Relationship between Earnings Response Coefficient of ...
10
International Business Research; Vol. 7, No. 6; 2014 ISSN 1913-9004 E-ISSN 1913-9012 Published by Canadian Center of Science and Education 164 Relationship between Earnings Response Coefficient of Insurance Firms and ExGrowth Opportunities, Earned Premium Incomes and Commissions in Malaysia Cheng Fan Fah 1 & Lee Hui Sin 2 1 Department of Economics, Faculty of Economics and Management, University Putra Malaysia, Malaysia 2 Graduate School of Management Faculty of Economics and Management, University Putra Malaysia, Malaysia Correspondence: Cheng Fan Fah, Associates Professor, Department of Economics, Faculty of Economics and Management, University Putra Malaysia, 43400, Serdang, Selangor, Malaysia. E-mail: [email protected] Received: February 2, 2014 Accepted: March 20, 2014 Online Publication: May 27, 2014 doi: 10.5539/ibr.v7n6p164 URL: http://dx.doi.org/10.5539/ibr.v7n6p164 Abstract The insurance industry plays the roles of intermediary, provider of financial services and risk transferor. These important roles have created strong demand for insurance products. Strong financial fundamentals combined with industry strength are vital for insurance-based companies to continuously do well in their business. This paper analyses the Earnings Response Coefficients (ERCs) and the financial performance of insurance-based companies in Malaysia. This analysis covers a period of 5 years from the year 2007 to the year 2011.This study also investigates the relationship between growth opportunity for the insurance industry in Malaysia and earned premium income, net investment income, net claims incurred, commissions paid, total assets and total liabilities as the specific factors of an insurance firm. As discovered in other studies, ERCs are found to be significant. In addition, among the six variables, only commission paid shows a significant result in affecting growth opportunities. A significant negative relationship is found between commissions paid and growth opportunities for the insurance industry in Malaysia. The significant relationship suggests that insurance companies should adequately implement or administer arrangements in their commissions paid policy. Keywords: insurance industry, earned premium, claim incurred, commissions paid 1. Introduction Individuals and corporations are exposed to all types of unanticipated risks. These risks may affect one’ s life, property and even business enterprise. Often, these risks are so devastating that they could destroy and influence the lives of many individuals, leaving them vulnerable and helpless. The question that rises then, is in what way can these victims be helped? The answer is insurance. The main intention of insurance is to uphold among the parties involved shared responsibility on the basis of mutual co-operation in protecting an individual against unforeseen risk. From an economics perspective, insurance facilitates industrialists and other entrepreneurs to avoid the necessity of freezing capital to guard against various contingencies as they can be reimbursed a fixed contribution, which is called a premium, thus obtaining financial security against the risks insured. Insurance has also permitted commercial, industrial and many other organizations to operate on a large scale that otherwise would have been unattainable. Enormous insurance funds are also invested in Government securities and industrial shares that ultimately offer financial support to the government, local authorities and industry. Alias, Hussein and Mohammad (2012) reported that Malaysia’ s insurance industry is one of the key drivers of the services sector. A general breakdown of the GDP contribution by the finance and insurance industry indicates that the country’ s finance and insurance industry accounted for 20.1% of the service sector ’ s output in 2011 (2000: 18.6%) as well as 11.8% of the country’ s gross domestic product or GDP (2000: 9.2%). The service sector as a whole accounted for a hefty 58.6% of GDP and is expected to remain a major contributor to economic growth in the years to come. This proves that the insurance industry in Malaysia still remains a key contributor to economic growth. Researchers have discovered that earnings announcements play a role in influencing the movement of share
Transcript of Relationship between Earnings Response Coefficient of ...

International Business Research; Vol. 7, No. 6; 2014
ISSN 1913-9004 E-ISSN 1913-9012
Published by Canadian Center of Science and Education
164
Relationship between Earnings Response Coefficient of Insurance
Firms and ExGrowth Opportunities, Earned Premium Incomes and
Commissions in Malaysia
Cheng Fan Fah1 & Lee Hui Sin
2
1 Department of Economics, Faculty of Economics and Management, University Putra Malaysia, Malaysia
2 Graduate School of Management Faculty of Economics and Management, University Putra Malaysia, Malaysia
Correspondence: Cheng Fan Fah, Associates Professor, Department of Economics, Faculty of Economics and
Management, University Putra Malaysia, 43400, Serdang, Selangor, Malaysia. E-mail: [email protected]
Received: February 2, 2014 Accepted: March 20, 2014 Online Publication: May 27, 2014
doi: 10.5539/ibr.v7n6p164 URL: http://dx.doi.org/10.5539/ibr.v7n6p164
Abstract
The insurance industry plays the roles of intermediary, provider of financial services and risk transferor. These
important roles have created strong demand for insurance products. Strong financial fundamentals combined
with industry strength are vital for insurance-based companies to continuously do well in their business. This
paper analyses the Earnings Response Coefficients (ERCs) and the financial performance of insurance-based
companies in Malaysia. This analysis covers a period of 5 years from the year 2007 to the year 2011.This study
also investigates the relationship between growth opportunity for the insurance industry in Malaysia and earned
premium income, net investment income, net claims incurred, commissions paid, total assets and total liabilities
as the specific factors of an insurance firm. As discovered in other studies, ERCs are found to be significant. In
addition, among the six variables, only commission paid shows a significant result in affecting growth
opportunities. A significant negative relationship is found between commissions paid and growth opportunities
for the insurance industry in Malaysia. The significant relationship suggests that insurance companies should
adequately implement or administer arrangements in their commissions paid policy.
Keywords: insurance industry, earned premium, claim incurred, commissions paid
1. Introduction
Individuals and corporations are exposed to all types of unanticipated risks. These risks may affect one’s life,
property and even business enterprise. Often, these risks are so devastating that they could destroy and influence
the lives of many individuals, leaving them vulnerable and helpless. The question that rises then, is in what way
can these victims be helped? The answer is insurance. The main intention of insurance is to uphold among the
parties involved shared responsibility on the basis of mutual co-operation in protecting an individual against
unforeseen risk.
From an economics perspective, insurance facilitates industrialists and other entrepreneurs to avoid the necessity
of freezing capital to guard against various contingencies as they can be reimbursed a fixed contribution, which
is called a premium, thus obtaining financial security against the risks insured. Insurance has also permitted
commercial, industrial and many other organizations to operate on a large scale that otherwise would have been
unattainable. Enormous insurance funds are also invested in Government securities and industrial shares that
ultimately offer financial support to the government, local authorities and industry.
Alias, Hussein and Mohammad (2012) reported that Malaysia’s insurance industry is one of the key drivers of
the services sector. A general breakdown of the GDP contribution by the finance and insurance industry indicates
that the country’s finance and insurance industry accounted for 20.1% of the service sector’s output in 2011
(2000: 18.6%) as well as 11.8% of the country’s gross domestic product or GDP (2000: 9.2%). The service sector
as a whole accounted for a hefty 58.6% of GDP and is expected to remain a major contributor to economic
growth in the years to come. This proves that the insurance industry in Malaysia still remains a key contributor
to economic growth.
Researchers have discovered that earnings announcements play a role in influencing the movement of share

www.ccsenet.org/ibr International Business Research Vol. 7, No. 6; 2014
165
prices when they were not anticipated. This study researches further into the others factors of insurance firms to
examine whether the findings for the effect of the ExGrowth Opportunities, Earned Premium Income and
Commission on the stock’s valuation response to earnings of insurance firms will remain unchanged. The reason
that insurance firms were chosen is the variation in their earnings contribution from premium earnings and
commissions.
This study will seek to answer the following research questions:
Do the ERCs of insurance firms significantly affect the firms’ valuations?
Do insurance-based companies in Malaysia show good financial performance?
Is there an expansion opportunity for insurance-based companies in Malaysia?
The general objective of this study is to investigate the ERCs and whether there are expansion opportunities for
the insurance industry in Malaysia. In addition, this research also analyses the ERCs and the financial
performance of a selected sample of insurance-based companies in Malaysia by analysing their returns and
comparing the financial health of the selected sample using both common-size financial statement analysis and
financial ratio analysis.
2. Literature Review
One of the main research themes in Capital Market Research is the study of the Earning Response Coefficients
(ERCs). The ERC has been predominantly defined as the coefficient on measures of unexpected accounting
earning in regressions of abnormal share market returns on earnings and other variables (Collins & Kothari,
1989). There are many published works on the topic of CMR, and ERC and Kothari (2002) have provided a
comprehensive and contemporary review of these. Early interest in the ERC as a topic of research is clearly
traced to literature on market reaction. The recent analysis of the determinants of ERCs usually derives a
specification of the unexpected returns and unexpected earnings relationship based upon a specification of a
relationship between share value and book value or returns and earnings suggested by theory. Further to Ariff
and Cheng (2011), Ariff et al. (2013) state that there is strong evidence that the ERCs are highly significant in
several investigations over 40years on the relation between abnormal returns of stocks and accounting earnings.
This study aims to extend this to the insurance industry.
Kugler and Ofoghi (2005) report that the importance of the relationship between financial development and
economic growth should be recognised. They suggested that developing countries have a supply-leading
causality pattern of development; hence, more attention should be paid to supply forces in insurance markets in
developing countries. Property-liability insurance, like other financial services, has grown in quantitative
importance as part of the general development of financial institutions. Kugler and Ofoghi (2005) found that the
economic importance of the insurance sector is still low when considering the share of total premiums generated
in developing countries.
Financial intermediaries, and particularly banks and insurance firms, have a very important role in financial
markets since they are well suited to engaging in information-producing activities that facilitate productive
investment for the economy. Thus, a decision is as ability of these institutions to engage as financial
intermediaries and to make loans which will lead directly to a decline in investment and aggregate economic
activity. When stocks to the financial system make adverse selection and lead to moral problems, then lending
tends to dry up, even for many of those with productive investment opportunities, since it becomes harder to
distinguish them from potential borrowers who do not have good opportunities. The lack of credit leads
individuals and firms to cut their spending, resulting in a contraction of economic activity that can be quite
severe (Hahm & Mishkin, 2000).
Diacon, Fenn and O’Brien (2003) attempt to measure the size of reserve errors in the accident-year accounted
business of UK general insurers. The results showed that the weighted average reserve error was -22.3% as a
percentage of initial reserves and -16.7% as a percentage of capital. The figure indicates that companies in the
UK general insurance market in general are apt to over-reserve, even when there happens to be some cyclical
behaviour in the fullness of time. Many factors can lead to loss reserve errors. One of the factors is earned
premium income. It is the amount of sum premiums obtained by an insurance company over a time that have
been earned based on the proportion of the time passed on the policies to their effective life.
Poposki (2007) studied the dominance of financial synergies as the main intention for merger and acquisition
activity in the insurance industry. It is known that the insurance industry has a high-cost distribution system and
lacks price rivalry; however, insurers are gradually encountered with more concentrated competition from
non-traditional insurance suppliers such as mutual fund firms, investment firms and banks. The augmented

www.ccsenet.org/ibr International Business Research Vol. 7, No. 6; 2014
166
competition has lessened profit margins and encouraged insurers to search for ideas to cut costs. These
developments propose that financial synergies and possible competence gains may present a major enthusiasm
for the current mergers and acquisitions in the insurance industry, improving the effectiveness of the firm’s goal
and/or the combined post-merger entity.
Cummins and Phillips (2009) report that the insurance industry in every developed country worldwide is
seriously regulated, the major regulation issue being solvency. A surge in insurer insolvencies took place in the
late 1980s and early 1990s in the U.S. as a result of a liability crisis for property-liability insurers and asset
quality troubles for life insurers and drove the implementation of risk-based capital. The universal financial crisis
that began in 2008 influenced both equity and debt securities and emphasised the necessity for regulators to
revise their solvency surveillance schemes. The result of insolvency analysis demonstrates a general positive
solvency experienced in the U.S. life and property-casualty insurance industry. Therefore, the U.S. system should
thoroughly incorporate qualitative aspects, offer motivation for risk management improvement and initiate
own-risk and solvency measurement practice.
Hamid and Osman (2010) investigate factors such as leverage, growth opportunities, expected bankruptcy costs,
company size, managerial ownership, tax considerations and regulated effects as the determinants of corporate
demand for takaful in Malaysia. However, the results pertinent to growth opportunities of the corporations was
insignificant, and the corporate decision on property takaful sent the signal that takaful operators might wish to
make better reflection of risk management needs of enterprises in their product innovation and market strategies.
The market-to-book value ratio was used as a proxy for growth opportunities in line with previous studies. This
ratio evaluates how much a company is worth at present, in assessment with the amount of capital invested by
current and past stockholders.
Finally, research by Ionescu (2012) find that in a modern economy, insurance plays an important role by
promoting effective control of various risk categories and mobilising people’s savings towards financial stability.
The study showed that the Romanian market was strongly under-insured due to a small amount of premiums and
very low advances compared to the mature European market. The reasons were largely related to insufficient tax
incentives, lack of financial resources, lack of understanding the need for insurance, the impact of the economic
crisis, the high debt rate accumulated by the population years before the crisis, reduced credit, lower income
levels, uncertainty about financial security and losses from insurance products that have an investment
component. The low level of protection in Romania provides the biggest opportunity for the local insurance
industry.
Therefore, this study on the insurance industry is another extension to the classical well known theory in stock
valuations in response to unexpected earnings. This study uses latest research in market models and new addition
variables peculiar to insurance firms.
3. Research Design, Hypothesis and Data
3.1 Research Design
This study examines the impact of additional insurance factors on insurance firms’ performance.The factors are
Earned Premium Income and Commission. This research is a modest attempt to discover the impact of these
factors using Cheng and Ariff’s (2011) methodology, computed using ratios from the financial statements of all
insurance firms over the study periods. The impact on insurance firms’ shares, both in direction and magnitude,
of the revaluation effect arises from earnings changes as they occurred in the period 2004 to 2012.
Many studies have used the market adjusted model for Abnormal Returns. However, this study used a more
statistically advanced risk-adjusted Sharp’s (1963) Market Model for analysis of Abnormal Returns. Sharpe’s
(1963) Market Model is a standard general equilibrium relationship for asset returns. Abnormal returns (AR) are
calculated as the excess returns on the risk-adjusted returns over the systematic risk measured by it, given in the
formula below as beta of the stock:
ARit = Rit- [i + iRmt] (1)
where;
i = the intercept,
I = the beta of stock i,
Rit = the stock returns = logn(Pit/Pit-1) and,
Rmt = the market index return = logn(CIt/CIt-1).

www.ccsenet.org/ibr International Business Research Vol. 7, No. 6; 2014
167
The definitions of the terms are: logn is the natural logarithm while CI refers to the Kuala Lumpur markets index.
Hence, we took the changes in bank share prices as Rit while changes in market index we indicated as the Rmt.
This study regresses the Rit and Rmt to compute the beta (β) and alpha (α) values to complete the model for each
insurance firm. We also computed (Cumulative Abnormal Return) CAR from the summation of (Abnormal
Return) AR for the period of 12 months.
CAR = Σ ARit (t = 1 to 12) (2)
Cumulative Abnormal Returns measures the share valuation in response to any changes in the set of information
specific to a firm. Unexpected earnings are one of the well accepted variables that affect share prices. The
measurement of unexpected earnings is described in the next section.
3.2 Analysis of Unexpected Annual Accounting Earnings
There are many ways to measure unexpected earnings (see Cheng & Ariff, 2007). This research adopted the
difference in accounting returns between current year and previous year, which is commonly used as the naive
model in accounting literature.
Unexpected Annual Earnings (UEs) are computed as follows:
UEit = Eit - Ei(t-1) (3)
SUEit= UEit/(UEi).
This standardisation by dividing the unexpected earnings will mitigate the heteroscedasticity problems in the
variables due to size influence. Transformation is to normalise the variable, and yields an unexpected value of
annual earnings variable adjusted for volatility differences, given as(UEi). This method will result in robust
estimates of all test statistics and is the most commonly used and accepted measure.
3.3 Returns-to-Earnings Relationship
A common regression between the abnormal returns (CAR) as dependent variables and the unexpected earnings
(SUE) as the independent variable is the standard measure of the influence of earnings on share price. The slope
coefficients of the unexpected earnings are commonly known as the Earning Response Coefficients (ERC). The
common test is the significance of the coefficients and the power of the model by using the determination of the
explanatory (R²) of the model in the following linear estimation done as panel regression:
CARi = α+ γ* SUEi + ξi (4)
where,
CARi = Cumulative Abnormal risk-adjusted returns for security annually, t,
SUEi = Standardized annual unexpected annual earnings, and,
ξi = Error term assumed to be randomly, normally distributed.
In previous studies by Cheng and Arif (2007),the ERCs were found to be highly significant in magnitude and sign.
However, the explanatory powers were low. The extension to this relationship is to include other factors in the
relationship. This paper attempts to extend the study to insurance firms with the inclusion of the insurance firms’
specific factors.
3.4 Research Framework.
Standardised unexpected earnings, stock prices and specific factors of insurance firm.
Theories in accounting and finance tell us that firms’ specific factors affect the earnings of firms; therefore, this
study first suggests to relate the specific factors of the insurance firms and the unexpected earning.
In equation 4, the relation between standardised unexpected earnings (SUE) is the dependent variable and in
equation 6, the specific factors of the insurance firms are the independent variables. These independent variables
are Earned Premium Income, Net Investment Income, Net Claims Incurred, Commissions Paid, Total Assets and
Total Liabilities.
This study will try to capture the effect of changes in the independent variables on the dependent variable.
The general estimation model is specified as follows:
∆𝐴𝑅𝑖𝑡 = 𝛼0 + 𝜆1∆𝐸𝑃𝑆𝑖𝑡 + 𝜆2∆𝐸𝑃𝐼𝑖𝑡 + 𝜆3∆𝑁𝐼𝐼𝑖𝑡 + 𝜆4∆𝑁𝐶𝐼 + 𝜆5∆𝐶𝑃𝑖𝑡 + 𝜆6∆𝑇𝐴𝑖𝑡 + 𝛽7∆𝑇𝐿𝑖𝑡 + 휀𝑖𝑡 (5)
Variable definitions:
𝛼0 = Intercept of mathematical model,

www.ccsenet.org/ibr International Business Research Vol. 7, No. 6; 2014
168
𝜆𝑠 = Partial regression coefficients,
∆AR = Change of Abnormal Return = 𝑆𝑡𝑜𝑐𝑘𝑅𝑒𝑡𝑢𝑟𝑛 − 𝑀𝑎𝑟𝑘𝑒𝑡𝑅𝑒𝑡𝑢𝑟𝑛,
∆EPS = Change of Earning per Share,
∆EPI = Change of Earned Premium Income,
∆NII = Change of Net Investment Income,
∆NCI = Change of Net Claims Incurred,
∆CP = Change of Commissions Paid,
∆TA = Change of Total Assets,
∆TL = Change of Total Liabilities.
The second part of this study will try to investigate whether there is growth opportunity for Malaysia’s insurance
industry. The data are obtained from the Bank Negara Malaysia website. The data used are from a sample of 8
insurance-based companies over a period of 5 years i.e. from the year ended 2007 until 2011. This study employs
a cross-sectional and time-series regression model using panel data. The model has the following functional
form:
Insurance company growth opportunity = f (earned premium income, net investment income, net claims
incurred, commissions paid, total assets, total liabilities).
Hence, the following general model will be used to verify the factors affecting insurance growth opportunity.
The general estimation model can be specified as follows:
𝑀𝐵𝑉𝑅𝑖𝑡 = 𝛼0 + 𝛿1𝐸𝑃𝐼𝑖𝑡 + 𝛿2𝑁𝐼𝐼𝑖𝑡 + 𝛿3𝑁𝐶𝐼𝑖𝑡 + 𝛿4𝐶𝑃𝑖𝑡 + 𝛿5𝑇𝐴𝑖𝑡 + 𝛿6𝑇𝐿𝑖𝑡 + 휀𝑖𝑡 (6)
Variable definitions:
𝛼0 = Intercept of mathematical model,
𝛿𝑠 = Partial regression coefficients,
MBVR = Market Book Value Ratio of insurance company as a proxy for growth opportunity,
EPI = Earned Premium Income,
NII = Net Investment Income,
NCI = Net Claims Incurred,
CP = Commissions Paid,
TA = Total Assets,
TL = Total Liabilities,
ε = Error term.
3.5 Hypothesis
The major hypothesis in this study is that a strong relationship exists between ERC, which represents adjusted
share price changes by investors, and the unexpected annual earnings changes and other specific variables of
insurance firms. The null strategic hypothesis is:
H1: The specific factors of insurance firms do not affect Cumulative Abnormal Returns;
H2: The specific factors of insurance firms do not affect the growth opportunity of the insurance firms.
The null will be accepted if the t-statistics for λs and δs are not significant. The model fit will be tested using the
F-ratios while the size of the R-squared values may be examined to see if the insurance sector study has higher
values for the coefficient of determination than was the case in non-insurance studies in the same market.
4. Findings and Analysis
4.1 Earnings Response Coefficients and Specific Variables of Insurance Firms
The first part of the results reports the regression of equation 5. Based on Table 1 and 2, Model 8, the F statistic
produced (F = 4.459) from the ANOVA is significant at 0.05 level. The 𝑅2 of this model is 0.396, which means
that approximately 39.6% of the variation in abnormal return can be explained by using earning per share, earned
premium income, net claims incurred, commissions paid and total assets. The low level of 𝑅2 in this regression
suggests that these 5 variables are not the only variables to be considered in explaining the behaviour of

www.ccsenet.org/ibr International Business Research Vol. 7, No. 6; 2014
169
abnormal return of insurance industry; there are other important determinants of abnormal return that are not
included in the model. The Durbin-Watson is 2.334, which is approximately 2, meaning that it provides no
evidence of autocorrelation of the error term. Therefore, the test of relationship is not affected by the error term.
Note that the VIF of all variables is less than 10; hence, there is no sign of multicollinearity.
The conclusion that can be made from the multiple linear regression is that only earning per share is significant,
that is, that there is a positive relationship between earning per share and abnormal return of insurance industry.
This shows that earnings per share has informational content and it causes market reaction that result in
fluctuation in price.
Table 1. Regression of CAR against each change in independent variables
∆𝐴𝑅𝑖𝑡 = 𝛼0 + 𝛽1∆𝐸𝑃𝑆𝑖𝑡 + 𝛽2∆𝐸𝑃𝐼𝑖𝑡 + 𝛽3∆𝑁𝐶𝐼 + 𝛽4∆𝐶𝑃𝑖𝑡 + 𝛽5∆𝑇𝐴𝑖𝑡 + 휀𝑖𝑡
Model 1 2 3 4 5 6 7 8
Const 0.063 0.077 0.075 0.075 0.078 0.080 0.083 0.073
(t-value) 0.994 0.409 0.559 0.576 0.558 0.280 0.313 1.230
(Sig) 0.327 0.685 0.580 0.568 0.580 0.781 0.756 0.227
∆EPS 0.200 0.234
(t-value) 4.762 5.010
(Sig) ***0.000 ***0.000
∆EPI
0.086
0.217
(t-value)
0.687
0.380
(Sig)
0.496
0.707
∆NII
0.002
(t-value)
0.397
(Sig)
0.693
∆NCI
0.0001
0.0001
(t-value)
0.354
0.331
(Sig)
0.726
0.742
∆CP
0.109
0.12
(t-value)
0.18
0.522
(Sig)
0.858
0.605
∆TA
0.27
0.248
(t-value)
1.894
0.848
(Sig)
0.066
0.403
∆TL
0.275
(t-value)
1.752
(Sig)
0.088
R sqr 0.374 0.014 0.004 0.003 0.001 0.086 0.075 0.396
F 22.679 0.472 0.158 0.125 0.032 3.587 3.07 4.459
(sig) ***0.000 0.496 0.693 0.726 0.858 0.066 0.088 **0.003
DW 2.334 2.785 2.842 2.846 2.87 2.729 2.891 2.334
VIF 1.142-9.386
Note. Level of significance: (*) 0.05, (**) 0.01 and (***) 0.001.
www.ccsenet.org/ibr International Business Research Vol. 7, No. 6; 2014
170
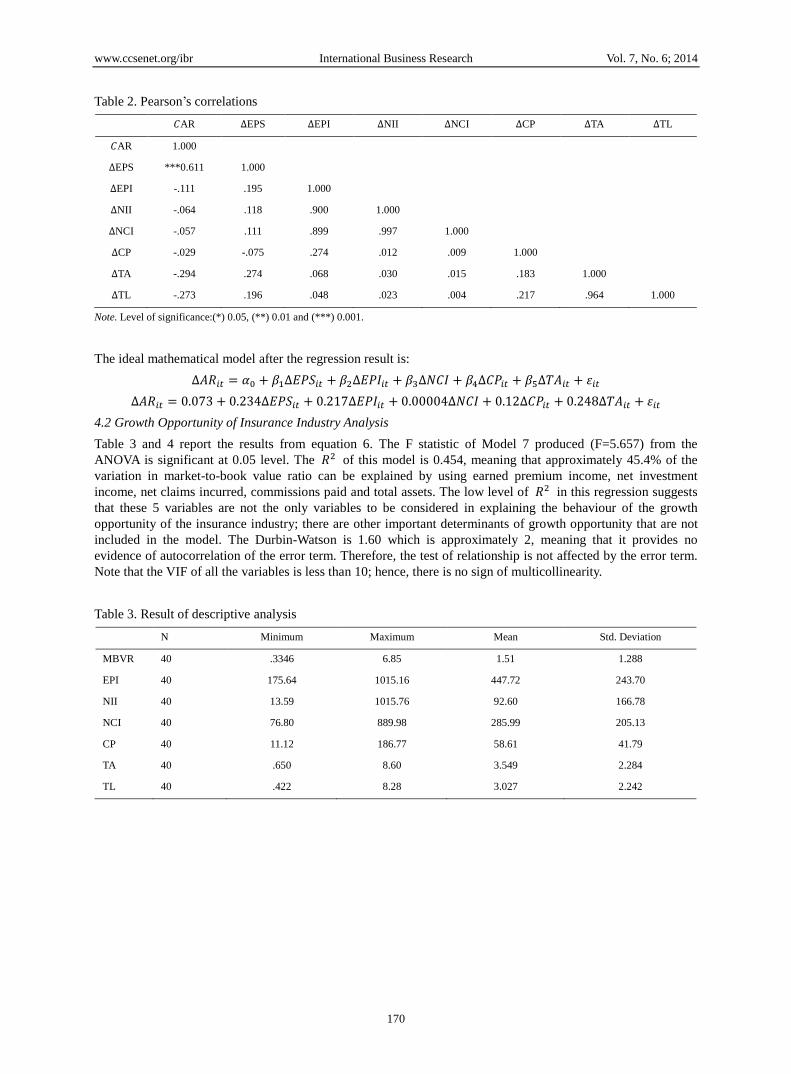
Table 2. Pearson’s correlations
𝐶AR ∆EPS ∆EPI ∆NII ∆NCI ∆CP ∆TA ∆TL
𝐶AR 1.000
∆EPS ***0.611 1.000
∆EPI -.111 .195 1.000
∆NII -.064 .118 .900 1.000
∆NCI -.057 .111 .899 .997 1.000
∆CP -.029 -.075 .274 .012 .009 1.000
∆TA -.294 .274 .068 .030 .015 .183 1.000
∆TL -.273 .196 .048 .023 .004 .217 .964 1.000
Note. Level of significance:(*) 0.05, (**) 0.01 and (***) 0.001.
The ideal mathematical model after the regression result is:
∆𝐴𝑅𝑖𝑡 = 𝛼0 + 𝛽1∆𝐸𝑃𝑆𝑖𝑡 + 𝛽2∆𝐸𝑃𝐼𝑖𝑡 + 𝛽3∆𝑁𝐶𝐼 + 𝛽4∆𝐶𝑃𝑖𝑡 + 𝛽5∆𝑇𝐴𝑖𝑡 + 휀𝑖𝑡
∆𝐴𝑅𝑖𝑡 = 0.073 + 0.234∆𝐸𝑃𝑆𝑖𝑡 + 0.217∆𝐸𝑃𝐼𝑖𝑡 + 0.00004∆𝑁𝐶𝐼 + 0.12∆𝐶𝑃𝑖𝑡 + 0.248∆𝑇𝐴𝑖𝑡 + 휀𝑖𝑡
4.2 Growth Opportunity of Insurance Industry Analysis
Table 3 and 4 report the results from equation 6. The F statistic of Model 7 produced (F=5.657) from the
ANOVA is significant at 0.05 level. The 𝑅2 of this model is 0.454, meaning that approximately 45.4% of the
variation in market-to-book value ratio can be explained by using earned premium income, net investment
income, net claims incurred, commissions paid and total assets. The low level of 𝑅2 in this regression suggests
that these 5 variables are not the only variables to be considered in explaining the behaviour of the growth
opportunity of the insurance industry; there are other important determinants of growth opportunity that are not
included in the model. The Durbin-Watson is 1.60 which is approximately 2, meaning that it provides no
evidence of autocorrelation of the error term. Therefore, the test of relationship is not affected by the error term.
Note that the VIF of all the variables is less than 10; hence, there is no sign of multicollinearity.
Table 3. Result of descriptive analysis
N Minimum Maximum Mean Std. Deviation
MBVR 40 .3346 6.85 1.51 1.288
EPI 40 175.64 1015.16 447.72 243.70
NII 40 13.59 1015.76 92.60 166.78
NCI 40 76.80 889.98 285.99 205.13
CP 40 11.12 186.77 58.61 41.79
TA 40 .650 8.60 3.549 2.284
TL 40 .422 8.28 3.027 2.242

www.ccsenet.org/ibr International Business Research Vol. 7, No. 6; 2014
171
Table 4. Regression of MBVR against each independent variable
Model 1 2 3 4 5 6 7
Constant 0.625 1.275 0.701 1.535 2.208 2.089 1.447
(t-value) (1.546) (5.706) (2.200) (4.282) (6.121) (6.338) (3.442)
(Sig) (0.017) (0.000) (0.034) (0.000) (0.000) (0.000) (0.002)
EPI 0.002
0.002
(t-value) (2.490)
(0.981)
(Sig) **(0.017)
(0.334)
NII
0.003
0.001
(t-value)
(2.159)
(0.878)
(Sig)
*(0.037)
(0.386)
NCI
0.003
0.002
(t-value)
(3.116)
(1.314)
(Sig)
(0.198)
CP
-0.0004
-0.014
(t-value)
(-0.082)
(-2.432)
(Sig)
(0.935)
(0.020)
TA
-0.196
-0.188
(t-value)
(-2.288)
(-2.591)
(Sig)
*(0.028)
(0.014)
TL
-0.191
(t-value)
(-2.173)
(Sig)
*(0.036)
R² 0.140 0.109 0.203 0.000 0.121 0.111 0.454
F-stat 6.202 4.662 9.708 0.007 5.234 4.721 5.657
(Sig) *(0.017) *(0.037) **(0.003) (0.935) *(0.028) *(0.036) **(0.001)
DW 0.977 1.056 1.097 0.758 0.804 0.821 1.569
VIF 1.027-7.175
Note. Level of significance:(*) 0.05, (**) 0.01 and (***) 0.001.
Table 5. Pearson’s correlations
MBVR EPI NII NCI CP TA TL
MBVR 1.000
EPI **0.375 1.000
NII .331 .345 1.000
NCI .451 .887 .290 1.000
CP -.013 .697 .089 .562 1.000
TA *-0.348 .050 -.076 -.005 .046 1.000
TL *-0.332 -.006 -.064 -.014 -.017 .989 1.000
Note. Level of significance:(*) 0.05, (**) 0.01 and (***) 0.001.

www.ccsenet.org/ibr International Business Research Vol. 7, No. 6; 2014
172
The ideal mathematical model after the regression result is:
𝑀𝐵𝑉𝑅𝑖𝑡 = 1.47 + 0.002𝐸𝑃𝐼𝑖𝑡 + 0.001𝑁𝐼𝐼𝑖𝑡 + 0.002𝑁𝐶𝐼𝑖𝑡 − 0.014𝛽4𝐶𝑃𝑖𝑡 − 0.188𝑇𝐴𝑖𝑡 + 휀𝑖𝑡
The conclusion that can be made from the multiple linear regression is that only commission paid is significant,
meaning that there is a negative relationship between commission paid and growth opportunities of the insurance
industry.
5. Conclusion
This study examined the earnings-return relationships of insurance firms in Malaysia. This report also studies the
effect of some of the subcomponent earnings, which are the specific factors of insurance firms: Earned Premium
Income, Net Investment Income, Net Claims Incurred, Commissions Paid, Total Assets and Total Liabilities on
the price to earnings relationship.
Our findings have shown that the standardised unexpected earnings affect the stock price positively and are
significant. This result is expected as all investors would appreciate the release of unexpected earnings news.
This is also consistent with the results of Cheng et al. (2007) for the Malaysian market.
With the results obtained, we may conclude that our first hypothesis is acceptable. Firstly, the changes in the
stock prices can be explained by the sign and the magnitude of unexpected annual earnings changes reported by
insurance firms.
It is worth highlighting that the 2008 economic crisis did give some impact to the insurance industry in Malaysia.
It is important for insurance companies to maintain a high capital adequacy ratio to buffer any unexpected event
to avoid insolvency. This is supported by Cummins and Phillips (2009), who suggested that insurance companies
should implement solvency measurement to improve risk management.
Lastly, earned premium income, net investment income, net claims incurred, total assets and total liabilities do
not show significantly that they have a relationship with growth opportunities of the Malaysian insurance
industry. Only commission paid appears to play an important role in determining the growth opportunities of the
Malaysian insurance industry. An inadequately implemented or administered arrangement on commissions paid
can harm the insurer; hence, insurance companies should focus on the concerns to be measured in incorporating
or establishing a profit commission arrangement. This is because commission paid is a major factor among all
the factors that affect the growth opportunities of the insurance industry.
References
Alias, N. Z., Hussein, N., & Mohamad, A. A. (2012). Malaysian insurance industry—A Marco Perspective.
Malaysia Rating Corporations (364803-V), ER/008/2012, 1–12.
Ariff, M., & Cheng, F. F. (2011). Accounting earnings response coefficient: An extension to banking shares in
Asia Pacific countries. Advances in Accounting, Incorporating Advances in International Accounting, 27,
346–354. http://dxdoi:10.1016/j.adiac.2011.08.002
Ariff, M., Cheng F. F., & Soh, W. N. (2013). Earnings response coefficients of OECD banks: Tests extended to
include bank risk factors. Advances in Accounting, Incorporating Advances in International Accounting, 29,
97–107. http://dx.doi.org/10.1016/j.adiac.2013.03.003
Bernstein, L. A. (1998). Financial Statement Analysis Theory, Application & Interpretation (5th ed.). United
States: Irwin/McGraw Hill.
Cheng, F. F., & Ariff, M. (2007). Abnormal returns of bank stocks and their factor—analysed determinants.
Journal of Accounting, Business and Management, 14, 1–15.
Collins, D. W., & Kothari, S. P. (1989). An Analysis of International and Cross-Sectional Determinants of
Earnings Response Coefficients. Journal of Accounting and Economics, 11(2/3), 143–181.
http://dx.doi.org/10.1016/0165-4101(89)90004-9
Cummins, J. D. (2000). Allocation of Capital in the Insurance Industry. Risk Management and Insurance Review,
3, 7–28. http://dx.doi.org/10.1111/j.1540-6296.2000.tb00013.x
Cummins, J. D., & Phillips, R. D. (2009). Capital Adequacy and Insurance Risk-Based Capital Systems. Journal
of Insurance Regulation, 28(1), 25–72.
Diacon, S. R., Fenn, P. T., & O’Brien, C. (2003). How Accurate are the Disclosed Provisions of UK General
Insurers? 25th UK Insurance Economists’ Conference, March 2003. Nottingham University Business
School.

www.ccsenet.org/ibr International Business Research Vol. 7, No. 6; 2014
173
Hahm, J. H., & Mishkin, F. S. (2000). The Korean Financial Crisis: An Asymmetric Information Perspective.
Emerging Markets Review, 1, 21–52. http://dx.doi.org/10.1016/S1566-0141(00)00003-0
Hamid, M. A., & Osman, J. (2010). Factors Affecting Corporate Risk Management in Malaysia: A Pooled Data
Of Takaful And Conventional Insurance. School of Business Management, Faculty of Economics and
Business, University Kebangsaan Malaysia. Retrieved from
http://www.researchgate.net/publication/251811563
Ionescu, O. C. (2012). Life Insurance—Their Characteristics Importance and Actuality on The Romanian Market.
Journal of Knowledge Management, Economics and Information Technology, 4.
Kothari, S. P. (2001). Capital markets research in accounting. Journal of Accounting and Economics, 31(1–3),
105–231. http://dx.doi.org/10.1016/S0165-4101(01)00030-1
Kugler, M., & Ofoghi, R. (2005). Does Insurance Promote Economic Growth? Evidence from the UK. In Money
Macro and Finance Research Group/Money Macro and Finance (MMF) Research Group Conference 2005,
1–3 September, University of Crete, Rethymno, Greece. Retrieved from http://repec.org/mmfc05/paper8.pdf
Poposki, K. (2007). Merger Activity in The Insurance Industry. Economics and Organization, 4(2), 161–171.
Sharpe, W. F. (1963). A Simplified Model for Portfolio Analysis. Management Science, 9(2), 277–293.
http://dx.doi.org/10.1287/mnsc.9.2.277
White, H. (1980). A Heteroscedasticity-Consistent Covariance Matrix Estimator and a Direct Test for
Heteroscedasticity. Econometrics, 48(4), 817–837. http://dx.doi.org/10.2307/1912934
Note
Note 1. Takaful is a co-operative system of reimbursement in case of loss, paid to people and companies concerned
about hazards, compensated out of a fund to which they agree to donate small regular contributions managed on
behalf by a Takaful Operator. It is defined as an Islamic insurance concept which is grounded in Islamic banking,
observing the rules and regulations of Islamic law.
Copyrights
Copyright for this article is retained by the author(s), with first publication rights granted to the journal.
This is an open-access article distributed under the terms and conditions of the Creative Commons Attribution
license (http://creativecommons.org/licenses/by/3.0/).