Edit1 Hormonal Regulation of Plasma Calcium and Calcium Metabolism

375
Regulation of Calcium Current by IntracellularCalcium in Smooth Muscle Cells of Rabbit
Portal Vein
Yusuke Ohya, Kenji Kitamura, and Hirosi Kuriyama
Effects of concentrations of intracellular calcium, [Ca2+],, on the voltage-dependent Ca2+ current cJrecorded from dispersed single smooth muscle cells of the rabbit portal vein were studied, using a wholecell voltage clamp method combined with an intracellular perfusion technique. Outward currents wereminimized by replacement of Cs+-rich solution in the pipette and 20 mM tetraethylammonium in thebath. The 1^ was evoked by command pulses of above - 30 mV, and the maximum amplitude wasobtained at about 0 mV. This 1^ was dose dependently inhibited by increases in the [CaJ+], above 30nM. The Kd value of the [Ca2+], required to inhibit the 1^ was about 100 nM. The Ba2+ current wasalso inhibited by increases in the [Ca1+],. Conversely, perfusion of Ba2+ into the cell up to 100 /iM didnot suppress the 1^. Changes in the [Ca2+], did not modify the steady-state inactivation curve. Theinhibition of the 1^ evoked by the test pulse is most prominent when the preceding influx of Ca2+
during the conditioning pulse was large, as estimated using a double pulse protocol. This inhibitionwas proportionally reduced by increases in the concentration of the Ca2+ chelator, ethylene glycolbisOS-aminoethyl ether)-N,N,N',N'-tetnaeetic acid (EGTA). Therefore, the Ca2+-dependent inac-tivation of the Ca2+ channel may contribute toward regulating [Ca2+], in smooth muscle cells of therabbit portal vein. (Circulation Research 1988;62:375-383)
Mechanisms of inactivation of the voltage-dependent Ca2+ channel have been investi-gated using various excitable tissues.1-2 The
Ca2+ channel of egg cell membranes of marine poly-chaetes was inactivated only in a voltage-dependentmanner,3 as in the Na+ channel of squid giant axons.4
On the other hand, there is evidence that an increase inthe intracellular Ca2+ concentration ([Ca2+],), eitherdue to released or influxed Ca2+, participates in theinitiation of inactivation of the Ca2 + channel of neuronsand skeletal and cardiac muscle cells. For example, 1)increases in the [Ca2+], have been shown to suppress theamplitude of Ca2+ current (IcJ.56 2) The inactivationcurves obtained from double pulse studies are "U"shaped, which indicates that the inactivation dependson the Ca2+ inflow during applications of conditioningpulse. 3) Intracellular application of ethylene glycolbisOS-aminoethyl ether)-N,N,W,./V'-tetraacetic acid(EGTA) has been shown to slow the decay of 1^, andweaken the inhibition of l^ as observed using thedouble pulse protocol. *•10 4) When charge carriers of theCa channel are replaced from Ca2+ to B a , decay ofthe Ba current (I,J has been shown to be slower manthe decay of the I c , . "
In a previous paper, we proposed the possibleinvolvement of a Ca2+-dependent mechanism in theinactivation of 1^ obtained in intestinal smooth muscle
From the Department of Pharmacology, Faculty of Medicine,Kyushu University 60, Fukuoka 812, Japan.
Supported in part by a Grant-in-Aid for Scientific Research fromThe Ministry of Education, Science and Culture of Japan, and grantsfrom The Ministry of Health and Welfare of Japan.
Address for reprints: Dr. Yusuke Ohya, Department of Physiologyand Biophysics, College of Medicine, University of Cincinnati,Cincinnati, OH 45267-0576.
Received May 29, 1987; accepted September 14, 1987.
cells12 because the inactivation curve obtained using thedouble pulse protocol was U shaped and because decayof the inward currents slowed when Ba2+ was usedinstead of Ca2+ as the charge carrier of the Ca2+
channel. Similar conclusions were reported by Jmari etal13 and Ganitkevich et al'4 who used rat myometrialtissue and guinea pig tenia cecum, respectively. How-ever, this evidence was derived from experimentsperformed using the double pulse protocol alone, andinvestigations involving the direct regulation of [Ca2+](
were apparently not carried out.Using an intracellular perfusion technique" to alter
the [Ca2+], and using various concentrations of a Ca2+
chelator, we obtained evidence that an increase in the[Ca2+], inhibits the Ca2+ channel in smooth muscle cellsof the rabbit portal vein.
Materials and MethodsPreparations of Single Smooth Muscle Cells
Single smooth muscle cells of the rabbit portal veinwere prepared by enzymatic treatment as described byInoue et al." Briefly, male albino rabbits (NipponWhite, 1.8-2.0 kg) were anesthetized with sodiumpentobarbital (40 mg/kg i.v.) and exsanguinated. Theportal vein was excised, connective tissues werecarefully removed, and the endothelium was rubbed offwith a cotton swab. The muscle layer was then cut intosmall pieces in Ca2+-free solution containing (mM)NaCl 145, KC1 6, 4-(2-hydroxyethyl)-l piperazineethansulfonic acid (HEPES) 10, glucose 12, pH 7.3titrated with tris (hydroxymethyl) aminomethane(Tris+). After 15 minutes incubation in Ca2+-freesolution, the tissues were transferred into anothervessel filled with the same solution containing 2 mg/mlcollagenase (clostridio peptidase A; Boehringer-
by guest on July 6, 2018http://circres.ahajournals.org/
Dow
nloaded from

376 Circulation Research Vol 62, No 2, February 1988
Mannheim, Mannheim, Federal Republic of Ger-many). After 30 minutes incubation for digestion of thetissue at 36° C, single cells were dispersed by gentleagitation using a glass pipette in fresh Ca2+-freesolution. The cells were stored in a stock solution (0.5mM CaCl2 was added to the Ca2+-free solution)containing 2 mg/ml bovine serum albumin (essentiallyfatty acid free) and 1 mg/ml trypsin inhibitor (type II-s;Sigma Chemical, St. Louis, Missouri). Spindle-shapedsingle smooth muscle cells (5-10 fim diameter and150-250 t̂m length) were obtained. Experiments wereperformed within 3 hours after the cell harvest.
Electrical RecordingsThe cell suspension was taken into a small chamber
(0.2 ml) and placed on the stage of a microscope(TMD-Diaphoto, Nihon Kogaku, Tokyo, Japan).Whole cell voltage clamp was performed with a suctionpipette through a single electrode voltage clampamplifier.l7" The recording conditions of the amplifierwere the same as those described in our previousreports.1219-20 Patch pipettes (resistances of 2-4 MO)made of Pyrex glass capillary tubes were prepared asdescribed by Hamill et al.21 After formation of thepipette-membrane seal with a high resistance (over 5Gil), the patch membrane was disrupted by a negativepressure (10-30 mm H2O).
Electrical responses were displayed on a storageoscilloscope and simultaneously stored in a videocas-sette recorder (NV-880HD, National, Osaka, Japan)through a PCM converting system (PCM-501ES,Sony, Tokyo, Japan; 16 bit, sampling frequency of 44kHz) with a built-in low-pass filter (four poles Besseltype active filter, 3 kHz).
Experiments were carried out using short cells (150/nm length) to achieve an isopotential throughout the celland a rapid internal perfusion. Although difficulties forthe satisfactory voltage clamping of longer cells havebeen previously mentioned,12 the five times higher inputresistance achieved in the present experiments comparedto that reported previously12 (5 GCl versus 1 Gft) and thesmall amplitude of 1^ allowed improved voltagecontrol.u Further evidence of the isopotential state of thecells was provided by the current-voltage (I-V) curve inwhich no abrupt increase in the inward current was seen,which would have indicated loss of voltage control.23
To prevent a run-down phenomenon of the 1̂ , or Ig,,a 250-msec command pulse to 0 mV (for 1^ or to —10mV (for Ifj from the holding potential of - 60 mV wasapplied every 30 seconds, except for measurements ofthe current-voltage relation (I-V curve) and the doublepulse studies. Five millimolar ATP present in the
pipette solution also prevented the run-down of 1^ insmooth muscle cells19 as is also the case with neuronsand cardiac muscle cells.ua* Under such conditions,the amplitude of L̂ , was preserved for more than 20minutes after initiation of the current recording.19'20
SolutionsThe bath solution of the following composition was
used throughout the current recording (mM): NaCl120, tetraethylammonium chloride (TEA Cl) 20, CaCl2(or BaCl,) 2.8, HEPES 10, glucose 8, pH 7.3 withTris+. To isolate the Ic.,12-22 the pipette was filled withhigh-Cs+ solution of the following composition (mM):CsCl 125, HEPES 20, adenosine 5'-triphosphate (di-sodium salt, ATP-2Na) 5.1, various concentrations ofMgCl2 to adjust a free-Mg2+ concentration to 1, pH 7.3with CsOH. Concentrations of free Ca2+ (3-1,000nM), free Ba2+ (1-100 ^M), and EGTA (0.1, 1, and10 mM) were varied and are given in Table 1. The freeCa2+, Ba2+, and Mg2+ concentrations of the pipettesolutions were obtained by making use of multiequi-librium equations, using the association constants forCaEGTA2-, MgEGTA2", BaEGTA", CaATP26',MgATP", and BaEGTA27" as cited by Itoh et al andSato et al.10 (The apparent binding constants were4.3X103 M - \ 2.14X10⁴ M"1, 2.57x10" M"',4.0X10 M -
\ 1.0x10* M"1, and 1.95xlO> M",respectively.") In preparing the pipette solutions, theconcentration of EGTA was fixed at 10 mM, andappropriate amounts of CaCl2, BaCl22+, and MgCl2+2 wereadded (Table 1). The calculated Ca and Ba con-centrations in the pipette solution were termed as the[Ca] , and [Ba] f , respectively.
All experiments were performed at room tempera-ture (20-26° C).
Intracellular Perfusion ProceduresTo control the intracellular constituents while re-
cording the current, the pipette solution was exchangedusing the modified "intracellular perfusion technique"introduced by Soejima and Noma." Apparatus andprocedures were the same as described by Ohya et al.l9-20
In brief, a heat-formed fine polyethylene tube, con-nected to a reservoir filled with a test solution, wasinserted into the suction electrode at a distance of100-300 fxM behind the tip. Exchange of the solutionwas performed by applying a negative pressure to thesuction pipette and by a positive pressure to the insertedtube by lifting the reservoir. Exchange of the pipettesolution was confirmed by checking the volume of thesolution leaving the pipette holder (0.03-0.05ml/min).
Table
CaCl2
BaCl2
Mga2
EGTA
1. Compositions
(mM)
(mM)
(mM)
(mM)
Control .0
0
0
6.0
10
of Divalent
3
0.2
5.9
10
Cations
10
0.6
5.910
Present[Ca2+];
30
1.8
5.8
10
in Pipette(nM)
100
4.3
5.5
10
Solutions
300
6.9
5.3
10
10,000
8.8
5.1
10
1
0.4
5.9
10
[Bia2+].
3
3.
5.
10
(MM)
1
7
100
8.3
5.2
10
by guest on July 6, 2018http://circres.ahajournals.org/
Dow
nloaded from
Ohya et al [Ca2+], Inactivates 1^ in Vascular Muscles 377
Morphometric Observations of the CellShortening of the dispersed single cells induced by
perfusions of Ca2+ into the cytosol was observed in theCa2+-free bath solution containing Mg2+ (2.5 mMMgCl2 was added to the Ca2+-free solution). Pipettesolutions and procedures for the pipette-membrane sealand rupture were the same as those used for the wholecell voltage clamp study. After rupture of the patchmembrane, the contraction was initiated. The celllength was measured on photos taken before and afterthe contraction. The shortening was expressed as arelative length. (The cell length before rupture of thepatch membrane was normalized as 1.0.)
Data AnalysisTo estimate the relation between the inhibition of I
against the [Ca2+]i, the extent of influx of Ca2+ provokedby the conditioning pulse was estimated from theintegral of the l^ (Jldt) evoked by the conditioningpulse (200 msec) and expressed as nanocoulomb (nC).
To normalize amplitudes of the 1^ obtained fromindividual cells, the 1^ was expressed as a currentdensity and calculated as follows: the maximumamplitude of the Ic. was divided by the cell capacitance(FIAJFJUF), estimated from the capacitive current evokedby the potential step from — 60 to — 50 mV.
The steady-state inactivation curve of 1^ was drawnby fitting the data to the Boltzmann distribution:
P=l /{ l+exp[ (V-V h ) /k ]>
where P is the probability of being available to open toa test depolarization; V is the conditioning commandpotential; Vh is the conditioning command potentialrequired for the half inhibition of the 1,̂ ; k is theBoltzmann coefficient.
If it is assumed that inactivation of the Ca2+ channelwould be caused by the Ca2+ binding, the dissociationconstant (KJ and the Hill's coefficient (n) for theinhibition of I,-, can be determined by fitting the datato the following equation:
where ic, is the maximum current amplitude recordedin various [Ca2+]i,andiCl'isthat recorded in the absenceof Ca2+ (10 mM EGTA) in the pipette.
Fitting the data to each equation was performedusing the nonlinear least-squares method. The data aregiven as mean±SD. Statistical significance was de-termined by Student's t test (paired or unpaired), andlevel of significance was p<0.05 .
Results
Effects of [Ca2+], on Amplitude ofl^To investigate the effects of [Ca2+], on the Ic,, the
[Ca2+]; was altered using an intracellular perfusiontechnique. Figure 1A shows inhibition of the 1^ inducedby increases in the [Ca2+], from 3 to 100 nM. The Ic, wasevoked by a command potential of 0 mV from theholding potential of - 60 mV. After the amplitude of ^had reached a steady level (registered as the control)
on
•*••••••••••,
3nM 100nM
0 5perfusion Urns
10 15 r *
10 100 1000
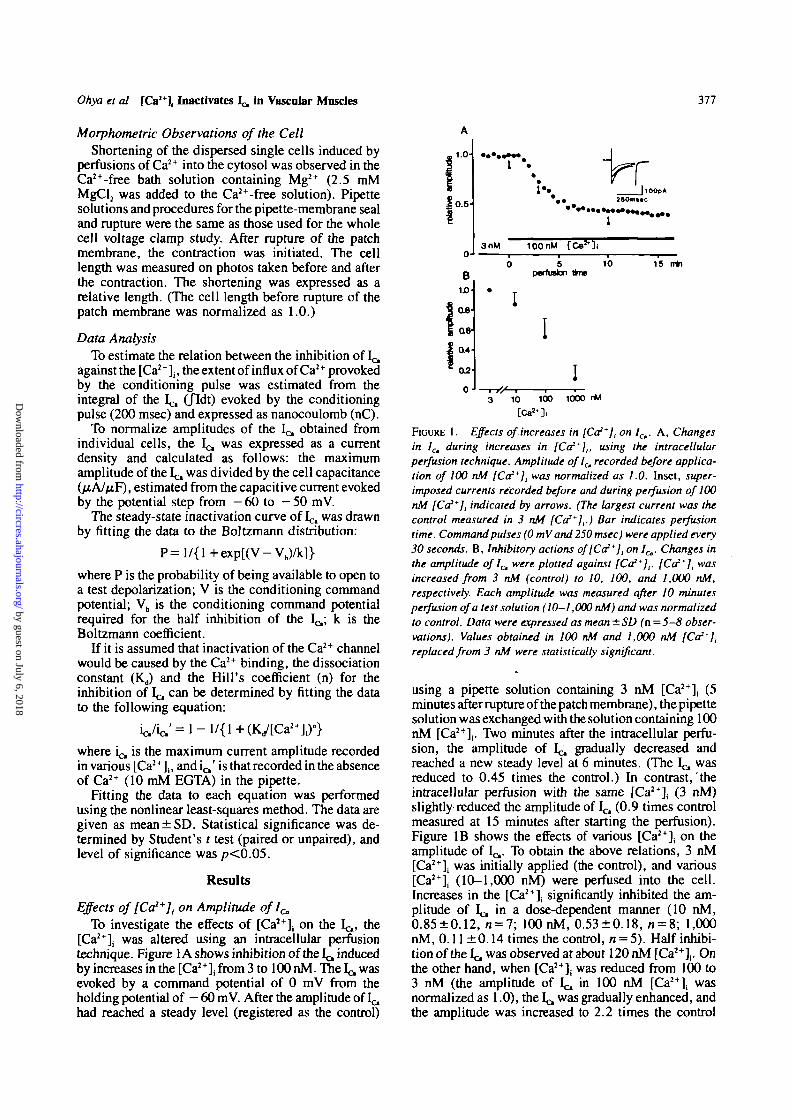
FIGURE 1. Effects of increases in [Co**], on lCt. A, Changesin /c, during increases in [Ca2*],, using the intracellularperfusion technique. Amplitude ofl^ recorded before applica-tion of 100 nM [Ca2*], was normalized as 1.0. Inset, super-imposed currents recorded before and during perfusion of 100nM [Co2*], indicated by arrows. (The largest current was thecontrol measured in 3 nM [Ca2*],.) Bar indicates perfusiontime. Command pulses (0 mVand 250 msec) were applied every30 seconds. B, Inhibitory actions of[Ca2*], on 1^. Changes inthe amplitude of 1^ were plotted against [Ca2*],. [Ca2*], wasincreased from 3 nM (control) to 10, 100, and 1,000 nM,respectively. Each amplitude was measured after 10 minutesperfusion of a test solution (10-1,000 nM) and was normalizedto control. Data were expressed as mean ± SD (n=5-8 obser-vations). Values obtained in 100 nM and 1,000 nM [Ca2*],replaced from 3 nM were statistically significant.
using a pipette solution containing 3 nM [Ca2+], (5minutes after rupture of the patch membrane), the pipettesolution was exchanged with the solution containing 100nM [Ca2+](. Two minutes after the intracellular perfu-sion, the amplitude of 1^ gradually decreased andreached a new steady level at 6 minutes. (The I^ wasreduced to 0.45 times the control.) In contrast, theintracellular perfusion with the same [Ca2+], (3 nM)slightly reduced the amplitude of I^ (0.9 times controlmeasured at 15 minutes after starting the perfusion).Figure IB shows the effects of various [Ca2+]j on theamplitude of 1^. To obtain the above relations, 3 nM[Ca2+]i was initially applied (the control), and various[Ca2+]; (10-1,000 nM) were perfused into the cell.Increases in the [Ca*], significantly inhibited the am-plitude of Ic, in a dose-dependent manner (10 nM,0.85±0.12, n = 7; 100 nM, 0.53±0.18, « = 8; 1,000nM, 0.11 ±0.14 times the control, n = 5). Half inhibi-tion of the Ic, was observed at about 120 nM2+ [ C a ] , . Onthe other hand, when [ C a ] ; was reduced from 100 to3 nM (the amplitude of I^ in 100 nM [ C a ] | wasnormalized as 1.0), the Ic was gradually enhanced, andthe amplitude was increased to 2.2 times the control
by guest on July 6, 2018http://circres.ahajournals.org/
Dow
nloaded from

378 Circulation Research Vol 62, No 2, February 1988
A
Z5-
2.0-
1.5
1.0 1.0
100nM 3nM
5 10perfusion lime
15 mln 100
(Figure 2A). The mean value was 1.9 ±0.62 times thecontrol (n = 9, Figure 2B).
Effects of fCa2*], on 1^ and Effects of[Ba2+]ionlCa
Inhibitory effects of [Ca2+], on the Ca2+ channel werealso determined from measurements of the \^. WhenCa2+ in the bath solution was replaced with Ba2+, theIB, could be recorded. [Ca2+], was increased from 3 nM(control) to 100 nM using the intracellular perfusiontechnique, and reductions in amplitudes of the Ig, wereinvestigated (Figure 3A). Amplitudes of the I,,, weregradually decreased in proportion to increases in the[Ca2+], to 0.45 times the control. Increases in the [Ca2^inhibited the Ig, to much the same extent as observedin the case of the 1^. (The Ig, was inhibited in 100 nM[Ca2+]( to 0.49 ±0.05 times the control, n = 5.)
As the decay phase of L^ was slow, compared withthat of the 1^, it seemed unlikely that Ba2+ would haveany inhibitory effect on the Ca2+ channel.'" To confirmthis, we investigated the effect of [Ba2+], (1-100 fiM)on the Ic,. Figure 3B shows a typical result obtained in100 fiM [Ba2*],. As the control, the ^ was recordedwith the Ca2+-free pipette solution containing 10 mMEGTA, and subsequently, the pipette solution contain-ing 100 /xM [Ba2+], was intracellularly perfused.Introduction of Ba2+ (100 fiM) into the cytosol did notinhibit the I^ for over 20 minutes (reduced to 0.9 timesthe control). Similar experiments were performed usingother cells, and we concluded that there is no significanteffect with applications of 1-100 /xM [Ba2+], (1 fiM,0.95±0.06, n = A\ 10 FIM, 0.91 ±0.07, n = 4; 100
, 0.90±0.12 times the control, n = 5).
Effects of [Ca2*], on Current-Voltage RelationFigure 4 shows the I-V curves of the 1^ at two
different concentrations of [Ca2+], (3 and 100 nM) usingthe same cell. In the presence of 3 nM [Ca2+];, thethreshold potential required to evoke the 1^ was about— 30 mV, and the maximum amplitude was obtainedby application of the command pulse of 0 mV. Whenthe [Ca2+]; was increased to 100 nM, the 1^ wasconsistently suppressed at any given command poten-tial (to 0.5-0.65 times the control).
Effects of [Ca2+]i on lnactivation Curve ofICc
A steady-state inactivation curve of the I^ wasdetermined using the double pulse protocol. To reach
FIGURE 2. Effects of reduction in [Ca2*], on 1^. Pro-cedures and data analysis were the same as described forFigure 1. A, Changes in amplitudes of the 1^ duringdecreases in [Ca2*], from 100 nM (control) to 3 nM.Inset, Records obtained at times indicated by arrows andthe smallest current being the control. B, Enhancementin the amplitude ofl^ by reductions in [Ca2*], from 100nMto3 nM. Amplitude oflc, recorded in 100 nM [Ca2*],was normalized as 1.0, and individual values were
~ expressed in a relative manner (a = 9). Increases in theamplitude of /^ induced by reduction in [Ca2*], werestatistically significant.
the steady state of the 1&, conditioning pulses of 5seconds with various intensities were applied, andsubsequently, to evoke the 1^, the test pulse (0 mV, 50msec) was applied at the holding potential of - 80 mV.(The interval of two pulses was 10 msec.) Similarsteady-state inactivation curves were obtained with 3and 100 nM [Ca2+],, as shown in Figure 5 (3 nM,k = 7.2 and V h = - 3 8 mV; 100 nM, k = 7.3 andVh= -40mV;n = 5-7).
Inhibitions of the 1^ were also studied using adifferent double pulse protocol with a short condition-ing pulse (200 msec). The conditioning (up to +50mV) and test (0 mV, 50 msec) pulses were separated
A1.0
0.5
3nM1 100nM
B1.0-
'as
oJ
5 10porfusion flmo
16 n *
1 i
| iooo*
10 16 n*iperfusion Ume
FIGURE 3. A, Effects of increase in [Ca2*]l on the l u . Changesin the amplitude of /fc measured during increases in [Ca2*],from 3 nM (control) to 100 nM are shown. Inset, Recordsobtained at the times indicated by arrows. (The largest currentwas the control.) Procedures and data analysis were the sameas for Figure 1 except for the bath solution (2.5 mM Ba2* waspresent instead of Ca1*) and the command potential ( — 10 mV).Amplitude ofl^ in the presence of 3 nM [Co2*], was normalizedas 1.0. B, Effects of [Ba2*], on 1^. Changes in the amplitudeoflu and superimposed real records. (The larger current wasthe control.) Experimental procedures and data analysis werethe same as for Figure 1. 1^ was recorded using Ca2*-freepipette solution containing 10 mM EGTA alone (normalized as1.0, the control), and 100 pM [Ba2*], was infused into thecytosol.
by guest on July 6, 2018http://circres.ahajournals.org/
Dow
nloaded from

Ohya et al [Ca2+], Inactivates 1^ in Vascular Muscles 379
JiOOpA250msec pA
FIGURE 4. Current-voltage relation observed in the presenceof 3 nM or lOO nM [Co2*],. A, l^ was recorded before (3 nM,open circles) and 10 minutes after perfusion of 100 nM [Co2*],(100 nM, closed circles). The holding membrane potential waskept at -60 mV, and command potentials are shown in the leftside of traces. B, I-V curve obtained in the presence of 3 nMor 100 nM [Ca2*],. Peak amplitudes ofl^ provoked by variouscommand potentials were plotted. The holding potential waskept at —60 mV. A and B were obtained from the same cell.
by an interval of 100 msec to minimize the influenceof the noninactivated Ca2+ current and of contaminat-ing currents such as the Ca2+-dependent Cl~ current,etc. Figure 6A shows a typical result obtained from onecell for which two EGTA concentrations (0.1 and 1mM) were used for the pipette solution. In thisexperiment, CaCl2 was not added to the pipettesolution. The amplitudes of l^ were larger in thepresence of 1 mM EGTA than those of 0.1 mM EGTA.With application of the conditioning pulse of - 30 mV,the Ic, evoked by the test pulse was inhibited, andapplication of the conditioning pulse of 0 mV furtherinhibited the 1^. However, when the conditioning pulseof + 50 mV was applied, the amplitude of l^ was partlyrestored. Figure 6B shows the relative amplitudes of
1.0-
0.5-
0-J-80 -60 -40 -20
conditioning depolarization mV
FIGURE 5. Steady-state inactivation curves observed in thepresence of 3 nM and 100 nM [Ca '*],. Various amplitudes ofconditioning pulse (5 seconds) were applied before applicationof the test pulse (0 mV, 50 msec) at an interval of 10 msec. Theholding potential was kept at —80mV. Continuous curves wereobtained by fitting data to the Boltzmann distribution (3 nM,k=7.2, Vt= -38 mV; 100 nM, k=7.3, Vk= -40 mV; see"Materials and Methods"). Each point was expressed as themean±SD of 5-7 observations.
the Ic, evoked by the test pulse plotted against theconditioning potential. The amplitudes of 1^ recordedwithout application of the conditioning pulse, in thepresence of 0.1 and 1.0 mM EGTA, were bothnormalized as 1.0. The maximum inhibition of the l^was obtained by a conditioning pulse of 0 mV or + 10mV; that is, the inhibition curve was U shaped.However, the fraction of the maximal inhibition wassmaller in the presence of 1 mM EGTA than that in 0.1mM EGTA (to 0.4 times in 0.1 mM EGTA, and to 0.5
B 1.0
0.5-
0 J
a • o EGTA 0.1 mM •1 mM o
o o• o °
H O ^ 0 +40 mVcondltiortiQ depolarization
10amount of Ca
30 nCInflux
FIGURE 6. Inactivations of Co2* channel measured using thedouble pulse protocol in the presence of two different concen-trations of EGTA in the pipette solution (0.1 mM, 1 mM). Theholding potential was kept at —60 mV. Inset, a test commandpulse (0 mV and 50 msec) was applied after application of theconditioning pulse (200 msec and various steps of depolariza-tion) with an interval between conditioning and test pulses of 100msec. After completion of a series of the experiment for 0.1 mMEGTA, the pipette solution was replaced with that containing 1mM EGTA, and then the experiment for 1 mM EGTA wasrepeated. A, l^ measured in the presence of 0.1 mM (closedcircles) or 1 mM (open circles) EGTA. B and C, Inactivation of/c induced by the conditioning pulse. 1^ evoked by the test pulsein the presence of 0.1 mM or 1 mM EGTA without applicationof the conditioning pulse was normalized as 1.0. Relativeamplitude of /& evoked by the test pulse was plotted againstpotentials of the conditioning pulse (B) and the Ca2* influx(expressed as nanocoulomb, nC; see "Materials and Methods" )provoked by the conditioning pulse (C). A, B, and C wereobtained from the same cell.
by guest on July 6, 2018http://circres.ahajournals.org/
Dow
nloaded from
380 Circulation Research Vol 62, No 2, February 1988
O8
0.6-
0.4
O2-
0-
I—I-
-J..5.
•0
•0.2 IO
-0.4 =oo0 6 .
_>• 0.8 a
1.0L 1.1
EGTA10mM
10 100 1000nM
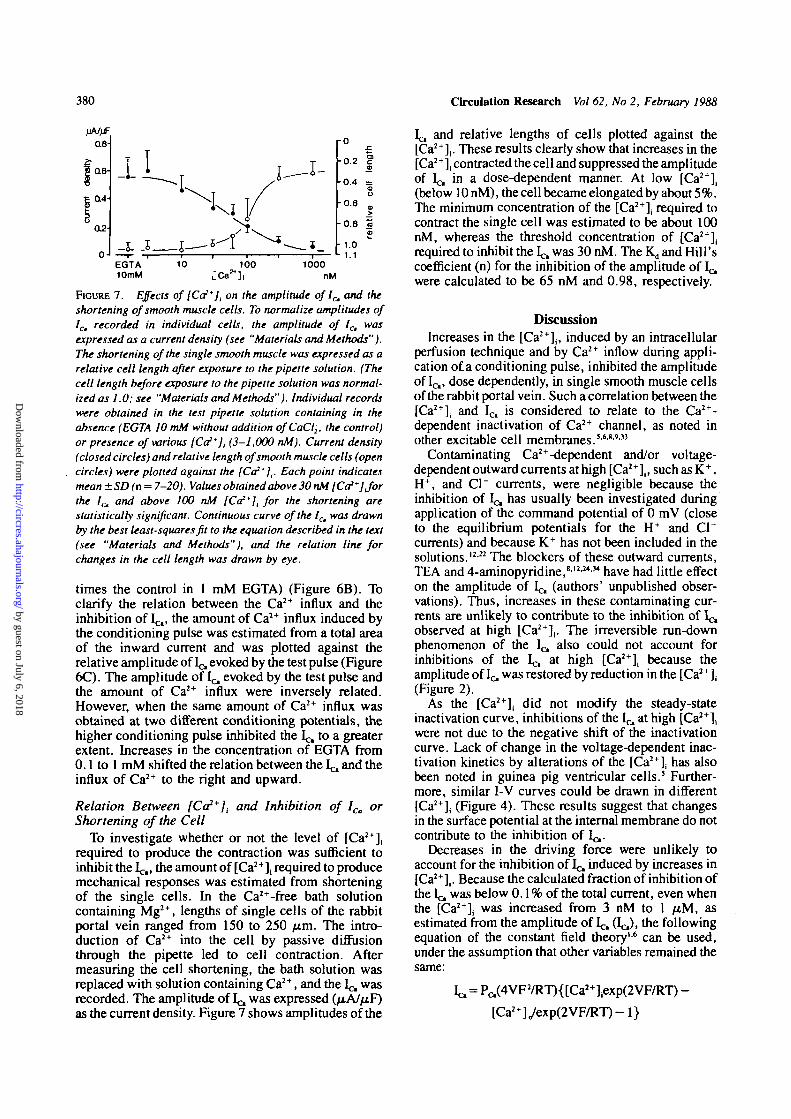
FIGURE 7. Effects of [Co**], on the amplitude of 1^ and theshortening of smooth muscle cells. To normalize amplitudes ofICm recorded in individual cells, the amplitude of 1^ wasexpressed as a current density (see "Materials and Methods").The shortening of the single smooth muscle was expressed as arelative cell length after exposure to the pipette solution. (Thecell length before exposure to the pipette solution was normal-ized as 1.0; see "Materials and Methods"). Individual recordswere obtained in the test pipette solution containing in theabsence (EGTA 10 mM without addition ofCaCl2, the control)or presence of various [Co2*], (3-1,000 nM). Current density(closed circles) and relative length of smooth muscle cells (opencircles) were plotted against the [Co*],. Each point indicatesmean±SD (n = 7-20). Values obtained above 30 nM [Co*]Jorthe /c, and above 100 nM [Ca*]l for the shortening arestatistically significant. Continuous curve of the 1^ was drawnby the best least-squares fit to the equation described in the text(see "Materials and Methods"), and the relation line forchanges in the cell length was drawn by eye.
times the control in 1 mM EGTA) (Figure 6B). Toclarify the relation between the Ca2+ influx and theinhibition of 1^, the amount of Ca2+ influx induced bythe conditioning pulse was estimated from a total areaof the inward current and was plotted against therelative amplitude of 1^ evoked by the test pulse (Figure6C). The amplitude of l^ evoked by the test pulse andthe amount of Ca2+ influx were inversely related.However, when the same amount of Ca2+ influx wasobtained at two different conditioning potentials, thehigher conditioning pulse inhibited the 1^ to a greaterextent. Increases in the concentration of EGTA from0.1 to 1 mM shifted the relation between the l^ and theinflux of Ca2+ to the right and upward.
Relation Between [Ca2*]i and Inhibition of ICA orShortening of the Cell
To investigate whether or not the level of [Ca2+],required to produce the contraction was sufficient toinhibit the l^,, the amount of [Ca2+], required to producemechanical responses was estimated from shorteningof the single cells. In the Ca2+-free bath solutioncontaining Mg2+, lengths of single cells of the rabbitportal vein ranged from 150 to 250 /urn. The intro-duction of Ca2+ into the cell by passive diffusionthrough the pipette led to cell contraction. Aftermeasuring the cell shortening, the bath solution wasreplaced with solution containing Ca2+, and the 1^ wasrecorded. The amplitude of Ic, was expressed (jxAJfiF)as the current density. Figure 7 shows amplitudes of the
Ic, and relative lengths of cells plotted against the[Ca2+]i. These results clearly show that increases in the[Ca2+], contracted the cell and suppressed the amplitudeof Ic, in a dose-dependent manner. At low [Ca2+](
(below 10nM), the cell became elongated by about5%.The minimum concentration of the [Ca2+]; required tocontract the single cell was estimated to be about 100nM, whereas the threshold concentration of [Ca2+],required to inhibit the L^ was 30 nM. The K,, and Hill'scoefficient (n) for the inhibition of the amplitude of 1^were calculated to be 65 nM and 0.98, respectively.
DiscussionIncreases in the [Ca2+],, induced by an intracellular
perfusion technique and by Ca2+ inflow during appli-cation of a conditioning pulse, inhibited the amplitudeof Ic, dose dependently, in single smooth muscle cellsof the rabbit portal vein. Such a correlation between the[Ca2+], and 1^ is considered to relate to the Ca2+-dependent inactivation of Ca2+ channel, as noted inother excitable cell membranes.3-6-8-9J3
Contaminating Ca2+-dependent and/or voltage-dependent outward currents at high [Ca2+],, such as K+,H+, and Cl" currents, were negligible because theinhibition of 1^ has usually been investigated duringapplication of the command potential of 0 mV (closeto the equilibrium potentials for the H+ and C l 'currents) and because K+ has not been included in thesolutions.12-22 The blockers of these outward currents,TEA and 4-aminopyridine,8'2-24'34 have had little effecton the amplitude of L^ (authors' unpublished obser-vations). Thus, increases in these contaminating cur-rents are unlikely to contribute to the inhibition of I cobserved at high [Ca2+],. The irreversible run-downphenomenon of the I^ also could not account forinhibitions of the I,-, at high [Ca2+], because theamplitude of 1^ was restored by reduction in the [Ca2+],(Figure 2).
As the [Ca2+], did not modify the steady-stateinactivation curve, inhibitions of the 1,̂ at high [Ca2+],were not due to the negative shift of the inactivationcurve. Lack of change in the voltage-dependent inac-tivation kinetics by alterations of the [Ca2*], has alsobeen noted in guinea pig ventricular cells.5 Further-more, similar I-V curves could be drawn in different[Ca2+], (Figure 4). These results suggest that changesin the surface potential at the internal membrane do notcontribute to the inhibition of I^.
Decreases in the driving force were unlikely toaccount for the inhibition of I^ induced by increases in[Ca2+],. Because the calculated fraction of inhibition ofthe Ic was below 0.1 % of the total current, even whenthe [Ca2+]( was increased from 3 nM to 1 fiM, asestimated from the amplitude of L^ (1^), the followingequation of the constant field theory" can be used,under the assumption that other variables remained the
same:
= PCl(4VF2/RT){[Ca2+]iexp(2VF/RT) -
[Ca2 +]yexp(2VF/RT)-l}
by guest on July 6, 2018http://circres.ahajournals.org/
Dow
nloaded from

Ohya et al [Ca2+], Inactivates 1^ in Vascular Muscles 381
where V is membrane potential ( - 30 mV - h 50 mV);P Q is the Ca2+ permeability coefficient; and R, T, andF have their standard meanings.
Increases in the [Ca2+]f inhibited both the l^ and IB,to much the same extent. Therefore, the inhibitoryeffects of [Ca2+]i seemed to work on the Ca2+ channel.From the relation between the inhibition of 1^ andincreases in the [Ca2+], (Figure 7), the Kj value was 65nM, and the Hill's coefficient was about 1.0. Plant etal6 proposed that a Ca2+ binding site linked to theinactivation mechanism is located near the insidemouth of the Ca2+ channel in neurons. The presentresults also suggest the presence of a Ca2+ binding siteon the inside of the plasma membrane, and thestoichiometry of Ca2+ to the binding site seems to be1:1. When we assumed that the Hill's coefficient was1.0 and the i^' was the same as i,-, measured in thepresence of 3 nM [Ca2+]2, the Kd value of 106 nM couldbe obtained from the data of Figure 1, and this valuewas roughly the same as estimated from the data shownin Figure 7. This Kd value was slightly smaller than thatobserved in Helix neurons (1 fiM), but was much thesame as observed in snail and rat neurons.
In the present experiments, the calcium concentra-tion in the pipette was assumed to be [Ca2^, and thisvalue may differ from that obtained by direct mea-surement using a calcium-sensitive microelectrode.34
We think that internal perfusion could achieve completereplacement of the intracellular fluid within 10 minutesas the amplitude of 1^ did not change subsequently anda good dose-response relation was observed." Al-though the calculated [Ca2+], may not be accurate,direct measurements by a calcium-sensitive electrodeare also limited in their ability to estimate the real[Ca2+]i; especially at concentrations lower than 0.1fjM., due to a poor seal around the electrode and toalterations in electrode responsiveness during meas-urement.33 In any case, if 10 mM EGTA used here wasinsufficient to reduce [Ca2+](,33 the value of Kj may bean underestimate.
Low concentrations of [Ca2+]j (30 nM-1 fjM)inhibited the Ca2+ channel of smooth muscle membranein the rabbit portal vein, in a dose-dependent manner,but even high concentrations of Ba2+ (up to 100 (J.M)did not do so. Therefore, the inhibitory effects of[Ca2+], on the Ca2+ channel seem to be specific. Brownet al* found no inhibitory effect of increased [Ba2+], (upto 1 mM) on the Ca2+ channel in neurons.
One explanation for the mechanisms related to[Ca2+],-dependent inactivation of the Ca2+ channel wasintroduced by Chad and Eckert.35 They proposed thatinactivation of the 1^ may occur during dephosphory-lation of a Ca2+ channel-related protein and that theCa2+-dependent inactivation was the result of activa-tion of a Ca2+-dependent phosphatase. In such cases,the binding of Ca2+ corresponds to the enzymaticreaction that occurs in certain biochemical processes.Ohya et al" reported that intracellular applications ofATP enhanced the 1^ with slight prolongation of thedecay of the current in intestinal smooth muscle cells.Studies are underway to clarify the inactivation of the
Ca2+ channel in smooth muscle cells in relation toenzymatic processes.
Two types of Ca2+ channels have been reported,3*"3*and in heart and dorsal root ganglion cells, only one ofthese is inactivated by a Ca2+-dependent mecha-nism.39-40 In the present study, as we did not find anyevidence that suggested two types of Ca2+ channels inthe smooth muscle cells of rabbit portal vein, thepossible contribution of two such Ca2+ channels wasnot taken into consideration for measurement of the
In smooth muscle cells, the inactivation curveobtained from the double pulse study with a shortconditioning pulse was U shaped,1314" and the inhi-bition of I,;, was closely related to the influx of Ca2+
during the conditioning pulse. In the present experi-ments, increases in the concentration of EGTA sup-pressed the inhibitory effect induced by the condition-ing pulse. These results are in good accord with aCa2+-dependent inactivation mechanism of the Ca2+
channel. Increases in the concentration of EGTA in thecell may suppress the elevation of [Ca2+]; induced byconditioning pulses. The enhancement of the 1 .̂induced by increases in the concentration of EGTA inthe pipette solution observed in the present study isprobably due to decreases in the steady level of [Ca24^.
The voltage-dependent inactivation mechanism ofthe Ca2+ channel in smooth muscle cells was alsoelucidated from the following evidence: 1) The steady-state inactivation curve was initiated at the commandpotential where the ^ was not generated (Figure 4).2) When the conditioning pulse was sufficiently long,turn-up of the inactivation curve observed at highcommand-potential levels was suppressed in the doublepulse study." 3) Inhibitions of the 1^ could not solelybe explained quantitatively by the amount of influx ofCa2+ induced by the conditioning in the double pulsestudy with a short conditioning pulse; that is, higherconditioning depolarization inhibited the 1̂ , to a greaterextent even when the amount of Ca2+ influx induced bythe conditioning pulses was the same with higher andlower conditioning depolarizing pulses (Figure 5).
Single smooth muscle cells of the rabbit portal veincontracted with application of over 100 nM [Ca2+]|( andthe maximum shortening was observed at 1 fiM. ThisCa2+ sensitivity of the mechanical response was muchthe same as that observed in skinned muscle tissues ofthe rabbit mesenteric artery determined using theisometric tension recording methods.2341 Therefore, theperfusion of Ca2+, in a passive manner, into the cytosolfrom the pipette was considered to be adequate.
The [Ca2+], at the resting state in vascular smoothmuscle cells was about 100 nM, as estimated fromexperiments using Ca2+-sensitive dyes, quin2 andfura2,4243 and also from the Ca2+ sensitivity of skinnedsmooth muscle tissues.2340 Therefore, about 50% of theCa2+ channel may be inactivated during the restingstate. The role of these inactivated Ca2+ channels at theresting state, in relation to the contraction-relaxationcycle in the smooth muscle cells, has yet to be clearlydefined. However, together with other factors, such as
by guest on July 6, 2018http://circres.ahajournals.org/
Dow
nloaded from

382 Circulation Research Vol 62, No 2, February 1988
the Ca2+-dependent K+ channel,16 the intracellularCa2+-dependent inactivation may well function toprevent Ca2+ overload in the cytosol.
We conclude that Ca2+-dependent inactivation of theCa2+ channel contributes to physiological alterations of[Ca2+]j in smooth muscle cells of the rabbit portal vein.
AcknowledgmentsWe thank Dr. T. Fujiwara for assistance with
calculating ionic compositions of the solutions, and M.Ohara for reading the manuscript.
References1. Hagiwara S, Byerly L: Calcium channel. Annu Rev Neurosci
1981;4:69-1252. Tsien RW: Calcium channels in excitable cell membranes.
Annu Rev Physiol 1983;45:341-3583. Fox AP: Voltage-dependent inactivation of a calcium channel.
Proc Noll Acad Sci USA 1981;78:953-9564. Hodgkin AL, Huxley AF: A quantitative description of
membrane current and its application to conduction andexcitation in nerve. / Physiol (Lond) 1952;117:500-544
5. Kokubun S, Irisawa H: Effects of various intracellular Ca ionconcentrations on the calcium current of guinea-pig singleventricular cells. Jpn J Physiol 1984;34:599-611
6. Plant TD, Standeh NB, Ward TA: The effects of injection ofcalcium ions and calcium chelators on calcium channelinactivation in Helix neurones. J Physiol (Lond) 1983;334:189-212
7. Ashcroft FM, Stanfield PR: Calcium inactivation in skeletalmuscle fibers of the stick insect, Carausius morosus. J Physiol(Lond) 1982;330:349-372
8. Brown AM, Morimoto K, Tsuda Y, Wilson DL: Calciumcurrent-dependent and voltage-dependent inactivation of cal-cium channels in Helix aspersa. J Physiol (Lond) 1981;320:193-218
9. Eckert R, Tillotson DL: Calcium-mediated inactivation of thecalcium conductance in cesium-loaded giant neurones ofAplysia calfornica. J Physiol (Lond) 1981;314:265-280
10. Josephson IR, Sanchez-Chapula J, Brown AM: A comparisonof calcium currents in rat and guinea pig single ventricular cells.CircRes 1984;54:144-156
11. Lee KS, Marban E, Tsien RW: Inactivation of calcium channelin mammalian heart cells: Joint dependence on membranepotential and intracellular calcium. J Physiol (Lond) 1985;364:395^11
12. Ohya Y, Terada K, Kitamura K, Kuriyama H: Membranecurrents recorded from a fragment of rabbit intestinal smoothmuscle cell. Am J Physiol 1986;251(CW/ Physiol 2O):C335-C346
13. Jmari K, Mironneu C, Mironneu. J: Inactivation of calciumchannel current in rat uterine smooth muscle: Evidence forcalcium- and voltage-mediated mechanisms. / Physiol (Lond)1986;380:l 11-126
14. Ganitkevich VY, Shuba MF, Smirnov SV: Potential dependentcalcium inward current in a single isolated smooth muscle cellof the guinea-pig Taenia caeci. J Physiol (Lond) 1986;380:1 -16
15. SoejimaM, Noma A: Mode of regulation of the ACh-sensitiveK-channel by muscarinic receptor in rabbit atrial cells. PflugersArch 1984;400:424-^31
16. Inoue R, Kitamura K, Kuriyama H: Two Ca-channel dependentK channels classified by tetraethylammonium distributed onsmooth muscle membranes of the rabbit portal vein. PflugersArch 1985 ;405:173-179
17. Brenncke R, Lindemann B: Design of a fast voltage clamp forbiological membranes, using discontinuous feedback. Rev SciInstrum 1974;45:656-661
18. Finkel AS, Redman SJ: Optimal voltage clamping with singlemicroelectrode, in Smith TG Jr, Lecar H, Redman SJ, Gage PW(eds): Voltage and Patch Clamping With Microelectrodes.American Physiological Society, Bethesda, Md, 1985, pp95-120
19. Ohya Y, Kitamura K, Kuriyama H: Modulation of ionic currentsin smooth muscle balls of the rabbit intestine by intracellularlyperfused ATP and cyclic AMP. Pflugers Arch 1987;408:465-473
20. Ohya Y, Terada K, Kitamura K, Kuriyama H: D600 blocks theCa2+ channel from the outer surface of smooth musclemembrane of the rabbit intestine and portal vein. Pflugers Arch1987;4O8:8O-83
21. Hamill OP, Marty A, Neher E, Sackmann B, Sigworth FJ:Improved patch-clamp technique for high-resolution currentrecording from cells and cell-free membrane patches. PflugersArch 1981;391:85-100
22. Kldckner U, Isenberg G: Calcium current of cesium loadedisolated smooth muscle cells (urinary bladder of the guineapig). Pflugers Arch 1985;405:340-348
23. Walsh JV Jr, Singer JJ: Identification and characterization ofmajor ionic currents in isolated smooth muscle cells using thevoltage-clamp technique. Pflugers Arch 1987;4O8:83-97
24. Byerly L, Meech R, Moody JW: Rapid activating hydrogen ioncurrent in perfused neurones of the snail, Lymnaea stagnalis.J Physiol (Lond) 1984;351:199-216
25. Irisawa H, Kokubun S: Modulation by intracellular ATP andcyclic AMP of the slow inward current in isolated singleventricular cells of the guinea-pig. J Physiol (Lond) 1983;338:321-337
26. Itoh T, Kanmura Y, Kuriyama H: Inorganic phosphate regulatesthe contraction-relaxation cycle in skinned muscles of the rabbitmesenteric artery. / Physiol (Lond) 1986;376:231-252
27. Sato S, Kubota Y, Itoh T, Kuriyama H: Mechanisms of theBa2+-induced contraction in smooth muscle cells of the rabbitmesenteric artery. J Gen Physiol 1987;89:215—238
28. Botts J, Chashin A, Young HL: Alkali metal binding byethylenediamine-tetraacetate, adenosine 5'-trisphosphate, andpyrophosphate. Biochemistry 1965;4:1788-1796
29. Hararuji H, Ogawa Y: Re-examination of the apparent bindingconstant of ethylene glycol bis 09-aminoethyl ether)-N,N,N',N'-tetraacetic acid with calcium around neutral pH. JBiochem (Tokyo) 1980;87:1305-1312
30. Martell AE, Schwarzenbach G: Adenosine Phosphate undTriphosphate als Komplex-bindner fur Calcium und Magne-sium. Hetv Chimi Ada 1956;39:653-661
31. Taqui Khan MM, Martell AE: Thermodynamic quantitiesassociated with the interaction of adenosine triphosphate withmetal ions. J Am Chem Soc 1966;88:668-671
32. Schwarzenbach G, Senn H, Anderegg G: Komplexone. XXJXEingrosser Chelateffekt besonderer. Helv Chimi Acta1957;40:1886-1900
33. Dupont JL, Bossu JL, Feltz A: Effect of internal calciumconcentration of calcium currents in rat sensory neurones.Pflugers Arch 1986;4O6:433^35
34. Byerly L, Moody JW: Intracellular calcium ions and calciumcurrent in perfused neurones of the snail, Lymnaea stagnalis.J Physiol (Lond) 1984;352:637-652
35. Chad JE, Eckert R: An enzymatic mechanism for calciumcurrent inactivation in dialysed Helix neurones. J Physiol(Lond) 1986;378:31-51
36. Aaronson PI, Benham CD, Bolton TB, Hess P, Lang RJ, TsienRW: Two types of single-channel and whole-cell calcium orbarium currents in single smooth muscle cells of rabbit earartery and the effects of noradrenaline. J Physiol (Lond)1986;377:36
37. LoirandG, PacaudP, Mironneau C, Mironncau J: Evidence fortwo distinct calcium channels in rat vascular smooth musclecells in short-term primary culture. Pflugers Arch1987;407:566-568
38. Sturek M, Hermsmeyer K: Calcium and sodium channels inspontaneously contracting vascular muscle cells. Science1986;233:475-478
39. Bean BP: Two kinds of calcium channels in canine atrial cells:Differences in kinetics, selectivity, and pharmacology. J GenPhysiol 1985;86:l-30
40. Carbone E, Lux HD: A low voltage-activated, fully inactivatingCa channel in vertebrate sensory neurones. Nature1984;310:501-502
41. Kuriyama H, Ito Y, Suzuki H, Kitamura K, Itoh T: Factors
by guest on July 6, 2018http://circres.ahajournals.org/
Dow
nloaded from

Ohya et al [Ca2+], Inactivates I c in Vascular Muscles 383
modifying contraction-relaxation cycle in vascular smoothmuscles. Am J Physiol 1982;243(flearl Circ Physiol 12):H641-H662
42. Sumimoto K, Kuriyama H: Mobilization of the Ca2* measuredduring contraction-relaxation cycles in smooth muscle cells ofthe porcine coronary artery using quin2. Pflugers Arch1986;4O6:173-180
43. Williams DA, Fbgarty ICE, Tsien RW, Fay FS: Calciumgradients in single smooth muscle cells revealed by the digitalimaging microscope using Fura-2. Nature 1986;318:558-561
KEY WORDS • single vascular smooth muscle cell • voltageclamp • Ca2* channel • Ca2+-channel inactivation
by guest on July 6, 2018http://circres.ahajournals.org/
Dow
nloaded from

Y Ohya, K Kitamura and H Kuriyamaportal vein.
Regulation of calcium current by intracellular calcium in smooth muscle cells of rabbit
Print ISSN: 0009-7330. Online ISSN: 1524-4571 Copyright © 1988 American Heart Association, Inc. All rights reserved.is published by the American Heart Association, 7272 Greenville Avenue, Dallas, TX 75231Circulation Research
doi: 10.1161/01.RES.62.2.3751988;62:375-383Circ Res.
http://circres.ahajournals.org/content/62/2/375World Wide Web at:
The online version of this article, along with updated information and services, is located on the
http://circres.ahajournals.org//subscriptions/
is online at: Circulation Research Information about subscribing to Subscriptions:
http://www.lww.com/reprints Information about reprints can be found online at: Reprints:
document. Permissions and Rights Question and Answer about this process is available in the
located, click Request Permissions in the middle column of the Web page under Services. Further informationEditorial Office. Once the online version of the published article for which permission is being requested is
can be obtained via RightsLink, a service of the Copyright Clearance Center, not theCirculation Research Requests for permissions to reproduce figures, tables, or portions of articles originally published inPermissions:
by guest on July 6, 2018http://circres.ahajournals.org/
Dow
nloaded from


![Regulation of Intracellular Calcium Signaling, Localized Signals … · 2015-12-25 · in Cerebellar Purkinje Cells Rat cerebellar slice [12 days PN]; Polyclonal antibody for type](https://static.fdocuments.net/doc/165x107/5cd3fee888c993de288ba23c/regulation-of-intracellular-calcium-signaling-localized-signals-2015-12-25.jpg)