Mobilization of intracellular calcium stores participates in
Bone 53 (2013) 531–540
Contents lists available at SciVerse ScienceDirect
Bone
j ourna l homepage: www.e lsev ie r .com/ locate /bone
Original Full Length Article
Spatiotemporal properties of intracellular calcium signaling inosteocytic and osteoblastic cell networks under fluid flow
Da Jing a,b, X. Lucas Lu b,c, Erping Luo a, Paul Sajda d, Pui L. Leong b, X. Edward Guo b,⁎a Department of Biomedical Engineering, Fourth Military Medical University, Xi'an, Shaanxi 710032, Chinab Bone Bioengineering Laboratory, Department of Biomedical Engineering, Columbia University, New York, NY 10027, USAc Department of Mechanical Engineering, University of Delaware, Newark, DE 19716, USAd Laboratory for Intelligent Imaging and Neural Computing, Department of Biomedical Engineering, Columbia University, New York, NY 10027, USA
⁎ Corresponding author at: 351 Engineering Terrace,MAvenue, Columbia University, New York, NY 10027, USA.
E-mail address: [email protected] (X.E. Guo).
8756-3282/$ – see front matter © 2013 Elsevier Inc. Allhttp://dx.doi.org/10.1016/j.bone.2013.01.008
a b s t r a c t
a r t i c l e i n f oArticle history:Received 9 October 2012Revised 4 January 2013Accepted 5 January 2013Available online 14 January 2013
Edited by: J. Aubin
Keywords:Osteocytic and osteoblastic networksFluid flowCalcium signalingIndependent component analysisSpatiotemporal properties
Mechanical stimuli can trigger intracellular calcium (Ca2+) responses in osteocytes and osteoblasts. Successfulconstruction of bone cell networks necessitates more elaborate and systematic analysis for the spatiotemporalproperties of Ca2+ signaling in the networks. In the present study, an unsupervised algorithm based on indepen-dent component analysis (ICA) was employed to extract the Ca2+ signals of bone cells in the network. Wedemonstrated that the ICA-based technology could yield higher signal fidelity than the manual region of interest(ROI) method. Second, the spatiotemporal properties of Ca2+ signaling in osteocyte-like MLO-Y4 andosteoblast-like MC3T3-E1 cell networks under laminar and steady fluid flow stimulation were systematically an-alyzed and compared. MLO-Y4 cells exhibited much more active Ca2+ transients than MC3T3-E1 cells, evidencedby more Ca2+ peaks, less time to the 1st peak and less time between the 1st and 2nd peaks. With respect to tem-poral properties, MLO-Y4 cells demonstrated higher spike rate and Ca2+ oscillating frequency. The spatialintercellular synchronous activities of Ca2+ signaling in MLO-Y4 cell networks were higher than those inMC3T3-E1 cell networks and also negatively correlated with the intercellular distance, revealing faster Ca2+
wave propagation inMLO-Y4 cell networks. Our findings show that the unsupervised ICA-based technique resultsin more sensitive and quantitative signal extraction than traditional ROI analysis, with the potential to be widelyemployed in Ca2+ signaling extraction in the cell networks. The present study also revealed a dramatic spatiotem-poral difference in Ca2+ signaling for osteocytic and osteoblastic cell networks in processing themechanical stim-ulus. The higher intracellular Ca2+ oscillatory behaviors and intercellular coordination of MLO-Y4 cells providedfurther evidences that osteocytes may behave as the major mechanical sensor in bone modeling and remodelingprocesses.
© 2013 Elsevier Inc. All rights reserved.
Introduction
Bone, acting as an adaptive system, can remodel its structure in re-sponse to the external mechanical environment [1]. Understanding themechanism of bone remodeling is of critical importance in osteoporosis,age-related fractures and bone loss in prolonged space flight. Osteocytes,accounting for almost 95% of the bone cell population, are encapsulatedin a fluid-filled mineralized matrix and interconnected with each otherthrough long dendritic processes to form extensive networks in the lacu-nae–canaliculi system. It has been long conjectured that this elaborateosteocytic network behaves as the central mechanosensory system inbone adaptation and bone homeostasis [2]. Osteocytic networks cantransduce physical stimuli into biochemical signals to further regulatethe behaviors of osteoblasts and osteoclasts, thus coordinating bonemodeling and remodeling processes [3]. Several studies have shown
ail Code 8904, 1210AmsterdamFax: +1 212 854 8725.
rights reserved.
that osteoblasts themselves could respond to mechanical stimuli with acascade of cellular activities, such as calcium (Ca2+) signaling, and re-lease of nitric oxide (NO) and prostaglandin E2 (PGE2) [4–6]. Mechanicalloading triggers Ca2+ release in both osteocytes and osteoblasts [7–11],which is a pivotal and ubiquitous second messenger regulating manydownstream cellular activities, including cell proliferation, differentia-tion, and apoptosis [12]. Hence, a comprehensive understanding ofCa2+ signaling in osteocytes and osteoblasts under mechanical stimuliis of tremendous value in deciphering the mechanisms by which boneprocesses the biophysical stimulus.
Ca2+ signaling in osteocytes and osteoblasts can propagate betweenneighboring cells and generate Ca2+ waves in the bone cell populations[10,13]. However, most studies in bone cell mechanotransduction havebeen performed on confluent or sub-confluent uncontrolled cellmonolayers. In our previous studies, a two-dimensional patterned bonecell network was successfully constructed to mimic the elaborate invivo bone cell network topology using microcontact printing andself-assembled monolayer (SAM) techniques [14]. Our recent findingsdemonstrated that the osteocytic network showed repetitive spike-like
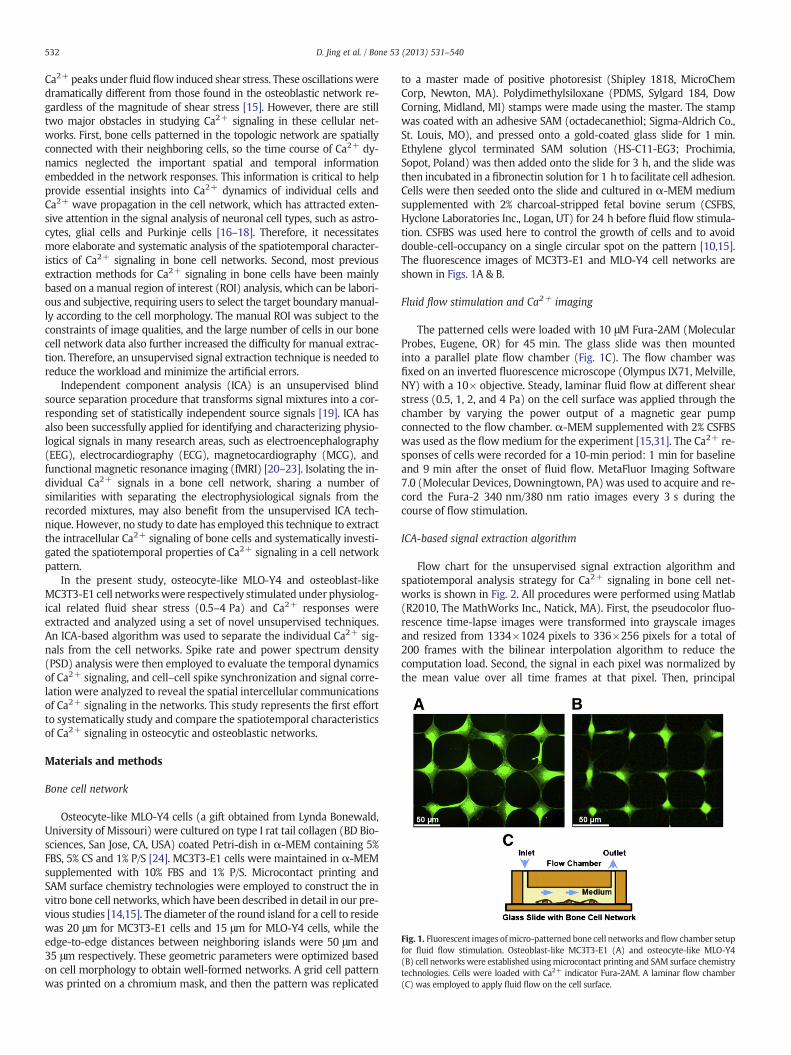
Fig. 1. Fluorescent images ofmicro-patterned bone cell networks and flow chamber setupfor fluid flow stimulation. Osteoblast-like MC3T3-E1 (A) and osteocyte-like MLO-Y4(B) cell networks were established usingmicrocontact printing and SAM surface chemistrytechnologies. Cells were loaded with Ca2+ indicator Fura-2AM. A laminar flow chamber(C) was employed to apply fluid flow on the cell surface.
532 D. Jing et al. / Bone 53 (2013) 531–540
Ca2+ peaks under fluidflow induced shear stress. These oscillationsweredramatically different from those found in the osteoblastic network re-gardless of the magnitude of shear stress [15]. However, there are stilltwo major obstacles in studying Ca2+ signaling in these cellular net-works. First, bone cells patterned in the topologic network are spatiallyconnected with their neighboring cells, so the time course of Ca2+ dy-namics neglected the important spatial and temporal informationembedded in the network responses. This information is critical to helpprovide essential insights into Ca2+ dynamics of individual cells andCa2+ wave propagation in the cell network, which has attracted exten-sive attention in the signal analysis of neuronal cell types, such as astro-cytes, glial cells and Purkinje cells [16–18]. Therefore, it necessitatesmore elaborate and systematic analysis of the spatiotemporal character-istics of Ca2+ signaling in bone cell networks. Second, most previousextraction methods for Ca2+ signaling in bone cells have been mainlybased on a manual region of interest (ROI) analysis, which can be labori-ous and subjective, requiring users to select the target boundarymanual-ly according to the cell morphology. The manual ROI was subject to theconstraints of image qualities, and the large number of cells in our bonecell network data also further increased the difficulty for manual extrac-tion. Therefore, an unsupervised signal extraction technique is needed toreduce the workload and minimize the artificial errors.
Independent component analysis (ICA) is an unsupervised blindsource separation procedure that transforms signal mixtures into a cor-responding set of statistically independent source signals [19]. ICA hasalso been successfully applied for identifying and characterizing physio-logical signals in many research areas, such as electroencephalography(EEG), electrocardiography (ECG), magnetocardiography (MCG), andfunctional magnetic resonance imaging (fMRI) [20–23]. Isolating the in-dividual Ca2+ signals in a bone cell network, sharing a number ofsimilarities with separating the electrophysiological signals from therecorded mixtures, may also benefit from the unsupervised ICA tech-nique. However, no study to date has employed this technique to extractthe intracellular Ca2+ signaling of bone cells and systematically investi-gated the spatiotemporal properties of Ca2+ signaling in a cell networkpattern.
In the present study, osteocyte-like MLO-Y4 and osteoblast-likeMC3T3-E1 cell networkswere respectively stimulated under physiolog-ical related fluid shear stress (0.5–4 Pa) and Ca2+ responses wereextracted and analyzed using a set of novel unsupervised techniques.An ICA-based algorithm was used to separate the individual Ca2+ sig-nals from the cell networks. Spike rate and power spectrum density(PSD) analysis were then employed to evaluate the temporal dynamicsof Ca2+ signaling, and cell–cell spike synchronization and signal corre-lation were analyzed to reveal the spatial intercellular communicationsof Ca2+ signaling in the networks. This study represents the first effortto systematically study and compare the spatiotemporal characteristicsof Ca2+ signaling in osteocytic and osteoblastic networks.
Materials and methods
Bone cell network
Osteocyte-like MLO-Y4 cells (a gift obtained from Lynda Bonewald,University of Missouri) were cultured on type I rat tail collagen (BD Bio-sciences, San Jose, CA, USA) coated Petri-dish in α-MEM containing 5%FBS, 5% CS and 1% P/S [24]. MC3T3-E1 cells were maintained in α-MEMsupplemented with 10% FBS and 1% P/S. Microcontact printing andSAM surface chemistry technologies were employed to construct the invitro bone cell networks, which have been described in detail in our pre-vious studies [14,15]. The diameter of the round island for a cell to residewas 20 μm for MC3T3-E1 cells and 15 μm for MLO-Y4 cells, while theedge-to-edge distances between neighboring islands were 50 μm and35 μm respectively. These geometric parameters were optimized basedon cell morphology to obtain well-formed networks. A grid cell patternwas printed on a chromium mask, and then the pattern was replicated
to a master made of positive photoresist (Shipley 1818, MicroChemCorp, Newton, MA). Polydimethylsiloxane (PDMS, Sylgard 184, DowCorning, Midland, MI) stamps were made using the master. The stampwas coated with an adhesive SAM (octadecanethiol; Sigma-Aldrich Co.,St. Louis, MO), and pressed onto a gold-coated glass slide for 1 min.Ethylene glycol terminated SAM solution (HS-C11-EG3; Prochimia,Sopot, Poland) was then added onto the slide for 3 h, and the slide wasthen incubated in a fibronectin solution for 1 h to facilitate cell adhesion.Cells were then seeded onto the slide and cultured in α-MEM mediumsupplemented with 2% charcoal-stripped fetal bovine serum (CSFBS,Hyclone Laboratories Inc., Logan, UT) for 24 h before fluid flow stimula-tion. CSFBS was used here to control the growth of cells and to avoiddouble-cell-occupancy on a single circular spot on the pattern [10,15].The fluorescence images of MC3T3-E1 and MLO-Y4 cell networks areshown in Figs. 1A & B.
Fluid flow stimulation and Ca2+ imaging
The patterned cells were loaded with 10 μM Fura-2AM (MolecularProbes, Eugene, OR) for 45 min. The glass slide was then mountedinto a parallel plate flow chamber (Fig. 1C). The flow chamber wasfixed on an inverted fluorescence microscope (Olympus IX71, Melville,NY) with a 10× objective. Steady, laminar fluid flow at different shearstress (0.5, 1, 2, and 4 Pa) on the cell surface was applied through thechamber by varying the power output of a magnetic gear pumpconnected to the flow chamber. α-MEM supplemented with 2% CSFBSwas used as the flowmedium for the experiment [15,31]. The Ca2+ re-sponses of cells were recorded for a 10-min period: 1 min for baselineand 9 min after the onset of fluid flow. MetaFluor Imaging Software7.0 (Molecular Devices, Downingtown, PA) was used to acquire and re-cord the Fura-2 340 nm/380 nm ratio images every 3 s during thecourse of flow stimulation.
ICA-based signal extraction algorithm
Flow chart for the unsupervised signal extraction algorithm andspatiotemporal analysis strategy for Ca2+ signaling in bone cell net-works is shown in Fig. 2. All procedures were performed using Matlab(R2010, The MathWorks Inc., Natick, MA). First, the pseudocolor fluo-rescence time-lapse images were transformed into grayscale imagesand resized from 1334×1024 pixels to 336×256 pixels for a total of200 frames with the bilinear interpolation algorithm to reduce thecomputation load. Second, the signal in each pixel was normalized bythe mean value over all time frames at that pixel. Then, principal
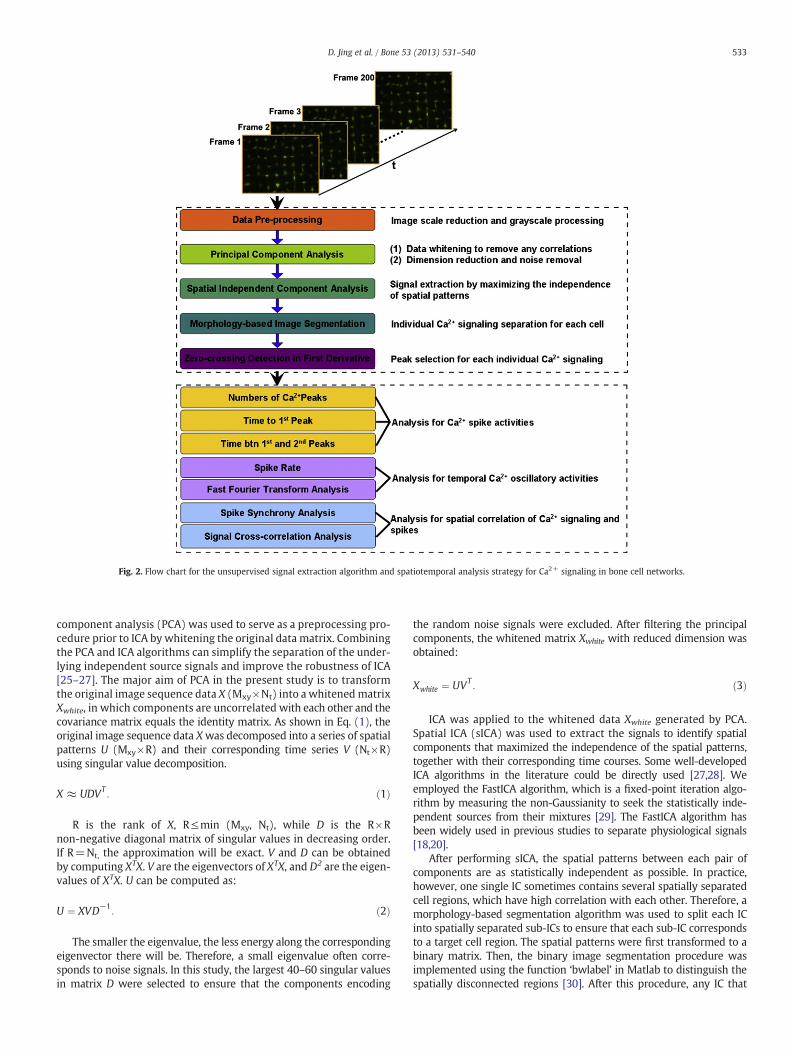
Fig. 2. Flow chart for the unsupervised signal extraction algorithm and spatiotemporal analysis strategy for Ca2+ signaling in bone cell networks.
533D. Jing et al. / Bone 53 (2013) 531–540
component analysis (PCA) was used to serve as a preprocessing pro-cedure prior to ICA by whitening the original data matrix. Combiningthe PCA and ICA algorithms can simplify the separation of the under-lying independent source signals and improve the robustness of ICA[25–27]. The major aim of PCA in the present study is to transformthe original image sequence data X (Mxy×Nt) into a whitened matrixXwhite, in which components are uncorrelated with each other and thecovariance matrix equals the identity matrix. As shown in Eq. (1), theoriginal image sequence data Xwas decomposed into a series of spatialpatterns U (Mxy×R) and their corresponding time series V (Nt×R)using singular value decomposition.
X ≈ UDVT: ð1Þ
R is the rank of X, R≤min (Mxy, Nt), while D is the R×Rnon-negative diagonal matrix of singular values in decreasing order.If R=Nt, the approximation will be exact. V and D can be obtainedby computing XTX. V are the eigenvectors of XTX, and D2 are the eigen-values of XTX. U can be computed as:
U ¼ XVD−1: ð2Þ
The smaller the eigenvalue, the less energy along the correspondingeigenvector there will be. Therefore, a small eigenvalue often corre-sponds to noise signals. In this study, the largest 40–60 singular valuesin matrix D were selected to ensure that the components encoding
the random noise signals were excluded. After filtering the principalcomponents, the whitened matrix Xwhite with reduced dimension wasobtained:
Xwhite ¼ UVT: ð3Þ
ICA was applied to the whitened data Xwhite generated by PCA.Spatial ICA (sICA) was used to extract the signals to identify spatialcomponents that maximized the independence of the spatial patterns,together with their corresponding time courses. Some well-developedICA algorithms in the literature could be directly used [27,28]. Weemployed the FastICA algorithm, which is a fixed-point iteration algo-rithm by measuring the non-Gaussianity to seek the statistically inde-pendent sources from their mixtures [29]. The FastICA algorithm hasbeen widely used in previous studies to separate physiological signals[18,20].
After performing sICA, the spatial patterns between each pair ofcomponents are as statistically independent as possible. In practice,however, one single IC sometimes contains several spatially separatedcell regions, which have high correlation with each other. Therefore, amorphology-based segmentation algorithm was used to split each ICinto spatially separated sub-ICs to ensure that each sub-IC correspondsto a target cell region. The spatial patterns were first transformed to abinary matrix. Then, the binary image segmentation procedure wasimplemented using the function ‘bwlabel’ in Matlab to distinguish thespatially disconnected regions [30]. After this procedure, any IC that
534 D. Jing et al. / Bone 53 (2013) 531–540
contains multiple spatially separated cell regions can be split into thecorresponding sub-ICs. Then, a threshold value of the minimal cellarea (20 pixels in practice) was set to eliminate the ICs encoding thenoise signals or backgroundfluctuation. To identify the cell region occu-pied by multiple sub-ICs, the distance between the centroids of eachtwo sub-IC regions was computed, and a threshold of minimal distancevalue (10 pixels in practice) was set to select the overlapped sub-ICs.The sub-IC with maximal area value among the overlapped sub-ICswas selected as the target spatial component. All these procedures en-sured a one-to-one correspondence between each sub-IC and a cellregion.
After signal extraction, a peak selection algorithmwas developed todetect the peaks in each cellular signal. The signal was first normalizedusing the standardized z-score, and then the first derivative of curvewas smoothed using the triangular smooth method. The downwardzero-crossings in the smoothed first derivative were then detected.The points were selected as the peak points by setting the thresholdvalues for the amplitude of the selected zero-crossings as:
Stest−Smin
Smax−Smin> Pthreshold ð4Þ
where Stest is the value of the test point, Smin is the minimal value of thesignal, Smax is the maximal value of the signal, and Pthreshold is the thresh-old value. In this study, Pthreshold was set to 1/4 [15].
Validation for the signal extraction algorithm
Simulation movies were generated to mimic the typical cell shapesandCa2+ signal curves in bone cell networks. The signalswere artificiallycontaminated by generatingGaussian noisewith different variances. Thesignal-to-noise ratio ranged from 10 to 30 dB, which covers the normalrange of the experimental fluorescence images. The signal fidelity, de-fined as the Pearson's correlation coefficient between the true signaland extracted signal, was compared between the unsupervised ICAmethod and manual ROI method.
Analysis for the spatiotemporal characteristics of Ca2+ signaling
After signal extraction, information relating to spikes was automati-cally recorded, including the total responsive cell number, Ca2+ spikenumber in each cell, and time of spike occurrence in each cell. Acolor-code image with different color intensities corresponding tocells with different spike numbers was also generated automaticallyto facilitate describing the spatial distribution of Ca2+ signaling (Figs. 6A& B). The average Ca2+ spike number, occurrence time of the 1st spikeand time between the 1st and 2nd spikes were compared betweenMC3T3-E1 and MLO-Y4 cells in various magnitudes of shear stress(0.5, 1, 2 and 4 Pa) [15,31]. Since the present ICA-based Ca2+ signalingextraction algorithm is only sensitive to the cells which exhibited Ca2+
response, the total cell number in each slide was manually counted tocompare the responsive rate between MC3T3-E1 and MLO-Y4 cells.The spike ratewas then systematically analyzed to elucidate the tempo-ral distributions of spike activities of Ca2+ signals. In brief, a time bin(10 frames in practice) was set so that the time range was segmented
Table 1Number of cell networks (slides) and analyzed cells (responsive cells) in differentexperimental groups.
Shear stress (Pa) 0.5 1 2 4
MLO-Y4 Slides 3 5 4 5Responsive cells 397 625 446 509
MC3T3-E1 Slides 7 6 6 4Responsive cells 219 324 459 290
into several sub-ranges with equal length (20 sub-ranges in practice).All the spikes of cells were mapped into the corresponding sub-range,and the spike number was determined in each sub-range. The spikerate in each sub-range was calculated as:
Rspike ¼Nspike
Δ tð Þ⋅Ncellð5Þ
where Rspike is the spike rate, and Nspike is the total spike number in eachsub-range, Δ (t) is the bin size, and Ncell is the total cell number in eachsub-range.
The centroid of each cell was also automatically extracted in thesignal extraction program for the spike synchrony and signal correlationanalysis. All cells in the field of view from eachmovie were compared ina pair-wise manner. Since the center to center distance between neigh-boring round islands for cells to reside was 70 μm for osteoblastsand 50 μm for osteocytes, the cell pair was excluded for the spatialcorrelation analysis with intercellular distance lower than 60 μmfor osteoblasts and 40 μm for osteocytes, given that the possiblenon-coincidence between the cell centroid and the island center. Be-cause most cells' 1st spikes occurred almost synchronously when fluidflowwas applied, the spikes after the 1stmain peakwere analyzed to in-vestigate the synchronization of multiple responses of Ca2+ signaling inbone cell networks. From our previous study, the 1st spike was resultedfrom Ca2+ entry into the cell while the subsequent spikes resulted fromATP-related signal propagation. Spikes between two cells were definedas synchronous ones if the time offset between the spike pair was lessthan 5 frames (15 s). In this study, the sliding-window cross correlationanalysis (windowwidth: 60 s; step size: 60 s)was employed to evaluatethe signal correlation. This method can provide enhanced localizationanalysis in the temporal domain by splitting the signals with the slidingwindow, and thus quantitate the Ca2+ signal correlation more preciselycompared with the normal correlation analysis [32–34].We selected themaximum value over the lag range from−5 to 5 frames (−15 to 15 s)in each sub-range. The correlation value between two signals was calcu-lated by averaging the values over all the sub-ranges.
To compare the periodicities and frequency distribution characteris-tics of Ca2+ signaling between MC3T3-E1 and MLO-Y4 cells, the nor-malized Ca2+ signals were analyzed using fast Fourier transform(FFT)-based power spectrum density (PSD) processing routines inMatlab. All the frequency curves of cellular signals in each group wereaveraged to identify the difference in frequency distribution betweenMC3T3-E1 and MLO-Y4 cells.
Statistical analysis
The number of cell networks (slides) and analyzed cells (responsivecells) in different experimental groups are shown in Table 1. All datawere presented as themean±standard deviation (SD). Statistical analy-ses were performed using a SPSS version 10.0 for Microsoft Windows(SPSS, Chicago, IL, USA). At each fluid stimulation strength, differencesof each parameter (the number of Ca2+ peaks, time to the 1st peak,time between the 1st and 2nd peaks, synchronous cell pair number,and sliding-window correlation coefficient) between MC3T3-E1 andMLO-Y4 cells were examined using a Student t-test. To determine thecorrelation between a parameter and the stimulation strength, linear re-gression analysis was performed. Linear regression analysis was alsoused to evaluate the correlation of the spike synchrony and signal corre-lation with the cell–cell spatial separation distance. Pb0.05 was consid-ered statistically significant.
Results
The spatial patterns and temporal signals of the original simulatedmovies are shown in Fig. 3A (Left). Gaussian noise was artificiallyintroduced to the movies (SNR ranged from 10 to 30 dB). The
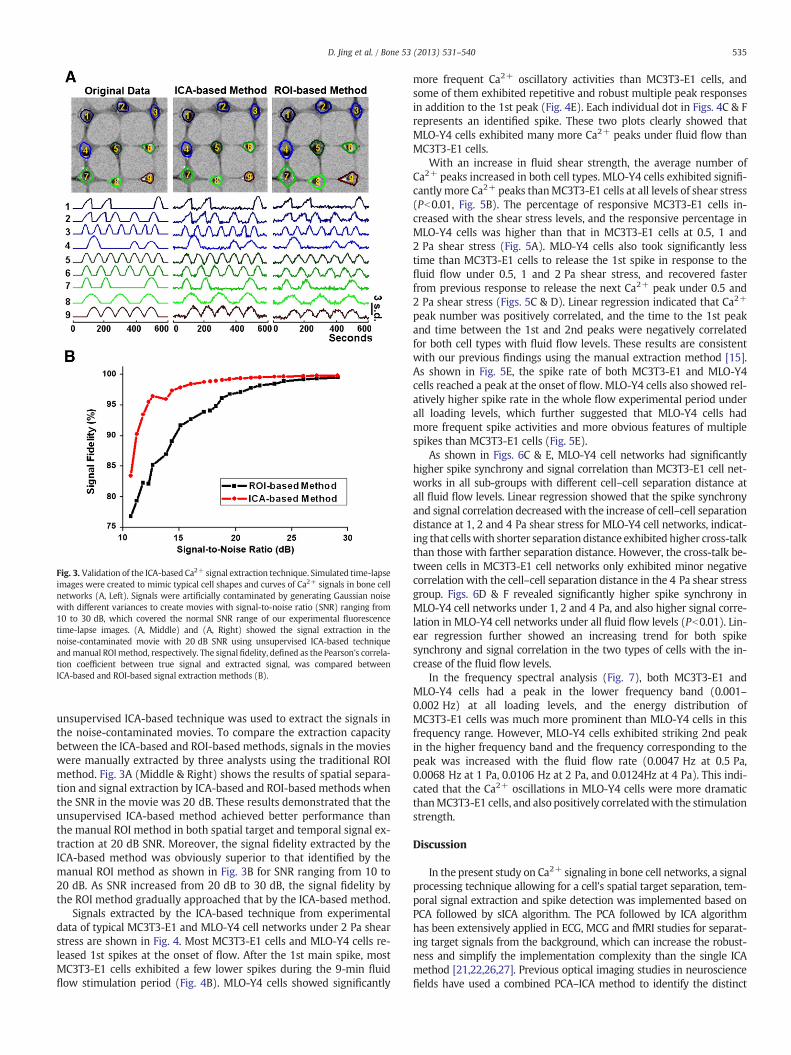
Fig. 3. Validation of the ICA-based Ca2+ signal extraction technique. Simulated time-lapseimages were created to mimic typical cell shapes and curves of Ca2+ signals in bone cellnetworks (A, Left). Signals were artificially contaminated by generating Gaussian noisewith different variances to create movies with signal-to-noise ratio (SNR) ranging from10 to 30 dB, which covered the normal SNR range of our experimental fluorescencetime-lapse images. (A, Middle) and (A, Right) showed the signal extraction in thenoise-contaminated movie with 20 dB SNR using unsupervised ICA-based techniqueandmanual ROImethod, respectively. The signal fidelity, defined as the Pearson's correla-tion coefficient between true signal and extracted signal, was compared betweenICA-based and ROI-based signal extraction methods (B).
535D. Jing et al. / Bone 53 (2013) 531–540
unsupervised ICA-based technique was used to extract the signals inthe noise-contaminated movies. To compare the extraction capacitybetween the ICA-based and ROI-based methods, signals in the movieswere manually extracted by three analysts using the traditional ROImethod. Fig. 3A (Middle & Right) shows the results of spatial separa-tion and signal extraction by ICA-based and ROI-basedmethods whenthe SNR in the movie was 20 dB. These results demonstrated that theunsupervised ICA-based method achieved better performance thanthe manual ROI method in both spatial target and temporal signal ex-traction at 20 dB SNR. Moreover, the signal fidelity extracted by theICA-based method was obviously superior to that identified by themanual ROI method as shown in Fig. 3B for SNR ranging from 10 to20 dB. As SNR increased from 20 dB to 30 dB, the signal fidelity bythe ROI method gradually approached that by the ICA-based method.
Signals extracted by the ICA-based technique from experimentaldata of typical MC3T3-E1 and MLO-Y4 cell networks under 2 Pa shearstress are shown in Fig. 4. Most MC3T3-E1 cells and MLO-Y4 cells re-leased 1st spikes at the onset of flow. After the 1st main spike, mostMC3T3-E1 cells exhibited a few lower spikes during the 9-min fluidflow stimulation period (Fig. 4B). MLO-Y4 cells showed significantly
more frequent Ca2+ oscillatory activities than MC3T3-E1 cells, andsome of them exhibited repetitive and robust multiple peak responsesin addition to the 1st peak (Fig. 4E). Each individual dot in Figs. 4C & Frepresents an identified spike. These two plots clearly showed thatMLO-Y4 cells exhibited many more Ca2+ peaks under fluid flow thanMC3T3-E1 cells.
With an increase in fluid shear strength, the average number ofCa2+ peaks increased in both cell types. MLO-Y4 cells exhibited signifi-cantly more Ca2+ peaks thanMC3T3-E1 cells at all levels of shear stress(Pb0.01, Fig. 5B). The percentage of responsive MC3T3-E1 cells in-creased with the shear stress levels, and the responsive percentage inMLO-Y4 cells was higher than that in MC3T3-E1 cells at 0.5, 1 and2 Pa shear stress (Fig. 5A). MLO-Y4 cells also took significantly lesstime than MC3T3-E1 cells to release the 1st spike in response to thefluid flow under 0.5, 1 and 2 Pa shear stress, and recovered fasterfrom previous response to release the next Ca2+ peak under 0.5 and2 Pa shear stress (Figs. 5C & D). Linear regression indicated that Ca2+
peak number was positively correlated, and the time to the 1st peakand time between the 1st and 2nd peaks were negatively correlatedfor both cell types with fluid flow levels. These results are consistentwith our previous findings using the manual extraction method [15].As shown in Fig. 5E, the spike rate of both MC3T3-E1 and MLO-Y4cells reached a peak at the onset of flow. MLO-Y4 cells also showed rel-atively higher spike rate in the whole flow experimental period underall loading levels, which further suggested that MLO-Y4 cells hadmore frequent spike activities and more obvious features of multiplespikes than MC3T3-E1 cells (Fig. 5E).
As shown in Figs. 6C & E, MLO-Y4 cell networks had significantlyhigher spike synchrony and signal correlation than MC3T3-E1 cell net-works in all sub-groups with different cell–cell separation distance atall fluid flow levels. Linear regression showed that the spike synchronyand signal correlation decreased with the increase of cell–cell separationdistance at 1, 2 and 4 Pa shear stress for MLO-Y4 cell networks, indicat-ing that cellswith shorter separation distance exhibited higher cross-talkthan those with farther separation distance. However, the cross-talk be-tween cells in MC3T3-E1 cell networks only exhibited minor negativecorrelation with the cell–cell separation distance in the 4 Pa shear stressgroup. Figs. 6D & F revealed significantly higher spike synchrony inMLO-Y4 cell networks under 1, 2 and 4 Pa, and also higher signal corre-lation in MLO-Y4 cell networks under all fluid flow levels (Pb0.01). Lin-ear regression further showed an increasing trend for both spikesynchrony and signal correlation in the two types of cells with the in-crease of the fluid flow levels.
In the frequency spectral analysis (Fig. 7), both MC3T3-E1 andMLO-Y4 cells had a peak in the lower frequency band (0.001–0.002 Hz) at all loading levels, and the energy distribution ofMC3T3-E1 cells was much more prominent than MLO-Y4 cells in thisfrequency range. However, MLO-Y4 cells exhibited striking 2nd peakin the higher frequency band and the frequency corresponding to thepeak was increased with the fluid flow rate (0.0047 Hz at 0.5 Pa,0.0068 Hz at 1 Pa, 0.0106 Hz at 2 Pa, and 0.0124Hz at 4 Pa). This indi-cated that the Ca2+ oscillations in MLO-Y4 cells were more dramaticthanMC3T3-E1 cells, and also positively correlatedwith the stimulationstrength.
Discussion
In the present study on Ca2+ signaling in bone cell networks, a signalprocessing technique allowing for a cell's spatial target separation, tem-poral signal extraction and spike detection was implemented based onPCA followed by sICA algorithm. The PCA followed by ICA algorithmhas been extensively applied in ECG, MCG and fMRI studies for separat-ing target signals from the background, which can increase the robust-ness and simplify the implementation complexity than the single ICAmethod [21,22,26,27]. Previous optical imaging studies in neurosciencefields have used a combined PCA–ICA method to identify the distinct
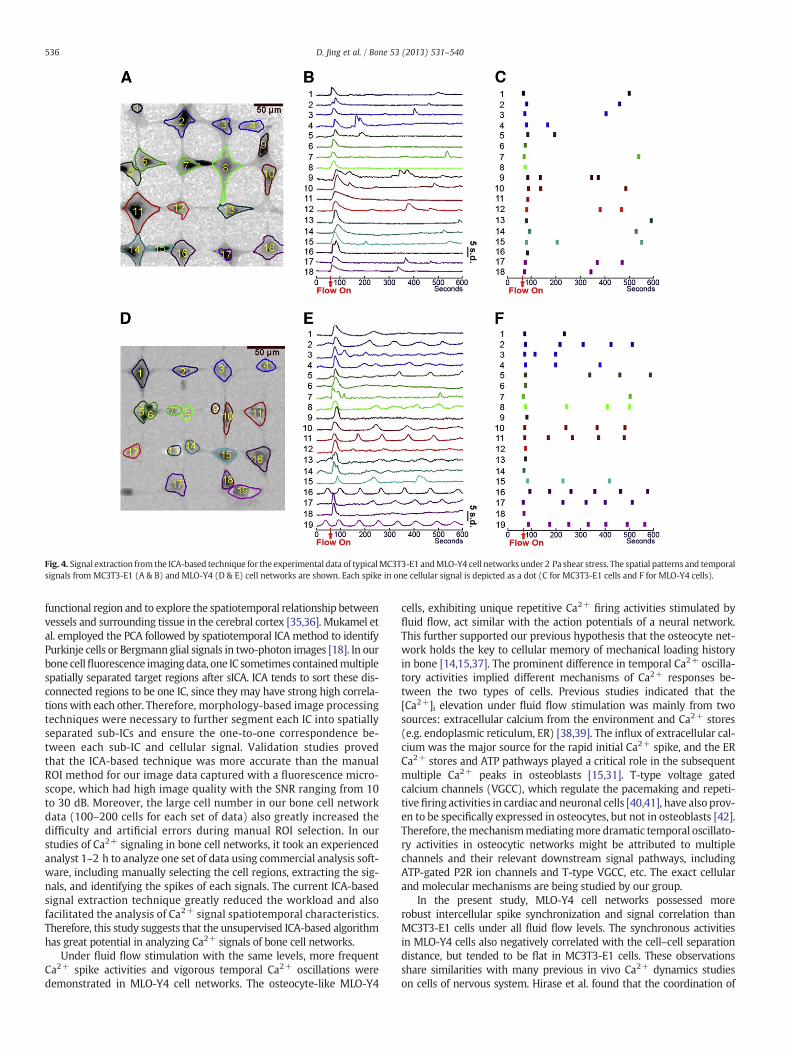
Fig. 4. Signal extraction from the ICA-based technique for the experimental data of typicalMC3T3-E1 andMLO-Y4 cell networks under 2 Pa shear stress. The spatial patterns and temporalsignals from MC3T3-E1 (A & B) and MLO-Y4 (D & E) cell networks are shown. Each spike in one cellular signal is depicted as a dot (C for MC3T3-E1 cells and F for MLO-Y4 cells).
536 D. Jing et al. / Bone 53 (2013) 531–540
functional region and to explore the spatiotemporal relationship betweenvessels and surrounding tissue in the cerebral cortex [35,36]. Mukamel etal. employed the PCA followed by spatiotemporal ICA method to identifyPurkinje cells or Bergmann glial signals in two-photon images [18]. In ourbone cellfluorescence imagingdata, one IC sometimes containedmultiplespatially separated target regions after sICA. ICA tends to sort these dis-connected regions to be one IC, since they may have strong high correla-tionswith each other. Therefore, morphology-based image processingtechniques were necessary to further segment each IC into spatiallyseparated sub-ICs and ensure the one-to-one correspondence be-tween each sub-IC and cellular signal. Validation studies provedthat the ICA-based technique was more accurate than the manualROI method for our image data captured with a fluorescence micro-scope, which had high image quality with the SNR ranging from 10to 30 dB. Moreover, the large cell number in our bone cell networkdata (100–200 cells for each set of data) also greatly increased thedifficulty and artificial errors during manual ROI selection. In ourstudies of Ca2+ signaling in bone cell networks, it took an experiencedanalyst 1–2 h to analyze one set of data using commercial analysis soft-ware, including manually selecting the cell regions, extracting the sig-nals, and identifying the spikes of each signals. The current ICA-basedsignal extraction technique greatly reduced the workload and alsofacilitated the analysis of Ca2+ signal spatiotemporal characteristics.Therefore, this study suggests that the unsupervised ICA-based algorithmhas great potential in analyzing Ca2+ signals of bone cell networks.
Under fluid flow stimulation with the same levels, more frequentCa2+ spike activities and vigorous temporal Ca2+ oscillations weredemonstrated in MLO-Y4 cell networks. The osteocyte-like MLO-Y4
cells, exhibiting unique repetitive Ca2+ firing activities stimulated byfluid flow, act similar with the action potentials of a neural network.This further supported our previous hypothesis that the osteocyte net-work holds the key to cellular memory of mechanical loading historyin bone [14,15,37]. The prominent difference in temporal Ca2+ oscilla-tory activities implied different mechanisms of Ca2+ responses be-tween the two types of cells. Previous studies indicated that the[Ca2+]i elevation under fluid flow stimulation was mainly from twosources: extracellular calcium from the environment and Ca2+ stores(e.g. endoplasmic reticulum, ER) [38,39]. The influx of extracellular cal-cium was the major source for the rapid initial Ca2+ spike, and the ERCa2+ stores and ATP pathways played a critical role in the subsequentmultiple Ca2+ peaks in osteoblasts [15,31]. T-type voltage gatedcalcium channels (VGCC), which regulate the pacemaking and repeti-tivefiring activities in cardiac and neuronal cells [40,41], have also prov-en to be specifically expressed in osteocytes, but not in osteoblasts [42].Therefore, themechanismmediatingmore dramatic temporal oscillato-ry activities in osteocytic networks might be attributed to multiplechannels and their relevant downstream signal pathways, includingATP-gated P2R ion channels and T-type VGCC, etc. The exact cellularand molecular mechanisms are being studied by our group.
In the present study, MLO-Y4 cell networks possessed morerobust intercellular spike synchronization and signal correlation thanMC3T3-E1 cells under all fluid flow levels. The synchronous activitiesin MLO-Y4 cells also negatively correlated with the cell–cell separationdistance, but tended to be flat in MC3T3-E1 cells. These observationsshare similarities with many previous in vivo Ca2+ dynamics studieson cells of nervous system. Hirase et al. found that the coordination of
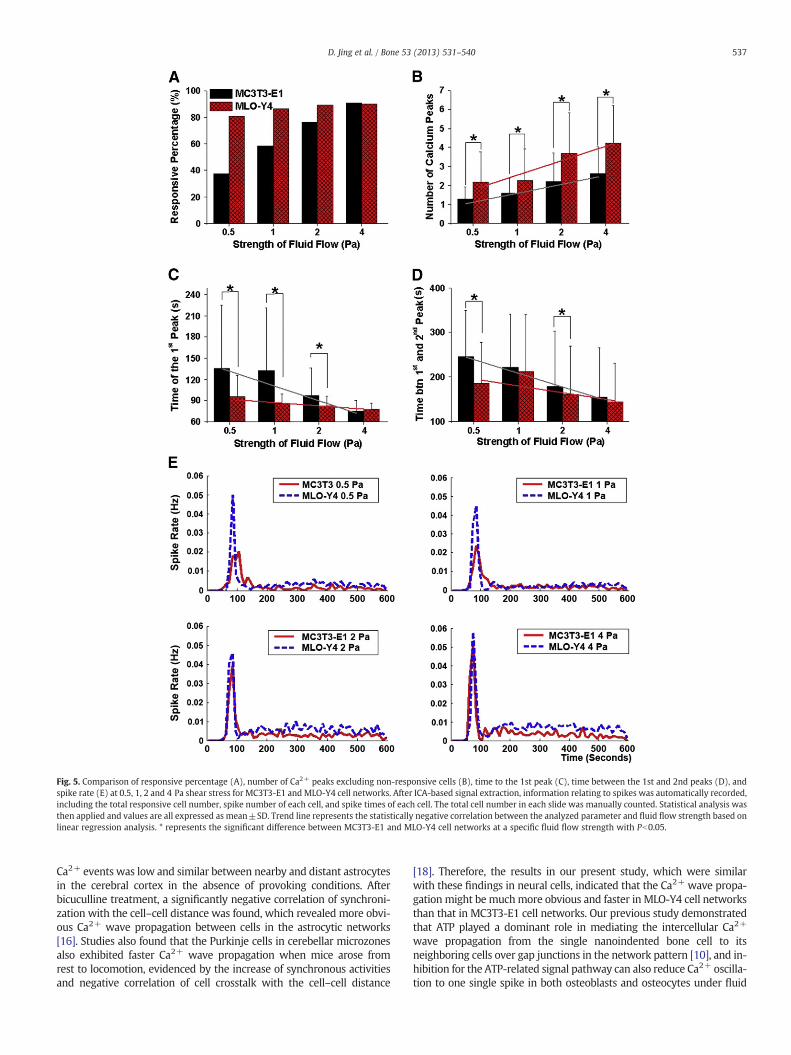
Fig. 5. Comparison of responsive percentage (A), number of Ca2+ peaks excluding non-responsive cells (B), time to the 1st peak (C), time between the 1st and 2nd peaks (D), andspike rate (E) at 0.5, 1, 2 and 4 Pa shear stress for MC3T3-E1 and MLO-Y4 cell networks. After ICA-based signal extraction, information relating to spikes was automatically recorded,including the total responsive cell number, spike number of each cell, and spike times of each cell. The total cell number in each slide was manually counted. Statistical analysis wasthen applied and values are all expressed as mean±SD. Trend line represents the statistically negative correlation between the analyzed parameter and fluid flow strength based onlinear regression analysis. * represents the significant difference between MC3T3-E1 and MLO-Y4 cell networks at a specific fluid flow strength with Pb0.05.
537D. Jing et al. / Bone 53 (2013) 531–540
Ca2+ events was low and similar between nearby and distant astrocytesin the cerebral cortex in the absence of provoking conditions. Afterbicuculline treatment, a significantly negative correlation of synchroni-zation with the cell–cell distance was found, which revealed more obvi-ous Ca2+ wave propagation between cells in the astrocytic networks[16]. Studies also found that the Purkinje cells in cerebellar microzonesalso exhibited faster Ca2+ wave propagation when mice arose fromrest to locomotion, evidenced by the increase of synchronous activitiesand negative correlation of cell crosstalk with the cell–cell distance
[18]. Therefore, the results in our present study, which were similarwith these findings in neural cells, indicated that the Ca2+ wave propa-gation might be muchmore obvious and faster in MLO-Y4 cell networksthan that in MC3T3-E1 cell networks. Our previous study demonstratedthat ATP played a dominant role in mediating the intercellular Ca2+
wave propagation from the single nanoindented bone cell to itsneighboring cells over gap junctions in the network pattern [10], and in-hibition for the ATP-related signal pathway can also reduce Ca2+ oscilla-tion to one single spike in both osteoblasts and osteocytes under fluid
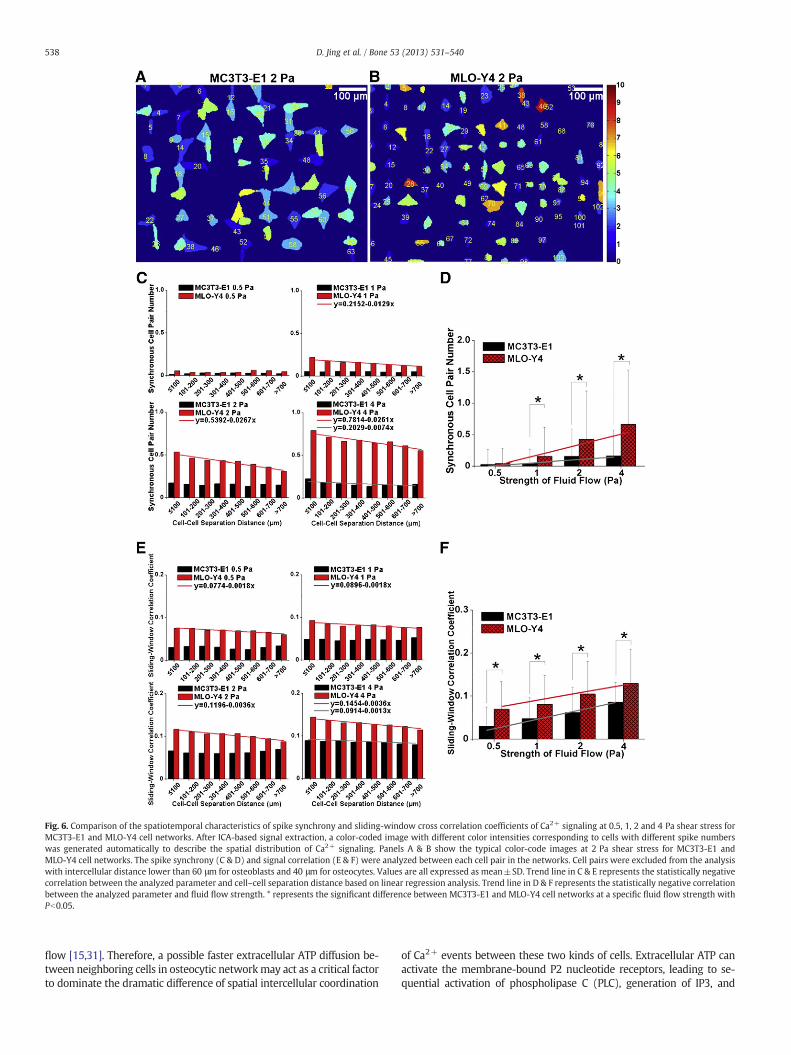
Fig. 6. Comparison of the spatiotemporal characteristics of spike synchrony and sliding-window cross correlation coefficients of Ca2+ signaling at 0.5, 1, 2 and 4 Pa shear stress forMC3T3-E1 and MLO-Y4 cell networks. After ICA-based signal extraction, a color-coded image with different color intensities corresponding to cells with different spike numberswas generated automatically to describe the spatial distribution of Ca2+ signaling. Panels A & B show the typical color-code images at 2 Pa shear stress for MC3T3-E1 andMLO-Y4 cell networks. The spike synchrony (C & D) and signal correlation (E & F) were analyzed between each cell pair in the networks. Cell pairs were excluded from the analysiswith intercellular distance lower than 60 μm for osteoblasts and 40 μm for osteocytes. Values are all expressed as mean±SD. Trend line in C & E represents the statistically negativecorrelation between the analyzed parameter and cell–cell separation distance based on linear regression analysis. Trend line in D & F represents the statistically negative correlationbetween the analyzed parameter and fluid flow strength. * represents the significant difference between MC3T3-E1 and MLO-Y4 cell networks at a specific fluid flow strength withPb0.05.
538 D. Jing et al. / Bone 53 (2013) 531–540
flow [15,31]. Therefore, a possible faster extracellular ATP diffusion be-tween neighboring cells in osteocytic networkmay act as a critical factorto dominate the dramatic difference of spatial intercellular coordination
of Ca2+ events between these two kinds of cells. Extracellular ATP canactivate the membrane-bound P2 nucleotide receptors, leading to se-quential activation of phospholipase C (PLC), generation of IP3, and
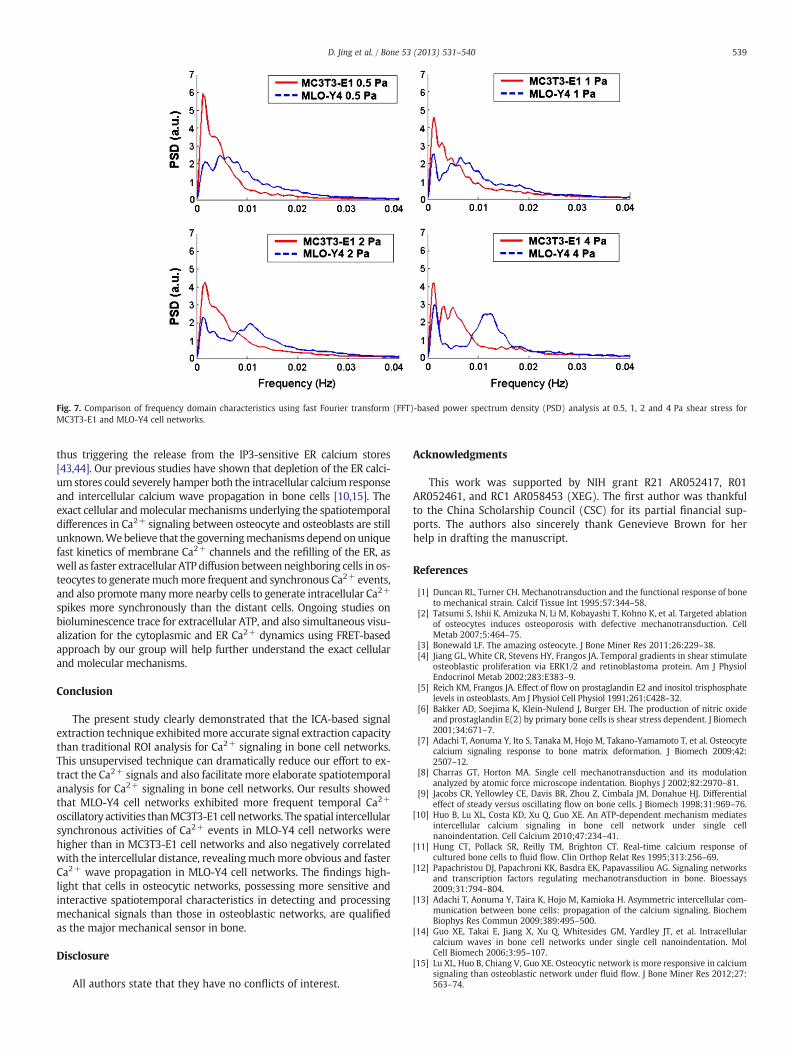
Fig. 7. Comparison of frequency domain characteristics using fast Fourier transform (FFT)-based power spectrum density (PSD) analysis at 0.5, 1, 2 and 4 Pa shear stress forMC3T3-E1 and MLO-Y4 cell networks.
539D. Jing et al. / Bone 53 (2013) 531–540
thus triggering the release from the IP3-sensitive ER calcium stores[43,44]. Our previous studies have shown that depletion of the ER calci-um stores could severely hamper both the intracellular calcium responseand intercellular calcium wave propagation in bone cells [10,15]. Theexact cellular andmolecular mechanisms underlying the spatiotemporaldifferences in Ca2+ signaling between osteocyte and osteoblasts are stillunknown.Webelieve that the governingmechanisms depend on uniquefast kinetics of membrane Ca2+ channels and the refilling of the ER, aswell as faster extracellular ATP diffusion between neighboring cells in os-teocytes to generatemuchmore frequent and synchronous Ca2+ events,and also promotemanymore nearby cells to generate intracellular Ca2+
spikes more synchronously than the distant cells. Ongoing studies onbioluminescence trace for extracellular ATP, and also simultaneous visu-alization for the cytoplasmic and ER Ca2+ dynamics using FRET-basedapproach by our group will help further understand the exact cellularand molecular mechanisms.
Conclusion
The present study clearly demonstrated that the ICA-based signalextraction technique exhibitedmore accurate signal extraction capacitythan traditional ROI analysis for Ca2+ signaling in bone cell networks.This unsupervised technique can dramatically reduce our effort to ex-tract the Ca2+ signals and also facilitate more elaborate spatiotemporalanalysis for Ca2+ signaling in bone cell networks. Our results showedthat MLO-Y4 cell networks exhibited more frequent temporal Ca2+
oscillatory activities thanMC3T3-E1 cell networks. The spatial intercellularsynchronous activities of Ca2+ events in MLO-Y4 cell networks werehigher than in MC3T3-E1 cell networks and also negatively correlatedwith the intercellular distance, revealingmuchmore obvious and fasterCa2+ wave propagation in MLO-Y4 cell networks. The findings high-light that cells in osteocytic networks, possessing more sensitive andinteractive spatiotemporal characteristics in detecting and processingmechanical signals than those in osteoblastic networks, are qualifiedas the major mechanical sensor in bone.
Disclosure
All authors state that they have no conflicts of interest.
Acknowledgments
This work was supported by NIH grant R21 AR052417, R01AR052461, and RC1 AR058453 (XEG). The first author was thankfulto the China Scholarship Council (CSC) for its partial financial sup-ports. The authors also sincerely thank Genevieve Brown for herhelp in drafting the manuscript.
References
[1] Duncan RL, Turner CH. Mechanotransduction and the functional response of boneto mechanical strain. Calcif Tissue Int 1995;57:344–58.
[2] Tatsumi S, Ishii K, Amizuka N, Li M, Kobayashi T, Kohno K, et al. Targeted ablationof osteocytes induces osteoporosis with defective mechanotransduction. CellMetab 2007;5:464–75.
[3] Bonewald LF. The amazing osteocyte. J Bone Miner Res 2011;26:229–38.[4] Jiang GL, White CR, Stevens HY, Frangos JA. Temporal gradients in shear stimulate
osteoblastic proliferation via ERK1/2 and retinoblastoma protein. Am J PhysiolEndocrinol Metab 2002;283:E383–9.
[5] Reich KM, Frangos JA. Effect of flow on prostaglandin E2 and inositol trisphosphatelevels in osteoblasts. Am J Physiol Cell Physiol 1991;261:C428–32.
[6] Bakker AD, Soejima K, Klein-Nulend J, Burger EH. The production of nitric oxideand prostaglandin E(2) by primary bone cells is shear stress dependent. J Biomech2001;34:671–7.
[7] Adachi T, Aonuma Y, Ito S, Tanaka M, Hojo M, Takano-Yamamoto T, et al. Osteocytecalcium signaling response to bone matrix deformation. J Biomech 2009;42:2507–12.
[8] Charras GT, Horton MA. Single cell mechanotransduction and its modulationanalyzed by atomic force microscope indentation. Biophys J 2002;82:2970–81.
[9] Jacobs CR, Yellowley CE, Davis BR, Zhou Z, Cimbala JM, Donahue HJ. Differentialeffect of steady versus oscillating flow on bone cells. J Biomech 1998;31:969–76.
[10] Huo B, Lu XL, Costa KD, Xu Q, Guo XE. An ATP-dependent mechanism mediatesintercellular calcium signaling in bone cell network under single cellnanoindentation. Cell Calcium 2010;47:234–41.
[11] Hung CT, Pollack SR, Reilly TM, Brighton CT. Real-time calcium response ofcultured bone cells to fluid flow. Clin Orthop Relat Res 1995;313:256–69.
[12] Papachristou DJ, Papachroni KK, Basdra EK, Papavassiliou AG. Signaling networksand transcription factors regulating mechanotransduction in bone. Bioessays2009;31:794–804.
[13] Adachi T, Aonuma Y, Taira K, Hojo M, Kamioka H. Asymmetric intercellular com-munication between bone cells: propagation of the calcium signaling. BiochemBiophys Res Commun 2009;389:495–500.
[14] Guo XE, Takai E, Jiang X, Xu Q, Whitesides GM, Yardley JT, et al. Intracellularcalcium waves in bone cell networks under single cell nanoindentation. MolCell Biomech 2006;3:95–107.
[15] Lu XL, Huo B, Chiang V, Guo XE. Osteocytic network is more responsive in calciumsignaling than osteoblastic network under fluid flow. J Bone Miner Res 2012;27:563–74.
540 D. Jing et al. / Bone 53 (2013) 531–540
[16] Hirase H, Qian L, Barthó P, Buzsáki G. Calcium dynamics of cortical astrocyticnetworks in vivo. PLoS Biol 2004;2:E96.
[17] Agulhon C, Platel JC, Kolomiets B, Forster V, Picaud S, Brocard J, et al. Bioluminescentimaging of Ca2+ activity reveals spatiotemporal dynamics in glial networks ofdark-adapted mouse retina. J Physiol 2007;583:945–58.
[18] Mukamel EA, Nimmerjahn A, Schnitzer MJ. Automated analysis of cellular signalsfrom large-scale calcium imaging data. Neuron 2009;63:747–60.
[19] Jung TP, Makeig S, Lee TW, McKeown MJ, Brown G, Bell AJ, et al. Independentcomponent analysis of biomedical signals. 2nd International Workshop on Inde-pendent Component Analysis and Signal Separation, Helsinki; 2000. p. 633–44.
[20] Vigário R, Särelä J, Jousmäki V, HämäläinenM,Oja E. Independent component approachto the analysis of EEG and MEG recordings. IEEE Trans Biomed Eng 2000;47:589–93.
[21] Zarzoso V, Nandi AK, Bacharakis E. Maternal and foetal ECG separation using blindsource separation methods. IMA J Math Appl Med Biol 1997;14:207–25.
[22] DiPietroPaolo D,Müller HP, Nolte G, Erné SN. Noise reduction inmagnetocardiographyby singular value decomposition and independent component analysis. Med Biol EngComput 2006;44:489–99.
[23] McKeown MJ, Makeig S, Brown GG, Jung TP, Kindermann SS, Bell AJ, et al. Analysisof fMRI data by blind separation into independent spatial components. Hum BrainMapp 1998;6:160–88.
[24] Kato Y, Windle JJ, Koop BA, Mundy GR, Bonewald LF. Establishment of anosteocyte-like cell line, MLO-Y4. J Bone Miner Res 1997;12:2014–23.
[25] Bai P, Shen HP, Huang XM, Truong Y. A supervised singular value decompositionfor independent component analysis of fMRI. Stat Sin 2008;18:1233–52.
[26] Stone JV, Porrill J, Porter NR, Wilkinson ID. Spatiotemporal independentcomponent analysis of event-related fMRI data using skewed probability densityfunctions. Neuroimage 2002;15:407–21.
[27] Hyvarinen A, Oja E. Independent component analysis: algorithms and applica-tions. Neural Netw 2000;13:411–30.
[28] Roberts S, Everson R. Independent component analysis: principles and practice.Cambridge: Cambridge University Press; 2001.
[29] Hyvarinen A. Fast and robust fixed-point algorithms for independent componentanalysis. IEEE Trans Neural Netw 1999;10:626–34.
[30] Boland MV, Murphy RF. A neural network classifier capable of recognizing thepatterns of all major subcellular structures in fluorescence microscope imagesof HeLa cells. Bioinformatics 2001;17:1213–23.
[31] Huo B, Lu XL, Hung CT, Costa KD, Xu Q, Whitesides GM, et al. Fluid flow inducedcalcium response in bone cell network. Cell Mol Bioeng 2008;1:58–66.
[32] Laurent G, Wehr M, Davidowitz H. Temporal representations of odors in anolfactory network. J Neurosci 1996;16:3837–47.
[33] Castelo-Branco M, Neuenschwander S, Singer W. Synchronization of visual re-sponses between the cortex, lateral geniculate nucleus, and retina in the anesthe-tized cat. J Neurosci 1998;18:6395–410.
[34] Beierlein M, Gibson JR, Connors BW. A network of electrically coupled inter-neurons drives synchronized inhibition in neocortex. Nat Neurosci 2000;3:904–10.
[35] Reidl J, Starke J, Omer DB, Grinvald A, Spors H. Independent component analysis ofhigh-resolution imaging data identifies distinct functional domains. Neuroimage2007;34:94–108.
[36] Siegel RM, Duann JR, Jung TP, Sejnowski T. Spatiotemporal dynamics of the func-tional architecture for gain fields in inferior parietal lobule of behaving monkey.Cereb Cortex 2007;17:378–90.
[37] Turner CH, Robling AG, Duncan RL, Burr DB. Do bone cells behave like a neuronalnetwork? Calcif Tissue Int 2002;70:435–42.
[38] Hung CT, Allen FD, Pollack SR, Brighton CT. Intracellular Ca2+ stores and extracel-lular Ca2+ are required in the real-time Ca2+ response of bone cells experiencingfluid flow. J Biomech 1996;29:1411–7.
[39] Chen NX, Ryder KD, Pavalko FM, Turner CH, Burr DB, Qiu J, et al. Ca2+ regulatesfluid shear-induced cytoskeletal reorganization and gene expression in osteoblasts.Am J Physiol Cell Physiol 2000;278:C989–97.
[40] Talavera K, Nilius B. Biophysics and structure-function relationship of Ttype Ca2+
channels. Cell Calcium 2006;40:97–114.[41] Nilius B, Talavera K, Verkhratsky A. T-type calcium channels: the never ending
story. Cell Calcium 2006;40:81–8.[42] Thompson WR, Majid AS, Czymmek KJ, Ruff AL, García J, Duncan RL, et al. Associ-
ation of the α(2)δ(1) subunit with Ca(v)3.2 enhances membrane expression andregulates mechanically induced ATP release in MLO-Y4 osteocytes. J Bone MinerRes 2011;26:2125–39.
[43] Berridge MJ, Lipp P, Bootman MD. The versatility and universality of calcium sig-nalling. Nat Rev Mol Cell Biol 2000;1:11–21.
[44] Iqbal J, Zaidi M. Molecular regulation of mechanotransduction. Biochem BiophysRes Commun 2005;328:751–5.


![Calcium Homeostasis in Articular Chondrocytes of Two ... · Introduction: Intracellular calcium concentration ([Ca2+] i) is a critical para-meter in cellular homeostasis, including](https://static.fdocuments.net/doc/165x107/5f05a9497e708231d414126a/calcium-homeostasis-in-articular-chondrocytes-of-two-introduction-intracellular.jpg)