Tony L Smith DNP MSN RN ACNP Vanderbilt LifeFlight Flight Nurse/Clinical Educator
OCTOBER18,2017FINALIDFPR/ILLINOISCENTERFORNURSINGRNSURVEYREPORT
1
Registered Nurse
Workforce Survey 2016

OCTOBER18,2017FINALIDFPR/ILLINOISCENTERFORNURSINGRNSURVEYREPORT
2
Acknowledgements
The Illinois Center for Nursing (ICN) would like to express our gratitude to the individuals and
organizations that have made this report possible. We would especially like to thank:
The Governor of Illinois, Bruce Rauner; the Secretary of the Illinois Department of Financial
and Professional Regulation (IDFPR), Bryan A. Schneider; and the Director of Professional
Regulations, Jessica Baer, for their support and interest in the study of nursing workforce.
The Illinois Center for Nursing Advisory Board:
Maureen Shekleton, PhD, RN, FAAN, Chairperson
Julie Bracken, MS, RN, CEN
Kathleen Delaney PhD, PMH‐NP
Donna L. Hartweg, PhD, RN
Corinne Haviley, RN, MSN, PhD
Carmen C. Hovanec, MSN, RN, Vice‐Chairperson
Janet Krejci, PhD, RN (through December 2016)
Mary Lebold, EdD, RN
Donna Meyer, RN, MSN
Marsha A. Prater, PhD, RN
Deborah A. Terrell, PhD, FNP‐BC, RN
Completed in 2016, under the leadership of the Illinois Center for Nursing’s Advisory Board of
Directors, this survey was the second Illinois Registered Nurse (RN) workforce study offered with
individual on‐line licensure renewal. The acquisition of data was accomplished through the
collaboration of the following IDFPR sections: Licensing, the Division of Nursing, the Illinois Center for
Nursing and the State of Illinois Department of Innovation and Technology.
We owe a special thanks to: the ICN Data Workgroup: Kathleen R. Delaney, PhD, PMH‐NP –
Chairperson; Julie Bracken, MSN, RN; and Corinne Haviley, RN, MS, PhD, who provided many hours in
the production of this report; Linda D. Taylor, PhD, RN, CNE, Director of Undergraduate Studies,
Northern Illinois University School of Nursing for statistical analysis underlying this critical work;
Michele Bromberg, MSN, APN, IDFPR Nursing Coordinator; and Linda B. Roberts, MSN, RN, ICN
Manager.
Special thanks to the nurses licensed in Illinois who responded to the survey. The feedback
provided will make a significant contribution to planning health services in Illinois, specifically those
focused on the nursing workforce.

OCTOBER18,2017FINALIDFPR/ILLINOISCENTERFORNURSINGRNSURVEYREPORT
3
Executive Summary
Illinois Center for Nursing Registered Nurse Workforce Survey 2016
The purpose of this report is to detail the results from the 2016 Illinois Registered Nurse (RN)
workforce survey. The survey was structured to capture data on the demographics, education, state
distribution, and practice foci of RNs in Illinois. The survey was conducted during the 2016 Illinois RN
licensure renewal period, from 3/14/16 to 5/31/16. In Illinois, over 90% of individual RNs completed
licensure renewal via an on‐line platform. When individuals concluded the renewal process, there was
a link to the survey along with an explanation of its purpose. The voluntary survey was completed by
41,194 RNs, representing 23.3% of the total RN population in Illinois.
General overview: Data on the characteristics, supply and distribution of RNs in the State of
Illinois is essential to expanding access to care and planning for provision of essential primary and
other health care services. This report contains data on the demographics of the current RN workforce,
the relative numbers of RNs in each age group, their cultural diversity, and educational preparation.
Based on these findings, issues and concerns for the nursing workforce into the near future are identified.
Aging workforce: The report presents important information about the aging of the RN
workforce. In 2016, 50.18% respondents are over the age of 55 years, which is approximately an 8%
increase in this cohort of Illinois RNs since 2014. The relatively rapid increase in RNs in older age
categories has significant implications for workforce planning. In addition, one third of the
respondents indicated intent to retire within the next five years. This combination of aging workforce
and retirement plans predict the potential of an impending nursing shortage within the next five years.
Education post‐licensure: Responses to questions regarding registered nurses’ intent to seek
higher degrees revealed two major barriers. Respondents who are not pursuing a degree post‐
licensure indicated that the greatest barrier was cost, specifically cost of tuition, followed by family
obligations. In the 2014 survey, 40% respondents said cost of tuition was the greatest barrier; in 2016
that number rose to 52%. As schools move to requiring the Doctorate of Nursing Practice (DNP)

OCTOBER18,2017FINALIDFPR/ILLINOISCENTERFORNURSINGRNSURVEYREPORT
4
degree as a minimum credential for advanced practice nursing education, the increased cost of these
degrees should be considered.
Decreased diversity: In contrast to the increase in cultural and racial diversity in the state of
Illinois, data indicated a decrease in the cultural diversity of the RN workforce in the younger cohorts
in several groups For instance, 4% of Black/African American respondents reported being younger
than 35 years, compared to the 29% in those over 65 years. In contrast, those identifying as
Hispanic/Latino, 15% are younger than age 36 years, while only 6% are over age 55 years. White
females with initial licensure in the U.S. constitute a substantial majority (approximately 80%);
however, indications of changing demographics are observable across age categories.
Specialty foci: The respondents reported employment in these top five nursing specialties:
acute care, critical care, emergency, surgical, and geriatrics. The data also demonstrated the
distribution of nurses in specialties by age cohorts, revealing significantly fewer younger nurses in
specialties such as psychiatric mental‐health, school, home health, gerontology, and community
health nursing. These trends stand in contrast to the Illinois report, The Workforce Implications of New
Health Care Models, which forecasts a significant increase in ambulatory services, as well as a
concomitant need for RNs to practice in community based models of care.
Summary: Collectively, the 2016 Illinois Registered Nurse (RN) workforce survey is a useful
resource as health care planners project the human health care capital that will be needed in Illinois.
The information will allow ICN to address questions such as, what is the current RN supply and will it
be adequate to meet the health care needs of Illinois citizens? Health care workforce planners can
help determine and guide educational preparation as to what types of RN (e.g. specialty) will be in
greatest demand, as well as the types of specialties and skills required of future models of care.

OCTOBER18,2017FINALIDFPR/ILLINOISCENTERFORNURSINGRNSURVEYREPORT
5
Table of Contents
1. About the Data …………………………………………………………………………..……….….. Page 5
2. Demographics ………………………..………………………………………………………………. Page 6
3. Human Capital …………………………………………………………………………………...…… Page 10
4. Geography …………..………………………………………………………………………………..… Page 17
5. Earnings ………………………………..…………………………………………………………………. Page 21
6. Discussion…………………………………………………………………………………………………. Page 22
7. Appendix A ……………….……………………………………………………………………………... Page 27
About the Data
The primary source of data for this report was from a voluntary survey offered to individual
Registered Nurses completing an on‐line licensure renewal conducted from 3/14/16 to 5/31/16. Of
the 176,974 Registered Nurses in Illinois, 41,194 completed the survey, representing 23.3% of those
who hold an RN‐only license. Advanced practice nurses (APNs), who are also licensed as Registered
Nurses, were not included in the survey data.
Illinois Center for Nursing Registered Professional Nurse (RN) Workforce Survey 2016
The survey included 28 questions consistent with the national minimum dataset requirements
of the National Forum of State Nursing Workforce Centers. A comprehensive record of questions is
provided in Appendix A. Information obtained from the survey can be categorized into four areas: 1)
demographic information such as age, diversity (ethnicity, gender), and retirement horizon; 2) human
capital elements of education and area of employment specialty; 3) job characteristics of work setting,
earnings, and other details; and 4) select geographic information derived from employer zip codes
reported by participants.
General Overview
Data on the characteristics, supply and distribution of RNs in the State of Illinois is
essential to expanding access to care and planning for provision of essential primary and other health
care services. This report contains data on the demographics of our current RN workforce, the relative
numbers of RNs in each age group, their cultural diversity, and educational preparation.
OCTOBER18,2017FINALIDFPR/ILLINOISCENTERFORNURSINGRNSURVEYREPORT
6
Demographics
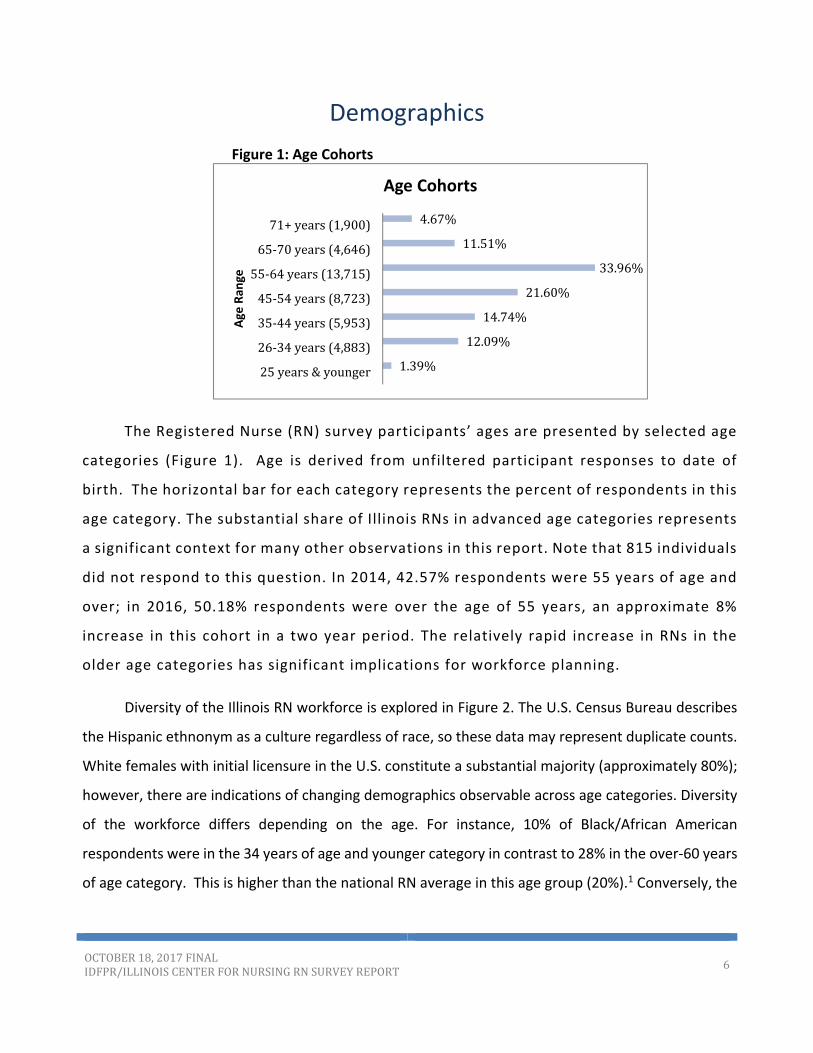
Figure 1: Age Cohorts
The Registered Nurse (RN) survey participants’ ages are presented by selected age
categories (Figure 1). Age is derived from unfiltered participant responses to date of
birth. The horizontal bar for each category represents the percent of respondents in this
age category. The substantial share of Illinois RNs in advanced age categories represents
a significant context for many other observations in this report. Note that 815 individuals
did not respond to this question. In 2014, 42.57% respondents were 55 years of age and
over; in 2016, 50.18% respondents were over the age of 55 years, an approximate 8%
increase in this cohort in a two year period. The relatively rapid increase in RNs in the
older age categories has significant implications for workforce planning.
Diversity of the Illinois RN workforce is explored in Figure 2. The U.S. Census Bureau describes
the Hispanic ethnonym as a culture regardless of race, so these data may represent duplicate counts.
White females with initial licensure in the U.S. constitute a substantial majority (approximately 80%);
however, there are indications of changing demographics observable across age categories. Diversity
of the workforce differs depending on the age. For instance, 10% of Black/African American
respondents were in the 34 years of age and younger category in contrast to 28% in the over‐60 years
of age category. This is higher than the national RN average in this age group (20%).1 Conversely, the
1.39%
12.09%
14.74%
21.60%
33.96%
11.51%
4.67%
25years&younger
26‐34years(4,883)
35‐44years(5,953)
45‐54years(8,723)
55‐64years(13,715)
65‐70years(4,646)
71+years(1,900)Age
Ran
ge
Age Cohorts

OCTOBER18,2017FINALIDFPR/ILLINOISCENTERFORNURSINGRNSURVEYREPORT
7
Hispanic/Latino diversity is greater in the 35 years of age and younger cohort (32%) compared to 23%
in the age 55 years and older cohort.
Figure 2: Diversity: Race/Ethnicity, by Age
Figure 2 Note. Respondents were asked to mark all that applied for Race/Ethnicity. If multiple options were selected, respondents were coded to be mutually exclusive. Hispanic is a culture regardless of race so respondent options for Hispanic were not included in the Multiracial category and therefore represent duplicate counts.
Age <30 30‐34 35‐39 40‐44 45‐49 50‐54 55‐59 60‐65 >65 Total
American Indianor
Alaska Native4 3 5 10 8 10 17 15 9 81
Percent 5% 4% 6% 12% 10% 12% 21% 19% 11%
Asian 298 278 238 512 612 295 379 520 223 3355
Percent 9% 8% 7% 15% 18% 9% 11% 15% 7%
Black/African
American133 183 281 340 409 425 471 549 350 3141
Percent 4% 6% 9% 11% 13% 14% 15% 17% 11%
Native Hawaiian
or Other Pacific
Islander
13 15 17 18 25 16 12 15 11 142
Percent 9% 11% 12% 13% 18% 11% 8% 11% 8%
White/Caucasian 2475 2149 2009 2387 2848 4046 5679 6573 3709 31875
Percent 8% 7% 6% 7% 9% 13% 18% 21% 12%
Hispanic/Latino 303 232 214 199 182 155 187 143 51 1666
Percent 18% 14% 13% 12% 11% 9% 11% 9% 3%
Other 74 45 63 61 52 53 84 65 38 535
Percent 13.83% 8.41% 11.78% 11.40% 9.72% 9.91% 15.70% 12.15% 7.10%
Mulitracial 64 55 50 41 65 60 65 91 44 535
Percent 12% 10% 9% 8% 12% 11% 12% 17% 8%
Race/Ethnicity, by Age
OCTOBER18,2017FINALIDFPR/ILLINOISCENTERFORNURSINGRNSURVEYREPORT
8
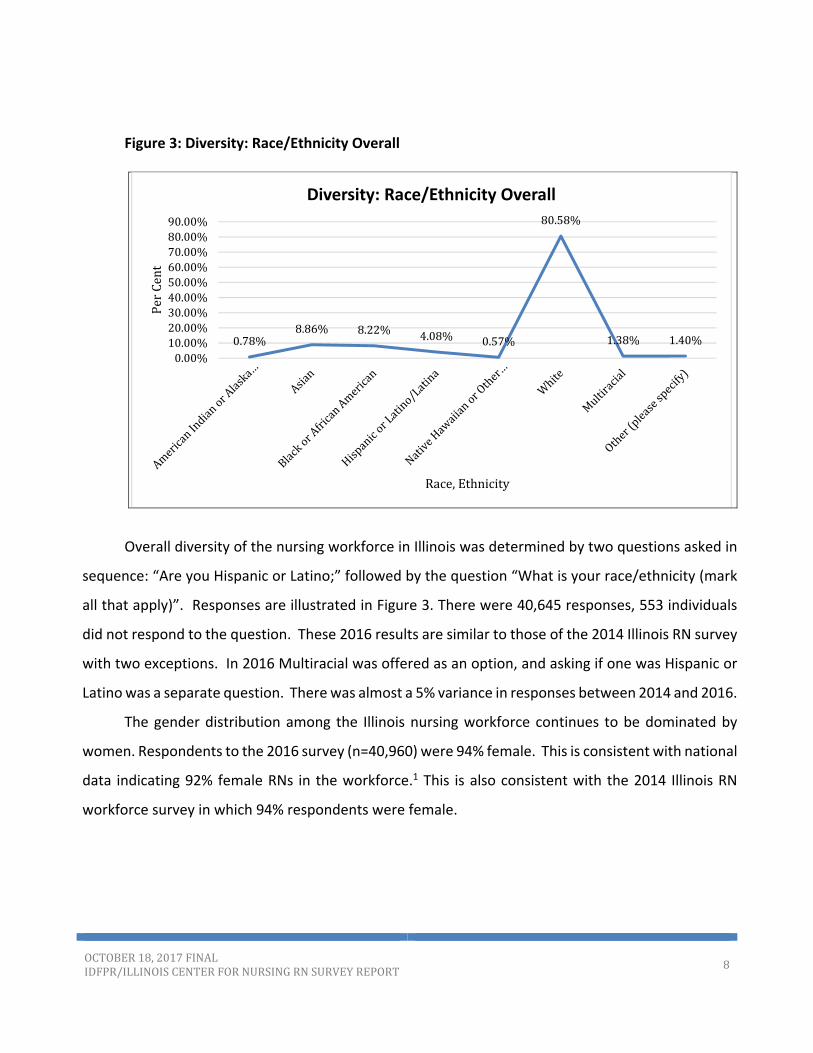
Figure 3: Diversity: Race/Ethnicity Overall
Overall diversity of the nursing workforce in Illinois was determined by two questions asked in
sequence: “Are you Hispanic or Latino;” followed by the question “What is your race/ethnicity (mark
all that apply)”. Responses are illustrated in Figure 3. There were 40,645 responses, 553 individuals
did not respond to the question. These 2016 results are similar to those of the 2014 Illinois RN survey
with two exceptions. In 2016 Multiracial was offered as an option, and asking if one was Hispanic or
Latino was a separate question. There was almost a 5% variance in responses between 2014 and 2016.
The gender distribution among the Illinois nursing workforce continues to be dominated by
women. Respondents to the 2016 survey (n=40,960) were 94% female. This is consistent with national
data indicating 92% female RNs in the workforce.1 This is also consistent with the 2014 Illinois RN
workforce survey in which 94% respondents were female.
0.78%8.86% 8.22% 4.08% 0.57%
80.58%
1.38% 1.40%
0.00%10.00%20.00%30.00%40.00%50.00%60.00%70.00%80.00%90.00%
PerCent
Race,Ethnicity
Diversity: Race/Ethnicity Overall

OCTOBER18,2017FINALIDFPR/ILLINOISCENTERFORNURSINGRNSURVEYREPORT
9
Figure 4: Retirement The retirement plans of respondentswere
assessed by a pair of questions in the survey. The
distribution across selected categories of years to
retirement is presented in Figure 4 (left). On this
question, there was a substantial number (4,754) of
non‐responses and 14% (5,213) indicating
uncertainty with regards to retirement plans.
Therefore, the following is based on responses of
only 76% of the actual participants and must be a consideration when interpreting the data. What is
unknown is the number of the respondents who have already retired but continue their license. The
largest group of respondents is composed of RNs within five years of exit. More than 44% of those
addressing the question report anticipated retirement over the next decade. A comparison between
the 2014 and 2016 survey data shows an increase of 8.4% in the percentage of respondents who plan
to retire in 10 years, from 36.3% in 2014 to, 44.7% in 2016
Figure 5: Reasons to Delay Retirement
Responses to the question of
factors affecting delayed retirement
are illustrated in Figure 5. The
responses are ordered by frequency
of response with economic
conditions as the leading concern
(13.8%), followed by desirability of
shortened/flexible work hours
(11%), reduced physical demands
(19%) and increased compensation
(7.2%).
0.0%
5.0%
10.0%
15.0%
20.0%
25.0%
30.0%
1-5years
6-10years
11-15years
16-20years
21-30years
over30
years
Donot
know
How much longer do you plan to practice as an RN in illinois?
0.0% 10.0% 20.0%
Econo…
Shorte…
A less…
Increa…
Other
Contin…
New…
Better…
If you plan to retire within the next 5 years, is there a primary factor that would persuade you to continue working as a nurse, extend your date of retirement?
(Select only one):
Economic conditions
Shortened/flexible workhours
A less physicallydemanding position
Increased salary
Other
Continued or betterbenefits
New learningopportunity

OCTOBER18,2017FINALIDFPR/ILLINOISCENTERFORNURSINGRNSURVEYREPORT
10
Human Capital
The concept of human capital encourages workforce analysis in terms of the productive
capacity of each individual. Skills and knowledge can be general (productive in a variety of contexts)
or specific (most valuable in a particular context, such as a unique industry setting or specialized
occupational role). A human capital perspective is essential to a full appreciation of the role of health
care, education, and workforce development in promoting economic growth and societal well‐being.
This section reports on registered nurse (RN) education and clinical practice specialties.
Figure 6:Initial Nursing Credentials
The response
frequencies to the
question of the type of
nursing credential that
qualified an individual for
his/her first U.S. nursing
license is presented in
Figure 6 (left). The
percentage of nurses
entering the field via the
Associate Degree in
Nursing (ADN) route was 38.2%, was similar to those entering at the Bachelor of Science in Nursing
(BSN) level of 40.2%. The next highest category was comprised of nurses who initiated their career via
a diploma school (15.4 %). The remaining 6.2% were distributed across a broad spectrum of
educational categories.
Interestingly when respondents were asked to indicate the highest degree attained (Figure 7
below), the percent who indicated an associate degree in nursing (ADN) decreased to 25.2% and
diploma to 8.1%, suggesting many nurses go on to higher degrees during the course of their careers.
While a significant percent of nurses continue in school to obtain a master’s degree, either in nursing
3.2%15.4%
38.2%40.2%
2.7%0.1%0.1%0.1%
0.0% 10.0% 20.0% 30.0% 40.0% 50.0%
Vocational/Practical certificate-…Diploma-nursing
Associate degree-nursingBaccalaureate degree-nursing
Master's degree-nursingDoctoral degree-nursing practice…
Doctoral degree-nursing (PhD)Doctoral degree-nursing - other
What type of nursing degree/credential qualified you for your first U. S. nursing license?

OCTOBER18,2017FINALIDFPR/ILLINOISCENTERFORNURSINGRNSURVEYREPORT
11
(9%) or another field (5.4%) the number of nurses with an earned research doctorate (PhD) remains
small (0.6%).
Figure 7: Highest Level of Education
Availability of education affects the nursing pipeline, which in turn impacts the future supply of
nurses, an essential part in our health care system. In Illinois, the minimum requirement to teach in
an LPN program is a baccalaureate degree with a major in Nursing (Nurse Practice Act/NPA Section
1300.230g). For all other pre‐licensure nursing education programs, the minimum requirement is a
master’s degree with a major in nursing (NPA Section 1300.340g). A doctoral degree is required to
teach in graduate nursing education, including Advanced Practice Registered Nurses (APRNs). These
data are important because they raise questions of the adequacy of nursing faculty to maintain the
nursing education pipeline.
When asked if they were currently pursuing a higher degree, the majority (88.2%) of
respondents indicated they were not. However, 4.5% seeking an additional degree were enrolled in
a Master’s program and 4.6% in a bachelor’s program. It is difficult to ascertain if the 1.2% of
individuals enrolled in doctoral programs were seeking a doctor of nursing practice (DNP) or a doctor
of philosophy (PhD). Future surveys should include questions to determine types of doctoral degrees
being pursued.
0.0%
5.0%
10.0%
15.0%
20.0%
25.0%
30.0%
35.0%
40.0%
45.0%
What is your highest level of education?Diploma-nursing
Associate degree-nursing
Associate degree - other field
Baccalaureate degree - nursing
Baccalaureate degree - otherfieldMaster's degree - nursing
Master's degree - other field
Doctoral degree - nursingpractice (DNP)Doctoral degree - nursing (PhD)
Doctoral degree - nursing other
OCTOBER18,2017FINALIDFPR/ILLINOISCENTERFORNURSINGRNSURVEYREPORT
12
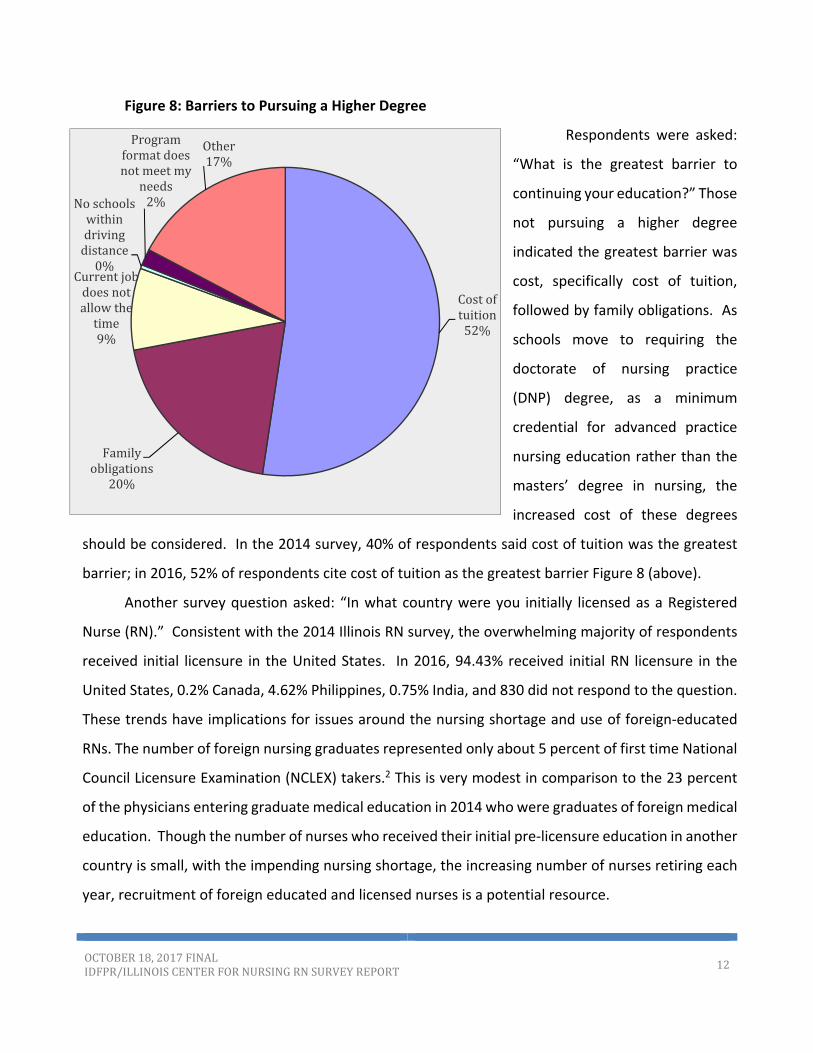
Figure 8: Barriers to Pursuing a Higher Degree
Respondents were asked:
“What is the greatest barrier to
continuing your education?” Those
not pursuing a higher degree
indicated the greatest barrier was
cost, specifically cost of tuition,
followed by family obligations. As
schools move to requiring the
doctorate of nursing practice
(DNP) degree, as a minimum
credential for advanced practice
nursing education rather than the
masters’ degree in nursing, the
increased cost of these degrees
should be considered. In the 2014 survey, 40% of respondents said cost of tuition was the greatest
barrier; in 2016, 52% of respondents cite cost of tuition as the greatest barrier Figure 8 (above).
Another survey question asked: “In what country were you initially licensed as a Registered
Nurse (RN).” Consistent with the 2014 Illinois RN survey, the overwhelming majority of respondents
received initial licensure in the United States. In 2016, 94.43% received initial RN licensure in the
United States, 0.2% Canada, 4.62% Philippines, 0.75% India, and 830 did not respond to the question.
These trends have implications for issues around the nursing shortage and use of foreign‐educated
RNs. The number of foreign nursing graduates represented only about 5 percent of first time National
Council Licensure Examination (NCLEX) takers.2 This is very modest in comparison to the 23 percent
of the physicians entering graduate medical education in 2014 who were graduates of foreign medical
education. Though the number of nurses who received their initial pre‐licensure education in another
country is small, with the impending nursing shortage, the increasing number of nurses retiring each
year, recruitment of foreign educated and licensed nurses is a potential resource.
Costoftuition52%
Familyobligations
20%
Currentjobdoesnotallowthetime9%
Noschoolswithindrivingdistance0%
Programformatdoesnotmeetmy
needs2%
Other17%
OCTOBER18,2017FINALIDFPR/ILLINOISCENTERFORNURSINGRNSURVEYREPORT
13
Employment, Job Characteristics
The overwhelming majority of respondents, 91.25% work full‐time at one job and are actively
employed in nursing. Of those respondents who work part‐time or per diem, the majority are also
actively employed in nursing. A small number of respondents, approximately 10‐15%, work multiple
jobs. Approximately half or 55.4% of respondents work a total of 40 hours per week on all jobs. For
those who work part‐time, 25% work less than 40 hours per week, and approximately 20% work
between 50‐60 hours per week; very few respondents work more than 60 hours per week.
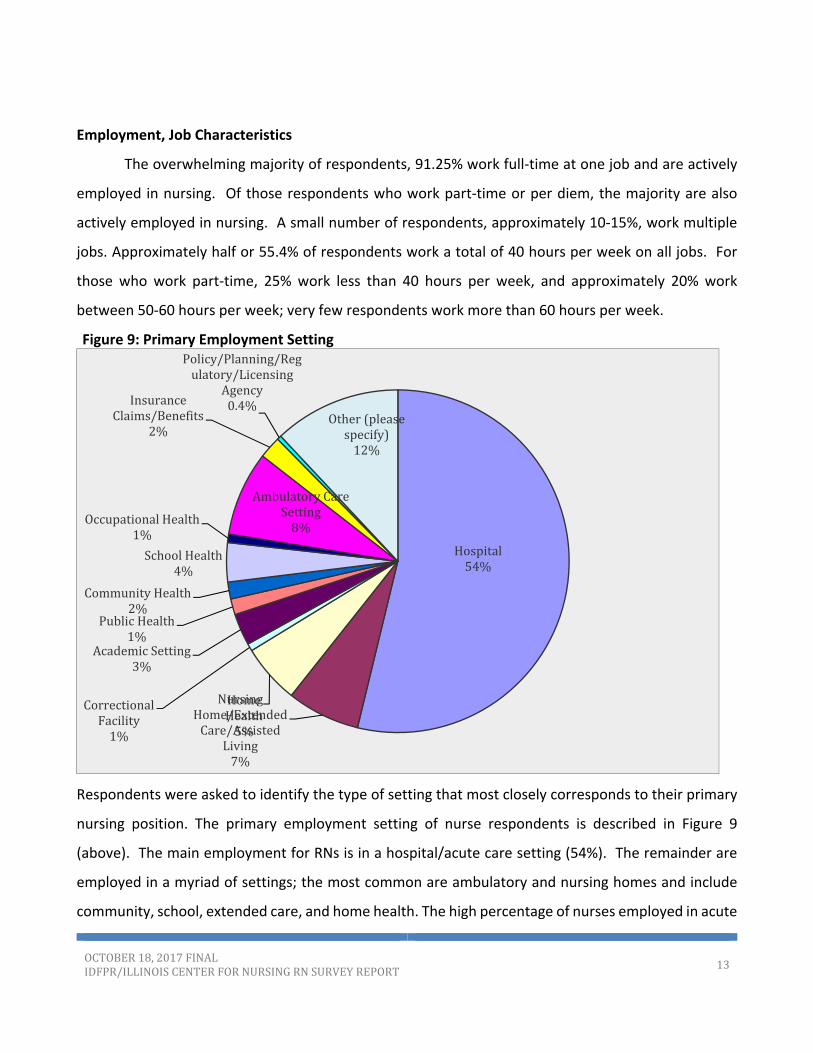
Figure 9: Primary Employment Setting
Respondents were asked to identify the type of setting that most closely corresponds to their primary
nursing position. The primary employment setting of nurse respondents is described in Figure 9
(above). The main employment for RNs is in a hospital/acute care setting (54%). The remainder are
employed in a myriad of settings; the most common are ambulatory and nursing homes and include
community, school, extended care, and home health. The high percentage of nurses employed in acute
Hospital54%
NursingHome/ExtendedCare/Assisted
Living7%
HomeHealth5%
CorrectionalFacility1%
AcademicSetting3%
PublicHealth1%
CommunityHealth2%
SchoolHealth4%
OccupationalHealth1%
AmbulatoryCareSetting8%
InsuranceClaims/Benefits
2%
Policy/Planning/Regulatory/Licensing
Agency0.4%
Other(pleasespecify)12%

OCTOBER18,2017FINALIDFPR/ILLINOISCENTERFORNURSINGRNSURVEYREPORT
14
care is essentially unchanged from the 2014 survey, which indicated that 53.52% of respondents were
employed in acute care. But considering that in the 2000 survey 64.4% were employed in a hospital
setting the number is trending downward. This shift in care setting reflects an increased focus on RN
positions in non‐acute care, community settings. These settings carry an increased focus on health
promotion, disease prevention, and wellness. Nurses play a critical role in optimizing health outcomes
through a traditional and evolving focus in areas such as care coordination, health promotion and
quality improvement.3 It will be important that nursing school curriculums adjust their emphasis to
include these foci.
Figure 10: Position TitleIn their employment settings
approximately two thirds
(66.6%) of the respondents
provide direct patient care as
staff nurses (Figure 10). The
next most common position
title is nurse manager or
administrator (11.8%),
followed by patient care
coordinator (5%), and nursing
faculty (3%). This is similar to
the 2014 RN survey report
where 66.05% respondents
identified as staff nurse, and 11.23% as nurse manager.
Employment specialty displays the breadth of clinical specialty knowledge areas required for
the RNs primary position. For this question, more than one clinical specialty knowledge area could be
selected by respondents. The most frequently reported knowledge areas were medical (18%), surgical
(9.5%), acute care/critical care/intensive care (20.7%), and maternal‐child (11.6%).
67%12%
8%
5%
3%
2%1%
1%
1%0%
33%
Pleaseidentifythepositiontitlethatmostcloselycorrespondstoyourprimarynursingposition:
StaffNurse
Administrator/Manager
Other‐HealthRelated
PatientCareCoordinator
Faculty
Consultant
Executive
OCTOBER18,2017FINALIDFPR/ILLINOISCENTERFORNURSINGRNSURVEYREPORT
15
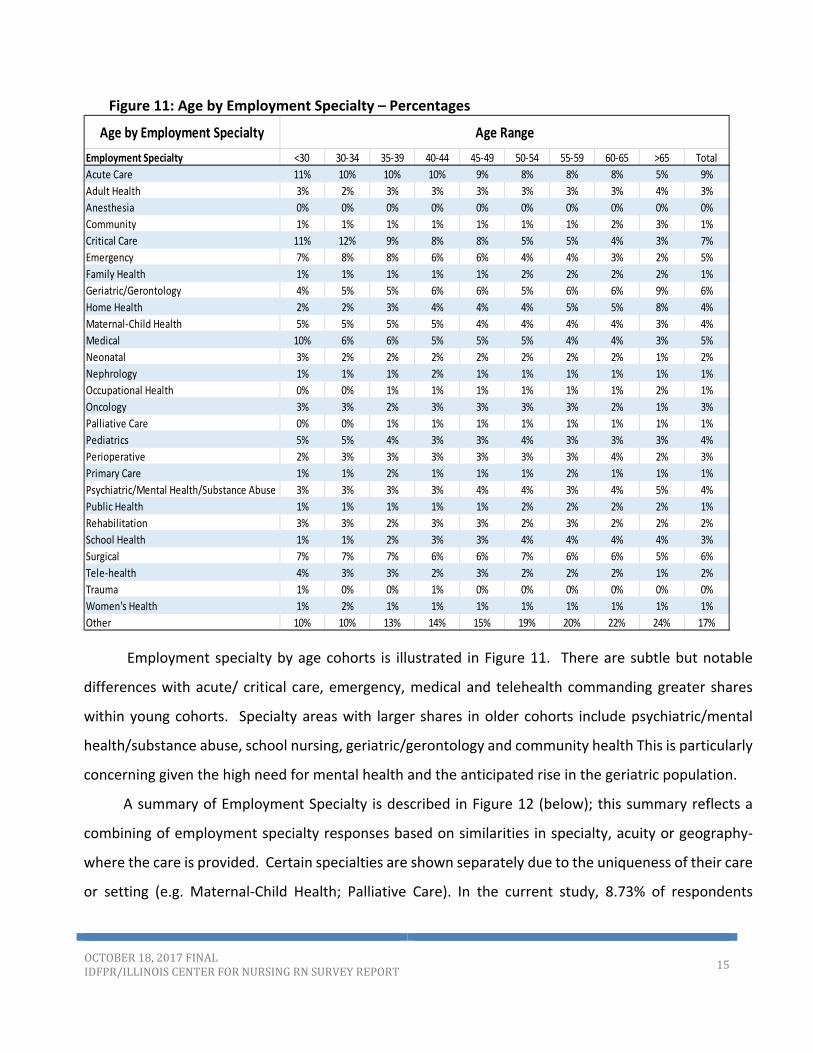
Figure 11: Age by Employment Specialty – Percentages
Employment specialty by age cohorts is illustrated in Figure 11. There are subtle but notable
differences with acute/ critical care, emergency, medical and telehealth commanding greater shares
within young cohorts. Specialty areas with larger shares in older cohorts include psychiatric/mental
health/substance abuse, school nursing, geriatric/gerontology and community health This is particularly
concerning given the high need for mental health and the anticipated rise in the geriatric population.
A summary of Employment Specialty is described in Figure 12 (below); this summary reflects a
combining of employment specialty responses based on similarities in specialty, acuity or geography‐
where the care is provided. Certain specialties are shown separately due to the uniqueness of their care
or setting (e.g. Maternal‐Child Health; Palliative Care). In the current study, 8.73% of respondents
Employment Specialty <30 30‐34 35‐39 40‐44 45‐49 50‐54 55‐59 60‐65 >65 Total
Acute Care 11% 10% 10% 10% 9% 8% 8% 8% 5% 9%
Adult Health 3% 2% 3% 3% 3% 3% 3% 3% 4% 3%
Anesthesia 0% 0% 0% 0% 0% 0% 0% 0% 0% 0%
Community 1% 1% 1% 1% 1% 1% 1% 2% 3% 1%
Critical Care 11% 12% 9% 8% 8% 5% 5% 4% 3% 7%
Emergency 7% 8% 8% 6% 6% 4% 4% 3% 2% 5%
Family Health 1% 1% 1% 1% 1% 2% 2% 2% 2% 1%
Geriatric/Gerontology 4% 5% 5% 6% 6% 5% 6% 6% 9% 6%
Home Health 2% 2% 3% 4% 4% 4% 5% 5% 8% 4%
Maternal‐Child Health 5% 5% 5% 5% 4% 4% 4% 4% 3% 4%
Medical 10% 6% 6% 5% 5% 5% 4% 4% 3% 5%
Neonatal 3% 2% 2% 2% 2% 2% 2% 2% 1% 2%
Nephrology 1% 1% 1% 2% 1% 1% 1% 1% 1% 1%
Occupational Health 0% 0% 1% 1% 1% 1% 1% 1% 2% 1%
Oncology 3% 3% 2% 3% 3% 3% 3% 2% 1% 3%
Palliative Care 0% 0% 1% 1% 1% 1% 1% 1% 1% 1%
Pediatrics 5% 5% 4% 3% 3% 4% 3% 3% 3% 4%
Perioperative 2% 3% 3% 3% 3% 3% 3% 4% 2% 3%
Primary Care 1% 1% 2% 1% 1% 1% 2% 1% 1% 1%
Psychiatric/Mental Health/Substance Abuse 3% 3% 3% 3% 4% 4% 3% 4% 5% 4%
Public Health 1% 1% 1% 1% 1% 2% 2% 2% 2% 1%
Rehabilitation 3% 3% 2% 3% 3% 2% 3% 2% 2% 2%
School Health 1% 1% 2% 3% 3% 4% 4% 4% 4% 3%
Surgical 7% 7% 7% 6% 6% 7% 6% 6% 5% 6%
Tele‐health 4% 3% 3% 2% 3% 2% 2% 2% 1% 2%
Trauma 1% 0% 0% 1% 0% 0% 0% 0% 0% 0%
Women's Health 1% 2% 1% 1% 1% 1% 1% 1% 1% 1%
Other 10% 10% 13% 14% 15% 19% 20% 22% 24% 17%
Age by Employment Specialty Age Range

OCTOBER18,2017FINALIDFPR/ILLINOISCENTERFORNURSINGRNSURVEYREPORT
16
indicated acute care as their primary practice specialty, followed by 6.72% who reported a specialty in
critical care and 6.19% reported a surgical specialty. RNs also reported employment specialties in
geriatric/gerontology (5.88%) and medical (5.1%). All other specialties were reported at less than 5
percent. The specialties that were combined are as follows:
Acute Specialties: Acute Care (8.73%), Critical Care (6.72%), Emergency (4.87%), Trauma (0.37%), Neonatal (2.11%)
Community, Health Promotion: Community (1.35%), Home Health (4.19%), Public Health (1.31%), School Health (3.31%)
Family – includes Pediatrics through Gerontology/Geriatrics: Family Health (1.46%), Primary Care (1.29%), Geriatric/Gerontology (5.88%), Adult Health (3.05%), Pediatrics (3.75%), Women’s Health (1.20%)
Maternal‐Child Health (4.49%)
Medical, includes Specialties: Medical (5.10%), Nephrology (1.17%), Oncology (2.81%), Rehabilitation (2.45%), Occupational Health (1.05%)
Other: respondents listed individual specialty titles (17.31%)
Palliative Care (0.63%)
Psychiatric/Mental Health/Substance Abuse (3.59%)
Surgical, Perioperative: Anesthesia (0.18%), Perioperative (3.09%), Surgical (6.19%)
Tele‐health (2.35%)
Figure 12: Employment Specialty – Summary
0.00%
5.00%
10.00%
15.00%
20.00%
25.00%
PerCent
Summary Employment Specialty
Employment Specialty ‐ Summary
OCTOBER18,2017FINALIDFPR/ILLINOISCENTERFORNURSINGRNSURVEYREPORT
17
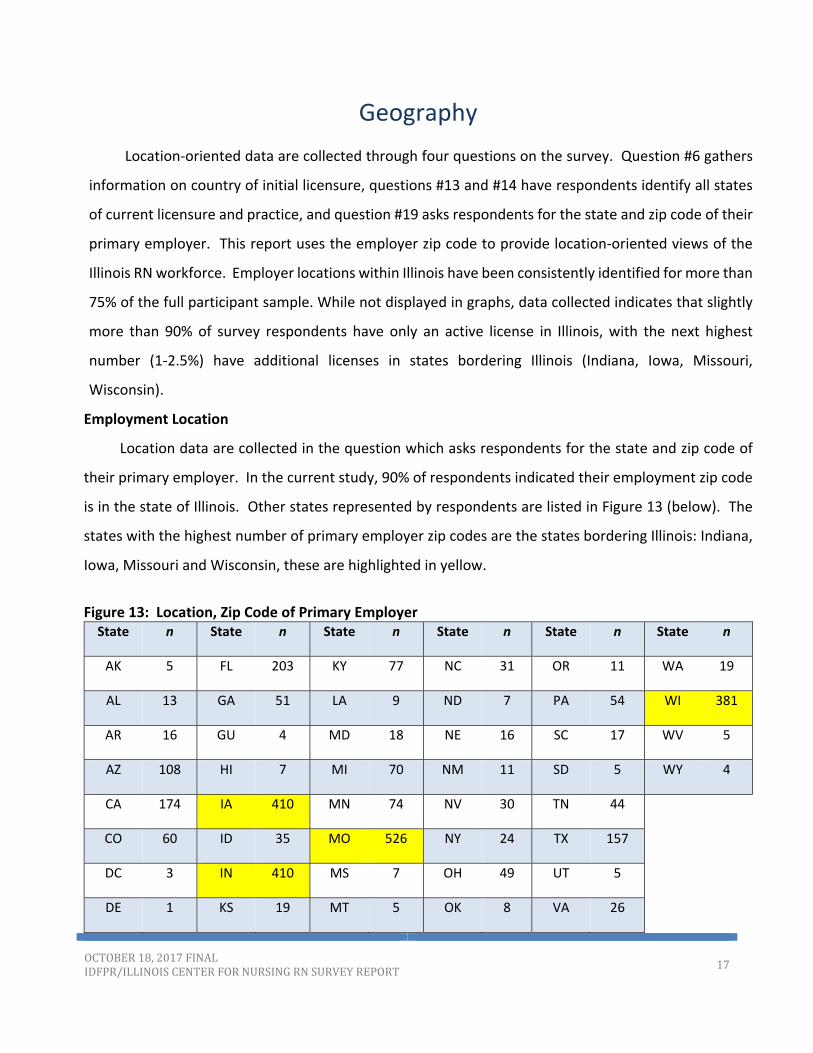
Geography
Location‐oriented data are collected through four questions on the survey. Question #6 gathers
information on country of initial licensure, questions #13 and #14 have respondents identify all states
of current licensure and practice, and question #19 asks respondents for the state and zip code of their
primary employer. This report uses the employer zip code to provide location‐oriented views of the
Illinois RN workforce. Employer locations within Illinois have been consistently identified for more than
75% of the full participant sample. While not displayed in graphs, data collected indicates that slightly
more than 90% of survey respondents have only an active license in Illinois, with the next highest
number (1‐2.5%) have additional licenses in states bordering Illinois (Indiana, Iowa, Missouri,
Wisconsin).
Employment Location
Location data are collected in the question which asks respondents for the state and zip code of
their primary employer. In the current study, 90% of respondents indicated their employment zip code
is in the state of Illinois. Other states represented by respondents are listed in Figure 13 (below). The
states with the highest number of primary employer zip codes are the states bordering Illinois: Indiana,
Iowa, Missouri and Wisconsin, these are highlighted in yellow.
Figure 13: Location, Zip Code of Primary Employer State n State n State n State n State n State n
AK 5 FL 203 KY 77 NC 31 OR 11 WA 19
AL 13 GA 51 LA 9 ND 7 PA 54 WI 381
AR 16 GU 4 MD 18 NE 16 SC 17 WV 5
AZ 108 HI 7 MI 70 NM 11 SD 5 WY 4
CA 174 IA 410 MN 74 NV 30 TN 44
CO 60 ID 35 MO 526 NY 24 TX 157
DC 3 IN 410 MS 7 OH 49 UT 5
DE 1 KS 19 MT 5 OK 8 VA 26

OCTOBER18,2017FINALIDFPR/ILLINOISCENTERFORNURSINGRNSURVEYREPORT
18
Illinois counties are the common denominator for geographic information presented. There are 102
counties in the state and each of the zip codes in survey responses has been assigned to the
corresponding county. Note that the figures represent RNs responding to the survey as opposed to all
RNs in a county; also note that location is based on reported employer location not RN residence.
Employment location of the respondents corresponds to major metropolitan areas. Data reported
as zip code were coded by county according to the U.S. Postal Service zip code designations. The
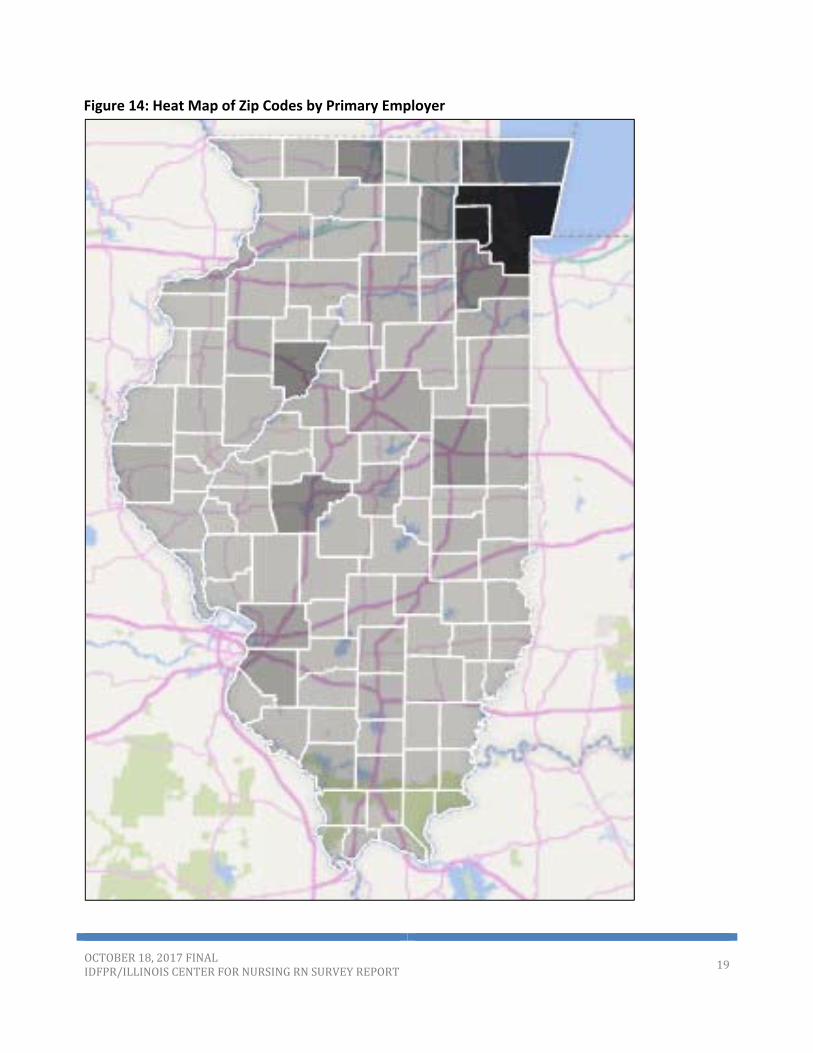
distribution of survey respondents is illustrated in Figure 14 (below), which demonstrates a heat map by
county of employment responses. All Illinois counties were represented in the survey, with the highest
number of respondents in Cook and the five collar counties: Du Page, Kane, Lake, McHenry and Will
counties. The next highest numbers were in Winnebago, Sangamon, St. Clair and Champaign counties,
followed by McLean and Madison counties. Given the geography of population density in Illinois it is not
surprising that RNs are generally clustered where people are generally clustered. 6, 693 individuals
skipped this question.
OCTOBER18,2017FINALIDFPR/ILLINOISCENTERFORNURSINGRNSURVEYREPORT
19
Figure 14: Heat Map of Zip Codes by Primary Employer

OCTOBER18,2017FINALIDFPR/ILLINOISCENTERFORNURSINGRNSURVEYREPORT
20
Figure 15 (below) is the list of all 102 Illinois counties and the total number of respondents from each county.
Figure 15: Primary employer zip codes – total numbers
Adams County 247 Henderson County 2 Ogle County 65
Alexander County 3 Henry County 69 Peoria County 1060
Bond County 35 Iroquois County 63 Perry County 43
Boone County 38 Jackson County 219 Piatt County 22
Brown County 8 Jasper County 8 Pike County 29
Bureau County 76 Jefferson County 145 Pope County 2
Calhoun County 6 Jersey County 20 Pulaski County 8
Carroll County 15 Jo Daviess County 25 Putnam County 2
Cass County 10 Johnson County 10 Randolph County 65
Champaign County 651 Kane County 907 Richland County 58
Christian County 60 Kankakee County 295 Saline County 65
Clark County 12 Kendall County 103 Sangamon County 861
Clay County 31 Knox County 168 Schuyler County 20
Clinton County 58 Lake County 1312 Scott County 3
Coles County 154 LaSalle County 262 Shelby County 17
Cook County 10698 Lawrence County 29 St. Clair County 550
Crawford County 50 Lee County 80 Stark County 4
Cumberland County 7 Livingston County 76 Stephenson County 161
De Witt County 17 Logan County 58 Tazewell County 220
DeKalb County 224 Macon County 323 Union County 41
Douglas County 11 Macoupin County 52 Vermilion County 180
DuPage County 2658 Madison County 485 Wabash County 26
Edgar County 38 Marion County 132 Warren County 31
Edwards County 7 Marshall County 22 Washington County 17
Effingham County 142 Mason County 25 Wayne County 25
Fayette County 31 Massac County 22 White County 17
Ford County 38 McDonough County 79 Whiteside County 59
Franklin County 42 McHenry County 493 Will County 1017
Fulton County 97 McLean County 415 Williamson County 222
Gallatin County 4 Menard County 13 Winnebago County 943
Greene County 25 Mercer County 16 Woodford County 63
Grundy County 126 Monroe County 20
Hamilton County 13 Montgomery County 53
Hancock County 19 Morgan County 86
Hardin County 3 Moultrie County 8
OCTOBER18,2017FINALIDFPR/ILLINOISCENTERFORNURSINGRNSURVEYREPORT
21
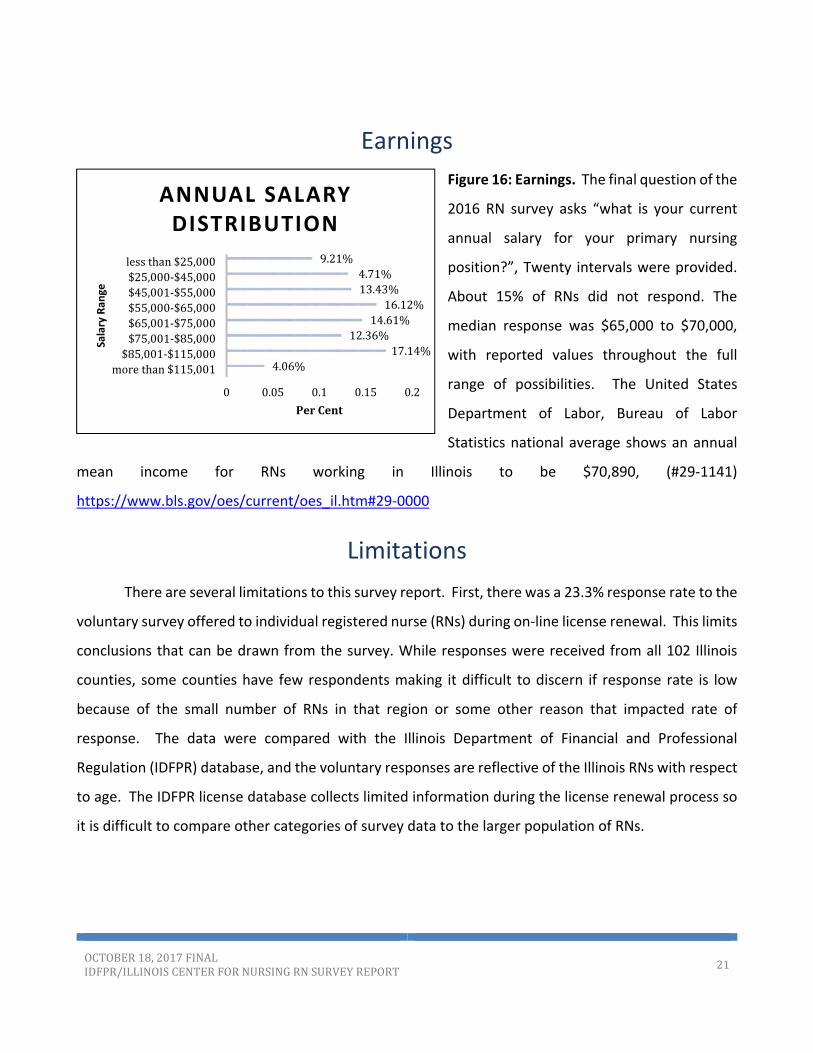
Earnings
Figure 16: Earnings. The final question of the
2016 RN survey asks “what is your current
annual salary for your primary nursing
position?”, Twenty intervals were provided.
About 15% of RNs did not respond. The
median response was $65,000 to $70,000,
with reported values throughout the full
range of possibilities. The United States
Department of Labor, Bureau of Labor
Statistics national average shows an annual
mean income for RNs working in Illinois to be $70,890, (#29‐1141)
https://www.bls.gov/oes/current/oes_il.htm#29‐0000
Limitations
There are several limitations to this survey report. First, there was a 23.3% response rate to the
voluntary survey offered to individual registered nurse (RNs) during on‐line license renewal. This limits
conclusions that can be drawn from the survey. While responses were received from all 102 Illinois
counties, some counties have few respondents making it difficult to discern if response rate is low
because of the small number of RNs in that region or some other reason that impacted rate of
response. The data were compared with the Illinois Department of Financial and Professional
Regulation (IDFPR) database, and the voluntary responses are reflective of the Illinois RNs with respect
to age. The IDFPR license database collects limited information during the license renewal process so
it is difficult to compare other categories of survey data to the larger population of RNs.
4.06%17.14%
12.36%14.61%16.12%
13.43%4.71%
9.21%
0 0.05 0.1 0.15 0.2
morethan$115,001$85,001‐$115,000$75,001‐$85,000$65,001‐$75,000$55,000‐$65,000$45,001‐$55,000$25,000‐$45,000lessthan$25,000
PerCent
Salary Ran
ge
ANNUAL SALARY DISTRIBUTION
OCTOBER18,2017FINALIDFPR/ILLINOISCENTERFORNURSINGRNSURVEYREPORT
22
Discussion
Illinois continues to have a robust RN workforce with practice in every setting where health care
is delivered. However, the data raise several concerns around sustaining this workforce. The registered
nurse (RN) workforce is an aging group, with 50.18% respondents over the age of 55 years, which is
approximately an 8% increase in this age cohort of Illinois RNs since 2014. In addition, one fourth of
respondents indicated an intent to retire within the next five years. Also, note that since a significant
number did not answer this question, there is no way of knowing how many of these non‐responders
are already retired. Overall, the number of graduates from pre‐licensure RN programs has held steady
in the last 3‐4 years, though the number of associate degree RN graduates has decreased from 41 to
36%.4 Given anticipated retirements, this raises the concern that the rate of nurses retiring will outpace
the number of new nurses entering the workforce.
A second related concern involves the RN pipeline and adequate faculty to teach in Illinois
nursing programs. In Illinois, RN pre‐licensure nursing education requires that faculty teaching RN
students have at least a master’s degree with a major in nursing. A doctoral degree is often required
to teach graduate nursing education, both Advanced Practice Registered Nurses (APRNs) and nursing
education programs. Eighty‐ eight percent of RN respondents do not plan on continuing their education
which could result in a shortage of masters and doctorally prepared faculty. Having enough nursing
faculty to maintain the nursing education pipeline is essential to the supply of nurses required to
maintain and improve the health status of Illinois citizens.
The actual supply and demand for nurses in Illinois demands additional consideration.
Nationally there has been considerable debate around nursing supply and demand. In discussing the
nursing pipeline, Salsberg5, a workforce expert, commented that after 14 years of steady growth, the
number of newly educated RNs in America appears to be leveling off. Yet the recent RN workforce
report of the U.S. Health Resources and Services Administration6 (HRSA) estimates a surplus of RNs by
2020 in particular states. The HRSA model is described as a micro‐simulation model that uses data on
individuals to develop forecasts. This model assumes that supply and demand for RNs was balanced in
2012, graduations will remain stable at the 2012 rate and employment patterns will not change
notably. This model does not acknowledge that enrollment in nursing pre‐licensure education

OCTOBER18,2017FINALIDFPR/ILLINOISCENTERFORNURSINGRNSURVEYREPORT
23
programs is susceptible to the fragile supply of nurse educators. HRSA also acknowledges that state
data based on licensure data holds more accurate predictions. For Illinois, there was a shortage of RNs
based on the 2011 demand study 7 and the 2014 and 2016 RN reports indicate significant retirements.
Thus, in Illinois there is reason to be concerned about the future supply of RNs.
An informed discussion on RN demand/capacity must also consider the nursing competencies
that will be demanded in new models of care, such as team based care and health homes.8 Another
dynamic impacting RN roles is the shift in health care from acute to non‐acute care with the increased
emphasis on health promotion and disease prevention. 9 There is some shifting away from employment
in acute care settings (64% in 2014 to 53.4% in 2016) and a movement to Family health (Pediatrics‐
through‐Geriatrics/Gerontology) (16.4% of respondents) and, Community/Health Promotion (10.16%).
However, the data indicating that nurses in the younger age cohorts continue to choose acute care
nursing roles, raises concerns around the nursing workforce that will be needed to meet health care
demands created by service delivery changes, population shifts and health care transformation. It
would be helpful to have a better understanding of the drivers for choosing an RN degree, and how the
profession might optimize each individual’s interest in a nursing career. As we engage in workforce
planning what must be considered is the movement of RNs to community roles and the training that
will demand. As the need for more RNs and health care providers in non‐acute care settings grows,
educators must consider how to assist in retraining the acute care RN workforce.
One in four Americans experience a behavioral health illness each year, and the majority of those
individuals also suffer from a comorbid physical health condition.10 Given the increased demand for
behavioral health services it is concerning that a limited number of Illinois nurses are choosing
psychiatric‐ mental health nursing. Moreover, between 30 to 80% of all primary care visits are driven, in
part, by behavioral health issues, necessitating that primary care physicians (PCPs) provide mental health
care and substance use disorder services.11 RNs are well suited for integrated care given the wide
breadth of skills and emphasis on holistic health.12 Work force planning for behavioral health will
demand consideration of how to optimize the RN role in these new models of care.13
There are additional concerns raised in this report, particularly around the diversity of the RN
workforce. In several of the younger cohorts there is decreasing diversity, particularly African American
nurses. Perhaps reflecting population trends, there is an increase of Hispanic nurses in Illinois. Vigilance
OCTOBER18,2017FINALIDFPR/ILLINOISCENTERFORNURSINGRNSURVEYREPORT
24
to this issue is necessary, particularly how the profession might increase diversity by optimizing entrée
to nursing through community college routes and plan for smooth academic progression.14
Given these issues and concerns there are policy implications in five areas:
1. To assure an adequate RN pipeline, there is a need for more nursing faculty in both pre‐
licensure nursing education and post‐licensure education, especially graduate nursing education.
Incentives for nurses to enter educational programs for nursing faculty are needed, particularly PhD
programs.
2. With the changing focus of where individuals receive health care and health promotion, there
is a need for improved competencies in community health, both in the education setting, and in the
expanding work areas.
3. Behavioral health demands are great particularly given the move to integrated care and
providing behavioral health care in a variety of settings. Programs are needed to incentivize RNs to
seek careers in psychiatric mental health (PMH) as well as retraining for the existing acute care PMH
RN workforce.
4. Increasing the racial and ethnic diversity of the health care workforce is essential for the
adequate provision of culturally competent care.
5. Given the conflicting views on the need for RNs in Illinois in the next decade, and the data
indicating the retirements of a large segment of the workforce, there is a need to study demand in
Illinois and build supply demand models considering all areas of the state and all RN specialties.
This report is a starting point for focusing on RN workforce in Illinois, and the gaps in the care
providers that exist and need to be filled to meet the needs of Illinois citizens. Moving forward, policy
decisions regarding nursing education and employment patterns should be based on the data obtained
through the biennial RN workforce surveys. Comparisons from subsequent surveys should be analyzed
for shifting trends and to evaluate progress toward meeting workforce requirements for addressing
the current and future healthcare needs of Illinois.

OCTOBER18,2017FINALIDFPR/ILLINOISCENTERFORNURSINGRNSURVEYREPORT
25
References
1. National State Boards of Nursing and the National Forum of State Nursing Workforce
Centers. (2015) National Nursing Workforce Study. Retrieved from
https://www.ncsbn.org/workforce.htm
2. National Council State Boards of Nursing Annual Report (2015). NCSBN 2015 Annual Report.
Retrieved from https://www.ncsbn.org/9155.htm
3. Smolowitz, J., Speakman, E., Wojnar, D., Whelan, E. M., Ulrich, S., Hayes, C., & Wood, L.
(2015). Role of the registered nurse in primary health care: Meeting health care needs in the 21st
century. Nursing Outlook, 63(2), 130‐136.
4. Illinois Department of Professional and Financial Regulation (2016). IDFPR Board of Nursing
Report on Pre‐Licensure Nursing Education Programs, Students and Faculty 2011‐2015. Retrieved
from http://nursing.illinois.gov/PDF/2017‐02‐22_BONSurveyFinalReport(LBRedits).pdf
5. Salsberg, E. (2016) Examining the nurse pipeline: Where We Are and Where We’re Headed.
Health Affairs Blog, http://healthaffairs.org/blog/
6. U.S. Department of Health and Human Services, Health Resources and Services
Administration (2017). Supply and demand projections of the nursing workforce: 2014‐2030.
Retrieved from
https://bhw.hrsa.gov/sites/default/files/bhw/nchwa/projections/NCHWA_HRSA_Nursing_Report.pdf
7. Illinois Center for Nursing (2014). 2011 Nursing Workforce Supply‐Demand Analysis for
Illinois Nurses. Retrieved from http://nursing.illinois.gov/PDF/2011%20RN%20Statewide%20Sup‐
Dem%20Analysis%20FINAL%20(2).pdf
8. Healthcare Task Force Report to the Illinois Workforce Investment Board (2014). The
Workforce Implications of New Healthcare Models. Retrieved from:
https://www.illinoisworknet.com/DownloadPrint/HCTF%20Final%20Report.pdf

OCTOBER18,2017FINALIDFPR/ILLINOISCENTERFORNURSINGRNSURVEYREPORT
26
9. Ashley, C., Halcomb, E., & Brown, A. (2016). Transitioning from acute to primary health care
nursing: An integrative review of the literature. Journal of Clinical Nursing, 25(15‐16), 2114‐2125.
10. American Hospital Association (2014). Integrating behavioral health across the continuum
of care. Chicago, IL: Health Research & Educational Trust. Retrieved from
www.hpoe.org/integratingbehavioralhealth
11. Wodarski, J. S. (2014). The Integrated Behavioral Health Service Delivery System Model.
Social Work in Public Health, 29(4), 301‐317. doi:10.1080/19371918.2011.622243
12. Delaney, K.R., Nagel, M., A. Valentine, N. M., Antai‐Otong, D., Groh, C., & Brenneman, L.
(2017). The effective use of RNs and APRNs in integrated care: Policy implications for increasing
access and quality. Journal of Behavioral Health Services and Research. On line First May 8, 2017,
https://doi:10.1007/s11414‐017‐9555‐x
13. Delaney, K. R. (2016). Psychiatric mental health nursing workforce agenda: Optimizing
capabilities and capacity to address workforce demands. Journal of the American Psychiatric Nurses
Association, 22(2), 122‐131.
14. Pennington, K., Berg, B., & Jarrett, S. (2013). Giving credit where credit is due: The RN‐to‐
BSN block transfer. Nurse Educator, 38(3), 103‐105.

OCTOBER18,2017FINALIDFPR/ILLINOISCENTERFORNURSINGRNSURVEYREPORT
27
Appendix A
Survey Questions
Question 1: What is Your Gender?
*Question 2: Are you currently licensed as an APN (CRNA, CNMW, CNP, CNS)? If yes, please cease participation.
Question 3: Are you Hispanic or Latino? (Yes or No)
Question 4: Select one or more of the following races that apply to you? (Mark all that apply):
Question 5: What year were you born? (Place a number in a box)
Question 6: In what country were you initially licensed as RN or LPN?
*Question 7: What type of nursing degree/ credential qualified you for your first U. S. nursing license?
*Question 8: What is your highest level of education?
Question 9: Are you currently enrolled in a nursing education program leading to a degree/ certificate?
Question 10: What is the greatest barrier to continuing your education? (Select only one)
Question 11: What year did you obtain your initial U.S. Licensure? (Place a number in a box)
Question 12: What is the status of the Illinois license currently held?
Question 13: Please list all states in which you hold an active license to practice as an RN:
Question 14: Please list all states in which you are currently practicing as an RN:
Question 15: What is your employment status? (Mark ALL that apply)
Question 16: If you are unemployed, not currently working as a nurse, are you: (Mark all that apply)
Question 17: In how many positions are you currently employed as a nurse:
Question 18: In how many hours per week do you work during a typical week in ALL your nursing positions?
Question 19: Please indicate state and zip code of your primary employer:
Question 20: Please identify the type of setting that most closely corresponds to your primary nursing position:

OCTOBER18,2017FINALIDFPR/ILLINOISCENTERFORNURSINGRNSURVEYREPORT
28
Question 21: Please identify the position title that most closely corresponds to your primary nursing position:
Question 22: Please identify the employment specialty that most closely corresponds to your primary nursing position:
Question 23: Please identify the type of setting that most closely corresponds to your secondary nursing position:
Question 24: Please identify the position title that most closely corresponds to your secondary nursing position:
Question 25: Please identify the employment specialty that most closely corresponds to your secondary nursing position:
Question 26: How much longer do you plan to practice as an RN in Illinois?
Question 27: If you plan to retire within the next 5 years, is there a primary factor that would persuade you to continue working as a nurse, extend your date of retirement? (Select only ONE):
Question 28: Please estimate our 2015 pre‐tax annual earnings from your primary nursing position. Include overtime, on‐call earnings, and bonuses:
(*) An asterisk prior to a question indicates that the question is mandatory and must be answered in order for the respondent to continue.