
Regional - xinhua08.comupload.xinhua08.com/2012/0801/1343801388982.pdfPhilex Mining Corp PX PM 22.15...
17
SEE APPENDIX I FOR IMPORTANT DISCLOSURES AND ANALYST CERTIFICATIONS 30 July 2012 Regional Daily Top Views Asia ex-Japan: Strategy Malaysia: Country Report Tham Mun Hon Wong Chew Hann 4 The Big Picture: Road Show Feedback - Economic worries weigh. Singaporean and Malaysian investors we met over the past two weeks were markedly less positive on the stock market than their peers in US. Renewed concerns over Eurozone debt sustainability and strength of the Chinese economy were key factors. - ASEAN is looking expensive. Investors are of the opinion that ASEAN markets valuations are no longer attractive. Asian investors are more positive on Thailand, but are less positive on Indonesia, especially with elections coming in 2014 that may lead to greater policy uncertainties. - China – the catalyst. There is also a consensus that the equity market is now driven by macro events and within Asia, further confirmation of a soft landing in China could trigger a more significant rally. Future updates to the Chinese PMI and industrial production data would be closely watched by investors. - Malaysian equities has run ahead. With the KLCI scaling new highs during our roadshow, investors have turned more cautious, questioning the sustainability of the rally. We reiterate our defensive call for the Malaysian market as we overweight the Power, Telco and NFO sectors. Oil & gas and Gloves offer thematic and re-rating plays. FY12 REVIEW McapUSD5.7b ADTV USD7.4m SG: Singapore Exchange (SGX SP) James KOH 5 Financials | Commendable set of results | BUY | Upside 13% - FY6/12 results were in line with expectations. Net profit was down only 3% yoy despite a 19% decline in trading volumes. Full year dividend of SGD 27 cents/ share was unchanged, representing 99% payout. - Derivatives revenue held up performance again, posting another record quarter. SGX is one of the largest derivatives centres in Asia, a factor we continue to believe will mitigate softening equities volume. - With a cashed-up balance sheet and lower capex going forward, sustainable dividend yield will remain healthy at around 4-5% at current price. Maintain BUY with TP of $7.50 pegged at 23x FY6/13F PER. INITIATION McapUS$11.9b ADTV US$m TH: Siam Cement (SCC TB) Sutthichai K. Maria L. 6 Industrials | Earnings Troughed; Sequential Earnings to begin in Earnest from 3Q12 | BUY | Upside 20.3% - The 2Q12 earnings should be SCC’s trough and we expect recovery starting 3Q12 on improving petrochemical spread and no further stock losses. - We also think that the recovery in spreads will be sustained to 2013. - We recommend accumulate on SCC and we re-initiate coverage with a 12mth SOTP target price of Bt380. P K Basu [email protected] (65) 6432 1821 ONG Seng Yeow [email protected] (852) 2268 0644 Jeremy TAN [email protected] (852) 2268 0635 Today’s Content… Country Regional Asia ex-Japan Strategy & Malaysia Country Report Singapore Singapore Exchange Thailand Siam Cement Regional Ebbs and Flows Malaysia Malaysia Airports India Infotech Enterprise Indonesia Astra Agro Lestari Indonesia Semen Gresik Philippines RFM Corporation Regional Stubs Monitor Top Buys… Company Ticker Spot Target Upside (%) Siam Makro MAKRO TB 322.00 478.00 48.45 Philex Mining Corp PX PM 22.15 30.61 38.19 Vinamilk VNM VN 87000.00 118000.00 35.63 LICHF LICHF IN 249.60 332.00 33.01 KLCC Property KLCC MK 4.93 6.38 29.41 SembMarine SMM SP 4.82 6.20 28.63 Venture Corp VMS SP 7.52 9.65 28.32 B. Armada BAB MK 3.86 4.88 26.42 First Philippine Holdings FPH PM 78.25 97.80 24.98 Kiatnakin Bank KK TB 39.75 49.00 23.27 Yes Bank YES IN 354.65 434.00 22.37 China State Construction 3311 HK 7.74 9.45 22.09 Top Sells… Company Ticker Spot Target Downside (%) Jai Prakash Associates JPA IN 69.90 47.00 32.76 GMA Network Inc GMAP PM 10.20 6.90 32.35 Ayala Land ALI PM 21.30 15.00 29.58 Uni-President 220 HK 7.57 5.60 26.02 Maybank-KE Events Date Event Location 30-31 Jul Yinson Holdings Non-Deal Roadshow SG 31 Jul RFM Corporation Non-Deal Roadshow SG 1 Aug Yinson Holdings Non-Deal Roadshow HK 2 Aug Perisai Petroleum Non-Deal Roadshow HK 2 Aug RFM Corporation Non-Deal Roadshow KL
Transcript of Regional - xinhua08.comupload.xinhua08.com/2012/0801/1343801388982.pdfPhilex Mining Corp PX PM 22.15...

SEE APPENDIX I FOR IMPORTANT DISCLOSURES AND ANALYST CERTIFICATIONS
30 July 2012
Regional
Daily
Top Views Asia ex-Japan: Strategy Malaysia: Country Report
Tham Mun Hon Wong Chew Hann
4
The Big Picture: Road Show Feedback - Economic worries weigh. Singaporean and Malaysian investors we met
over the past two weeks were markedly less positive on the stock market than their peers in US. Renewed concerns over Eurozone debt sustainability and strength of the Chinese economy were key factors.
- ASEAN is looking expensive. Investors are of the opinion that ASEAN markets valuations are no longer attractive. Asian investors are more positive on Thailand, but are less positive on Indonesia, especially with elections coming in 2014 that may lead to greater policy uncertainties.
- China – the catalyst. There is also a consensus that the equity market is now driven by macro events and within Asia, further confirmation of a soft landing in China could trigger a more significant rally. Future updates to the Chinese PMI and industrial production data would be closely watched by investors.
- Malaysian equities has run ahead. With the KLCI scaling new highs during our roadshow, investors have turned more cautious, questioning the sustainability of the rally. We reiterate our defensive call for the Malaysian market as we overweight the Power, Telco and NFO sectors. Oil & gas and Gloves offer thematic and re-rating plays.
FY12 REVIEW McapUSD5.7b ADTV USD7.4m SG: Singapore Exchange (SGX SP) James KOH 5 Financials | Commendable set of results | BUY | Upside 13% - FY6/12 results were in line with expectations. Net profit was down only
3% yoy despite a 19% decline in trading volumes. Full year dividend of SGD 27 cents/ share was unchanged, representing 99% payout.
- Derivatives revenue held up performance again, posting another record quarter. SGX is one of the largest derivatives centres in Asia, a factor we continue to believe will mitigate softening equities volume.
- With a cashed-up balance sheet and lower capex going forward, sustainable dividend yield will remain healthy at around 4-5% at current price. Maintain BUY with TP of $7.50 pegged at 23x FY6/13F PER.
INITIATION McapUS$11.9b ADTV US$m TH: Siam Cement (SCC TB) Sutthichai K.
Maria L. 6
Industrials | Earnings Troughed; Sequential Earnings to begin in Earnest from 3Q12 | BUY | Upside 20.3% - The 2Q12 earnings should be SCC’s trough and we expect recovery
starting 3Q12 on improving petrochemical spread and no further stock losses.
- We also think that the recovery in spreads will be sustained to 2013. - We recommend accumulate on SCC and we re-initiate coverage with a
12mth SOTP target price of Bt380.
P K Basu [email protected] (65) 6432 1821 ONG Seng Yeow [email protected] (852) 2268 0644 Jeremy TAN [email protected] (852) 2268 0635
Today’s Content… Country Regional Asia ex-Japan Strategy & Malaysia Country
Report Singapore Singapore Exchange Thailand Siam Cement Regional Ebbs and Flows Malaysia Malaysia Airports India Infotech Enterprise Indonesia Astra Agro Lestari Indonesia Semen Gresik Philippines RFM Corporation Regional Stubs Monitor
Top Buys… Company Ticker Spot Target Upside (%) Siam Makro MAKRO TB 322.00 478.00 48.45 Philex Mining Corp PX PM 22.15 30.61 38.19 Vinamilk VNM VN 87000.00 118000.00 35.63 LICHF LICHF IN 249.60 332.00 33.01 KLCC Property KLCC MK 4.93 6.38 29.41 SembMarine SMM SP 4.82 6.20 28.63 Venture Corp VMS SP 7.52 9.65 28.32 B. Armada BAB MK 3.86 4.88 26.42 First Philippine Holdings FPH PM 78.25 97.80 24.98 Kiatnakin Bank KK TB 39.75 49.00 23.27 Yes Bank YES IN 354.65 434.00 22.37 China State Construction 3311 HK 7.74 9.45 22.09
Top Sells… Company Ticker Spot Target Downside (%) Jai Prakash Associates JPA IN 69.90 47.00 32.76 GMA Network Inc GMAP PM 10.20 6.90 32.35 Ayala Land ALI PM 21.30 15.00 29.58 Uni-President 220 HK 7.57 5.60 26.02
Maybank-KE Events Date Event Location 30-31 Jul Yinson Holdings Non-Deal Roadshow SG 31 Jul RFM Corporation Non-Deal Roadshow SG 1 Aug Yinson Holdings Non-Deal Roadshow HK 2 Aug Perisai Petroleum Non-Deal Roadshow HK 2 Aug RFM Corporation Non-Deal Roadshow KL
30 July 2012
Regional Daily
Company Notes Ebbs & Flows Tham Mun Hon 7 Eurozone woes return - USD9.6b left global equities for the week ending 25 July, on renewed
concerns over Greece and Spain. - Outflows from Asia ex-Japan narrowed to USD99m helped by better
inflows into Malaysia, Taiwan and China.
- During the month of June, better buying was seen in IT and telecoms. Cash ratios in Asia ex-Japan funds declined slightly to 2.2%. but at this level, remain supportive of further stock market upside in 3Q12.
2Q12 RESULTS McapUS$2.1b ADTV US$0.9m MY: Malaysia Airports (MAHB MK) Wong Chew Hann 8 Industrial | 2Q12 Costs Rise Faster Than Revenue | Buy | Upside 24% - MYR203.7m 1H12 core net profit (-1.7% YoY) was 38% of our and 45%
of consensus full-year forecasts. The results disappointed due to high operational costs; some of these are adjustments to prior periods.
- We maintain our BUY call with a lower DCF-based target price of MYR6.90/share (from MYR7.10), after imputing the higher recurring cost items.
- Meanwhile, the construction of KLIA2 is progressing well and is on track to meet the Apr 2013 deadline. Management is confident that KLIA2 will be built within the MYR3.9b guidance.
SMID CAP | 1Q13 REVIEW McapUS$337m ADTV US$0.6m IN: Infotech Enterprises (INFTC IN) Jigar Shah 9 Software | Bucks the trend with 150% EPS increase | BUY | Upside 31% - Q1 EPS rose 150% YoY on strong revenue and margin expansion.
Software services of INFTC related to engineering and utilities benefited from ramp-up in new client execution and INR depreciation vs the USD.
- Despite pressure from slowing contributions from Europe revenue and staff salary increase of 6.5%, Q1 gross margin held up at 30.8% vs our forecast of 28.3%. We now factor in 100bp increase in gross margin for FY13 and upgrade our EPS by 9% to Rs22.3(+47.9%).
- The stock still trades cheap at PER of 7.6x FY13F. We increase our TP to Rs220/sh (+16%) based on PER of 10x FY13F to reflect strong earnings growth and net cash B/S. Maintain BUY.
2Q12 REVIEW Mcap USD3.8b ADTV USD2.4m IJ: Astra Agro Lestari (AALI IJ) Pandu Anugrah 10 Plantations | Fairly In Line | HOLD | Downside 12.7% - Higher 2Q12 external FFB processes, flat ASP, and stable cost have
allowed AALI to register robust earnings growth of 53.7% QoQ, translating to 1H12 net profit of IDR959b (-24.5% YoY), in line with ours but lower than consensus estimate.
- While lower ASP is imminent in 2H12, seasonally higher production would remain supportive on earnings in the following quarters, but FY12 earnings growth would remain unexciting, falling 12.7% YoY.
- We raise our TP to IDR20,000 as we roll over our valuation basis to FY13, but reiterate HOLD for AALI on limited nucleus production growth prospect and premium valuation (FY13 PER: 16.7x vs. sector PER of 13x).

30 July 2012
Regional Daily
2Q12 REVIEW Mcap USD7.6b ADTV USD8.3m IJ: Semen Gresik (SMGR.IJ) Anthony Yunus 11 Cement | Waiting for New Capacity| HOLD | Upside 6.6% - Semen Gresik’s (SMGR) 1H12 earnings rose by 12% YoY to reach
IDR2.1t, supported by a 14% YoY growth in revenue and lower operating expenses. This figure is in line with our estimates.
- We think it will be slightly hard for SMGR to expand its market share this year, as its new capacity of 5m tonnes will only be available in 2013. SMGR’s capacity will only rise by approximately 2m tonnes (+10%) for 2012.
- We believe the cost threat is not as strong as it was in 1H12, as the coal price is still falling and downside to the rupiah is limited. Maintain TP of IDR13,000, HOLD.
VISIT NOTE Mcap USD0.3b ADTV USD0.2m PH: RFM Corporation (RFM) Lovell Sarreal 12 Cons. Staples | Higher Sales an Better Margin in 1H12 | HOLD | Upside 6.2% - RFM Corp’s 1H12 results were generally in line with our forecasts with
net profits reaching PHP303m, up 42% YoY. This accounts for 46.6% of our full year forecast of PHP649m. On top of strong revenue growth, operating margins improved to 9% in 1H12 from 7.5% last year.
- Revenues grew 16% to PHP5.3b or 46.5% of our 2012 forecast of PHP11.65b. Most of RFM’s major brands grew this year, as market share for the ice cream business is now at 71%, supported by strong sales of existing Selecta products and newly launched Magnum ice cream. Meanwhile, White King Fiesta noodles pasta also performed well with market share growing to 29% from 25% last year.
- Meanwhile, RFM is looking to raise prices starting August for its flour-based products to help soften the impact of currently rising international wheat prices.
- With the results in line with our estimates, we are keeping our forecasts on RFM unchanged. Maintain HOLD.
QUANT STRATEGY | Stubs Monitor Jacky Wong 13 Long Las Vegas Sands Stubs (LVS US – 6.879 * 1928 HK) - The stub is trading at 2.58 S.D. above its one-year average. - LVS is trading at 32.6% discount to its NAV, close to its one-year widest
discount. - LVS was sold off after reporting worse-than-expected set of results. The
company said they may be buying back shares which could be a potential catalyst.

SEE APPENDIX I FOR IMPORTANT DISCLOSURES AND ANALYST CERTIFICATIONS
Regional / Malaysia
Market Strategy 30 July 2012
The Big Picture Road show feedback Economic worries weigh. Singaporean and Malaysian investors we met over the past two weeks were markedly less positive on the stock market than their peers in US. Renewed concerns over Eurozone debt sustainability and strength of the Chinese economy were key factors.
Buying on dips. That said, most investors acknowledged that they have been selective buyers of quality cyclicals on dips. The truth is, cash ratio amongst investment funds have risen since February and these funds had to be redeployed in the absence of new bad news.
ASEAN is looking expensive. Investors are of the opinion that ASEAN markets valuations are no longer attractive. Asian investors are more positive on Thailand, but are less positive on Indonesia, especially with elections coming in 2014 that may lead to greater policy uncertainties.
China – the catalyst. There is also a consensus that the equity market is now driven by macro events and within Asia, further confirmation of a soft landing in China could trigger a more significant rally. Future updates to the Chinese PMI and industrial production data would be closely watched by investors.
Malaysian equities has run ahead. With the KLCI scaling new highs during our roadshow, investors have turned more cautious, questioning the sustainability of the rally. We reiterate our defensive call for the Malaysian market as we overweight the Power, Telco and NFO sectors. Oil & gas and Gloves offer thematic and re-rating plays.
THAM Mun Hon, CFA [email protected] (852) 2268 0630
Wong Chew Hann, CA [email protected] (603) 22978686

SEE APPENDIX I FOR IMPORTANT DISCLOSURES AND ANALYST CERTIFICATIONS
Results Review 30 July 2012
Singapore
Co. Reg No: 198700034E MICA (P) : 099/03/2012
Singapore Exchange Commendable set of results
In line with expectations. FY6/12 reported net profit came in at $292. Underlying net profit of $304m was down only 3% yoy, which we believe reflects a commendable set of results given the challenging market conditions. Management proposed an unchanged final dividend of SGD 15 cents/ share (full year unchanged at SGD 27 cent/ share), which represents a 99% payout. Derivatives revenue held up performance. SDAV fell from %1.6b to $1.3b for the year, which was a familiar story for most exchanges around the world. As a result, securities revenue declined 16% yoy. Results were again held up by derivatives revenue, which were up 18% yoy. This segment posted another record quarter and has now shown steady growth over the past 12 quarters. Derivatives now account for 26% of total group revenue vs Securities which contribute 38%. Good cost control was another factor. Operating expenses were kept under control, declining 1% in line with the revenue decline. Between FY10-FY12, there were significant investments in new systems, which we believe has come to the end of a cycle. Importantly, we believe the lower capex going forward ($30-$35m per annum guidance) will be conducive for generous dividend payouts. Partnerships may be a better avenue than M&As. Going forward, we expect management to continue pursing organic initiatives as well as partnerships with other exchanges to grow. SGX recently signed a memorandum of understanding with the London Stock Exchange (LSE) to enable cross-trading of their most actively traded stocks. Management believes this platform, will make both exchanges more attractive for companies seeking a listing. SDAV at cyclical lows, maintain BUY. We believe SDAV is currently at cyclical lows. An uptick in trading volumes, combined with a growing derivatives business will bring SGX earnings to greater heights. With a cashed-up balance sheet, we believe sustainable dividend yield will remain healthy at around 4-5% at current price. Maintain BUY with a target price of SGD7.50 pegged at 23x FY6/13F PER.
Singapore Exchange – Summary Earnings Table FYE Jun (SGD m) 2011 2012 2013F 2014F 2015F Revenue 660.7 647.9 692.9 726.2 757.4 EBITDA 411.1 404.4 442.7 467.3 490.3 Recurring Net Profit 312.9 302.5 331.7 348.9 364.7 Recurring EPS (SGD cts) 27.5 27.2 31.0 32.5 34.0 DPS (SGD cts) 27.0 27.0 28.8 30.3 31.6 PER (x) 24.1 24.4 21.5 20.4 19.5 EV/EBITDA (x) 15.6 15.9 14.5 13.7 13.0 Div Yield (%) 4.1 4.1 4.3 4.6 4.8 P/BV (x) 8.7 8.5 8.3 8.1 7.9 ROE (%) 35.8 35.0 38.7 39.6 40.2 ROA (%) 15.5 16.9 18.7 19.0 19.3 Consensus Net Profit 332.7 379.3 na Source: Company, Maybank KE estimates
BUY (unchanged) Share price: SGD6.65 Target price: SGD7.50 (previously SGD7.43) James KOH [email protected] (65) 6432 1431 Stock Information Description: Owns and operates Singapore’s securities and derivatives exchange and their related clearing houses. Also provides ancillary securities processing and information technology services to participants in the financial sector. Ticker: SGX SP Shares Issued (m): 1,068.08 Market Cap (USD m): 5,667.7 3-mth Avg Daily Turnover (USD m): 7.4 ST Index: 2,998.49 Free float (%): 71.0 Major Shareholders: % SEL Holdings 23.3 Tokyo Stock Exchange 4.9 Key Indicators ROE (%) 35.08 Net cash (SGD m): 697.7 Book value per share (SGD) 0.78 Interest cover (x): na
Historical Chart
Performance: 52-week High/Low SGD7.65/SGD5.91 1-mth 3-mth 6-mth 1-yr YTD Absolute (%) 5.1 -1.8 1.2 -10.9 8.5 Relative (%) -0.4 -2.3 -1.6 -5.1 -4.3
5.00
5.50
6.00
6.50
7.00
7.50
8.00
Jul-11 Sep-11 Nov-11 Jan-12 Mar-12 May-12 Jul-12
SGX SP Equity

SEE APPENDIX I FOR IMPORTANT DISCLOSURES AND ANALYST CERTIFICATIONS
Re-initiating Coverage 27 July 2012
Thailand
Siam Cement (SCC) Earnings troughed; sequential recovery going forward
Investment thesis: The 2Q12 earnings should be SCC’s trough and we expect recovery starting 3Q12 on improving petrochemical spread and no further stock losses. We also think that the recovery in spreads will be sustained to 2013. Thus, we recommend investors accumulate on SCC. We re-initiate coverage with a 12mth price target of Bt380 – SOTP based.
Stock losses pulled 2Q12 profit: SCC reported 2Q12 net profit of Bt4.38bn, -42.9%YoY,-28.3%QoQ) but inline with our & market estimates (Bt4.4bn). The QoQ drop was mainly from the –Bt2bn inventory losses at the petchem division and the Bt600m cost associated to BST’s plant explosion. In 2Q12, petchem EBITDA margin remain low at 0.7% (0.8% in 1Q12) and the segment posted a net loss of -Bt1.0bn. The cement division saw softness as well. Domestic prices were off slightly to Bt1,800/tonne and the EBITDA margin was ~20.9% vs 24.3% 1Q12 – the decline is mostly seasonal. The Paper Division posted better performance with EBITDA rising to 16.4% vs 15.8% in 1Q12.
Petchem-driven improvement in 2H12: The H/H improvement will be driven by better Petchem margins and no further inventory losses assuming no major slump in crude oil prices. BST will be on full quarter shutdown and this would trim profits by ~Bt750mn, lower than the earlier management guidance of ~Bt1bn. As for cement, we expect soft performance as per seasonality while paper could see a slight slowdown due to weaker demand from both domestic and regional markets. The lift in 3Q12 will be because the improvement in the petchem division will more than offset the softening in the cement & paper segments.
Buy with TP of Bt380. We are re-initiating SCC coverage with a Buy rating and a TP of Bt380 (SOTP). We expect earnings to improve from 2H12 and into 2013 mainly on better petchem spreads and this could led to earnings upgrade that will underpin share price performance. Further push into HVAs (high value added) petchem products could also augment divisional improvement. SCC announced a 1H12 dividend of Bt4.50, a 1.4% yield. (XD on 6 Aug).
SCC – Summary Earnings TableFYE: Dec 31 (Btmn) 2010 2011 2012F 2013F 2014F Revenue 301,323 368,579 408,157 433,121 452,103 EBITDA 41,943 40,838 42,023 51,048 61,850 Recurring Net Profit 19,349 27,281 24,897 30,242 39,310 Recurring Basic EPS (Bt) 16.12 22.73 20.75 25.20 32.76 EPS growth (%) 53.5 (27.0) (8.7) 21.5 0.0 DPS (Bt) 12.50 12.50 11.41 12.60 14.74
PER 19.60 13.90 15.23 12.54 9.65 EV/EBITDA (x) 9.69 10.74 11.21 9.14 7.32 Div Yield (%) 3.96 3.96 3.61 3.99 4.66 P/BV(x) 2.85 2.70 2.46 2.23 1.97
Net Gearing (%) 81.54 116.36 112.38 91.40 67.29 ROE (%) 28.08 19.46 16.18 17.82 20.41 ROA (%) 2.54 3.24 2.64 4.40 6.18
Source: Company reports and KELIVE Research estimates.
Buy (Re-initiating coverage) Share price: Bt316 Target price: Bt380 Sutthichai Kumworachai [email protected] (02) 658 6300 Maria Lapiz [email protected] +662 257 0250
Stock Information Description : : SCC is holding company of the Siam Cement Group of Companies (SCG. Its subs and affiliates are engaged in 6 core businesses comprising of chemicals business, paper business, cement business, building materials business, distribution business, and investment. Ticker : SCC Shares Issued (mn) : 1,200 Market Cap (Btmn): 379,200 Market Cap (US$mn): 11,980 3-mth Avg. Daily Turnover (Btmn): 754.26 SET Index: 1,188.62 Free float (%): 50.5 Major Shareholders : % Crown Property Bureau 30.00 Thai NVDR 10.93
Historical Chart
0.2100.2200.2300.2400.2500.2
Jul-11 Oct-11 Jan-12 Apr-12
SCC SET Index (rebased)
Bt
Performance 52-week High / Low Bt387.00/Bt236.00 1-mth 3-mth 1-yrs Ytd Absolute (%) -2.43 -6.69 -13.24 2.56 Relative (%) -6.33 -9.99 -19.90 -13.40

SEE APPENDIX I FOR IMPORTANT DISCLOSURES AND ANALYST CERTIFICATIONS
Regional Market Strategy 30 July 2012
Ebbs & Flows Eurozone Woes Return USD9.6b left global equities for the week ending 25 July, as
renewed concerns over Greece and Spain roiled global equity markets. Both ETF and non-ETF investors turned net sellers, to the tune of USD7.5b and USD2.1b respectively. A slew of weaker US macroeconomic data releases also weighed on sentiment, leading to USD8.9b in outflows from the US market.
Interestingly, outflows from Asia ex-Japan narrowed to US99m
from USD222m a week earlier, helped by better inflows into Malaysia, Taiwan and China. Interest in Chinese equities is rising, given undemanding valuations for this market of 8.4x 12m forward PER and increasing efforts from the government to improve economic growth momentum.
During the month of June, investors returned to the market;
better buying was seen in IT (supportive book-to-bill ratio) and telecoms (yield plays remaining attractive). Cash ratios in Asia ex-Japan funds declined slightly to 2.2% from 2.6%, but at this level, remain supportive of further stock market upside in 3Q12.
That said, the structural issues that have stymied global
economic growth are unlikely to be effectively resolved in the near future and equity markets will likely remain volatile in 2H12.
Weekly sector flows
% of assets Weekly flow (USD m) Year-to-date flows Country 25-Jul-12 25-Jul-12 18-Jul-12 11-Jul-12 4-Jul-12 USD m % YoY Consumer Discretionary (0.09) (18.3) (20.6) 17.6 (27.4) (463) (10.6) Consumer Staples (0.07) (8.1) (20.1) 4.7 (9.3) (207) 41.2 Energy (0.04) (5.7) (9.1) 11.6 (16.0) (104) 85.0 Financials (0.06) (32.3) (32.2) 61.3 (39.8) (807) 54.6 Health Care (0.03) (1.2) (10.4) 1.6 (5.2) (62) 65.4 Industrials (0.08) (13.4) (22.8) 15.7 (6.1) (524) (27.6) Information Technology (0.00) (1.0) (67.0) 31.1 33.1 (744) (196.4) Materials (0.06) (7.5) (22.9) 10.2 (2.2) (380) (196.9) Telecom Services (0.04) (3.5) (8.6) 9.6 0.4 (61) 70.3 Utilities (0.02) (0.6) (2.9) 4.3 (2.5) (21) 86.5 Note: AUM of funds tracked under sector flows is smaller than those tracked for country flows. Source: EPFR, Maybank-KE
THAM Mun Hon, CFA [email protected] (852) 2268 0630
SEE APPENDIX I FOR IMPORTANT DISCLOSURES AND ANALYST CERTIFICATIONS
Results Review 30 July 2012
PP16832/01/2013 (031128)
Malaysia
Malaysia Airports Holdings 2Q12 Costs Rise Faster Than Revenue
Below expectations. MAHB’s MYR203.7m 1H12 core net profit (-1.7% YoY) was 38% of our and 45% of consensus full-year forecasts. While 2H is typically much stronger than 1H, the results disappointed due to operational costs spiking 36.8% YoY, significantly outpacing revenue growth of 21.9% YoY. Some of these cost items are adjustments to prior periods and will not feature in 2H. We maintain our BUY call with a lower DCF-based target price of MYR6.90/share (from MYR7.10), after imputing the higher recurring cost items.
Costs soared due to staff, and prior year adjustments. 2Q core net income of MYR87.1m (-7.8% YoY, -25.3% QoQ) was below our expectations. There were a series of cost adjustments relating to back-pay of bonuses and salaries, health insurance claims, and back charges of maintenance costs. Depreciation rose by MYR17.6m or 37% QoQ, relating to project upgrades and recently completed capex.
KLIA2 recruitment ahead of schedule. Headcount has risen sharply, by 500 employees, to roughly 6,300. Staff have been recruited ahead of time to be trained for the commencement of the KLIA2 project. This is earlier than expected; we had previously thought that recruitment would take place in October-November, 5-6 months ahead of the opening.
KLIA2 on track. Management reassures that construction of KLIA2 is progressing well and is on track to meet the Apr 2013 deadline. Roughly 60% of the construction work is completed (up from 50% last quarter), and management is confident that KLIA2 will be built within the MYR3.9b guidance. Management asserts that there is no truth to media speculation that the cost of KLIA2 will rise to MYR5.0b.
Lower target price. We lower our FY12-14 earnings forecasts by 0.9%,1.0% and 0.8% respectively, to take into account higher staff cost than originally envisioned as well as a higher depreciation rate. MAHB is cheap on a PER and EV/EBITDA basis compared to global peers.
Malaysia Airports Holdings – Summary Earnings Table FYE Dec (RM m) 2010A 2011A 2012F 2013F 2014F Revenue 1,812.9 1,935.6 2,141.2 2,469.7 2,884.1 EBITDA 706.9 787.7 904.1 984.2 1,182.7 Recurring Net Profit 378.1 444.0 526.8 286.3 426.2 Recurring Basic EPS (Sen) 31.2 40.4 44.4 23.7 35.2 EPS growth (%) 7.9 29.2 9.9 (46.7) 48.9 DPS (Sen) 15.6 17.8 17.8 17.8 17.8
PER 17.9 13.9 12.6 23.7 15.9 EV/EBITDA (x) 10.1 10.0 9.9 9.5 7.6 Div Yield (%) 2.8 3.2 3.2 3.2 3.2 P/BV(x) 1.9 1.7 1.5 1.5 1.4
Net Gearing (x) 0.29 0.49 0.52 0.56 0.47 ROE (%) 8.9 10.7 13.1 6.4 9.2 ROA (%) 4.8 5.1 6.4 3.1 4.4
Earnings revision (%) n.a n.a -0.9 -1.0 -0.8 Consensus Net Profit (MYR m) n.a n.a 422.8 439.8 537.0 Source: Maybank KE
Buy(unchanged) Share price: MYR5.57 Target price: MYR6.90 (from MYR7.10) Wong Chew Hann [email protected] (03) 22978692
Stock Information Description: Licensed airport operator in Malaysia, India, Maldives and Turkey Ticker: MAHB MK Shares Issued (m): 1,210.0 Market Cap (MYR m): 6,739.7 3-mth Avg Daily Turnover (USD m): 0.86 KLCI: 1,624.94 Free float (%): 32.1 Major Shareholders: % KHAZANAH 49.1 EPF 10.0 SKIM AMANAH SAHAM 8.9
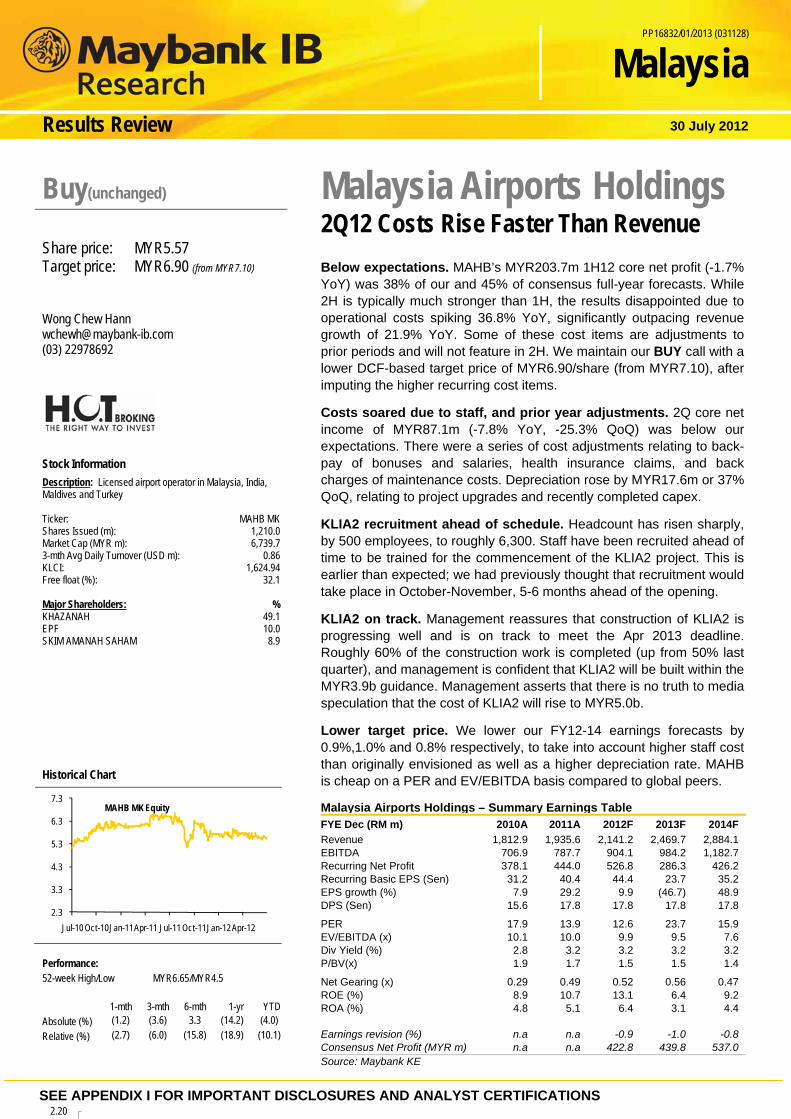
Historical Chart
Performance: 52-week High/Low MYR6.65/MYR4.5 1-mth 3-mth 6-mth 1-yr YTD Absolute (%) (1.2) (3.6) 3.3 (14.2) (4.0) Relative (%) (2.7) (6.0) (15.8) (18.9) (10.1)
2.3
3.3
4.3
5.3
6.3
7.3
Jul-10 Oct-10Jan-11Apr-11 Jul-11 Oct-11Jan-12Apr-12
MAHB MK Equity
2.20
SEE APPENDIX I FOR IMPORTANT DISCLOSURES AND ANALYST CERTIFICATIONS
1Q13 RESULT REVIEW 30 July 2012
India
Infotech Enterprises (INFTC) Bucks the trend with 150% EPS increase
. Q1 EPS rose 150% YoY on strong revenue and margin expansion. Software services of INFTC related to engineering and utilities benefited from ramp-up in new client execution and INR depreciation vs, the USD. Despite pressure from slowing Europe revenue and salary increase of 6.5%, Q1 gross margin held up QoQ at 30.8% vs. our forecast of 28.3%. We now factor in 100bp increase in gross margin for FY13 and upgrade our EPS by 9% to Rs22.3(+47.9%). The stock still trades cheap at PER of 7.6x FY13F. We increase our TP to Rs220/sh (+16%) based on PER of 10x FY13F to reflect strong earnings growth and net cash B/S. Maintain BUY. Q1 revenue of Rs4.5bn (+9.3%QoQ) is led by growth in US, Asia. INFTC recorded strong growth in both Engineering and Utility segments even as two European clients pulled out (Europe contribution -280bp QoQ). We increase our FY13F revenue due to addition of 1) 17 new clients, 2) strong order pipeline in the aerospace and utility segments and 3) new offices in Japan, Malaysia, China and South Korea, which will start contributing from Q2. Q1 gross margin of 31% is higher than our FY13 forecast of 28.3%. We believe, besides INR depreciation vs. USD, margin expansion is also due to increased work from low-cost locations in India. We also expect tax rate reduction of 400bp to 29% due to increased work from facilities having tax incentives to boost EPS. Manpower addition and CAPEX plan on track. INFTC is on course to add 1.5k employees this year (added 464 in Q1) to support new projects in the aviation and utility segment. It spent Rs215m in Q1 for CAPEX (new facility in India, offices in US/Australia) and will be spending Rs500m more from its surplus cash of Rs4.8bn. Net cash of Rs4.8bn to be used for acquisitions. INFTC made a series of acquisitions in the past to increase its geographical reach and widen its service offering. The company confirmed that it is looking at some more acquisitions to increase its presence in the utilities and aviation segment. PER of 7.6x FY13F, trades at 20% discount to historical avg. INFTC should trade in line with historical average with sharp margin recovery, EPS growth of 48% and strong net cash B/S. INFTC – Summary Earnings Table FY Mar 31 (Rsm) FY10 FY11 FY12 FY13F FY14F Revenue 9,531 11,880 15,531 19,414 23,296 EBITDA 2,547 2,097 2,856 3,948 4,759 Recurring Net Profit 1,704 1,407 1,674 2,477 2,999 Recurring Basic EPS (Rs) 15.3 12.7 14.9 22.3 27.0 EPS growth (%) 84.3 -17.4 19.0 47.9 21.1 DPS (Rs) 1.0 1.3 2.9 4.5 5.4 PER (x) 11.0 13.3 11.2 7.6 6.3 EV/EBITDA (x) 5.5 6.7 4.9 3.6 3.0 Div Yield (%) 0.6 0.7 1.7 2.6 3.2 P/BV(x) 2.4 2.1 1.8 1.6 1.4 Net Debt/Equity (%) -25.3 -34.0 -32.8 -35.1 -38.3 ROE (%) 20.3 14.5 15.2 19.7 20.3 ROA (%) 15.2 11.1 11.3 14.2 14.6
Source: Company data, Bloomberg, KESI estimates
BUY (Unchanged) Share price: Rs170/sh Target price: Rs223/sh (Upgraded from
Rs190/sh) Jigar Shah [email protected] (91) 22 66232632
Stock Information Description: Specialises in software for heavy engineering and geo-mapping. Ticker: INFTC IN Shares Issued (m): 111 Market Cap (US$ m): 351 6-mth Avg Daily Turnover (US$m): 0.6 SENSEX: 16,839 Free float (%): 49 Major Shareholders: % BVR Mohan Reddy 51
Key Indicators (FY13F) ROE – annualised (%) 18.2 Net cash (Rs bn): 4.8 Operating CF (Rs bn) 2.7
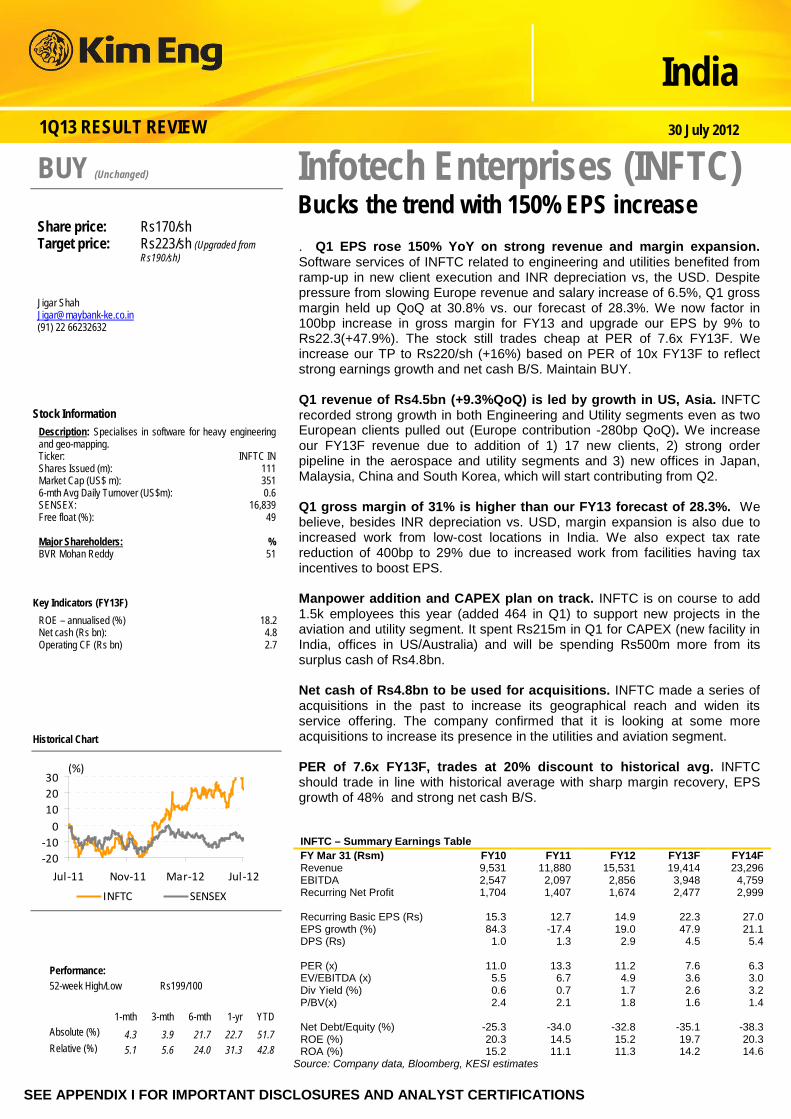
Historical Chart
-20-10
0102030
Jul-11 Nov-11 Mar-12 Jul-12
(%)
INFTC SENSEX
Performance: 52-week High/Low Rs199/100 1-mth 3-mth 6-mth 1-yr YTD Absolute (%) 4.3 3.9 21.7 22.7 51.7 Relative (%) 5.1 5.6 24.0 31.3 42.8

SEE APPENDIX I FOR IMPORTANT DISCLOSURES AND ANALYST CERTIFICATIONS
Results Review 30 July 2012
Indonesia
Astra Agro Lestari Fairly In Line
Robust QoQ earnings growth masks weak 1H12. On the back of solid 2Q12 CPO sales volume and manageable costs, Astra Agro Lestari (AALI) reported robust earnings of growth of 53.7% QoQ to IDR581b. Nevertheless, 1H12 net profit remained unexciting, falling 24.5% YoY to IDR959b as costs soared, but still on track to reach our FY12 forecast of IDR2.1t (-14.5% YoY). On the top line, 2Q12 CPO ASP was flat at IDR7,624/kg (1Q12: IDR7,706/kg), but higher CPO sales volume of 345k tonnes (+15.5% QoQ) resulted in revenue growth of 18.8% QoQ to IDR3.1t. This, coupled with a modest QoQ increase in costs, paved the way for an operating profit margin expansion to 27.2% in 2Q12 from 20.6% in 1Q12.
Higher third party purchases; raising FY12 CPO sales volume slightly. We raise our FY12 CPO volume estimate by 3% to 1.4m tonnes, incorporating higher than expected 1H12 external FFB of 1.1m tonnes, up 14% YoY. On the other hand, 1H12 processed nucleus FFB grew at a single-digit rate of 6.1% YoY. While rising third party purchases will persist, we believe that unexciting nucleus FFB growth output will limit AALI’s room for exponential earnings growth given the old average age profile of its trees (15 years) and the absence of sizeable landbank for new plantings.
Higher 2H12 production to partially offset lower CPO prices. With the continued uncertainty of the global economic recovery, we maintain our stance that lower CPO prices are set to unfold in 2H12, resulting in an unchanged FY12 price forecast of MYR3,150 (6M12: MYR3,200/t). Nevertheless, we believe that seasonal improvements in AALI’s production in the following quarters will underpin 2H12 earnings, offsetting the potential 3% downside in CPO prices (2H12 average CPO price estimate: MYR3,100/t).
Rolling over valuation to FY13; retain HOLD on premium valuation. While we raise our TP to IDR20,000 as we roll over our valuation basis to FY13, we retain our HOLD rating on AALI, pegging the stock at 14.5x PER. AALI’s FY13 PER of 16.7x is premium to domestic counters, making the company unattractive. We believe that uncertainty on the acquisition of new landbank remains a setback to AALI’s long-term growth prospect.
Astra Agro Lestari – Summary Earnings Table FYE Dec (IDR b) 2010 2011 2012F 2013F 2014FRevenue 8,844 10,773 11,380 11,556 12,164 EBITDA 3,249 3,527 3,306 3,505 3,701 Recurring Net Profit 2,017 2,406 2,101 2,155 2,289 Recurring Basic EPS (IDR) 1,281 1,528 1,334 1,369 1,454 EPS growth (%) 21.4 19.3 (12.7) 2.6 6.2 DPS (IDR) 655 940 993 867 890
PER (x) 17.9 15.0 17.2 16.7 15.8 EV/EBITDA (x) 10.7 10.0 10.8 10.1 9.4 Div Yield (%) 2.9 4.1 4.3 3.8 3.9 P/BV(x) 5.0 4.4 4.2 3.8 3.5
Net Gearing (%) Net Cash Net Cash Net Cash Net Cash Net Cash ROE (%) 28.0 29.6 24.2 22.8 22.1 ROA (%) 22.9 23.6 18.7 17.8 17.3 Consensus Net Profit (IDR b) - - 2,445 2,628 2,841 Source: Company, Kim Eng estimates
HOLD (Unchanged) Share price: IDR22,900 Target price: IDR20,000 (From IDR18,000) Pandu Anugrah [email protected] (62 21) 2557 1137 Stock Information Description: Astra Agro Lestari is the largest listed plantation company in Indonesia. It owns a total planted area of 267,000ha located in Sumatra and Kalimantan. Ticker: AALI IJ Shares Issued (m): 1,575 Market Cap (USD m): 3,798 3-mth Avg Daily Turnover (USD m): 2.4 IDX index: 4084 Free float (%): 20.32 Major Shareholders: % Astra International 79.68 Key Indicators
ROE – annualised (%) 22 Net cash (IDR b): 372 NTA/shr (IDR): 5,478 Interest cover (x): 229
Historical Chart
Performance: 52-week High/Low IDR23,950/IDR16,550 1-mth 3-mth 6-mth 1-yr YTD Absolute (%) 12.3 7.5 6.3 -3.4 5.3 Relative (%) 8.5 9.4 3.8 -1.2 -1.9
01122334455
10,000
12,000
14,000
16,000
18,000
20,000
22,000
24,000
26,000
25-Jul-11 15-Oct-11 5-Jan-12 27-Mar-12 17-Jun-12
IDR Millionshares
SEE APPENDIX I FOR IMPORTANT DISCLOSURES AND ANALYST CERTIFICATIONS
Results Review 30 July 2012
Indonesia
Semen Gresik Waiting for The New Capacity
Keeping up the pace. Semen Gresik’s (SMGR) 1H12 net profit rose by 12% YoY to reach IDR2.1t, supported by a 14% YoY growth in revenue and lower operating expenses. The bottom line figure is inline with our estimates, accounting for 48% of our full-year estimates. The company was able to maintain its net margin at 24%.
Bottom line grew by 8% QoQ. On a quarterly basis, net profit grew by 8% QoQ to IDR1.1t from IDR1.0t in 1Q12. Quarterly operating margin increased by 3ppts, thanks to slightly lower COGS. In addition, domestic sales volume increased by 8% to 5.3m tonnes in 2Q12, bringing the 1H12 volume to 10.3m tonnes. This figure has reached 46% of our FY12 estimates of 22m tonnes. We expect higher domestic sales volume booked in the 4Q12, in line with the rising property demand.
Expect market share to be flat in 2012. In our view, it will be slightly difficult for SMGR to expand its market share this year, as its new capacity of 5m tonnes will only be available in 2013. The new Tuban and Tonasa plants are starting to operate in March and July 2012; thus, they are running below their optimal capacity in their initial year. Therefore, SMGR’s capacity will only rise by approximately 2m tonnes (+10%) for 2012. Overall, market share in 2012 should remain at 41-42%, with SMGR’s plants running at a high utilisation rate of 97-98%.
Packing plants expansion. Besides completing the construction of its new plants this year, SMGR also plans to build five packing plants to cost at USD100–120k each. The plants will be located in Pontianak, Balikpapan, Banjarmasin, and other parts of western Indonesia. Capacity will be 200k tonnes p.a. per plant. Construction will commence in 3Q12 and will take about 13–16 months.
Maintain TP of IDR13,000, HOLD. We maintain our HOLD stance on the counter with TP at IDR13,000, pegged at FY12F PER of 17.5x. In addition, we believe the cost threat is not as strong as it was in 1H12, as the coal price is still falling and the downside to the rupiah is limited.
Semen Gresik– Summary Earnings TableFYE Dec (IDR b) 2010A 2011A 2012F 2013F 2014FRevenue 14,344 16,379 19,035 21,924 23,690 EBITDA 4,864 5,228 6,129 7,539 8,153 Recurring Net Profit 3,633 3,925 4,405 5,493 5,959 Recurring Basic EPS (IDR) 613 662 743 926 1,005 EPS growth (%) 8.2 8.0 12.2 24.7 8.5 DPS (IDR) 280 245 331 371 648
PER (x) 20.1 18.6 16.6 13.3 12.2 EV/EBITDA (x) 14.3 13.6 11.4 9.2 8.5 Div Yield (%) 2.3 2.0 2.7 3.0 5.3 P/BV(x) 6.1 5.0 4.3 3.6 3.3
Net Gearing (%) net cash net cash net cash net cash net cash ROE (%) 30.3 27.1 26.1 27.2 26.7 ROA (%) 23.3 20.0 18.8 20.5 20.8 Consensus Net Profit (IDR b) 3,540 3,860 4,532 5,270 5,995 Source: Kim Eng
HOLD (unchanged) Share price: IDR12,200 Target price: IDR13,000 Anthony Yunus [email protected] (62 21) 2557 1139 Stock Information Description: PT Semen Gresik (Persero) Tbk is an Indonesia-based cement company which has the highest market share in Indonesia. The Company's products include ordinary Portland cement type I, II, III and V. Ticker: SMGR.IJ Shares Issued (m): 5,932 Market Cap (US$ m): 7,622 3-mth Avg Daily Turnover (US$ m): 8.3 IDX index: 4084 Free float (%): 49.0 Major Shareholders: % Government of RI 51.0 Key Indicators
ROE – annualised (%) 27.8 Net cash (IDR b): Net cash NTA/shr (IDR): 23,583 Interest cover (x): 15.7
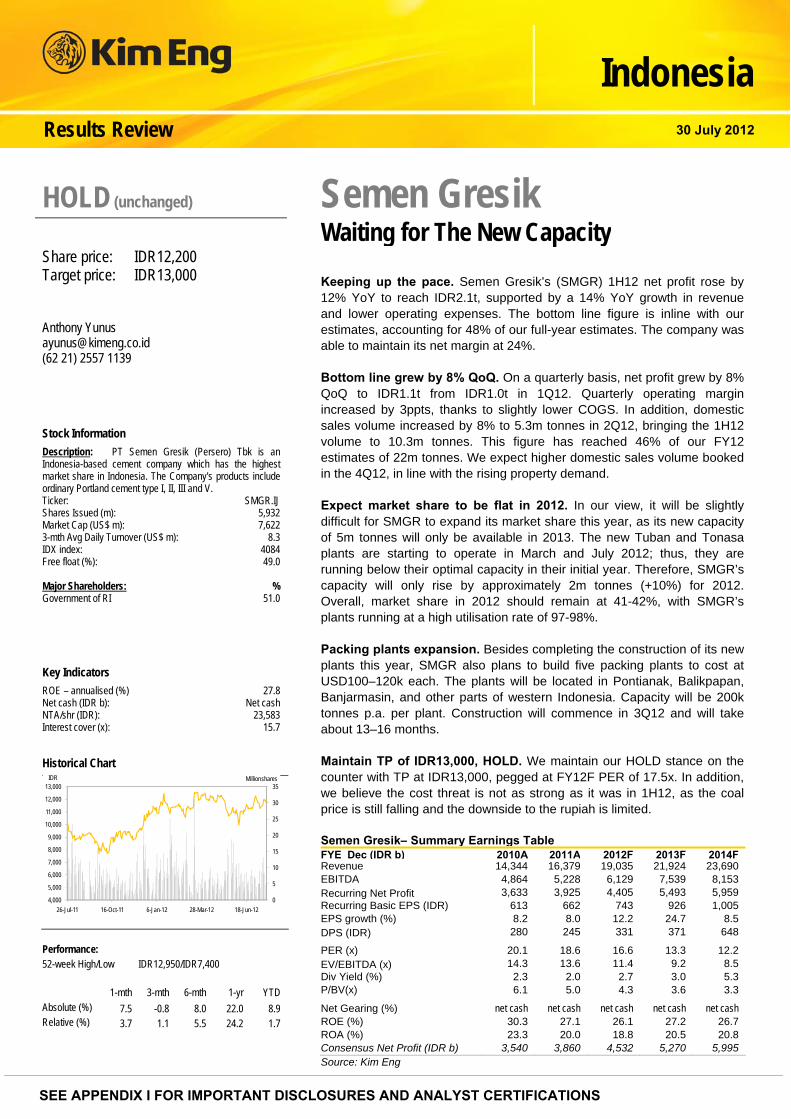
Historical Chart
Performance: 52-week High/Low IDR12,950/IDR7,400 1-mth 3-mth 6-mth 1-yr YTD Absolute (%) 7.5 -0.8 8.0 22.0 8.9 Relative (%) 3.7 1.1 5.5 24.2 1.7
0
5
10
15
20
25
30
35
4,000
5,000
6,000
7,000
8,000
9,000
10,000
11,000
12,000
13,000
26-Jul-11 16-Oct-11 6-Jan-12 28-Mar-12 18-Jun-12
IDR Millionshares

SEE APPENDIX I FOR IMPORTANT DISCLOSURES AND ANALYST CERTIFICATIONS
Philippines Company update 30 July 2012
RFM Corp Higher sales and better margins in 1H12
Net income surges 42% YoY in 1H12. RFM Corp’s (RFM) 1H12 results were generally in line with our forecasts with net profits reaching PHP303m, up 42% YoY. This accounts for 46.6% of our full year forecast of PHP649m. Revenues grew 16% to PHP5.3b or 46.5% of our 2012 forecast of PHP11.65b while operating income rose 37.6% to PHP472m, 45.7% of our full year estimate of PHP1.03b. RFM appears on track to meet our 2012 forecasts with contributions from 2H normally higher than 1H. Revenues in 2Q12 grew 12% to PHP2.87b while net income rose 53% to PHP173m, accelerating from the 30% rise in 1Q12. On top of strong revenue growth, operating margins improved to 9% in 1H12 from 7.5% last year through a combination of price increases, product rationalization, better scale and lower raw material costs.
Strengthening lead in ice cream and pasta markets. Most of RFM’s major brands grew this year, in line with the disclosed results for 5M12, led by Selecta ice cream, White King Fiesta pasta, Selecta milk and Sunkist juice. The ice cream business, which is a 50-50 joint venture (JV) with Unilever Philippines continued to post strong sales, up over 30%. Market share for the ice cream business is now at 71%, supported by strong sales of existing Selecta products and newly launched Magnum ice cream (Belgian chocolate ice cream on-stick) despite its higher price point. Meanwhile, White King Fiesta noodles pasta also performed well with market share growing to 29% from 25% last year. In key accounts, its market share is even higher at 38%.
Price hike and other mitigating factors to soften effects of higher wheat prices. Meanwhile, RFM is looking to raise prices starting August for its flour-based products in response to the recent jump in international prices for wheat which the company imports. The impact of higher costs should be felt in 4Q as the company use up lower-priced inventories. In recent past, RFM along with other local flour millers have gradually adjusted prices in response to increasing wheat prices. The strong peso and introduction this year of flour enhancers in RFM’s flour products should help in managing production costs. Wheat is the single most important raw material for RFM, accounting for an estimated 35-40% of cost of goods sold.
HOLD rating maintained. With the results in line with our estimates, we are keeping our forecasts on RFM unchanged. We also maintain our HOLD rating on the stock as the total potential return to our price target of PHP3.50 remains below 15%. RFM Corp– Summary Earnings TableFY 31 Dec (PHPm) 2009A 2010A 2011A 2012F 2013FRevenue 8,334 9,099 10,336 11,650 12,733 Net Profit to Common 364 625 510 649 766 EPS (PHP) 0.12 0.20 0.16 0.21 0.24 EPS growth (%) 50.5 71.4 (18.4) 27.4 18.0 DPS (PHP) 0.02 0.02 0.06 0.05 0.06 PER 29.0 16.9 20.7 16.3 13.8 EV/EBITDA (x) 15.9 13.0 12.0 9.5 8.0 Div Yield (%) 0.5 0.5 1.8 1.4 1.8
Net Gearing (%) 15.6 21.9 43.2 43.7 41.2 Consensus Net Profit (PHPm) na na na na na Source: RFM, Maybank ATR Kim Eng estimates
Hold (unchanged) Share price: PHP3.34 Target price: PHP3.50 Lovell Sarreal [email protected] (632) 849 8841
Stock Information Description: RFM is a food and beverage company in the Philippines. It is primarily engaged in the processing and manufacture of flour, flour-based products, milk and juice drinks, canned and processed meats, ice cream, and bottled mineral water. Ticker: RFM PM / RFM.PS Shares Issued (m): 3,160 Market Cap (PHPm): 10,554 Market Cap (USDm): 252 3-mth Avg Daily Value (USDm): 0.238 PSEi: 5,219.55 Free float (%): 51% Major Shareholders: % Horizons Realty Inc. 20.87 Triple Eight Holdings 20.86 Key Indicators
ROE-annualised (%) 12.0 Net debt (Pm) 2,473.2 NTA/shr (P) -BVPS 1.8 Interest cover (x) 6.0
Historical Chart
RFM PM
1
2
2
3
3
4
Jul-10 Nov-10 Mar-11 Jul-11 Nov-11 Mar-12 Jul-12 Source: Bloomberg Performance: 52-week High/Low PHP3.78 / PHP1.01 1-mth 3-mth 6-mth 1-yr YTD Absolute (%) 10.60 21.45 131.94 153.03 178.33 Relative (%) 11.33 20.48 120.41 136.60 159.63

SEE APPENDIX I FOR IMPORTANT DISCLOSURES AND ANALYST CERTIFICATIONS
Hong Kong Quantitative Research 30 July 2012
Stubs Monitor • Long Las Vegas Sands stub (LVS US – 6.879 * 1928 HK). The stub is
trading at 2.58 S.D. above its one-year average. LVS is trading at 32.6% discount to its NAV, close to its one-year widest discount. LVS got sold off after reporting a worse-than-expected result. The company said they may be buying back shares which could be a potential catalyst.
Figure 1: LVS NAV premium
Source: Company data, Kim Eng Securities
Figure 2: LVS Stub
Source: Company data, Kim Eng Securities
Stub Alerts – stubs trading near its +/- 2.0 standard deviations (30-day):
Ruentex stub (2915 TT – 1.436 * 6808 HK): +2.45 S.D.
-35%
-30%
-25%
-20%
-15%
-10%
-5%
0%
Jul-11 Sep-11 Nov-11 Jan-12 Mar-12 May-12
one year average
15
20
25
30
35
40
Jul-11 Sep-11 Nov-11 Jan-12 Mar-12 May-12
+2 s.d.
-2 s.d.
one year average
Anita HWANG, CFA [email protected] (852) 2268 0142 Jacky WONG, CFA [email protected] (852) 2268 0107

30 July 2012
Regional Daily
RESEARCH OFFICES REGIONAL
P K BASU Regional Head, Research & Economics (65) 6432 1821 [email protected]
WONG Chew Hann, CA Acting Regional Head of Institutional Research (603) 2297 8686 [email protected]
THAM Mun Hon Regional Strategist (852) 2268 0630 [email protected]
ONG Seng Yeow Regional Products & Planning (852) 2268 0644 [email protected]
ECONOMICS Suhaimi ILIAS Chief Economist Singapore | Malaysia (603) 2297 8682 [email protected]
Luz LORENZO Economist Philippines | Indonesia (63) 2 849 8836 [email protected]
MALAYSIA WONG Chew Hann, CA Head of Research (603) 2297 8686 [email protected] Strategy Construction & Infrastructure Desmond CH’NG, ACA (603) 2297 8680 [email protected] Banking - Regional LIAW Thong Jung (603) 2297 8688 [email protected] Oil & Gas Automotive Shipping ONG Chee Ting (603) 2297 8678 [email protected] Plantations Mohshin AZIZ (603) 2297 8692 [email protected] Aviation Petrochem Power YIN Shao Yang, CPA (603) 2297 8916 [email protected] Gaming – Regional Media Power WONG Wei Sum, CFA (603) 2297 8679 [email protected] Property & REITs LEE Yen Ling (603) 2297 8691 [email protected] Building Materials Manufacturing Technology
LEE Cheng Hooi Head of Retail [email protected] Technicals
HONG KONG / CHINA Edward FUNG Head of Research (852) 2268 0632 [email protected] Construction Ivan CHEUNG (852) 2268 0634 [email protected] Property Industrial Ivan LI (852) 2268 0641 [email protected] Banking & Finance Jacqueline KO (852) 2268 0633 [email protected] Consumer Staples Andy POON (852) 2268 0645 [email protected] Telecom & equipment Alex YEUNG (852) 2268 0636 [email protected] Industrial Jacky WONG, CFA (852) 2268 0107 [email protected] Special Situations Quants Anita HWANG, CFA (852) 2268 0142 [email protected] Consumer Discretionaries Special Situations
INDIA Jigar SHAH Head of Research (91) 22 6623 2601 [email protected] Oil & Gas Automobile Cement Anubhav GUPTA (91) 22 6623 2605 [email protected] Metal & Mining Capital goods Property Haripreet BATRA (91) 226623 2606 [email protected] Software Media Ganesh RAM (91) 226623 2607 [email protected] Telecom Contractor Darpin SHAH (91) 226623 2610 [email protected] Banking & Financial Services Gagan KWATRA (91 )226623 2612 [email protected] Small Cap
SINGAPORE Stephanie WONG Head of Research (65) 6432 1451 [email protected] Strategy Small & Mid Caps Gregory YAP (65) 6432 1450 [email protected] Technology & Manufacturing Telcos - Regional Wilson LIEW (65) 6432 1454 [email protected] Hotel & Resort Property & Construction James KOH (65) 6432 1431 [email protected] Logistics Resources Consumer Small & Mid Caps YEAK Chee Keong, CFA (65) 6433 5730 [email protected] Healthcare Offshore & Marine Alison FOK (65) 6433 5745 [email protected] Services S-chips Bernard CHIN (65) 6433 5726 [email protected] Transport (Land, Shipping & Aviation) ONG Kian Lin (65) 6432 1470 [email protected] REITs / Property WeiBin (65) 6432 1455 [email protected] S-chips Small & Mid Caps
INDONESIA Katarina SETIAWAN Head of Research (62) 21 2557 1125 [email protected] Consumer Strategy Telcos Lucky ARIESANDI, CFA (62) 21 2557 1127 [email protected] Base metals Coal Oil & Gas Rahmi MARINA (62) 21 2557 1128 [email protected] Banking Multifinance Pandu ANUGRAH (62) 21 2557 1137 [email protected] Auto Heavy equipment Plantation Toll road Adi N. WICAKSONO (62) 21 2557 1130 [email protected] Generalist Anthony YUNUS (62) 21 2557 1134 [email protected] Cement Infrastructure Property Arwani PRANADJAYA (62) 21 2557 1129 [email protected] Technicals
PHILIPPINES Luz LORENZO Head of Research +63 2 849 8836 [email protected] Strategy Laura DY-LIACCO (63) 2 849 8840 [email protected] Utilities Conglomerates Telcos Lovell SARREAL (63) 2 849 8841 [email protected] Consumer Media Cement Mining Kenneth NERECINA (63) 2 849 8839 [email protected] Conglomerates Property Ports/ Logistics Katherine TAN (63) 2 849 8843 [email protected] Banks Construction Ramon ADVIENTO (63) 2 849 8842 [email protected] Mining
THAILAND Mayuree CHOWVIKRAN Head of Research (66) 2658 6300 ext 1440 [email protected] Strategy
Maria BRENDA SANCHEZ LAPIZ Co-Head of Research Dir (66) 2257 0250 | (66) 2658 6300 ext 1399 [email protected]
Andrew STOTZ Strategist (66) 2658 6300 ext 5091 [email protected]
Suttatip PEERASUB (66) 2658 6300 ext 1430 [email protected] Media Commerce Sutthichai KUMWORACHAI (66) 2658 6300 ext 1400 [email protected] Energy Petrochem Termporn TANTIVIVAT (66) 2658 6300 ext 1520 [email protected] Property Woraphon WIROONSRI (66) 2658 6300 ext 1560 [email protected] Banking & Finance Jaroonpan WATTANAWONG (66) 2658 6300 ext 1404 [email protected] Transportation Small cap. Suchot THIRAWANNARAT (66) 2658 6300 ext 1550 [email protected] Automotive Construction Materials Soft commodity
VIETNAM Michael KOKALARI, CFA Head of Research +84 838 38 66 47 [email protected] Strategy Nguyen Thi Ngan Tuyen +84 844 55 58 88 x 8081 [email protected] Food and Beverage Oil and Gas Ngo Bich Van +84 844 55 58 88 x 8084 [email protected] Banking Nguyen Quang Duy +84 844 55 58 88 x 8082 [email protected] Rubber Dang Thi Kim Thoa +84 844 55 58 88 x 8083 [email protected] Consumer Nguyen Trung Hoa +84 844 55 58 88 x 8088 [email protected] Steel Sugar Macro

30 July 2012
Regional Daily
APPENDIX I: TERMS FOR PROVISION OF REPORT, DISCLAIMERS AND DISCLOSURES DISCLAIMERS This research report is prepared for general circulation and for information purposes only and under no circumstances should it be considered or intended as an offer to sell or a solicitation of an offer to buy the securities referred to herein. Investors should note that values of such securities, if any, may fluctuate and that each security’s price or value may rise or fall. Opinions or recommendations contained herein are in form of technical ratings and fundamental ratings. Technical ratings may differ from fundamental ratings as technical valuations apply different methodologies and are purely based on price and volume-related information extracted from the relevant jurisdiction’s stock exchange in the equity analysis. Accordingly, investors’ returns may be less than the original sum invested. Past performance is not necessarily a guide to future performance. This report is not intended to provide personal investment advice and does not take into account the specific investment objectives, the financial situation and the particular needs of persons who may receive or read this report. Investors should therefore seek financial, legal and other advice regarding the appropriateness of investing in any securities or the investment strategies discussed or recommended in this report. The information contained herein has been obtained from sources believed to be reliable but such sources have not been independently verified by Maybank Investment Bank Berhad, its subsidiary and affiliates (collectively, “MKE”) and consequently no representation is made as to the accuracy or completeness of this report by MKE and it should not be relied upon as such. Accordingly, MKE and its officers, directors, associates, connected parties and/or employees (collectively, “Representatives”) shall not be liable for any direct, indirect or consequential losses or damages that may arise from the use or reliance of this report. Any information, opinions or recommendations contained herein are subject to change at any time, without prior notice. This report may contain forward looking statements which are often but not always identified by the use of words such as “anticipate”, “believe”, “estimate”, “intend”, “plan”, “expect”, “forecast”, “predict” and “project” and statements that an event or result “may”, “will”, “can”, “should”, “could” or “might” occur or be achieved and other similar expressions. Such forward looking statements are based on assumptions made and information currently available to us and are subject to certain risks and uncertainties that could cause the actual results to differ materially from those expressed in any forward looking statements. Readers are cautioned not to place undue relevance on these forward-looking statements. MKE expressly disclaims any obligation to update or revise any such forward looking statements to reflect new information, events or circumstances after the date of this publication or to reflect the occurrence of unanticipated events. MKE and its officers, directors and employees, including persons involved in the preparation or issuance of this report, may, to the extent permitted by law, from time to time participate or invest in financing transactions with the issuer(s) of the securities mentioned in this report, perform services for or solicit business from such issuers, and/or have a position or holding, or other material interest, or effect transactions, in such securities or options thereon, or other investments related thereto. In addition, it may make markets in the securities mentioned in the material presented in this report. MKE may, to the extent permitted by law, act upon or use the information presented herein, or the research or analysis on which they are based, before the material is published. One or more directors, officers and/or employees of MKE may be a director of the issuers of the securities mentioned in this report. This report is prepared for the use of MKE’s clients and may not be reproduced, altered in any way, transmitted to, copied or distributed to any other party in whole or in part in any form or manner without the prior express written consent of MKE and MKE and its Representatives accepts no liability whatsoever for the actions of third parties in this respect. This report is not directed to or intended for distribution to or use by any person or entity who is a citizen or resident of or located in any locality, state, country or other jurisdiction where such distribution, publication, availability or use would be contrary to law or regulation. This report is for distribution only under such circumstances as may be permitted by applicable law. The securities described herein may not be eligible for sale in all jurisdictions or to certain categories of investors. Without prejudice to the foregoing, the reader is to note that additional disclaimers, warnings or qualifications may apply based on geographical location of the person or entity receiving this report. Malaysia Opinions or recommendations contained herein are in the form of technical ratings and fundamental ratings. Technical ratings may differ from fundamental ratings as technical valuations apply different methodologies and are purely based on price and volume-related information extracted from Bursa Malaysia Securities Berhad in the equity analysis. Singapore
This report has been produced as of the date hereof and the information herein may be subject to change. Maybank Kim Eng Research Pte. Ltd. (“Maybank KERPL”) in Singapore has no obligation to update such information for any recipient. For distribution in Singapore, recipients of this report are to contact Maybank KERPL in Singapore in respect of any matters arising from, or in connection with, this report. If the recipient of this report is not an accredited investor, expert investor or institutional investor (as defined under Section 4A of the Singapore Securities and Futures Act), Maybank KERPL shall be legally liable for the contents of this report, with such liability being limited to the extent (if any) as permitted by law. Thailand The disclosure of the survey result of the Thai Institute of Directors Association (“IOD”) regarding corporate governance is made pursuant to the policy of the Office of the Securities and Exchange Commission. The survey of the IOD is based on the information of a company listed on the Stock Exchange of Thailand and the market for Alternative Investment disclosed to the public and able to be accessed by a general public investor. The result, therefore, is from the perspective of a third party. It is not an evaluation of operation and is not based on inside information. The survey result is as of the date appearing in the Corporate Governance Report of Thai Listed Companies. As a result, the survey may be changed after that date. Maybank Kim Eng Securities (Thailand) Public Company Limited (“MBKET”) does not confirm nor certify the accuracy of such survey result. Except as specifically permitted, no part of this presentation may be reproduced or distributed in any manner without the prior written permission of MBKET. MBKET accepts no liability whatsoever for the actions of third parties in this respect. US
This research report prepared by MKE is distributed in the United States (“US”) to Major US Institutional Investors (as defined in Rule 15a-6 under the Securities Exchange Act of 1934, as amended) only by Maybank Kim Eng Securities USA Inc (“Maybank KESUSA”), a broker-dealer registered in the US (registered under Section 15 of the Securities Exchange Act of 1934, as amended). All responsibility for the distribution of this report by Maybank KESUSA in the US shall be borne by Maybank KESUSA. All resulting transactions by a US person or entity should be effected through a registered broker-dealer in the US. This report is not directed at you if MKE is prohibited or restricted by any legislation or regulation in any jurisdiction from making it available to you. You should satisfy yourself before reading it that Maybank KESUSA is permitted to provide research material concerning investments to you under relevant legislation and regulations. UK This document is being distributed by Maybank Kim Eng Securities (London) Ltd (“Maybank KESL”) which is authorized and regulated, by the Financial Services Authority and is for Informational Purposes only. This document is not intended for distribution to anyone defined as a Retail Client under the Financial Services and Markets Act 2000 within the UK. Any inclusion of a third party link is for the recipients convenience only, and that the firm does not take any responsibility for its comments or accuracy, and that access to such links is at the individuals own risk. Nothing in this report should be considered as constituting legal, accounting or tax advice, and that for accurate guidance recipients should consult with their own independent tax advisers.

30 July 2012
Regional Daily
DISCLOSURES Legal Entities Disclosures Malaysia: This report is issued and distributed in Malaysia by Maybank Investment Bank Berhad (15938-H) which is a Participating Organization of Bursa Malaysia Berhad and a holder of Capital Markets and Services License issued by the Securities Commission in Malaysia. Singapore: This material is issued and distributed in Singapore by Maybank KERPL (Co. Reg No 197201256N) which is regulated by the Monetary Authority of Singapore. Indonesia: PT Kim Eng Securities (“PTKES”) (Reg. No. KEP-251/PM/1992) is a member of the Indonesia Stock Exchange and is regulated by the BAPEPAM LK. Thailand: MBKET (Reg. No.0107545000314) is a member of the Stock Exchange of Thailand and is regulated by the Ministry of Finance and the Securities and Exchange Commission. Philippines: MATRKES (Reg. No.01-2004-00019) is a member of the Philippines Stock Exchange and is regulated by the Securities and Exchange Commission. Vietnam: Kim Eng Vietnam Securities Company (“KEVS”) (License Number: 71/UBCK-GP) is licensed under the State Securities Commission of Vietnam. Hong Kong: KESHK (Central Entity No AAD284) is regulated by the Securities and Futures Commission. India: Kim Eng Securities India Private Limited (“KESI”) is a participant of the National Stock Exchange of India Limited (Reg No: INF/INB 231452435) and the Bombay Stock Exchange (Reg. No. INF/INB 011452431) and is regulated by Securities and Exchange Board of India. KESI is also registered with SEBI as Category 1 Merchant Banker (Reg. No. INM 000011708) US: Maybank KESUSA is a member of/ and is authorized and regulated by the FINRA – Broker ID 27861. UK: Maybank KESL (Reg No 2377538) is authorized and regulated by the Financial Services Authority. Disclosure of Interest Malaysia: MKE and its Representatives may from time to time have positions or be materially interested in the securities referred to herein and may further act as market maker or may have assumed an underwriting commitment or deal with such securities and may also perform or seek to perform investment banking services, advisory and other services for or relating to those companies. Singapore: "Singapore: As of 27 July 2012, Maybank KERPL does not have any interest in any companies recommended in this research report. The covering analyst has an interest in the company recommended in this research report." Thailand: MBKET may have a business relationship with or may possibly be an issuer of derivative warrants on the securities /companies mentioned in the research report. Therefore, Investors should exercise their own judgment before making any investment decisions. MBKET, its associates, directors, connected parties and/or employees may from time to time have interests and/or underwriting commitments in the securities mentioned in this report. Hong Kong: KESHK may have financial interests in relation to an issuer or a new listing applicant referred to as defined by the requirements under Paragraph 16.5(a) of the Hong Kong Code of Conduct for Persons Licensed by or Registered with the Securities and Futures Commission.
As of 30 July 2012, KESHK and the authoring analyst do not have any interest in any companies recommended in this research report.
MKE may have, within the last three years, served as manager or co-manager of a public offering of securities for, or currently may make a primary market in issues of, any or all of the entities mentioned in this report or may be providing, or have provided within the previous 12 months, significant advice or investment services in relation to the investment concerned or a related investment. OTHERS Analyst Certification of Independence The views expressed in this research report accurately reflect the analyst’s personal views about any and all of the subject securities or issuers; and no part of the research analyst’s compensation was, is or will be, directly or indirectly, related to the specific recommendations or views expressed in the report. Reminder Structured securities are complex instruments, typically involve a high degree of risk and are intended for sale only to sophisticated investors who are capable of understanding and assuming the risks involved. The market value of any structured security may be affected by changes in economic, financial and political factors (including, but not limited to, spot and forward interest and exchange rates), time to maturity, market conditions and volatility and the credit quality of any issuer or reference issuer. Any investor interested in purchasing a structured product should conduct its own analysis of the product and consult with its own professional advisers as to the risks involved in making such a purchase. No part of this material may be copied, photocopied or duplicated in any form by any means or redistributed without the prior consent of MKE.
Definition of Ratings Maybank Kim Eng Research uses the following rating system: BUY Total return is expected to be above 15% in the next 12 months HOLD Total return is expected to be between -15% to +15% in the next 12 months SELL Total return is expected to be below -15% in the next 12 months
Applicability of Ratings The respective analyst maintains a coverage universe of stocks, the list of which may be adjusted according to needs. Investment ratings are only applicable to the stocks which form part of the coverage universe. Reports on companies which are not part of the coverage do not carry investment ratings as we do not actively follow developments in these companies.
Some common terms abbreviated in this report (where they appear): Adex = Advertising Expenditure FCF = Free Cashflow PE = Price Earnings BV = Book Value FV = Fair Value PEG = PE Ratio To Growth CAGR = Compounded Annual Growth Rate FY = Financial Year PER = PE Ratio Capex = Capital Expenditure FYE = Financial Year End QoQ = Quarter-On-Quarter CY = Calendar Year MoM = Month-On-Month ROA = Return On Asset DCF = Discounted Cashflow NAV = Net Asset Value ROE = Return On Equity DPS = Dividend Per Share
NTA = Net Tangible Asset ROSF = Return On Shareholders’ Funds EBIT = Earnings Before Interest And Tax P = Price WACC = Weighted Average Cost Of Capital EBITDA = EBIT, Depreciation And Amortisation P.A. = Per Annum YoY = Year-On-Year EPS = Earnings Per Share PAT = Profit After Tax YTD = Year-To-Date EV = Enterprise Value PBT = Profit Before Tax
30 July 2012
Regional Daily
Malaysia Maybank Investment Bank Berhad (A Participating Organisation of Bursa Malaysia Securities Berhad) 33rd Floor, Menara Maybank, 100 Jalan Tun Perak, 50050 Kuala Lumpur Tel: (603) 2059 1888; Fax: (603) 2078 4194
Singapore Maybank Kim Eng Securities Pte Ltd Maybank Kim Eng Research Pte Ltd 9 Temasek Boulevard #39-00 Suntec Tower 2 Singapore 038989 Tel: (65) 6336 9090 Fax: (65) 6339 6003
London Maybank Kim Eng Securities (London) Ltd 6/F, 20 St. Dunstan’s Hill London EC3R 8HY, UK Tel: (44) 20 7621 9298 Dealers’ Tel: (44) 20 7626 2828 Fax: (44) 20 7283 6674
New York Maybank Kim Eng Securities USA Inc 777 Third Avenue, 21st Floor New York, NY 10017, U.S.A. Tel: (212) 688 8886 Fax: (212) 688 3500
Stockbroking Business: Level 8, Tower C, Dataran Maybank, No.1, Jalan Maarof 59000 Kuala Lumpur Tel: (603) 2297 8888 Fax: (603) 2282 5136
Hong Kong Kim Eng Securities (HK) Ltd Level 30, Three Pacific Place, 1 Queen’s Road East, Hong Kong Tel: (852) 2268 0800 Fax: (852) 2877 0104
Indonesia PT Kim Eng Securities Plaza Bapindo Citibank Tower 17th Floor Jl Jend. Sudirman Kav. 54-55 Jakarta 12190, Indonesia
Tel: (62) 21 2557 1188 Fax: (62) 21 2557 1189
India Kim Eng Securities India Pvt Ltd 2nd Floor, The International 16, Maharishi Karve Road, Churchgate Station, Mumbai City - 400 020, India Tel: (91).22.6623.2600 Fax: (91).22.6623.2604
Philippines Maybank ATR Kim Eng Securities Inc. 17/F, Tower One & Exchange Plaza Ayala Triangle, Ayala Avenue Makati City, Philippines 1200 Tel: (63) 2 849 8888 Fax: (63) 2 848 5738
Thailand Maybank Kim Eng Securities (Thailand) Public Company Limited 999/9 The Offices at Central World, 20th - 21st Floor, Rama 1 Road Pathumwan, Bangkok 10330, Thailand Tel: (66) 2 658 6817 (sales) Tel: (66) 2 658 6801 (research)
Vietnam In association with Kim Eng Vietnam Securities Company 1st Floor, 255 Tran Hung Dao St. District 1 Ho Chi Minh City, Vietnam Tel : (84) 838 38 66 36 Fax : (84) 838 38 66 39
Saudi Arabia In association with Anfaal Capital Villa 47, Tujjar Jeddah Prince Mohammed bin Abdulaziz Street P.O. Box 126575 Jeddah 21352 Tel: (966) 2 6068686 Fax: (966) 26068787
South Asia Sales Trading Connie TAN [email protected] Tel: (65) 6333 5775 US Toll Free: 1 866 406 7447
North Asia Sales Trading Eddie LAU [email protected] Tel: (852) 2268 0800 US Toll Free: 1 866 598 2267
www.maybank-ke.com | www.kimengresearch.com


