
Regional IPM Centers Survey A Preliminary Summary Carol Pilcher Department of Entomology Iowa State...
38
Regional IPM Centers Survey A Preliminary Summary Carol Pilcher Department of Entomology Iowa State University
-
Upload
marsha-johnston -
Category
Documents
-
view
215 -
download
0
Transcript of Regional IPM Centers Survey A Preliminary Summary Carol Pilcher Department of Entomology Iowa State...
Regional IPM Centers SurveyA Preliminary Summary
Carol PilcherDepartment of Entomology
Iowa State University

• Where Are We In the Process?• Methodology• Preliminary Results• Questions For You• Questions For Me
Where We Are In the Process
• Summary Document Sent to Dick Stuckey (January 18, 2006)
– He will review summary document and develop the final report for the IPM Center Mid-Term Review
– Please note the results presented here are the preliminary results
Methodology
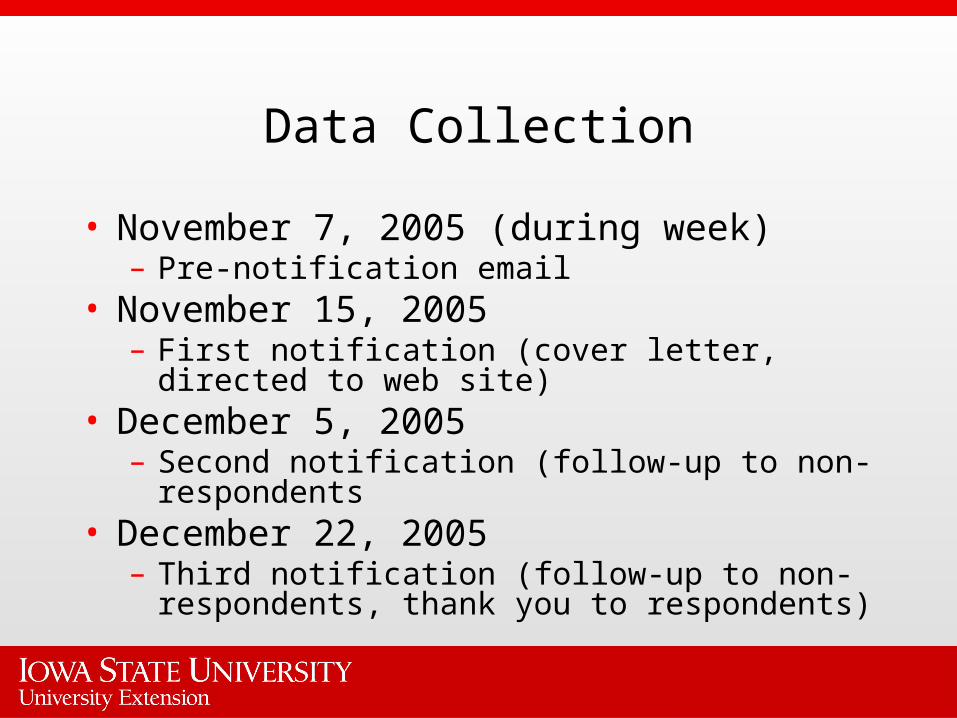
Data Collection
• November 7, 2005 (during week)– Pre-notification email
• November 15, 2005– First notification (cover letter, directed to
web site)• December 5, 2005
– Second notification (follow-up to non-respondents
• December 22, 2005– Third notification (follow-up to non-
respondents, thank you to respondents)
Response Rate
• 135 individuals• 97 individuals responded to survey• 71.8% response rate
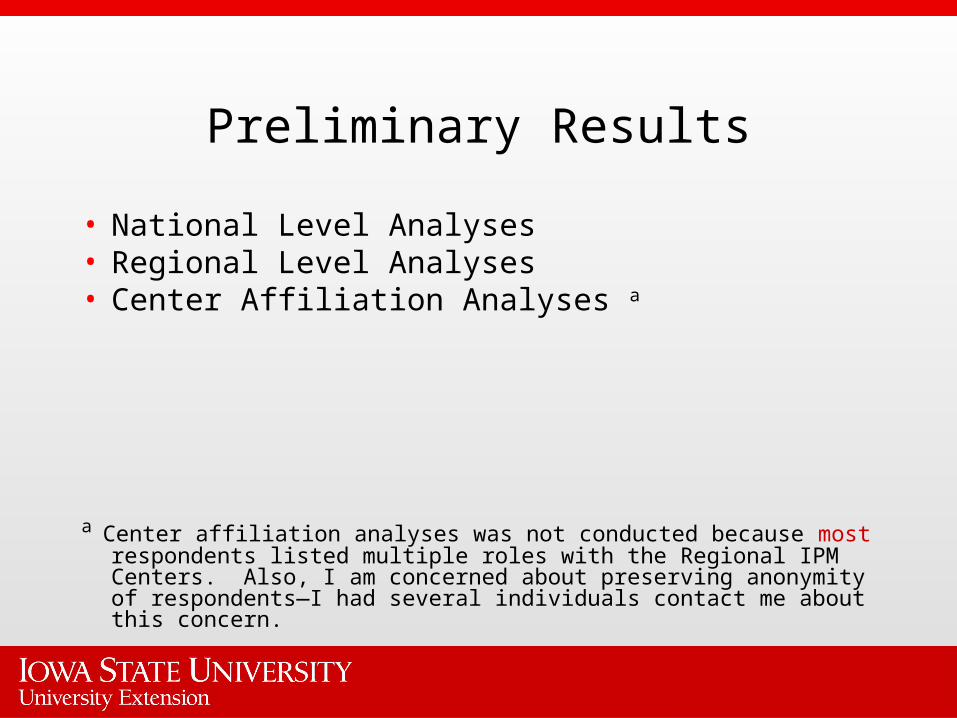
Preliminary Results
• National Level Analyses• Regional Level Analyses• Center Affiliation Analyses a
a Center affiliation analyses was not conducted because most respondents listed multiple roles with the Regional IPM Centers. Also, I am concerned about preserving anonymity of respondents—I had several individuals contact me about this concern.

National Level Analyses
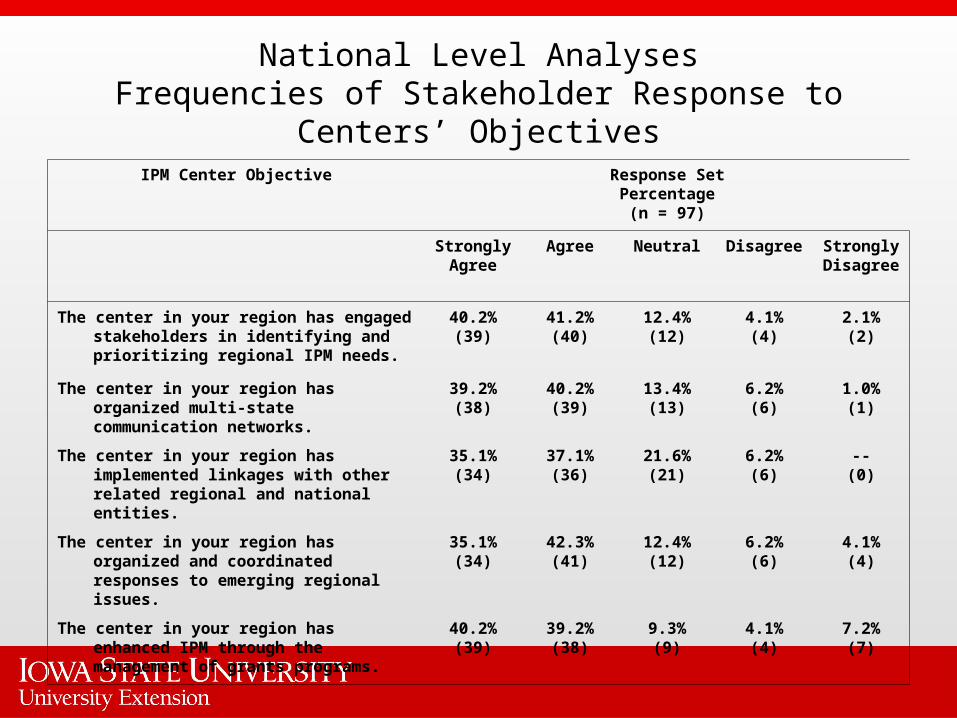
National Level AnalysesFrequencies of Stakeholder Response to Centers’
ObjectivesIPM Center Objective Response Set
Percentage(n = 97)
StronglyAgree
Agree Neutral Disagree StronglyDisagree
The center in your region has engaged stakeholders in identifying and prioritizing regional IPM needs.
40.2%(39)
41.2%(40)
12.4%(12)
4.1%(4)
2.1%(2)
The center in your region has organized multi-state communication networks.
39.2%(38)
40.2%(39)
13.4%(13)
6.2%(6)
1.0%(1)
The center in your region has implemented linkages with other related regional and national entities.
35.1%(34)
37.1%(36)
21.6%(21)
6.2%(6)
--(0)
The center in your region has organized and coordinated responses to emerging regional issues.
35.1%(34)
42.3%(41)
12.4%(12)
6.2%(6)
4.1%(4)
The center in your region has enhanced IPM through the management of grants programs.
40.2%(39)
39.2%(38)
9.3%(9)
4.1%(4)
7.2%(7)
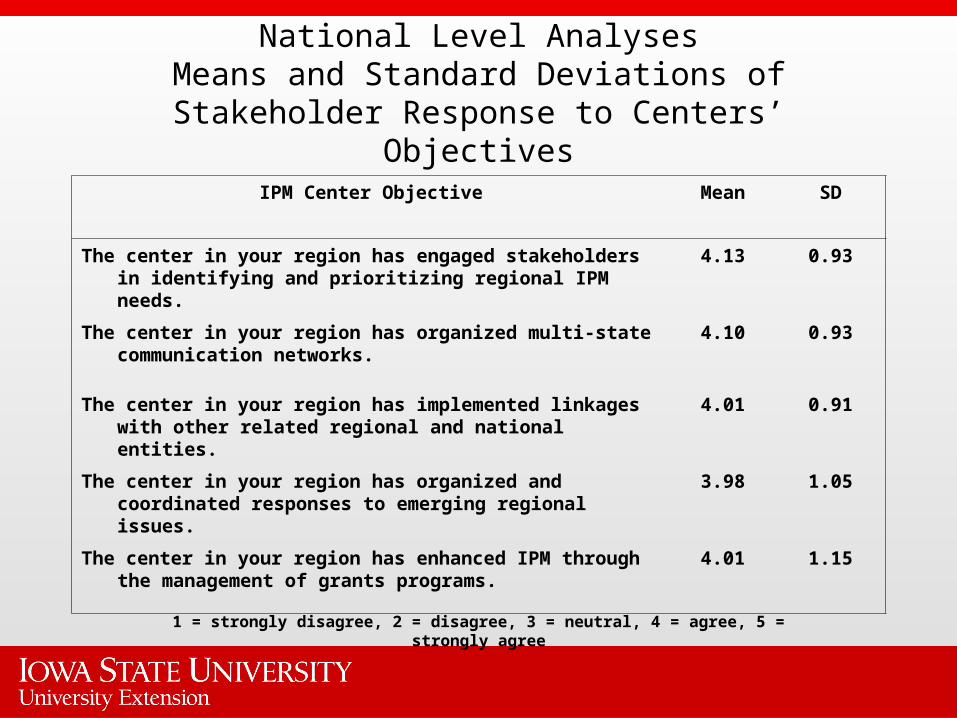
National Level AnalysesMeans and Standard Deviations of Stakeholder
Response to Centers’ Objectives
IPM Center Objective Mean SD
The center in your region has engaged stakeholders in identifying and prioritizing regional IPM needs.
4.13 0.93
The center in your region has organized multi-state communication networks.
4.10 0.93
The center in your region has implemented linkages with other related regional and national entities.
4.01 0.91
The center in your region has organized and coordinated responses to emerging regional issues.
3.98 1.05
The center in your region has enhanced IPM through the management of grants programs.
4.01 1.15
1 = strongly disagree, 2 = disagree, 3 = neutral, 4 = agree, 5 = strongly agree

Regional Level Analyses
IPM Center Objective Response SetPercentage
(n = 16)
Strongly Agree
Agree Neutral Disagree Strongly Disagree
The center in your region has engaged stakeholders in identifying and prioritizing regional IPM needs.
18.8%(3)
43.8%(7)
18.8%(3)
12.5%(2)
6.3%(1)
The center in your region has organized multi-state communication networks.
31.3%(5)
31.3%(5)
25.0%(4)
12.5%(2)
--(0)
The center in your region has implemented linkages with other related regional and national entities.
18.8%(3)
37.5%(6)
25.0%(4)
18.8%(3)
--(0)
The center in your region has organized and coordinated responses to emerging regional issues.
25.0%(4)
50.0%(8)
12.5%(2)
12.5%(2)
--(0)
The center in your region has enhanced IPM through the management of grants programs.
31.3%(5)
31.3%(5)
12.5%(2)
18.8%(3)
6.3%(1)
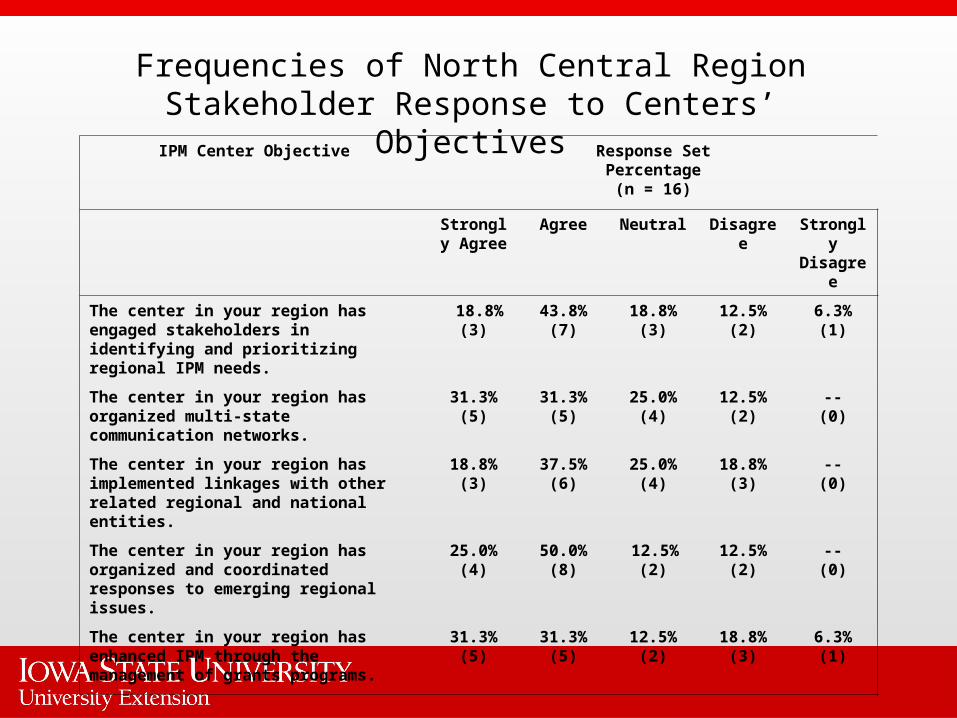
Frequencies of North Central Region Stakeholder Response to Centers’ Objectives
IPM Center Objective Response SetPercentage
(n = 31)
Strongly Agree
Agree Neutral Disagree Strongly Disagree
The center in your region has engaged stakeholders in identifying and prioritizing regional IPM needs.
51.6%(16)
32.3%(10)
9.7%(3)
3.2%(1)
3.2%(1)
The center in your region has organized multi-state communication networks.
54.8%(17)
22.6%(7)
12.9%(4)
6.5%(2)
3.2%(1)
The center in your region has implemented linkages with other related regional and national entities.
45.2%(14)
32.3%(10)
19.4%(6)
3.2%(1)
--(0)
The center in your region has organized and coordinated responses to emerging regional issues.
38.7%(12)
29.0%(9)
16.1%(5)
12.9%(4)
3.2%(1)
The center in your region has enhanced IPM through the management of grants programs.
45.2%(14)
32.3%(10)
6.5%(2)
3.2%(1)
12.9%(4)
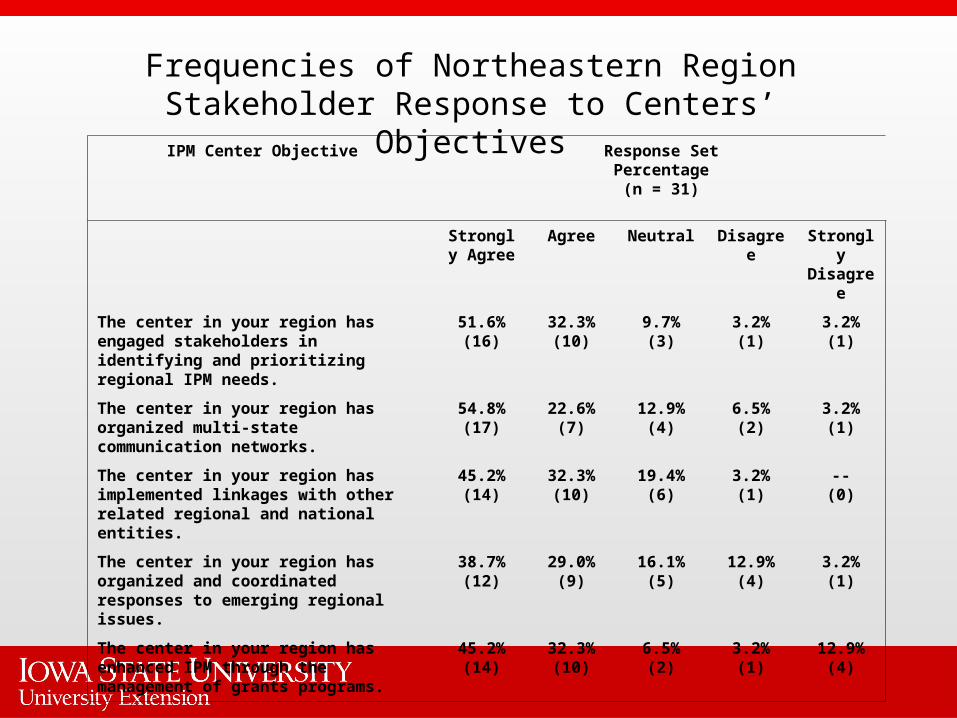
Frequencies of Northeastern Region Stakeholder Response to Centers’ Objectives
IPM Center Objective Response SetPercentage
(n = 29)
Strongly Agree
Agree Neutral Disagree Strongly Disagree
The center in your region has engaged stakeholders in identifying and prioritizing regional IPM needs.
27.6%(8)
58.6%(17)
10.3%(3)
3.4%(1)
--(0)
The center in your region has organized multi-state communication networks.
17.2%(5)
65.5%(19)
10.3%(3)
6.9%(2)
--(0)
The center in your region has implemented linkages with other related regional and national entities.
27.6%(8)
44.8%(13)
20.7%(6)
6.9%(2)
--(0)
The center in your region has organized and coordinated responses to emerging regional issues.
37.9%(11)
51.7%(15)
6.9%(2)
--(0)
3.4%(1)
The center in your region has enhanced IPM through the management of grants programs.
37.9%(11)
48.3%(14)
6.9%(2)
--(0)
6.9%(2)
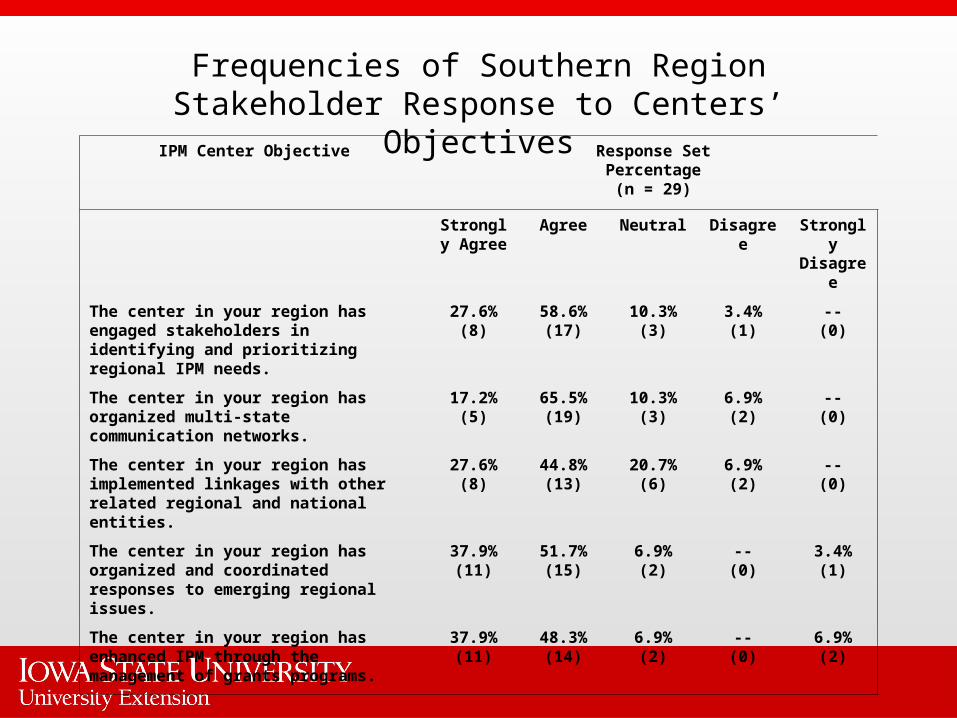
Frequencies of Southern Region Stakeholder Response to Centers’ Objectives
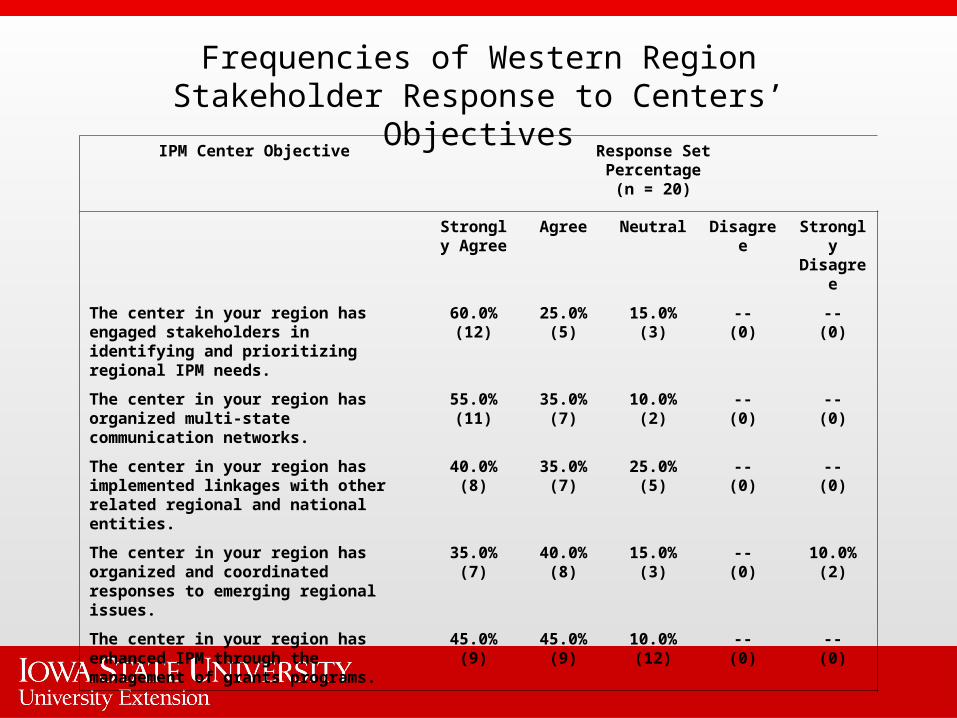
IPM Center Objective Response SetPercentage
(n = 20)
Strongly Agree
Agree Neutral Disagree Strongly Disagree
The center in your region has engaged stakeholders in identifying and prioritizing regional IPM needs.
60.0%(12)
25.0%(5)
15.0%(3)
--(0)
--(0)
The center in your region has organized multi-state communication networks.
55.0%(11)
35.0%(7)
10.0%(2)
--(0)
--(0)
The center in your region has implemented linkages with other related regional and national entities.
40.0%(8)
35.0%(7)
25.0%(5)
--(0)
--(0)
The center in your region has organized and coordinated responses to emerging regional issues.
35.0%(7)
40.0%(8)
15.0%(3)
--(0)
10.0%(2)
The center in your region has enhanced IPM through the management of grants programs.
45.0%(9)
45.0%(9)
10.0%(12)
--(0)
--(0)
Frequencies of Western Region Stakeholder Response to Centers’ Objectives
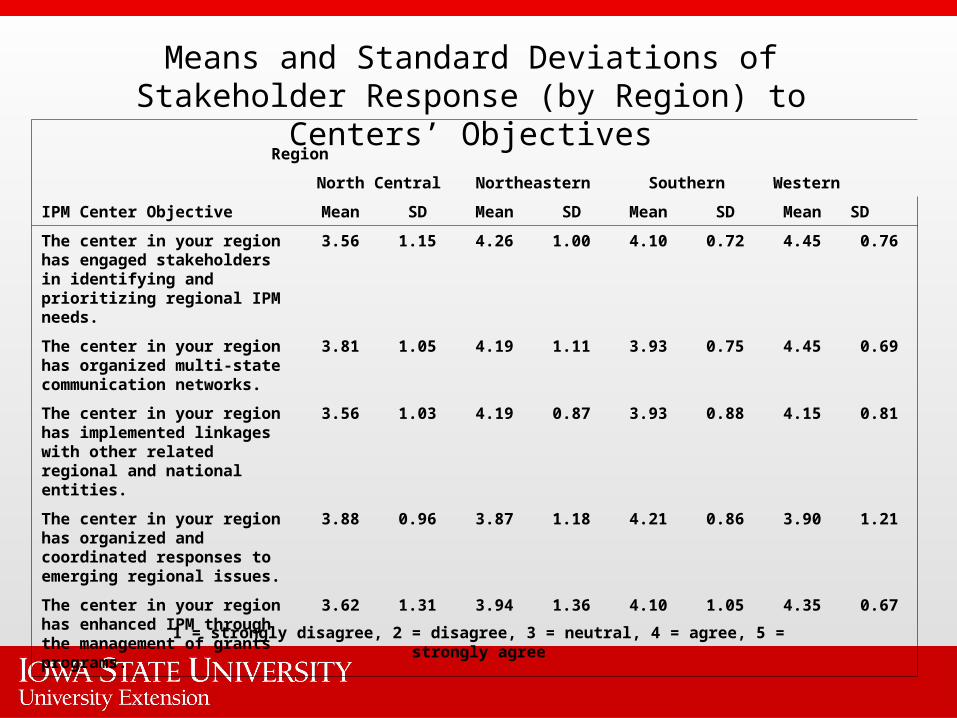
Region
North Central Northeastern Southern Western
IPM Center Objective Mean SD Mean SD Mean SD Mean SD
The center in your region has engaged stakeholders in identifying and prioritizing regional IPM needs.
3.56 1.15 4.26 1.00 4.10 0.72 4.45 0.76
The center in your region has organized multi-state communication networks.
3.81 1.05 4.19 1.11 3.93 0.75 4.45 0.69
The center in your region has implemented linkages with other related regional and national entities.
3.56 1.03 4.19 0.87 3.93 0.88 4.15 0.81
The center in your region has organized and coordinated responses to emerging regional issues.
3.88 0.96 3.87 1.18 4.21 0.86 3.90 1.21
The center in your region has enhanced IPM through the management of grants programs.
3.62 1.31 3.94 1.36 4.10 1.05 4.35 0.67
Means and Standard Deviations of Stakeholder Response (by Region) to Centers’ Objectives
1 = strongly disagree, 2 = disagree, 3 = neutral, 4 = agree, 5 = strongly agree
National Level AnalysesSelect Responses from Open-
ended Questions
For questions 1-5, I have provided
one slide with positive comments and one slide with areas for improvement
Has the Center in your region engaged stakeholders in
identifying and prioritizing regional IPM needs?
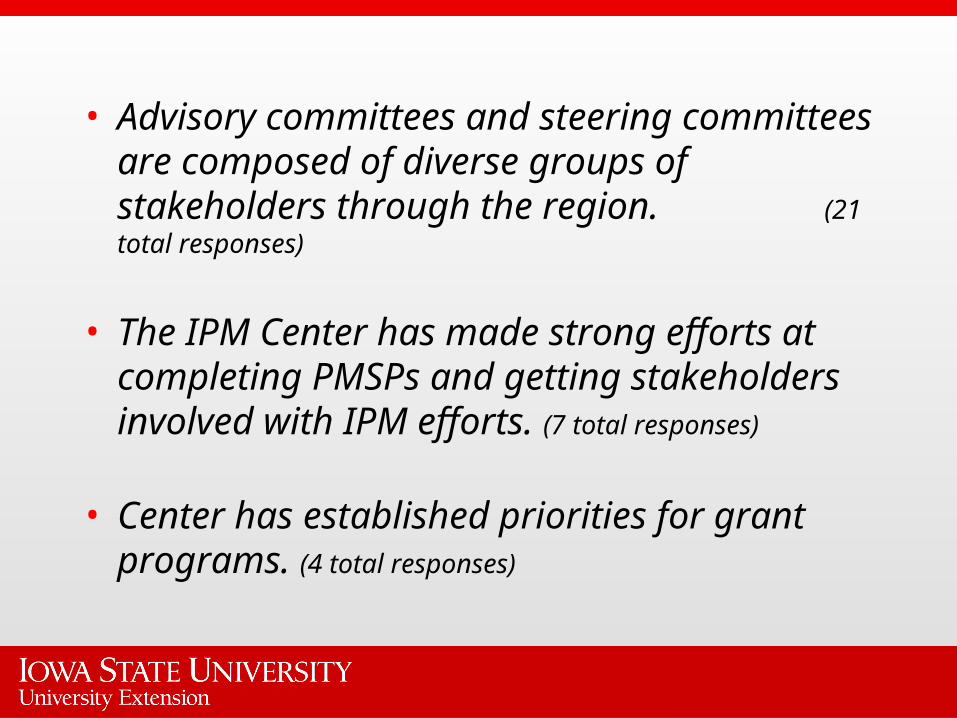
• Advisory committees and steering committees are composed of diverse groups of stakeholders through the region. (21 total responses)
• The IPM Center has made strong efforts at completing PMSPs and getting stakeholders involved with IPM efforts. (7 total responses)
• Center has established priorities for grant programs. (4 total responses)
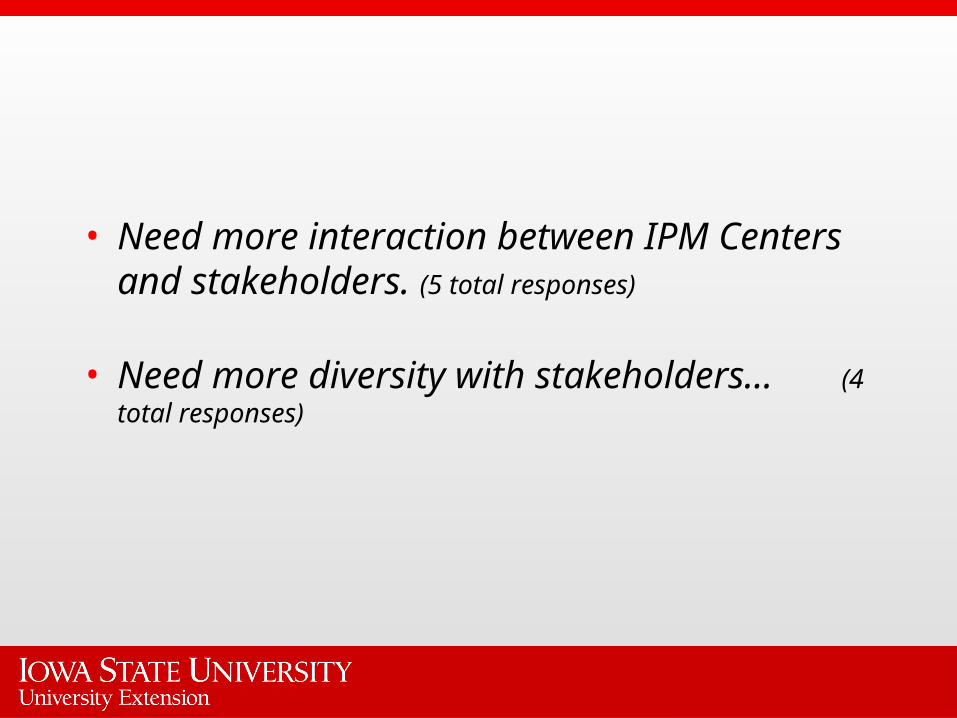
• Need more interaction between IPM Centers and stakeholders. (5 total responses)
• Need more diversity with stakeholders… (4 total responses)
Has the Center in your region organized multi-state
communication networks?
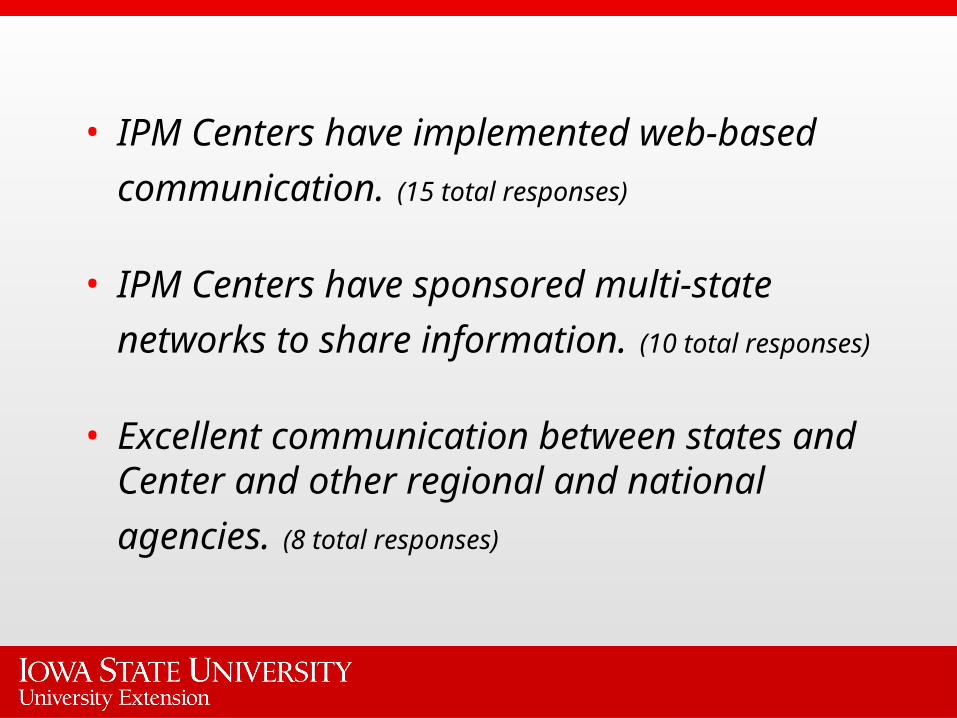
• IPM Centers have implemented web-
based communication. (15 total responses)
• IPM Centers have sponsored multi-state
networks to share information. (10 total responses)
• Excellent communication between states and Center and other regional
and national agencies. (8 total responses)
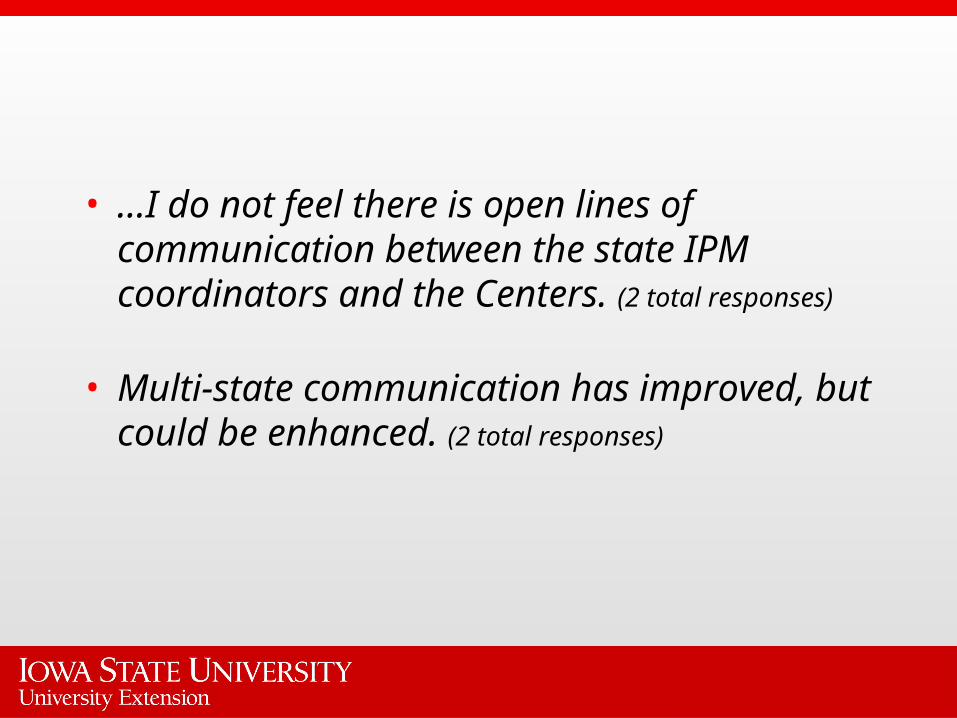
• …I do not feel there is open lines of communication between the state IPM coordinators and the Centers. (2 total responses)
• Multi-state communication has improved, but could be enhanced. (2 total responses)
Has the Center in your region implemented linkages with other
related regional and national entities?
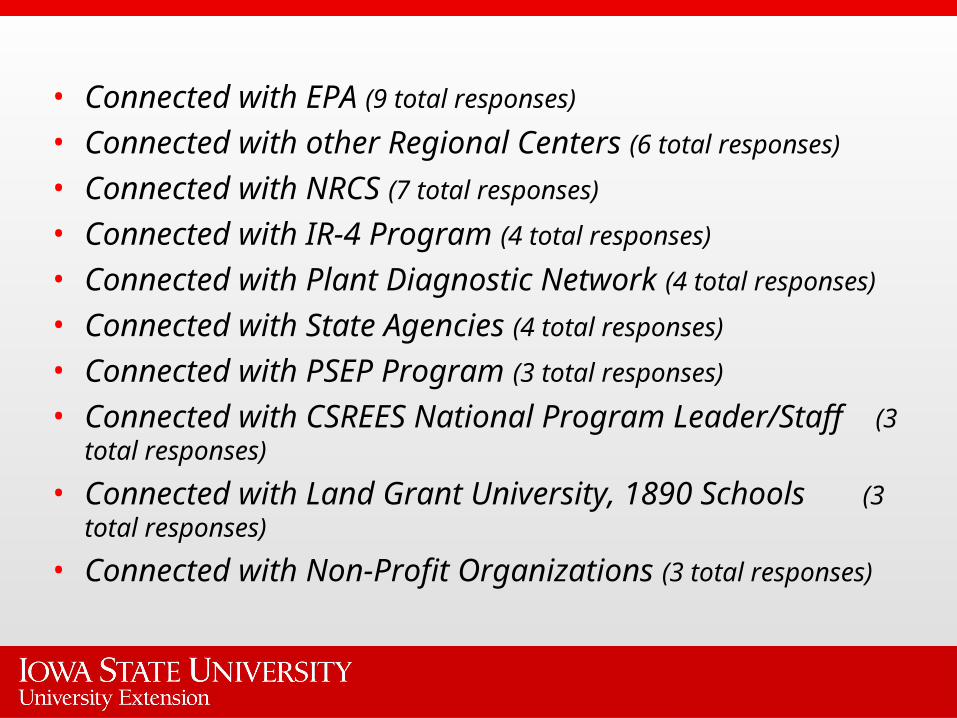
• Connected with EPA (9 total responses)
• Connected with other Regional Centers (6 total responses)
• Connected with NRCS (7 total responses)
• Connected with IR-4 Program (4 total responses)
• Connected with Plant Diagnostic Network (4 total responses)
• Connected with State Agencies (4 total responses)
• Connected with PSEP Program (3 total responses)
• Connected with CSREES National Program Leader/Staff (3 total responses)
• Connected with Land Grant University, 1890 Schools (3 total responses)
• Connected with Non-Profit Organizations (3 total responses)
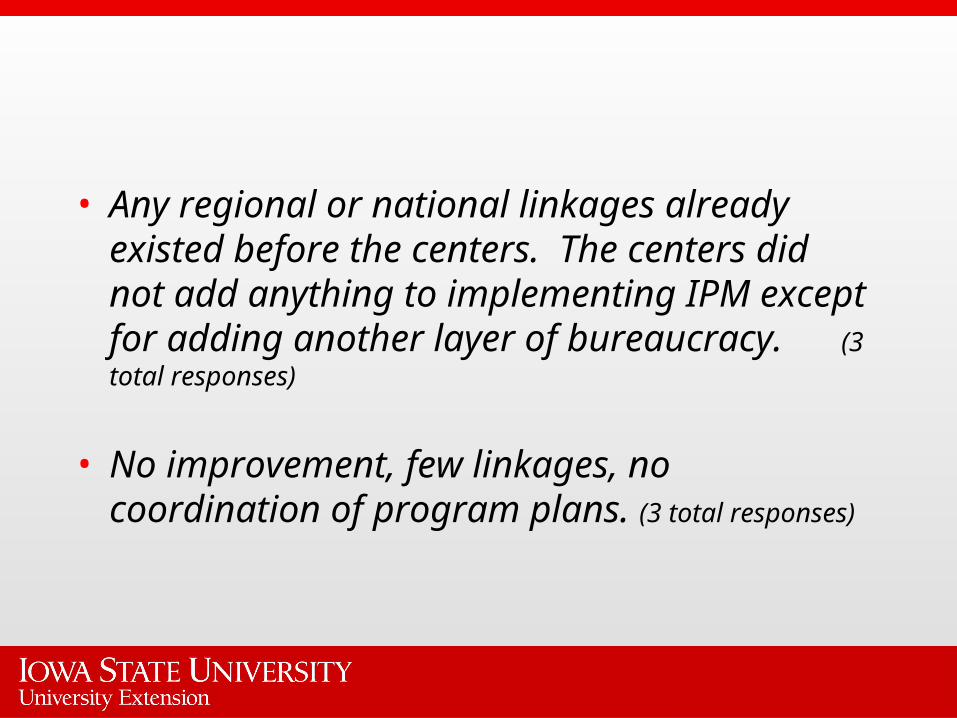
• Any regional or national linkages already existed before the centers. The centers did not add anything to implementing IPM except for adding another layer of bureaucracy. (3 total responses)
• No improvement, few linkages, no coordination of program plans. (3 total responses)
Has the Center in your region organized and coordinated
responses to emerging regional issues?
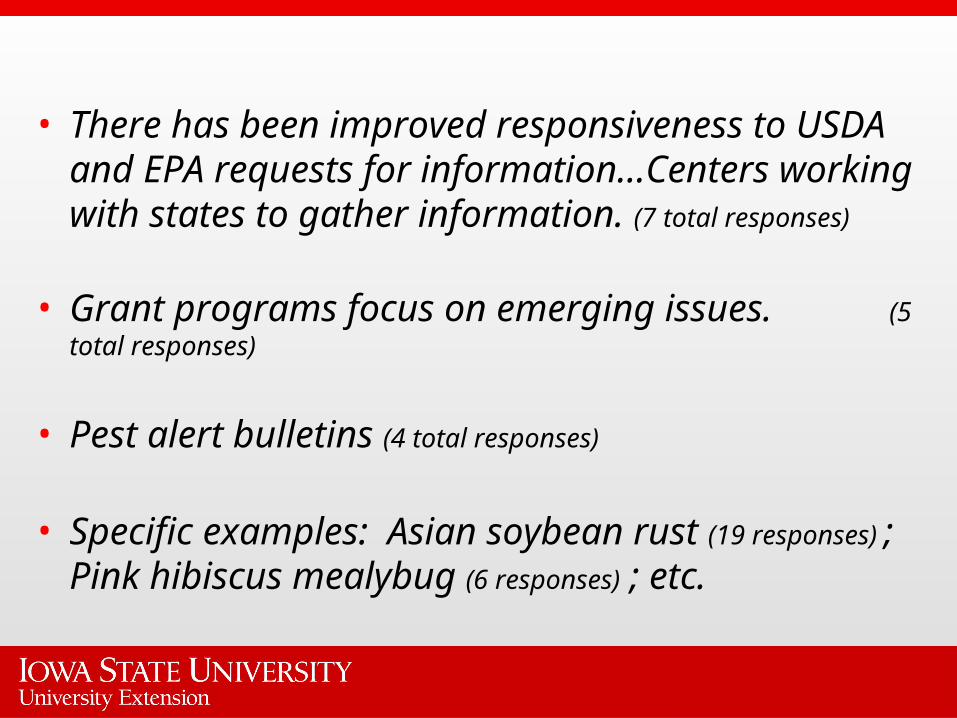
• There has been improved responsiveness to USDA and EPA requests for information…Centers working with states to gather information. (7 total responses)
• Grant programs focus on emerging issues. (5 total responses)
• Pest alert bulletins (4 total responses)
• Specific examples: Asian soybean rust (19
responses) ; Pink hibiscus mealybug (6 responses) ; etc.
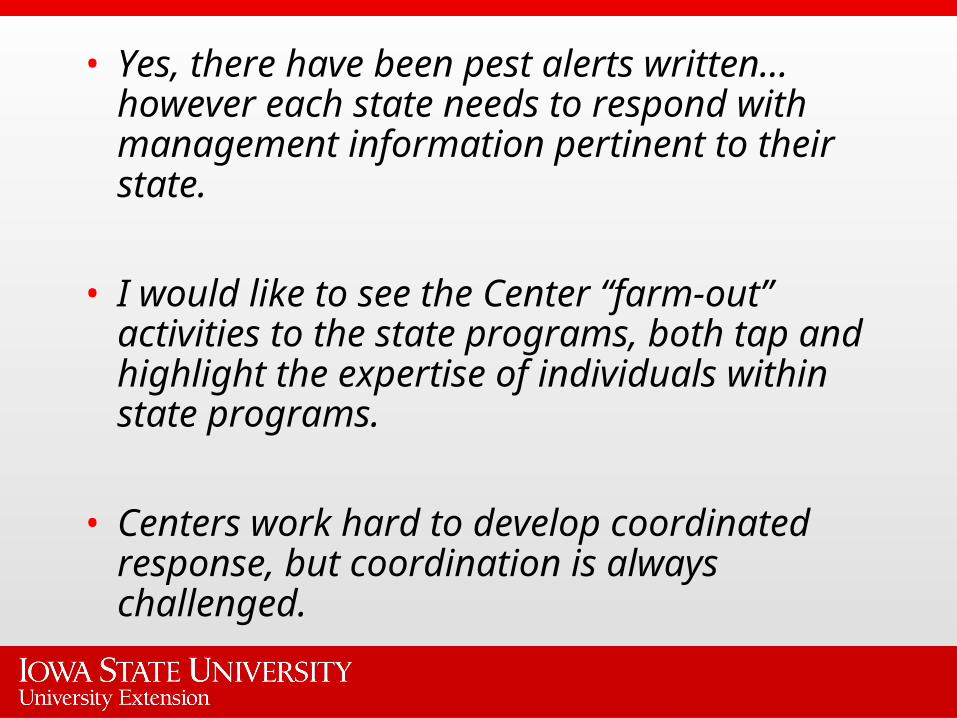
• Yes, there have been pest alerts written…however each state needs to respond with management information pertinent to their state.
• I would like to see the Center “farm-out” activities to the state programs, both tap and highlight the expertise of individuals within state programs.
• Centers work hard to develop coordinated response, but coordination is always challenged.
Has the Center in your region enhanced IPM approaches and
systems through the management of grants
programs?
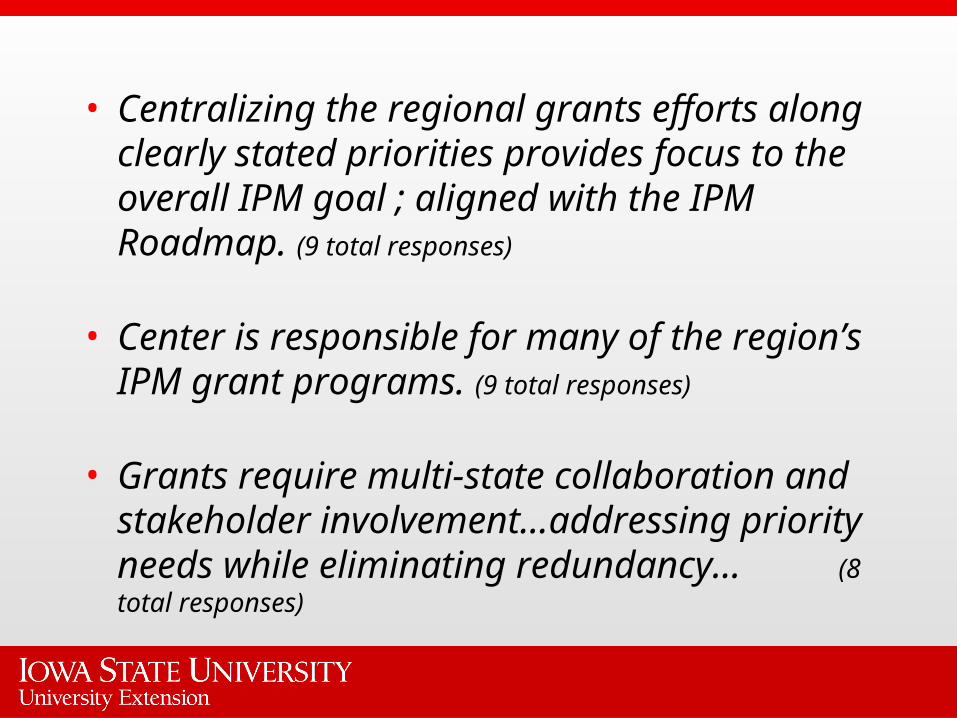
• Centralizing the regional grants efforts along clearly stated priorities provides focus to the overall IPM goal ; aligned with the IPM Roadmap. (9 total responses)
• Center is responsible for many of the region’s IPM grant programs. (9 total responses)
• Grants require multi-state collaboration and stakeholder involvement…addressing priority needs while eliminating redundancy… (8 total responses)
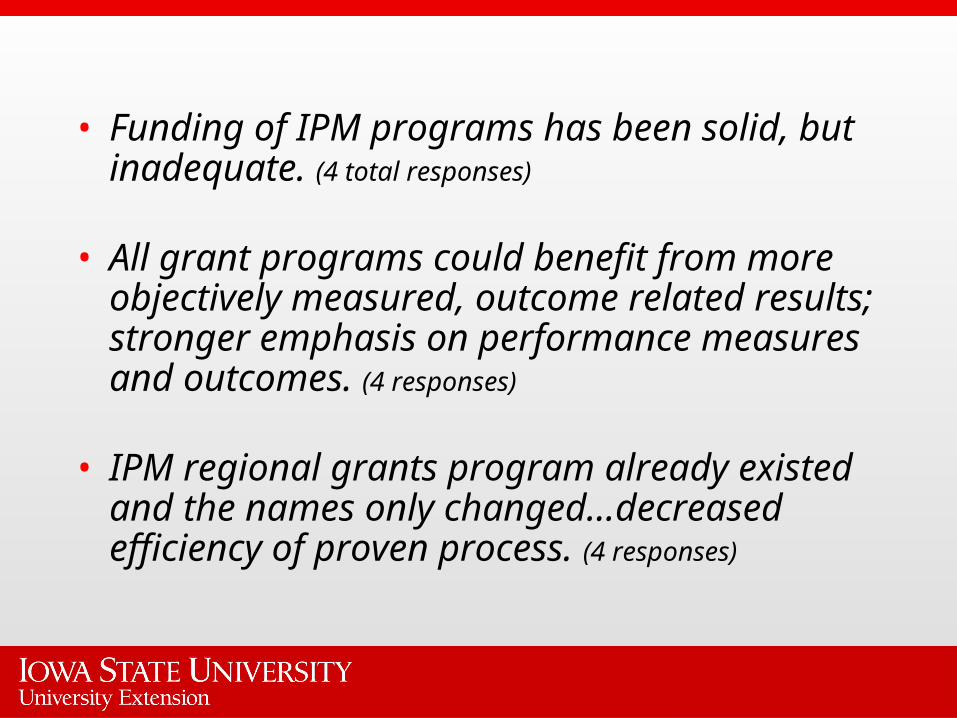
• Funding of IPM programs has been solid, but inadequate. (4 total responses)
• All grant programs could benefit from more objectively measured, outcome related results; stronger emphasis on performance measures and outcomes. (4 responses)
• IPM regional grants program already existed and the names only changed…decreased efficiency of proven process. (4 responses)
Are there any activities, programs, approaches or
practices that the Regional IPM Centers should consider
implementing?
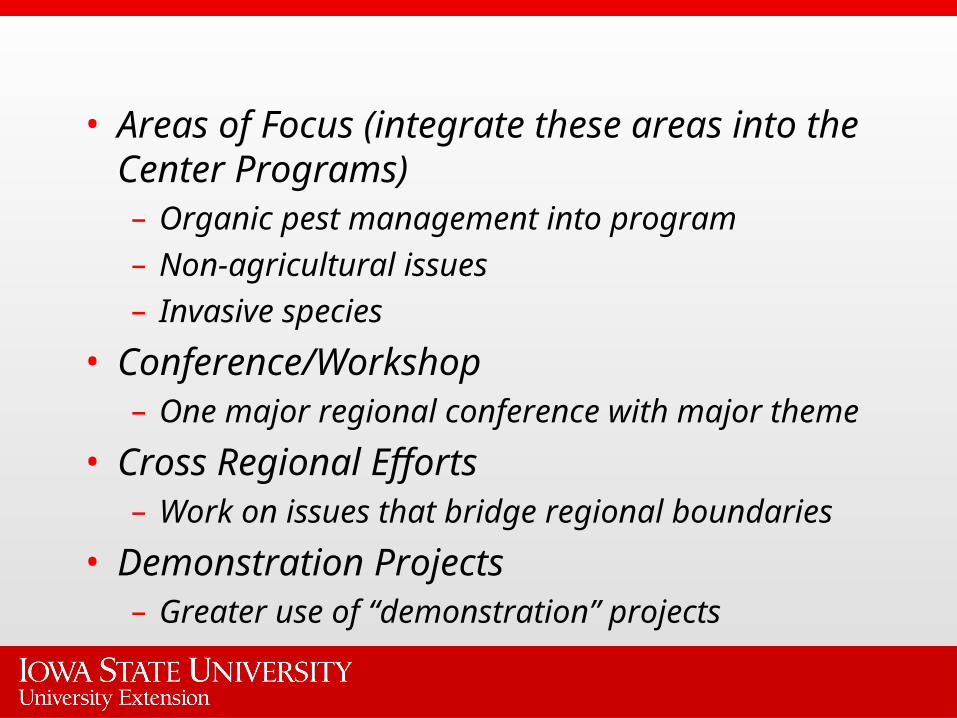
• Areas of Focus (integrate these areas into the Center Programs)– Organic pest management into program– Non-agricultural issues– Invasive species
• Conference/Workshop– One major regional conference with major
theme
• Cross Regional Efforts– Work on issues that bridge regional boundaries
• Demonstration Projects– Greater use of “demonstration” projects
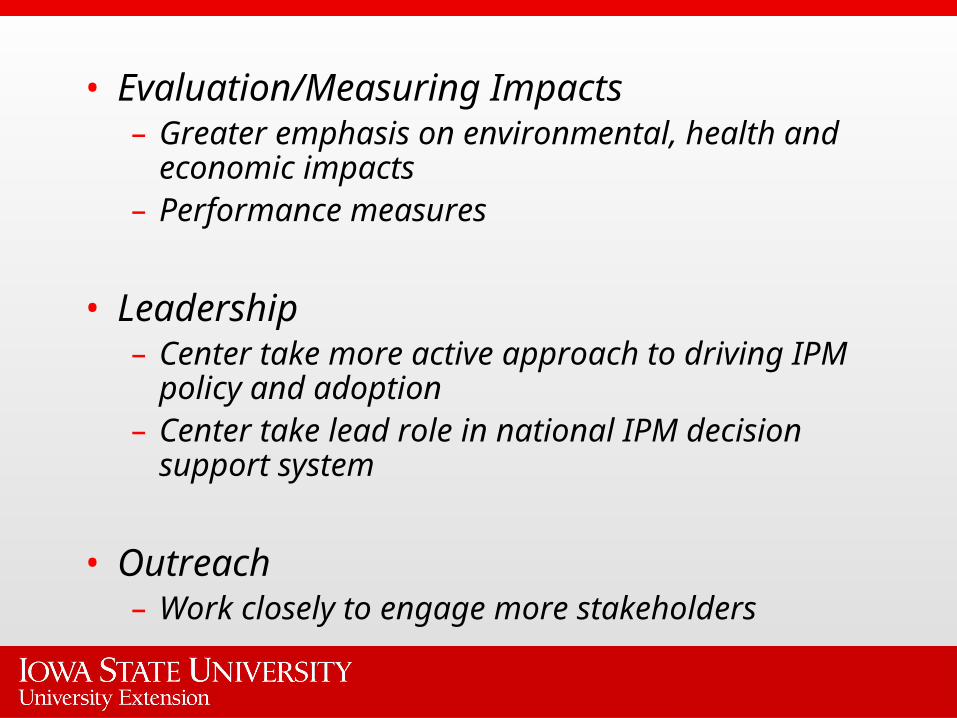
• Evaluation/Measuring Impacts– Greater emphasis on environmental, health
and economic impacts– Performance measures
• Leadership– Center take more active approach to driving
IPM policy and adoption– Center take lead role in national IPM
decision support system
• Outreach– Work closely to engage more stakeholders
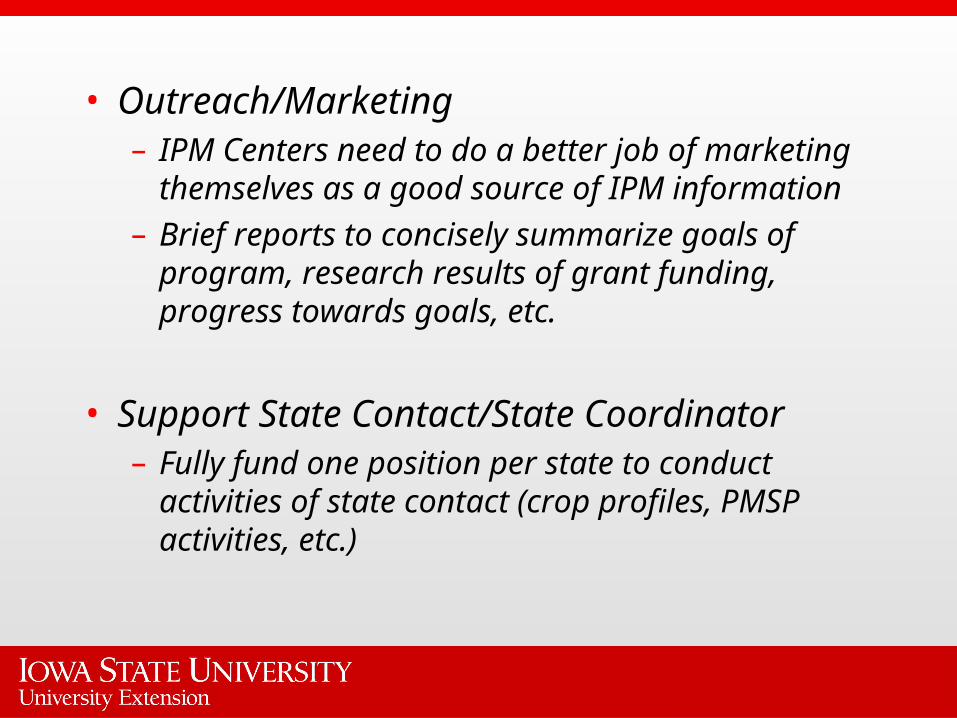
• Outreach/Marketing– IPM Centers need to do a better job of
marketing themselves as a good source of IPM information
– Brief reports to concisely summarize goals of program, research results of grant funding, progress towards goals, etc.
• Support State Contact/State Coordinator– Fully fund one position per state to conduct
activities of state contact (crop profiles, PMSP activities, etc.)
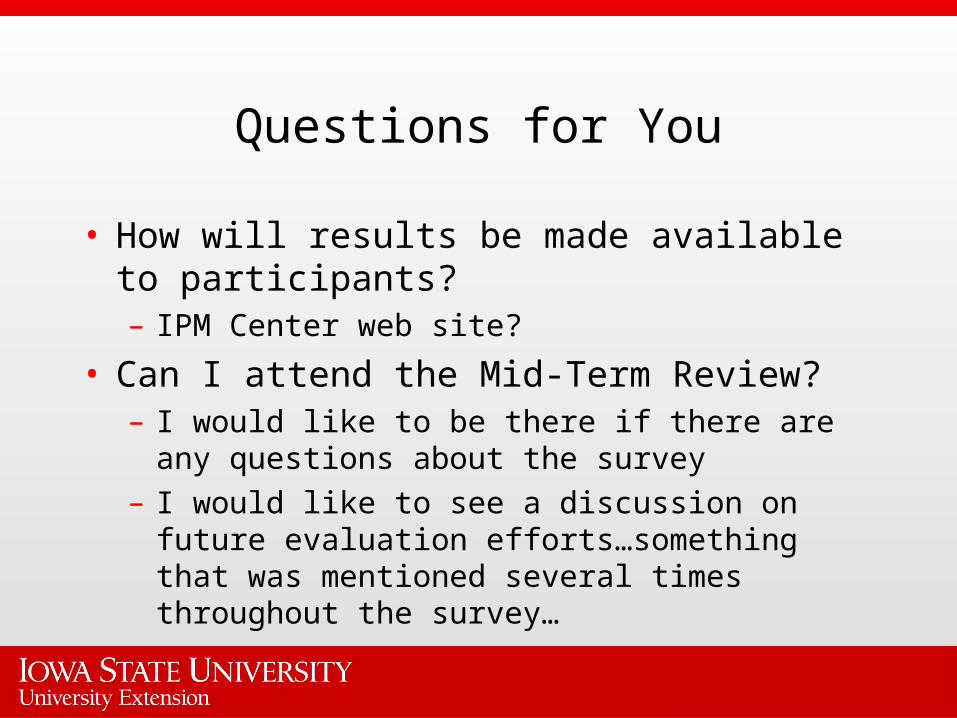
Questions for You
• How will results be made available to participants?– IPM Center web site?
• Can I attend the Mid-Term Review?– I would like to be there if there are any
questions about the survey– I would like to see a discussion on future
evaluation efforts…something that was mentioned several times throughout the survey…


![IPM in Soybean Dr. Amar N. Sharma Principal Scientist (Entomology) Directorate of Soybean Research (ICAR) Indore 452 001 (MP) [amarnathsharma2@gmail.com]](https://static.fdocuments.net/doc/165x107/56649f345503460f94c51a9e/ipm-in-soybean-dr-amar-n-sharma-principal-scientist-entomology-directorate.jpg)
