Regional Economic Impact Analysis of High Speed Rail in China · impacts of China’s High Speed...
120
Report No: ACS9734 People's Republic of China Regional Economic Impact Analysis of High Speed Rail in China Main Report June 25, 2014 . China and Mongolia Sustainable Development Sector Unit EAST ASIA AND PACIFIC REGION . Document of the World Bank
Transcript of Regional Economic Impact Analysis of High Speed Rail in China · impacts of China’s High Speed...

Report No: ACS9734
People's Republic of China
Regional Economic Impact Analysis of High Speed Rail in China
Main Report
June 25, 2014
.
China and Mongolia Sustainable Development Sector Unit
EAST ASIA AND PACIFIC REGION
.
Document of the World Bank

Standard Disclaimer:
.
This volume is a product of the staff of the International Bank for Reconstruction and Development/ The World Bank. The findings, interpretations, and conclusions expressed in this paper do not necessarily reflect the views of the Executive Directors of The World Bank or the governments they represent. The World Bank does not guarantee the accuracy of the data included in this work. The boundaries, colors, denominations, and other information shown on any map in this work do not imply any judgment on the part of The World Bank concerning the legal status of any territory or the endorsement or acceptance of such boundaries.
.
Copyright Statement:
The material in this publication is copyrighted. Copying and/or transmitting portions or all of this work without permission may be a violation of applicable law. The International Bank for Reconstruction and Development/ The World Bank encourages dissemination of its work and will normally grant permission to reproduce portions of the work promptly. For permission to photocopy or reprint any part of this work, please send a request with complete information to the Copyright Clearance Center, Inc., 222 Rosewood Drive, Danvers, MA 01923, USA, telephone 978-750-8400, fax 978-750-4470; http://www.copyright.com/. All other queries on rights and licenses, including subsidiary rights, should be addressed to the Office of the Publisher, The World Bank, 1818 H Street NW, Washington, DC 20433, USA, fax 202-522-2422, e-mail [email protected].

PREFACE
This Report is the main output of a Technical Assistance activity, prepared for the World Bank and
for the China Railway Corporation (CRC), by an international team consisting of Dr. Ying Jin, Mr. Richard
G Bullock, Dr. Runze Yu and Ms. Nanyan Zhou, and a Chinese team consisting of Mr. Jinglin Nan and Mr.
Mingming Gao from the Third Railway Survey and Design Institute (TSDI), Mr. Zhongyi Xu and Mr.
Chunjiang Guo from the CRC Economic Planning and Research Institute (EPRI), and Mr. Lixin Shi from the
Institute of Economic System and Management of National Development and Reform Commission (NDRC).
This Technical Assistance has been led by Mr. Gerald Ollivier (Sr. Infrastructure Specialist, World Bank)
and by Mr. Jianping Zhang (Director of Planning, CRC).

ACKNOWLEDGEMENTS
The Study Team acknowledges the help, cooperation and information provided by the CRC in the
course of this work and for the pertinent comments provided by the National Development and Reform
Commission (NDRC), the Ministry of Finance, CRC, the Chinese Academy of Social Sciences, the China
Road Transport Association, Beijing Jiaotong University, the Economic Planning and Research Institute, the
China Academy of Railway Sciences, the Railway Investment Corporation, TSDI, and by peer reviewers
from the World Bank (Uwe Deichmann, Mark Roberts, Julian Lampietti, and Andreas Kopp), Sector
Managers (Mark Lundell and Abhas Jha) and members of the Steering Committee (Yanfang Zhang,
Changjiang Zhao, Yuping Shao, Lei Miao, and Shujuan Cai).

Technical Assistance
Regional Economic Impact Analysis of
China’s High Speed Rail
CONTENTS
EXECUTIVE SUMMARY .............................................................................................................................................. 1
GLOSSARY ............................................................................................................................................................. 6
CHAPTER 1 INTRODUCTION ................................................................................................................................... 8
1.1 Background ........................................................................................................................................................ 8
1.2 Objective and Scope ........................................................................................................................................ 10
1.3 Structure of this Report .................................................................................................................................... 11
CHAPTER 2 REGIONAL ECONOMIC IMPACT ANALYSIS: .............................................................................12
THEORIES, INDICATORS, AND METHODS ...........................................................................................................12
2.1 Overview.......................................................................................................................................................... 12
2.2 Theoretical Basis.............................................................................................................................................. 12
2.3 Choice of Regional Economic Impact Indicators ............................................................................................ 14
2.4 Quantification of Regional Economic Impacts ................................................................................................ 15
CHAPTER 3 AN OVERVIEW OF REGIONAL ECONOMIC IMPACT ANALYSES OF ...................................20
RAILWAY PROJECTS IN CHINA ...............................................................................................................................20
3.1 Progress in Research and Practice ................................................................................................................... 20
3.2 Regional Economic Impact Analysis in China: Outlook ................................................................................. 26
CHAPTER 4 REGIONAL ECONOMIC IMPACT ANALYSIS: ..............................................................................28
AN INTERNATIONAL REVIEW .................................................................................................................................28
4.1 Overview.......................................................................................................................................................... 28
4.2 Ex Post Studies ................................................................................................................................................ 29
4.3 Ex-Ante Assessments ....................................................................................................................................... 33
4.4 Key Lessons ..................................................................................................................................................... 36
CHAPTER 5 RELEVANT WORLD BANK STUDIES IN CHINA .........................................................................37
5.1 Overview.......................................................................................................................................................... 37
5.2 Analysis of the Relationship between Spatial Proximity and Productivity in Guangdong .............................. 38
CHAPTER 6 METHODOLOGY DEVELOPMENT..................................................................................................41
FOR REGIONAL ECONOMIC IMPACT ANALYSIS IN CHINA ...........................................................................41
6.1 Overview of the Approach ............................................................................................................................... 41
6.2 Lessons from Applications in Other Countries ................................................................................................ 43
6.3 Design of Predictive Models ............................................................................................................................ 44
6.4 Approach to Parameter Calibration.................................................................................................................. 48
6.5 Worked examples ............................................................................................................................................. 49
CHAPTER 7 CASE STUDIES ....................................................................................................................................51
7.1 Selection of Case Study Areas ......................................................................................................................... 51
7.2 Collection of Background Data ....................................................................................................................... 52
7.3 On-board Survey of HSR and Other Train Passengers .................................................................................... 52
7.4 Business and Government Agency Interviews ................................................................................................. 57

7.5 Agglomeration Effects on Productivity and GDP ............................................................................................ 60
7.5.1 Scope of calculation ................................................................................................................................ 60
7.5.2 Principles for calculating productivity effects from agglomeration ........................................................ 61
7.5.3 Network characteristics ........................................................................................................................... 62
7.5.4 Calculation of agglomeration effect ........................................................................................................ 63
7.5.5 Future work of agglomeration effect calculation .................................................................................... 64
7.6 Employment Effects......................................................................................................................................... 68
7.7 Tourism Effects ................................................................................................................................................ 69
7.7.1 Empirical evidence ......................................................................................................................................... 69
7.7.2 Demonstrative calculation .............................................................................................................................. 71
CHAPTER 8 CONCLUSIONS ...................................................................................................................................74
8.1 Summary of the Findings ................................................................................................................................. 74
8.2 Recommendations for Further Work ................................................................................................................ 76
BIBLIOGRAPHY ...........................................................................................................................................................78
APPENDIX 1. A REVIEW OF EX POST EVALUATION STUDIES .......................................................................82
OF HIGH SPEED RAIL PROJECTS OUTSIDE CHINA ..........................................................................................82
APPENDIX 2. A REVIEW OF EX ANTE HIGH SPEED RAIL PROJECT ............................................................89
ASSESSMENT METHODS ...........................................................................................................................................89
APPENDIX 3. A REVIEW OF OFFICIAL EX ANTE ASSESSMENT ...................................................................94
METHODOLOGIES ......................................................................................................................................................94
APPENDIX 4 ON-BOARD PASSENGER INTERVIEW ....................................................................................... 110
APPENDIX 5 INTERVIEWING BUSINESS MANAGERS .................................................................................. 112

FIGURES
Figure 1. High Speed Rail Network and new 200 km/h lines in China, by Dec 2013, World Bank ................................ 9
Figure 2. Comparison of the GDP of 15 Cities along the Beijing – ................................................................................23
Figure 3. Complementarity between Conventional and Wider Regional Impact Analysis ..............................................42
Figure 4. Configuration of a Four-City Example ............................................................................................................50
Figure 5. Age Distribution of Passengers ........................................................................................................................53
Figure 6. Gender Distribution .........................................................................................................................................53
Figure 7. Trip Purpose .....................................................................................................................................................53
Figure 8. Trip Distance ....................................................................................................................................................54
Figure 9. Monthly Income Distribution ...........................................................................................................................54
Figure 10. Connecting Modes to Railway Stations ..........................................................................................................55
Figure 11. Average Trip Duration (days) ..........................................................................................................................55
Figure 12. Alternative Transport Modes for Changchun-Jilin Line ..................................................................................55
Figure 13. Alternative Modes for Beijing-Shanghai Line ................................................................................................56
Figure 14. Analysis of the Confucius Temple entry ticket sales 2010-2012 .....................................................................70
Figure 15. Impact of Shinkansen extensions on visitors ..................................................................................................87
Figure 16. Workflow for Estimating Wider Economic Impacts .......................................................................................97
Figure 17. Workflow for Agglomeration Impacts ............................................................................................................99
Figure 18. Mechanism for the Economic Ripple Effects of Transport Investment ........................................................107
Figure 19. Configuration for the Regional Econometric Model .....................................................................................109

TABLES
Table 1 Direct Impacts of the Value Added by Beijing-Kowloon Railway: 1997-2006 ...........................................22
Table 2 Comprehensive Social Progress Indicators of Eight Provinces and Cities along Beijing-Kowloon Railway
compared with the national average of China ..............................................................................................24
Table 3 Assessment of the main regional impact indicators: Germany, the UK, Japan and proposals for China .....43
Table 4 Assessment of the main regional impact indicators: Comparison with the existing indicators of regional
economic and macro-economic impacts ......................................................................................................44
Table 5 Summary of Recommendations Regarding Model Parameters....................................................................49
Table 6 Industry Types Involved in Business Interviews ..........................................................................................58
Table 7 Scopes of Analysis for Selected Cities .........................................................................................................61
Table 8 Network characteristics of Beijing-Shanghai HSR (Jinan) ..........................................................................62
Table 9 Network characteristics of Beijing-Shanghai HSR (Dezhou) ......................................................................63
Table 10 Network Characteristics of Beijing-Shanghai HSR (Jilin)...........................................................................63
Table 11 Agglomeration Benefit of Beijing-Shanghai HSR on Jinan ........................................................................65
Table 12 Agglomeration Benefit of Beijing-Shanghai High-speed Railway on Dezhou ............................................66
Table 13 Agglomeration Benefit of Changchun-Jilin Intercity Rail on Jilin ..............................................................67
Table 14 Other Travel Related Expenses ....................................................................................................................71
Table 15 Standardization of Generalized Cost and Calculation of Total Travel Expense ...........................................71
Table 16 Comprehensive Generalized Cost of Different Transport Modes ................................................................73
Table 17 Comprehensive Expenses in with/without project scenarios .......................................................................73
Table 18 Conventional Appraisal versus WEIs Appraisal ..........................................................................................96
Table 19 Variables and notations for EQUATIONs A4.1 to A4.4 .............................................................................100
Table 20 Categories of Accessibility Deficiency ......................................................................................................105
Table 21 Structural Backwardness and Associated Area Types ................................................................................105
Table 22 Evaluation of Relief Impacts on Long-Distance Traffic ............................................................................105

1
EXECUTIVE SUMMARY
The objective of this Technical Assistance (TA) activity is to support China Railway Corporation
(CRC) in developing a standard, operational approach to identifying and quantifying regional economic
impacts of China’s High Speed Rail (HSR) projects. The HSR in this report includes not only the dedicated
passenger line projects with a design speed of 200 km per hour or above, but also mixed traffic projects with
a maximum design speed of 200 km per hour. China’s HSR network is the largest and fastest expanding in
the world.
This TA includes the identification of relevant indicators, the definition of a potential methodology to
assess such impacts in consultation with CRC, and the provision of support to CRC and its consultants in
applying such methodology to two specific case studies. The approach has been designed in such a way as to
allow its practical use by design institutes and other professionals as part of feasibility studies.
Context
The quantification of regional economic impacts is particularly relevant at this stage of China’s HSR
network development. Projects with a prima facie justification have largely been launched or completed. The
remainder of the planned routes, in particular in the under-developed central and western regions, requires
careful assessment and planning to ensure that they meet China’s economic, social, and environmental policy
objectives.
There is already extensive experience in measuring conventional economic impacts of railway
projects in China, and accordingly the methodology for such conventional analyses is not covered
specifically in this report. The third and most recent edition of the Methods and Parameters for the
Economic Evaluation for Railway Construction Projects (MoHURD, NDRC and MOR, 2011) provides a
detailed quantitative framework for such benefits. Existing project assessment in China following such a
framework covers construction costs of the projects, operation and maintenance costs of associated transport
services, direct user benefits (mainly cost and time savings), transport safety impacts,
congestion/overcrowding effects, exhaust emissions, and strategic environmental and sustainability analysis.
The framework has been gradually developed in China over the past twenty years, building on international
practice.
Focus of the study
This activity is focused on methodologies to measure economic impacts that are not, or not fully,
accounted for by conventional transport cost benefit analyses. Over the past twenty years, there has been an
increasing focus on assessing the impacts of major transport projects on the economy, such as labor
productivity, jobs, industrial growth and regional development. There is an emerging consensus that major
transport investments have significant regional impacts that are not well captured by conventional transport
cost benefit analyses. This applies to most countries in the world including China.
Regional economic impacts of transport projects can be either positive or negative and their
assessment is often at the heart of policy questions concerning sustainable development. In their wider
sense, regional economic impacts are the totality of impacts upon the economy of the region. However, the
term is often used in a narrower sense (such as in this report) to denote those economic impacts that are not,

2
or not fully, accounted for by conventional transport cost benefit analyses. For policy makers, such impacts
upon the economy and welfare are significant factors in planning and decision-making. It is therefore
important to account for the main regional impacts in project assessment.
Based on the findings of the international and domestic review as well as the policy needs reflected
in the indicator system of the Methods and Parameters for the Economic Evaluation for Railway
Construction Projects (MoHURD, NDRC and MOR, 2011), the analyses of this report have been designed to
focus on three regional economic impacts: (1) the effects of transport-induced agglomeration upon business
productivity, i.e. the productivity effects that arise from expansion of markets for inputs and products, better
matching between producers and consumers, and improved learning and dissemination of tacit knowledge
through face-to-face communication; (2) employment effects, i.e. rises or falls in jobs as result of changes in
the level of output and business locations; (3) tourism effects, i.e. changes in the number of tourists, their
average durations of stay, and their average spends per stay.
Methodologically they represent three different types of effects: (1) agglomeration-induced
productivity effects are central to an overall economic assessment, and their inclusion represents an
important extension beyond conventional cost benefit analyses that have already been implemented in
existing transport project appraisals in China – the quantified agglomeration effects can be added to the costs
and benefits calculated by conventional analysis without causing double counting; (2) employment effects
are also an important extension to conventional analyses, but they must be accounted for in parallel to rather
than added over and above conventional costs and benefits in order to avoid double-counting – for instance,
employment effects can be assessed in their own right in the context of shared growth among regions; (3)
tourism effects represent an industry-specific outcome that can become a prominent feature almost
immediately following the opening of the HSR lines, where it is important to establish rapidly a
methodological framework for monitoring the effects, not least because a HSR line may in part displace
tourism activities from one location to another.
Methodological development
The main barriers to such assessments are the lack of rigorous yet operational methods and
procedures, as well as severe limitations in available data. Despite a growing array of research on regional
impacts, the conversion of such research into methodologies that can be readily implemented by practitioners
as part of feasibility studies poses a challenge that few countries have resolved. Existing national and
regional statistical sources are not immediately usable in their original form for the necessary calibration of
parameters, although as it is shown in this report, such sources can be translated into useful data for
parameter calibration if their use is guided by robust theories and supplemented by good transport network
data and an essential set of additional surveys. As the statistical sources improve, the data barrier will be
gradually overcome.
Several developed countries have established operational assessment procedures for the regional
economic impacts of major transport investment projects including HSR. Germany, the UK and Japan
represent three distinct frameworks: Germany incorporates a largely qualitative procedure to identify the
areas with accessibility deficiencies and structural backwardness within its transport cost benefit analysis; the
UK adopts a quantitative procedure based on partial equilibrium models within its extended transport cost
benefit analysis; Japan, by contrast, adopts computable general equilibrium models to quantify the
agglomeration, employment, tourism and other regional impacts of HSR projects.
An extensive review of Chinese and international literature shows that the predominant regional

3
economic effect that is missing from conventional transport cost benefit analyses is that of agglomeration on
business productivity – that is to say, the impact of improved transport tending to raise average productivity
and thereby contributing to additional economic growth; this effect may be added to the conventional costs
and benefits in an extended cost benefit analysis without double-counting. Recent research carried out by a
World Bank team shows that at the current stage of development, transport projects can trigger significant
agglomeration benefits in China: After controlling for broad differences in labor skills, capital endowment,
industry composition and the number of hours worked, halving the economic distance within the coastal
region Guangdong can lead to a 10% rise in average productivity per employee (Jin, Bullock and Fang,
2013b1). This result is broadly corroborated by business surveys, and the significant growth in generated
traffic that has been observed on the trunk HSR lines between Wuhan-Guangzhou and Beijing-Shanghai.
During this TA, the international and Chinese teams have been able to work together effectively in
reviews, model development and in particular through two cases studies (respectively on the Changchun-
Jilin route and the northern part of the Beijing-Shanghai route). The reviews, case studies and consultation
with the businesses, policy makers and the expert group have led to specific recommendations regarding the
identification and quantification of the three types of effects, and the pathways towards further development.
Findings and recommendations
Regarding the HSR impacts on business productivity, we recommend that China broadly follow the
UK model given the current level of data and professional skills base. The initial parameters that are
necessary for estimating the productivity effects have already been estimated and tested in recent World
Bank studies of HSR projects in China, although we envisage that region-specific parameters will need to be
calibrated and validated over time. The estimated agglomeration benefits on various second-tier and third-
tier cities are shown to be very substantial, for instance they are equivalent to 0.55% of total GDP in Jinan
per year, 0.63% in Jilin and 1% in Dezhou. The benefits of this scale seem to be corroborated by business
surveys and surveys of generated traffic (estimated at 18% for Changchun-Jilin and between 30% and 60%
for Beijing-Shanghai), and would warrant more in-depth examination. The partial equilibrium approach to
quantifying productivity effects can be gradually extended towards general equilibrium analysis (such as
exemplified by the Japanese model), although this will require considerable time, data and further work.
The existing data sources cannot yet support a robust quantification of the impact on jobs. We
recommend that the evidence base be built up through business interviews using the methodology developed
by the study team and tested in the two case study areas. Given that the HSR lines studied have only been
put into operation very recently, specific evidence of significant job impacts is yet to emerge. However, as
expected in the theoretical models, business operations in the service industries as well as the management
and sales departments of other industries have been adapting rapidly to the significantly raised accessibility -
in particular, trip frequencies of the existing travelers have increased sharply. Passenger surveys indicate a
substantially higher percentage of business-related travelers on high speed rail than on conventional rail (e.g.
17% greater share for Changchun-Jilin and 11% for Beijing-Shanghai) and an overall high proportion of
business travelers (e.g. 40% for Changchun-Jilin and 63% for Beijing-Shanghai of all HSR passengers). We
expect that continuous monitoring of the employment effects through business surveys of this type will
gradually uncover the precise mechanisms and magnitudes of growth over time. We further put forward
partial equilibrium models of job location changes which can act as an intermediary step towards a full
quantification of employment effects through general equilibrium analysis.
1 This report was finalized as part of this TA and is provided as Working Paper 2.

4
Our tourism survey has shown that the tourism industry has experienced a rapid transformation: on
the one hand, the tourist trips have been increasing rapidly at major attraction sites on the HSR lines. For
instance, such impact is apparent in locations like Qufu, which experienced a net increase in the number of
visitors, part of which likely attracted by the reduction in total travel expense with the availability of HSR.
There is anecdotal evidence that improved accessibility by HSR has enabled some tourists to spend fewer
nights, although the existing surveys and tourism statistics are not adequate to provide a full confirmation of
this. Here more surveys and data collection is required to understand the changes in trip-making, tourist
expenditure, and over-night stay patterns. It would seem feasible to collect the necessary new data through
extending the existing tourism surveys. Based on good practice in tourist demand modelling, we recommend
the adoption initially of a simple route-based elasticity model, followed by a partial equilibrium tourist
destination choice model, and eventually incorporating the tourism effects in general equilibrium analysis.
The central conclusion of our empirical analysis is that a gradual accumulation of the evidence base
is of critical importance. Of the three types of effects studied, the estimation of agglomeration effects is the
most complete because a first set of parameters of the predictive model have been calibrated over the recent
years through the World Bank’s project monitoring work. The tourism effects model can be made
operational through supplementary data that should be feasible to collect in the short term. The employment
effects model cannot yet be calibrated. This is in part because the specific evidence of HSR effects will take
time to build up and monitor (as shown in the business interviews conducted in the study), and also because
a more complex set of input data is required to estimate the contribution of the HSR to employment changes.
The literature review, surveys and case studies carried out under this TA activity has established a
coherent methodology for regional economic impact assessment of HSR projects and a step-by-step guide to
practical analysis in the short term. The assessment methodology builds on robust theories and can be
gradually extended to suit improved data availability and growing complexity of project appraisal. The step-
by-step guide translates the method into a practical tool for the design institutes and other professionals in
China to carry out the assessments in the short term.
The current activity has focused on the methodological development that is appropriate for the HSR
projects – such projects make a step change in transport accessibility. However, the principles established
here can, with further work, be extended and adapted for assessing lower speed railways and other types of
transport projects.
Tasks beyond this TA
The findings above suggest that the expansion of markets and networks as result of the HSR may be
of great importance across China’s regions. It highlights the significance of analyzing the spatial economic
effects of transport investments. The methodology proposed here provides a practical approach to
quantification of some of the key effects at this stage, which is in line with the objectives of this TA. The
current methodology is focused on short to mid-term impacts using a partial equilibrium approach.
However, HSR is a new phenomenon in China. The accumulation of the empirical evidence is only
just starting. The assessment of wider economic impacts of transport networks is complex and much
methodological development is still ongoing to control for other influences. Further evidence and supporting
data will be needed to better understand HSR impacts in a Chinese context. There are a number of areas
where further work will be required. We highlight three tasks in particular.

5
First, further theoretical and empirical developments will be required on productivity growth,
particularly in terms of the medium to long term effects. Here it would be valuable to discern more precisely
the effects that arise through urban densification and micro-level spatial sorting in the evolution of trade
patterns, local labor markets and producer networks.
Secondly, a continuous effort is required to monitor the effects of business agglomeration and
relocation, and their impacts on jobs across the regions. This could be gradually refined to identify effects on
key regional industries, including tourism. This would require the development of a SCGE model for
research purpose to capture the relative strengths of the connected urban centers to explore the dynamics of
agglomeration, including any de-agglomerative impacts in some locations.
Thirdly, building on the accumulation of data sources through wider monitoring, it would be possible
to extend the assessment framework to cover more general regional effects arising from all relevant
transport modes (e.g. highway, conventional rail and air, as well as the HSR), and the interactions between
transport and spatial economic and regional land use patterns. This will lead to an improved understanding
of the counterfactuals to transport investment scenarios, and contribute to more precise measurements of the
additional benefits and costs brought by transport interventions.
Ultimately all of the above analyses further contribute to assessing the policy decisions against the
overarching objectives of poverty alleviation, shared prosperity and inclusive green growth.
Contents of this report
This report first reviews existing theories, indicators and methods in Chapter 2, setting out the
context of the research. In Chapter 3 and 4 respectively it reviews the existing Chinese and international
practices. Chapter 5 reviews specific research that has been carried out in China by the World Bank which is
of direct relevance to this TA activity. Chapter 6 further develops the methodology, with an emphasis on
operational procedures for estimating the most policy-relevant indicators identified by this study, which are
productivity effects arising from agglomeration, employment effects, and tourism effects. For each impact,
indicators are defined along with a quantification methodology and verification procedures. Chapter 7
reports the implementation of the methodology through two case studies. A framework has been set up to
examine both quantitative and qualitative information, and test the extent of corroboration through the
logical links among disparate pieces of evidence. Chapter 8 presents the conclusions and considers further
tasks to extend the assessment framework over time. Appendices 1 to 3 provide further details regarding
existing assessment studies and methodologies. Appendices 4 and 5 show the interview and survey forms. A
separate report provides a step-by-step ‘how-to’ guide for a regional economic impact assessment using a
four zone generic example model, which as a simple numerical example complements the presentation of the
case study applications on Changchun-Jilin HSR and the northern part of the Beijing-Shanghai HSR.

6
GLOSSARY
Agglomeration Benefits: are used in urban economics to describe the benefits that firms obtain
when locating near one another (i.e. through 'agglomerating'). Agglomeration occurs as a result of either
clustering of firms at the same location or, more particularly in this paper, transport service improvements
between locations which reduce the time and distance between them. Conventional transport cost and
benefit analyses can account for some of the effects that arise from these improvements, such as the
reduction in direct transport costs and travel times. However, they do not account for the wider productivity-
enhancing effects that arise from expanding markets for inputs and products, better matching between
producers and consumers, and improved learning and dissemination of tacit knowledge through face-to-face
communication. In this report we define agglomeration benefits as these wider effects, which complement
the impact of changes in transport costs and travel times already accounted for in conventional cost benefit
analyses.
Conventional Transport Cost Benefit Analysis: The coverage of such analyses naturally vary
from country to country but as a rule, these tend to cover the construction costs of transport projects,
operation and maintenance costs of associated transport services, direct user benefits (principally cost and
time savings), and a restricted list of externalities such as transport safety impacts, congestion, overcrowding
and emissions.
China Railway Corporation (CRC): in March 2013, the Ministry of Railways was dissolved and
its duties have been taken up by an expanded Ministry of Transport (for safety and regulation), State
Railways Administration (for inspection) and China Railway Corporation (CRC; for construction, service
operation and management).
Economic Mass: measures of the level of market access that businesses have at a given location.
Since firms today interact not only with local firms who are their immediate neighbors, but also to an ever
increasing extent with firms in more and more distant locations, the economic mass of a city is the sum of the
measure of market size at all relevant locations divided by the economic distance in between. In other
words, economic mass is a measure of overall market access, or the effective economic size of a city.
Employment Effects: are by convention measured in terms of the number of jobs by location. Jobs
are related to the total economic output at each location, but changes in jobs do not necessarily move by the
same magnitude or even in the same direction as economic output. This is because they are also affected by
industrial composition, technical change, employment policies, regulations and legislation, to name a few.
The number of jobs is an important social dimension of the regional impacts, which can enter the assessment
framework through multi-criteria analysis. The employment effects should then be considered as a parallel
indicator to the monetized costs and benefits such as conventional costs and benefits or agglomeration
effects.
High Speed Rail (HSR): in the context of this report includes both dedicated passenger lines with
design speeds of 200 km/hour or above, and mixed passenger-freight lines with maximum speeds of
200km/hour.
Inter-City Rail (ICR): These are HSR lines connecting specific cities, often within a relatively
short distance e.g. 100-200 kilometers.

7
Regional Economic Impacts: In their wider sense, regional economic impacts are the totality of
impacts upon the economy of the region. However, the term is often used in a narrower sense (such as in this
report) to denote those economic impacts that are not, or not fully, accounted for by conventional transport
cost benefit analyses.
Spatial Computable General Equilibrium (SCGE) Model: are a class of applied economic
models that use detailed economic data (such as the input-output tables of the national or regional economy)
to estimate how an economy might react to changes in policy, technology or other external factors. They
explicitly incorporate transport costs, and often other spatial costs for the movements of goods and people.
Most of the SCGE models conform only loosely to the theoretical general equilibrium paradigm. For
example, they usually allow for non-market clearing in any given year (therefore they can represent
unemployment and stocks for commodities), imperfect competition (e.g., monopoly pricing), exogenous
demands for goods and services (e.g., public sector investment, export shocks), a range of taxes, and
externalities (such as pollution).
Tourism Effects: Many cities and towns on new HSR lines have experienced a rapid increase in the
volume of tourists in the first couple of years of the lines’ opening. Such effects provide an excellent case
for studying the short term impacts of the HSR projects. The specific indicators of tourism need to account
for the fact that HSR travel enables the tourist to leave just as quickly and conveniently as they arrive. For
this reason, we define the effects upon the total volume of tourist trade through three component indicators:
the number of tourists, their average duration of stay, and the average spend per person per stay.

8
CHAPTER 1 INTRODUCTION
1.1 Background
1. Over the past twenty years, there has been an increasing focus on assessing the broader impacts of
major transport projects. Such impacts include labor productivity, jobs, industrial growth and regional
development. There is an emerging consensus that major transport investments have significant impacts that
are not well captured by conventional cost benefit analyses2. At the regional level, such impacts can be either
positive or negative and they are often at the heart of policy questions concerning sustainable development.
For policy makers, tangible impacts upon the economy and welfare are significant factors in planning and
decision-making, although the relevant empirical evidence is challenging to assemble and analyze.
2. In China, the benefits arising from the High Speed Rail (HSR) creating a step change in regional
linkages have been a key policy consideration at both the national and provincial levels. The effects of new
interregional transport corridors have been debated extensively throughout the hierarchy of central planners,
albeit in a qualitative manner in most cases. Supporting arguments put forward by the government for the
HSR include expanding market catchments for goods and services, disseminating know-how and facilitating
innovation. Occasional ex-post case studies, such as carried out for the Beijing-Kowloon railway line3,
appeared to support the view that new regional linkages are beneficial in those terms. However, there has
been little quantification of those broader impacts because the existing railway economic assessment
approach in China is largely based on conventional cost/benefit analysis which includes only direct user
impacts.
3. As China’s HSR network expands, new projects are increasingly likely to be links that connect the
less developed Central and West regions (Figure 1). Unlike the trunk lines where there may be a prima facie
case for investment owing to apparent transport capacity pressures, high travel demand and an intuitive
expectation of agglomeration benefits, the future schemes will require a greater degree of scrutiny to ensure
rational investment.
2 Vickerman, 2007; OECD-ITF, 2008; DfT, 2009
3 Sun, 2009

9
Figure 1. High Speed Rail Network and new 200 km/h lines in China, by Dec 2013, World Bank
Source: China Transportation and Communications Yearbooks, China Railway Yearbooks, and Planning & Statistics Department of
CRC
4. In China, the existing assessment process for rail projects includes regional economic impacts as an
important consideration for decision-making, along with macro-economic impacts. The current assessment
framework was first developed in 1997 and extended in 2011 by National Development and Reform
Commission (NDRC), the Ministry of Housing and Urban-Rural Development (MoHURD) and the Ministry
of Railways (MoR)4. In practice, the assessment of the regional and macro impacts to date has been limited
to qualitative analyses, owing to a lack of a rigorous approach to quantification. In order to better understand
the roles HSR can play in fulfilling the policy objective of supporting the less developed Central and West
regions, and to present the case for provincial and local governments to co-finance those projects, CRC has
started to develop a more robust, quantified approach to examining those impacts.
4 See MoHURD et al., 2011; In March 2013, the Ministry of Railways was dissolved and its operational responsibilities transferred
to the China Rail Corporation (CRC) (see CRC in the Glossary for the full arrangements).
Legend
Operating, 200 km/h
Operating, 250 km/h
Operating, 350 km/h
Under Construction, 200 km/h
Under Construction, 250 km/h
Under Construction, 350 km/h
Planned, 200/250 km/h
Planned, 350 km/h

10
1.2 Objective and Scope
5. The objective of this study is to support CRC in developing a standardized and operational approach
to identify and quantify the regional economic impacts of HSR projects5. Such regional economic impacts
are not yet captured under conventional cost/benefit analyses. Whilst the work is built on a robust theoretical
and empirical basis, the focus of the work is the development of a set of practical assessment procedures that
can be implemented in feasibility studies by practitioners in the short term and gradually refined to guide
planning and investment decisions on forthcoming HSR proposals.
6. The emphasis on developing operational procedures for use in the short term points to the
prioritization of the most policy-relevant indicators. Existing project assessment in China following the
conventional method covers the construction and operation costs of transport projects and their associated
transport services, direct user benefits (e.g. cost and time savings), transport safety impacts,
congestion/overcrowding effects, exhaust emissions, and strategic environmental and sustainability analysis.
Consultations with CRC and their technical consultants show that there has been a strong policy interest in
the effects of HSR projects on economic growth, jobs and land/property values. They understand that many
of the economic impacts will need time to build up, particularly those that are related to structural changes in
the economy. However, they also point out that in some sectors, such as tourism, a marked change is already
observable following the opening of some of the HSR lines.
7. Clearly, the finite time and resources of this activity has required prioritization of the analyses of
new assessment indicators. The nature of this Technical Assistance has prompted a focus on tackling
fundamental methodological issues and demonstrating methods that shed light on broad classes of models,
measurements and monitoring. In particular, we started by asking (1) what are the broader regional
economic impacts of HSR projects that have not been accounted for by the conventional assessment
methods, and can they be measured in a way to complement existing assessment procedure; (2) what are the
broader regional economic impacts that are not fully accounted for by the conventional assessment methods,
and have to be measured in parallel to existing assessment procedure under a multi-criteria framework; and
(3) can industry-specific effects be measured in the short term? If so, in which industries?
8. An extensive review of Chinese and international literature shows that (1) the predominant regional
economic effect that is missing from conventional transport cost benefit analyses is that of agglomeration
effects on per capita productivity – improved transport tends to raise average productivity and therefore
contributes to additional economic growth; this effect may be added to the conventional costs and benefits in
an extended cost benefit analysis without causing double-counting; (2) the growth of both jobs and land
values should be accounted for in parallel to the cost benefit analyses under a multi-criteria framework; if
those effects were added to the conventional or extended cost benefit analysis, there would be double-
counting; whilst the overall changes in the number of jobs tend to be stable over time, the changes in land
and property values are far more volatile and subject to market sentiment and speculation; (3) Whilst the
majority of industries will need a gradual build-up of many years in adjusting their operations to improved
rail travel, it is possible for those businesses which are heavily dependent upon passenger travel (such as
tourism) to respond in the short term, if the associated infrastructure and facilities can be adjusted rapidly.
9. Further consultations with the Steering Group and the wider Expert Group have confirmed that this
report should be focused on three regional impacts: namely the productivity effects arising from
5 HSR projects in this context include not only the 200 km/h and above projects but also mixed traffic projects with maximum speeds
that are equal to 200km/h.

11
agglomeration, employment effects, and tourism effects. For each impact, indicators are defined along with a
quantification methodology and verification procedures. The methods and procedures are then considered
through two case studies: one between Changchun and Jilin in Northeast China, and the other between
Tianjin and Jinan, along the northern section of the Beijing-Shanghai HSR line.
10. The two cases studies started with data assembly, local business and government agency interviews,
and an additional passenger survey on both HSR and non-HSR trains. The data and information collected are
used to refine, test and verify predictions, with a view to improving the assessment methodology gradually as
the evidence base is built up. The procedures for data collection, business interviews and passenger surveys,
which have been tested in the case studies, have become part of the assessment guidance to facilitate future
investment appraisals, ex-post evaluation on existing HSR lines, and continued monitoring as new HSR
projects come into operation.
11. In summary, this project reviews existing international and domestic practices and procedures,
develops an operational methodology for HSR project assessment (both ex-ante and ex-post) in consultation
with the CRC, supports the CRC and its consultants in applying the methodology to two specific case
studies, and puts forward a step-by-step guide to the analysis of the productivity, employment and tourism
impacts.
1.3 Structure of this Report
12. This report reflects a two-stage work flow designed to fulfill the research objectives: Stage 1 defined
the methodology, and Stage 2 tested this methodology and transferred the know-how to the CRC and its
consultants through case studies. Chapter 2 summarizes the theoretical framework within which regional
economic impacts are discussed and quantified. Chapter 3 reviews current regional economic impact
analyses in China. Chapter 4 summarizes the approach to practical regional impact assessment in other
countries and reviews the relevance of the main methods in the Chinese context. Chapter 5 summarizes the
work that has been carried out by the World Bank to date in estimating regional impacts in China. Chapter 6
develops a practical approach to quantifying the regional economic impacts of future HSR in China,
including methods for data collection, surveys and interviews. Chapter 7 presents the implementation of the
methodology in the case studies and the interpretation of quantified model results. Chapter 8 summarizes the
conclusions and the recommendations for further work. In addition, Appendices 1 to 3 provide further
details about existing assessment studies and methodologies. Appendices 4 and 5 show the interview and
survey forms. A separate report provides a step-by-step ‘how-to’ guide for a regional economic impact
assessment using a four zone generic example model, which as a simple numerical example complements the
presentation of the case study applications on Changchun-Jilin HSR and the northern part of the Beijing-
Shanghai HSR.

12
CHAPTER 2 REGIONAL ECONOMIC IMPACT ANALYSIS:
THEORIES, INDICATORS, AND METHODS
2.1 Overview
13. The diversity and complexity of regional impacts have led to a wealth of different theories and
methods from a wide range of perspectives. Few individual theories or methods can be expected to cover
such complex impacts in their entirety and building up a composite picture from a number of perspectives is
thus a useful start to understand the various issues.
14. This chapter first summarizes the theoretical basis for using a broader economic appraisal than the
conventional within-sector approach. It then discusses the main indicators that can be used to quantify the
regional economic impacts, and finally summarizes the various methods that have been adopted to provide
ex-ante and ex-post estimates of those indicators.
2.2 Theoretical Basis
15. Transport investment impacts are felt as soon as construction works commence. They arise from the
procurement of labor, capital, raw materials and intermediate services which will typically increase regional
and local economic activity. However, although such multiplier effects can be important in policy terms (e.g.
as part of an economic stimulus package), they are typically short-term in nature and are usually a minor part
of the stream of project benefits over time.
16. The bulk of the impacts normally accrue over the duration of the service operations. The most
common approach to appraisal is to focus on the workings of the transport market and account for the
expected streams of operation and maintenance costs, user savings, and safety and environmental benefits
over a predefined appraisal period. Such direct costs and benefits within the transport sector have been
traditionally considered a proxy for total economic impacts of the project.
17. However, this within-transport-sector approach is based on the assumptions of perfect competition
and of no externalities in the production of goods and services. Neither assumption holds in practice.
Transport affects businesses in terms of (a) where companies invest and grow their business; (b) how they
source their inputs from different locations; (c) how they develop and expand the market catchment of their
goods and services; (d) how they imitate and learn from one another amid competition, innovate, and (in
some cases) develop their own niche market.
18. Similarly, transport influences households and individuals in terms of (a) where to live; (b) how they
source consumer goods and services; (c) how they develop and expand the catchment of job opportunities;
(d) how they imitate and learn from one another amid competition, and develop their own social networks.
In practically all of those processes, competition among businesses is imperfect (often each firm carves out
its own niches in the market); There are a variety of externalities, particularly agglomeration effects that arise
through the increases in the size and diversity of markets and the number of specialized niches of suppliers.
19. The theoretical premise of the fundamental impacts of transport may be traced back to the insights
into urban agglomeration effects from Marshall (1890). Theoretical work including (though not limited to)

13
the New Economic Geography6 and its extension to include endogenous growth models
7 has shown that a
step change in transport accessibility as well as urban density may have significant agglomeration effects. It
has long been observed that incomes are significantly higher in large cities than in smaller ones (O’Sullivan,
2003; Rosenthal and Strange, 2004). This is generally explained by positive externalities from concentration
of economic activity. Firms are thought to derive productive advantages from access to suppliers (reducing
the price of inputs), access to labor (increasing labor productivity) and access to information (improving
technology). Thus, when a firm relocates to an area of agglomeration it may raise the output of other firms
through one or other of these channels.
20. Albeit that much of the agglomeration economics literature has emphasized urban densification
effects (e.g. see reviews by Rosenthal and Strange, 2004; Melo et al, 2009; also case studies of particular
cities in Glaeser, 2012), the insights of the New Economic Geography have spurred an increasing number of
studies regarding the quantification of transport’s role in productivity growth. Statistically robust empirical
evidence has emerged since the early 2000s, particularly in the developed countries. Improved transport
leads to agglomeration economies of increased access to input/output markets, innovation spillovers, and a
greater labor pool (See, e.g. Duranton and Puga, 2004, The World Bank, 2009). Competition is implicit with
increased access (and thus more competition for) markets and labor. These in combination raise productivity
and thus total output
21. Agglomeration can occur among all trades across the city as the result of improved external and
internal transport links (i.e. urbanization economies), as well as within a concentration of a particular trade
within a city (i.e. localization economies)8
. The concept of agglomeration benefits from transport
improvements is thus based on four main propositions: (a) output per worker, and hence wages, is a function
of effective density; (b) effective density rises with transport improvements; (c) there are positive
externalities from transport improvements which increase output for some firms independently of their use of
the transport network; (d) this increase in output is not included in the standard assessment of transport
projects.
22. On-going research has led to in-depth analyses to isolate the impact of the roads on growth (e.g.
Baum-Snow et al, 2013) or employment (Duranton and Turner, 2012). The majority of the advanced
methods have not yet resulted in operational methods that could be used in an ex-ante application, largely
because the transport variables adopted in model estimation have remained at a macro-level (e.g. road
investment is incorporated through km of roads built without further information about their impacts on
accessibility). Research by Graham (2005) is a notable exception, which found that improved transport
increased effective urban densities9 even where the actual land use densities remain constant. Although a
number of technical issues were unresolved (for example, the definition of an ‘area’ in a metropolitan
analysis, the heterogeneity of firms and allowing for price effects in denser areas, see Graham, 2006),
Graham showed that firm output in 8000 wards in the UK is a positive function of effective density.
6 by a number of economists who have worked on location and trade theories, such as Fujita (1989), Krugman (1991), Venables
(1996), and Fujita et al. (1999). 7 e.g. Baldwin and Martin (2004), where the NEG framework is extended to cover the concentration and movements of people and
the role of innovation in enhancing productivity. 8 However, in their major survey of agglomeration economies, Rosenthal and Strange (2004) observed that nearly all studies of
agglomeration economies are based on comparisons of metropolitan areas. They recognized that localization effects (due to industry
concentration) may operate for areas within cities but cited few studies of this. 9 The effective urban density of an area is the employment in that area plus the employment in adjacent areas weighted as a function
of the generalized cost of transport to the subject area. Thus, the effective density of an area can increase with lower transport costs
without any relocation of employment.

14
23. Such wider effects of transport have started to be incorporated into official government appraisal
guidance during the last few years. The approach represented by the UK (DfT, 2006) provides the most
comprehensive multi-criteria framework for the related impacts. Where there have been recent analyses of
agglomeration effects, the potential impacts have been shown to be particularly significant for rail projects
(DfT, 2006). Similar studies have also been undertaken in Germany, the Netherlands and Sweden. However,
the extent of agglomeration effects and their role in transport project appraisal in the emerging economies
remain largely unknown.
2.3 Choice of Regional Economic Impact Indicators
24. Many of the studies of regional economic impact have been undertaken by regional economists and
econometricians who have presented their results as percentage changes in productivity or GDP. The UK
approach10
discussed in the previous section similarly monetizes each of these impacts as a contribution to
economic output and/or consumer welfare as appropriate. Impacts upon the volume of jobs are not assessed
as part of this methodology.
25. However, the approaches used in both Germany and Japan (discussed further in Chapter 4) generate
physical indicators. The German approach incorporates a Spatial Impact Assessment (SIA) which scores the
accessibility and structural economic backwardness of each region in Germany for use in developing the
Federal Transport Plan, based on a range of socio-economic data pertaining to regional development
objectives. This provided a fixed set of regional weights which could then be applied to monetize a set of
physical indicators derived for each project under consideration, including the creation of new jobs and
economic activities.
26. An assessment methodology for rail investment in Japan (JRTT, 2011) adopts a spatial computable
general equilibrium (SCGE) model of the economy coupled with a demographic and migration model at the
prefecture level. This technically complex model enables predictions of the levels of both economic output
and volume of jobs along with a host of associated indicators11
for the with-project and without-project
cases. The indicators are not monetized; instead, they are presented in their natural monetary or physical
units for decision-makers to consider.
27. In China, the most important regional economic impacts are total economic output (i.e. GDP) and
jobs. Although the improvement in inter-city accessibility from HSR services may only provide limited
benefits to top officials and managers who have ready access to chauffeur-driven cars and a full range of
scheduled and special air services, it does offer a step change in travel speed of 50-100% for the majority of
professionals and middle ranking officials and managers who can thereby widen their market catchments.
The impact of this on the four effects listed in Section 2.2 is discussed below.
28. The first effect is increased competition due to better transport. It could be argued that most of the
light industrial and commercial tertiary sector in China is already highly competitive and this effect may be
minor for the sectors that use the HSR most extensively. Similarly the second effect, increased output in
imperfectly competitive markets, could also be expected to be small as the profit margins are generally low.
The third effect, welfare benefits from improved labor supply, is linked to labor tax rates, which are low in
China, with the majority of workers exempt from labor taxes, and hence the effect is likely to be small. The
labor market is already highly competitive owing to excess supply of labor in all but the specialist
10 This is also used in some other countries. 11 See Chapter 4 for details.

15
professional and managerial categories, and the key constraints in the supply of specialist workers at present
are to do with training and knowledge transfer (see the point (3) of the fourth effect below).
29. The fourth effect is agglomeration economies, such as (1) widening the range and variety of
products, (2) sharing a larger, wider and more flexible pool of labor, capital, and raw material inputs, and (3)
transfer of technology and innovation amidst increased learning and competition from more opportunities for
interactions among leading entrepreneurs and specialists. These effects are what the Chinese central planners
wish to achieve. International studies suggest that these agglomeration effects are likely to be the most
important component among the wider regional impacts12
.
30. Jobs are related to the total economic output for a region, but changes in jobs do not necessarily
move in the same magnitude or even the same direction as output as they are affected by industrial
composition, technical change, employment policies and legislations. The number of jobs as an economic
indicator represents a clear social dimension to the regional impacts and thus is complementary to the
indicator of total output.
31. An analysis of the impact on individual industry sectors helps to examine in detail the effects on
outputs and jobs, and the associated spatial dynamics triggered by the HSR. However, evidence for specific
industries from ex-post evaluation is likely to be elusive, as the changes triggered by the newly operational
HSR services will take time to build up and to be seen on the ground. A notable exception is the tourism
industry: many cities and towns on new HSR’s have seen a rapid increase in the volume of tourists. The
specific indicators of tourism need to be considered carefully, since HSR travel often enables the tourist to
leave just as quickly and conveniently as they arrive, and the total volume of tourist trade will need to be
separated into three components: the number of tourists, the duration of stay, and the spend per person per
stay.
32. In summary, the priority regional economic impact indicators are: (1) changes or the potential for
change in total economic output, particularly that arising from productivity growth triggered by
agglomeration economies; (2) changes or the potential for change in the total number of jobs; (3) changes or
the potential for change in the tourism trade, preferably separating out the number of tourists, duration of
visit and spend. All three effects have their roots in the underlying changes in the regional economy and
consumer behavior and will need to be estimated for each regional location. The changes in output and jobs
measure different dimensions of the overall economic impact, of which the tourism effects are a specific
component. How these indicators fit in the overall accounting of HSR impacts will depend on the boundaries
of the current assessment framework; we address this as part of the accounting question in Chapter 6.
2.4 Quantification of Regional Economic Impacts
33. The accumulated body of literature over recent decades shows that quantifying the impacts discussed
above is still an extremely challenging exercise; even in the OECD countries where the research has
progressed over a few decades, the evidence is still under considerable debate. Transport is one of many
necessary conditions for realizing the wider regional benefits and the degree of success depends on all the
conditions interacting with one another. The evidence to date suggests that HSR has its largest impacts on
high-end service sector activities and tourism, for which reliable data is often difficult to obtain. But even
with perfect observations of the effects through time, it is still likely that the effects observed are the net
12
The caveat is that such evidence in the literature comes mostly from developed countries.

16
result of many gains and losses offsetting one another across regions and across industry sectors13
. It is also
often difficult to isolate the effects rising from other transport investments that have occurred in parallel,
such as better airports or roads and the planning of the HSR schemes may have already factored in the
region’s high growth potential.
34. The overarching objective of a practical assessment methodology is to guide the development of
good HSR proposals. In an emerging economy such as China, the starting empirical base is invariably weak.
This suggests the application of a method that uses the ex post studies to build up the evidence base and
improve the predictive models, and sets up a virtuous cycle of model calibration and validation that
progressively refines the models and procedures used for ex ante studies. Identifying business decisions
actually taken in response to the HSR by organizations and individuals is an effective way to understand ex
post impacts if the user responses are analyzed within a clear framework. These responses can then be used
to refine the impact prediction models. However, in practice owing to political reasons, few ex ante
predictions have been revisited through ex post evaluation and few ex post findings have been used to
improve subsequent impact predictions; this has much diminished the opportunities to refine the subsequent
HSR schemes. In a country like China where the HSR network is still in the expansion phase of its coverage
and operations, there is significant benefit if a feedback loop can be established between successive ex ante
and ex post assessments.
Quantification of construction impacts
35. Where such effects have been formally calculated, they have generally used Leontief input-output
models (Leontief, 1986), which are now being replaced by computable general-equilibrium (CGE) models
which operate at the national, regional or project level, where the effects of major transport projects are
modelled as lump-sum investments. This helps to understand the multiplier effects of the investments on the
overall demand (as opposed to the spatial effects) for labor, industrial production and trade over the
construction period. The methodology for computing such benefits are well established. However, since the
construction impacts are not the focus of our study, the discussion on such impacts is not taken further in this
report.
Quantification of post-construction impacts
36. Oosterhaven and Knapp (2003)14
is a comprehensive review of the diverse attempts to identify and
quantify potential impacts of a major transport project. The methods have been classified into five broad
categories: (1) micro-surveys with firms; (2) estimation of quasi production functions; (3) regional macro-
economic models; (4) Land-Use/Transportation Interaction (LUTI) models; and (5) Spatial Computable
General Equilibrium (SCGE) models.
37. Among the five methods, the one that sets out to directly measure and understand the impacts in any
given situation is the micro-survey approach. This can gather a wealth of information through appropriate
surveys and interviews of businesses and individuals, in terms of both the mechanisms at work, and the
likely magnitudes of effects. However, the changes upon the routines in business activities and personal lives
13
For instance, interregional transport improvements may widen regional disparities in some cases whilst narrow them in others.
Connecting a city in Western China to a coastal center could allow firms to relocate to a place with lower labor and land prices, but it
could also allow firms in the coastal city to compete more easily and expand at the expense of the city in Western China. All being
equal, cities on the HSR may attract businesses and investment away from those off it. Within each city, some industries may gain
whilst others lose. 14
Spatial Economic Impacts of Transport Infrastructure Investments, Oosterhaven and Knaap; in: A. Pearman, P. Mackie & J.
Nellthorp (eds) Transport Projects, Programmes and Policies: Evaluation Needs and Capabilities, Ashgate, Aldershot, 2003.

17
are felt most acutely when the HSR services are introduced, which facilitates the before-and-after
comparison. This highlights the importance of carrying out in-depth interviews of businesses and the public
as well as the HSR passengers in the first couple of years of the HSR operations. As time goes by, the
existence of the HSR will be taken for granted, and it will be difficult to imagine the without-HSR scenario.
Although, with an appropriate set of questions, the survey of the HSR passengers will continue to have the
potential to produce a valuable time series data that reflect the regional economic impacts, as well as the
evolution of travel demand, it needs to be undertaken carefully if it is to identify the full long-term impacts.
38. The quasi-production function approaches postulate that regional output or employment levels are
related to some measures of transport investment or transport supply (e.g. in terms of the km of roads or
railway built), and multi-variate regression models have then been applied to quantify the influence of
transport upon the economy. Nevertheless, although they rely to a greater or lesser extent on economic
theories, it is often not clear whether the regression models have had adequate control variables and
appropriate model structures to account for other influences (such as skills of the labor force, capital
endowment in the industries, industry composition, etc.), and the complex interactions among the influences.
Many of the regression models are also hampered by confounding, i.e. both the economic and transport
variables were influenced by other factors not included in the production functions. The frequent lack of
robust theoretical foundations and the technical complexity in accounting for the complex dynamics of
growth and investment have meant that a simple and attractive partial equilibrium approach has often failed
to put forward convincing quantifications for practical policy use.
39. The three remaining models (regional economic model, LUTI and SCGE) have sought to address the
above issues and introduce explicit causal relationships in the model, so that the effects can be quantified in a
transparent manner. The models have quite distinct emphases, however. The regional economic models
tend to focus on the links among the sectors of the economy, through the use of sophisticated national or
regional input-output tables (for investment, trade and consumer demand) and social accounting techniques
(for incorporating population and employment effects); such models tend to have simplistic representations
of transport – which is often a non-geographical industry sector rather than spatially differentiated supply
and demand. By contrast, the LUTI models tend to address specifically the spatial nature of transport and
land use, although they by and large are not as sophisticated in representing the economic sectors, the labor
market or the agglomeration effects. The SCGE models aim to incorporate the strengths of both the regional
economic and LUTI models, but in the process they become technically much more complex and even more
data-hungry. As a result, no one model can provide ready answers to all the key policy questions posed
above within a practical timeframe.
40. Whilst the production approach appears to address well the overall impacts of transport upon
economic output in the study area– on the proviso that model structures are properly underpinned by
economic theory – the incidence of industrial location/relocation and the associated employment impacts will
have to be modelled more specifically through a regional economic model, a LUTI model, a SCGE model, or
any new models that can identify and quantify the spatial impacts in different parts of the study area.
41. Such spatial economic models will need to represent relocation of industries, as well as the
expansion of existing industries as transport accessibility changes. In addition, the model will need to be
able to represent the different rates of ‘churn’ among the different industries, e.g. typically, the high-end
service industries tend to be more foot-loose (i.e. with lower costs for relocation and thus more prone to
influences of transport accessibility change) than manufacturing (which are typically ‘foot-bound’ within the
investment cycle of factories and production lines). There are also natural ‘churn’ rates, i.e. at a given
moment only some of the foot-loose firms are prone to influences of relocation (Jin et al, 2013). Such

18
considerations inevitably add to the complexity of the spatial models, but they appear crucial in representing
the impacts in a realistic manner.
42. Successful past experience in employment location modelling (see review by Jin and Echenique,
2012) suggest that the industry location and employment location models should be developed gradually in
line with the evidence base. Given that in China very little empirical evidence currently exists for practical
purposes, the initial industry and employment location models have to start with very simple forms. Since
the majority of the transport professionals have a reasonably sound knowledge of the discrete choice
framework (e.g. for their work in mode choice modelling), spatial competition models that are set up to
examine the relative gains and losses of production and employment by location may be a suitable starting
point. This is similar to the LUTI model framework set up for practical policy modelling (see Jin and
Echenique, 2012). In time such models may be extended to cover regional economic and SCGE modelling.
43. All five types of models are reviewed in more detail in Appendix 2.
Model verification and updating
44. Verifying and updating any model is clearly a key consideration in model development. The main ex
ante policy interest is focused at the macro level but any impact assessment is subject to the underlying
assumptions about the trends of overall output employment levels, travel demand and generalized travel
costs across the study area (i.e. the HSR corridor as well as its catchment area). The validity of the ex-ante
predictions rests primarily upon the underlying theories, econometric estimation and assumptions adopted,
reinforced by corroboration from similar HSR case studies. Ex-post studies undertaken after the HSR
services are in operation can yield new information that will help refine the predictive models and update the
predictions. The revised predictions can also be compared with interviews and surveys to see if the nature
and magnitude of impacts predicted by the econometric models are corroborated by businesses and
passengers.
45. Ex-post analysis must allow for the changes in output, jobs and tourism for each city, town or county
to result from a wide range of factors. Econometric analyses and modelling thus need to control for such
external influences when isolating the contribution of transport (and HSR in particular) changes to
accessibility and the economic mass.15
This includes having a strategy for dealing with the causality
problem, i.e. in some cases the strength of the local economy may result in the placement of the HSR line,
and in others the reverse could occur. There may also be unobserved factors which are correlated with both
output and increased accessibility. Apart from applying statistical tests regarding the robustness of the
econometric findings, the results should therefore always be verified as far as possible through micro-level
studies.
46. Such links between the ex-ante and ex-post assessments are likely to play a crucial role in China
because the Chinese HSR network is still being expanded and refined, and its connections with the rest of the
transport system, the catchment cities and the wider economy are being constantly readjusted. Not only
should new HSR projects be viewed in this light – the rapid economic and urbanization changes imply that
regional impact assessment may play a useful role in refining the design of the HSR network and its
integration in the urban landscape throughout its operation period.
15 For a precise definition of the economic mass, see Chapter 5 below.

19
2.4 Summary
47. In China, as elsewhere, the main priority indicators for policy and project assessment purposes are
the potential and actual changes in regional output and jobs. At the incipient stage of HSR development,
there is also a keen interest in assessing the impact on the tourism industry in China.
48. The effects on output, jobs and specific industries are complex. A HSR project introduces a step
change in transport accessibility to and from the cities it serves. All being equal, this offers an expansion of
the economic mass that is accessible to those cities. The expansion of the economic mass potentially
increases the opportunities for knowledge transfer and innovation, which should lead to increased
productivity of those who work in those cities.
49. Whether such potential can be realized in practice in each region depends to a significant extent on
local circumstances, such as industry clustering, local resources, labor supply, entrepreneurship and
governance. In reality there may be both gains in output where the potentials have been well capitalized,
and losses elsewhere because of competition and/or comparative disadvantages. In some cases economic
activities tend to concentrate on the cities already well developed, and in others there can be dispersal. The
impacts may differ by industry and type of consumers.
50. To model the full extent of the dynamic interactions very complex simulation models are required.
This is well beyond the technical capability available for practical project assessment even in the developed
countries such as Germany, the UK, and Japan (cf. Chapter 4). It is therefore advisable to consider simpler
methods that are built on rigorous theories but can be (1) made operational under the current levels of skills
and data availability, and (2) can be gradually updated along with a gradually enhancing evidence base. This
has often led to the establishment of simpler, partial equilibrium models for productivity effects, employment
location and consumer behavior. We will turn to the detailed methodological specifications in Chapter 6.
51. However, it is already clear from the review that individual theories and methods have so far been
mostly applied in isolation from each other, rather than in tandem, e.g. for checking whether they corroborate
with one another. In particular, there is ample potential in linking ex-post micro-level surveys with the ex-
ante predictions at the macro level, in order to understand better the mechanisms and magnitudes of the
impacts from the viewpoint of businesses and travelers and progressively improve the quantification of
regional impacts.

20
CHAPTER 3 AN OVERVIEW OF REGIONAL ECONOMIC IMPACT
ANALYSES OF RAILWAY PROJECTS IN CHINA
3.1 Progress in Research and Practice
History of economic evaluation for railway construction projects in China
52. In October 1992, the Planning and Statistics Bureau of the Ministry of Railways (MoR), which later
became the Division of Development and Planning, and the Transportation Department of China
International Engineering Consulting Corporation (CIECC) drafted and issued the Methods on Economic
Evaluation for Railway Construction Projects (MoR and CIECC, 1993)
53. In January 1997, this guideline was revised by both these agencies, together with the Transportation
Environmental Protection Evaluation and Review Bureau of China Development Bank (MoR and CIECC,
1997).
54. In November 2011, the Ministry of Housing and Urban-Rural Development (MoHURD), the
National Development and Reform Commission (NDRC), and the MoR approved the release of the Methods
and Parameters for the Economic Evaluation for Railway Construction Projects (MoHURD, NDRC, and
MoR, 2011).
55. Along with the Methods and Parameters for Economic Evaluation for Construction Projects (3rd
Edition), the Methods and Parameters for Economic Evaluation for Railway Construction Projects published
in 2011 added contents about regional economic and macro-economic analyses. In a separate chapter, it
defined specific concepts and contents for the analysis of regional economic and macro-economic impacts of
railway construction projects, and formally integrated the analysis of regional economic and macro-
economic impacts as a component of economic evaluation process.
56. Indicators for the evaluation on regional economic impact of railway construction projects include:
Gross economic output
Economic structure
Social and environmental impacts
Affordability
57. The framework for regional economic and macro-economic impact analysis roughly describes how
to quantify the first three indicators, which calls for further methodological specifications.
Regional economic impact evaluation of construction projects in other fields
58. The theoretical research on the regional economic impact of large construction projects by Zheng
Youjing et al. (1994) was among the earliest Chinese literature analyzing the regional economic impact of
large construction projects in China. It applied methods including an indicator system and input-output
analysis and carried out a comprehensive feasibility study considering various factors that addressed social,
economic, and environmental impacts of regional ultra-large projects. Li Jingwen et al. (1997) demonstrated
the regional economic benefit of South-to-North Water Transfer Project in terms of the water supply,
economic aggregation, and industrial development of the region.

21
59. More and more studies have emerged since the 2000s in the economic literature with more in-depth
analyses on regional impact of large-scale construction projects in China. Li Ping et al. (2003) described the
basic concepts of analyzing regional economic and macro-economic impacts of large-scale investment
projects, discussed the similarities and differences between the analysis of regional and macro-economic
impacts and conventional economic evaluation, and also recommended an evaluation system with indicators
and a number of analytical methods. In terms of the indicator system, Li Ping et al. (2003) proposed gross
economic output indicators such as the regional value added, economic structure indicators like multiplier
factors and sensitivity tests together with several additional indicators like employment effects. With respect
to empirical studies, they introduced analytical methods such as macro-econometric models, input-output
models and system dynamics models, as well as index methods and expert evaluation methods.
60. Li and Xu (2004) analyzed the regional and macro-economic impacts of the South-to-North Water
Transfer Project on beneficial regions in northern China in terms of regional development, population,
employment, anti-poverty, economic development, fiscal revenue, and regional development gap. Their
calculation was based on location quotients and a computable general equilibrium (CGE) model, and they
established an evaluation system using indicators.
61. Studying the facilitating mechanism of large-scale highway projects on regional economic
development, Meng Wei (2006) adopted a comprehensive multi-fold evaluation method to evaluate those
projects’ impacts on the foundations of regional economic development, industrial development, and
economic development.
62. Ming et al. (2007) reviewed the evolution of evaluation methods for large transportation construction
projects at home and abroad. They conducted a case study for the Wuxi-Nantong River Crossing Pathway,
and carried out a preliminary empirical analysis of regional economic impact using traffic volumes and
regional economic aggregates.
63. Lao (2007) indicated that there were limited theories and methodological studies concerning regional
economic impact analysis, which resulted in evaluation principles and specifications not being properly
implemented in practice. For this matter, he presented the basic principles and main coverage of regional
economic evaluations, and set out corresponding evaluation methods and indicators.
64. Dong et al. (2008) conducted a quantitative analysis of regional impacts using statistical data. The
analysis revealed that Zhentouba and Shaping hydropower stations would boost the regional economy,
increase jobs, save energy and mineral resources, and reduce GHG emissions.
65. Wu et al. (2009) discussed the importance and indicators of the impact of highway projects on
regional economies, and came up with indicators for evaluating regional economic impacts. Utilizing a linear
regression, they conducted a quantitative analysis of economic growth and job addition, and a qualitative
analysis of fiscal revenue increase and industrial structure optimization.
Regional economic impact evaluation of railway construction projects in China
Applied studies
66. In 2006, Sun Yongfu, Academician of the Chinese Academy of Engineering and the former Vice-
Minister of the MoR, led a study on the significant impact of the Beijing-Kowloon Railway on economic and
social development. Based on ten years’ operation of the railway, this study made a detailed analysis of the

22
influence of the railway on economic and social development along the line, and conducted quantitative
analyses with theoretical methods and models for social benefit analysis and evaluation.
67. The research found that contributions of the railway to local economic growth lay in the fact that its
operations drove up the gross value added of relevant industries in regions along the line. The study also
calculated the direct value added created by the railway, and further calculated the multiplier effects of the
relevant industries as a result of the construction of the railway.
68. In terms of the direct value added, the study estimated that during the preceding ten years of
operation the Beijing-Kowloon Railway had created about 124.4 billion yuan, accounting for 4.33% of that
of the railway transport industry of China and approximately 0.09% of national GDP (Table 1) based on this
research (Sun, 2009). The impacts of railway on the value added of other industries, i.e. ripple effect, are not
included in the table.
Table 1. Direct Impacts of the Value Added by Beijing-Kowloon Railway: 1997-2006
Year
GDP
Added Value of
Railway
Transportation
Industry
Passenger and
Freight
Turnover of
Beijing-Kowloon
Railway
Passenger and
Freight
Turnover of
Railway
(100 million
tons/km)
Proportion of
Turnover of
Beijing-Kowloon
Railway in That
of Railway
Transportation
Industry
Direct Added
Value from
Beijing-
Kowloon
Railway (100
million yuan)
Proportion of
Direct Added
Value from
Beijing-
Kowloon
Railway to that
of China
(100 million
yuan) (100 million yuan)
(100 million
tons/km)
1997 78973.0 1597.0 450.38 16837.9 2.67% 42.72 0.05%
1998 84402.3 1732.7 589.66 16290.4 3.62% 62.72 0.07%
1999 89677.1 1907.79 738.49 16973.9 4.35% 83.00 0.09%
2000 99214.6 2384.08 797.07 18434.6 4.32% 103.08 0.10%
2001 109655.2 2687.44 871.49 19460.9 4.48% 120.35 0.11%
2002 120332.7 2989.93 951.48 20627.8 4.61% 137.91 0.11%
2003 135822.8 3288.04 1015.45 22035.3 4.61% 151.52 0.11%
2004 159878.3 3541.03 1202.68 25001.2 4.81% 170.34 0.11%
2005 183084.8 3783.95 1300.27 26788.0 4.85% 183.52 0.10%
2006 209609.5 3782.59 1413.02 28304.74 4.99% 188.83 0.09%
69. The value added by other industries as a result of the Beijing-Kowloon Railway in the past 10 years
for the 15 cities along the line (Langfang, Hengshui, Cangzhou, Liaocheng, Heze, Puyang, Shangqiu,
Xinyang, Fuyang, Huanggang, Jiujiang, Ji’An, Ganzhou, Heyuan, and Huizhou) was calculated based on the
difference in GDP of the cities in two cases: “with Beijing-Kowloon Railway” and “without Beijing-
Kowloon Railway”. A regression model was estimated on the observed data for the period 1988-1996, and
used to predict the GDP growth of these cities under the counterfactual scenario “without Beijing-Kowloon
Railway” in which the study area had not benefited from such railway. A comparison between the observed
GDP growth during 1997-2006 (i.e. with the railway) and the counterfactual suggests that the operation of
Beijing-Kowloon Railway increased value added for the 15 cities by 776.5 billion yuan, more than six times
the direct value added produced by the railway construction.
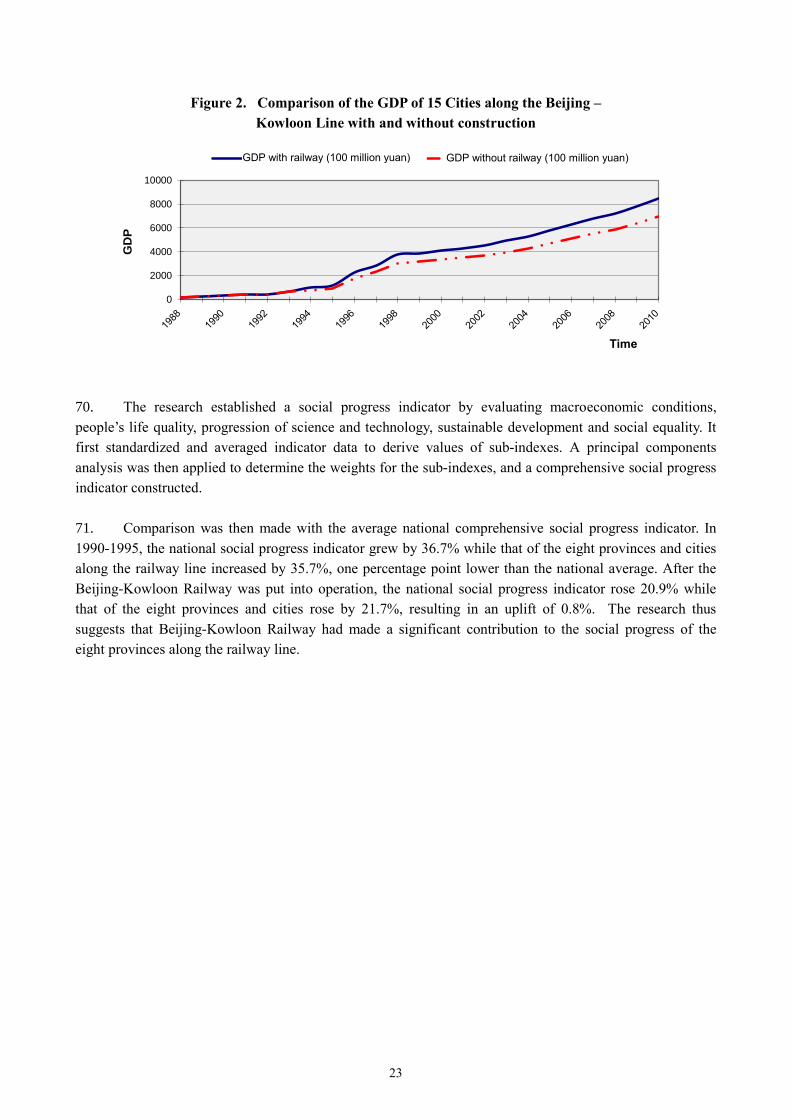
23
Figure 2. Comparison of the GDP of 15 Cities along the Beijing –
Kowloon Line with and without construction
70. The research established a social progress indicator by evaluating macroeconomic conditions,
people’s life quality, progression of science and technology, sustainable development and social equality. It
first standardized and averaged indicator data to derive values of sub-indexes. A principal components
analysis was then applied to determine the weights for the sub-indexes, and a comprehensive social progress
indicator constructed.
71. Comparison was then made with the average national comprehensive social progress indicator. In
1990-1995, the national social progress indicator grew by 36.7% while that of the eight provinces and cities
along the railway line increased by 35.7%, one percentage point lower than the national average. After the
Beijing-Kowloon Railway was put into operation, the national social progress indicator rose 20.9% while
that of the eight provinces and cities rose by 21.7%, resulting in an uplift of 0.8%. The research thus
suggests that Beijing-Kowloon Railway had made a significant contribution to the social progress of the
eight provinces along the railway line.
0
2000
4000
6000
8000
10000
GD
P
时间
有铁路时GDP(亿元) 无铁路时GDP(亿元) GDP with railway (100 million yuan) GDP without railway (100 million yuan)
Time

24
Table 2. Comprehensive Social Progress Indicators of Eight Provinces and Cities
along Beijing-Kowloon Railway compared with the national average of China
Year 1990 1995 1996 1997 1998 1999 2000 2001 2002 2003 2004 2005
National average
- China 5.158 7.050 7.213 7.582 7.432 8.050 8.003 8.7198 9.250 10.300 11.030 12.170
Beijing 5.230 7.999 8.601 8.913 9.398 9.588 9.324 10.001 10.384 11.040 11.854 12.830
Hebei 5.460 5.870 8.978 8.651 9.040 9.133 9.536 9.362 10.050 10.820 10.968 11.320
Henan 5.562 6.159 6.422 6.481 6.462 6.894 7.680 7.645 8.1787 9.6750 9.9282 10.930
Shandong 3.540 6.788 7.094 7.460 7.873 8.526 9.169 9.623 10.400 10.510 10.827 11.160
Hubei 5.820 7.075 7.502 7.875 8.405 7.772 7.129 8.924 10.260 10.780 11.471 11.460
Guangdong 4.670 6.693 7.084 7.364 7.378 7.506 7.891 8.154 10.620 10.490 10.556 11.040
Anhui 6.170 7.216 7.298 7.479 7.883 8.307 8.406 8.639 10.480 11.420 11.247 11.830
Jiangxi 3.550 6.464 6.679 6.829 7.822 8.472 8.718 9.022 9.191 9.3840 9.7279 10.560
Theoretical studies
72. Lin and Chen (2006) wrote the Quantitative Performance Evaluation of Infrastructure Investment. It
reviewed theories for assessing the regional economic impact of infrastructure investment, and put forward a
quantitative evaluation method on the basis of land price functions, accessibility indicators, and the degree of
regional sustainable development with railway infrastructure.
73. In terms of regional economic benefits, they separately discussed the impact of transport projects on
1) the land prices in cities along the line, 2) accessibility of cities, and 3) regional sustainable development.
74. The approach includes a number of components. First, the Beijing-Kowloon Railway was taken as a
case study to analyze the influence on land price in cities along the line. A regression model was built to
explore the interactive effects of railway lines and land price of cities, as a function of population,
passenger/freight volume and residents’ consumption of the selected city. The adopted regression model
was:
∆p=-126.288+12.901lnx1+24.478lnx2+0.392lnx3 (3.1)
75. Three variables (x1, x2, and x3 respectively) are: population, project completion time, and passenger
and freight traffic intensity. The book indicated that the model is most applicable to cities as sub-regional
centers or industrial centers as there was no significant correlation for cities of other types.
76. Second, the quantitative analysis of influence on intercity accessibility selected three indicators:
weighted average travel times, economic potential, and daily accessibility.
77. Weighted average time was a measure for the time from a nodal point to each economic center. It
was mainly determined by the geographical location of nodal point, and was also highly related to the
strength of economic activities at centers and the level of service of traffic facilities connecting the nodal
point and the economic centers. A lower indicator meant higher accessibility and closer relation with
economic centers. Therefore, for an individual city, the indicator for downtown would be lower than that for
urban fringe areas. In a large economic area or urban cluster, the indicator would be much lower for areas
closer to economic centers. This specific formula is:

25
1
1
n
ij j
j
i n
j
j
T M
A
M
(3.2)
which, Ai refers to the accessibility of nodal point i. Tij is the shortest time from nodal point i to economic
center (or destination) through a certain traffic facility and network. Mj is the strength of socio-economic
activities in economic center or activity destination, indicated by variables such as GDP, population, or total
sales of social commodities. It reflects the economic strength of the economic center and its influence or
attraction to the surrounding area. n is the total number of nodal points excluding the center i.
78. Economic potential was primarily determined by the economic location of the nodal point for
evaluation. A higher value meant a high accessibility and vice versa. The value had a positive correlation
with the spatial effect between the nodal point and the other economic centers/activity destinations. The
magnitude of the effect was positively correlated with the scale and strength of economic centers, and was
inversely proportional with the distance, time or cost from the nodal point to economic center. This formula
adopted the gravity model in physics, which is :
1
nj
i
j ij
MP
D
(3.3)
where, Pi refers to the economic potential of nodal point i. Dij means the time cost or distance from nodal
point i to economic centers or activity destination j by a certain transport facility and network. refers to
the impedance of distance, usually set to 1.
79. Daily accessibility referred to the degree and volume of all kinds of activities from a nodal point i to
other areas (including business, travel, and residence) within a day. It could be measured by either the flow
of passenger or freight concerned in those activities, or the maximum daily catchment area. This study
adopted the latter approach. Additionally, time span was set to be 8 hours (namely working time in a day),
and the time limit from nodal point i to destination was 4 hours. The degree of daily accessibility was
directly related to the level of service and completeness of traffic facilities. A larger daily catchment area
implied higher levels of accessibility.
80. Using the Beijing-Shanghai HSR as a case study, this article made a before-and-after comparison of
four cities, of which two were located near the railway and two were located far from it, in order to examine
the impacts of the railway project. The results suggested that trunk traffic corridors had a significant impact
on city accessibility. The above three indicators were all feasible in terms of quantifying accessibility.
However, expert judgment was still needed to benchmark the accessibility improvements.
81. Third, for the analysis of impact on regional sustainable development, a sustainable impact indicator
system was established which considered the integrity, hierarchy and dynamics of sustainable development.
The analytic hierarchy process (AHP) method was adopted to determine the weight of each indicator, based
on which quantitative analyses were undertaken.
Other studies
82. In the late 1990s, academic circles in China took part in an extensive debate on the construction
plans for the Beijing-Shanghai HSR. A number of research studies were carried out investigating the

26
relationship between railway construction projects and the regional economy, which triggered in-depth
discussions on the methods for evaluating the regional economic impacts of railway projects.
83. Li Jingwen (1998 and 2000) established a model for analyzing economic development impacts in six
regions along the Beijing-Shanghai HSR. A production function based approach was adopted to predict the
impacts of alternative plans. The study concluded that the construction of the Beijing-Shanghai HSR would
make a significant contribution to regional development along the line.
84. Focusing on qualitative analysis, Hu and Shen (1999) carried out a systematic analysis of the impact
of Beijing-Shanghai HSR on the related regional economy in terms of relieving transport pressure, saving
travel time, shaping economic integration, promoting knowledge dissemination, driving the development of
tertiary industry and tourism, and increasing job opportunities.
85. With a log-linear model and a Grey Prediction model, Zhao and Lin (2010) conducted a quantitative
analysis of the regional economic impact of the Beijing-Tianjin Intercity Railway in terms of relieving
transport congestion, reducing travel time, economic integration and high-tech industry development.
86. Lin et al. (2010) established an analytical indicator system for analyzing the impact of HSR on the
regional economy. Using Grey Prediction and multivariate linear regression models, they calculated relevant
economic indicators of Beijing and Tianjin in 2008 and 2009 without the intercity railway. Then, comparing
with- and without-project scenarios, they compared the contributions of the railway to regional economic
development in both regions in those terms.
3.2 Regional Economic Impact Analysis in China: Outlook
87. The above studies in China accumulated a wealth of insights into the regional economic impacts of
large construction projects including major railway investments. Some of the theoretical models were
established on robust economic theories (e.g. Li Jingwen, 1998; 2000). New analytical methods were
explored (Hu and Shen, 1999; Lin and Chen, 2006; Zhao and Lin, 2010; Lin et al, 2010). Lack of
appropriate data sources have made it very difficult, particularly in the earlier years, to carry out systematic
studies. Large scale research projects focusing upon ex-post studies, such as Sun Yongfu (2009), shed
significant and valuable light upon the range of regional impacts along the Beijing-Kowloon corridor. The
studies provided quantitative as well as qualitative evidence in understanding the significance and potential
magnitude of the impacts, which is a valuable foundation for the on-going research on regional impacts.
Four insights are particularly relevant to this study.
88. First, the research studies from a wide variety of theoretical and methodological perspectives suggest
that there are potentially significant regional economic impacts – on output, jobs, productivity and well-
being – that arise from the large scale investment projects on rail. The impacts are complex, with myriad
linkages, the most analytically challenging of which are inter-sectoral and spatial ones. Although the main
empirical studies suggest that the impacts are significantly positive, the theoretical models cannot rule out
that there would not be negative regional impacts. There is a huge appetite among the policy makers and
researchers to understand these complex impacts, particularly in the current era as HSR projects move from
coastal trunk lines to regional branches and connections in underdeveloped regions.
89. Secondly, the existing data sources are as yet far from adequate to inform the building and
calibration of sophisticated empirical models that would be necessary to discern and assess the complex
patterns of regional impacts. Existing statistics and traditional methods of data collection are not sufficient

27
for pinpointing the specific effects that arise from the HSR projects, thus resulting in ambiguity among gross
and net effects. New types of data would be needed, particularly regarding agglomeration effects, producer
and consumer behavior, the drivers for business relocation, and the interactions with urban development and
land use policies. Because such data sources are difficult to collect and are typically not available without a
significant time lag, it would be necessary to consider theoretically robust ways to collect the data and design
data collection programs over time, e.g. as part of the on-going monitoring of the HSR operations.
90. Thirdly, engagement of Chinese scholars and practitioners with the experience, theories and methods
that are developed in other countries has proven to be fruitful. In effect, there is a high degree of
commonality regarding policy questions and analytical challenges across the different countries – an
international perspective would therefore facilitate more rapid development of theories and methods. There
will be mutual benefit - given that China has become a leading country in HSR use, the Chinese experience
is likely to play an increasingly significant role in this field.
91. Finally, the vast majority of existing research appears to be unconnected with the cost benefit
analyses currently being used in planning new HSR projects. It is often unclear how much overlapping there
is among the different metrics, and whether it is possible to eliminate any double-counting so that the project
alternatives can be compared on a consistent basis. This is of course not unique in China – such problems
exist in most countries. However, for practical policy and planning purposes we will have to address this
problem when designing and implementing the assessment framework.

28
CHAPTER 4 REGIONAL ECONOMIC IMPACT ANALYSIS:
AN INTERNATIONAL REVIEW
4.1 Overview
92. This Chapter considers the experience outside China in terms of assessing regional economic
impacts of HSR in practice. Over the last thirty years a substantial literature covering both ex-ante and ex-
post studies has developed, documenting the main impacts in a number of countries. However, many of these
are theoretical, as already mentioned in Chapter 2. To focus on the most relevant methods, this Chapter
concentrates on studies which are concerned with actual projects rather than general approaches. We first
outline the history and nature of the literature in this overview, and then summarize the main findings of the
ex post and ex ante studies.
93. The international experience is diverse, reflecting the geography of the individual countries. Both
Spain and France, for example, have a concentration of population in a limited number of large cities, with
relatively low population densities in between, and the HSR networks link their respective capitals with the
main provincial centers. Germany’s intercity express (ICE) train system, by contrast, links a series of
regional centers, many of them substantial cities but none of them dominant. Japan, being a country with
severe urban land constraints, has shaped the HSR lines as the backbone of communications in its major
conurbations. However, a number of underlying themes, reflecting the role of transport accessibility in
shaping the spatial economy, do emerge, when the effects are considered against an agglomeration
economics framework.
94. In developed countries, many types of ex-ante models have been developed extensively over the
years, commonly with a view to tackling the more general problem of estimating the spatial economic
impacts of transport infrastructure investments. A wide range of these general predictive models have been
applied to potential HSR projects but relatively few appear to have been any part of the practical decision-
making process. Several ex-post studies and reviews have been undertaken following high-profile HSR
projects but most of these are of a qualitative nature and, whilst interesting, are of limited use in model
development or calibration. Excluding the various on-board passenger surveys, which are very common and
provide an estimate of the level of generated traffic, there have only been three studies that attempt
significant quantitative analysis of the HSR impacts on regional economies.
95. Economic historians have since the 19th Century undertaken many studies on the impact of railway
networks on economic growth, including in colonial India, Tsarist Russia, South America and the US16
.
However, in all those studies, there was hardly any mention of the influence of improved passenger travel on
economic productivity, their attention having instead been focused on the changes in market size and
catchments as the result of the often order-of-magnitude reductions in freight costs provided by rail17
.
96. One of the earliest references to the wider benefits brought by improved passenger transport was
published in 1850 and discussed the improvements that railways could bring to small rural communities in
Canada (see Box 1). Besides discussing the increase in trade possible through cheaper transport, it describes
16
Where there is a particularly well-known study by Fishlow (1965) 17
This is not to say such reductions were universal. Coastal and river shipping and canals continued to provide strong competition
for freight transport through much of the nineteenth century in many countries.

29
both the process of economic development and, more importantly, the potential for easier transportation to be
a catalyst for transmitting innovation and contributing to a more productive economy.
97. In the European context, Kopp (2005) examines how transport infrastructure stock influences the
total factor productivity at the country level. It uses a panel data model to address the issue of endogeneity,
and identifies contribution from transport investment to productivity. Based on the data of OECD countries,
the research indicates that doubling transport infrastructure such as road stock in a country will lead to about
10% growth in total factor productivity. This study provides a macro perspective of the impacts of transport
projects.
4.2 Ex Post Studies
98. A useful starting point of ex post studies is France, whose HSR lines lie in the middle of the range of
the very different operational environments across the main HSR countries. The first French Train à Grande
Vitesse (TGV) line, Paris-Lyon, opened in 1981, primarily to relieve congestion on the main Paris-Dijon-
Lyon line. The line was then extended south to Marseilles, and other lines and extensions were built
generally where there was thought to be enough demand. Many of the French HSR routes have sections of
dedicated HSR track but use normal track to start or end the journey (e.g. Paris-Geneva). Fares and fare
Box 1. Regional economic impacts 1850
[As the railroad was put into operation] “… some of the ‘city folks’ come out [of the existing urban
area] and take up a water privilege, or erect steam power, and commence manufacturing. Iron is
bought, cut into nails, screws and hinges, cotton is spun and wove, and all the variety of manufactures
introduced, because here motive power, rents and food are cheaper, and labour more easily controlled
than in the cities, while transportation and distance have by the Railroad been reduced to a minimum.
A town has been built and peopled by the operatives—land rises rapidly in value—the neglected
swamp is cleared and the timber is converted into all sorts of wooden ‘notions’—tons of vegetables,
grains, or grasses, are grown where none grew before—the patient click of the loom, the rushing of the
shuttle, the busy hum of the spindle, the thundering of the triphammer, and the roaring of steam, are
mingled in one continuous sound of active industry. While the physical features of our little hamlet are
undergoing such a wonderful transformation, the moral influence of the iron civilizer on the old
inhabitants is bringing a rapid ‘change over the spirit of their dreams.’ The young men and the
maidens, the old men and the matrons, daily collect around the cars; they wonder where so many well-
dressed and rich-looking people come from and are going to, etc,—what queer machines those are
which they see passing backwards and forwards. They have perhaps an old neighbour whose son had
long since wandered off, and now they see him returned, a first-class passenger with all the prestige of
broadcloth, gold chains, rings, gloves, and a travelled reputation : the damsels rapidly impress upon ‘
the mind's eye’ the shapes of the bonnets, visites, etc., of that superior class of beings who are flying
(like angels) over the country, and drink in, with wide-mouthed admiration, the transcendent splendour
and indescribable beauty ‘ of’ that ‘ere shawl.’ All are interested, all are benefitted, cuique suum. Is he
a farmer? he has a practical illustration of the superior cheapness of transportation by increasing the
load—the cart is abandoned for the wagon—for he sees the railroad, notwithstanding the great cost of
the cuttings, embankments, tunnels, bridges, engines, cars, and stations, carrying his produce for a less
sum than his personal expenses and the feeding of his horses would amount to. Is he a blacksmith? he
determines his son shall no longer shoe horses, but build engines. Is he a carpenter? he is proud of his
occupation as he surveys the new bridge over the old creek. Even the village tailor gathers ‘a wrinkle,’
as he criticises the latest effort of Buckmaster or Tibb, whilst the unconscious advertiser is swallowing
his coffee. Thus curiosity and emulation are excited and the results are discernible in a general
predilection for improved ‘modes.’ A spirit is engendered which is not confined to dress or equipage,
but is, roads, rapidly extended to agriculture and instructive societies” Quoted from Keefer (1850).

30
strategy are generally the same as those on conventional trains (including yield management borrowed from
airlines, and discounts for many types of passenger). France differs from Japan, Korea, and Britain, which
use exclusive HSR track for the full distance, from Germany where there is relatively more conventional
track and where ICE trains have higher fares, and from Spain, where fares differ from those of normal trains.
99. One of the most systematic papers to examine the impact of the TGV appeared in 198618
, which
reported the results of before-and-after surveys of business behavior with the aim of identifying the effect on
both businesses based in Rhone-Alps (RA), the region in which Lyon is situated, and the impact on Paris-
based (PA) firms. High-level service industries flourished; trips from Paris increased by 52% but trips by
RA-based firms increased by 144%; thus, contrary to the expectation that Paris-based firms would swamp
local firms, the reverse occurred and services were able to expand outside Paris. However, it appeared that
the TGV was not a determining factor in the location of business location but was certainly a factor in
selecting between alternative locations which were otherwise reasonably similar. Further regional studies
suggest with anecdotal evidence that some head offices subsequently moved from Lyon to Paris, although
such evidence has not been systematically studied19
.
100. Examples of centers besides Lyon where there has been a positive interaction between HSR and
regional development include Lille, on the crossroads between Paris, London and Brussels/Amsterdam,
which has built up the largest university/medical complex in Europe and substantial regional banking and
insurance activities; Le Mans, now a major center for the insurance industry; Rheims, where new university
campus extensions have complemented existing tertiary education, and a center for online information
technology-based services and back office services (accounting, information technology, human resources);
Marseilles, where a successful new business park and entertainment center, Euroméditerranée, were
constructed close to the HSR station. However, there are also cases where there are few positive and some
negative impacts around HSR stations. For example, Le Creusot, Montceau, and Montchanin are declining
mining areas and experienced no measurable regional development impact. In Mâcon, business areas were
set up in an attempt to attract activities that needed fast connections to Paris and Geneva, but had limited
success. Rural areas in the northeastern part of France around Lille also experienced ‘tunnel’ effects,
meaning they have the negative noise and visual impacts of the HSR line running through the countryside
but no direct improvements in access. Small towns without TGV stations in this area reported losses of some
services to larger centers that have stations. It is therefore clear that success is not guaranteed and that active
local policies are essential to promote HSR-related development.
101. The experience in Spain is in many ways similar to that in France, with the impact of HSR
depending on the size of the city, its location relative to others on the rail line, and its location relative to the
capital, Madrid. The primary policy objective of HSR in Spain was to connect all the major coastal cities to
Madrid with a rail journey time of not more than four hours, but the first line to Seville was also intended to
provide sufficient capacity for the 1992 World Expo as well as to achieve a policy objective of improved
connections to the relatively undeveloped south of Spain20
. Other lines were then built between 2003 and
2008.
102. A national strategic objective of reducing regional disparities by investing in HSR appears to have
been successful, albeit the level of success may be modest. An Organisation for Economic Co-operation and
Development (OECD) report notes Spain was one of only eight OECD countries (five of which had
18
Bonnafous A, The regional impact of the TGV, Transportation 14, 1986,pp 127-137 19
See Chen and Hall (2011). 20
Invensys Rail & Oxford Analytica, The benefits of high-speed rail in comparative perspective, 2012.

31
significant HSR lines) in which regional inequality decreased between 1995 and 200521
. Although the
introduction of HSR was only one of several policy measures in Spain, it nevertheless seems that HSR added
value to a wider mix of regional policy measures.
103. Spanish HSR suggests that key factors in maximizing the development benefits of HSR, in addition
to good planning and strong political leadership, include22
:
The station should be located close to the city center, preferably close to established business
activities.
Land should be released for mixed-use development, including offices, residential, conference
facilities, public services and open space.
A city transport hub with good local, sub-regional and regional services
Plans for signature architecture to address image and sense of place.
A mix of public and private sector investment.
A development corporation or similar organization should undertake collaborative public-private
real estate development in the station precincts.
104. A detailed econometric study of the impact of improved accessibility on a regional economy
investigated the impact of the Cologne – Frankfurt high-speed line on two small towns, Montabaur and
Limburg, situated between the two cities. The two towns are small (with respective populations of 12.500
and 34,000) and are located only some 20 km apart around the midpoint of the line. The HSR line was
opened in 2002 and more than halved rail travel times along the route, bringing the two towns to within 30
minutes of both Frankfurt and Cologne. The analysis showed that the increase in market access led to
economic adjustments over a four year period, centered on the two town rail stations, with an estimated
increase in GDP in these areas of 2.7%. The result was robust against a range of alternative assumptions,
indicating a 0.25% growth in GDP for a 1% increase in market access, with this increase remaining once the
initial impact of the HSR has been absorbed23
.
105. In 1977, UK introduced 200 km/h services operating on conventional track at speeds of (currently)
up to 200km/h, reducing journey times by up 20-30% and bringing many regional centers into relatively easy
commuting distance to London. A detailed study of the long-term regional economic impacts of these
services compared six routes radiating from London, two with high-speed services and four without over the
30 years from 1976 to 2006, using a range of economic and employment variables.
106. The conclusions drawn from the data were qualitative rather than quantitative, reflecting the nature
of the analysis. The HST service appeared to have had positive spatial-economic impacts on most cities
within a 2-hour train time to and from London (this covered much of UK for those routes on which the
services operated) and these centers demonstrated particular strength in knowledge-intensive services. HST
centers within 1 hour of London demonstrated major population increases, with knowledge-intensive
industries again prominent. In contrast, the non-HST towns were characterized by a generally weaker local
economic performance, demonstrating the generally positive impact of HST on regional growth. However,
the weak performance of some centers served by HST services reinforces the commonly-expressed view that
HST cannot by itself guarantee local economic competitiveness and that good transport is a necessary but not
sufficient condition.
21
OECD, How Regions Grow, March 2009. 22
Coto-Millan et al, 2007; Urena, Menerault & Garmendia, 2009, Campos and de Rus, 2009. 23
Ahlfeldt and Feddersen, 2010; Willigers and Van Wee, 2011.

32
107. In Japan, Nakamura and Ueda (1989) (cited in Sands, 1993) found three of the six prefectures in
Japan with a Shinkansen station had higher population growth than the national average between 1980 and
1985, while no prefecture without the Shinkansen grew faster than the national average. Whether the
causality is that the rail caused the growth or areas expected to grow attracted investment is unclear. Similar
studies of metropolitan growth suggest that Shinkansen and growth are correlated (e.g. Hirota, (1984)
reported by Brotchie (1991)), but the causal structure is not clear from the ex post studies. Recent studies
suggest that the effects of the newer Shinkansen lines are not as favorable as earlier lines (Nakagawa and
Hatoko, 2007). Sands (1993) concludes the Shinkansen has shifted growth, but not induced it.
108. In terms of tourism, the Shinkansen lines opened in 2002 and 2004 generated a measurable increase
in visitors, around 20% for leisure trips (based on the Hachinohe tourist facilities) and probably about 10%
overall. In France, TGV Sud-Est appeared to have caused two countervailing impacts: overnight stays in
some of the main centers decreased as one-day trips increased from 42% of the total visitors before the line
opened to 55% afterwards. However, recreational tourism clearly increased with hotels in smaller centers
almost reaching saturation and visits to the Abbaye of Fontenay, five kilometres from the small town of
Montbard, increased by 40% in 3 years.
109. Most of the ex post studies tend to be dominated by qualitative results with very limited
quantification of the effects. Notably, only two have examined HSR impacts at a detailed, local level: one, a
before-and-after study of the TGV Sud-Est, included industry interviews24
while the other, a study of sub-
regional productivity in Germany, uses concepts from a CGE (computable general equilibrium) modelling
framework. Studies in Japan have discussed the impacts of the HSR on regional population distribution and
there is also data on the impact of specific Shinkansen links on tourist facilities.
110. International evidence thus demonstrates that HSR can contribute to but is not always a cause of
regional development. Regional centers with stable or growing populations and healthy economies benefit
more from the addition of HSR than stagnant or declining ones. Regional areas in Spain and France within 1-
1.5 hours of major metropolitan areas with supportive economic development programs were more likely to
gain both population and economic activity with the advent of HSR. Intermediate sized areas (50,000 to
100,000+ people) tend to attract population from surrounding communities. Thus, the net impacts of HSR on
the overall regional population can be modest. Moreover, commuters from regional areas flow in both
directions, so some areas experience small gains in local jobs but, overall, regional incomes rise primarily
because of higher wage gains by commuters working in higher paying jobs in larger centers.
111. The impacts described throughout this section result from complex, ongoing processes. No clear
conclusion can be drawn about winners and losers, especially for the regional centers with HSR stations.
However, it is likely that the capital cities would have more winners than losers with the converse being true
for smaller centers without a station.
112. A more detailed review of ex-post studies is found in Appendix 2.
24
Bonnafous, 1986

33
4.3 Ex-Ante Assessments
113. Since the more general approaches outside China to ex ante predictions have been outlined in
Chapter 2 followed by reviews in Appendix 2, we focus our discussions here to practical assessment
procedures that are used by government agencies, which are pertinent to the operational methodology to be
developed for HSR regional impact assessment in China.
114. Not surprisingly, such ex-ante assessment procedures are diverse, as necessitated by the
circumstances of the countries and their policy environments. Nevertheless, some shared threads run
through the ex-ante methodologies owing to the common mechanisms operating within the regional
economies. Whilst we provide a detailed review of the main practical ex-ante assessment procedures in
Appendix 3, here we outline three distinct types which help summarize the experience and lessons: a
primarily qualitative scoring system to examine spatial impacts of transport projects in Germany, a
quantitative assessment of the regional impacts based on a partial equilibrium framework in the UK, and a
quantitative assessment based on a general equilibrium model of the spatial economy coupled with a
population and migration model in Japan. There are a number of other countries where ex-ante assessment
have also been carried out, notably Sweden, Australia, New Zealand and the US; however, those
methodologies are less complete and they do not seem to add further key content to the three main examples
to be reviewed below.
Germany: Spatial advantages and spatial impacts
115. In the Federal Transportation Infrastructure Plan 2003 (FTIP2003) published by the Federal
Ministry of Transport, Building and Housing, the macroeconomic evaluation methodology considers the
proportion in the overall employment effect during the construction and operation of the given project in the
conventional CBA approach which is accounted for by number of persons who would otherwise be
unemployed; it also establishes a largely qualitative procedure, Spatial Impact Assessment (SIA), to identify
the areas with accessibility deficiencies and structural backwardness.
The UK: partial equilibrium models
116. A major characteristic of the applied UK transport models is their roots in partial equilibrium
modelling, i.e. models that cover part of the interactions between transport and the wider economy. An
advantage of such models is that they can be fairly clearly defined and calibrated empirically in order to
quantify the transport related effects, based on limited data and resources. However, the models also suffer
from the fact that they do not account for all the main interactions and feedback loops which means that they
must be applied with clear knowledge regarding their theoretical and practical limitations.
117. One prominent example is the UK’s approach to quantifying the wider economic impacts as defined
in the Transport Analysis Guidance (TAG) by the UK’s Department for Transport (DfT). The wider
economic impacts cover: agglomeration, output change in imperfectly competitive markets, labor supply
change, moving to more or less productive jobs, and wider impact from labor market changes. All the
impacts are modelled under partial rather than general equilibrium.
118. Similarly, the main applied employment location models are also based on partial equilibrium
concepts. Such models often have their roots in utility and profit maximizing behavior, where the location
choices are often represented by logit-based discrete choice models, or in some cases other functions as
probabilities; those related to markets have outcomes which are often expressed as spatial interaction models

34
in either logit or entropy-maximizing terms (Wilson and Pagliara, 2012). The main attraction of such spatial
interaction-based employment location models is the ease in setting them up and using them to explore the
policy impacts with limited data. A key challenge of those location choice models is the identification of the
drivers of economic development.
119. The spatial interaction-based employment location models may be further extended in a fairly
flexible way, e.g. through integrated land use and transport models (Jin and Echenique, 2012). The
employment location decisions are gradually represented as an outcome of increasingly complex interactions
and feedbacks introduced into the predictive models. In such models, the decisions regarding where to locate
are subject to (1) what inputs they use for production, (2) from where they choose to obtain the inputs and (3)
where the demand is for their products and services. Whilst (1) is modelled through production functions, (2)
and (3) are based on advanced spatial interaction modelling that takes account of all direct and indirect costs
of production, sales market penetration and transport. In doing so, the modelling of employment location
decisions are gradually steered towards spatial equilibrium between supply and demand in the economy,
which has often been considered as a stepping stone towards computable general equilibrium modelling.
Japan: spatial computable general equilibrium (SCGE) and population modelling
120. In Japan, the Japan Railway Construction, Transport, and Technology Agency (JRTT) has overseen
the development of an integrated SCGE and population model and applied it to assess the GDP, employment
and population impacts of planned HSR projects. The model consists of seven sub-model-systems:
production, expenditure, income allocation, capital investment, land value, employment, and population.
121. The model forecasts the economic and population impacts by solving a large number of
simultaneous equations for ‘with-project’ and ‘without-project’ scenarios respectively for ten consecutive
years, for each of all 47 prefectures in Japan, considering both the transport links among them and the
planned HSR connections. The model forecasts changes in economic output, population and employment by
taking account of the changes in relative economic attractiveness as well as relative living costs between
prefectures.
122. All the equations in the system have been calibrated using historical data – this is obviously a very
substantial undertaking that has taken many years. The model is continuously updated to reflect the needs of
new projects and appraisal focus. The benefits of having a SCGE model are also apparent when compared
with partial equilibrium models: it is not only able to predict a comprehensive range of impacts upon
population migration, GDP output and employment, but also to account for the interactions among all seven
sub-systems and hence secondary feedback.
Use of results
123. In all three cases, the regional impacts assessment complements the conventional cost benefits
analysis. The SIA in the German approach yields a qualitative score from 1 to 5, which is presented
separately from the conventional CBA results to support the appraisal. A project of outstanding significance
from a regional planning perspective (scored 5) will receive funds from a dedicated funding “pool” of almost
€1.5 billion, even though it might not qualify for funding support using a CBA-based approach.
124. The UK DfT approach selects regional impact indicators that do not double-count the impacts
already included in the conventional analysis, and then directly estimates the monetary values of those
impacts so that it can be added to the benefits (in pounds) in the Benefit Cost Ratio (BCR) – although the

35
official guidance has always advised that the direct and wider impacts should first be presented separately for
clarity.
125. The Japanese JRTT approach is capable of quantifying comprehensive range of GDP, employment
and population impacts brought by the new HSR investment through a SCGE model. The SCGE model is
not part of any conventional transport appraisal framework, so the quantified GDP and employment impacts
are presented alongside the BCRs. The main challenge of the SCGE approach is its technical complexity and
extensive data requirements for its calibration and validation.
126. For a sense of the main outputs from the Japan JRTT and UK DfT appraisal procedures, see Box 2
and Box 3 respectively below.
127. A common thread that runs through all the above methods is the conjecture that transport investment
affects the economy through a change in accessibility. Lower travel costs, shorter commuting time, or
improved level of service will facilitate human interaction, information exchange, goods movement, which
all will in turn enhance employment and productivity and benefit the economy. This principle is reflected in
Box 2. Case Study on the Tohoku Shinkansen between Hachinohe and Shin-Aomori
Cost: 481.4 billion Yen
Benefits: 891.7 billion Yen
BCR = 1.9
The overall social impacts on residents’ daily life (qualitative):
Enhance the service reliability during extreme winter weather;
More comfortable and spacious carriages
Shorter travel time: travel time savings about 1 hour 40 minutes
The overall social impacts on regional economy:
More human interaction activates the local economy (Approximately 1.5-fold increase in the
amount of interaction and the southern Kanto region in Aomori)
More consumption activities in each region with improved transport services along with more
capital investment, and improving the efficiency of their business, 50 billion Yen per year is
expected due to the economic ripple effect. (Estimate the amount GDP increase for the tenth
year after opening)
Contribution to the increase in the number of workers. (Estimated national employment growth
of 2,000 per year)
Source: Re-evaluation of the Tohoku Shinkansen and Hokuriku Shinkansen, the Japan Railway
Construction, Transport, and Technology Agency (JRTT), 2006
Box 3. Wider Economic Impacts (WEIs) from the UK High Speed Line 2 (HS2) proposal
Overall, it is expected that the full Y network would deliver around £47.2 billion to £59.3 billion (2011
PV and prices) in benefits including Wider Economic Impacts. On this basis, the Benefit Cost Ratio
(BCR) of HS2, including Wider Economic Impacts (WEIs), would be 1.8 to 2.5. In other words, for every
£1 spent by Government, the scheme would deliver £1.80 to £2.50 in benefits. Similarly, the BCR
excluding WEIs is 1.6 to 1.9.
Source: www.hs2.org.uk/

36
the analysis frameworks across all three countries investigated, where quantifying accessibility (represented
by generalized costs in the UK and Japan, or equivalent line speed in Germany) is at the core of the analysis.
4.4 Key Lessons
128. Two key lessons can be learnt through the review of ex post and ex ante studies. First, it is very
difficult to assemble the necessary information for a rigorous assessment, either ex post or ex ante. Even in
the developed countries with considerably more abundant resources than in China, the data sets are often
incomplete. This suggests that it would be sensible to design a methodology that allows a gradual build-up
of the ex post evidence base and the predictive models for ex ante assessment.
129. Secondly, the data difficulties have often been compounded by the diverse theoretical outlooks and
methodologies adopted by the studies. Furthermore, those who carried out the ex-post studies are rarely
those who carried out the ex-ante appraisal. This has made it harder to use the ex-post evaluation for refining
the models intended for ex-ante assessment. However, it would seem that there is much to be gained to
connect the insights found from ex-post studies with the theoretical conjunctures, i.e. treating the ex-ante
and-ex post studies as the two arms of the appraisal process. This would help to test the theories as well as
expanding the evidence base.

37
CHAPTER 5 RELEVANT WORLD BANK STUDIES IN CHINA
5.1 Overview
130. In China, agglomeration effects have been recognized at a theoretical level, although there are few
quantitative studies on the topic, and in most cases they offer indirect evidence. One, conducted by the World
Bank with data from Chinese 120 cities (IBRD, 2006), found that firms in more populated cities and city
regions tend to be more productive, and this was tentatively attributed to greater competition and
agglomeration benefits.
131. Roberts et al. (2012) targeted the regional impacts of the National Expressway Network (NEN) in
China at a meso level. Using a counterfactual method, it showed that the aggregate real income, which is
taken as a proxy of productivity, is 6% higher with the NEN than without it. Although the aggregate
influence is positive, it suggests that the distribution of benefits is uneven across regions. Broadly speaking,
urban sectors in coastal areas benefit far more from the NEN, although the picture is somewhat patchy. The
study focused on some of the short-run impacts of NEN, and the authors plan to include, in the future,
longer-run impacts such as migration. They also call for verification of econometric results using on-the-
ground knowledge of transport and regional development patterns.
132. Jin, Bullock and Fang (2013a) provided insights through both case studies and econometric work
into how lowering transport cost helps foster agglomeration and leads to higher productivity at the urban area
level. Both transport and land use effects were considered in the measurement of the ‘economic mass’, and
they introduced a new measure of it based on ‘regional hierarchy’. Estimation results using county/urban
district level data from Guangdong in China indicated that doubling the economic mass will lead to 10% in
per employee productivity. This central econometric estimate of the productivity elasticity with respect to
economic mass was derived from a dynamic panel model using observed data in Guangdong over the period
1999-2009, and was shown to be statistically robust (Jin, Bullock and Fang, 2013a; Jin, Bullock and Fang,
2013b). The findings have been applied to assess the wider economic impacts of several Chinese high-speed
rail projects which are partly financed by World Bank loans.
133. As part of the HSR project studies, the World Bank team has had discussions with manufacturers,
wholesalers and local economic planners in both rich and poor regions in China. Those discussions showed
that the regions all recognize agglomeration economies, albeit in more specific ways that are linked directly
to their circumstances. Some in currently peripheral areas spoke of their inability to attract staff who are
skilled enough to help them develop while others spoke of the barriers to obtaining critical inputs for product
design and maintain market share at a reasonable cost. Many previously remote cities and towns that have
been connected to the recently developed National Expressways have started seeing benefits in sourcing
production inputs and technology and expanding export markets. Examples of these discussions are reflected
in field interviews in Yunfu in southern China (Fang, Jin and Bullock, 2013c)25
. In particular, the discussions
in Yunfu confirmed that (a) a wide range of the local businesses have a product market catchment that reach
many provinces in China and the clients overseas, and (b) the need for frequent business contact, know-how
and market info with this market catchment is by no means limited to the Research and Development sector,
and it actually includes the majority of manufacturing and business service sectors.
25
This city in Guangdong province does not have a conventional rail passenger service. It is connected by the National Expressway
in 2003 and will soon be connected to the Nanning-Guangzhou high-speed railway.

38
134. Interviews with businesses in the City of Jiamusi in the far northeast of China, which is expected to
be connected to a new, fast rail service also showed that local businesses were already formulating
commercial plans to exploit the complementarity of local industrial activities with those in Harbin, the
provincial capital 370 km away. They expected Harbin investment in local businesses will bring expertise as
well as financial support for expanding and new business activities. Obviously, when a railway line links a
relatively developed area (such as Harbin) with an old industrial area (such as Jiamusi), there is a complex
pattern of potential gains and losses between the regions.
135. In a recent paper that was released by the World Bank young scholar blog website26
, Qin (2013)
explored, using data from the early 2000s, the potential differences in growth between cities that are
connected by faster rail services and the small towns that are on the same railway line but have nevertheless
lost rail services during the railway passenger train speed uplift program of 1997-2007. Although the study
did not analyze the impacts of the HSR, useful insights could be gleaned from it. She found that the cities
have benefited from the train speed uplift in terms of higher GDP levels, whilst the small towns have lost
out, when compared with a region with a similar initial growth trend. However, the benefits to the cities are
about 20 times greater than the losses to the small towns.
5.2 Analysis of the Relationship between Spatial Proximity and Productivity in Guangdong
136. The World Bank team’s analysis in Guangdong was an investigation of the relationship between
spatial proximity and productivity at the greatest level of geographic detail for which data is obtainable,
using county and urban district level economic data for 1999-2009 and explicit measurements of business
travel costs derived from accurate GIS mapping of Guangdong’s main road network.
137. The underlying empirical model can thus be presented in a general form
( , )i i iy f M X (5.1)
where iy is a measure of per worker income per working hour or productivity in county i, and is a function of
the economic mass of zone i, iM , and a set of control variables 𝑋𝑖 such as capital endowment, education
level of the labor force, and industry mix that reflect the county-specific characteristics that are also believed
in theory to affect per worker income and productivity. The objective of the analysis was to compare
different formulations of iM and estimate the parameters for the formulation that provides the best statistical
explanation of variations in iy .
138. The economic mass (EM), iM , measured the level of market access to economic activity in any
given location. Since firms in a given county interact not only with local firms but also with other counties
within a radius that is dependent upon the ease of transport, the EM of a given county was the sum of the
measures of market access to each relevant zone divided by the economic distance between that zone and the
home zone. In other words, the intensity of interactions between firms, e.g. information sharing, labor
pooling, competition, etc., was divided by a suitable measure of the cost of travel between all relevant zone
pairs.
139. The World Bank team’s field work in Guangdong showed that regional hierarchies are important
when firms consider their suppliers, markets and linkages for technology transfer and this is especially
26 See https://blogs.worldbank.org/impactevaluations/high-speed-rail-upgrade-leads-economic-slowdown-counties-guest-post-yu-qin

39
reinforced in China by the clearly-defined administrative hierarchies of village, township, county seat and
municipality (formerly prefecture) seat. A special formulation was considered where the Central Place
hierarchies are incorporated in estimating the economic mass.
140. Besides the spatial proximity to economic mass, total earnings per employee in a given county are
influenced by a range of factors such as working hours, skills, industry composition, capital investment, and
natural endowment. It is intuitive that if workers in a given zone work longer hours (e.g. through routine
over-time working) they get higher annual pay. All being equal, higher skilled workers are paid more and a
high proportion of skilled workers in a county or urban district could also markedly raise the level of average
earnings. Similarly, employees working in some industries, such as finance, business services, IT and
research & development are often observed to receive higher pay than those in other industries. These
influences on per worker earnings must be controlled for.
141. The analysis controlled for the effect of working hours by modeling the average hourly nominal
earnings per employee as the dependent variable, i.e. the annual average per employee earnings were divided
by the average number of working weeks and the average working hours per week (which vary across the
counties and urban districts). Employee skills were represented by the proportions of those who achieved
college, university and post graduate qualifications among the employees and the analysis also included
control variables representing industry composition and capital investment. Initially, ordinary least squares
(OLS) models were tested for cross-section models for 2005 through 2008, the most recent year for all the
statistics when the research started. Subsequently, a time series database was developed for 1999-2009.
Pooled OLS, fixed effects (FE) and dynamic panel data models applying alternative linearized generalized
method of moments (GMM) techniques were tested on the time series data. In line with prior theoretical
expectations, the pooled OLS and the FE models established respectively the lower and higher bounds of the
model coefficient values; the GMM models were able to provide statistically robust coefficient values for the
relationship between per employee productivity and the economic mass whilst controlling for the influences
of capital stock, education level, and the endogeneity effects among the model variables, making full use of
the time series data. The quantification of this relationship in the form of coefficient values provided the
productivity elasticity .
142. The results of the time series econometric analysis showed that:
a) Two of the control variables, the level of education and capital investment, were consistently
significant in influencing hourly employee wages, with a third, the employment in the Research and
Development (R&D) industry sector, rather less so. The control variables covering the finance and
IT sectors were generally not significant. This could be because the statistics available for industry
composition were not precise enough to discern the high end employment of those sectors; excluding
those industry sector variables made no material difference to the model results for productivity
elasticity .
b) The estimated productivity elasticity with respect to economic mass was shown to be highly
significant in all econometric models. Overall, the best estimate of the elasticity of productivity with
respect to economic mass ( ) was 0.14 (t = 2.1), if the influence of regional hierarchies is
incorporated among the cities and counties upon the economic mass, and the control variables for the
own zone and the nearest neighboring zone (the latter for spatial spillover effects).
c) The productivity elasticity estimate of 0.14 implies that a doubling of the access to economic mass
would give rise to an increase of per worker productivity of 10% (i.e., 20.14
- 1 = 0.10). This is higher
than, but close to the upper bound of, the consensus range in the OECD countries, where ‘doubling

40
city size seems to increase productivity by an amount that ranges from… roughly 5-8%’ (Rosenthal
and Strange, 2004).
143. The estimates may be compared with related studies: Spatial proximity and agglomeration is thought
to play an important role in knowledge spillover and technological improvements in China. The empirical
findings in this paper are to an extent supported by those of Au and Henderson (2006). Their analysis using
data of 1990 and 1997 from 205 Chinese cities suggests that there are significant urban agglomeration
benefits: e.g. moving from a city of 635,000 to one of 1.27 million increases the real output per worker by
14%, after controlling a wide range of other influences. Recent findings by Ren and Lin (2007) and
Jorgenson et al. (2007) may also be relevant – they found that the contribution of technological
improvements to productivity to be much higher in China than in developed countries – although this is
circumstantial rather than direct evidence.
144. The estimates may be further compared with the emerging evidence from induced traffic on China’s
high speed rail network. The experience with the first high-speed lines demonstrates significant latent
demand for short-medium distance travel to regional centers, which is over and above what has been
observed in other countries with high speed rail services. Available data on the Wuhan-Guangzhou line
suggests traffic which is either generated or has transferred from road to HSR is between one-third and two-
thirds of the traffic on the high-speed line; given the distances involved the bulk of this must be generated
traffic. A similar pattern can be seen on the Changchun-Jilin line, a much shorter line of only 111km, for
which such traffic is over a third of the HSR traffic. As for the Beijing-Tianjin intercity line, only about 20
percent of the current patronage has transferred from conventional rail or bus services; although there were
previously many trips between the two cities by minibus and car, pure generation is likely to still represent a
significant proportion of the remaining 80 percent.
145. However, although the econometric results fit the prior expectations and current observations, the
econometric models may have not fully controlled for other differences between zones, for example the
spatial self-selection and sorting of employees within and amongst the counties and urban districts. Recent
research has highlighted the importance of such mechanisms upon productivity, e.g. through improving the
quality of matches among the workers in cities and reinforcing the development of informational networks
(Combes et al., 2005; Venables, 2010). Clearly, spatial proximity resulting from transport improvements
plays an enabling role in spatial self-selection and sorting. Although it is still difficult to discern the precise
contribution of transport improvements to such mechanisms, it is commonly observed that including such
effects is likely to reduce the magnitude of the productivity elasticity.
146. Experience in other countries has also shown that the mere existence of a high speed rail connection
is not sufficient in itself to generate increases in economic growth. Unlike expressways, for which the local
road network generally provides a ready-made distribution network, high speed rail normally requires a
complementary local distribution network to be developed unless the services use existing railway stations.
This involves a close interaction with land use planning – the urban development plans should take full
advantage of the potential afforded by the high speed rail, and, in particular, ensure the area immediately
surrounding the stations is developed to maximize its accessibility.

41
CHAPTER 6 METHODOLOGY DEVELOPMENT
FOR REGIONAL ECONOMIC IMPACT ANALYSIS IN CHINA
6.1 Overview of the Approach
147. The methodology development for this study builds upon the understanding of the existing literature
of regional economic impact assessment in China and other countries, including the recent work carried out
by the World Bank transport team in China.
148. The first consideration in methodology design concerns the boundaries of assessment: both the
boundaries of the impact region to be studied, and the boundaries between the existing cost/benefit analysis
and the wider regional economic impacts.
149. In principle, in the longer term, the extent of the impact region can be large and go beyond the
immediate HSR corridor into other areas that share the same city cluster, as shown in the case of the UK
(Chen and Hall, 2011). In the short term, we expect to find, from the government and business interviews,
that the main impacts are strongly felt around the main HSR nodes. The methodology for impact
quantification therefore needs to be flexible enough to adapt to both the narrower definition of the impact
region in the short term, and the wider definition that may be required as the evidence builds up. Ultimately,
the regional boundary definition is an empirical question to be determined appropriately in the case studies,
although for comparison of alternative scenarios under each case study, the regional boundary should be kept
the same to ensure comparability.
150. In terms of the boundary with existing cost/benefit analysis, the mainstream ex ante HSR project
assessment in China adopts a within-transport-sector, conventional cost/benefit approach based on four-step
transport models or their derivatives. This is similar to the mainstream approach adopted in the UK. As
reviewed in Chapter 4, this conventional assessment framework can be used jointly with the assessment of
the potential productivity effects that arise from agglomeration economies. Similar to the case put forward
by the UK wider impact assessment methodology, the productivity effects arising from agglomeration are not
accounted for in the conventional cost/benefit analysis, and can thus be considered in addition to the user
benefits already accounted for. This will, in the short term at least, fit well with the existing assessment work
already in place in project appraisal.
151. The recommended accounting structure of the HSR economic appraisal is therefore presented in
Figure 3. The large bracket on the left of the diagram indicates the components of net benefits from the
conventional cost-benefit analysis – they are net benefits from freight traffic and business travel and net
benefits from other travel, e.g. travel undertaken by consumers for shopping, leisure, etc. Whilst both items
are net user benefits accounted by the conventional cost-benefit analysis, only the first arise from the
production process and are therefore part of the producer benefits, whereas the second item accrue to private
consumers only. The second large bracket to the right of the center of the diagram indicates that adding the
net benefits for freight and business travel from a conventional cost-benefit analysis to the agglomeration-
induced productivity effects will produce a more complete total of the contribution to the regional GDP. The
rightmost bracket shows that adding all three items together gives the total transport economic benefits. The
diagram also warns that the impacts on employment, land prices and the tourism industry, if quantified and
monetized, should not be added to the total economic benefits – this is because so doing will cause double
counting of the impacts.

42
Figure 3. Complementarity between Conventional and Wider Regional Impact Analysis
Note: Impacts on employment, land prices, and tourism should not be added to benefits accounted for in the diagram above to avoid
double-counting. They should be presented separately as part of the multi-criteria analysis.
152. Like the UK assessment method, it is recommended the potential productivity effects are computed
under a partial equilibrium framework. This means that they are projected as a marginal change in
productivity based on the Base Case distribution of economic activities. Whilst the partial equilibrium
approach can estimate the potential for change in employee productivity and the relative strengths of
productivity change across different locations in the region, it is not designed to forecast the eventual
patterns of economic activity distribution triggered by it. This is a clear limitation of the partial equilibrium
approach. This weakness can be overcome in the long-term through the development of a computable
general equilibrium model (e.g. like in the Japanese case) to trace the ripple effects of the productivity
changes in the regional economy. This shift from partial to general equilibrium should be accompanied by a
simultaneous expansion of the impact region boundaries from the HSR corridor to the wider city clusters, as
discussed above.
153. The partial equilibrium approach can predict the potential relative attractiveness of different
locations that compete for employment in the region (both on the HSR line and off it), but it will not be able
to forecast the eventual patterns of employment distribution triggered by the changes in the potential. Again
a computable general equilibrium model coupled with a population and migration model may, in the longer
term, be able to trace the ripple effects from the changes in potential to the eventual patterns of employment
location.
154. Similarly, land prices may in their own way reflect the HSR impacts. However, in order to avoid
double counting, land prices should not be added to the total project benefits, because the productivity effects
from economic mass increases that drive the fundamentals of land prices have already been accounted for.
Land and property values are important and relevant questions associated with the HSR, and it may be
particularly appropriate to consider them in the context of station area development strategies.
155. For the tourist trade, the partial equilibrium approach may offer a market potential analysis taking
into consideration the market catchments of competing tourist destinations. Tourism was chosen because it

43
is expected to respond quickly to the opening of the HSR. Many of the other tertiary sectors may not
respond as quickly and some local services may not be very sensitive to HSR. Given the tertiary sector is
heterogeneous, it would make sense to examine this sector in a segmented way, in the future.
156. The employment and tourist trade impacts have clear overlaps with the GDP and welfare effects
shown in Figure 3. As a result, these effects must be presented separately from cost/benefit analysis and its
extensions, and should be used for policy analysis under a multi-criteria framework.
6.2 Lessons from Applications in Other Countries
157. The most relevant lesson from the international review is the importance of establishing an evidence
base for calibrating and validating the predictive models. In particular, the models have been based on the
socio-economic and tourism data, in-depth interviews of businesses and institutions and an additional rail
passenger survey designed to uncover new information about the purposes of travel and the extent of induced
traffic. The interview and survey forms have been developed with a view to collect data that will help to
verify the proposed model structures and the nature of the HSR impacts on businesses and consumers (see
Appendix 4 and 5).
158. Table 3 summarizes the lessons learnt from the review of the official regional impact assessment
procedures of Germany, the UK and Japan. It also outlines the proposed paths of model development for
China for assessing effects on total economic output (or GDP), employment and the tourism trade.
Table 3. Assessment of the main regional impact indicators:
Germany, the UK, Japan and proposals for China
Indicator Germany UK Japan China
GDP Not calculated
directly
In proportion to
economic mass;
partial equilibrium
approach
In proportion to economic
mass; forecasting based
on spatial computable
general equilibrium
(SCGE) model and
population-migration
model
Estimate the partial
equilibrium productivity
effects arising from
agglomeration in the short
term. Collect data and build
SCGE and population-
migration model in the
longer term.
Employment
effect /
Urbanization
Special indices
for different
regions for the
benefits of
creating new
jobs
SCGE and urban
development models
SCGE and population
migration model
Through interviewing
businesses in modelled area
to understand the impact on
employment, build up
preliminary model and
cumulate data. Identify
appropriate parameter for
different areas gradually
over a period of time
Industry
structure /
Tourism
Special indices
for different
regions for
industry
impacts
Urban development
models
SCGE and population
migration model
Through interviewing
businesses in modelled area
to understand the impact on
industry structure, build up
preliminary model and
cumulate data. Focus on the
impact on tourism in the
short term
159. In addition, there are two further lessons which appear to be common across the countries. First,
whilst the regional impact indicators are important, implicit in their assessment is the comparison between

44
the with-project case with a ‘base’ (i.e. without-project case). Care must be taken in defining a realistic and
policy-cogent counterfactual. This is particularly difficult when assessing projects that have a long term
impact into the future.
160. Secondly, over the medium to the long term, there may be many different types of investment across
all modes of transport. This leads to complexities in teasing out the impacts of particular projects or groups
of projects. This becomes very challenging where there is little support in understanding how the different
transport modes interact, and how transport interacts with urban land use development.
161. In order to address the above challenges, it seems crucial to incorporate, within the assessment
framework, a multimodal transport approach (e.g. with the use of discrete choice models that account for
choice of modes of travel across all available modes). In other words, the base case or counterfactuals must
include all planned future transport improvements in order to identify the changes that are attributable to the
new HSR service offering in that context.
6.3 Design of Predictive Models
162. The design of the predictive models has been proposed from the perspective of current policy needs.
Those policy needs are reflected in the indicator system put forward by the Economic Evaluation for Rail
Construction Projects: Methodologies and Parameters (MoHURD et al., 2011).
Table 4. Assessment of the main regional impact indicators:
Comparison with the existing indicators of regional economic and macro-economic impacts
Railway construction project economic
evaluation method 2012;
Regional/macro-economic impact assessment
indicators
Relationship to this research
GDP
Value added Focus on GDP effects that arise from agglomeration, which is not
included in conventional assessment
Net output
Can be derived from value added Net income
Revenue
Economic
structure
Industry structure
Through interviewing businesses in the impact area to understand
the effects on industry structure, build up preliminary model and
cumulate data. Focus on impact on tourism
Employment structure Based on the preliminary model and data collected, in the longer
term make predictions based on SCGE and population model
Impact index Same as above
Employment effects
Through interviewing businesses in impact area to understand the
effects on employment; gradually build up model and cumulate
data
Social and
environment
Income distribution effect Based on the preliminary model and data collected, in the longer
term make predictions based on SCGE and population model
Energy saving
Assessment methods already exist, subject to availability of
model(s) that can forecast future production and consumption
activities
Time saving Same as above
Land saving

45
Water saving
Environmental impact
Poverty reduction Assessment methods already exist. Difficulty to obtain data
Affordability
Human resources
Same as above Material resources
Financial resources
163. We present the model forms for predicting the effects of agglomeration, employment and tourism
below. These have served as a theoretical framework for data collection and interviews. A simple 4-city
example has been developed to provide an overall understanding of the models, and experimenting with
them (see the accompanying Step by Step Guide).
Modelling agglomeration effects on GDP
164. The international review (Chapter 4) and the recent work of the World Bank team in China (Chapter
5) suggest that there may be sufficient data to measure the contribution of the productivity impacts from
agglomeration to GDP by the HSR projects in China. The theoretical framework is based on rigorous
economic theories, similar to the UK WebTAG method (DfT, 2006; 2009).
165. The model first measures the impact on economic mass at location j that arises from the total number
of employed persons (including self-employed persons) in location i, iE , and the generalized transport costs
of travel between locations i and j, ijg including but not limited to those affected by the HSR services:
ij
i ij
EM
g (6.1)
166. The wider impact on GDP is then:
0 0
/
j jA B
j jA B B
j jB B
j j
M MW GDP
M M
(6.2)
where:
i, j Zones, i.e. cities or other administrative areas
iE Total number of employed persons (including self-employed persons) in location i
/A B
jW Agglomeration benefits for the Alternative Case (A) vs. the Base Case (B)
0, ,BA B
j j jM M M Economic masses, for Case A , B and Base Year 0B respectively
j Productivity elasticity parameter with respect to economic mass for zone j, to be adopted
from existing studies or estimated specifically for j
B
jGDP Size of GDP in the Base Case (i.e. without project)
ijg Generalized travel cost from region i to region j
Decay parameter with respect to distance
167. Note that the definition of the economic mass provides a way to measure the accessibility of a zone
to the production and market potential of its surrounding areas without the need to delimit fixed boundaries
for each urban area, and is thus appropriate for quantifying city clusters that evolve through time. Note this

46
does not do away with the need to define geographic boundaries for assessment: for the assessment to be
comparable among alternative project scenarios, the study area boundary will need to be kept the same.
168. The impacts are subject to the productivity elasticity which is to be adopted from suitable empirical
sources. The total contribution of the HSR project to the GDP is then the sum of the net travel benefits from
freight and business travel, and the wider agglomeration impacts computed above for each location j.
169. The calculation of the economic mass is based on generalized costs that account for all modal
choices on each OD pair. When there is more than one mode of travel, the average generalized cost
calculation is based on a logsum equation that is derived from discrete choice theory (Domencich and
McFadden, 1975). This equation can deal with new modes in an easy and theoretically consistent way. When
the HSR becomes an available mode on any OD pair, this changes the mode share and the average
generalized travel cost in a consistent way, which in turn affects the economic mass.
170. From the international research literature in past 10 years, some consensus has emerged for the
possible range of values for γ. The recent work of the World Bank team in China has provided a model
estimation methodology and initial model parameters based on their case study in Guangdong Province (See
Chapter 5 above), and applied them to the assessment of HSR projects in China. In the future, further data
collection, analyses and parameter estimation can gradually develop specific elasticity parameter values for
different geographic regions in China.
Modelling employment effects
171. The main challenge for the application of the method for employment estimate is that, compared
with the productivity effects, for which the overall gain in a HSR corridor is of direct policy relevance,
policy makers are very sensitive to relative changes of jobs at a local level, given that relocation of jobs is
likely to be a major part of the change in overall jobs. This would require extensive empirical work in
suitable case study areas to build up the evidence base for employment impacts and robust predictive models.
172. Employment effects are complex. There are few established models in China or elsewhere that
explore the influence of transport improvements upon employment growth without resorting to SCGE
modelling (such as in the Japanese case). The formulae below are proposed as a framework to explore the
relationships between transport improvements and employment growth in the case studies, and gradually
build up the evidence base. Furthermore, the observations of employment effects will take considerable time
(in terms of years) to materialize. Therefore, the case studies in this project were not able to collect sufficient
data to establish robust empirical models of employment effects.
173. Our proposed approach is to simplify the question by considering local employment movements
within a closely integrated city cluster separately from the in/out movements of employment based on a
given future year employment forecast in the without project case. We further divide employment in any city
into that which cannot relocate due to high relocation costs (which is the majority and we call them
‘footbound’) within a given period and that which can relocate relatively easily (‘footloose’). This provides
a simplified framework for considering both impacts of relocation within the city cluster (with total
employment within the city cluster remaining constant), and net changes for the cluster as a whole.
174. For instance, if a HSR service is introduced between two of the cities in the cluster, the economic
mass of those two cities is likely to rise more rapidly than other cities in the cluster. We hypothesize that the
probability of the footloose employment relocating to a city in the cluster is subject to a discrete choice

47
model with the city production price index and economic mass as its measurable decision function, and
parameter J representing the unobservable influences within city cluster J, and M a coefficient for the
economic mass variable. Thus for Case B the probability of internal footloose industries 27
locating in zone j
is:
exp ( )
exp ( )
B M B p
j J j jB
jB M B p
j J j j
j
S M p
S M p
(6.3)
and for Case A:
exp ( )
exp ( )
A M A p
j J j jA
jA M A p
j J j j
j
S M p
S M p
(6.4)
where A
jS and A
jS are the sizes of the zones, and note that we assume that the production index jp does not
vary between Cases B and A.
175. For the in/out movements of employment crossing the city cluster boundary, we thus have the
attractiveness of city cluster J for footloose employment to be
1
ln exp ( )A A M A p
J j J j j
jJ
U S M p
(6.5)
with B
JU similarly defined. If we assume that under Case B, the attractiveness of the regions outside city
cluster J is B
EU = B
JU and this remains unchanged under Case A, then the probability of footloose employment
being attracted from outside the cluster is
exp exp
exp exp exp exp
A A A A
J E J J E JA
JA A B A A B
J E J E E E J E J E E J
S U S U
S U S U S U S U
(6.6)
176. The net gain/loss of employment is therefore *( ) /A B A B B
J J J J JE E . Let J be the
proportion of footloose employment that exists in city cluster J, then the employment that locates in zone j
under Case A is the sum of its footbound employment, and its share of footloose employment relocating from
both within and without the city cluster – the share being determined by the probability to attract such
industries:
(1 ) ( )A B A B A
j J j j J j J
j
E E E E (6.7)
177. Depending on the proportion of footloose employment J , level of net gain/loss A
JE and the
relative attractiveness to footloose employment represented by the probability share A
j , the HSR connected
27
Such industries include those which can relocate easily from city to city e.g. the high end of business services, research and
development, and creative industries. The classification of such industries is a local matter that can be determined through interviews
of businesses and the local governments.

48
cities may gain employment (e.g. for a high A
j ) or lose it (for a combination of high J and high
attractiveness in other cities).
Modelling tourism effects
178. The standard way to model tourism effects starts from tourism demand, subject to the characteristics
of supply in different destinations. It is normally necessary to model tourism demand by origin-destination
(O-D) pair, as each O-D pair may represent a specific market (Song, 2008).
179. For general planning purposes, the tourism industry tends to use a simple price elasticity method of
predicting demand changes at the ‘route’ or O-D level. For the short haul flights market, which is many
ways similar to HSR travel in passenger profile, InterVistas (2007, page v) suggests that the tourism market
in Asia for a modestly affluent population has an average overall price elasticity of -1.46, i.e. for a 10%
reduction in the expenditure the number of trips increase by 14.6%. As it is relatively straightforward to
calculate the travel and accommodation expenditure for a typical tourism journey before and after the HSR,
the price elasticity method would be a simple one to apply.
180. Nevertheless, along the HSR lines the tourism offering has been developing very rapidly in terms of
both quantity and quality of supply. In some cases where there has been significant new development it may
be necessary to go beyond the price elasticity approach in order to identify the effects for different types of
tourism travel (e.g. business/conferences/exhibitions, private travel, package tours etc.). In such cases, it
would possible to set up discrete choice models (such as used above for employment effects) to compute
destination competition and choice, and induced travel in type of tourism. Such models will require
extensive data collection for model estimation, which will not be feasible within this project. However, an
experimental nested induced demand and destination choice model has been set up to guide the data
collection exercise.
6.4 Approach to Parameter Calibration
181. Owing to the limited time and resources in the project, no econometric estimation of specific
parameters of the above functions has taken place as part of this project. Based on literature review and data
collection we recommend the adoption of the most suitable existing parameter values, and highlight the
needs for parameter estimation as part of future work (See Table 5).

49
Table 5. Summary of Recommendations Regarding Model Parameters
Model Parameter Recommended
Value Source/Remarks
Agglomeration effects of
GDP
Distance decay
parameter 1
DfT (2006), i.e. from UK official wider
impact analysis guidance; In the longer
term this parameter should be calibrated
using local data
Productivity elasticity
parameter with
respect to economic
mass for zone j, j
In the test sample
values of 0.05,
0.075 and 0.1 are
tested.
Jin, Bullock and Fang (2013a); the
elasticity of 0.14 has been calibrated on
the data collected in Guangdong province.
In the longer term this parameter should
be calibrated using local data for each
distinct regions of China.
Employment effects
Discrete choice
model parameter for
choices among
locations within the
city cluster J, J
None available; in
the test example,
values from 0.01
to 1.00 are tested
In the longer term this parameter should
be calibrated using local data for each
distinct regions of China
Discrete choice
model parameter for
choices between city
cluster J and external
areas, E
None available; in
the test example,
a value of 0.05 is
assumed
ditto
Proportion of
footloose industries
in city cluster J, J
None available; in
the test example,
values from 0.01
to 0.10 are tested
ditto
Economic mass
coefficient, M
None available; in
test example it is
assumed to be 1.0
ditto
Tourism effects
Tourism demand
elasticity with respect
to total expenditure
on route from
location i to location
j, ij
-1.46
InterVistas (2007, page v) for the tourism
market in Asia for a modestly affluent
population; In the longer term this
parameter should be calibrated using local
data for distinct tourist markets in China
182. International experience shows that many of the elasticity parameters discussed above may vary by
region. In a vast country such as China with diverse conditions it would be prudent to test the validity of the
model parameters by region as part of the longer term work to establish a robust evidence base for economic
impact assessment.
6.5 Worked examples
183. To illustrate the theoretical models above, a simple four city example is presented in the separate
Step by Step Guide. In this example, each city is defined as one zone. It is assumed that there are no
significant urban areas nearby, therefore the four zones form a complete study area for the assessment. In
practice, of course, there may well be other cities and towns nearby, in which case all those cities and towns
that are expected to be impacted upon by the HSR project should be included in the study area – the
demarcation of the study area is a decision that needs to be made based on interviews with the businesses and
local government agencies. For details see the Step-by-Step Guide to implementing the methods above using
this example.

50
Figure 4. Configuration of a Four-City Example

51
CHAPTER 7 CASE STUDIES
7.1 Selection of Case Study Areas
184. The case studies were selected based on the following principles: The line has operated for at least 1-
2 years and has formed stable passenger flows; there are distinct cities and towns along the project line, and
the operation of the HSR project has significantly improved the accessibility of the cities and towns; the HSR
project has been operating normally as expected in the design specifications; finally, for unambiguous
identification of their contribution, only HSR projects that do not have concurrent and parallel services
running in the same corridor are selected as case studies.
185. Accordingly, two case studies have been selected as follows:
Case 1: Changchun-Jilin Intercity Railway
186. The services on the Changchun-Jilin Intercity Railway (ICR) have been running for nearly three
years. It currently operates 40 pairs of trains every day and has about a 4.5 million unidirectional passenger
flow per year. With the track length of 110km, the scale of this project is similar to many of the new regional
HSR lines to be proposed and built in the future.
187. This is a project with a moderate scale, which facilitated the implementation of the case study.
Changchun and Jilin are respectively the largest and second largest cities of Jilin Province. The HSR services
also connect to Longjia Airport, which is between Changchun and Jilin.
Case 2: The northern part of the Beijing-Shanghai High Speed Rail Line
188. As an important trunk line in the “4+4” national HSR network (four east-west corridors and four
north-south corridors), Beijing-Shanghai HSR connects two mega-metropolitan clusters (the Bohai Bay Rim
and the Yangtze River Delta).
189. Numerous cities and towns are either on or within the catchment of this HSR line. It is also a line
with significant volume of business travel, generating considerable influence on business locations and
employment distribution along the line. Only the part that is between Tianjin and Jinan has been identified as
the case study, because unlike the Beijing-Tianjin and Nanjing-Shanghai sections of the line, this part of the
HSR line does not have concurrent and parallel HSR services in the corridor.
190. The case studies were conducted in three broad steps: first, background statistics, on-board train
passenger surveys and business/government agency interviews have been conducted to understand the case
study area, and the nature as well as the extent of the HSR impact on work and life; second, the impacts on
GDP, employment and tourism have been studied through the predictive models – not all impacts are
currently quantifiable based on the data and empirical parameter values available; third, the HSR regional
impacts are considered in a broader assessment framework, to consider how the available evidence
corroborate or contradict one another. The case study components are discussed in turn below.

52
7.2 Collection of Background Data
191. For the two case studies, data collection was conducted according to the predictive models designed
in Chapter 6, with a particular focus on the type of data that can support the estimation or corroboration of
project impacts.
192. To start with, data was first sourced from a desktop assembly of published statistics from coach
stations, airports, train schedules, and maps; surveys carried out at expressway entrances and exits; design
documents and on-board passenger survey of Changchun-Jilin ICR and Beijing-Shanghai HSR; “12th Five-
Year Plan” for national and regional economy and social development; business interviews in Changchun,
Jilin, Tianjin, and Jinan which are the main cities in the case study areas.
193. Data collected covered transport network and travel data (e.g. time spent on board, ingress/egress
time, waiting time, ticket price and additional costs for each transport mode), GDP by city (base year values
and future year projections), and passenger volume by travel mode and origin-destination (OD) pair.
7.3 On-board Survey of HSR and Other Train Passengers
194. The on-board survey was carried out between May 20, 2013 and May 24, 2013, with a focus on
collecting information of induced passenger flow for model calibration. Passengers on the HSR Electric
Multiple Units (EMUs), and non-HSR trains were surveyed in the case study areas.
For the Tianjin-Jinan section of the Beijing-Shanghai HSR, the sections between Beijing South
Station/Tianjin West Station/Tianjin Station/Tianjin South Station and Jinan Station/Jinan West
Station were included. 577 questionnaires were collected: 488 for eight HSR trains, 129 for two non-
HSR trains (1461 and K102);
For the Changchun-Jilin ICR, 531 questionnaires were collected: 416 for 12 ICR trains, 115 for two
non-HSR trains (K75, T5316).
195. The on-board survey questionnaire is attached in Appendix 4.
196. The on-board survey reveals a fascinating picture of the profile of the travelers and their travel
behavior.
197. Age: most HSR passengers are 25-55 years old. For HSR passengers older than 55 years old, non-
business travelers account for 58% on Beijing-Shanghai HSR and 72% for Changchun-Jilin ICR. Ordinary
trains are used heavily by passengers below 25, particularly those on longer distance trips. For age
distribution, see Figure 5.

53
Figure 5. Age Distribution of Passengers
198. Gender: Male and female roughly account for 60% and 40% for both lines (Figure 6).
199. Trip purposes: The share of business-related trips on the Beijing-Shanghai Line is some 25% higher
than that on Changchun-Jilin Line. Business trips dominate on the Beijing-Shanghai Line: at 62%, the share
of business trips on HSR is 34% higher than the share of leisure trips, and 11% higher than share of business
trip on non-HSR trains on the same corridor. Business-related trip and leisure trip are on a par on
Changchun-Jilin Line, at 40% and 51% respectively. Commuting trips account for 17% of the total trips, or
nearly half of the business-related trips on the Changchun-Jilin Line. The patterns on ordinary, non-HSR
services are similar (Figure 7).
Figure 6. Gender Distribution Figure 7. Trip Purpose
200. Trip distance: Short-distance trips (i.e. inter-city passenger flow, <300km) account for 97% on the
Changchun-Jilin Line. On the Beijing-Shanghai Line, short-distance trips (<300km), medium-distance trips
19%
73%
8%
18%
75%
7%
22%
68%
10%
39%
53%
9%
0%
20%
40%
60%
80%
100%
<25 25-55 >55
Age
0%
10%
20%
30%
40%
50%
0 20 40 60 80
Age
Changji-HSR
Changji-Ordinary
Jinghu-HSR
Jinghu-Ordinary
72% leisure
trip
58% leisure
trip
40%
51%
9%
23%
63%
14%
62%
28%
10%
51%
37%
12%
0%
20%
40%
60%
80%
100%
商务Business 休闲Leisure 其他 Other
出行目的Purpose
Changji-HSR Changji-Ord Jinghu-HSR Jinghu-Ord
40%
51%
9%
23%
63%
14%
62%
28%
10%
51%
37%
12%
0%
20%
40%
60%
80%
100%
Business Leisure Other
Purpose
Changji-HSR Changji-Ord Jinghu-HSR Jinghu-Ord
Commuting traffic: 17%
60%
40%
58%
42%
60%
40%
65%
35%
0%
20%
40%
60%
80%
100%
Male Female
Gender

54
(300~800km), and long-distance trips (>800km) account for 13%, 35% and 52% respectively28
. Again the
patterns on the ordinary non-HSR train services are similar (Figure 8).
201. Monthly income: Passenger’s monthly average income is about RMB 4,300 on Changchun-Jilin
ICR, RMB 3,200 on Changchun-Jilin non-HSR trains (RMB 2,200 if passengers from Jiutai are excluded);
RMB 6,700 on Beijing-Shanghai HSR and RMB 4500 on Beijing-Shanghai non-HSR trains. As shown in
Figure 9, the high-income group (>RMB 20,000) accounts for less than 5% on HSR lines. According to
previous data TSDI had collected on Beijing-Shanghai line, about 49% passengers had a monthly average
income lower than RMB 5,000, and 16.3% had a monthly average income higher than RMB 10,000. This
suggests that the high-income group may not be as dominant among the HSR passengers, although some
caution is required in this interpretation, as the income figures were self-reported by the surveyed passengers.
Nevertheless, the higher income profiles of the passengers on the Beijing-Shanghai HSR relative to that of
the Changchun-Jilin line would seem reasonable, which provides a degree of assurance in the general
reasonableness of the data (Figure 9).
Figure 8. Trip Distance Figure 9. Monthly Income Distribution
202. Connecting modes to railway stations: connectivity of urban transport options with HSR stations
reflects another aspect of HSR services. For the Changchun-Jilin Line, passengers accessing railway station
by mass transit account for 43%, 14% higher than the share for Beijing-Shanghai Line. Since the HSR
stations of Beijing-Shanghai Line are in the urban periphery, 18% of passengers arrive at stations by car,
13% higher than the share for Changchun-Jilin Line. Only 1% of passengers of Beijing-Shanghai Line access
the station on foot, compared to 9% walking access to the Changchun and Jilin railway stations due to their
urban location. Since the business trip percentage is high on the Beijing-Shanghai Line, passengers that
access stations by company-owned vehicles account for 11%, 9% higher than the share on Changchun-Jilin
Line (Figure 10).
28
Based on the passengers surveyed in the vicinity of Jinan. Over the Beijing – Shanghai corridor as a whole, the proportion of long-
distance is rather less.
L
LL
M
M M
S S
S S
0%
10%
20%
30%
40%
50%
60%
70%
80%
90%
100%
0%
10%
20%
30%
40%
50%
60%
70%
80%
90%
100%
>20001
10001-20000
5001-10000
2001-5000
<2000

55
Figure 10. Connecting Modes to Railway Stations
203. Trip duration: passengers on the Beijing-Shanghai Line stay away from home on average one day
longer than those on Changchun-Jilin Line. The result is consistent with the fact that short-distance passenger
flow accounts for the majority of the Changchun-Jilin Line. Trip duration by HSR is about one day shorter
than by non-HSR trains; and trip duration of business travelers is shorter than that of leisure travelers,
reflecting that business trips are associated with a higher Value of Time (VoT) than leisure trips (Figure 11).
Figure 11. Average Trip Duration (days) Figure 12. Alternative Transport Modes for
Changchun-Jilin Line
Changchun-Jilin
Walk9%
Taxi41%
Public transport
43%
Company car2%
Private car5%
Walk1%
Taxi38%
Public transport
29%
Company car11%
Private car18%
Other3%
Beijing-Shanghai
Avg time
35min
Avg time
54min
Avg time
53min
Avg time
44min
2.8
3.94.3
5.1
Changji-HSR Changji-Ordi Jinghu-HSR Jinghu-Ordi
Ordinary Train36%
Air0%
Bus50%
Company Car0%
Private car
13%
Other1%
Changji

56
Figure 13. Alternative Modes for Beijing-Shanghai Line
204. Alternative transport modes: On the Changchun-Jilin Line, if there were no high-speed railway, 50%
of passengers would choose coach or bus, and 36% of passengers would select non-HSR trains. For the
Beijing-Shanghai Line, 32% of short-distance passengers would choose coach or bus, while 39% of medium-
distance passengers and 77% of long-distance passengers would choose air travel. On the Beijing-Shanghai
Line, the share of passengers that select bus or non-HSR train as the alternative mode drops with increasing
travel distance, as expected (Figure 12 and 13).
205. Induced passenger flow by HSR: In the case of Changchun-Jilin rail corridor, 3.8 million passengers
per year travelled between the two cities (in both directions) on non-HSR trains in 2009 prior to the opening
of the HSR line (the volume in 2010 was reduced because of the construction works). The new line carried
around 8 million passengers in 2011. Meanwhile the number of passengers on non-HSR trains declined to
0.7 million, and an estimated 3.1 million per year thus appear to have transferred from non-HSR trains29
.
Based on information from intercity bus operators, an estimated 2 million per year have transferred from bus
service to the new HSR line, leaving roughly 2.9 million per year of the HSR passengers who have either
transferred from cars/minibuses or been generated. As the car/minibus passenger volume is unknown, it is
difficult to estimate how many HSR passengers are generated; but if half of the 2.9 million passengers had
transferred from cars/minibuses, a provisional estimate of generated passengers would be around 1.45
million, or 18% of the total HSR passengers.
206. Similar induced traffic is also observed on the Beijing-Shanghai HSR line. Although detailed mode
share data is not available, the analysis of observed passenger volumes on HSR and non-HSR trains from
previous years show that the new HSR line may have increased total rail demand along the whole corridor by
up to 25%. Relatively few passengers appear to have transferred from cars/minibuses. This suggests that the
generation rate on the Beijing-Shanghai corridor is similar to that on the Wuhan-Guangzhou line discussed
earlier, i.e. between one-third and two-thirds of the passengers may have been generated.
207. Those newly generated demand induced by HSR is also supported by informal surveys and
anecdotal evidence from news media provided by passengers when new lines opened. Interestingly, very few
surveyed passengers said that they would stop traveling if the HSR service became unavailable – instead the
majority said that they would continue to travel on the corridor by alternative modes. This appears to suggest
that the majority of the generated traffic have arisen because of increased frequency of travel by existing
passengers on the corridors, rather than new passengers who had not travelled previously on the corridors.
29 Natural growth over this period was very low.
Ordinary Train17%
Air77%
Bus2%
Company Car1%
Private car3%
Long >1000km
Ordinary Train28%
Air39%
Bus14%
Company Car7%
Private car
10%
Other2%
Medium 300-1000km
Ordinary Train40%
Air13%
Bus32%
Company Car5%
Private car9%
Other1%
Short <300km

57
This would seem reasonable given that it is the initial period for HSR operations.
208. In summary, short-distance travelers (<300km) dominate (97%) the ridership of Changchun-Jilin
Line, as expected. On the Beijing-Shanghai Line, there are fewer short-distance trips and about 52% of the
total trips are long-distance trips (>800km), with more half of the passengers on business travel. Although
HSR passenger’s average income is higher than that of non-HSR trains, the difference is not significant
enough to suggest, prima facie, that the HSR is a privilege for the higher income groups30
. HSR shortens
average trip duration and makes one-day roundtrip possible between many cities. As expected, the main
competitor for HSR in the long-distance travel market is air travel. Last but not least, in both cases higher
demand has ensued from newly-opened HSR lines, but that the generated demand appears to have
predominantly from higher trip frequencies of those who had already been travelling - this is corroborated by
the business interviews (below) which report that the senior managers and professionals who lead marketing,
research and innovation activities have significantly raised their frequencies of travel, whilst the back office
staff have not.
7.4 Business and Government Agency Interviews
209. Business interviews were undertaken, focusing on business operations, employee travel and the
influence of the HSR, to understand the mechanisms at work and gather information for establishing the
models put forward in Chapter 6. The main purpose of the interviews is to understand how businesses and
individuals use HSR, and how the use of the HSR has modified their patterns of work and daily life as well
as business decision-making.
210. Business interviews were conducted from May 13, 2013 to May 31, 2013. Local government
agencies were consulted for selection of interviewees. In view of the local economic structure in the case
study areas, interviewees were selected as diversely as possible. 45 enterprises were selected in Tianjin (13),
Jinan (12), Changchun (10) and Jilin (10), including large-, medium-, and small-sized enterprises from
secondary and tertiary industries.
Both Changchun and Jilin are typical industrial cities. The 20 enterprises selected from the two cities
were in manufacturing (13), real estate (3), scientific research and technical services (2), transport
(1), and hotels and hostels (1).
It takes one hour for a trip between Tianjin and Jinan along the Beijing-Shanghai HSR line. The
enterprises selected in Tianjin were distributed in diverse industries such as manufacturing, real
estate, information technology, commercial services, scientific research and technical services,
culture and public management. Those selected in Jinan were of eight different industries
(construction, wholesale & retail, finance, environmental & sanitation, education, public
management, etc.).
211. Industry types involved in the business interviews are shown in Table 6.
30 As the incomes are self-reported, some caution is required in this interpretation, pending future surveys using alternative methods.

58
Table 6. Industry Types Involved in Business Interviews
Surveyed City Industry Type # of Enterprises
Jinan
Construction 2
Wholesale & retail 1
Finance 1
Leasing and commercial service 1
Scientific research and technical service 2
Water conservancy, environment, public facility management 1
Education 2
Sanitation, social work 2
Subtotal 12
Tianjin
Manufacturing 1
Communication, software and information technology service 1
Real estate 2
Leasing and commercial service 2
Scientific research and technical service 3
Culture, sports, entertainment 2
Public management, social security, social organization 2
Subtotal 13
Changchun
Manufacturing 5
Transport, storage, postal service 1
Lodging & boarding 1
Real estate 2
Scientific research and technical service 1
Subtotal 10
Jilin
Manufacturing 8
Real estate 1
Scientific research and technical service 1
Subtotal 10
212. See Appendix 5 for a sample questionnaire of the business interviews.
213. There is clear qualitative evidence that the HSR services have had appreciable impacts on the
following aspects of business operations:
214. Site selection of enterprises: Among the 45 interviewees, 14 are engaged in manufacturing, and they
consider local policy, land price, transport accessibility, and logistics services as primary factors for site
selection. Given that HSR is not the major means of transporting raw materials and final products, HSR has
not been considered in site selection of the 14 manufacturing enterprises. Many of other enterprises have
stayed in their current sites (mostly in urban centers) for historical reasons: the original sites become centers
of urban areas following urban expansion. Site selection of large state-owned enterprises is strongly
influenced by the availability of government’s preferential policies, abundance of land area, and general
traffic conditions. Therefore when given the chance to relocate their business, many of these enterprises
decide to settle in new economic zones planned by the government. For some small enterprises engaged in
professional services, there is apparent consideration with the convenience of intracity travel. Among the 45
interviewees, only two clearly indicated that HSR was explicitly considered in their site selection - as both of
the businesses are engaged in international trade, they need to establish branch offices in some international
metropolis such as Shanghai, Qingdao, and Jinan with HSR access. A number of enterprises are located
around Tianjin Station (terminal station of Beijing-Tianjin ICR), which is in the urban center, for historical
reasons. Therefore it is fair to argue that those enterprises to some extent considered rail access in site
selection. In conclusion, the influence of HSR on the site selection of enterprises appears to be relatively low

59
at this point. This may reflect a need for more concerted land development around station supported by
publicity campaign on the opportunities brought by high-speed railway stations to attract new businesses.
215. Decision-making of business operation: most manufacturing enterprises consider that the opening of
HSR has not significantly influenced their basic business operations, but significantly influenced business
travel since it lowers travel expenses, saves time, and improves productivity. High-end consulting companies
and design institutes (e.g. China Railway Electrification Survey Design & Research Institute, Northeast
Electric Power Design Institute) consider that the HSR facilitates human resource allocation and broadens
business catchment areas. Since HSR shortens the travel time between cities, staff in a city can now cover
neighboring cities more easily than before, thus business can be expanded to achieve regional scale economy
and faster business responses. Jilin Meixin Real Estate Appraisal Co., Ltd. suggested that the company will
establish a branch office in Changchun, considering that the Changchun-Jilin ICR plays a very important role
in promoting interurban integration between the two cities and tightly linking the branch office to the
headquarters. Tianjin Youth Palace stated that the opening of Beijing-Tianjin ICR facilitates employment of
expert trainers and expands its training business. Also the new line has increased the number of participants
for their competitions and exhibitions, and makes it easier for them to take students to compete in other
cities. Tianjin Binhai Wanghui Engineering Consulting Co., Ltd. (TBEC) stated that the opening of HSR and
ICR lines improves non-local enterprises’ intentions of investing in Tianjin, bringing new business
opportunities and promoting local business. In conclusion, HSR has positively influenced businesses
operation of most enterprises, although such influence is relatively stronger for professional service
enterprises.
216. Citizens’ lives: the opening of Beijing-Shanghai HSR and Changchun-Jilin ICR has intensified
interurban integration. Many enterprises concluded that, since the opening of HSR, reunion of long-distance
couple, as well as inter-city classmate reunion and friend get-togethers (for business or private reasons) has
got more frequent. Such increases in the frequency of reunions can tighten social networks, bringing business
opportunities. President Lin of Shandong Engineering Consulting Institute gave the example of one of his
friends who always travels on business trips towards different cities and decided to reside near Jinan West
Station for easy access from home. In addition, some corporate staff stated that with the Beijing-Shanghai
HSR, Beijing-Tianjin ICR, and Changchun-Jilin ICR, they could easily organize a few friends to go to
Beijing or Changchun for shopping and concerts. As indicated by the Tianjin Municipal Commission of
Development and Reform, the opening of the HSR station has been a major force driving realty development
around station: significant urban development projects have emerged around Tianjin West Station.
217. Local tourism and recreational industries: China Railway Travel Service Tianjin First Branch stated
that HSR benefits its business in three aspects. First, HSR tickets are in abundant supply, which makes it
easier to arrange tourist itineraries. Thanks to opening of HSR, ticket booking has become more convenient
for the branch. Previously tickets had to be booked 20 days in advance, while now 4~5 days is enough.
Second, HSR significantly shortens the time spent travelling. Third, HSR offers a clean and comfortable ride,
which is favored by tourists and makes HSR the first choice for trips shorter than 500km. Upon its opening,
HSR was accepted by few travelers due to its high fares. However, gradually tourists, especially the white-
collar class and the younger generation, have accepted this new mode of traveling. However, most of the
older generation still prefer non-HSR trains. For example, going to Ji County many old people select the
“green [colored] trains”, i.e. the slow local services. President Liu of the Branch stated that in 2012 sales
from HSR travel accounted for 7~8% of their total revenue, which will increase to about 10% in 2013. Mr. Li
Tongcai, manager of Tianjin RAIN Culture & Art Communication Co. indicated that due to the better
reliability of HSR the period of ticket sales for performing events has been shortened from one and half

60
month to one month; better accessibility to event cities has also enlarged the catchment area of their
business; HSR also reduced the pressure of organizing fans to concerts since they can easily take HSR by
themselves.
218. Transport demand of enterprises: different types of enterprises have different transport demands.
Transporting products, manufacturing enterprises primarily consider railway and highway. HSR is not for
cargo freight. However, sales and procurement personnel of those enterprises heavily rely on HSR for
business trips. Among the 14 manufacturing enterprises, 4 enterprises said that business trips occur 2~5 times
per person per month. The enterprises engaged in professional services and realty business, such as design
institutes, have a larger appetite for HSR, since it significantly shortens travel time for meeting clients.
Maximum monthly frequency of business travel among the 12 enterprises engaged in professional service
and realty business is 6 trips per person. For enterprises engaged in culture and entertainment (Tianjin Youth
Palace, Tianjin RAIN Culture & Art Communication Co., Ltd.), HSR not only facilitates traveling, but also
promotes business development. Noticeably many medium and small-size enterprises concur that intercity
transport connecting to the HSR stations played a vital part in their HSR travel.
219. When interviewed, all the enterprises believes that the HSR has become an indispensable mode for
business travel. Many enterprises find that alternative modes (video/telephone meeting, etc.) cannot replace
meetings that require face to face communication. If HSR were shut down, businesses will suffer, although
the sample size does not allow for quantification. Intercity HSR is particularly attractive to travelers
previously travelling by car and bus. One car insurer has attributed a dip in road accident compensation on
inter-city expressways and has attributed this to the shift of car travel to the HSR.
7.5 Agglomeration Effects on Productivity and GDP
220. To demonstrate how to quantify impacts of HSR on an individual city’s GDP through agglomeration
benefits, Jilin was selected for case 1 (Changchun-Jilin Inter-city Railway) and Jinan and Dezhou selected
for case 2 (Beijing-Shanghai High-speed Railway).
7.5.1 Scope of calculation
221. Theoretically, the scope of the calculation should cover all regions influenced by the project, which
would require an intensive calculation over all the cities and towns under the impact of HSR. Given that in
China economic development primarily depends on the driving effect of large cities on small ones (and
driving effect of small cities on large ones is negligible), the concept of city hierarchy has been used to
simplify the calculation. The following levels are considered.
Level 1: The city itself
Level 2: The city at the next level
Level 3: The city at the second-next level
…………
Final level: First-tier cities, i.e. Beijing, Shanghai, Guangzhou
222. The journal paper “Urban hierarchy of innovation capability and inter-city linkages of knowledge in
post-reform China” by Lu, et al. in 201231
further corroborates that it is practical to take this hierarchical
31
Lu Lachang, Huang Ru, 2012. Urban hierarchy of innovation capability and inter-city linkages of knowledge in post-reform China.
Chinese Geographical Science, 22(5): 602–616. doi: 10.1007/s11769-012-0555-8

61
approach for urban development analysis. The application of the hierarchy approach to the three selected
cities is shown in Table 7.
Table 7. Scopes of Analysis for Selected Cities
City Level 1 Level 2 Level 3 Level 4
Jilin Jilin Changchun Shenyang Beijing
Jinan Jinan Tianjin Beijing, Shanghai --
Dezhou Dezhou Jinan Tianjin Beijing, Shanghai
7.5.2 Principles for calculating productivity effects from agglomeration
223. As summarized in Chapter 6, the productivity effects from agglomeration, namely the GDP benefits
or agglomeration benefits, are:
0 0
/
j jA B
j jA B B
j jB B
j j
M MW GDP
M M
(7.1)
where:
i, j Zones, i.e. cities or other administrative areas
/A B
jW
Agglomeration benefits for the Alternative Case (A) vs. the Base Case (B)
0, ,BA B
j j jM M M
Economic masses, for Case A, B and Base Year 0B respectively
j Productivity elasticity parameter with respect to economic mass for zone j, to be adopted
from existing studies or estimated specifically for j
B
jGDP
Annual GDP in yuan (RMB) in the Base Case (i.e. without project) for location j
224. The economic mass is defined as:
a
ij
i
jg
EM (7.2)
Where:
ijg Generalized travel cost from region i to region j
Decay parameter with respect to distance
225. Specifically the international empirical value for decay parameter is 1. The parameter is taken as
1 in the calculation, and can be further calibrated according to data from different regions.
226. For each transport mode, the generalized cost m
ijg = travel time + travel cost/value of time +
alternative specific constant32
(defined in the unit of time (min) so that the model parameters are more
32
The travel times and travel costs are those of door to door, i.e. including local access and egress. The alternative specific constant
is also called the mode specific constant, which represents the additional inconvenience/discomfort that is not reflected by travel time
and cost.

62
comparable across different study areas). The composite generalized cost across all transport modes is
1ln
mij ijg
ij
ij
g e
. In other words, the generalized travel cost
ijg is the logsum of the modal
generalized costs of travel. Here the parameter ij is the discrete choice parameter for the location ij pair, to
be determined by the mode choice model. As a rule, the ij values are smaller when the generalized costs
are higher. For example, in the case studies, the ij values vary from 0.02 for the ij distances less than
200km, to 0.002 for ij distances greater than 1100km.
227. The Value of Time (VoT) is derived from traveler’s average incomes. In the study, traveler’s average
income is considered as RMB 45/h on Beijing-Shanghai High-speed Railway and RMB 32/h on Changchun-
Jilin Inter-city Railway.
228. A consensus on the range of the productivity elasticity coefficient is gradually being reached in
the international literatures. The value concluded from the study by World Bank in Guangdong is 0.14 but in
current applications is conservatively considered as 0.075. In this calculation, is valued as 0.075, and
0.05 and 0.1 are introduced for sensitivity tests. In the future, the parameter can be calibrated according to
data from different regions, using the methods such as those proposed by Jin, Bullock and Fang (2013b).
7.5.3 Network characteristics
229. For an OD pair, various modes including coach, auto, HSR, non-HSR train, and airplane are
considered. The basic data of the five transport modes are summarized in Tables 8, 9 and 10.
Table 8. Network characteristics of Beijing-Shanghai HSR (Jinan)
Origin Destination Transport
mode
Ticket Fare (RMB) Time (min) Operational
distance
Onboard
expense Surcharge Onboard time Additional time (km)
Tianjin Jinan
Bus 126 20 240 60 368
Car 125 0 206 0 326
Rail 51 20 275 60 360
HSR 140 20 82 60 301
Air -- -- --
Beijing
Jinan
Bus 114 20 350 80 455
Car 185 0 248 0 429
Rail 108 20 295 80 498
HSR 185 20 99 80 406
Air 750 50 65 120 412
Shanghai
Jinan
Bus 210 20 660 80 925
Car 355 0 480 0 850
Rail 131 20 720 80 968
HSR 399 20 200 80 912
Air 860 50 80 120 852

63
Table 9. Network characteristics of Beijing-Shanghai HSR (Dezhou)
Origin Destination Transport
mode
Ticket fare (RMB) Time (min) Operational
distance
Onboard
expense Surcharge
Onboard
time Additional time (km)
Jinan Dezhou
Bus 30 20 80 50 125
Car 40 0 85 0 118
Rail 28 20 93 50 120
HSR 40 20 24 50 92
Air -- -- -- -- --
Tianjin Dezhou
Bus 85 20 150 50 243
Car 100 0 150 0 233
Rail 35 20 180 50 239
HSR 90 20 44 50 192
Air -- -- -- -- --
Beijing Dezhou
Bus 87 20 189 60 350
Car 135 0 210 0 339
Rail 80 20 214 60 377
HSR 145 20 72 60 314
Air -- -- -- -- --
Shanghai Dezhou
Bus 229 20 600 60 929
Car 420 0 530 0 943
Rail 164 20 780 60 1086
HSR 145 20 439 60 1004
Air -- -- -- -- --
Table 10. Network Characteristics of Beijing-Shanghai HSR (Jilin)
Origin Destination Transport
mode
Ticket fare (RMB) Time (min) Operational
distance
Onboard
expense Surcharge
Onboard
time
Additional
time (km)
Changchun Jilin
Bus 35 20 120 60 130
Car 97.5 0 90 0 116
Rail 20 20 90 60 128
HSR 32 20 45 60 111
Air -- -- -- -- --
Shenyang Jilin
Bus 127 20 351 60 410
Car 247.5 0 250 0 407
Rail 54 20 480 60 446
HSR 174 20 127 60 421
Air -- -- -- -- --
Beijing Jilin
Bus 334 20 865 60 1079
Car 720 0 616 0 1102
Rail 155 20 920 60 1290
HSR 155 20 920 60 1124
Air 750 60 110 120 933
7.5.4 Calculation of agglomeration effect
230. In the calculation of agglomeration benefits, the distance decay parameter and productivity elasticity
are considered as 1 and 0.075, respectively. 0.05 and 0.1 have been used for sensitivity tests on the
productivity elasticity.

64
231. As calculated, Beijing-Shanghai HSR’s contributions to GDPs of Jinan and Dezhou are 0.55% and
1.03%, respectively, and Changchun-Jilin Inter-city Railway’s contribution to GDP of Jilin is 0.64%. The
opening of HSR increases the urban economic mass. The increases attributable to agglomeration benefits in
the GDPs of Jinan, Dezhou, and Jilin are RMB 3.65, 3.59 and 2.39 billion, respectively. For the detailed
procedures of agglomeration effect calculation, see Tables 11, 12 and 13.
7.5.5 Future work of agglomeration effect calculation
232. For the future application of agglomeration model in China, it is necessary to gradually accumulate
data and calibrate parameters. In detail,
For the selection of (productivity elasticity coefficient), it is necessary to calibrate by regions.
In the medium term and long term, it would be ideal to gradually build up a general equilibrium
model from the current partial equilibrium model, such as exemplified by the modelling approach
developed for assessing high speed rail investments in Japan.
The key parameters and alternative specific constant in the mode choice model (LOGIT model)
can be calibrated by regions and travel distances for value ranges and trends. Such methods have
become fairly standard (see e.g. Ortúzar and Willumsen, 2011).
The distance decay parameter can be calibrated by distance through accumulating data of the
economic change attributable to opening of HSR in different types of cities.
Alternative Specific Constant (ASC) can be calibrated by means of trip survey and data
accumulation.
With the opening of HSR lines in different regions and accumulation of data of HSR passenger flow,
parameters can be calibrated from one region to another.

65
Table 11. Agglomeration Benefit of Beijing-Shanghai HSR on Jinan
Jinan
Base year 2010 Future year 2015
Generalized cost
GDP (RMB
100 million)
Generalized cost
(mln) GDP (RMB 100 million)
Without project
Generalized cost (mln)
With project
Generalized cost (mln)
CENTRE Jinan 3911 45 6600 45 45
PROVINCIAL CENTRE Tianjin 9109 567 16053 567 456
REGIONAL CENTRE Beijing 13778 801 20244 801 656
REGIONAL CENTRE Shanghai 16872 1394 24791 1394 1164
Contribution to economic mass
Distance decay parameter = 1 Base year Without project in future year With project in future year
CENTRE Jinan 86.9 46.7 146.7
PROVINCIAL CENTRE Tianjin 16.1 28.3 35.2
REGIONAL CENTRE Beijing 17.2 25.3 30.9
REGIONAL CENTRE Shanghai 12.1 17.8 21.3
Economic mass 132.3 218.0 234.0
Agglomeration benefits
Productivity elasticity Increase in GDP Benefit
(RMB 100 million)
0.050 0.36% 24.0
0.075 0.55% 36.5
0.100 0.75% 49.4

66
Table 12. Agglomeration Benefit of Beijing-Shanghai High-speed Railway on Dezhou
Dezhou
Base Year 2010 Future Year 2015
Generalized cost
GDP (RMB 100 million) Generalized Cost (mln) GDP (RMB100 million) Generalized Cost (mln) GDP (RMB100 million)
CENTRE Dezhou 1658 40 3500 40 40
PROVINCIAL CENTRE Tianjin 9109 470 16053 470 410
PROVINCIAL CENTRE Jinan 3911 258 6600 258 208
REGIONAL CENTRE Beijing 13778 571 20244 571 461
REGIONAL CENTRE Shanghai 16872 1577 24791 1577 1043
Contribution to economic mass
Distance decay parameter = 1 Base Year Without project in future year With project in future year
CENTRE Dezhou 41.5 87.5 87.5
PROVINCIAL CENTRE Tianjin 19.4 34.1 39.1
PROVINCIAL CENTRE Jinan 15.1 25.6 31.7
REGIONAL CENTRE Beijing 24.1 35.5 43.9
REGIONAL CENTRE Shanghai 10.7 15.7 23.8
Economic mass 110.8 198.4 226.0
Agglomeration Benefits
Productivity elasticity Increase in GDP Benefit
(RMB 100 million)
0.050 0.67% 23.5
0.075 1.03% 35.9
0.100 1.39% 48.6

67
Table 13. Agglomeration Benefit of Changchun-Jilin Intercity Rail on Jilin
Jilin
Base Year 2010 Future Year 2015
Generalized Cost
GDP (RMB
100 million)
Generalized Cost
(mln) GDP (RMB 100 million) Generalized Cost (min) GDP (RMB 100 million)
CENTRE Jilin 1855 40 3750 40 40
PROVINCIAL CENTRE Shenyang 5015 908 8838 908 748
REGIONAL CENTRE Changchun 3370 448 7000 448 323
REGIONAL CENTRE Beijing 13778 2021 20244 2021 1597
Contribution to economic mass
Distance decay parameter = 1 Base Year Without project in future year With project in future year
CENTRE Jilin 46.4 93.8 93.8
PROVINCIAL CENTRE Shenyang 5.5 9.7 11.8
REGIONAL CENTRE Changchun 7.5 15.6 21.7
REGIONAL CENTRE Beijing 6.8 10.0 12.7
Economic mass 66.2 129.1 139.9
Agglomeration Benefits
Productivity elasticity Increase in GDP Benefit
(RMB 100 million)
0.050 0.42% 15.6
0.075 0.64% 23.9
0.100 0.86% 32.4
68
7.6 Employment Effects
233. Compared with the time required for inducing employment effects, the duration of the HSR
operation have been very short to date in both case study areas. The business interviews show that the HSR
employment impacts are emerging, albeit in very limited ways, with few businesses placing the HSR as a
major factor in their site choice or relocation. This is particularly so in cities where HSR stations are built in
peripheral areas yet to be fully developed.
234. The business interviews explored any quantification of impacts on employment location and
business operations. Naturally, no enterprise and institution specifically monitor and report how their
business planning and operations respond to the availability of the HSR – it is left to the business managers
and senior professionals to decide how they best take advantage of the new mode, in the context of the
business operations. Nevertheless, they do feel that the HSR have had a significant impact, and can recount
them qualitatively. All main businesses and institutions have contributed to a five-yearly national Economic
Census regarding their output, employment and other operations data which means that, in time, there will be
a systematic data source at the enterprise level to help gauge the patterns of employment changes.
235. The business interviews involving 45 enterprises reveal impact factors for the site selection of
enterprises. Manufacturing enterprises name local industrial policy, land price, road accessibility, and
logistics services as key influences for site selection. For example, the site selection by large state-owned
enterprises is primarily influenced by preferential government policy, land availability and overall traffic
conditions. Therefore in new business site selection, many enterprises decided to settle in new economic
zones recently planned by government; whereas convenience for intra-city traveling is the main
consideration for small professional service businesses. Although for most of enterprises HSR is not
considered an important factor for site selection, many enterprises are located in current urban center sites
with intermodal connections, reflecting the implicitly significant role of rail transport accessibility for site
selection in the past.
236. The focus on passenger transport accessibility is especially true for the tertiary industry.
Professional service enterprises like the design/research institutes and consulting firms see the positive
impacts of HSR on their business operation: it facilitates human resource allocation between regions. Senior
staff in a city can now cover a few neighboring cities with quick responses, thus market can be explored to
achieve regional scale economy. Travel agencies observe that increased sales revenue has resulted from the
opening of HSR line. Cultural, arts, and media enterprises now can facilitate employment of experts, expand
geographical scope of training business, facilitate organization of fans events, and create new business
opportunities. Even for the manufacturing industry, HSR lowers expenses for business travel of its
managerial and sales personnel and result in time savings and productivity improvements. Those new
changes in business operation and the mobilization of human resources induced by HSR may bring prospect
of long-term employment effects.
237. Since the employment effects are a particularly difficult subject, both qualitative interviews
and quantitative analyses will have to be pursued in the next steps. The accumulation of the understanding
and data will gradually enable partial equilibrium modelling in the medium term (such as suggested in
Chapter 6) and SCGE modelling in the longer term (e.g. following the examples of Japan).

69
7.7 Tourism Effects
7.7.1 Empirical evidence
238. The basic model to establish the influence of changes in transport cost (which includes the
introduction of high-speed services) on tourism is straightforward. Improved transport services almost
invariably lead to an increase in trip-making, as has been demonstrated from both the aggregate data on
travel demand from the services already in operation and from the detailed surveys of users and businesses
described earlier in this chapter. Typically, the introduction of high-speed services has led to overall increases
in demand in the relevant corridors (net of transfers from other modes) of at least 20% and probably more for
shorter-distance links33
. Most travel on high-speed lines is undertaken by residents along the line. Travel
patterns overseas show demand between two cities is normally reasonably balanced in terms of the residence
of travelers, with slightly more (say 50%) being by residents of the smaller center, slightly less (say 40%) by
residents of the larger center and 10% by non-local residents. The on-board surveys showed a similar pattern:
the Changchun-Jilin survey found 47% of trips on the train between Changchun and Jilin were by Jilin
residents, 41% by Changchun residents and the remaining 12% by non-local residents.
239. However, such patterns do not hold when the center served by the improved service is a major tourist
attraction, for which the bulk of travelers will be based in other cities. This type of travel, which is termed
recreational tourism, is a discretionary activity, which may be undertaken or not depending on competing
tourist attractions or of alternative ways of spending discretionary income. This freedom of choice means
that this type of travel is much more sensitive to changes in the cost of travel. It is also sensitive to the ease
of travel; many of these trips are typically done over a weekend or a short holiday period (such as a three-day
weekend) and changes in the accessibility of a tourist location in terms of travel time (e.g. being able to
complete a round-trip as well as spend a reasonable amount of time at the destination) and in ease of
obtaining tickets for travel (as many of such trips are made at comparatively short notice, often being a
function of such short-term influences as the weather) have a major influence on recreational travel
behavior34
. As such travel is in practice a function of total cost, covering travel, accommodation and
incidental expenses such as sightseeing charges, the impact of high-speed services will depend on how high a
proportion of the total trip cost is for travel itself.
240. A case study was undertaken to assess such impacts in China, using the example of Qufu in
Shandong. Qufu was the home of Confucius and has been an important center for Chinese travelers for many
hundreds of years (over 100 emperors either visited the site or sent deputies there to worship). It now
receives large numbers of tourists, particularly during the summer months. It is about 500 km south of
Beijing and about 800 km north of Shanghai. Although the total number of visitors is not available, in 2010
3.8 million tickets were sold at the various attractions, of which 1.4 million were at Confucius Temple, the
main attraction and a very good proxy for the total number of tourists attracted to Qufu.
241. Before the opening of Beijing – Shanghai (Jinghu) line, Qufu was served by two railway stations: (1)
Qufu, on a secondary line of Rizhao to Xinxiang and (2) Yanzhou, on the Beijing – Shanghai (Jinghu) main
line. The Qufu station handled a small volume of passengers (200-300,000 p.a.) but Yanzhou, only about 30
minutes away by bus, handled far more, over 5 million p.a. Local estimates are that, prior to the opening of
the HSR, about 200,000 of these trips were to and from Beijing, about 250,000 to and from Shanghai and
150,000 to and from Nanjing. Although there is no detailed data available, it was stated that relatively few
33
See, for example, High-Speed Rail – The First Three Years: Taking the Pulse of China’s Emerging Program CTT 4, World Bank
Beijing 2012. 34
A good example is the growth of what is called the ‘weekend break’ market in Europe – often for two or three days. Such trips
have only been made possible by the growth of cheap airlines and the introduction of easy self-ticketing on the internet.

70
tourists from these places came by rail to Yanzhou; there were only three or four trains each day, typically
overnight at inconvenient times and taking from seven to ten hours or more. Such tourists who did use rail
generally travelled to either Xuzhou or Jinan and then toured the region by bus; the possibility of a weekend
trip to Qufu from these major centers was open only to the very determined.
242. The introduction of the HSR has provided a completely new market. The new station at Qufu East
handled 2.6 million passengers in 2012 and is on track to increase this to over 4 million in 2013. Local
estimates are that around 30% of the current passengers are to and from Beijing (say 1.3 million p.a. in
2013), about 15% to and from Shanghai (say 600,000 p.a.) and about 7% to and from Nanjing (say 300,000
p.a. Clearly such a large increase cannot be only (or even largely) tourists, but equally tourists must have
contributed significantly to that growth. The local travel industry confirmed that group tours were now
connecting to bus at Qufu rather than at Xuzhou or Jinan as they had done in the past; around 30% of group
tours (about 110,000 visitors) were now booked through local tour operators compared to 12% before the
HSR opened as a result. And due to easy connection by HSR, the proportion of group tour visitors has
dropped from 30% before to about 20% of total tourists.
243. Analysis of monthly ticket sales data for the Confucius Temple, provided by the local tourist
authorities, shows that, in 2011, overall ticket sales increased by 5% during the first six months, before the
HSR was opened but by 15% in the second six months35
. Ticket sales in 2012 increased by 9% in the first six
months but were unchanged from 2011 in the second six months (see Figure 14). We have carried out an
online media search to check if there had been any major tourism marketing campaigns from Qufu to boost
the tourist numbers over the period. Although the Qufu tourist industries have widely publicized the fact that
the HSR was opening its services, particularly to the residents in the Shanghai-Nanjing corridor in the south,
no exceptional marketing campaigns were in evidence. Overall, it seems a reasonable estimate of the
increase in tourism attributable to the HSR is about 10%, or about 150,000 visitors36
. Clearly, those cities
that are directly connected by the HSR to Qufu are expected to increase at a rate much higher than 10%,
whilst the contribution from the rest of the origins would be much smaller if the indirect connections have
been improved, or zero if there are no improvements.
Figure 14. Analysis of the Confucius Temple entry ticket sales 2010-2012
Source: Qufu Tourism Bureau
35 In particular, in July 2011, the first month of HSR operation, there was a special promotion in Shanghai and ticket sales at the Qufu
sites increased by 30%. 36 On the assumption that all visitors to Qufu visit the Confucius temple.

71
244. The increase in demand can also be seen in the reaction of the hotel industry to the opening of the
HSR. Prior to its opening, there were about 11000 beds in Qufu in some 329 hotels; 11 of these (with just
over 2000 beds) were ‘starred’ hotels. Since the second half of 2010, about 30 new hotels have opened,
providing over 3000 beds. Currently, several further hotels, with 1000 new beds, are under construction,
including two new 5-star hotels. Occupancy typically averages 60-70%, with 100% at weekends and
holidays, so the new construction implies a further 200,000 or so visitor-nights are being planned for. Not all
of these are expected to be new visitors; one objective is that, by providing better accommodation, tourists
who are visiting other centers in Shandong (such as Taishan) can be attracted to stay in Qufu rather than stay
elsewhere.
7.7.2 Demonstrative calculation
245. A calculative example is shown below as a demonstration of estimating impacts of Beijing-Shanghai
HSR on tourism in Qufu. This example is for one origin-destination pair: Tianjin to Qufu. Impacts on other
origin-destination pairs may be calculated in the same way. The purpose of the following calculation is to
demonstrate the underlying methodology and step-by-step workflow for such estimation, and we note where
relevant the assumptions we have made to overcome any data issues, and the need to improve on data.
246. Calculating generalized cost of each transport mode: there are four major transport modes (auto,
coach, non-HSR train, HSR) available between Tianjin and Qufu. Calculations of generalized cost are shown
in Table 16, measured in minutes. Among all modes, the generalized cost of travel by HSR is the lowest;
247. Calculating tourism effects: With valued as 0.005, the natural exponential of comprehensive
generalized expense )exp( D and mode share are shown in Table 17. Taking the logarithm on the sum of
natural exponential of travel costs across all the modes (with or without the HSR project):
1log ln[ exp( )]sums D
(7.3)
248. Values of other travel related expenses (on average) in the two scenarios are shown in Table 14. The
impact of the Beijing-Shanghai HSR on tourism demand from Tianjin to Qufu is shown in Table 15.
Table 14. Other Travel Related Expenses
Fees Without project With project
Accommodation 140 70
Food 150 120
Shopping 80 80
Entry fees 200 200
Total (RMB) 570 470
Total Expenses in Minutes 2280 1880
Table 15. Standardization of Generalized Cost and Calculation of Total Travel Expense
Scenario Log sums Other trip
expenditure Total trip expenses
Min yuan
With project 1553 388.15 470 858.15
Without project 1729 432.15 570 1002.15
249. The incremental expense with the project compared to without the project can then be calculated as

72
exp exp-1 14.4%
exp
withprojectense
withoutproject
total ense
total ense (7.4)
250. As indicated in Chapter 6, the tourism market in Asia for a modestly affluent population has an
average route elasticity of k=-1.46, i.e. for a 10% reduction in the expenditure the number of trips would
increase by 14.6% from a given origin to a given tourist destination (InterVistas, 2007, page v). For lack of a
specific local elasticity value for Tianjin-Qufu, we adopt the InterVistas elasticity of k=-1.46 here, which
implies that the increment of tourism demand as a result of the HSR from Tianjin to Qufu can be calculated
as demand =
expense k =(-14.4%)*(-1.46)=21%. In other words, the estimated increase in the number of
travelers from Tianjin to Qufu attributable to the opening of the HSR is estimated to be 21%. This would
seem to be broadly in line with the increases in tourism demand and the overall generated HSR traffic as
estimated above. However, because there is currently little information about the specific volumes of tourists
from Tianjin to Qufu, and about the tourism demand elasticities, we must say that any verification of this
estimate would have to await for further accumulation of the evidence base, which could become available
with a more detailed tourist survey guided by the discussions above.
251. This analysis may be repeated for other tourist origin-destination pairs to estimate the total impact on
tourism on the HSR corridor, as the evidence base is accumulated; such models may follow the simple
origin-destination pair model as proposed in Chapter 6 and demonstrated above. In the longer term,
however, more advanced modelling and estimation may be required to account for the new tourism facility
developments (e.g. conferences and exhibitions) and new tourism attractions (e.g. holiday resorts and leisure
destinations) that are to be triggered by the HSR services; such models may follow the more complex model
as proposed in Chapter 6, and eventually incorporated into SCGE models (e.g. those which are established
primarily for employment effects modelling).

73
Table 16. Comprehensive Generalized Cost of Different Transport Modes
Mode (km)
Distance
Service
Frequency
In vehicle In Qufu In Tianjin All door to door
ASC (Min)
Gen cost (RMB)
Cost
(Min)
Time
(RMB)
Cost
(Min)
Time
(RMB)
Cost
(Min)
Time
(RMB)
Cost
(Min)
Time
Car 448 999 194 384 3 15 0 30 200 474 -100 1471
Bus 448 2 132 420 0 10 5 45 142 530 -100 1828
Non-HSR Train 448 1 75 408 5 30 5 45 95 558 86 1794
HSR 448 5 199 120 3 23 5 45 215 256 0 1340
Table 17. Comprehensive Expenses in with/without project scenarios
With project
Lambda
- D
Lambda*Gen cost )exp( D
Mode Share
k
i
i
i
D
D
1
)exp(
)exp(
Without project
Lambda
- D
Lambda*Gen
cost
)exp( D
Mode Share
k
i
i
i
D
D
1
)exp(
)exp(
Car 0.005 -7.36 0.000638 30% Car 0.005 -7.36 0.000638 73%
Bus 0.005 -9.14 0.000107 5% Bus 0.005 -9.14 0.000107 12%
Non-HSR Trains 0.005 -8.97 0.000127 6% Non-HSR Train 0.005 -8.97 0.000127 15%
HSR 0.005 -6.7 0.001231 59%
Total 0.002104 100% 0.000873 100%

74
CHAPTER 8 CONCLUSIONS
252. The literature review, surveys and case studies carried out under this TA activity has established a
coherent methodology for regional economic impact assessment of HSR projects, a step-by-step guide to
practical analysis in the short term, and three main recommendations for longer term tasks. The
assessment methodology builds on robust theories and can be gradually extended to suit improved data
availability and growing complexity of project appraisal. The step-by-step guide translates the method
into a practical tool for the design institutes and other professionals in China to carry out the assessments
in the short term. The three specific recommendations for further work have been put forward to
establish a work program for extending the evidence base, to develop predictive models for specific
regions in China, and to extend the assessment framework to cover more general regional effects arising
from all relevant transport modes. Here we summarize the findings and further tasks beyond this TA
activity.
8.1 Summary of the Findings
253. The literature review shows that the theoretical and methodological development in the field to
date has enabled a number of developed countries to establish operational assessment procedures for the
regional economic impacts of major transport investment projects including the HSR. Germany, the UK
and Japan represent three distinct frameworks: Germany incorporates a largely qualitative procedure to
identify the areas with accessibility deficiencies and structural backwardness within its transport cost
benefit analysis; the UK adopts a quantitative procedure based on partial equilibrium models within its
transport cost benefit analysis; Japan, by contrast, adopts spatial computable general equilibrium models
to assess the agglomeration, employment, tourism and other regional impacts of HSR projects. At the
current level of development, we recommend that China follow the UK model in order to establish a
robust and operational framework for assessing the HSR impacts in the short term. This approach can
gradually evolve towards spatial general equilibrium modelling, although this will require considerable
time, data and further work.
254. The literature review suggests that, first, the predominant regional economic effect that is missing
from conventional transport cost benefit analyses is that of agglomeration on per capita productivity –
improved transport tends to raise average productivity and therefore contributes to additional economic
growth; this effect may be added to the conventional costs and benefits in an extended cost benefit
analysis without causing double-counting. Recent research carried out by a World Bank team shows that
at the current stage of development, transport projects can trigger significant agglomeration benefits in
China: all being equal, halving the economic distance within the coastal region Guangdong was estimated
to lead to a 10% rise in average business productivity (Jin, Bullock and Fang 2013b). This is broadly
corroborated by findings from business interviews, and significant growth in generated traffic that has
been observed on the trunk HSR lines between Wuhan and Guangzhou and between Beijing and
Shanghai. The case studies show that the estimated agglomeration benefits on various second-tier and
third-tier cities can be very substantial, for instance they are equivalent to 0.55% of total GDP in Jinan
per year, 0.63% in Jilin and 1% in Dezhou. The benefits of this scale seem to be corroborated by
business surveys and surveys of generated traffic (estimated at 18% for Changchun-Jilin and between 1/3
and 2/3 for Beijing-Shanghai), and would warrant more in-depth examination.

75
255. Regarding the impacts on jobs, the existing data sources cannot yet support a robust
quantification. We recommend that the evidence base be built up through business interviews using the
methodology developed by the study team and tested in the two case study areas. Given that the HSR
lines studied have only been put into operation very recently, specific evidence of significantly job
impacts is yet to emerge. However, as expected in the theoretical models, business operations in the
service industries as well as the management and sales departments of other industries have been
adapting rapidly to the significantly raised accessibility - in particular, trip frequencies of the existing
travelers have increased sharply. Passenger surveys indicate a substantially higher percentage of
business-related travelers on high speed rail than on conventional rail (e.g. 17% greater share for
Changchun-Jilin and 11% for Beijing-Shanghai) and an overall high market share of business travelers
(e.g. 40% for Changchun-Jilin and 63% for Beijing-Shanghai). We expect that continuous monitoring of
the employment effects through business surveys of this type will gradually uncover the precise
mechanisms and magnitudes of growth over time. We further put forward partial equilibrium models of
job location changes which can act as an intermediary step towards a full quantification of employment
effects through general equilibrium analysis.
256. Regarding the impacts on tourism, our tourism survey has shown that the tourism industry has
experienced a rapid transformation: the tourist trips have been increasing rapidly at major attraction sites
on the HSR lines. For instance, such impact is apparent in locations like Qufu, which experienced a net
increase in the number of visitors, part of which likely attracted by the reduction in total travel expense
with the availability of HSR. There is anecdotal evidence that improved accessibility by HSR has enabled
some tourists to spend fewer nights, although the existing surveys and tourism statistics are not adequate
to provide a full confirmation of this. Here more surveys and data collection is urgently required to
understand the changes in trip-making, tourist expenditure, and over-night staying patterns. It would
seem feasible to collect the necessary new data through extending the existing tourism surveys. Based on
good practice in tourist demand modelling, we recommend the adoption initially of a simple route-based
elasticity model, followed by a partial equilibrium tourist destination choice model, and eventually
incorporating of tourism effects in general equilibrium analysis.
257. The central conclusion of our empirical analysis is that a gradual accumulation of the evidence
base is of critical importance. Of the three types of effects studied, the estimation of agglomeration
effects is the most complete because a first set of parameters of the predictive model have been calibrated
over the recent years through the World Bank’s project monitoring work. The tourism effects model can
be made operational through supplementary data that should be feasible to collect in the short term. The
employment effects model cannot yet be calibrated. This is in part because specific evidence of HSR
effects will take time to build up and monitor (as shown in the business interviews conducted in the
study), and also because a more complex set of input data is required to estimate the contribution of the
HSR to employment changes.
258. During this TA activity the international and Chinese teams have been able to work together
effectively in reviews, model development and in particular through two cases studies (respectively on
the Changchun-Jilin ICR route and the northern part of the Beijing-Shanghai HSR). This has enabled
the joint team to develop empirical models for the agglomeration effects and tourism effects, and assess
the future requirements for the modelling of employment effects.
259. The findings above suggest that the expansion of markets and networks as result of the HSR may

76
be of great importance besides spatial planning of economic activities across China’s city regions. It
highlights the significance of analyzing spatial effects of transport investments. The methodology
proposed here provides a practical approach to quantification of some of the key effects at this stage,
which is in line with the stated objective for this Technical Assistance.
260. However, HSR is a new phenomenon in China. The accumulation of the empirical evidence is
only just starting. Extensive evidence and supporting data will be needed to enable a gradual calibration
of parameters used as part of the quantification to better understand the HSR impact in a Chinese context.
8.2 Recommendations for Further Work
261. The combination of a rigorous theoretical basis and practical operationability poses a challenge
that few countries have resolved. In light of what have been achieved by the joint international and
Chinese team, we put forward three specific recommendations that should be considered in further work.
262. First, establish a work program for extending the evidence base. It is clear from the case studies
that the current evidence base is far from complete for estimating all the predictive model parameters. On
productivity growth which is central to the regional impacts of transport investments, further theoretical
and empirical developments will be required, particularly in terms of the medium to long term effects.
Here it would be valuable to discern more precisely effects that arise through urban densification and
micro-level spatial sorting in the evolution of trade patterns, local labor markets and producer networks.
The agglomeration effects model also requires new data and calibration regarding the productivity
elasticity parameters which should be estimated and verified in each of the broad regions in China – this
is because such elasticity parameters may be different at different stages of development. This is
particularly important for the under-developed regions in China. Both the employment effects model and
the tourism effects model urgently need confirmation of a number of model parameters to substantiate the
assumptions currently being made in line with the international literature. More generally, the
evaluation of wider economic impact of transport networks is complex and a lot of methodology
development is still ongoing to control for other influences. The data collection and model calibration
are most effectively accomplished through the on-going monitoring of the HSR performance by the CRC.
263. Secondly, a continuous effort is required to monitor the effects of business agglomeration and
relocation, and their impacts on jobs across the regions. This could be gradually refined to identify
effects on key regional industries, including tourism. This would require the development of a SCGE
model for research purposes to capture the relative strengths of the connected urban centers and to
explore the dynamics of agglomeration, including any de-agglomerative impacts in some locations. As
shown in the literature review of the study, such models are capable of representing the interactions of the
agents in the macro- and regional economy, and can therefore provide more complete assessments. For
example, with appropriate segmentation of the industry sectors and population groups, the SCGE model
can provide insights into social and distributional impacts, especially for the under-privileged and
vulnerable groups. The SCGE models are technically complex, and would require considerable technical
skills that are scarce in China. A longer term vision of the assessment framework will help program the
training as well as evidence base building over time.
264. Thirdly, building on the accumulation of data sources through wider monitoring, it would be
possible to extend the assessment framework to cover a more general assessment framework for regional

77
effects arising from all relevant transport modes (e.g. highway, conventional rail and air, as well as the
HSR), and the interactions between transport and spatial economic and regional land use patterns. This
will lead to an improved understanding of the counterfactuals to transport investment scenarios, and
contribute to more precise measurements of the additional benefits and costs brought by transport
interventions.
265. Ultimately all of the above analyses further contribute to assessing the policy decisions with
overarching benchmarks of poverty alleviation, shared prosperity and inclusive green growth. The
current TA activity serves to expand the foundation of the integrative analyses, which may be jointly
carried out with social, distributional and environmental assessment.

78
BIBLIOGRAPHY
Abelson (2009). The wider economic benefits of transport: a review. Working Paper produced by Applied Economics,
Sydney, Australia.
Acemoglu, D. Modern Economic Growth. Princeton University Press, Princeton, 2009.
Adler, HA (1987). Economic Appraisal of Transport Projects. published for the World Bank by John Hopkins
University Press, Washington.
Aghion, P. and P. Howitt. A model of growth through creative destruction. Econometrica, 60:323–351, 1992.
Ahlfeldt, GM and A Feddersen (2010). From Periphery to Core: Economic Adjustments to High Speed Rail. See
http://eprints.lse.ac.uk/29430/1/From_periphery_to_core_(LSERO_version).pdf
Aschauer, DA (1989). Is public expenditure productive? Journal of Monetary Economics, 23, 177-200.
Audretsch, DB and Maryann P. Feldmann. Knowledge spillovers and the geography of innovation. In J.V. Henderson
and J.-F. Thisse, editors, Cities and Geography, volume 4 of Handbook of Regional and Urban Economics,
chapter 61, pages 2713–2739. Elsevier, Amsterdam, 2004.
Baldwin, Richard E. & Martin, Philippe (2004). "Agglomeration and regional growth," Handbook of Regional and
Urban Economics, in: J. V. Henderson & J. F. Thisse (ed.), Handbook of Regional and Urban Economics,
edition 1, volume 4, chapter 60, pages 2671-2711 Elsevier.
Barro R and Xavier Sala–i–Martin. Economic Growth. McGraw-Hill, New York, 1995.
Baum-Snow, Nathaniel, Loren Brandt, J. Vernon Henderson, Matthew A. Turner and Qinghua Zhang (2013). Roads,
Railroads and Decentralization of Chinese Cities. Working paper, see
http://www.econ.brown.edu/fac/nathaniel_baum-snow/china_transport_all.pdf
Bröcker, J (1998). Operational spatial computable general equilibrium modeling. The Annals of Regional Science, 32,
367-387
Campos, J., & de Rus, G. (2009). Some stylized facts about high-speed rail: A review of HSR experiences around the
world. Transport Policy, 16(1), 19-28.
Chen, C.-L., & Hall, P. (2011). The impacts of high-speed trains on British economic geography: a study of the UK's
InterCity 125/225 and its effects. Journal of Transport Geography, 19, 689-704
Christaller (1933). Central places in Southern Germany. Engelwood Cliffs, NJ: Prentice-Hall (English edition 1966).
Combes, P-Ph, G Duranton and L Gobillon (2005). Spatial wage disparities: sorting matters! CERAS Working Paper.
Coto-Millán, P., Inglada, V., & Rey, B. (2007). Effects of network economies in high-speed rail: the Spanish case. The
Annals of Regional Science, 41(4), 911-925.
De Rus, G. (2011). The BCA of HSR: Should the government invest in high speed rail infrastructure?. Journal of
Benefit-Cost Analysis, 2(1).
DfT (2006). Transport, Wider Economic Benefits, and Impacts on GDP. London: UK Department for Transport
(2006). See http://www.dft.gov.uk/pgr/economics/rdg/webia/transportwidereconomicbenefi3137
DfT (2009). The Wider Impacts Sub-Objective. Transport Analysis Guidance (TAG) Unit 3.5.14. UK Department for
Transport. See http://www.dft.gov.uk/webtag/documents/expert/pdf/unit3.5.14c.pdf.
Domencich, T and D McFadden (1975). Urban Travel Demand: A Behavioural Analysis. (North Holland, Amsterdam)

79
Dong Xinliang, Ma Guangwen, Zhang Qiuju, (2008). Zhentouba/Shaping Shuidianzhan Jianshe de Quyu Jingji
Yingxiang Fenxi, Zhongguo Nongcun Shuili Shuidian, Vol. 10
Duranton, G and D Puga (2004). Micro-foundations of urban agglomeration economies. In J. V. Henderson & J. F.
Thisse (ed.), 2004. "Handbook of Regional and Urban Economics," Handbook of Regional and Urban
Economics, Elsevier, 2063–2063.
Duranton, G and MA Turner (2012). Urban Growth and Transportation. Review of Economic Studies, 1:1evi
Fishlow, A.American railroads and the Transformation of the Ante-Bellum Economy, Harvard Economic Studies,
Volume CXXVII 1965
Fujita M. and J.-F. Thisse. Economics of Agglomeration: Cities, Industrial Location, and Regional Growth. Cambridge
University Press, Cambridge MA, 2002.
Fujita, M (1989). Urban Economic Theory: Land Use and City Size. Cambridge: Cambridge University Press.,
Fujita, M, P Krugman and AJ Venables (1999). The Spatial Economy: Cities, Regions and International Trade.
Cambridge, MA: MIT Press.
Glaeser, E (2012). Triumph of the City. Penguin Books, London.
Glaeser, E, J-P Chauvin and Kristina Tobio (2011). Urban Economics in the U.S. and India. Paper presented at the 3rd
Global Conference on Economic Geography, COEX, Seoul, Korea, June.
Graham, DJ (2005). Wider Economic Benefits of Transport Improvement: Link between Agglomeration and
Productivity, Stage 1 Report prepared for the Department for Transport, London.
Graham, DJ (2007) Agglomeration, Productivity and Transport Investment, Journal of Transport Economics and Policy,
41, 317-43.
Hu Tianjun, Shen Jinsheng, (1999). Jinghu Gaosu Tielu Dui Yanxian Jingji Fazhan de Yingxiang Fenxi, Jingji Dili.
IBRD (2006). Governance, investment climate, and harmonious society: competitiveness enhancements for 120 cities
in China. Washington DC: IBRD / The World Bank. [In English and Chinese].
Intervistas (2007). Estimating Air Travel Demand Elasticities: Final Report. Prepared for IATA. See:
http://www.iata.org/whatwedo/Documents/economics/Intervistas_Elasticity_Study_2007.pdf
Jin, Y and MH Echenique (2012) Employment location modeling within an integrated land use and transport
framework: taking cue from policy perspectives. In F Pagliara, DC Simmonds and AG Wilson (eds);
Employment Location in Cities and Regions. Springer, Heidelberg, pp133-158.
Jin, Y, RG Bullock and W Fang (2013a). Regional Impacts of High Speed Rail in China: Identification, quantification
and outlook. Background Report. The World Bank Beijing Office, Beijing.
Jin, Y, RG Bullock and W Fang (2013b). Spatial proximity and productivity in an emerging economy: econometric
findings from Guangdong Province, People’s Republic of China. The World Bank Beijing Office, Beijing.
Jin, Y, RG Bullock and W Fang (2013c). Impacts of High Speed Rail in China: Yunfu Case Study. The World Bank
Beijing Office, Beijing.
Jin, Y and MH Echenique (2012). Employment location modelling within an integrated land use and transport
framework: taking cue from policy perspectives. In F Pagliara, DC Simmonds, M de Bok and AG Wilson,
eds. Employment Location Modelling. Elsevier, 133-158. DOI: 10.1007/978-3-642-31779-8.
Jin Y, M Echenique and A Hargreaves (2013). A recursive spatial equilibrium model for planning large-scale urban
change. Environment and Planning B: Planning and Design Vol 40, Issue 6 (doi:10.1068/b39134).
Jorgenson, D, M Kuroda and K Motohashi, eds (2007) Productivity in Asia. Cheltenham, UK: Edward Elgar.

80
Keefer, Thomas C (1850). Philosophy of railroads. Montreal: Armour and Ramsay.
Kopp, A (2005). Aggregate Productivity Effects of Road Investment - A Reassessment for Western Europe.
EconPapers at http://econpapers.repec.org/paper/wiwwiwrsa/ersa05p631.htm
Krugman, P (1991). Geography and Trade. Cambridge, MA: MIT Press.
Lao Chengyu, (2007). Zhongda Jianshe Touzi Xiangmu Quyu Jingji Pingjia Fangfa Pouxi, Xinan Jinrong, Vol. 10
Li Jingwen (2000). Tiedao Yu Fazhan. Shehui Kexue Wenxian Chubanshe, pp. 171-262
Li Jingwen et al. (1997). Kuashiji Zhongda Gongcheng Jishu Jingji Lunzheng, Shehui Kexue Wenxian Chubanshe, pp.
244-252. (in Chinese)
Li Jingwen, (1998). Jinghu Gaosu Tielu Jianshe Dui Yanxian Diqu Jingji Fazhan de Yingxiang. China Railways. Vol.
10.
Li Ping, Li Wenjun, and Guo Shusheng, (2003). Tedaxing Touzi Xiangmu de Quyu he Hongguan Jingji Yingxiang
Fenxi, Shuliang Jingji Jishu Jingji Yanjiu, Vol.2
Li Shantong, Xu Xinyi (Editors), (2004). Nanshuibeidiao yu Zhongguo Fazhan, Jingji Kexue Chubanshe, pp. 39-43,
155-245, 373- 382.
Lin Xiaoyan and Chen Youxiao, (2006). Jichusheshi Touzi Xiaoguo Dingliang Pingjia. Tsinghua Universiy Press.
Lin Xiaoyan, Chen Xiaojun, Bai Yunfeng, Han Xinmei. (2010). Jingjin Chengji Gaosu Tielu dui Quyu Jingji Yingxiang
Dingliang Fenxi. Vol. 5.
Lu Lachang, Huang Ru, (2012). Urban hierarchy of innovation capability and inter-city linkages of knowledge in post-
reform China. Chinese Geographical Science, 22(5): 602–616. doi: 10.1007/s11769-012-0555-8
Marshall A (1890). Principles of Economics. London: Macmillan (The 8th Edition was published in 1920).
Melo, P, DJ Graham and RB Noland (2009). A meta-analysis of estimates of urban agglomeration economies.
Regional Science and Urban Economics, Vol 39, pp332-342.
Meng Wei, (2006). Gaosugonglu Dui Quyu Jingji Yingxiang Fenxi yu Pingjia Fangfa Yanjiu, Changsha Ligong
University, Doctoral Dissertation.
Meré and Graham (2010). Agglomeration elasticities and firm heterogeneity. SERC discussion paper 43. London:
London School of Economics.
Ming Libo, Zhen Feng, Zheng Jun, (2007). Wuxi-Nantong Guojiang Tongdao Jianshe Gouxiang Jiqi Quyu Jingji
Yingxiang Pingjia, Renwen Dili, Vol 4
MoHURD, NDRC and MOR (2011). Economic Evaluation for Rail Construction Projects: Methodologies and
Parameters, China Planning Press, Beijing. (In Chinese)
MoR and CIECC (1993). Methods on Economic Evaluation for Railway Construction Projects, 1st Edition. (in
Chinese)
MoR and CIECC (1997). Methods on Economic Evaluation for Railway Construction Projects, 2nd Edition, Southwest
Jiaotong University Press, Chengdu, Sichuan. (in Chinese)
Oosterhaven J and T Knaap (2003). Spatial Economic Impacts of Transport Infrastructure Investments. In A. Pearman,
P. Mackie & J. Nellthorp (eds) Transport Projects, Programmes and Policies: Evaluation Needs and
Capabilities, Ashgate, Aldershot
O’Sullivan, A (2003). Urban Economics, 5th ed., McGraw-Hill, New York.
OECD-ITF, 2008; http://www.internationaltransportforum.org/Pub/pdf/08rt140.pdf
Ortúzar, Juan de Dios and Luis G Willumsen (2011). Modelling Transport. Wiley, Chichester.

81
Redding SJ and A Venables (2004). Economic geography and international inequality. Journal of International
Economics, 62, 53-82.
Ren R and LS Lin (2007). Total factor productivity growth in Chinese indistries 1981-2000. In Jorgenson et al, eds
(2007), 76-112.
Rice, P.G., A.J. Venables and E Patacchini (2006). Spatial determinants of productivity: Analysis for the regions of
Great Britain. Regional Science and Urban Economics, 36, 727-752.
Roberts, M, U Deichmann, B Fingleton, T Shi (2012). Evaluating China's road to prosperity: A new economic
geography approach. Regional Science and Urban Economics, 42: 580-594.
Romer, PM, Endogenous technological change. Journal of political economy, 98:S71–S102, 1990.
Rosenthal, S and WC Strange (2004). Evidence on the nature and sources of agglomeration. Review of Economics
and Statistics, 85, 377-393.
Song Yongfu, (2006). Jingjiu Tielu Dui Jingji Shehui Fazhan Zhongda Zuoyong Yanjiu, Jingji Guanli Chubanshe
Song, H and G Li (2008). Tourism demand modelling and forecasting—A review of recent research. Tourism
Management 29: 203–220
Sun, Yongfu, ed (2009). A Study of the Significant Role of the Beijjing-Kowloon Railway for Economic and Social
Development. Economic Management Press, Beijing. (In Chinese)
Ureña, José M. , Philippe Menerault, Maddi Garmendia (2009), The high-speed rail challenge for big intermediate
cities: A national, regional and local perspective. Cities, 26: 266-279.
Venables, AJ (1996). Equilibrium locations of vertically linked industries. International Economic Review, 37, 341-
359.
Venables, AJ (2010). Productivity in cities: self-selection and sorting. Unpublished Working Paper. Department of
Economics, University of Oxford.
Vickerman, R (2007). Recent Evolution of Research into the Wider Economic Benefits of Transport Infrastructure
Investments. OECD/ITF Joint Transport Research Centre Discussion Papers 2007/9, OECD Publishing.
Wegener, M (2011). Transport in Spatial Models of Economic Development. In A de Palma, R Lindsey, É Quinet and
R Vickerman, eds. Handbook in Transport Economics. (Edward Elgar, Cheltenham)
Willigers, J., & Van Wee, B. (2011). High-speed rail and office location choices. A stated choice experiment for the
Netherlands. Journal of Transport Geography, 19(4), 745-754.
Wilson, AG and F Pagliara (2012). Employment Location Models: An Overview. In F Pagliara, DC Simmonds, M de
Bok and AG Wilson, eds. Employment Location in Cities and Regions. London: Springer, 1-10.
World Bank (2009). World Development Report 2009: Reshaping Economic Geography. Washington DC: The World
Bank.
Wu Gaoxuan, Song Shuyan, Fu Weigang, (2009). Gonglu Xiangmu Quyu Jingji Yingxiang Fenxi, Keji Xinxi, Vol. 19
Zhao Juan, Lin Xiaoyan. (2010). Jingjin Chengji Tielu Quyu Jingji Yingxiang Pingjia. Tiedao Yunshu Yu Jingji. Vol. 1
Zheng Youjing (Editor), (1994). Chaodaxing Gongcheng Jianshe Xiangmu Pingjia, Lilun Fangfa Yanjiu, Shehui Kexue
Wenxian Chubanshe, pp. 60-67. (in Chinese)

82
APPENDIX 1. A REVIEW OF EX POST EVALUATION STUDIES
OF HIGH SPEED RAIL PROJECTS OUTSIDE CHINA
The reviews in this appendix are organized first by country to summarize the features. A specific section
is then devoted to tourism impacts.
France
The first French Train à Grande Vitesse (TGV) line, Paris-Lyon, opened in 1981, primarily to relieve
congestion on the main Paris-Dijon-Lyon line. The line was then extended south to Marseilles, and other
lines and extensions were built generally where there was thought to be enough demand. Many of the
French HSR routes have sections of dedicated HSR track but use normal track to start or end the journey
(e.g. Paris-Geneva). Fares and fare strategy are generally the same as those on conventional trains
(including yield management borrowed from airlines, and discounts for many types of passenger).
One of the first papers to examine the impact of the TGV appeared in 198637
, which reported the results
of before-and-after surveys of business behavior with the aim of identifying the effect on both businesses
based in Rhone-Alps (RA), the region in which Lyon is situated, and the impact on Paris-based (PA)
firms. Two main employment-related conclusions could be drawn from the surveys:
High-level service industries flourished; trips from Paris increased by 52% but trips by RA-based
firms increased by 144%; thus, contrary to the expectation that Paris-based firms would swamp local
firms, the reverse occurred and services were able to expand outside Paris.
The opening of the TGV took place at a time of economic crisis when businesses were contracting
rather than expanding so little had been observed at the time of study. However, it appeared that the
TGV was not a determining factor in the location of business location but was certainly a factor in
selecting between alternative locations which were otherwise reasonably similar.
Subsequent surveys were also planned post-1986 investigating the regional city hierarchy, the
attractiveness of universities and the impact of the project on businesses with multiple units in regional
centers. The results of those studies are unknown. Further regional studies suggest with anecdotal
evidence that some head offices subsequently moved from Lyon to Paris38
.
Policies to leverage HSR for development, where they exist, have been locally developed rather than part
of a national policy initiative. There is little published quantitation of regional impacts and it is difficult
to distinguish HSR-related effects from those that might have happened anyway. However, a common
theme through much of the literature in France is that HSR can add impetus to regional development, but
will not alone cause it. HSR has proved beneficial to towns or regions with a relatively strong, high-end
service sector such as higher education, medical complexes, information technology and ‘back offices’39
.
Regions that rely mainly on manufacturing, agriculture and mining generally see much less difference,
apart from the travel time saving benefits to passengers.
37 Bonnafous A, The regional impact of the TGV, Transportation 14, 1986,pp 127-137 38 See Chen and Hall (2011). 39 ‘Back office’ refers to high density, low to moderate cost workplaces frequently used by call-centres, data processing centres,
banks, insurance company and some government agencies to house employees.

83
Examples of centers besides Lyon where there has been a positive interaction between HSR and regional
development include:
Lille, on the crossroads between Paris, London and Brussels/Amsterdam, now has the largest
university/medical complex in Europe and substantial regional banking and insurance activities.
Le Mans, now (post-HSR) a major center for the insurance industry, built on insurance activity
that was previously solely local and regional.
Rheims, where new university campus extensions have complemented existing tertiary
education. It has also become a center for online information technology-based services and back
office services (accounting, information technology, human resources).
Marseilles, a major port and regional business/service center where a successful new business
park and entertainment center, Euroméditerranée, were constructed close to the HSR station.
However, there are also cases where there are few positive and some negative impacts around HSR
stations. For example, Le Creusot, Montceau, and Montchanin are declining mining areas and
experienced no measurable regional development impact. In Mâcon, business areas were set up in an
attempt to attract activities that needed fast connections to Paris and Geneva, but had limited success.
Rural areas in the northeastern part of France around Lille also experienced ‘tunnel’ effects, meaning they
have the negative noise and visual impacts of the HSR line running through the countryside but no direct
improvements in access. Small towns without TGV stations in this area reported losses of some services
to larger centers that have stations.
Policies designed to enhance the impact of HSR have had varying success. For example, in Lille, local
and regional government and business groups combined to develop several new office blocks in a
rundown area (about 1 kilometer length) between the main Lille station and the HSR station. It was
successful, although not in attracting the private sector – many of the tenants are government-controlled
or government-influenced banks and insurance companies. The net employment effects in the wider
region are not known and it has been suggested that the Lille development has partly been at the expense
of smaller surrounding cities.
In summary, while the French literature is generally positive, it is also clear that success is not guaranteed
and that active local policies are essential to promote HSR-related development.
Spain
The experience in Spain is in many ways similar to that in France, with the impact of HSR depending on
the size of the city, its location relative to others on the rail line, and its location relative to the capital,
Madrid. The primary policy objective of HSR in Spain was to connect all the major coastal cities to
Madrid with a rail journey time of not more than four hours, but the first line to Seville was also intended
to provide sufficient capacity for the 1992 World Expo as well as to achieve a policy objective of
improved connections to the relatively undeveloped south of Spain40
. Other lines were then built between
2003 and 2008.
A national strategic objective of reducing regional disparities by investing in HSR appears to have been
successful, albeit that the level of success may be modest. An Organisation for Economic Co-operation and
40 Invensys Rail & Oxford Analytica, The benefits of high-speed rail in comparative perspective, 2012.

84
Development (OECD) report notes Spain was one of only eight OECD countries (five of which had
significant HSR lines) in which regional inequality decreased between 1995 and 200541
. Although the
introduction of HSR was only one of several policy measures in Spain, it nevertheless seems that HSR
added value to a wider mix of regional policy measures.
Findings from several papers can be summarized into two key points42
, although at this stage firm
conclusions can only be drawn from the first lines to be opened. Firstly, the impacts of HSR in Spain on the
large intermediate cities have not depended solely on HSR access. Secondly, the presence of an HSR station
has not necessarily been a precursor to greater local economic development.
Large cities located between the major centers at the ends of the HSR lines are often the principal city within
their sub-region or province and as such contain high-level services such as hospitals, universities and
government offices. Such cities with an HSR station have benefited from having people transit through the
city that previously flew over them. Their improved accessibility can also help to attract tourism (especially
day return trips).
For both business and leisure travel, the short term impact has been an increase in total visitor numbers but a
loss of overnight stays43
. HSR has also supported the dispersion of back office activities from larger centers
to intermediate centers in some cases. However, intermediate cities can also lose if businesses in small cities
can now bypass the services previously obtained in them and go directly to large cities as a result of HSR.
Similarly, employers in large cities can draw employees directly from small cities because of reduced
commuting times. In these examples, the intermediate cities become hubs through which small cities gain
access to large cities using HSR. For example, HSR has brought Madrid and Seville closer to the smaller
cities, and so some roles that were played by Cordoba, the large intermediate city, are now concentrated in
Madrid and Seville
If the intermediate centers are within 1.5 hours of the larger centers, commuting in both directions increases,
with the pattern depending upon each city’s service and industry base, the station location and extent to
which any station-related regeneration creates wider economic activities and job opportunities44
.
In summary, the experience of Spanish HSR suggests that key factors in maximizing the development
benefits of HSR, in addition to good planning and strong political leadership, include45
:
The station should be located close to the city center, preferably close to established business
activities.
Land should be released for mixed-use development, including offices, residential, conference
facilities, public services and open space.
A city transport hub with good local, sub-regional and regional services
Plans for signature architecture to address image and sense of place.
A mix of public and private sector investment.
41 OECD, How Regions Grow, March 2009. 42 For example, various local level studies by Bellet: see C Bellet & A Casellas, ‘Infraestructuras de transporte y territorio. Los
efectos estructurantes de la llegada del tren de alta velocidad en España’, Boletín de la Asociación de Geógrafos Españoles, no. 52,
2010, pp. 143-163. 43 J Puebla, ‘El tren de alta velocidad y sus efectos espaciales’ Investigaciones Regionales, 2005. 44
In most cases, land close to the HSR station has been released for new development. 45
Urena, Menerault & Garmendia

85
A development corporation or similar organization should undertake collaborative public-private
real estate development in the station precincts.
Germany
The most statistically rigorous analysis of the impact of improved accessibility on a regional economy has
been undertaken in Germany, studying the impact of the 177km Cologne – Frankfurt high-speed line on two
small towns, Montabaur and Limburg, situated between the two cities . The two towns are small (with
respective populations of 12.500 and 34,000) and are located only some 20 km apart around the midpoint of
the line. Their selection was largely determined by political rather than economic considerations and any
economic impacts that were observed could thus be confidently associated with the railway line rather than
being caused by pre-existing economic factors. The HSR line was opened in 2002 and has more than halved
rail travel times along the route, bringing the two towns to within 30 minutes of both Frankfurt and Cologne.
The analysis used a range of techniques to test the hypothesis is that driving economic agents closer
together, and thus increasing accessibility to regional markets, should promote economic development in the
affected regions. The results suggested that the increase in market access led to economic adjustments in
several indicators such as GDP, per capita GDP and employment over a four year period, centered on the
two town rail stations. The estimated increase in GDP in these areas was 2.7%. A range of alternative
explanations were also tested, such as economic density, geography, industrial composition, business
turnover (or ‘churn’), the impact of the line construction and substitution in which growth was abstracted
from adjacent regions but the result remained robust, indicating a 0.25% growth in GDP for any 1% increase
in market access. The increase in GDP also appears to last once the initial impact of the HSR has been
absorbed and is thus a permanent effect.
UK
Although UK has only limited high-speed services operating on dedicated track, it has many Intercity
services, introduced in 1977, which operate on conventional track at speeds of (currently) up to 200km/h.
These services reduced journey times by up 20-30% and brought many regional centers into relatively easy
commuting distance to London. A detailed study of the long-term regional economic impacts of these
services compared six routes radiating from London, two with high-speed services and four without over
the 30 years from 1976 to 2006. The dependent variables aimed to measure economic strength and service
development, especially the knowledge economy: these included Gross Value Added (GVA) per head ,
employment, and unemployment (for local economic strength), Gross Disposable Household Income
(GDHI) and population changes (to reflect changes in spatial-economic patterns over time) and service
employment, ‘knowledge-intensive employment’, split into medium and high technology, and knowledge-
intensive services proper.
The conclusions drawn from the data were qualitative rather than quantitative, reflecting the nature of the
analysis. The HST service appeared to have had positive spatial-economic impacts on most cities within a 2-
hour train time to and from London (this covered much of UK for those routes on which the services
operated) and these centers demonstrated particular strength in knowledge-intensive services. HST centers
within 1 hour of London demonstrated major population increases, with knowledge-intensive industries
again prominent. In contrast, the non-HST towns were characterized by a generally weaker local economic
performance. Most demonstrated apparently-contradictory features: strong population inflow, high-income

86
inhabitants, yet low economic strength; many of these centers lie within the London commuter belt and draw
a significant component of their strength through income transfers. The analysis demonstrates that HST is
generally associated with stronger regional economic growth but this is by no means automatic: the
improved accessibility provided by HST cannot by itself guarantee local economic competitiveness and
good transport remains a necessary but not sufficient condition for regional growth.
Japan
Nakamura and Ueda (1989) (cited in Sands, 1993) found three of the six prefectures in Japan with a
Shinkansen station had higher population growth than the national average between 1980 and 1985, while
no prefecture without the Shinkansen grew faster than the national average. Whether the causality is that the
rail caused the growth or areas expected to grow attracted investment is unclear. Similar studies of
metropolitan growth suggest that Shinkansen and growth are correlated (e.g. Hirota, 1984) reported by
Brotchie (1991), but the causal structure is not clear from the ex post studies. Recent studies suggest that the
effects of the newer Shinkansen lines are not as favorable as earlier lines (Nakagawa and Hatoko, 2007).
Sands (1993) concluded the Shinkansen had shifted growth, but not induced it.
Tourism
Given that there are only a limited number of published studies analyzing the impact of HSR on tourism,
they are summarized here across countries. Many studies simply correlate changes in visitors at tourist
attractions with the dates at which HSR services are introduced.
A Japanese study documented the impact of two Shinkansen extensions on regional tourist facilities46
. The
Tohoku line was extended 96 km from Morioka to Hachinohe in December 2002 while the initial 138 km
section of the Kyushu line from Shin Yatsushiro to Kagoshima was opened in March 2004. Both of these
extensions saw sharp increases in demand: the Hachinohe line saw demand increase by 50% whilst demand
had increased by 140% on the Kyushu line by the third year of operation. Both lines reduced travel times
substantially, by 40 minutes in the case of Hachinohe and by nearly 90 minutes in the case of Kagoshima.
With the new lines, Hachinohe is within three hours of Tokyo while Kagoshima is only just over 2 hours
from Fukuoka, the capital of Kyushu.
The Hachinohe extension serves the Towada-Hachimantai National Park, a major tourist attraction, covering
two physically separate areas, with hot springs and attractive scenery and the region also has a number of
festivals. Prior to the extension, visitors to the Park had been steadily declining for nearly a decade and had
fallen to about 250,000 per year. After the extension had been opened, visitor numbers increased by about
25% to over 300,000. In particular, visitors using the main entrance to the northernmost area, and the one
which benefitted most from the extension, increased by over 60% to over 100,000 (Figure 15).
Another example from the same line is the impact on the five-day Hachinohe Sanja Festival (Figure 15-b).
Although visitors were increasing steadily prior to the extension opening, the new line appears to have
encouraged an increase of around 20% compared to where demand would otherwise have been.
46
Major impacts of the recent Shinkansen extensions, T. Matsunaga and S. Yamaguchi

87
Figure 15. Impact of Shinkansen extensions on visitors
a. Towada – Hachimantai National Park b. Hachinohe Sanja Festival
c. Lake Towada Winter Festival d. Visitors to Kagoshima
A third example is the number of visitors to the Lake Towada Winter Festival (‘Winter's Tale’) – the largest
of its type in Northern Tohuku (Figure 15-c). The number of visitors was increasing steadily prior to the
extension opening but the Festival was then increased from 2-3 weeks to 4 weeks and the total number of
visitors then increased sharply, both in total and per day. Although the number reduced in 2004 and 2005, the
total tourism still shows a substantial increase on that before the extension opened.
The Kyushu line has seen similar impacts:
The number of tourists entering the city of Kagoshima had remained constant at around 820,000 for
the four years prior to the opening of the new line in 2004. It then increased by about 6% to 870,000
p.a.
The visitors to the Kagoshima Aquarium, having remained steady at about 160,000 p.a. for four
years, increased by 20% while the number of tourist bus passengers increased by 10% (Figure 15).
After the opening of the line, three new hotels opened in Kagoshima (compared to 20 before) and
hotel guests increased by 14%.
In summary, the Shinkansen lines opened in 2002 and 2004 generated a measurable increase in visitors,
around 20% for leisure trips (based on the Hachinohe tourist facilities) and probably about 10% overall.

88
The Bonnafous study described earlier also included some discussion on the tourism impact of TGV Sud-Est
. Two countervailing impacts were identified. Overnight stays in some of the main centers decreased as one-
day trips increased from 42% of the total visitors before the line opened to 55% afterwards. However,
recreational tourism clearly increased with hotels in smaller centers almost reaching saturation and visits to
the Abbaye of Fontenay, five kilometres from the small town of Montbard, increased by 40% in 3 years.

89
APPENDIX 2. A REVIEW OF EX ANTE HIGH SPEED RAIL PROJECT
ASSESSMENT METHODS
Micro Surveys with Firms
These surveys have generally been designed to investigate the relative importance of the various factors
influencing firms’ location, including infrastructure accessibility. The answers reflect the different location
bottlenecks experienced by the firms as well as the variation in cost profiles between different economic
sectors but centrality and reliability of access generally play an important role. Other micro survey research
has tried to investigate the historical or future impacts of specific infrastructure investments. As with the
equivalent passenger Stated Preference surveys, care needs to be taken in interpreting the results of such
surveys, since firms tend to answer positively even when the project at hand is of little importance to their
own firm, and second-order impacts (e.g. on the firm’s suppliers and customers) are very difficult to
establish. Nevertheless, as discussed later in this chapter, such surveys can yield very useful information.
Quasi-Production Functions
Many macro-economic studies have shown strong links between the aggregate level of infrastructure
investment and economic growth as measured by GDP, productivity or employment. For example Adler
(1987) concluded that when investment in transport infrastructure leads to major new developments or large
(non-marginal) increases in output, the net value of this additional output (gross value less all inputs) could
be regarded as a measure of the value of increased output. In the late 1980s several studies investigated this
at a macro-level by, for example, regressing GDP against levels of infrastructure investment, and most of
these found a large return to infrastructure investment (see Aschauer, 1989, for example). Whether this link
is causal or not, and the direction of the causality, is not clear from the various analyses, as many took little
account of the nature of the relationship between the response variable (output or productivity) and the
regressors (e.g. transport investment, labor, capital etc). Many reviews, such as World Bank (1994),
discounted these results on the grounds that a common factor may explain output and investment, economic
growth may drive investment rather than the reverse, and the macroeconomic correlations did not have a
clear microeconomic basis. A further shortcoming is the fact that transport was considered as a lump-sum
investment with no reference to its location (which could affect the cost of infrastructure) or geographic
effects (which could be very uneven across space).
An overview paper by Lakshmanan47
noted that there have been many variations between several macro-
economic studies which try to estimate this relationship in the functional specifications that are assumed, the
variables used for such measures as output (e.g. GDP, per capita income etc), the level of disaggregation of
the economy (i.e. a single sector or some dozens), the size of the geographic area (nation or region) and in
whether the model uses single year, multiple year, cross-sectional or pooled data. Although in aggregate they
show that there is a relationship between transport investment and economic growth and productivity, the
magnitude of the relationship varies markedly (by 5:1 or more) from study to study, even when these are
considering the same country and time period48
. Lakshamanan’s conclusion that such macro-economic
47 Lakshaanan, TR, The Wider Economic Benefits of Transport – an Overview, Joint transport ResearchCentre, Discussion Paper
2007-8 (2007). This section is largely a précis of this article. 48
As a group of results, they suggest that the middle-income countries show the greatest elasticity of output with respect to transport
investment (specifically paved roads) with up to twice the response obtained in both very poor and in high-income countries.

90
models have many drawbacks in terms of estimating the broader economic benefits of transport seems
reasonable
Nevertheless, there seems little doubt that there are significant impacts from major transport investment that
are not captured by the conventional cost benefit analysis and, over the past fifteen years, there has been an
increasing focus on the impacts of major transport projects which are outside conventional financial and cost
benefit analysis..
Regional Macro Economic Models
The problems of identifying causality, and allowing more rigorous econometric testing, in the previous
models led to the development of macro-economic models based on a set of structured relationships. In
these models indirect economic impacts start from the supply side with improvements in transport cost and
time; new or improved infrastructure may then have both positive and negative economic effects for any
affected region. Increased accessibility may boost that region’s exports in some sectors, whereas in other
sectors it may lead to increased competition on its home market and a contraction of local output, income
and employment. Economies of scale can inflate these effects and they can be further modified and
complicated by inter-industry and consumption demand feedbacks. Finally, the direct effect of (generalized)
transport cost savings will normally increase the demand for all non-transport products.
These models typically represent transport infrastructure by using a measure of the economic accessibility of
the region, usually done by inversely weighting the economic activity in other regions by a measure of the
relevant inter-region transport cost. This is associated with the concept of economic potential, a close
relative of economic mass and which is also related to the gravity models commonly used in transport
planning.
Regional and national economic models need to be multi-sectoral in order to capture the differing impacts of
infrastructure on physical transport and sector prices – and this generally requires a detailed transportation
module. But even then, as such regional models do not have any spatial detail they will still have great
difficulty capturing the impacts of specific projects.
LUTI Models
Spatially detailed models provide the only way to adequately model the economic impact of new transport
infrastructure. The models with the strongest physical representation are the land-use/transportation
interaction (LUTI) models. These consist of linked transportation models and ‘land-use’ or better location
models and are primarily developed to predict future growth and to analyze policy scenarios for large urban
conglomerations. LUTI models have a decades long history of gradual development and are nowadays
typically very disaggregated with numerous spatial zones, sectors, household types, transport motives,
modes of transportation, etc. (DSC/ME&P, 1998).
The key difference between a standard four-step transport model and a LUTI model is that, for any given
point in time, a standard transport model typically assumes that the distribution of economic activity and
land use is exactly the same whether the proposed transport project is included or not, and the users will
adjust the number of trips made, the geographic distribution of trips, mode choice, departure-time choice and

91
route choice depending on conditions of transport supply49
. This assumption of fixed land use may be
appropriate for short term planning or for regions that expect no significant change in urban land use but
does not fit emerging economies under rapid urbanization. A LUTI model instead handles transport-induced
land-use changes through identifying which land uses will respond to the proposed transport project by
extending the model to include explicitly land use markets as well as transport. However, such a combined
model of transport and land use activities is considerably more difficult and costly to build, and therefore is
only done for the largest projects even in the richest developed countries. The state of the art LUTI models
can account to a considerable extent for relocation and new growth of businesses and the population in
response to a major project. However, they typically assume constant returns to scale and constant product
range, and therefore will not capture many of the productivity effects that arise from increasing returns to
scale, product varieties, niche markets and enhanced learning and communication which are part and parcel
of what transport investment aims to promote (Iacono et al., 2008; Wegener, 2011; Jin and Echenique,
2012).
The LUTI transport sub-models are well-developed and can readily reproduce the observed impact of
changes in transportation price and quantity on the transport sector itself. However, this does not normally
hold to the same degree for the impact on the location of firms, although the location of service activities can
be explained much better than the location of industrial activities. As the location of most service activities
primarily follows that of people and industrial activities, LUTI models are generally stronger at estimating
the intra-urban location effects of transport measures than inter-regional location effects.
Whether LUTI models can easily incorporate imperfect markets, and internal and external economies or
diseconomies of scale, is doubtful. The strength of most LUTI models lies in their segmentation and detail,
i.e. they usually contain many different zones, transport modes, households type, firms type, and so on. The
benefit of having such detail lies in the homogeneity of behavior and the assumed stability of relations at
that level of detail. But this detail is achieved at the cost of mathematical and theoretical simplicity, such as
perfect competition, fixed ratios, linear relations and the absence of scale economies.
SCGE
These models are typically comparative static equilibrium models of interregional trade and location based
on microeconomic theories, using utility and production functions with substitution between inputs. They
are part of the New Economic Geography school (Krugman, 1991; Fujita, Krugman and Venables, 1999).
While they have a sound theoretical basis from the academic viewpoint, their primary problems are the
ability to obtain the empirical data required for any detailed analysis and the computational effort required to
obtain a result. Consistent estimation of the necessary consumers’ and producers’ substitution elasticities is
difficult because of the lack of adequate data and regional elasticity estimates. These models are generally
calibrated to historic data and maintain the calibrated relationships into the future; while technological
change can be incorporated into the models, there is no easy way of doing so. In addition, many of these
models are constructed from national accounts data, which excludes in particular consumers’ time. Any
project involving user time benefits, such as an HSR project, will therefore introduce challenges in
reproducing realistic consumer choices, such as increased tourism.
49 In some more advanced transport models, changes in land use are handled by including an allowance for generated (or induced)
traffic, normally expressed as a function of the change in transport costs for a particular origin, destination or origin-destination
movement. Whilst the assumptions have clear limitations, the predictive model has the advantage of being simple and can be made
operational with widely available skills. In China, many design institutes are now capable of building and operating such transport
models.

92
The existing, still young SCGE models have contrasting properties to the LUTI models, namely a lack of
detail or sound empirical foundation, but a sophisticated theoretical foundation and rather complex, non-
linear mathematics. Because of this, SCGE models are able to model (dis)economies of scale, external
economies of spatial clusters of activity, continuous substitution between capital, labor, energy and material
inputs in the case of firms, and between different consumption goods in the case of households. Moreover,
monopolistic competition of the Dixit-Stiglitz type allows for heterogeneous products implying variety, and
therefore allows for cross-hauling of close substitutes between regions. Finally, SCGE models lead to a
direct estimation of the non-transport benefits of new infrastructure, which are absent in most LUTI models.
Whether a further piecemeal improvement of the theoretically handicapped, but in practice successful, LUTI
models is preferable to the implementation of a theoretically superior, but as yet untested alternative, is
essentially a matter of taste and belief. DSC/ME&P (1998) confess to the piecemeal improvement strategy.
The further segmentation they call for may be necessary for the ‘best’ estimation of the impacts of transport
policies, but it is not sufficient for the ‘best’ estimation of the indirect transport benefits needed for CBA.
The latter requires modelling, not only of discrete choice, but also of continuous responses of consumers and
producers based on, respectively, utility maximizing and profit maximizing assumptions. In summary, the
SCGE models contain additional causal mechanisms which are absent in LUTI models. On the other hand,
for countries where model building is still in its infancy, LUTI models may be a useful stepping stone
towards full scale SCGE modeling in the medium to long term.
Two problems, however, remain. LUTI models are inherently more dynamic than the comparative static
SCGE models. The latter, for the moment, are only able to compare the outcomes of different equilibrium
states, such as:
benefits of generalized transport cost reductions due to changing prices, production, consumption
and trade, while holding the number of firms and the number of workers per region constant;
showing what could be labelled as the short-run effects;
benefits of transport cost reductions when the number of firms per region is allowed to change
showing medium term effects;
benefits when the number of workers is allowed to change too; showing the long-run effects of new
transport infrastructure.
A truly dynamic SCGE approach is theoretically possible but raises a whole new series of issues (Knaap,
2000). To some, it is not the comparative static but the equilibrium character of SCGE models that poses the
fundamental problem. But this seems to be a less serious one as SCGE models may well incorporate
disequilibrium features, e.g. (regional) unemployment caused by (nationally) set inflexible wages (Van den
Berg, 1999). In fact, solving the highly non-linear SCGE models becomes much simpler numerically when
all kinds of prices, quantities and ratios are fixed, as is frequently done in the LUTI models.
Elhorst and Oosterhaven (2008) estimate indirect benefits on top of direct benefits from a Maglev system
proposed for the Netherlands. While there is no uniform multiplier, the values for the cases they examined
the indirect benefits and costs: Additional consumer benefits, Indirectly reduced congestion, Spatial labor
market relocation effects, Spatial labor market size and matching effects, and International labor market
effects. These indirect benefits range from 0 to 38 percent of the direct benefits. Interviews with decision-
makers at firms in Utrecht, Netherlands, finds some firms located to be near the perceived accessibility of
urban transit and intercity rail networks, while others were indifferent. However “High-speed trains did not
have a significant impact on the location choice of any of the firms” because the advantages over

93
conventional trains were small and connections required transfers anyway (Willigers, 2003). This is for the
Netherlands, where high-speed domestic services will provide very little door-to-door benefit compared to
existing services
An emerging technique to compute transport project impacts is to combine the strengths of transport, land
use and SCGE models, which constitute different forms of spatial equilibrium models (Bröcker, 1998; Anas
and Liu, 2007; Jin, Echenique and Hargreaves, 2011; Zhu, Jin and Echenique, 2012). Because the spatial
equilibrium models compute the economy-wide impacts of a project, they automatically include almost all
of the direct and wider impacts50
. However, such models are currently skill-intensive to develop and require
considerably more data than what is typically available to appraisal studies of even the largest of projects.
Among the countries we have reviewed, only Japan has made use of such models in a practical ex-ante rail
project assessment by a government agency (JRTT, 2011).
At the frontier of research spatial endogenous growth models, such as those reviewed by Baldwin and
Martin (2004), are being developed and tested. Such models are based on the Romer-type formulation
which explicitly represents the effects of innovation explicitly, and consider them the fundamental driving
force of long term growth (Romer, 1990; Barro and Sala-i-Martin, 1995). Such models operate under the
general equilibrium framework and can better deal with the issues of endogeneity and cumulative causation
in spatial dynamics. However, empirical applications of such models have not yet been fully developed, and
the high modeling skills required mean that they are unlikely to be available for practical use in the near
future.
50
A criticism on the early spatial equilibrium models was that they exclude benefits associated with private car use or savings of
leisure time. This is no longer the case (see e.g. Anas and Liu, 2007; Jin et al., 2011).

94
APPENDIX 3. A REVIEW OF OFFICIAL EX ANTE ASSESSMENT
METHODOLOGIES
Project appraisal is one of the imperatives when planning new transport infrastructure, which is capital
intensive and of far-reaching influence. By assessing the affordability and financial sustainability of
competing proposals, it provides input to efficient policy development and resource allocation across
government.
Multi-criteria analysis (MCA) has been widely adopted by multiple countries for project appraisal, with Cost
Benefit Analysis (CBA) being one of the key components. CBA evaluates a diversity of benefits against the
monetary costs of the proposal: reduced transport costs, shortened travel time, increased traffic safety, etc.
Gwee et al. 51
compared CBA approaches to urban rail project evaluation in Australia, the US, the UK,
Canada, New Zealand, Germany, Holland, France, Japan, Hong Kong, the Republic of Korea and Singapore.
They identified that travel time savings and congestion relief are primary benefits across all the practices
from countries under comparison, accounting for about 50–60% and 40–50% of the total project benefits
respectively.
Environmental externalities and accident cost savings are widely considered as secondary benefits in most of
the countries. However, very few countries include “wider impacts” in the CBA framework: only the US
considers Option Value (OV); Germany and the Netherlands estimate agglomeration benefits. To illustrate
the differences among the diverse global practices, Gwee et al. conducted a case study and found that OV
benefits is negligible (less than 1%) in the total project benefits evaluation. Yet they acknowledged that it is
premature to infer insignificant OV benefits. The case study also revealed potential significance of
agglomeration benefits and suggested further research be warranted.
A similar comparison was conducted for this study of appraisal procedures for general transport
infrastructure, with an emphasis on regional economic impacts analysis. Particularly methodologies and
procedures from the UK, Germany, and Japan are summarized and presented in the following chapters, since
all the three countries have developed fairly comprehensive framework and have applied them to several
real-world cases tentatively.
Regional Economic Impacts Analysis in the UK
General Background
In 1998 the UK government published the white paper A New Deal for Transport: Better for Everyone,
which framed the move away from “predict and provide” solutions to transport problems and put an
integrated transport policy at the core. The white paper introduced the New Approach To Appraisal (NATA),
to appraise and inform the prioritization of transport investment proposals. NATA enumerates five objectives
for transport as Environmental, Safety, Economy, Accessibility, and Integration. Particularly, the Economy
objective is concerned with improving (a) the economic efficiency of transport, and (b) the efficiency of
economic activities. Particularly regarding the second element of this objective, it has often been argued
that, the benefits to transport users captured in a conventional CBA are a satisfactory measure of the wider
benefits to the economy. However, others have suggested that the conventional approach fails to capture the
51
Gwee, Currie and Stanley, 2008

95
additional benefits to economic development, due to the completeness of the transport appraisal itself, the
existence of imperfections in the economy, and the spatial incidence of impacts. In 1999 the Standing
Advisory Committee on Truck Road Assessment (SACTRA) report identified areas where conventional
evaluation approach may miss accounting for the benefits of transport investments. In 2006 the Eddington
Transport Study estimated these impacts and suggested they could be significant; in 2011 Transport Analysis
Guidance (TAG) on wider economic impacts formally was established.
Wider Economic Impacts Considered in TAG
The TAG considers that reduced transport costs and the improved accessibility could encourage economic
performance in a diversity of aspects, which extends beyond the traded transactions measured in GDP. For
example, businesses can pass on the benefit of lower production costs to consumers in the form of lower
prices, or they can implement further efficiency improvements by reorganizing production and distribution.
The economy can also benefit if lower transport costs help stimulate easier transfer between jobs, or greater
competition among firms.
Specifically, the TAG evaluates the following Wider Economic Impacts (WEIs) in the appraisal framework:
WI1 – Agglomeration
WI3 – Output change in imperfectly competitive markets
GP1 – Labor supply impacts
GP3 – Move to more or less productive jobs
WI4 – Wider impact from labor market changes
Those indicators are explained in detail as follows.
Agglomeration (WI1): The term agglomeration refers to the concentration of economic activities over an
area. When the accessibility between these firms is improved, this would lead to a greater clustering of
firms, i.e. more related businesses would be closer together. This phenomenon of clustering of similar firms
could support enhanced knowledge sharing, a greater specialization of staff resources, and enhanced
competition between suppliers. Agglomeration also has an impact on UK welfare through its impact on
productivity and UK Gross Domestic Product (GDP). Higher UK GDP would provide a means to allow for
higher UK consumption, thereby impacting on ‘welfare’ or ‘wellbeing’;
Output change in imperfectly competitive markets (WI3): The conventional transport appraisal approach
calculates the benefits arising froma reduction in transport costs to a firm. In most cases, markets are not
“perfectly competitive” and the cost of production does not exactly match the value to the consumer of the
product or service produced so the value of cost reductions is likely to be greater than the simple reduction
in transport cost. This category of benefits is referred to by DfT as “imperfect competition” and measures
this additional value, over and above the cost savings to business.
Labor supply impacts (GP1): Transport costs are likely to affect the overall costs and benefits to an
individual from working. In deciding whether to work, an individual will weigh travel costs against the wage
rate of the job travelled to. The labor supply impact is essentially computed by looking at how the estimated
change in transport costs affects the incentives for an individual to work, therefore affecting the overall level
of labor supplied, the additional value added to the economy and the resulting tax revenue to the
government.

96
Move to more or less productive jobs (GP3): Transport can affect the incentives for firms and workers to
locate and work in different locations. Employment growth or decline in different areas is likely to have
implications for productivity, as workers are often more or less productive in different locations. This may
have implications for UK productivity which, in turn, will impact on UK welfare. The extent to which
workers are employed in their most productive uses in high productivity jobs affects the level of UK GDP.
Wider impact from labor market changes (WI4): The wider impacts from labor market changes additional
to the conventional appraisal (Transport Economic Efficiency, or TEE) are estimated as the tax wedge from
the labor supply change (GP1) and the tax wedge of the move to more/less productive jobs impact (GP3).
The tax wedges reflect income tax, national insurance contributions and corporation tax.
TABLE 18 below shows how the WEIs relate to those benefits currently appraised under the existing NATA
framework. The impact of transport on agglomeration and output change in imperfectly competitive markets
is not captured via conventionally calculated direct user benefits such as journey time savings. The labor
market impacts (“labor supply” and “move to more or less productive jobs”) are partially, but not wholly,
captured through user benefits.
Table 18. Conventional Appraisal versus WEIs Appraisal
Appraisal Type Appraisal Impact
Conventional Appraisal
Business user benefits (money costs, journey time, etc.)
Other user benefits (commuting, leisure)
Other user benefits (commuting, leisure)
Other impacts (safety, emissions, etc.)
Wider Impacts Appraisal
Agglomeration (WI1)
Output change in imperfectly competitive markets (WI3)
Labor supply impacts (GP1)
Move to more or less productive jobs (GP3)
When to Consider WEIs Appraisal?
The agglomeration impact of a transport investment should be considered for areas in sufficient proximity to
an economic center or large employment center. Impact on productivity and welfare is likely to be negligible
for a rural location. The UK DfT has identified a list of “Functional Urban Regions” (FURs) where an
agglomeration WEIs appraisal should be undertaken if a project falls within the area.
The analysis of agglomeration assumes that employment and residence are not relocated within the area
that is modeled. Therefore GP3 (move to more or less productive jobs) is not a core requirement of the
WEIs assessment. In the central case, GP3 should be assumed to be zero. GP3 should only be estimated
in the sensitivity tests using a Land Use Transport Interaction (LUTI) model.
Temporal and Spatial Scope of WEIs Appraisal
The UK’s practice does NOT set a fixed period of time for appraising the WEIs. Instead the level of demand
is particularly important as it principally defines whether the scheme is justified, whereas the rate of growth
affects when it is justified. For example, in the UK’s HS2 assessment, a capped demand on the rail network
is determined at a reasonable level (an average increase of 0.5 single rail trips over 100 miles per person per
year). The cap year and demand level are important factors in decision-making. If demand for a particular

97
infrastructure does stop growing earlier than expected, then its WEIs are weaker and there is a risk that it
would not realize the benefits and revenues needed to justify the costs.
The WEIs estimates reported should be total net figures for the UK (overall impact on national productivity).
There is not sufficient information to identify how WEIs pass through the economy such as from consumers
to producers, or across areas. Therefore they should not be presented geographically or as gains to any
particular group of the population or region.
Estimating Wider Economic Impacts
Overall Procedure
The workflow for estimating WEIs is outlined in Figure 16. The first stage in the WEIs appraisal requires
the analyst to identify which WEIs should be considered. It is recommended, but not mandatory, that GP1
and WI3 are assessed for all projects. The FURs map and table should be used to inform the need for an
assessment of WI1 (agglomeration impacts). Availability or otherwise of a LUTI model will help inform the
decision of whether or not to assess GP3.
Figure 16. Workflow for Estimating Wider Economic Impacts

98
The second stage of the analysis requires the preparation of the appropriate data inputs. This requires
transport model outputs to be obtained for the relevant modes and journey purposes. The transport model
data obtained may need to be aggregated to the level of the economic data necessary for the WEIs
estimation.
Because WEIs analysis ideally needs to consider all flows by all modes and by all key journey purposes, not
just the impacts on the elements of travel (time, cost, etc.) that are changed as a result of the intervention, the
transport data requirements (e.g. demand and generalized costs by mode and journey purpose) for WEIs
analysis (in particular agglomeration analysis) are somewhat greater than the requirements for conventional
transport user impacts (TEE) analysis. These data demands are needed in order to assess the contribution of
the project to overall existing levels of accessibility and agglomeration across the area considered. Once the
appropriate data has been collated, the WEIs that are to be assessed can be estimated.
The agglomeration (WI1) estimation is undertaken as follows:
The change in the level of agglomeration resulting from the transport infrastructure is estimated on
the basis of the impact that the estimated change in user travel time and costs has on the accessibility
of firms and workers to each other.
For the estimated change in the level of agglomeration, the productivity impact is estimated by
applying a value to reflect the likely change in productivity for each fractional change in
agglomeration. The output is a monetary estimate of the scheme’s agglomeration impact.
The output change in imperfectly competitive markets impact (WI3) represents the difference between
the (higher) willingness of consumers to pay for increased output and the (lower) cost of the extra
production, in imperfectly competitive markets. The impact is estimated in a simplified form – essentially
up-lifting the estimate of conventional travel time and travel cost benefits to business users (and to freight
where relevant) to account for this missing element.
The labor supply impact (GP1) is estimated in several parts:
The change in modeled commuting costs resulting from the new infrastructure affects the benefit
that individuals obtain from working (i.e. their wage considering other costs such as transport). This
provides an estimate of the change in the net benefit from working.
The change in the level of labor supplied is based on how the change in the net benefit from
working affects overall labor supply. This is calculated by applying an evidence-based elasticity
value to the net wage change.
The additional productivity that results from the additional labor supplied is determined by
multiplying the change in number of people working by the average economic contribution (GDP)
of a new worker.
Since the agglomeration takes a significant proportion of the total WEI estimates, the following section only
focuses on the details of estimating WI1.
Estimating Agglomeration Impacts
The core of estimating agglomeration impacts lies in the concept of effective density (Equation A4.4).
Effective density provides a measure of the mass of economic activity across the modeled area. This

99
measure reflects the accessibility of firms and workers to each other, with the importance of one firm/worker
to another declining over distance.
Once effective density is estimated in the base and alternative case scenarios, the likely productivity
response for the change in the level of agglomeration between the base and alternative case is estimated by
applying an elasticity of productivity (with respect to effective density). Taking the relative changes in
productivity by sector as a result of changes in agglomeration, the absolute changes in productivity are
estimated according to the GDP and employment for the sectors in the areas being assessed. This gives an
estimate of total output for each sector and each area. The resulting agglomeration impact is then summed
across all origin areas and sectors to give the total agglomeration impact across the modeled area for each
modeled year. This procedure is outlines in Figure 17 and relevant equations are listed as follows. Variables
and notations for Equations A4.1 to A4.4 are listed in Table 19.
Figure 17. Workflow for Agglomeration Impacts
, ,, , , , ,
, ,1 1
k
A k fk f B k f B k fif i iB k f
i
dWI GDPW E
d
(A4.1)
,
,
1 1f k f
i
i k
WI WI (A4.2)
, , , , ,
, ,
, ,
, , , ,
,
S m f S m p f
i j i j
pS m f
i j S m p f
i j
p
g T
gT
(A4.3)
,
, ,
, ,,,
k
S f
jS k f
iS m fj mi j
Ed
g
(A4.4)

100
Table 19. Variables and notations for EQUATIONs A4.1 to A4.4
Variable Name Data Description Source Details
, ,B k f
iGDPW
GDP per worker in Local
Authority District i sector k
in the base case (B) varying
by forecast year f
Economic Data
Set
i is origin area
B is base case
k is industrial sector
f is forecast year
GDP per worker is in £ 2010 prices
, ,B k f
iE
Total employment in the base
case in sector k, area i
varying by forecast year f
Economic Data
Set
B is base case
k is industrial sector
f is forecast year
,S f
jE
Total employment for all k
sectors for scenario S area j
varying by forecast year f
Economic Data
Set
LUTI and/or
local forecasts
for the
sensitivity
WEIs estimate f
j is destination area
S is scenario: alternative (A) or base
(B) case
f is forecast year
k Elasticity of productivity with
respect to effective density
Economic Data
Set
ρ is the agglomeration elasticity
k is industrial sector
k Distance decay parameter Economic Data
Set
α is the distance decay parameter
k is industrial sector
, ,
,
S m f
i jg
Average generalized cost of
travel from area i to area j in
the scenario S for mode m
aggregated by purpose and
varying by forecast year f
Transport
Model Outputs
i is origin area
j is destination area
S is scenario: alternative (A) or base
(B) case
m is mode: private and public
transport
f is forecast year
Average generalized cost is in £
2010 prices
, , ,
,
S m p f
i jg
Average generalized cost of
travel from zone i to zone j in
the scenario S for mode m
and purpose p and varying by
forecast year. It needs to be
aggregated to the LAD level
Transport
Model Outputs
i is origin area
j is destination area
S is scenario: alternative (A) or base
(B) case
m is mode: private and public
transport
p is purpose of travel including
business, commuting and freight in
the sensitivity case.
f is forecast year
Average generalized cost is in £
2010 prices
, , ,
,
S m p f
i jT
Number of trips from zone i
to zone j for mode m and
purpose p and varying by
forecast year. It needs to be
aggregated to the LAD level.
Transport
Model Outputs
i is origin area
j is destination area
S is scenario: alternative (A) or base
(B) case
m is mode: private and public
transport
p is purpose of travel including
business, commuting and freight in
the sensitivity case.
f is forecast year

101
Data Issues
Generalized Cost Data from the Transport Model
The WEI assessment analyzes the change in accessibility
for different transport users, and the benefits that derive
as a result of this change in accessibility extend beyond
direct user benefits. To allow for this, the measure of the
generalized cost change (resulting from the new
infrastructure) needs to be as full a measure as possible.
This means it needs to capture time, travel cost,
reliability and crowding benefits, where relevant.
Additionally generalized cost data should be extracted
from the transport model for the full set of OD pairs. As
noted above, it is necessary to include those users and
modes that are not affected by the intervention as well as
those that are.
Value of Time (VoT)
Agglomeration impacts are driven by changes in business and commuter user impacts which are valued
according to working time values. These WEIs should therefore be grown from modeled year to modeled
year in line with a weighted average work plus commuter VoT. Relationship between long-term annual
productivity growth and the growth of the value of non-work time should be determined or advised.
Geographical resolution of data
The economic and transport data are often sourced at different levels of geographic resolution. The
economic data set is put together at Local Authority District (LAD) level. The modeled transport demand
and generalized cost data is likely to be at the level of geography selected for the transport zones of the
transport model. This will vary in different cases, and will often be at a lower, more detailed level of
geography, than the economic data. In these cases the transport data will need to be aggregated to LAD level
to put the transport and economic data on the same level of geographic detail for analysis.
Sensitivity Tests
The estimation procedure mentioned in previous sections involves forecasts on a series of factors (e.g. future
travel demand and economic growth), causing risks and uncertainties. Therefore sensitivity tests should be
conducted to demonstrate the implications when those factors vary: employment and population forecasts,
changes in employment and for residential location, distance decay parameter k for inter-city transport
infrastructure, and freight user costs and trip numbers (see example in Box A4.1).
Structure of a Wider Impacts Assessment Report
When the WEIs analysis has been undertaken, the outputs should be presented in a Wider Impacts report.
This report is separate from the TEE appraisal report (the conventional approach). The following
should be included in the Wider Impacts report:
Box A4.1. Sensitivity Tests in the UK’s HS2 Appraisal The relevant BCRs for the central case are 1.4 for London to West Midlands and 1.6 for the Y network excluding WEIs (capped demand in 2037).
If we capped demand in 2026, the
BCR would fall to 0.8 excluding
WEIs.
If the demand cap were five years
later (in 2042) the BCR would
increase to 1.8.
A 50% higher road fuel duty would
push the BCR up by as much as
0.5.

102
Information that was used in deciding which Wider Impacts to appraise;
Outputs from the central WEIs estimates;
The outputs from the sensitivity tests; and
Information on methodology, including any non-standard approaches.
As discussed in the previous chapters, the central estimates should:
Include only TEMPRO (official DfT forecasting tool) employment and population forecasts;
Include no modeled changes in employment or residential location;
Should not factor in WI impacts that result from changes in freight user costs and trip numbers,
resulting from the intervention of the new infrastructure.
For each modeled year, the pound value for agglomeration (no employment relocation), output in
imperfectly competitive markets, and labor supply impact (no resident relocation) should be estimated
according to the procedures and equations documented above, and then aggregately reflected using the Net
Present Value (NPV).
The Government’s standard discount rates are applied in the following manner: 3.5% for 30 years from the
year the appraisal is carried out (e.g. the current year) and 3.0% for the remainder of the appraisal period
(the discount rate drops again at 75 years from the current year, but this is unlikely to be relevant in most
appraisals). It should be remembered that values should be discounted back to the base year. This will often
be before the current year implying more than 30 years discounting at 3.5%.
REGIONAL ECONOMIC IMPACTS ANALYSIS IN GERMANY
Transport investment appraisal in Germany (Federal Transport Infrastructure Plan 2003 or FTIP 2003)
comprises three components: Benefit-Cost Analysis (quantitative analysis yielding a benefit-cost ratio),
Environmental Risk Assessment (a qualitative classification), and Spatial Impact Analysis (a qualitative 1 to
5 scoring system). Regional economic impacts from new transport investments are reflected in both the
Benefit-Cost Analysis (BCA) component (Spatial Advantages) and the Spatial Impact Analysis (SIA)
component. The difference lies in that in the benefit-cost analysis, the Spatial Advantages only focus on the
regions where the new infrastructure will be built; while in SIA the impacts are evaluated in a broader
context, the entire Federal Republic of Germany.
Spatial Advantages
The spatial impact components remaining in the BCA are the employment effects resulting from the
construction (NR1) and operation (NR2) of the transport infrastructure and the contributions to the
promotion of international relations (NR3).
Employment Effects (NR1 and NR2)
The NR1 benefit contributions do not accrue throughout the entire duration of the projects, but only during
the period of investment activity (the construction phase). Accordingly, a multiplication using the project’s
average annuity factor is required to determine the annual benefit: 81 10 a AP nNR K A r p W a (A4.5)

103
Where:
K Investment costs of the project at 1998 prices (€)
A Man-years per 100 million € investment costs
r Proportion of regionally imputable employed persons: 0.4 here
ap Regional differentiation factor
APW Alternative cost unit rate per job per year: €13,000 here
na The project’s average annuity factor
The starting point for quantifying the employment effects from infrastructure construction projects is to
estimate the labor force required ( K A ) to execute the project or the proportion of earned income in the
investment costs.
The employment effects obtained refer to the whole national economy. Therefore, it has to be reviewed to
what extent they are assignable to the regional level. The regional affinities of individual branches of the
economy cannot be precisely identified based on current knowledge. To avoid distortions in the results, and
in a similar fashion to previous federal transport infrastructure plans, 40% of the employment effects (r) that
occur in all the branches of the economy involved are assumed to be regionally imputable.
The procedure for the FTIP 2003 takes empirically validated findings to determine the proportion in the
overall employment effect in the given project regions accounted for by persons who would otherwise be
unemployed. A response function, derived from time series analyses and with a high degree of statistical
reliability, quantifies the change in the unemployment rate as the demand for labor increases as a function of
the initial level of existing unemployment. The value can be interpreted as a probability that a person
employed as a result of the investment would have remained unemployed if the project had not been
realized.
The regional differentiation factors ap that flow into the evaluation system can be directly derived from the
response function determined, taking into account the regional unemployment rates. As the macroeconomic
calculations for the FTIP 2003 are generally carried out on the premise of a cyclical equilibrium, only the
structural unemployment is taken into account here.
( ) ( )
( )
( )
2r pl r vg
b r AP
r r vg
A ANR p W
A
(A4.6)
Where:
r The region's index
( )b rp Regional differentiation factor
vg “Without” scenario
pl “With” scenario
A Link indicator
APW Alternative cost unit rate per job per year: €13,000 here

104
The approach is based on the hypothesis that the structural problems in regional labor markets are largely
influenced by the factors available in the region. Alongside the classic production factors of labor and
capital, this also includes the provision of technical, social and cultural infrastructure in the region. A major
influence is likely to be the accessibility of transport infrastructure. Providing an economic area with good
links will enhance access to sales and procurement markets, promote the interregional division of labor, and
improve the locational attractiveness of the region in competition with other regions.
The connection between structural unemployment and the quality of links is quantified using a multiple
regression approach and presented by ( )b rp. Here, further regional locational factors or variables in addition
to the link indicator are taken into account to capture the regional locational quality.
The link indicator A is in the unit of speed. The qualities of regional links are derived from the transport
times and equivalent straight line speeds to all other regions, by mode and direction for each region, and
then aggregated (weighted averaged) by mode shares of the total originating and terminating traffic volumes.
From a macroeconomic perspective, only the net employment effects for the German national economy are
relevant here. Consequently, jobs that are shifted between regions within the Federal Republic of Germany
are not taken into account. If the extent of the retention or creation of jobs is determined, the employment
effects are evaluated taking into account the situation in the regional labor market.
Contributions to Promoting International Relationships (NR3)
Improving the basic conditions for cross-border traffic by upgrading the infrastructure in the area of the
Federal Republic can help to promote the international division of labor. For this reason, projects aimed at
improving transport infrastructure that have significance for cross-border traffic are given a special bonus of
a maximum of 10% of the savings achieved in time and operating costs.
3 ( ) iNR c NB NE p (A4.7)
Where:
NB Reduction of transportation costs
NE Improved accessibility of destinations
c Maximum benefit proportion (10%)
ip Project-specific proportion of traffic volume from international traffic in the overall
traffic volume
Spatial Impact Assessment (SIA)
The key regional planning requirements to be met by the Federal Regional Planning Act involve the
“distribution and development objectives” and “relief and modal shift objectives”. Therefore transport
infrastructure investment in less favored regions or highly congested regions should be awarded a bonus in
the appraisal process.
Under this principle, the Spatial Impact Assessment (SIA) process gives scores to a proposed project (from 1
to 5). To meet the distribution and development objectives, it first addresses the accessibility deficiency by
evaluating the impact of the new project on the links from a selected set of corridors that are relevant in

105
terms of regional planning. If the new project brings a significant improvement to a link’s travel speed
(>6km/h), and meanwhile the link’s original travel speed is under a certain percentile among all the links to
be influenced by the new project, the project will be categorized accordingly, as shown in Table 20.
Table 20. Categories of Accessibility Deficiency
Accessibility deficiency Percentile Criterion
None Standard Best 50%
Equivalent straight line
speed faster than the
median
Not very significant Sub-standard 1 50% - 25% Between the median and
25% percentile
Significant Sub-standard 2 25% - 10% Between 25% and 10%
percentile
Very significant Sub-standard 3 Worst 10% Slower than 10%
percentile
To address the structural backwardness, the project is then scored based on the region it is located, as
indicated in Table 21.
Table 21. Structural Backwardness and Associated Area Types
Structural backwardness Type of area allocated
Very significant Rural areas with very significant structural development problems
Significant Rural areas with significant structural development problems
Agglomerations with structural development problems
Not very significant Rural areas without very significant development problems
None Central areas of urban regions with no structural development problems
Areas with mixed urban and rural structures
As a project may generate impacts on multiple links, the only link used in the evaluation is the one which
makes the greatest contribution to the objectives (the highest number of regional planning points). This is the
"most favorable" link. The project can get between 1 and 5 regional planning points, where the regional
planning significance grows as the number of points increases. The greater the accessibility deficiencies and
the structural backwardness, the higher the number of points awarded.
To meet the interregional relief and modal shift objectives, an examination should be carried out, on a case-
by-case basis, to ascertain what new construction and upgrading projects in the rail and waterway sectors
can make a major contribution, possibly as an alternative to road construction, to relieving transport
corridors and agglomerations with high traffic density. Such projects will be given regional planning
preference according to their forecast relief impact, going beyond their contributions to the objective of
providing transport to and links between central places. The evaluation table is presented in Table 22.
Table 22. Evaluation of Relief Impacts on Long-Distance Traffic
RI points Corridor relief after traffic volume
Extreme Very high high
5 150 m. vehicle-U km per year and over
4 50 m. vehicle-U km per year and over
3 30 m. vehicle-U km per year and over
2 20 m. vehicle-U km per year and over
1 30 m. vehicle-U km per year and over

106
Both the scores for accessibility deficiency/ the structural backwardness and the relief impacts will be
reported in the SIA form as an individual document in the appraisal process. The project of outstanding
significance from a regional planning perspective (scored 5) will receive funds from a dedicated funding
“pool” of almost 1.5 billion €, even though it might not be qualified for funding support using a CBA-based
approach.
REGIONAL ECONOMIC IMPACT ANALYSIS IN JAPAN
The following procedure was summarized based on two case studies on Tohoku Shinkansen and Hokuriku
Shinkansen, performed by the Japan Railway Construction, Transport, and Technology Agency (JRTT). The
estimation is reflected by the GDP difference between “with” and “without” scenarios for ten consecutive
years. Since both Shinkansen lines are mainly for passenger travel, the basic assumption in both cases is that
the new infrastructure only generates economic impacts on the tertiary industry.
The core concept in the Japanese procedure is the “regional attractiveness”, which is similar with the
effective density in the UK’s approach, as shown in Equation A4.8. The difference lies in that in the UK’s
approach the numerator is employment; while in the Japan’s approach it is the total expenditure of a
prefecture:
46j
i
j ij
DEP
GV (A4.8)
Where:
iP The regional attractiveness of prefecture i;
jDE Total expenditure of prefecture j;
ijGV Average generalized cost of travel from prefecture i to prefecture j
The average generalized cost of travel is calculated as:
, , ,ij ij r ij c ij aGV C C C (A4.9)
Where:
rijC , Average generalized cost of travel from prefecture i to prefecture j by rail;
cijC , Average generalized cost of travel from prefecture i to prefecture j by car;
aijC , Average generalized cost of travel from prefecture i to prefecture j by air;
Mode share for rail, car, and air
The average generalized cost of travel from prefecture i to prefecture j for each mode is determined by:
, , ,ij k ij k ij kC F T (A4.10)
Where:
kijF , Fixed costs from prefecture i to prefecture j;

107
kijT , Average travel time from prefecture i to prefecture j;
Value of time in Yen per minute
The mechanism of regional economic impacts (“economic ripple effects” in the Japanese literature) from
new scheme on regional economy is summarized in Figure 18:
Figure 18. Mechanism for the Economic Ripple Effects of Transport Investment
The economic ripple effects, as aforementioned, are captured by the GDP difference between two scenarios.
Since the GDP can be evaluated by either the Production Approach or the Expenditure Approach, and the
increased regional attractiveness influence both the production and the expenditure of a prefecture (as
illustrated in Figure 18), the GDP for each scenario is estimated as the average over both approaches as the
indicator for the economic ripple effects.
/ 2GDP VT DE (A4.11)
Where:
VT Total production of the prefecture;
DE Total expenditure of the prefecture
The GDP difference is imputable to all the 47 prefectures in Japan and calculated for ten consecutive years
after the opening of the new line.
Higher regional attractiveness
Increase regional attractiveness for adjacent
prefectures
Improved level of service
Shorter travel time
Enhanced safety
Opening a new Shinkansen line
Economic development along the new line
Increment in the production of the prefecture
Economic ripple
effects
Econometric
model
Boost investment in new
equipment
New business
New equipment purchase
Tourism
Boost consumption
Boost local consumption
Boost consumption in
neighbor prefectures
Increase population
More residence
More employment
Increase business
efficiency
More business
opportunities
Higher productivity per
worker

108
Two highlights from the Japan’s approach are: first, VT and DE are estimated through solving a system of
simultaneous equations, with enriched information involving seven sub-systems: production, expenditure,
income allocation, capital investment, land value, employment, and population; second the econometric
model comprises both an economic model and a population migration model, the latter of which accounts
for the relocation of population across different prefectures determined by the relative economic
attractiveness as well as relative living costs between prefecture i to prefecture j. All the equations in the
system is calibrated using historical data, and then estimates for each consecutive year is calculated using
the calibrated equations as well as forecasts of economic growth, population growth, and employment
growth.

109
Figure 19. Configuration for the Regional Econometric Model
Economic model
Opening a new Shinkansen line
Travel time and fixed
cost between
prefectures (rail)
Initial investment
in the new line
Travel time and fixed cost
between prefectures (car
and air)
Mode share
Generalized costs
between prefectures
Number of immigrants
Number of emigrants
Population migration
model
Population
Employment
(7) Population
Average land
value
(5) Land value
Private capital
Public capital
Real-estate capital
(4) Capital investment
Resident’s income
Employee’s income
Private company revenue
Income from private
properties
Government revenue
(3) Income allocation
Total employment
Employment from the primary and
secondary industries
Employment from the tertiary
industry
(6) Employment
Total expenditure of prefecture
Total private consumption
Total public consumption
Investment in new equipment
Investment in real estate
Investment in civil works
Increment of private inventory
Increment of public inventory
Exports
Imports
Etc.
(2) Expenditure
Total production of the prefecture
Production from the primary and
secondary industries
Production from the tertiary
industry
Import tax and etc.
(1) Production
Regional
attractiveness
Exogenous
variable
Endogenous
variablesModels
Workflow Feed in the exogenous variable

110
APPENDIX 4 ON-BOARD PASSENGER INTERVIEW
文件编号 Doc. No. 调查员 Surveyor 日期 Date
列车号 Train No. 由 站到 站 From (Station) to (Station) 车厢等级 Car class
您好!感谢您抽出宝贵时间填写这份问卷,这将有助于我们进一步提高服务水平。Thank you for taking time
out to fill the questionnaire. Your answers will be helpful to us for further improving service.
您本次出行的起始站 终点站
Origin station of your current trip terminal station
本次旅行的主要目的(可多选)Purposes of your current trip (you may choose more than one)
1.因公出差 ○开会:○看展览:○培训/讲课:○采购:○销售:○技服:○其他公差)
1.On business (○meeting: ○exhibition: ○training/lecture: ○purchase: ○sales: ○technical service: ○others)
2.个体经商 small own business 3.旅游 Tourism 4.探亲/访友 Visit relatives/friends 5.外出务工 Migrant labor 6.上班
Go to work 7.上学 Go to school 8 其他 Others
本次旅行的起点 (市/县)
Origin of the trip (city/county)
由家(出发地)到达火车站用时 。交通方式是:
Time spent for arrival at station from your residence (start point): , transport mode:
1 步行 On foot 2.自行车 Bicycle 3.出租车 Taxi 4.其他公共交通 Other public transits 5.其他火车 Other trains 6.公车
Company car/van 7.私家车 Private car 8.其他 Others
本次旅行的目的地 (市/县)
Destination of the trip (city/county)
由火车站到达目的地预计用时 ,交通方式是
Predicted time spent for arrival at destination from station: , transport mode:
1 步行 On foot 2.自行车 Bicycle 3.出租车 Taxi 4.其他公共交通 Other public transits 5.其他火车 Other trains 6.公车
Company car/van 7.私家车 Private car 8.其他 Others
您居住的城市/县
City/county of your residence:
您此次旅行(将)在外停留 天
You are going to be away from home for: day(s)
如果没有高速铁路,您还会进行这次旅行么?○是○否
If there was no high-speed railway, would you still make the trip? ○Y ○N
如果选“是”,请具体选择会采用以下哪种交通方式
If selecting “Y”, please specify your preferred transport mode below.
1.动车 EMU 2.其他列车 Other trains 3.飞机 Airplane 4.大巴 Coach/bus 5.公车 Company car/van 6.私家车 Private
car 7.其他 Others
如果选“否”,请选择决定出行原因 If selecting “N”, please specify the reasons for your high speed train trip below.
1.班次多 Frequent services 2.购票方便 Easy to buy tickets 3.快捷 Fast4.票价经济 Reasonable ticket price 5.舒适
Comfort 6.安全 Safety 7.准时 Punctuality 8 其他 Others
对提升高缺服务您有什么建议?Do you have any suggestions for improving the service of high-speed railway?

111
个人基本信息 Personal information
性别 Gender
年龄 A 18 岁及以下 B 19~25 岁 C 26~30 岁 D 31~40 岁 E 41~50 岁 F 51~55 岁 G 56~60 岁 H 61~65 岁 I.
65 岁以上
Age: A. 18 or younger B. 19~25 C. 26~30 D. 31~40 E. 41~50 F. 51~55 G. 56~60 H. 61~65 I. >65
月均收入 A 2000 元及以下 B 2001 元~5000 元 C 5001 元~10000 元 D10001 万~20000 元 E 20001 元及以上
职业 A 公务员 B 军人 C 企业普通员工 D 企业管理人员 E 科教人员 F 务工人员 G 农民 H 个体经商人
员 I 离/退休人员 J 学生 K 待业人员 L 其他
Monthly mean income (RMB): A. 2000 or lower B. 2001~5000 C. 5001~10000 D. 10001~20000 E. 20001 or higher
Occupation: A. Official B. Soldier C. General company staff D. Company manager E. Staff in science and education F.
Migrant worker G. Farmer H. Small own business I. Retired J. Students K. Unemployed L. Others

112
APPENDIX 5 INTERVIEWING BUSINESS MANAGERS
问题大纲 Questions:
1 简要介绍企业经营范围、企业规模(员工人数、营业额等)Please introduce business scope
and scale (number of staff, annual turnover, etc.) of your company.
2 企业是迁至此地还是新建的?Was your company moved from elsewhere or built in the current
site?
3 高速铁路对企业选址/运营的影响 Influence of high-speed railway on site selection/operation
of your company
3a 企业选址此地的原因 Reasons for selecting the site:
劳动力/Labor
土地/Land
当地政府激励机制/Incentive mechanism of local government
距供应商近 Close to supplier
距消费者近 Close to customer
距新技术近 Close to new technology
方便公务出行 Convenient for official/business travel
货物运输 Cargo transport
3b 高速铁路是企业选址决策所考虑的因素之一么?Was high speed railway a consideration in
choosing the site?
如果是,做多大程度上,影响了哪些方面 If yes, how much was high speed railway considered? What
did the considerations influence?
3c 对交通运输的需求 Transport demand
讨论:员工的商务出行,供给,消费者等 Discussion: business trip, suppliers, customers, etc.
3d 企业的员工/供应商/消费者是否使用高铁?Do your staff/suppliers/customers select high speed
railway for travel?
如果是,出行频率和出行目的分别是?If yes, how frequent and why do they travel?
3e 如果高铁停止运行,对贵企业是否有影响?有何影响? Would the suspension of high-
speed railway services affect your business? If so what might be the impacts?
讨论:可代替的出行方式、视频/电话会议、物流服务等 Discussion: alternative travel modes,
video/telephone meetings, logistical services,etc.
3f 开通高铁后,您是否注意到本行业或其他行业的商业运作有任何变化 Is there any change in
business operations in your industry or other industries after the opening of the high speed railway?
4 您对提供高铁服务有什么建议?Do you have any suggestions for improving high speed railway
service?