Regional Disparities and Backwardness - U.Pplanning.up.nic.in/Annual Plan 2010-11 for website/Volume...
21
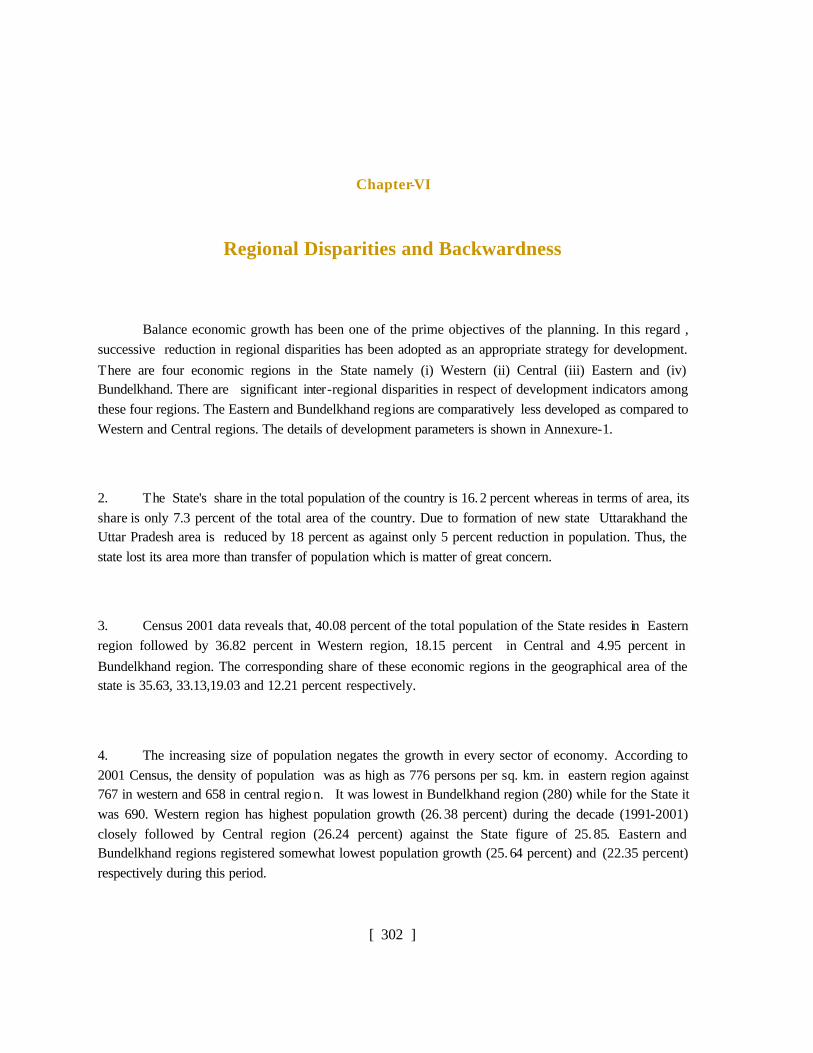
[ 302 ] Chapter-VI Regional Disparities and Backwardness Balance economic growth has been one of the prime objectives of the planning. In this regard , successive reduction in regional disparities has been adopted as an appropriate strategy for development. There are four economic regions in the State namely (i) Western (ii) Central (iii) Eastern and (iv) Bundelkhand. There are significant inter-regional disparities in respect of development indicators among these four regions. The Eastern and Bundelkhand regions are comparatively less developed as compared to Western and Central regions. The details of development parameters is shown in Annexure-1. 2. T he State's share in the total population of the country is 16. 2 percent whereas in terms of area, its share is only 7.3 percent of the total area of the country. Due to formation of new state Uttarakhand the Uttar Pradesh area is reduced by 18 percent as against only 5 percent reduction in population. Thus, the state lost its area more than transfer of population which is matter of great concern. 3. Census 2001 data reveals that, 40.08 percent of the total population of the State resides in Eastern region followed by 36.82 percent in Western region, 18.15 percent in Central and 4.95 percent in Bundelkhand region. The corresponding share of these economic regions in the geographical area of the state is 35.63, 33.13,19.03 and 12.21 percent respectively. 4. The increasing size of population negates the growth in every sector of economy. According to 2001 Census, the density of population was as high as 776 persons per sq. km. in eastern region against 767 in western and 658 in central regio n. It was lowest in Bundelkhand region (280) while for the State it was 690. Western region has highest population growth (26. 38 percent) during the decade (1991-2001) closely followed by Central region (26.24 percent) against the State figure of 25. 85. Eastern and Bundelkhand regions registered somewhat lowest population growth (25. 64 percent) and (22.35 percent) respectively during this period.
Transcript of Regional Disparities and Backwardness - U.Pplanning.up.nic.in/Annual Plan 2010-11 for website/Volume...
[ 302 ]
Chapter-VI
Regional Disparities and Backwardness
Balance economic growth has been one of the prime objectives of the planning. In this regard , successive reduction in regional disparities has been adopted as an appropriate strategy for development. There are four economic regions in the State namely (i) Western (ii) Central (iii) Eastern and (iv) Bundelkhand. There are significant inter-regional disparities in respect of development indicators among these four regions. The Eastern and Bundelkhand regions are comparatively less developed as compared to Western and Central regions. The details of development parameters is shown in Annexure-1.
2. The State's share in the total population of the country is 16.2 percent whereas in terms of area, its share is only 7.3 percent of the total area of the country. Due to formation of new state Uttarakhand the Uttar Pradesh area is reduced by 18 percent as against only 5 percent reduction in population. Thus, the state lost its area more than transfer of population which is matter of great concern.
3. Census 2001 data reveals that, 40.08 percent of the total population of the State resides in Eastern region followed by 36.82 percent in Western region, 18.15 percent in Central and 4.95 percent in Bundelkhand region. The corresponding share of these economic regions in the geographical area of the state is 35.63, 33.13,19.03 and 12.21 percent respectively.
4. The increasing size of population negates the growth in every sector of economy. According to 2001 Census, the density of population was as high as 776 persons per sq. km. in eastern region against 767 in western and 658 in central region. It was lowest in Bundelkhand region (280) while for the State it was 690. Western region has highest population growth (26.38 percent) during the decade (1991-2001) closely followed by Central region (26.24 percent) against the State figure of 25. 85. Eastern and Bundelkhand regions registered somewhat lowest population growth (25. 64 percent) and (22.35 percent) respectively during this period.
[ 303 ]
25.58
27.3
5
26.38
25.7
4
26.37
21.8
7
22.34
23.7
2
25.85
25.6
1 21.53
23.8
6
0.00
5.00
10.00
15.00
20.00
25.00
30.00
Eastern Western Central Bundelkhand U.P. India
Region
Decennial Growth In Population (%), 1991-2001
1991-2001 1981-1991
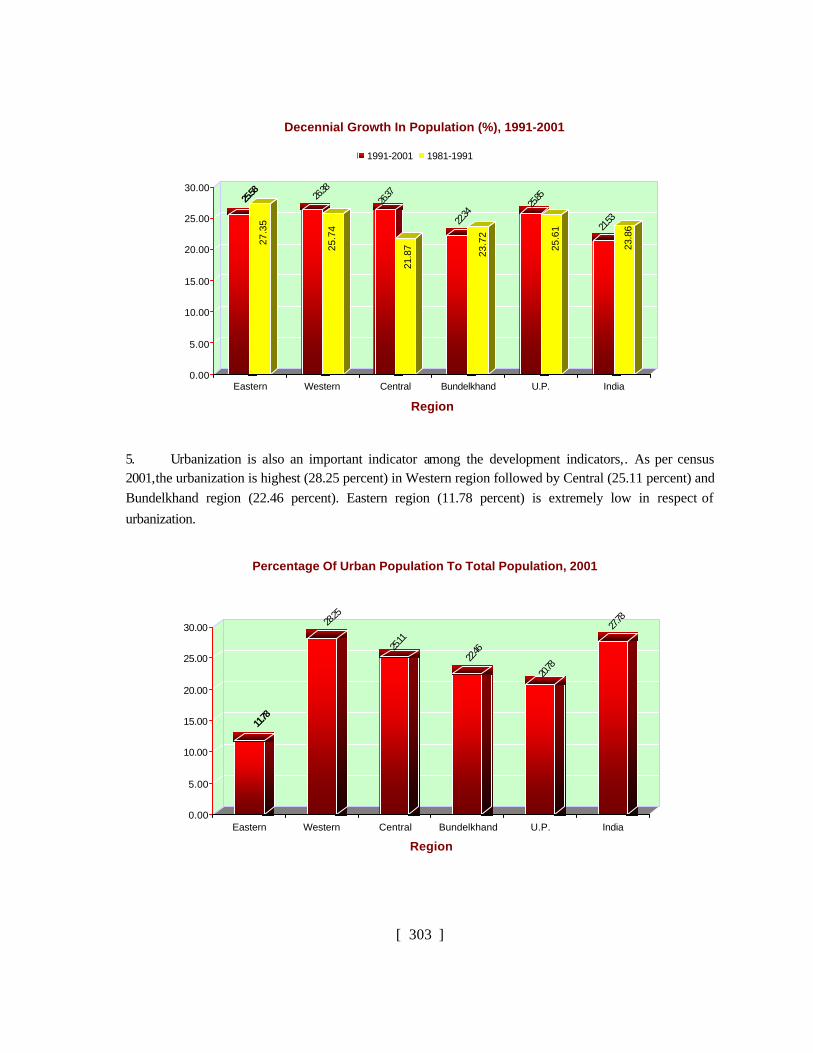
5. Urbanization is also an important indicator among the development indicators,. As per census 2001,the urbanization is highest (28.25 percent) in Western region followed by Central (25.11 percent) and Bundelkhand region (22.46 percent). Eastern region (11.78 percent) is extremely low in respect of urbanization.
11.78
28.25
25.11
22.46
20.78
27.78
0.00
5.00
10.00
15.00
20.00
25.00
30.00
Eastern Western Central Bundelkhand U.P. India
Region
Percentage Of Urban Population To Total Population, 2001
[ 304 ]
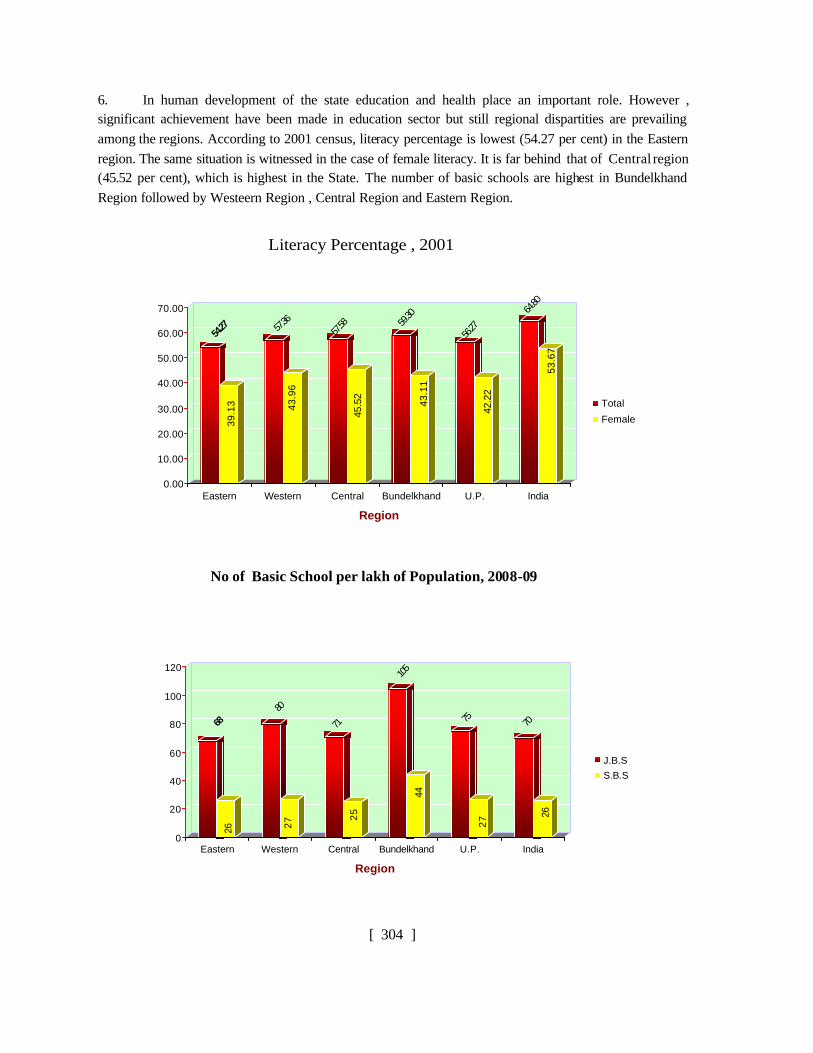
6. In human development of the state education and health place an important role. However , significant achievement have been made in education sector but still regional dispartities are prevailing among the regions. According to 2001 census, literacy percentage is lowest (54.27 per cent) in the Eastern region. The same situation is witnessed in the case of female literacy. It is far behind that of Central region (45.52 per cent), which is highest in the State. The number of basic schools are highest in Bundelkhand Region followed by Westeern Region , Central Region and Eastern Region.
54.27
39.1
3
57.36
43.9
6
57.58
45.5
2
59.30
43.1
1
56.27
42.2
2
64.80
53.6
7
0.00
10.00
20.00
30.00
40.00
50.00
60.00
70.00
Eastern Western Central Bundelkhand U.P. India
Region
Total
Female
Literacy Percentage , 2001
No of Basic School per lakh of Population, 2008-09
68
26
80
27
71
25
105
44
75
27
70
26
0
20
40
60
80
100
120
Eastern Western Central Bundelkhand U.P. India
Region
J.B.S
S.B.S

[ 305 ]
7. Land is the most important factor of production. In spite of having larger average size of holdings,the foodgrain productivity in the Bundelkhand region as it existed in 2006-07 was the lowest (11.40 qt/ha ) among all regions. Western region having productivity of 25.60 qt /ha is the most developed region in the State. Gross value of agricultural out put per hectare of gross cropped area (at current price) was lowest in Bundelkhand region Rs. 19786. The rockey terrain of the region reduces the moisture retaining capacity of the land and make it unsuitable for intensive cultivation. Western region having gross value of Rs.44399 of agricultural out put per hectare of gross cropped area is the most developed region of the State.
19.59
25.60
21.58
11.40
21.05
17.56
0.00
5.00
10.00
15.00
20.00
25.00
30.00
Eastern Western Central Bundelkhand U.P. India
Region
Productivity of Total Foodgrains (qtls/hect.) (2006-07)
8. In agriculture sector, irrigation is also a deciding factor for the growth of productivity. Irrigation facilities are inadequate in Bundelkhand region because of very difficult terrain and rocky strata. The percentage of net irrigated area to net area sown is lowest in Bundelkhand region (52.2 percent) and highest in Western region (91.9 per cent) followed by Central (82.7 per cent) and Eastern region (76.3 percent)
76.3
91.9
82.7
52.2
80.3
42.4
0.010.020.030.040.050.060.070.080.090.0
100.0
Eastern Western Central Bundelkhand U.P. India
Region
Percentage Of Net Area Irrigated To Net Area Sown (2006-07)

[ 306 ]
9. The per cap ita power consumption is highest (292.6 Kwh) in western region and lowest(128.9 kwh) in the Eastern region during 2008-09.In Bundelkhand region the per capita power consumption (182.7 Kwh) is slightly higher than Eastern region.
128.9
292.6
202.8
182.7 205.4
405.0
0.0
50.0
100.0
150.0
200.0
250.0
300.0
350.0
400.0
450.0
Eastern Western Central Bundelkhand U.P. India
Region
Per Capita Power Consumption (kwh) (2008-09)
10. The percentage of main workers is also an important variable. The percentage of main workers engaged in agriculture to total main workers (2001) is highest in Bundelkhand region (70.08 percent) followed by Eastern (66.14 per cent) and Central region (63.78 per cent). The Western region is more diversified with 56.08 per cent of workers being engaged in agriculture sector.
66.14
56.08
63.78
70.08
62.12
52.39
0.00
10.00
20.00
30.00
40.00
50.00
60.00
70.00
80.00
Eastern Western Central Bundelkhand U.P. India
Region
Percentage Of Main Workers Engaged In Agriculture To Total Main Workers (2001)
[ 307 ]
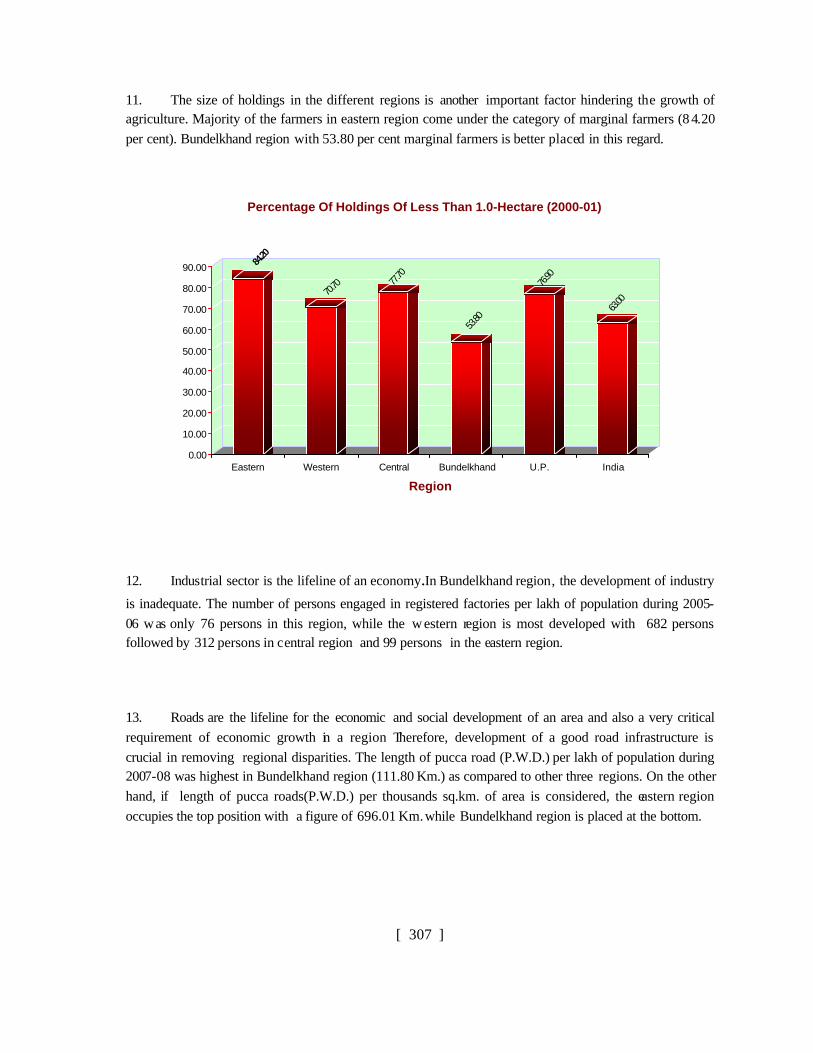
11. The size of holdings in the different regions is another important factor hindering the growth of agriculture. Majority of the farmers in eastern region come under the category of marginal farmers (8 4.20 per cent). Bundelkhand region with 53.80 per cent marginal farmers is better placed in this regard.
84.20
70.70 77
.70
53.80
76.90
63.00
0.00
10.00
20.00
30.00
40.00
50.00
60.00
70.00
80.00
90.00
Eastern Western Central Bundelkhand U.P. India
Region
Percentage Of Holdings Of Less Than 1.0-Hectare (2000-01)
12. Industrial sector is the lifeline of an economy.In Bundelkhand region, the development of industry
is inadequate. The number of persons engaged in registered factories per lakh of population during 2005-06 w as only 76 persons in this region, while the w estern region is most developed with 682 persons followed by 312 persons in central region and 99 persons in the eastern region.
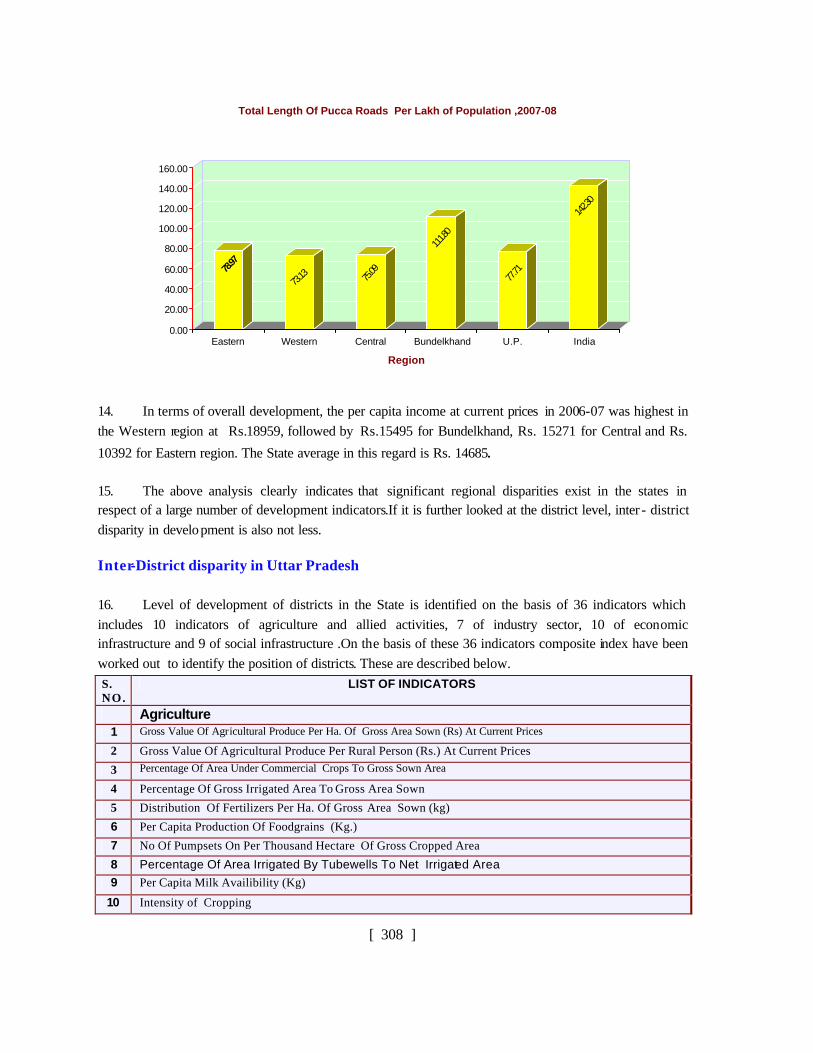
13. Roads are the lifeline for the economic and social development of an area and also a very critical requirement of economic growth in a region Therefore, development of a good road infrastructure is crucial in removing regional disparities. The length of pucca road (P.W.D.) per lakh of population during 2007-08 was highest in Bundelkhand region (111.80 Km.) as compared to other three regions. On the other hand, if length of pucca roads(P.W.D.) per thousands sq.km. of area is considered, the eastern region occupies the top position with a figure of 696.01 Km. while Bundelkhand region is placed at the bottom.
[ 308 ]
78.97
73.13 75
.09
111.8
0
77.71
142.30
0.00
20.00
40.00
60.00
80.00
100.00
120.00
140.00
160.00
Eastern Western Central Bundelkhand U.P. India
Region
Total Length Of Pucca Roads Per Lakh of Population ,2007-08
14. In terms of overall development, the per capita income at current prices in 2006-07 was highest in the Western region at Rs.18959, followed by Rs.15495 for Bundelkhand, Rs. 15271 for Central and Rs.
10392 for Eastern region. The State average in this regard is Rs. 14685.
15. The above analysis clearly indicates that significant regional disparities exist in the states in respect of a large number of development indicators.If it is further looked at the district level, inter - district disparity in development is also not less.
Inter-District disparity in Uttar Pradesh
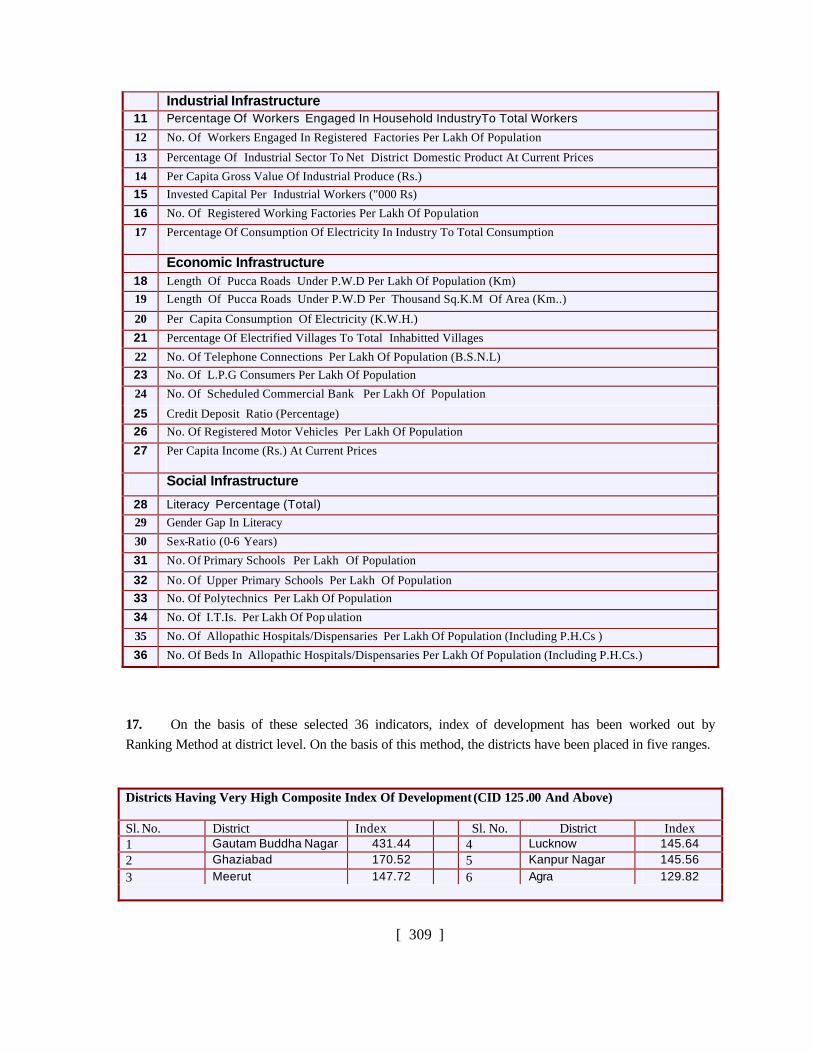
16. Level of development of districts in the State is identified on the basis of 36 indicators which includes 10 indicators of agriculture and allied activities, 7 of industry sector, 10 of economic infrastructure and 9 of social infrastructure .On the basis of these 36 indicators composite index have been worked out to identify the position of districts. These are described below. S. NO.
LIST OF INDICATORS
Agriculture 1 Gross Value Of Agricultural Produce Per Ha. Of Gross Area Sown (Rs) At Current Prices
2 Gross Value Of Agricultural Produce Per Rural Person (Rs.) At Current Prices
3 Percentage Of Area Under Commercial Crops To Gross Sown Area 4 Percentage Of Gross Irrigated Area To Gross Area Sown
5 Distribution Of Fertilizers Per Ha. Of Gross Area Sown (kg)
6 Per Capita Production Of Foodgrains (Kg.) 7 No Of Pumpsets On Per Thousand Hectare Of Gross Cropped Area
8 Percentage Of Area Irrigated By Tubewells To Net Irrigated Area 9 Per Capita Milk Availibility (Kg)
10 Intensity of Cropping
[ 309 ]
Industrial Infrastructure 11 Percentage Of Workers Engaged In Household IndustryTo Total Workers
12 No. Of Workers Engaged In Registered Factories Per Lakh Of Population
13 Percentage Of Industrial Sector To Net District Domestic Product At Current Prices
14 Per Capita Gross Value Of Industrial Produce (Rs.) 15 Invested Capital Per Industrial Workers ("000 Rs)
16 No. Of Registered Working Factories Per Lakh Of Population
17 Percentage Of Consumption Of Electricity In Industry To Total Consumption
Economic Infrastructure 18 Length Of Pucca Roads Under P.W.D Per Lakh Of Population (Km) 19 Length Of Pucca Roads Under P.W.D Per Thousand Sq.K.M Of Area (Km..)
20 Per Capita Consumption Of Electricity (K.W.H.)
21 Percentage Of Electrified Villages To Total Inhabitted Villages
22 No. Of Telephone Connections Per Lakh Of Population (B.S.N.L) 23 No. Of L.P.G Consumers Per Lakh Of Population
24 No. Of Scheduled Commercial Bank Per Lakh Of Population
25 Credit Deposit Ratio (Percentage) 26 No. Of Registered Motor Vehicles Per Lakh Of Population
27 Per Capita Income (Rs.) At Current Prices
Social Infrastructure
28 Literacy Percentage (Total) 29 Gender Gap In Literacy
30 Sex-Ratio (0-6 Years)
31 No. Of Primary Schools Per Lakh Of Population
32 No. Of Upper Primary Schools Per Lakh Of Population 33 No. Of Polytechnics Per Lakh Of Population
34 No. Of I.T.Is. Per Lakh Of Pop ulation
35 No. Of Allopathic Hospitals/Dispensaries Per Lakh Of Population (Including P.H.Cs )
36 No. Of Beds In Allopathic Hospitals/Dispensaries Per Lakh Of Population (Including P.H.Cs.)
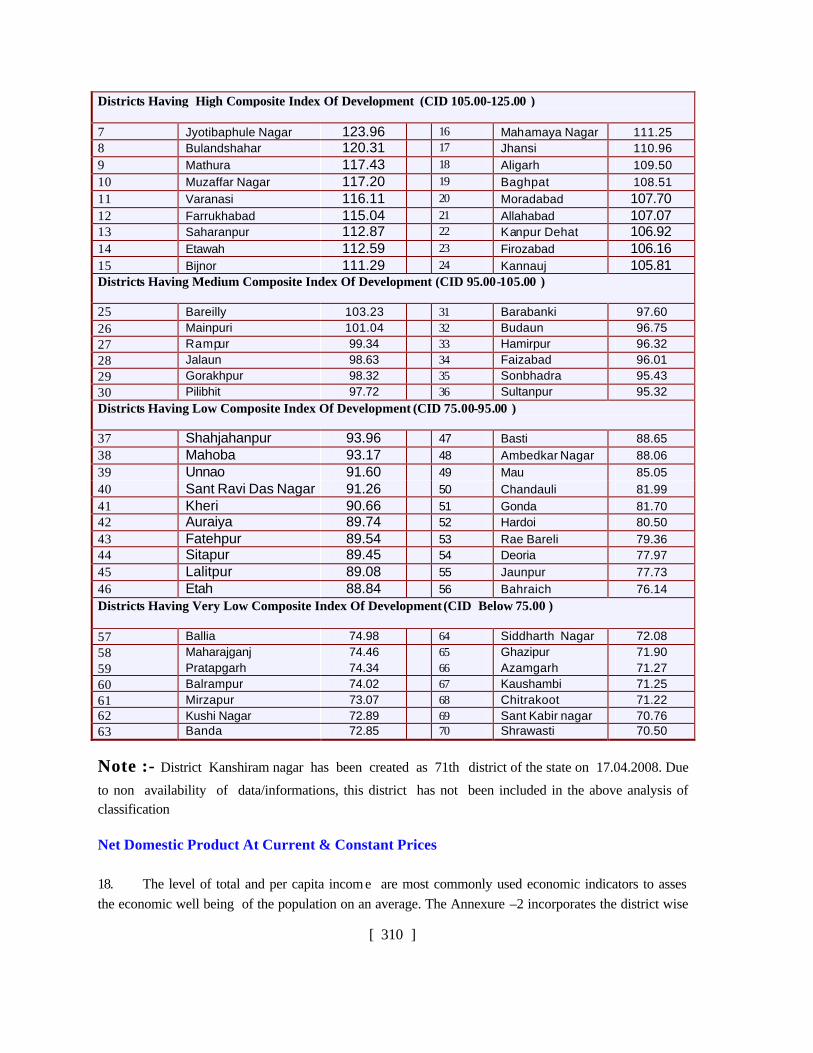
17. On the basis of these selected 36 indicators, index of development has been worked out by Ranking Method at district level. On the basis of this method, the districts have been placed in five ranges.
Districts Having Very High Composite Index Of Development (CID 125 .00 And Above) Sl. No. District Index Sl. No. District Index 1 Gautam Buddha Nagar 431.44 4 Lucknow 145.64 2 Ghaziabad 170.52 5 Kanpur Nagar 145.56 3 Meerut 147.72 6 Agra 129.82
[ 310 ]
Districts Having High Composite Index Of Development (CID 105.00-125.00 ) 7 Jyotibaphule Nagar 123.96 16 Mahamaya Nagar 111.25 8 Bulandshahar 120.31 17 Jhansi 110.96 9 Mathura 117.43 18 Aligarh 109.50 10 Muzaffar Nagar 117.20 19 Baghpat 108.51 11 Varanasi 116.11 20 Moradabad 107.70 12 Farrukhabad 115.04 21 Allahabad 107.07 13 Saharanpur 112.87 22 Kanpur Dehat 106.92 14 Etawah 112.59 23 Firozabad 106.16 15 Bijnor 111.29 24 Kannauj 105.81 Districts Having Medium Composite Index Of Development (CID 95.00-105.00 )
25 Bareilly 103.23 31 Barabanki 97.60 26 Mainpuri 101.04 32 Budaun 96.75 27 Rampur 99.34 33 Hamirpur 96.32 28 Jalaun 98.63 34 Faizabad 96.01 29 Gorakhpur 98.32 35 Sonbhadra 95.43 30 Pilibhit 97.72 36 Sultanpur 95.32 Districts Having Low Composite Index Of Development (CID 75.00-95.00 )
37 Shahjahanpur 93.96 47 Basti 88.65 38 Mahoba 93.17 48 Ambedkar Nagar 88.06 39 Unnao 91.60 49 Mau 85.05 40 Sant Ravi Das Nagar 91.26 50 Chandauli 81.99 41 Kheri 90.66 51 Gonda 81.70 42 Auraiya 89.74 52 Hardoi 80.50 43 Fatehpur 89.54 53 Rae Bareli 79.36 44 Sitapur 89.45 54 Deoria 77.97 45 Lalitpur 89.08 55 Jaunpur 77.73 46 Etah 88.84 56 Bahraich 76.14 Districts Having Very Low Composite Index Of Development (CID Below 75.00 ) 57 Ballia 74.98 64 Siddharth Nagar 72.08 58 Maharajganj 74.46 65 Ghazipur 71.90 59 Pratapgarh 74.34 66 Azamgarh 71.27 60 Balrampur 74.02 67 Kaushambi 71.25 61 Mirzapur 73.07 68 Chitrakoot 71.22 62 Kushi Nagar 72.89 69 Sant Kabir nagar 70.76 63 Banda 72.85 70 Shrawasti 70.50
Note :- District Kanshiram nagar has been created as 71th district of the state on 17.04.2008. Due
to non availability of data/informations, this district has not been included in the above analysis of classification
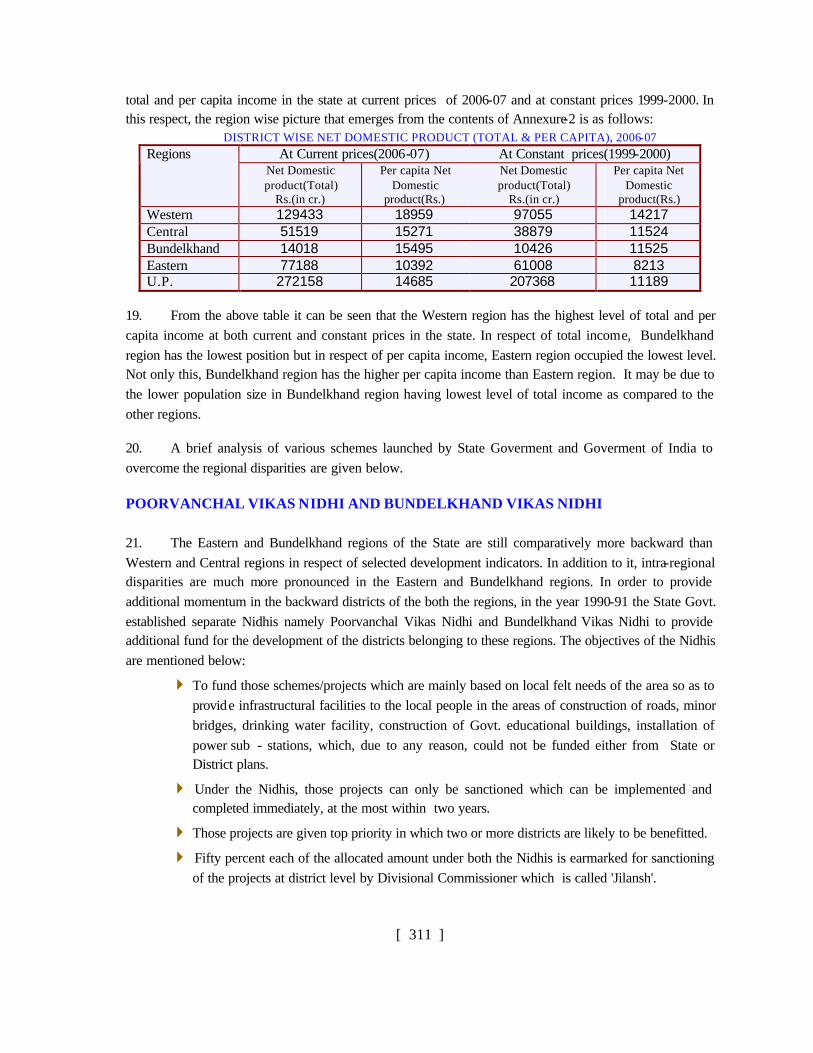
Net Domestic Product At Current & Constant Prices
18. The level of total and per capita incom e are most commonly used economic indicators to asses the economic well being of the population on an average. The Annexure –2 incorporates the district wise
[ 311 ]
total and per capita income in the state at current prices of 2006-07 and at constant prices 1999-2000. In this respect, the region wise picture that emerges from the contents of Annexure-2 is as follows:
DISTRICT WISE NET DOMESTIC PRODUCT (TOTAL & PER CAPITA), 2006-07 At Current prices(2006-07) At Constant prices(1999-2000) Regions
Net Domestic product(Total)
Rs.(in cr.)
Per capita Net Domestic
product(Rs.)
Net Domestic product(Total)
Rs.(in cr.)
Per capita Net Domestic
product(Rs.) Western 129433 18959 97055 14217 Central 51519 15271 38879 11524 Bundelkhand 14018 15495 10426 11525 Eastern 77188 10392 61008 8213 U.P. 272158 14685 207368 11189
19. From the above table it can be seen that the Western region has the highest level of total and per capita income at both current and constant prices in the state. In respect of total income, Bundelkhand region has the lowest position but in respect of per capita income, Eastern region occupied the lowest level. Not only this, Bundelkhand region has the higher per capita income than Eastern region. It may be due to the lower population size in Bundelkhand region having lowest level of total income as compared to the other regions.
20. A brief analysis of various schemes launched by State Goverment and Goverment of India to overcome the regional disparities are given below.
POORVANCHAL VIKAS NIDHI AND BUNDELKHAND VIKAS NIDHI
21. The Eastern and Bundelkhand regions of the State are still comparatively more backward than Western and Central regions in respect of selected development indicators. In addition to it, intra-regional disparities are much more pronounced in the Eastern and Bundelkhand regions. In order to provide additional momentum in the backward districts of the both the regions, in the year 1990-91 the State Govt. established separate Nidhis namely Poorvanchal Vikas Nidhi and Bundelkhand Vikas Nidhi to provide additional fund for the development of the districts belonging to these regions. The objectives of the Nidhis are mentioned below:
4 To fund those schemes/projects which are mainly based on local felt needs of the area so as to provide infrastructural facilities to the local people in the areas of construction of roads, minor bridges, drinking water facility, construction of Govt. educational buildings, installation of power sub - stations, which, due to any reason, could not be funded either from State or District plans.
4 Under the Nidhis, those projects can only be sanctioned which can be implemented and completed immediately, at the most within two years.
4 Those projects are given top priority in which two or more districts are likely to be benefitted.
4 Fifty percent each of the allocated amount under both the Nidhis is earmarked for sanctioning of the projects at district level by Divisional Commissioner which is called 'Jilansh'.
[ 312 ]
4 Remaining Fifty percent of the amount is earmarked for sanctioning of the projects at State level, called Rajyansh.
Backward Regions Grant Fund(BRGF)
22. The Backward Regions-Grant-Fund-is designed to redress regional imbalances in development. The fund will provide resources for supplementing and converging existing developmental inflows into identified districts, so as to:
4 Bridge critical gaps in local infrastructure and other development requirements that are not being adequately met through existing inflows;
4 Strengthen, to this end Panchayat and Municipality level governance with more appropriate capacity to facility participatory planning, decision making, implementation and monitoring, to reflect local felt needs,
4 Provide professional support to local bodies for planning, implementation and monitoring their plans.
4 Improve the performance and delivery of critical functions assigned to Panchayats, and counter possible efficiency and equity losses on account of inadequate local capacity.
Criteria for distribution of funds between districts:
23. The substantially untied grants will be distributed among the districts concerned as follows:
4 Every districts will receive a fixed minimum amount of Rs. 10 crore per annum.
4 50% of the balance allocation under the Scheme will be allocated on the basis of the share of the population of the district in the total population of all backward districts.
4 The remaining 50% will be distributed on the basis of the share of the area of the district in the total area of all backward districts.
24. A Backward Regions Grant Fund(BRGF) mandated to address regional imbalances concerns are structured with the following two windows:
4 Backward District Window: This could be an area-targetted grant facility, broadly on the lines of existing RSVY. Initially the window will consist of all backward district from RSVY list.
4 Compared to the provisions of the still nascent RSVY, a greater emphasis may be placed on human development indicators for identification of target regions and districts. Elimination of minimum normative gaps in local area developments; in physical infrastructure; in social attainments in health and education and land productivity should be the prime objective of financing interventions from this window. The selection will be based on objective parameters subject to minor changes in consultation with states.
4 State Infrastructure & Reforms Window: This could also be a grant facility for providing viability gap funding which will enable resources to be leveraged for core infrastructure projects at inter district or state level in less developed states. These projects will include
[ 313 ]
projects that would otherwise considered as not viable financially but are necessary for removing backwardness. the amounts to be made available to states will be in proportion to the population residing in the ir backward districts.
4 The BRGF has been approved in the financial year 2006-07, replacing the erstwhile Rashtriya Sum Vikas Yojana (RSVY).. Under BRGF the grant is to be used to fill critical gaps,to be identified by the Panchayati Raj Institution. In Uttar Pradesh BRGF covers 34 districts in which all the 21 districts which was covered under RSVY,are included . Apart from the 21 districts covered under RSVY the additional 13 district which are covered under BRGF as follows.
NATIONAL RURAL EMPLOYMENT GUARANTEE SCHEME
25. Unemployment generates different kind of problems in the society viz. illiteracy, backwardness, naxalits activities and terrorism.These are main problems due to unemployment ,As per provisions of Article 21 of the Indian Constitution,every persons has the right of living with pride.In the light of Article 41 to provide work to each person of the country,the Indian Parliament took initiatives and passed the National Rural Employment Guarantee Scheme Act 2005 on 23rd August 2005. The Govt of India has implemented the National Rural Employment Guarantee Scheme in 200 districts of the country from 2nd February 2006. In the first phase of the scheme only 22 districts of UP has been selected viz Azamgarh, Banda, Barabanki, Chandauli, Chitrakoot, Fatehpur, Gorakhpur, Hamirpur, Hardoi, Jalaun, Jaunpur, Kaushambi, Kushi Nagar , Lakhimpur Kheri, Lalitpur, Mahoba, Mirzapur, Pratapgarh, Raebareli, Sitapur, Sonbharda and Unnao. Thereafter additional 130 districts have been included in this scheme from the financial year 2007-08 out of that 17 districts belongs to Uttar Pradesh, notified w.e.f 15 th of May 2007. The remaining districts of the country have been notified under this scheme w.e.f April 1, 2008. Thus NREGA covers the entire country with the exception of districts that have a 100 percent urban population.
26. Under this scheme 100 days employment at local level will be provided to each rural family to overcome the problem of unemployment and poverty. For the success of the scheme there is need to to aware the people regarding the organised demand of employment. This scheme is to be implemented by the gram Panchayats and local bodies. As per norms of the scheme 90 percent expenditure will be contributed by the Central Govt.and State Govt will be responsible for the completion of the scheme.
Monitorable Targets in Eleventh Plan
27. The eight Millennium Development Goal (MDGs)- which range from halving extreme poverty to halting the spread of HIV/AIDS and providing universal primary education, all by the targ et date of 2015- form a blue print agreed to by all the world countries. The Govt. of India also agreed to the following eight MDGs.
4 Eradicate extreme poverty and hunger
4 Achieve universal primary education
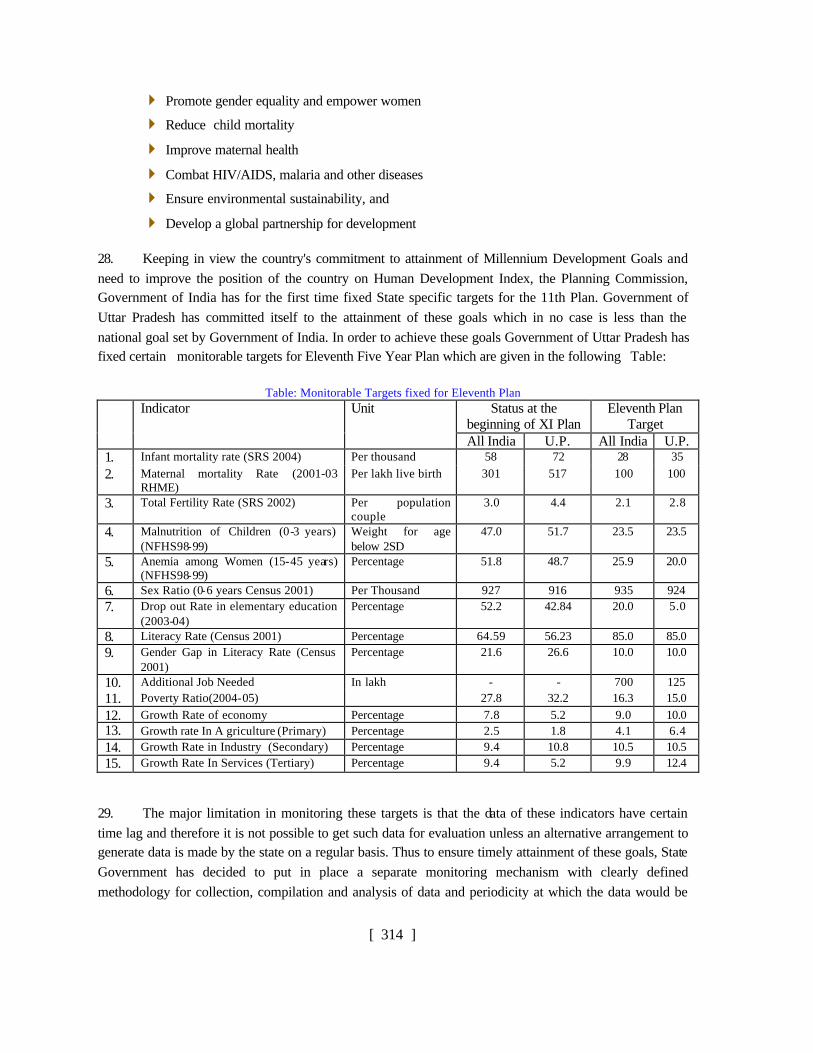
[ 314 ]
4 Promote gender equality and empower women
4 Reduce child mortality
4 Improve maternal health
4 Combat HIV/AIDS, malaria and other diseases
4 Ensure environmental sustainability, and
4 Develop a global partnership for development
28. Keeping in view the country's commitment to attainment of Millennium Development Goals and need to improve the position of the country on Human Development Index, the Planning Commission, Government of India has for the first time fixed State specific targets for the 11th Plan. Government of Uttar Pradesh has committed itself to the attainment of these goals which in no case is less than the national goal set by Government of India. In order to achieve these goals Government of Uttar Pradesh has fixed certain monitorable targets for Eleventh Five Year Plan which are given in the following Table:
Table: Monitorable Targets fixed for Eleventh Plan Status at the
beginning of XI Plan Eleventh Plan
Target Indicator Unit
All India U.P. All India U.P. 1. Infant mortality rate (SRS 2004) Per thousand 58 72 28 35 2. Maternal mortality Rate (2001-03
RHME) Per lakh live birth 301 517 100 100
3. Total Fertility Rate (SRS 2002) Per population couple
3.0 4.4 2.1 2.8
4. Malnutrition of Children (0-3 years) (NFHS98-99)
Weight for age below 2SD
47.0 51.7 23.5 23.5
5. Anemia among Women (15-45 years) (NFHS98-99)
Percentage 51.8 48.7 25.9 20.0
6. Sex Ratio (0-6 years Census 2001) Per Thousand 927 916 935 924 7. Drop out Rate in elementary education
(2003-04) Percentage 52.2 42.84 20.0 5.0
8. Literacy Rate (Census 2001) Percentage 64.59 56.23 85.0 85.0 9. Gender Gap in Literacy Rate (Census
2001) Percentage 21.6 26.6 10.0 10.0
10. Additional Job Needed In lakh - - 700 125 11. Poverty Ratio(2004-05) 27.8 32.2 16.3 15.0 12. Growth Rate of economy Percentage 7.8 5.2 9.0 10.0 13. Growth rate In A griculture (Primary) Percentage 2.5 1.8 4.1 6.4 14. Growth Rate in Industry (Secondary) Percentage 9.4 10.8 10.5 10.5 15. Growth Rate In Services (Tertiary) Percentage 9.4 5.2 9.9 12.4
29. The major limitation in monitoring these targets is that the data of these indicators have certain time lag and therefore it is not possible to get such data for evaluation unless an alternative arrangement to generate data is made by the state on a regular basis. Thus to ensure timely attainment of these goals, State Government has decided to put in place a separate monitoring mechanism with clearly defined methodology for collection, compilation and analysis of data and periodicity at which the data would be
[ 315 ]
collected. Since data of these monitorable indicators for the year 2008-09 is not available, there present available status is given below:
4 Infant Mortality Rate (per thousand) in U.P. in 2009 was 67 while the corresponding figure of India was 53.
4 Total Fertility Rate (per productive couple) in U.P. in 2005-06 was 3.82 while the corresponding figure of India was 2.68.
4 Malnutrition of children below 3 years of age in U.P. in 2005-06 was 47.3 percent while the corresponding figure of India is 45.9
4 Sex Ratio (no of females per thousand males 0-6 years) in U.P. in 2001 was 916 while the corresponding figure of India was 927.
4 Literacy Rate in U.P. in 2001 was 56.23 while the corresponding figure of India was 64.59.
4 Growth Rate of U.P's. economy in 2008-09 was 7.2 while the corresponding figure of India was 6.7 percent.
30. This indicates that if Uttar Pradesh fails to achieve the set goals , then India will also not be able to achieve the Millennium Development Goals by 2015. Hence, monitorable targets need to be rigorously monitored during the Plan period. The details of these targets and their achievements are given in the following Table.
Monitorable Targets Fixed For The Eleventh Plan Eleventh Plan
Target Present status Sl.
No. Indicator Unit
All India
UP Reference Period
All India
UP
1. Infant Mortality Rate Per thousand 28 35 SRS-2009 53 67
2. Maternal Mortality Rate Per lakh live birth 100 100 2001-03 301 517
3. Total Fertility Rate Per productive couple
2.1 2.8 NFHS III (2005-06)
2.68 3.82
4. Malnutrition of children (0-3 Years)
Children under 3 years of age who
are underweight %
23.5 23.5 NFHS III (2005-06)
45.9 47.3
5. Anaemia among women (15-49 years)
Percentage 25.9 20.0 NFHS III (2005-06)
56.2 50.8
6. Sex Ratio (0 -6 years) Per thousand 935 924 Census 2001 927 916
7. Literacy Rate Percentage 85.0 85.0 Census 2001 64.59 56.23
8. Gender Gap In Literacy Rate Percentage 10.0 10.0 Census 2001 21.6 26.6
9. Additional Jobs Needed In Lakh 700.0 125.0 jobs generated in
2008-09
25
10. Growth Rate Of Economy Percentage 9.0 10.0 quick* estimate (2008-09)
6.7 7.2
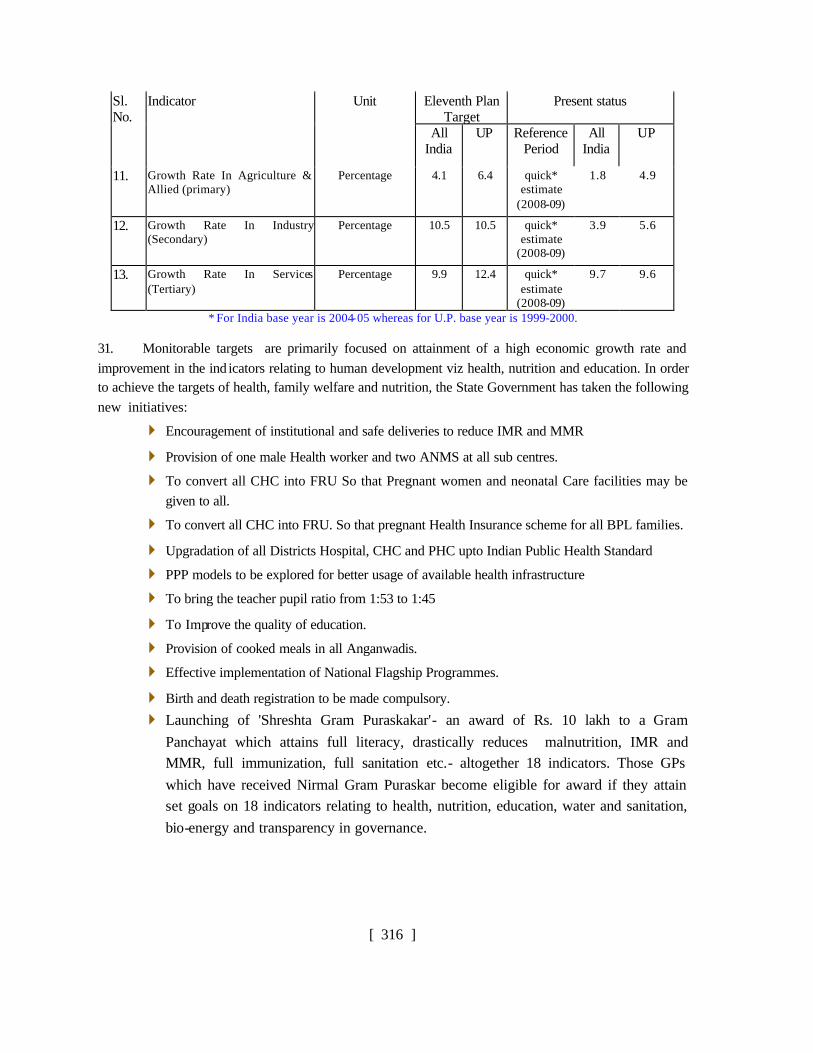
[ 316 ]
Eleventh Plan Target
Present status Sl. No.
Indicator Unit
All India
UP Reference Period
All India
UP
11. Growth Rate In Agriculture & Allied (primary)
Percentage 4.1 6.4 quick* estimate
(2008-09)
1.8 4.9
12. Growth Rate In Industry (Secondary)
Percentage 10.5 10.5 quick* estimate
(2008-09)
3.9 5.6
13. Growth Rate In Services (Tertiary)
Percentage 9.9 12.4 quick* estimate
(2008-09)
9.7 9.6
* For India base year is 2004-05 whereas for U.P. base year is 1999-2000.
31. Monitorable targets are primarily focused on attainment of a high economic growth rate and improvement in the ind icators relating to human development viz health, nutrition and education. In order to achieve the targets of health, family welfare and nutrition, the State Government has taken the following new initiatives:
4 Encouragement of institutional and safe deliveries to reduce IMR and MMR
4 Provision of one male Health worker and two ANMS at all sub centres.
4 To convert all CHC into FRU So that Pregnant women and neonatal Care facilities may be given to all.
4 To convert all CHC into FRU. So that pregnant Health Insurance scheme for all BPL families.
4 Upgradation of all Districts Hospital, CHC and PHC upto Indian Public Health Standard
4 PPP models to be explored for better usage of available health infrastructure
4 To bring the teacher pupil ratio from 1:53 to 1:45
4 To Improve the quality of education.
4 Provision of cooked meals in all Anganwadis.
4 Effective implementation of National Flagship Programmes.
4 Birth and death registration to be made compulsory.
4 Launching of 'Shreshta Gram Puraskakar'- an award of Rs. 10 lakh to a Gram Panchayat which attains full literacy, drastically reduces malnutrition, IMR and MMR, full immunization, full sanitation etc.- altogether 18 indicators. Those GPs which have received Nirmal Gram Puraskar become eligible for award if they attain set goals on 18 indicators relating to health, nutrition, education, water and sanitation, bio-energy and transparency in governance.
[ 317 ]
Employment Generation
32. On the basis of growth of workers during the 55th and 61th round of N.S.S. the total number of workers at the beginning of Eleventh Plan is estimated at around 739 lakh. During Eleventh Plan, the target is to generate 125 lakh employment opportunities. This is based on the State attaining growth rate of 10 percent during the Plan Period. As against this it is estimated that sustainable employment generation during 2009-10 will be more than 21 lakh. However during the Eleventh Plan under employment generation programmes State Government is giving more emphasis to Rojgar Chattri Yojna being implemented by the Rural Development Programme. Besides this effective implementation of NAREGA is on the top most priority of state Govt. initiatives . Rural development department and few other departments have also formed around 3.50 lakh self help groups. If these groups sustain and works efficiently then they will also generate gainful employment. If these programmes perform better then the employment generation figure could also go upto 25 lakh.
[ 318 ]
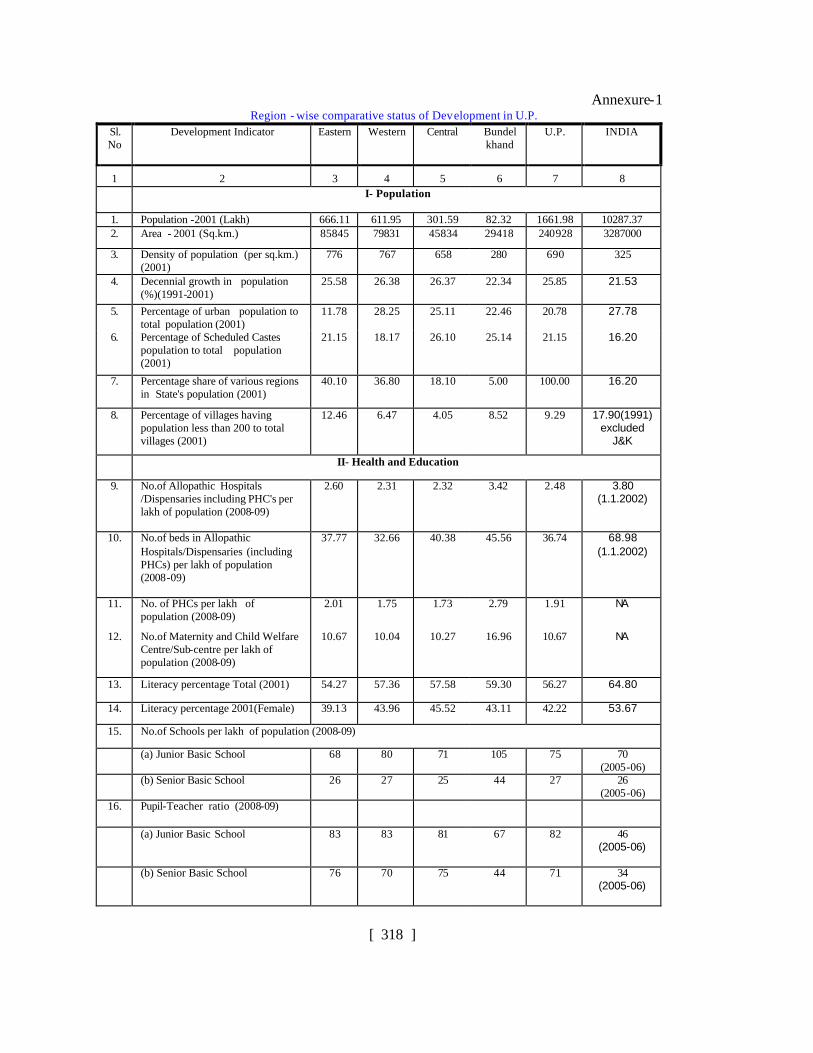
Annexure-1 Region - wise comparative status of Development in U.P.
Sl. No
Development Indicator Eastern Western Central Bundel khand
U.P. INDIA
1 2 3 4 5 6 7 8
I- Population
1. Population -2001 (Lakh) 666.11 611.95 301.59 82.32 1661.98 10287.37 2. Area - 2001 (Sq.km.) 85845 79831 45834 29418 240928 3287000
3. Density of population (per sq.km.) (2001)
776 767 658 280 690 325
4. Decennial growth in population (%)(1991-2001)
25.58 26.38 26.37 22.34 25.85 21.53
5. Percentage of urban population to total population (2001)
11.78 28.25 25.11 22.46 20.78 27.78
6. Percentage of Scheduled Castes population to total population (2001)
21.15 18.17 26.10 25.14 21.15 16.20
7. Percentage share of various regions in State's population (2001)
40.10 36.80 18.10 5.00 100.00 16.20
8. Percentage of villages having population less than 200 to total villages (2001)
12.46 6.47 4.05 8.52 9.29 17.90(1991) excluded
J&K
II- Health and Education
9. No.of Allopathic Hospitals /Dispensaries including PHC's per lakh of population (2008-09)
2.60 2.31 2.32 3.42 2.48 3.80 (1.1.2002)
10. No.of beds in Allopathic Hospitals/Dispensaries (including PHCs) per lakh of population (2008-09)
37.77 32.66 40.38 45.56 36.74 68.98 (1.1.2002)
11. No. of PHCs per lakh of population (2008-09)
2.01 1.75 1.73 2.79 1.91 NA
12. No.of Maternity and Child Welfare Centre/Sub-centre per lakh of population (2008-09)
10.67 10.04 10.27 16.96 10.67 NA
13. Literacy percentage Total (2001) 54.27 57.36 57.58 59.30 56.27 64.80
14. Literacy percentage 2001(Female) 39.13 43.96 45.52 43.11 42.22 53.67
15. No.of Schools per lakh of population (2008-09)
(a) Junior Basic School
68 80 71 105 75 70 (2005-06)
(b) Senior Basic School 26 27 25 44 27 26 (2005-06)
16. Pupil-Teacher ratio (2008-09)
(a) Junior Basic School 83 83 81 67 82 46 (2005-06)
(b) Senior Basic School 76 70 75 44 71 34
(2005-06)
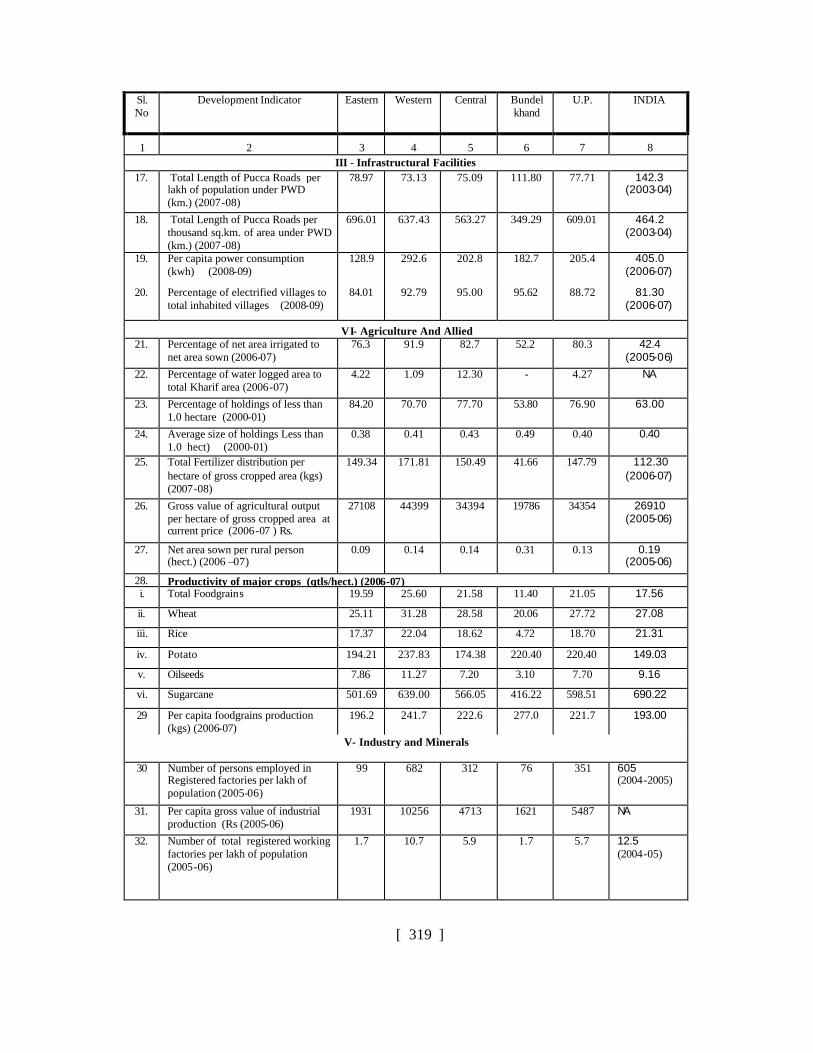
[ 319 ]
Sl. No
Development Indicator Eastern Western Central Bundel khand
U.P. INDIA
1 2 3 4 5 6 7 8 III - Infrastructural Facilities
17. Total Length of Pucca Roads per lakh of population under PWD (km.) (2007-08)
78.97 73.13 75.09 111.80 77.71 142.3 (2003-04)
18. Total Length of Pucca Roads per thousand sq.km. of area under PWD (km.) (2007-08)
696.01 637.43 563.27 349.29 609.01 464.2 (2003-04)
19. Per capita power consumption (kwh) (2008-09)
128.9 292.6 202.8 182.7 205.4 405.0 (2006-07)
20. Percentage of electrified villages to total inhabited villages (2008-09)
84.01 92.79 95.00 95.62 88.72 81.30 (2006-07)
VI- Agriculture And Allied 21. Percentage of net area irrigated to
net area sown (2006-07) 76.3 91.9 82.7 52.2 80.3 42.4
(2005-06) 22. Percentage of water logged area to
total Kharif area (2006-07) 4.22 1.09 12.30 - 4.27 NA
23. Percentage of holdings of less than 1.0 hectare (2000-01)
84.20 70.70 77.70 53.80 76.90 63.00
24. Average size of holdings Less than 1.0 hect) (2000-01)
0.38 0.41 0.43 0.49 0.40 0.40
25. Total Fertilizer distribution per hectare of gross cropped area (kgs) (2007-08)
149.34 171.81 150.49 41.66 147.79 112.30 (2006-07)
26. Gross value of agricultural output per hectare of gross cropped area at current price (2006-07 ) Rs.
27108 44399 34394 19786 34354 26910 (2005-06)
27. Net area sown per rural person (hect.) (2006 –07)
0.09 0.14 0.14 0.31 0.13 0.19 (2005-06)
28. Productivity of major crops (qtls/hect.) (2006-07) i. Total Foodgrains 19.59 25.60 21.58 11.40 21.05 17.56
ii. Wheat 25.11 31.28 28.58 20.06 27.72 27.08
iii. Rice 17.37 22.04 18.62 4.72 18.70 21.31
iv. Potato 194.21 237.83 174.38 220.40 220.40 149.03
v. Oilseeds 7.86 11.27 7.20 3.10 7.70 9.16
vi. Sugarcane 501.69 639.00 566.05 416.22 598.51 690.22
29 Per capita foodgrains production (kgs) (2006-07)
196.2 241.7 222.6 277.0 221.7 193.00
V- Industry and Minerals
30 Number of persons employed in Registered factories per lakh of population (2005-06)
99 682 312 76 351 605 (2004-2005)
31. Per capita gross value of industrial production (Rs (2005-06)
1931 10256 4713 1621 5487 NA
32. Number of total registered working factories per lakh of population (2005-06)
1.7 10.7 5.9 1.7 5.7 12.5 (2004-05)
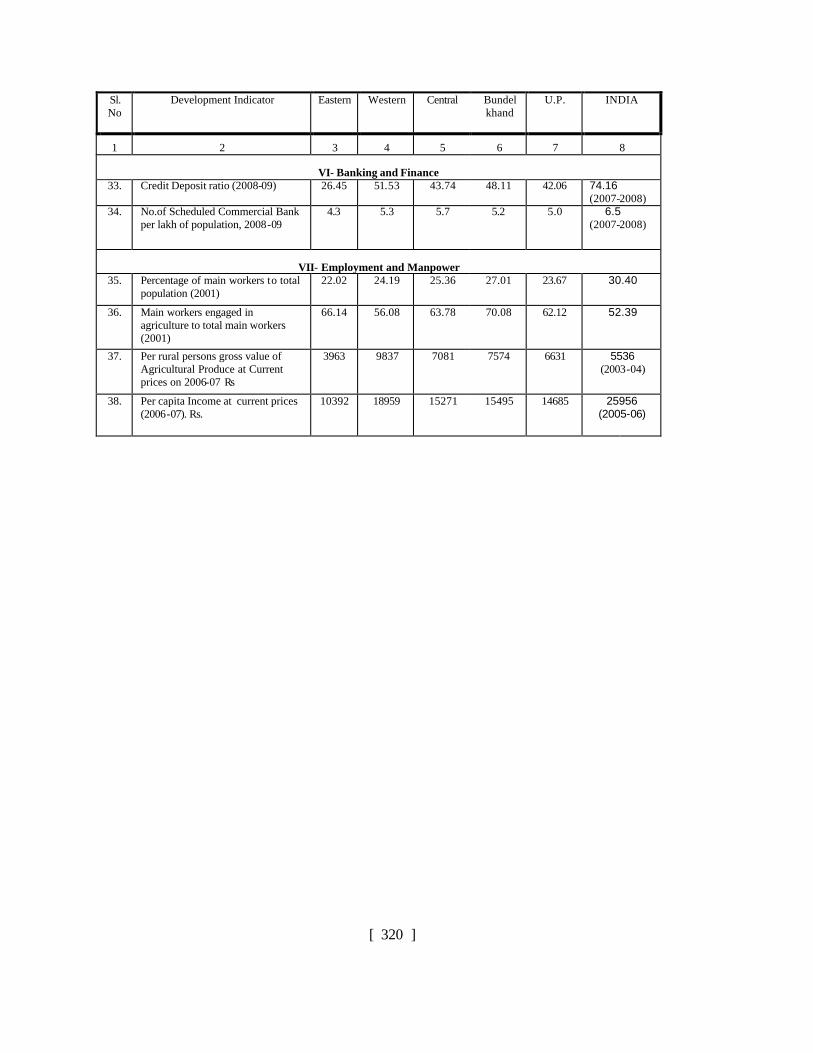
[ 320 ]
Sl. No
Development Indicator Eastern Western Central Bundel khand
U.P. INDIA
1 2 3 4 5 6 7 8
VI- Banking and Finance 33. Credit Deposit ratio (2008-09) 26.45 51.53 43.74 48.11 42.06 74.16
(2007-2008) 34. No.of Scheduled Commercial Bank
per lakh of population, 2008-09 4.3 5.3 5.7 5.2 5.0 6.5
(2007-2008)
VII- Employment and Manpower 35. Percentage of main workers to total
population (2001) 22.02 24.19 25.36 27.01 23.67 30.40
36. Main workers engaged in agriculture to total main workers (2001)
66.14 56.08 63.78 70.08 62.12 52.39
37. Per rural persons gross value of Agricultural Produce at Current prices on 2006-07 Rs
3963 9837 7081 7574 6631 5536 (2003-04)
38. Per capita Income at current prices (2006-07). Rs.
10392 18959 15271 15495 14685 25956 (2005-06)
[ 321 ]
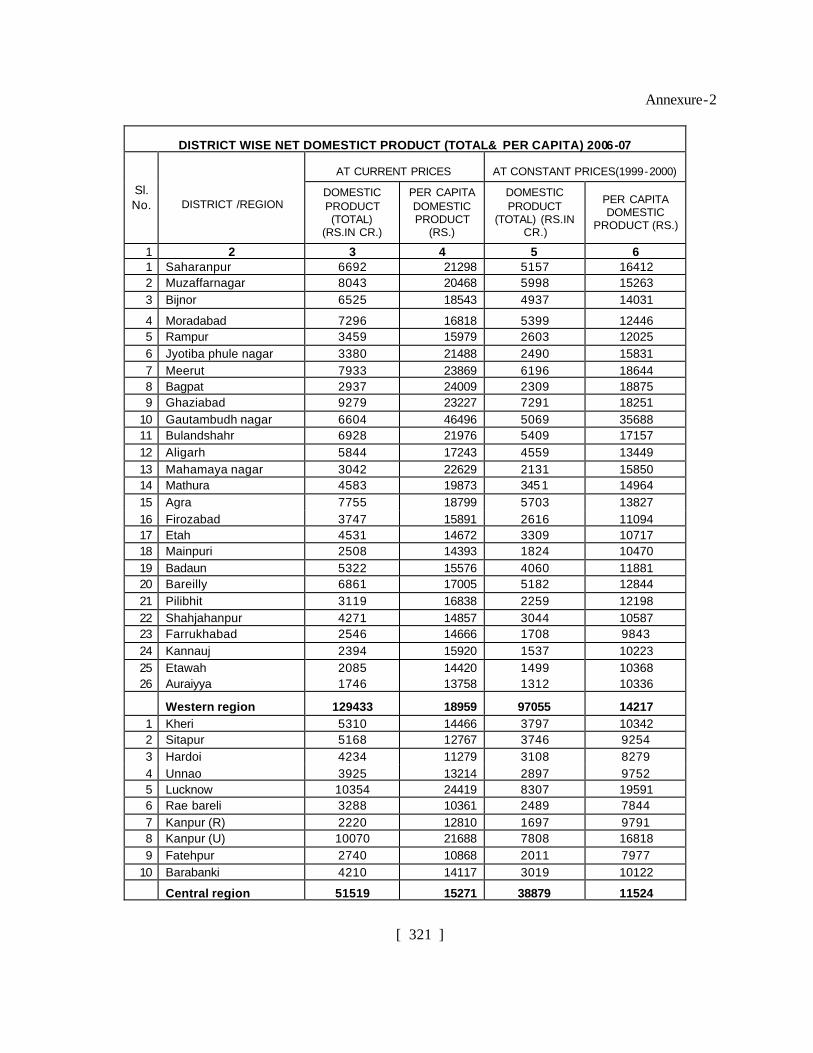
Annexure-2
DISTRICT WISE NET DOMESTICT PRODUCT (TOTAL& PER CAPITA) 2006-07
AT CURRENT PRICES
AT CONSTANT PRICES(1999-2000)
Sl. No.
DISTRICT /REGION
DOMESTIC PRODUCT (TOTAL)
(RS.IN CR.)
PER CAPITA DOMESTIC PRODUCT
(RS.)
DOMESTIC PRODUCT
(TOTAL) (RS.IN CR.)
PER CAPITA DOMESTIC
PRODUCT (RS.)
1 2 3 4 5 6 1 Saharanpur 6692 21298 5157 16412 2 Muzaffarnagar 8043 20468 5998 15263 3 Bijnor 6525 18543 4937 14031
4 Moradabad 7296 16818 5399 12446 5 Rampur 3459 15979 2603 12025 6 Jyotiba phule nagar 3380 21488 2490 15831 7 Meerut 7933 23869 6196 18644 8 Bagpat 2937 24009 2309 18875 9 Ghaziabad 9279 23227 7291 18251
10 Gautambudh nagar 6604 46496 5069 35688 11 Bulandshahr 6928 21976 5409 17157 12 Aligarh 5844 17243 4559 13449 13 Mahamaya nagar 3042 22629 2131 15850 14 Mathura 4583 19873 3451 14964 15 Agra 7755 18799 5703 13827 16 Firozabad 3747 15891 2616 11094 17 Etah 4531 14672 3309 10717 18 Mainpuri 2508 14393 1824 10470 19 Badaun 5322 15576 4060 11881 20 Bareilly 6861 17005 5182 12844 21 Pilibhit 3119 16838 2259 12198 22 Shahjahanpur 4271 14857 3044 10587 23 Farrukhabad 2546 14666 1708 9843 24 Kannauj 2394 15920 1537 10223 25 Etawah 2085 14420 1499 10368 26 Auraiyya 1746 13758 1312 10336
Western region 129433 18959 97055 14217 1 Kheri 5310 14466 3797 10342 2 Sitapur 5168 12767 3746 9254 3 Hardoi 4234 11279 3108 8279 4 Unnao 3925 13214 2897 9752 5 Lucknow 10354 24419 8307 19591 6 Rae bareli 3288 10361 2489 7844 7 Kanpur (R) 2220 12810 1697 9791 8 Kanpur (U) 10070 21688 7808 16818 9 Fatehpur 2740 10868 2011 7977
10 Barabanki 4210 14117 3019 10122
Central region 51519 15271 38879 11524
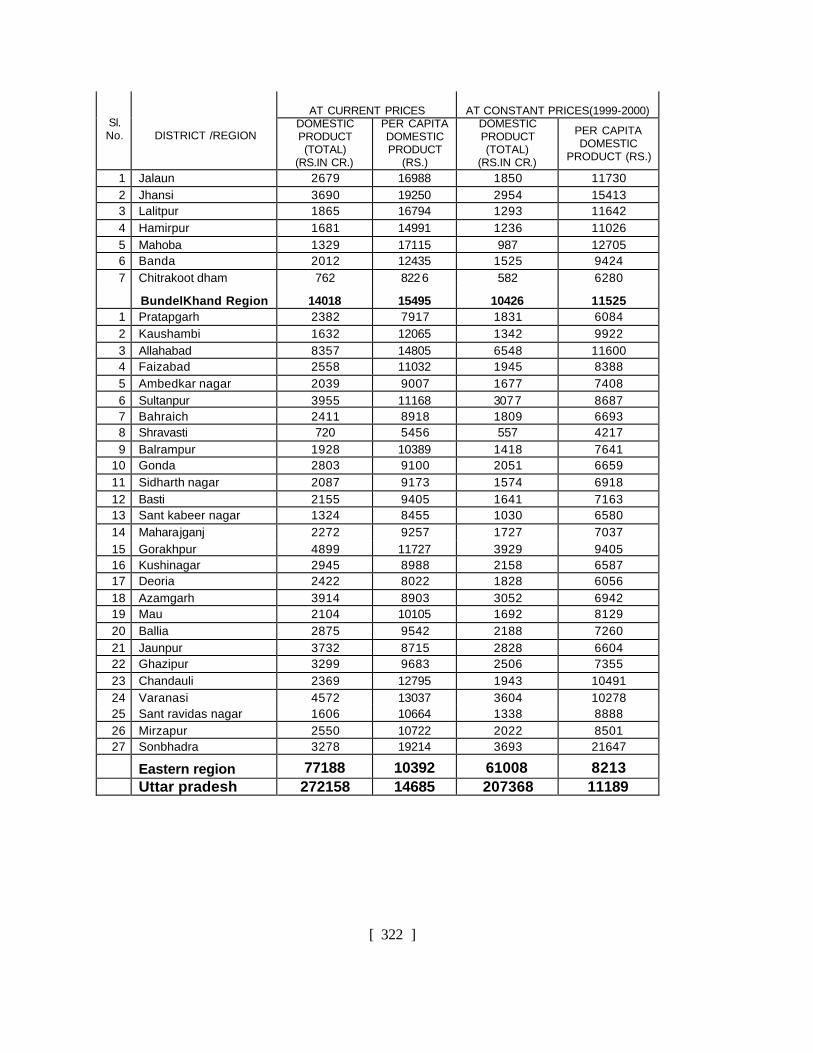
[ 322 ]
AT CURRENT PRICES
AT CONSTANT PRICES(1999-2000)
Sl. No.
DISTRICT /REGION
DOMESTIC PRODUCT (TOTAL)
(RS.IN CR.)
PER CAPITA DOMESTIC PRODUCT
(RS.)
DOMESTIC PRODUCT (TOTAL)
(RS.IN CR.)
PER CAPITA DOMESTIC
PRODUCT (RS.)
1 Jalaun 2679 16988 1850 11730 2 Jhansi 3690 19250 2954 15413 3 Lalitpur 1865 16794 1293 11642 4 Hamirpur 1681 14991 1236 11026 5 Mahoba 1329 17115 987 12705 6 Banda 2012 12435 1525 9424 7 Chitrakoot dham 762 8226 582 6280
BundelKhand Region 14018 15495 10426 11525 1 Pratapgarh 2382 7917 1831 6084 2 Kaushambi 1632 12065 1342 9922 3 Allahabad 8357 14805 6548 11600 4 Faizabad 2558 11032 1945 8388 5 Ambedkar nagar 2039 9007 1677 7408 6 Sultanpur 3955 11168 3077 8687 7 Bahraich 2411 8918 1809 6693 8 Shravasti 720 5456 557 4217 9 Balrampur 1928 10389 1418 7641
10 Gonda 2803 9100 2051 6659 11 Sidharth nagar 2087 9173 1574 6918 12 Basti 2155 9405 1641 7163 13 Sant kabeer nagar 1324 8455 1030 6580 14 Maharajganj 2272 9257 1727 7037 15 Gorakhpur 4899 11727 3929 9405 16 Kushinagar 2945 8988 2158 6587 17 Deoria 2422 8022 1828 6056 18 Azamgarh 3914 8903 3052 6942 19 Mau 2104 10105 1692 8129 20 Ballia 2875 9542 2188 7260 21 Jaunpur 3732 8715 2828 6604 22 Ghazipur 3299 9683 2506 7355 23 Chandauli 2369 12795 1943 10491 24 Varanasi 4572 13037 3604 10278 25 Sant ravidas nagar 1606 10664 1338 8888 26 Mirzapur 2550 10722 2022 8501 27 Sonbhadra 3278 19214 3693 21647
Eastern region 77188 10392 61008 8213 Uttar pradesh 272158 14685 207368 11189