REGIONAL COMMITTEE FOR EM/RCJ51l0 August 1988
43
WORLD HEALTH ORGANIZATION Regional Office for the Eastern Mediterranean ORGANISATION MONDIALE DE LA SANTE Bureau regional de la Mediterranee orientale REGIONAL COMMITTEE FOR THE EASTERN MEDITERRANEAN Thirty-fifth Session Agenda item 12 SECOND REPORT ON MONITORING PROGRESS IN --" . "'--:. / --'" , .. ." t <. ' .. -:-" ...... .. . .-- . . / .. ---.:...-- -,. "," EM/RCJ51l0 August 1988 ORIGINAL: ENGLISH THE IMPLEMENTATION OF HFA STRATEGIES
Transcript of REGIONAL COMMITTEE FOR EM/RCJ51l0 August 1988

WORLD HEALTH ORGANIZATION Regional Office
for the Eastern Mediterranean ORGANISATION MONDIALE DE LA SANTE
Bureau regional de la Mediterranee orientale
REGIONAL COMMITTEE FOR THE EASTERN MEDITERRANEAN
Thirty-fifth Session
Agenda item 12
SECOND REPORT ON MONITORING PROGRESS IN
~." --" . ~~ ~) "'--:. ~J / --'" , .. ." t <. ' .. -:-" ~ ...... ~. .. . .--. .
/ .. ---.:...-- -,. ","
EM/RCJ51l0 August 1988
ORIGINAL: ENGLISH
THE IMPLEMENTATION OF HFA STRATEGIES

l.
2.
3.
4.
5.
6.
7.
8.
9.
10.
11.
EM/RC35/10
TABLE OF CONTEN'l'S
INTRODUCTION • • •
MONITORING PROCESS AND MECHANISMS
OVERVIEW OF THE REGIONAL SOCIO-ECONOMIC SITUATION
HEALTH POLICIES AND STRATEGIES
DEVELOPMENT OF HEALTH SYSTEMS
INTERNATIONAL ACTION •
AVAILABILITY OF HEALTH CARE (GLOBAL INDICATOR 7)
ENVIRONMENTAL HEALTH
HEALTH STATUS
THE PALESTINIAN POPULATION
SUMMARY AND CONCLUSIONS
Annex STATISTICAL TABLES
1
2
3
4
5
13
15
18
18
20
20
25

1. INTRODUCTION
BM/RC35/l0 page 1
The Global Strategy for Health for All by the Year 2000 (HFA/2000) was adopted by the World Health Assembly (WHA) in 1981 (resolution WHA34.36) and the Plan of Action for Implementing the Strategy in 1982 (resolution WHA35.23). In addition to monitoring and evaluation of the national strategies by Member States, the Plan required that WHO governing bodies monitor progress in implementation of regional/global strategies every two years and evaluate their effectiveness every six years. Monitoring is the process whereby countries find out whether they are making progress in the implementation of their health strategies. EValuation is the systematic assessment of the relevance, adequacy, progress, efficiency and effectiveness of the strategies, programmes or activities and their impact on the health status of the people.
The Regional monitoring and evaluation reports were reviewed by the regional committees in 1983 and 1985, and the global reports were reviewed by the EXecutive Board and by the WHA in 1984 and 1986 respectively. In reviewing the first evaluation report, the WHA decided (resolution WHA39.7) to institute reporting on monitoring progress every three instead of every two years, maintaining reporting on evaluation every six years, starting from 1985. This will allow more time for Member States to make maximum use of the findings, particularly to strengthen their national capabilities in monitoring and evaluation.
The document DGO/86.l "The Common Framework: Monitoring (CFM)" has been prepared to assist Member States in collecting and analysing relevant information for monitoring progress in the implementation of HFA Strategies, and to report on the outcome to the regional committees through the Regional Offices, in 1988. It was sent to all Member States in February 1987. A Regional meeting was held in cyprus in September 1987, attended by participants from twenty countries, to explain the new Common Framework, its structure, contents, nature and sources of information and computation of relevant indicators, and the preparation of the reports on the outcome.
The present report is based primarily on the results of national monitoring as reported by Member States of the WHO Eastern Mediterranean Region (EMR). Other official national reports, UN agencies' documents and other published material have also been drawn upon. The report reviews the progress made by EMR countries in the implementation of their HFA Strategies, the factors contributing to and impeding that progress, and the positive and negative trends in the Region's health situation. As such, it stands as a milestone on the Region's road to HFA, shOWing how far we have come and the distance we still have to cover.
The deadline for receiving the national reports was end January 1988. Less than half the countries met that deadline. Despite repeated reminders, reports were not received up to the end of June 1988 from four countries. The report from another country was prepared according to the EValuation Framework (document DGO/84.l) used in the 1985 evaluation!
In reviewing this report, the following points should be stressed:
1. In giving "1988 data" or "1982 data" one means data latest available as of 1988 (or 1982), irrespective of the actual reference year; hence, country data are not literally comparable.

EMlRC35/10 page 2
2. For quite a number of indicators, the latest data reported referred to the early 1980s or even the 1970s. This may be understandable when information is actually unavailable. However, some countries ignored certain indicator values previously published or officially communicated to WHO without offering alternative data; some maintained earlier data if recent ones were less "bright"; and some recent values reported seemed to be strikingly inconsistent with what was published or given before. The problem of contradictory figures in different official sources, or data with apparent internal inconsistencies, is persistent.
3. In the text, the names of some countries appear here and there. These are mentioned as examples, merely to substantiate the statements, whether favourable or unfavourable, and should not be construed as to exclude other countries.
4. There has been a change in the composition of EMR: Israel left before, and Morocco joined after, the First Evaluation Report. This change, per se, would have an effect, albeit limited, on comparing the overall Regional pictures in 1988 and 1982.
2. MONITORING PROCESS AND MECHANISMS
It was hoped that Member States would have appreciated the value of the First Monitoring Report in managing their own health systems, and would have adopted monitoring as an ongoing activity. WHO's request for information after a 3-year interval would then merely involve summarizing already available monitoring data. However, it seems that the health ministries in many EMR countries have not yet introduced monitoring as a regular systematic process at all levels of the health system. This gives the impression that they still do not recognize the value of monitoring as a decision-making tool in pinpointing those areas in which health programmes and services can be improved and resources most effectively applied. The reasons given for not taking that action include: (a) lack of a documented national health strategy to monitor; (b) lack of defined targets and time-frame; (c) lack of understanding of the monitoring process by health workers; (d) lack of personnel to do the monitoring, particularly at the sub-national level; (e) lack of baseline information or, in general, of an adequate health information system to support the management process; (f) difficulty of monitoring activities by other sectors; (g) lack of interest in monitoring on the part of donor agencies; and (h) absence of a central body for monitoring and evaluation.
Progress in the health field can easily be gauged using relevant indicators. Country information on the Global and Regional Indicators varied regarding their availability. The most often quoted as difficult to quantify related to the financial resources for health services in general, and for primary health care (PHC) in particular. This was mainly because existing budgetary and accounting systems do not permit such categorization (Democratic Yemen), or because some basic data needed originate from government sources outside the health sector, or from non-governmental organizations (NGOs) and the private sector (Egypt, Kuwait); in cyprus 60\ of immunizations and MCH services are carried out by the private sector. A few countries had difficulty in providing data on one or more of the following: (a) PHC coverage, particularly to quantify input by other sectors or in relation to urban/rural differentials; (b) policy indicators; (c) quality of health care; (d) nutritional status; (e) unemployment; (f) population growth; (g) infant and maternal mortality; and (h) community participation.

EM/RC35/10 page 3
The main obstacles to improving information support for monitoring HFA strategies continue to be: (1) lack of interest by health workers in providing the data. particularly at sub-national level; (2) lack of a central focus where all data are sent for analysis; (3) the verticality of data collection; (4) the problem of collecting data from the private sector. particularly if of a sizeable magnitude; and (5) prevailing local circumstances. Actions taken to overcome these difficulties include: (a) motivating data-providers by feed back of information; (b) establishing planning units at central and sub-national levels where needed; (c) carrying out surveys. e.g. of the private health sectors; (d) upgrading and decentralization of health statistical services; and (e) integration of data collection.
3. OVERVIEW OF THE REGIONAL SOCIO-ECONOMIC SITUATION
3.1. General sociopolitical development trends
The Regional socio-economic situation has deteriorated during recent years. In addition to a prevailing global economic recession. local conditions have had their own (and greater) impact. one may mention war in the Gulf area and the situation in Republic of Afghanistan. Lebanon. Somalia. Sudan and the occupied Territories. resulting in massive population movements. Also. the problem of refugees. of a sizeable magnitude in Djibouti Pakistan. somalia and Sudan. has aggravated the already difficult economic situation in the host countries. In addition. drought has caused severe problems in some countries.
3.2. Demographic trends
The Region's population is now about 350 million. with a relatively high population growth rate (an average of 2.4%. compared to 2.8% in 1982). For known reasons. a few countries have almost zero net increase (Republic of Afghanistan. Lebanon). while some Gulf countries have rates exceeding 4% due to expatriate manpower. though to a lesser degree at present than a few years ago. The crude birth rate (CBR) is still at least 45 per 1000 population in five countries; it is encouraging to note. however. that the Regional average for the CBR now stands at 39.7 per 1000. against 42 per 1000 in 1982. Regarding the crude death rate (CDR). it is reported to be five or less per 1000 in five countries. and 15 or more per 1000 in six countries. The Regional average CDR dropped to 10.4 per 1000. against 14 in 1982. By age. the population is typically young; the proportion of the population under 15 years of age exceeds 45% in seven countries; the Regional average is 47%. in addition to 3% aged 65 years and over. giving a dependency ratio of 100%. The proportion of urban population has increased from 38% (range 11-91%) to a current 41% (range 14-94%).
3.3. Economic and social trends (see Annex)
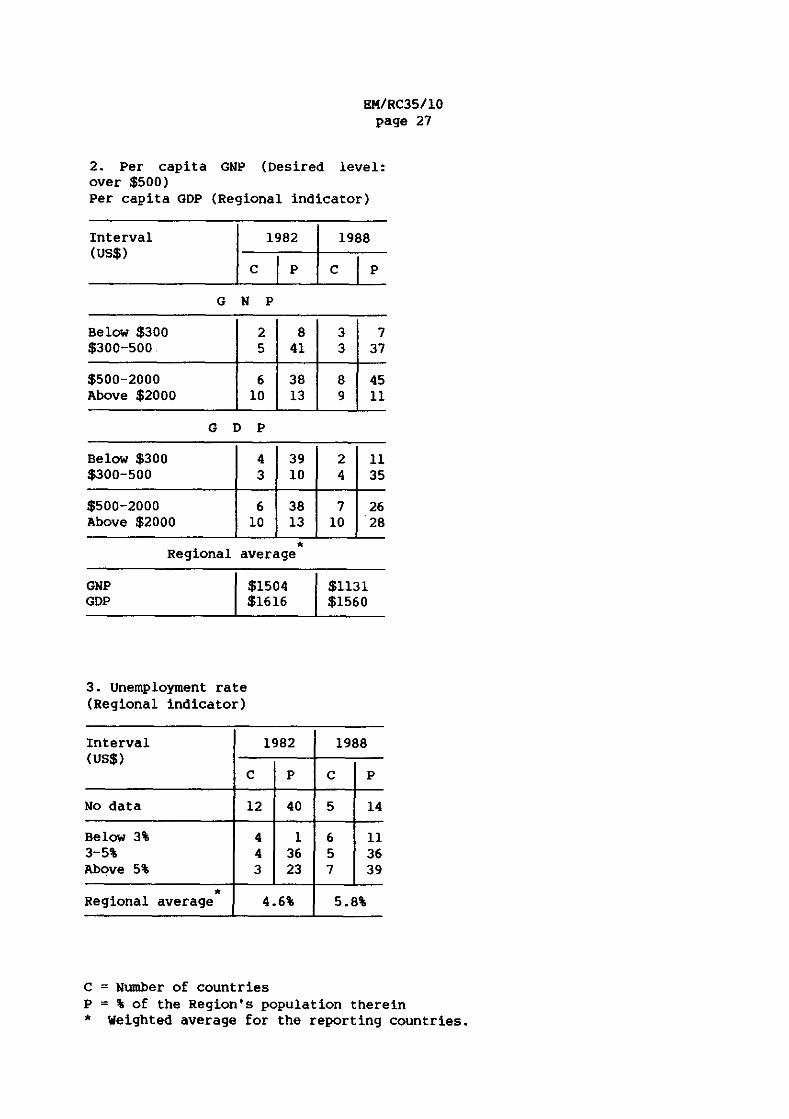
Global Indicator 12 calls for the per capita Gross National Product (GNP) to exceed US$500 while a Regional Indicator uses the Gross Domestic Product (GOP). The Regional average per capita GNP is well over US$500. But it has fallen by about one quarter from about US$1500 to US$1130 between 1982 and 1987. due to the slump in oil prices. The GOP has fallen slightly from US$1620 to US$1560. Only six countries. accounting for about 44% of the Regional population now have a per capita GNP below US$500. against seven. accounting for 48% of the Regional population. in 1982. The highest per
EM/RC35/10 page 4
capita GNP did not reach US$20 000 while it exceeded US$30 000 in 1982. Similarly, six countries with 46\ of the Regional population have a per capita GDP of less than US$500; the range has also narrowed, from about US$170-30 500 in 1982 to become about US$190-l3 400 most recently.
Reflecting such an economic situation, the average unemployment rate (a Regional Indicator) rose from 4.6\ in 1982 (data for 11 countries) to 5.7\ in 1988 (data for 18 countries). It now exceeds 10\ in four countries; the maximum was less than 8\ in 1982.
with respect to the adult literacy rate (Global Indicator 11), the desired level is over 70\ for both men and women. Normally "adult" here is defined as 15 years or over. A few countries use a lower age limit and, hence, their rates are over-estimated; when raw data were available (Bahrain), the rates were recalculated. The Regional average rose from 35\ to 45\; for males it rose from 47\ to 56\ and for females from 22\ to 32\. Eight countries (accounting for 12\ of the Regional population) crossed the 70\ level against five (with 3\ of the Regional population) in 1982. At the other end of the spectrum, five countries with 41\ of the Regional population (against seven with 52\ of the Regional population) have rates below 30\. Data on urbani rural differences were available for 12 countries; the rate was always higher in urban than in rural areas with averages of 62\ and 28\ respectively.
The nutrition situation has had some set-backs. Drought struck parts of Djibouti, Somalia and Sudan. Lately, devastating waves of locusts hit a few countries, adding to their problems. Local conditions in some countries hamper the logistics of food supply to affected population groups. Besides, due to soaring prices of food items, some countries have had to curtail importation of such items, while food aid to others was reduced.
4. HEALTH POLICIES AND STRATEGIES
The principal thrusts of health policies continue to be towards greater equity in providing health care, in one form or another as appropriate, using the PHC approach. Thus stress may be on extension of services to cover underserved population groups (Islamic Republic of Iran); on extension of the existing health insurance system (Egypt) or introduction of such a system (Saudi Arabia). There is always concern for the quality of care provided (Cyprus, Kuwait). However, only in about half of EMR countries is the health policy reflected in the overall national development policy.
For example, one of the main objectives of the Development Plan for Republic of Afghanistan is improvement of the health status of the people, so that productivity and, in turn, the rate of economic growth, would increase. The Economic Plan for Cyprus envisages replacing or remodelling all major hospital facilities. In TUnisia, the Seventh Development Plan envisages providing water, electricity and roads for underserved areas, and revising the relative contributions of State, individual and social security to health sector financing. It seems that some governments do not yet recognize the crucial importance of the health sector for national development.
There have been a few revisions of national health policies. Republic of Afghanistan updated its national strategy in 1987. In 1985, Islamic Republic of Iran integrated medical education and health services, renaming the Ministry concerned "Ministry of Health and Medical Education". More commonly,

EM/RC35/10 page 5
however, HFA strategies have been redefined within recent development plans (Jordan, Syrian Arab Republic, TUnisia). The following aspects of HFA strategies were the most frequently mentioned as requiring further strengthening, or for which actions had been taken: proper management of health services (Bahrain, oman); integrating vertical programmes (Islamic Republic of Iran); more effective linkages within and between different levels of the health care system (Yemen); reorientation of health workers' training towards PHC; community participation (Jordan, Kuwait); intersectoral coordination; upgrading health care facilities (oman); and development of the health information system. Related new legislation was promulgated (Islamic Republic of Iran, Kuwait, oman).
There is encouraging evidence of continuing political commitment to HFAl2000 at the highest official level (Global Indicator 1). As examples: Republic of Afghanistan's new constitution (1987) affirmed that health is a right of every individual. There were recent declarations by Heads of State in the same direction (Jordan, oman, TUnisia). Cyprus extended free medical care to more population groups. Democratic Yemen promulgated a decree (1987) accelerating immunization to reach 90\ of the target population by 1990. Iraq's health policy has recently focused on the vulnerable groups of infants, children and pregnant women, and instituted a "motherhood leave" in addition to the existing maternity leave (the latter now stretches to 72 days). Pakistan lately stressed the provision of basic health units to all "union councils" by 1990.
Obstacles to the development of national health policies include: (a) lack of understanding of the PHC approach; (b) differences in understanding among decision-makers when it comes to resource allocations; (c) vested interests in curative care; (d) insufficient community involvement; and (e) lack of a national health planning "focal unit". A few countries, despite a continuing commitment, still have no formal written HFA Strategy or master plan of action to implement it, the reasons given range from shortage of manpower and lack of managerial capability to absence of both intra- and intersectoral coordination. Attempts to overcome these problems are being made, e.g., by appointing coordinators, defining priorities, and requesting WHO collaboration in developing the Strategy.
The Regional Office has taken major steps towards HFA leadership development. senior officials from Egypt and Sudan attended a colloquium in Yugoslavia, and others from eight countries attended a colloquium in Thailand; women leaders joined in the delegations from five countries. Another colloquium in Thailand is planned for september 1988 for six countries. Two national colloquia were held in Pakistan. Senior delegations from Islamic Republic of Iran, Somalia and Sudan took part in a travelling seminar to Thailand and Indonesia. WHO Representatives and Regional Office staff joined the country participants. Brain-storming sessions were held with members of the "Parliamentary Health Committee" in Egypt. Religious leaders from Egypt were invited to the Regional Office with a view to motivating their support for HFA.
5. DEVELOPMENT OF HEALTH SYSTEMS
5.1. organization of the health system based on PHC
In general, PHC has been understood and fully accepted at the central level of the health system of Member States, but the case is different at

EMlRC35/l0 page 6
lower levels. Many physicians trained in the strictly curative approach have not yet been reoriented towards PHC. Economic recession. increasing running expenditures. and difficulties involved cuts from firmly established hospital allocations. hinder further expansion of PHC services. Other problems are: trade union interventions. and demands for tertiary level care from influential pressure groups. There is barely any community understanding of what PHC involves and how communities could participate in it. At the Ministry of Health level. some Member States have instituted a "directorate of PHC" or its equivalent. mainly for coordination purposes. However. PHC is not an independent programme to be delivered but rather an approach that should permeate all levels of the health services. The approach may differ in rural and urban areas.
Yet Member States have continued efforts to reorient and strengthen their health systems towards PHC. Actions taken include: (a) restructuring the Ministry of Health. with PHC approaching the Secretariat level (Bahrain. Egypt. Islamic Republic of Iran). while in Jordan hospitals have been separated from the Ministry of Health and attached to a special 'corporation' so that the Ministry devotes more time to PHC; (b) decentralizing administration (Kuwait. Libyan Arab Jamahiriya); (c) integrating vertical programmes (Islamic Republic of Iran. oman); (d) expansion of home visiting services (Egypt); (e) expansion of health education programmes and extension of rural health services (Republic of Afghanistan. Democratic Yemen. Pakistan); (f) reorientation of health workers towards PHC (Cyprus). Democratic Yemen has ceased building new hospitals except for replacement. Egypt held a national meeting to promote the concept of PHC. occasionally the expansion of facilities has been more rapid than the development of national capabilities. leading to a further drop in the ratio of nationals to expatriates among health personnel· (oman).
Coordination within the health sector. being essential to the proper functioning of the health system. has been improved in a number of cases. This may be achieved through regular interdepartmental meetings. or an Under-secretaries' Council (Egypt. Islamic Republic of Iran). or setting up a general coordination committee (Djibouti). However. much more remains to be done. for example. to ensure regular functioning of such committees. Solutions proposed include making efforts to integrate departments offering PHC services (Qatar); improvement of the health information system (Islamic Republic of Iran. oman); and legislation to regulate coordination of the private sector (Bahrain. where private clinics utilize governmental hospitals for infrastructure facilities and blood banks). The referral system is not satisfactory in many countries. In Bahrain. referral requests have now to be reViewed. before a final decision. by a senior family physician; this has reduced the number and improved the quality of referrals. TUnisia is acquiring 150 new ambulances to facilitate referrals.
With respect to intersectoral collaboration. a number of Member States do not yet have institutional mechanisms to ensure that health goals are integrated into their socio-economic development plans. There is a great need for recognition by governments that health care is essential for overall socio-economic development. and vice versa, i.e. that their development plans will have an impact on the people's health. A mechanism should be in place to ensure that health is not left out of the picture during development planning. and health care should receive its fair share of the national budget. This is particularly important since the health policies of many sectors (e.g. ministries responsible for water resources. education.

EMlRC35/l0 page 7
transport, agriculture and industry) have a direct influence on the health of the people. Besides, many health and health-related activities are carried out by sectors other than the health ministries. Examples of these include drinking water supply, sewage disposal and environmental sanitation, medical and other health personnel education, health education, school health, food handling, veterinary public health, pestiCide use, drug industry and importation, not to mention medical/health services provided direct to their personnel by the armed forces, police, oil companies, etc., and the private sector. The health sector has an input into all these policies and programmes.
More than half the EMR countries note that their intersectoral coordination on health matters is inadequate, despite the fact that HFA Strategies cannot work without the contributions of other sectors. Much more effort is needed to improve coordination as a matter of urgency. Such coordination is often carried out by various mechanisms at central level. These may take the form of: (a) general national health councils (Egypt, Jordan, syrian Arab Republic), and provincial health councils (Islamic Republic of Iran, Tunisia); (b) a central planning committee (Kuwait); (c) a central PHC committee (Jordan, oman); and (d) specific joint coordinating committees, e.g. on manpower training (Qatar), road safety (Cyprus), food hygiene, water and sanitation (Democratic Yemen, Saudi Arabia), EPI/MCH (oman), endemic diseases (Egypt), school health (Sudan), or conservation of the environment (Bahrain, Kuwait).· unfortunately, even where these committees and councils have been set up, they may not meet regularly. similar bodies at provincial. district and local levels are known to meet more frequently and often have more success in coordinating action (Republic of Afghanistan, Democratic Yemen, Islamic Republic of Iran). Coordination was said to have improved in Republic of Afghanistan after a visit of senior officials to Thailand to observe intersectoral coordination.
Where coordination has been lacking, this may be the result of extreme centralization in some health-related sectors. Other sectors may have seen no reason to collaborate. Other reasons mentioned include: a conflict of interests, a perceived threat to the independence of these other sectors, lack of provision for coordination, absence of a permanent coordinating body, or lack of an overall plan within which coordination could operate. Measures proposed to overcome these deficiencies inClude setting up a central coordinating body and holding intersectoral seminars.
5.2. Community involvement
In Cyprus, the National Health Committee, which advises the Ministry of Health on the Development Plan, includes community members. In many Gulf countries, "diwanias" (public meetings) are held where the people can inform the officials of their health needs. In Yemen, the community is fairly well developed around the confederation of the Yemen Development Association (CYDA) at governorate and district levels. LOcal people's councils often have health committees (Islamic Republic of Iran), and the boards of directors for health centres and hospitals have representatives of the community (Egypt). Generally speaking, however, there is little evidence of a policy or mechanism for involving the community in the planning and implementation of the national health strategy (Global Indicator 2).
on the other hand, in many Member States there is some sort of community involvement in health matters at the local level. This covers a wide range of forms, including: (a) participation in vaccination (Syrian Arab Republic;

EM/RC35/10 page 8
also, the People's Defence committees in Democratic Yemen listed children eligible for vaccination, contacted their parents, and followed up for the second and third doses); (b) participation in anti-malaria and leishmaniasis control activities (Democratic Yemen, Iraq, Youth Health Brigades in Republic of Afghanistan); (c) the selection and permanent support of a community health worker in cash or in kind, or providing maintenance costs of a rural hospital (Jordan, Pakistan, Yemen); (d) the digging of wells and latrines (Sudan); (e) providing supplies to health facilities (oman); (f) having a role in supervision (Egypt); or (g) construction of health centres (Sudan). Women's organizations are frequently prominent in this respect (Bahrain, Iraq, TUnisia). Also other groups such as the Red Crescent (Kuwait) and neighbourhood organizations such as the Comites des Quartiers, or local health committees (Egypt) may take part. To increase the communities' understanding of health problems and their solutions, measures taken include lectures to school and other groups, posters and presentations via the mass media (Bahrain, Islamic Republic of Iran, Pakistan), or mobile health education teams (Egypt). PHC staff go out to the villages to spread health messages covering such topics as thalassaemia (cyprus), drugs and smoking, AIDS, rodent control and road accidents. Reference has been made earlier to the motivation and involvement of religious leaders in Egypt. Some private establishments in Qatar bear the cost of advertisement for health posters.
Certain non-governmental organizations (NGOs) in some countries are also very active in the provision of services or in the health education field, although their activities may be restricted to urban areas. They do good work in arranging blood donation, teaching first aid and running mental health and rehabilitation programmes. It has been suggested by Bahrain and Syrian Arab Republic that they could also undertake studies on health problems.
Strong centralization of authority, a traditional reliance on the government to provide all services, high illiteracy rates among the public, limited participation by females, lack of education of the people who therefore do not understand that it is possible for them to take charge of their own health, and even apathy on their part, all these are examples of obstacles to community involvement. Also, the structural system in some countries renders community involvement limited, while it encourages it in others. Paradoxically, free medical care may actually discourage people from taking preventive or health-promotive measures. Similarly, the concept of voluntary work may be lacking, due to unemployment. The solution to these problems can only be through health education.
5.3. Managerial process and mechanisms
Many Member States have made further progress in improving their managerial process to implement their HFA Strategies. Reference has already been made to reorganization of health services, and to training activities in management. Obstacles to the development of the managerial process have varied. Examples of these are: (a) reduction in available resources; (b) lack of qualified manpower, whether due to weak staffing at Health Ministry level, or to insufficient number of nationals to be trained, especially in management; (c) lack of information support for management; (d) absence of necessary legislation and motivation; (e) existence of rules and procedures that make reorganization of the Health Ministries difficult. To overcome these deficiencies, measures taken include the reallocation of resources and decentralization of authority to sub-national levels, establishment of new posts and recruiting consultants, holding management training workshops

EM/RC35/10 page 9
particularly for intermediate-level personnel, integration of vertical programmes and improvement of information support. The concept of the district health system approach, integrating health and socio-economic development, is being promoted, and activities in this direction are being implemented (Democratic Yemen, Islamic Republic of Iran, Somalia, Sudan). Improving the health information system leads to improved management.
5.4. Health manpower
Not many Member States of the EMR have a health manpower development (HMO) plan and, where one does exist, it may not have been implemented or revised in accordance with changing needs. Thus, for example, Republic of Afghanistan prepared a long-term HMO plan. Bahrain had one for 1986-1990 which is being revised for 1988-1992. Islamic Republic of Iran updated a plan for 1980-2002. The absence of such plans leads to imbalance and wasteful situations, e.g. more doctors being produced than can be employed nationally, while there is an acute shortage of nurses and mid-level staff. This is becoming more and more of a problem in view of the declining "market demand" for expatriate health manpower in Gulf countries. several such countries have introduced a policy of gradual replacement of expatriates by nationals.
Member States are making big efforts to meet their needs in health manpower. Some have started their own medical schools (Bahrain, oman, United Arab Emirates, and Yemen), while others employ expatriate staff. The Regional average of physicians per 10 000 population has dropped from 5.4 in 1982 to 4.5 in 1988. The availability of dentists remains as unsatisfactory, with a corresponding average of 0.59 against 0.65 per 10 000 population. The picture regarding nursing/midwifery personnel has shown a minor improvement, the Regional average having risen from 8.8 to 9.0 per 10 000. Efforts are also being made in the area of training of various categories of health personnel: for example, Bahrain has begun a course for dental hygienists, and oman has introduced courses for physiotherapists and radiographers. Pakistan is training multipurpose health workers to provide an integrated PHC service; similarly, there are the health guides in Democratic Yemen. Qatar has waged a successful campaign to attract women nationals into nursing, with a College of Nursing due to open in 1988. Other categories include female community health workers (Yemen), male nurses (Egypt), technicians for maintenance and repair of equipment and health statistics technicians (syrian Arab Republic).
some countries have revised the curricula for paramedicals, reorienting them towards PHC (TUnisia), or those of medical schools towards communitybased education (Egypt). Occasionally, lack of teaching staff has affected the continuation of certain training programmes. Several countries have instituted continuing or in-service education for health staff. Cyprus, in collaboration with Greece, has introduced postgraduate training programmes for physicians at the main district hospitals. Bahrain has even extended continuing education to the private sector, requiring it as a condition for renewal of licence.
The problem of within-country equitable distribution of manpower remains to be solved, except in Bahrain, Cyprus, Kuwait and Qatar; each has very small rural populations, relatively small surface area of the whole country, and excellent road communications. A general problem is unwillingness of medical and nursing staff to serve in rural areas. Data on within-country distribution were available for eleven countries. In both Somalia and Sudan,

EM/RC35/10 page 10
some parts of the country have. relatively speaking. more than 100 times as many physicians as other parts; some governorates in Democratic Yemen have no dentists. and the few dentists available in Somalia are located exclusively in the capital city. Fortunately. the gap is not as large with respect to nursing/midwifery personnel. However. the absence of a formal "staffing pattern" has led to inequity of distribution of manpower. especially regarding female workers.
The main obstacles to the implementation of health manpower plans have been: (a) lack of career structures. (b) vested interests. (c) lack of an overall health plan within which a manpower plan can be developed and (d) lack of financial incentives. which basically comes down to lack of funds.
Djibouti is solving part of its manpower shortage by integrating traditional birth attendants into the health services. Pakistan has a new policy of giving loans to medical graduates to set up private practice; such loans are larger for rural areas and the Ministry of Health. Special Education and Social Welfare has recently appointed 6000 more doctors. most of them to rural posts. securing the motivation and commitment of health workers to PHC also continues to be a problem. A few countries have improved the terms of service of PHC workers. including special allowances. provision of accommodation and more rapid promotion for staff working at the peripheral level. as well as incentives for training. both within and outside the country. Revision of course curricula. holding of in-service training workshops. and improved supervision are also being tried.
5.5. Research and technology
Some countries. albeit very few. have a national policy on the selection and use of health care technology. Pakistan. for example. subjects new technology to review as to whether it is appropriate and based on the needs and priorities of the target community. Several others. though they have no national policy. also use interdepartmental. local government or ad hoc local committees to review the need for. and appropriateness of. new technology. similarly. less than half of the countries have a national research policy. For those that do. the main thrusts of these policies are research on health problems that are national priorities. such as endemic diseases. nutrition. BPI/MCH. costing of medical care and traditional medicine. Regarding research coordination. some countries have medical research councils which carry out that function. Others may have research institutes which could. but do not at present. coordinate national research.
The principal obstacle to developing national research and technology policies is that research and technology may not be seen as priorities and. consequently. no funds are made available for them. Hence the countries concerned lack qualified research manpower and facilities. Inadequate dissemination of research findings is another problem. A few other countries are making a determined effort to overcome these obstacles by attracting external funds for research; use may be made of such funds to improve both the career structure for research workers and the research facilities. as well as to support the publication and dissemination of the results of research. It is noted. however. that external support for research is usually time-limited.
special mention may be made here of the child health surveys being carried out in the Arab countries of the Gulf area. with financial/technical

BM/RC35/l0 page 11
support mainly from AGFUND, WHO and UNICEF. Reference may also be made to the proposed Pan Arab Project for Child Development (Papchlld project), for a series of surveys in other Arab countries through the League of Arab States (LAS), with financial inputs from LAS itself, AGFUND, UNFPA, UNICEF, WHO and the UN Statistical office.
5.6. Resource utilization and mobilization
Most countries lack a master plan for the mObilization of resources, separate from their medium-term (five-year or so) national health plans. Even where country Resources Utilization (CRU) Studies were carried out, they were not taken up seriously for fund-raising. Because of local situations, health services may not be accorded priority. Yet, many Member States have taken steps to reallocate and optimize existing resources, and to mobilize additional internal support. Thus in Bahrain, staffing patterns and extent of services in the health centres vary according to needs of the community served. Cyprus is increasing the proportion of management staff, nurses and health visitors that are being trained. In Islamic Republic of Iran, Parliament approved that the Ministry of Health and Medical Education may use all income collected from hospital fees as additional funds for strengthening medical services and health activities. Pakistan is shifting emphasis from curative to preventive and promotive health services, and is upgrading its rural services. Sudan allocates staff and funds to each health region in proportion to its needs, as determined by a needs assessment study. The concept of payment for some health services has been accepted by several countries which formerly provided free medical care. United Arab Emirates instituted small charges for health registration and annual renewal; Kuwait requests fees for certain services; Bahrain is extending employee health insurance schemes to all companies with fifty employees or more. In other countries, communities are being encouraged to participate, in cash or kind, in the support of community health workers or community health campaigns.
Meanwhile, various attempts are being made to optimize the use of available resources. Cost-effectiveness studies are being carried out, costrationalization programmes instituted and savings thus made in secondary care being shifted to PHC (Bahrain). services are being integrated, and a certain percentage of income generated from hospital care goes for water supply and TBA training (Islamic Republic of Iran). Better coordination is reducing duplication of services; management training is resulting in more efficient management; and the monitoring and evaluation process itself is being used effectively to review programmes and services with a view to replanning. Many Gulf countries (Bahrain, Qatar, oman, United Arab Emirates) have reduced the cost of specialized treatment abroad by sending patients to Saudi Arabia or Kuwait instead of to Europe. The Secretariat of Health for Arab Countries of the Gulf Area performs a valuable service by facilitating the bulk purchase of drugs and supplies at favourable prices for its Member States. These measures are seen as adequate by the countries that are utilizing them; however, others suffer from lack of data, especially budgetary data, on which to base decisions. There is also a problem in countries where a large proportion of health care is provided by sectors outside the Health Ministry, such as the private sector (Lebanon); no solution has so far been suggested for this problem.
5.6.1. Health expenditure (See Annex)
Global Indicator 3 calls for at least 5\ of the GNP to be spent on health. Data for 1982 for 13 countries showed an overall average of 3.0\

EM/RC35110 page 12
(range 1-10\). As of 1988 (data for 11 countries). the average has superficially increased to 4.9\ (range 3.2-12.6\). The figure was less than 5\ in six (out of 11) countries in 1988. against 10 (out of 13) countries in 1982. Very probably the increase in the percentage is not real. and is merely a reflection of the marked decrease in the GNP. as mentioned in section 111-3 above. Data for 1988 show that the average proportion of the GNP spent by the Ministry of Health (data for 16 countries) was 3.0\.
Since the material included under "national health expenditures" varied between one country and another. it may be advisable to look at the more specific Regional Indicators. The average recurrent expenditures of the Ministries of Health in 1988 (data for 20 countries). expressed as a percentage of recurrent government expenditures. was 6.9\ (range 1.8-15.9\) against 3.2\ (range 1.5-26.5\) in 1982 (data for 13 countries). The corresponding average percentages of total (recurrent plus developmental) government expenditures were 4.7\ against 3.1\ in 1982. Though the figures in 1988 seem to have increased over those in 1982. it is noticed that the gap between the two percentages in 1988 (recurrent 6.9\. total 4.7\) is wider than in 1982 (when they were 3.2\ and 3.1\ respectively). This implies that. due to the economic situation. less attention is being paid to investment in health. with governments simply concentrating on meeting daily expenditures. Public expenditure on health (by Ministries of Health and others) accounts for 9.7\ of total public expenditures.
The per capita GNP has dropped as compared to 1982. of necessity. it is expected that government expenditures will drop as well. It is surprising that the per capita expenditure by Ministries of Health has dropped from US$39.9 (with a range of US$3.4-298) in 1982 (data for 13 countries) to US$30.2 (range US$1.7-450) in 1988 (data for 23 countries). It was less than US$lO per person in five countries which account for almost 50\ of the population in the Region (against two countries only in 1982). The picture becomes more disturbing if one places it alongside the soaring cost of commodities and of services.
Regarding the percentage of national health expenditure devoted to PHC (Global Indicator 4). the Regional average increased from 31\ in 1982 to 53\ in 1988. Member States made no comment on whether they considered the percentage they spend reasonable or not. Notably. data were available for 14 countries only and. in calculating that percentage. a few countries included all health expenditures by the local governments; it is known that such expenditures are not exclusively for PHC in the strict sense of the term.
5.6.2. Bquity of distribution of resources (Global Indicator 5)
Comments have been made earlier on within-country variations in the distribution of health personnel. Apparently there was some difficulty in providing accurate data on health personnel in PHC. In 10 out of 12 countries that gave data. the ratio of physicians per 10 000 population was much lower in PHC than in health services in general; the Regional averages were 1.8 and 4.5 physicians respectively. unexpectedly. the drop regarding nursing/ midwifery personnel in PHC is greater; the Regional average is 3.3 per 10 000 population in PHC. against 9.0 in health services in general.
The overall average number of total beds per 10 000 population was 13.6 (with a range of 6-62 beds) against 12.9 beds in 1982 (range 2.7-67 beds). Data for nine countries show that within-country variations in the relative
EM/RC35/10 page 13
availability of hospital beds are far less marked than is the case with health personnel. With respect to PHC units (or equivalent). the Regional average was 1.2 units per 10 000 population (range 0.2-5.5 units).
unfortunately. a relative increase in expenditure on PHC does not guarantee that all underprivileged groups receive better care. Some countries with extensive urban slums may need to increase expenditure on PHC for these urban dwellers. Country health information systems are generally not geared to providing the detailed data needed to make such analyses. nor have national norms been established. say for the proportion of physicians and nurses to the population. There is an increasing call for this kind of information for planning purposes.
6. INTBRNATIONAL ACTION
6.1. International transfer of resources
Many of the EMR countries. but by no means all. have made a systematic analysis of the needs for external support for their HFA Strategies (Global Indicator 6). Up to 1985. some countries. particularly among those in the Gulf area. were in the position of not requiring external support; they even declined their country allocations from WHO. The countries that have made such analyses have defined the following priority needs: consultant services; reorganization of health services; construction or rehabilitation of facilities; equipment; training fellowships or medical education in general; strengthening of health information systems; logistics; and various programmes such as water and sanitation. immunization. malaria. diarrhoeal diseases control. and health education.
Bxternal support received has generally covered most of these priority needs. Republic of Afghanistan received only 20\ of external resources requested while cyprus received almost 100\. Generally. adequate support was not received for: construction of PHC centres or rural hospitals. particularly in remote areas; transport; management; planning; health information support (including computers); water and sanitation; health education; and research. Several of these areas were also mentioned in the first evaluation report as not having received adequate support.
Most EMR countries have not been in a position to give financial support to other countries. although there has been a considerable amount of Technical Cooperation among Developing countries (TCDC). Even those who used to provide it. have now had to reduce external support due to the prevailing economic situation. and more stringent measures are applied before support is offered.
6.2. Intercountry cooperation
Intercountry cooperation. both technical and to a lesser extent economic. has been developing rapidly. Arab countries of the Gulf area are cooperating in all areas of development. including health. They have established bulk purchase and manufacture of drugs and equipment. also drug and food control committees. There is considerable activity in the training field. with exchange visits. places provided in health training institutions for students from other countries (e.g. College of Health Sciences and the Arabian Gulf University in Bahrain). and intercountry mobility of qualified staff. In this respect. the excess production of physicians by some countries

BM/RC35/10 page 14
(e.g. Egypt. Pakistan. Sudan and syrian Arab Republic) has been helpful to recipient countries facing a shortage of staff. as well as being a source of income to the supplying countries. Exchange of information. and of expertise. as well as supply of drugs. are other forms of intercountry cooperation.
There are numerous examples of bilateral agreements in the field of health. between countries in BMR and others. both in and outside the Region. The South Asian Association of Regional cooperation links Pakistan with a number of countries outside EMR in various disease control programmes. Similarly Sudan has information exchange arrangements with a number of African and Arab countries. and joint disease control programmes with its neighbours Egypt. Kenya and Uganda. Gulf Arab countries have joined to achieve economies by bulk purchase of drugs and supplies. Bahrain. Oman. Qatar and United Arab Emirates have reduced the cost of referring patients for specialized treatment abroad by sending them to similar facilities in Kuwait and Saudi Arabia. Such cooperation has been facilitated through various mechanisms. from bilateral and multilateral agreements to the setting up of various bodies such as the aforementioned South Asian Association of Regional cooperation. the Secretariat of Health for Arab Countries of the Gulf Area and the Council of Arab Ministers of Health. The Regional organization for the Protection of the Marine Environment (ROPMB) also represents intercountry cooperation between some BMR countries.
Goodwill and friendship pave the way for adequate intercountry cooperation. Political "affiliation" is also a factor. on the other hand. due to the local political situation in some countries. there is limited contribution to and interest in supporting health development programmes.
6.3. International cooperation
An outstanding example of the way in which WHO has been supporting the implementation of HFA Strategies in BMR has been the bilateral Joint Programme Review Missions (JPRMs). taking place annually. in the countries and alternating with the visits of senior national health (and healthrelated) officials to the Regional Office. These activities bring together the responsible nationals and WHO staff to review progress of the national Strategy and the relevance of activities supported by WHO. both to reprogramme any unspent funds and to programme future budgets in the light of priority needs. Bfficiency in the use of WHO resources at country level has been increased by the appointment of national programme officers. better utilization of nationals returning from fellowships. holding local training workshops rather than sending staff abroad. and setting up a committee(s) to supervise and follow up on WHO-supported programmes.
Goodwill on both sides. together with the JPRMs and the visits to BMRO. have contributed to productive cooperation between countries and WHO. The most often cited difficulties in cooperation have been problems of rapid communication with the Regional Office. particularly when there have been deadlines for action; this problem has been ameliorated through using telefax services. There have also been occasional problems with short-term consultants. where last-minute substitutions were made. and countries have felt that a few WHO consultants were not the most appropriate (although their assignments had previously been cleared by the countries concerned). Inadequate effective information exchange has also been cited. Solutions suggested include some easing of bureaucratic and financial restrictions and longer notice for filing deadlines. The Regional Office is. of course. studying ways of improving the situation in the various areas.

EMlRC35/10 page 15
The international agencies mentioned most often by Member States as being involved in their health programmes are the UN agencies, namely: UNICBI', UNDP, UNI'PA, and to a lesser extent, UNIDO, UNBSCO, I'AO and UNHCR. Others mentioned include the Buropean Bconomic community (BBC) , the Commonwealth FUnd for Technical Assistance, the Asian Development Bank, and AGI'UND, as well as numerous bilateral aid groups and NOOs. Unfortunately, virtually no mechanisms exist at country level to coordinate the activities of these different agencies. Some countries are reluctant to disclose to one agency what they receive from others. In some cases the UNDP Resident Representative coordinates the work of the UN agencies, but there is no system that includes the other groups. There is no doubt that countries would benefit by setting up formal mechanisms for reviewing all areas of international cooperation in health so as to avoid duplication and to ensure that no gaps are left. This is an area in which progress still needs to be made.
7. AVAILABILITY OF HEALTH CARB (GLOBAL INDICATOR 7)
Since the time of the first monitoring report, progress in extending coverage with the essential elements of PHC to the Region's people has been mixed. Below is a summary of progress since the baseline year 1982, through the 1985 evaluation (see Annex).
7.1. Water and sanitation
Population coverage by a safe drinking water supply in the home or within 15 minutes' walking distance has increased from 53\ in 1982. to 61\ in 1985, then 63\ in 1988. No country now has less than 20\ coverage (two in 1982), and 12 countries accounting for 30\ of the Region's population, have a coverage of 80\ or more, (against 10 in 1982. accounting for 9\). It should be noted that for many countries. the latest available data refer to 1985 or earlier. hence the minimal changes since 1985.
Urban water supply is. of course. in better shape. Coverage has risen from 78\ in 1982. through 85\ in 1985. to 90\ in 1988. and the minimum has gone up from 28\ to 38\. Actually 19 countries (with 75\ of the Region's urban population) now reached 80\ coverage or more for their urban population. against 13 countries in 1982. Rural water supply is not as satisfactory. Coverage has only increased from 36\ in 1982 to 44\ in 1985, and down to 43\ in 1988. although the minimum has increased from 6\ to 17\. only eight countries (with 65\ of the Region's rural population) now have less than 50\ coverage with water supply for their rural population. against 12 countries in 1982.
Coverage with hygienic waste disposal in the home or immediate vicinity has barely increased from 41\ in 1982 and 1985. to 45\ in 1988. Now ten countries (with 26\ of the Region's population) have reached the 80\ coverage mark. against only four (with less than 3\ of the Region's population) in 1982. Noticeably data were available for all Member States in 1988. against 18 in 1982.
Urban sanitation presents a brighter picture: data were available for all countries (against 15 in 1982). The average was 63\ in 1982, increased to 73\ in 1985 and reached 79\ in 1988. Fifteen countries, with 66\ of the Region's urban population. have reached a coverage of 80\ or more, against four countries only in 1982. In contrast. the picture for rural sanitation is

I!M/RC35/10 page 16
really gloomy. Though the number of report ing countries has increased from 12 to 23 (in itself this is good), the Regional average coverage remained unchanged at 22-23\ throughout, and 13 countries with almost 80\ of the rural population in EMR still have rural sanitation coverage of less than 50\. It is quite clear that rural sanitation has a long way to go in this Region, where nearly 60\ of the population are rural.
7.2. Immunization
For the sake of consistency, data in this section of the paper are derived from what is being compiled by the &PI programme in WHO/Headquarters and not from figures given in the Monitoring Reports.
DPT: The Regional average increased from 24\ in 1982 to 45\ in 1985 then 67\ in 1987; the minimum coverage has increased from 2\ to 14\. Now only five countries, accounting for 18\ of the Region's live births, have coverage of less than 50\ (against 17 countries in 1982), and ten countries (compared to one) have reached the 80\ mark.
Poliomyelitis: Improvement in coverage is similar to that of DPT. The Regional average rose from 28\ in 1982 to 45\ in 1985 then 65\ in 1987. No country (against nine) has coverage of less than 10\, and five countries, accounting for 18\ of live births (instead of 17), have coverage of less that 50\. Ten countries (compared to three) have reached the 80\ mark.
Measles: For measles a more rapid increase in immunization coverage is shown, from 22\ in 1982, to 39\ in 1985, to 61\ in 1987, and the minimum became 15\ (instead of 1\). Only five countries, (instead of 18) accounting for 18\ of live births, have coverage of less than 50\. Seven countries (compared to none) have reached the 80\ mark.
BOG: The picture here is somewhat different. Though the Regional average rose from 22\ in 1982 to 51\ in 1985 then to 67\ in 1987, still six countries (out of 18 for which data are available) have coverage of less than 50\. Where tuberculosis is not a problem, some countries do not give BOG to infants and their policy is to immunize children at school entry. Six countries have reached the 80\ coverage mark.
Tetanus toxoid: The immunization of pregnant women with two doses of tetanus toxoid (TT) still has a long way to go to become satisfactory, although, relatively speaking, improvement has been more marked. The average rose from 4\ in 1982 to 9\ in 1985 then to 20\ in 1987. Three countries have reached the 50\ coverage mark while the maximum was 24\ in 1982. The apparent rare incidence of neonatal tetanus in some countries (hence they do not require immunization), may be one reason for this low coverage. Repeated pregnancies at short intervals, and the fact that TT administration need not be repeated once the mother has been previously fully immunized, may be another factor.
Incidence rates (per 100 000)
This Reqional Indicator calls for the incidence rates per 100 000 population for the six EPI target diseases as a direct measure of the impact of immunization. Rates reported for tuberculosis, pertussis, measles and total tetanus appear to be unrealistically low; those for diphtheria, poliomyelitis and neonatal tetanus are better but still much underestimated.

BM/RC35/10 page 17
The incidence rate for pertussis was 51 in 1982 and 33 in 1987. The rate for measles dropped from 90 in 1982 to 49 in 1987, and the maximum rate was about 460 against 1400 in 1982. There was a slight increase in the incidence rates for tuberculosis (all forms), from 73 in 1982 to 76 in 1987, probably due to better reporting. On the other hand, respiratory tuberculosis showed some drop in its incidence, from 42 to 37.
Regarding diphtheria, the incidence rate dropped from 2.0 in 1982 (data for 19 countries) to 1.3 in 1987 (23 countries). seven countries (representing 3.7\ of the Region's population) reported no cases (against three in 1982). Poliomyelitis showed a slight drop, from 0.83 in 1982 (data for 20 countries) to 0.77 in 1987 (23 countries). Five countries, representing 2.0\ of the Region's population, reported no cases (three in 1982), and 11 more countries (with 41\ of the Region's population) have rates below one per 100 000. Tetanus (all forms) showed increased incidence, from 5.3 to 7.5, again probably due to improved reporting, since five countries reported no cases of neonatal tetanus, and the average incidence rate now (for 21 countries) is about 2.0 per 1000 live births (197 per 100 000 live births).
7.3. Local health care (See Annex)
This part of the Global Indicator 7 refers to the availability of treatment for common diseases and injuries, and a regular supply of at least 20 essential drugs, within one hour's walk or travel. There has been an improvement in this area. The Regional average rose from 69\ in 1982 (data for 17 countries only) to 73\ in 1985 then to 79\ in 1988 (for 22 countries). Fifteen countries, with 62\ of the Region's population, have reached the 80\ coverage mark (against 10, with only 26\ of the population, in 1982).
Urban/rural data were available for 18 countries (against 10 only in 1982). The Regional average coverage is 96\ (minimum 50\) for the urban population (in two countries only below 80\). and 64\ (minimum 15\) for the rural population (below 80\ in six countries).
7.4. Maternal and child health (MCH)
It is estimated that the population aged under 15 years amounts to about 165 million, and the live births close to 14 million per year. Such a large target population gives coverage by MCH services special importance.
care during pregnancy: Data were available for 20 countries, against 11 in 1982, regarding the percentage of women attended by trained personnel during pregnancy. The Regional average now stands at 52\, against 39\ in 1985 and 28\ in 1982. In five countries, which account for 39\ of live births in the 20 reporting countries, coverage is less than SO'll, while it reached 80\ or more in seven others that account for a mere 9\ of live births. considering urban/rural differentials, coverage in the urban population was less than 50\ in one out of 13 reporting countries, while for the rural population it was so in three out of 10 reporting countries.
Care at childbirth: 22 countries provided the necessary data, against eight only in 1982, a big achievement in itself. The average now is 58\, up from 27\ in 1985. For the countries that provided data, coverage was always higher in the urban than in the rural population. Institutional deliveries account for an average of 20\ (range 2-99\) for the 16 reporting countries which account for 52\ of all live births; the figure was 15\ in 1985.

EM/RC35/l0 page 18
Infant care: Data on the percentage of children cared for by trained personnel up to at least one year of life were available for 15 countries that account for 76\ of live births (compared to seven countries in 1982). The Regional average was 82\. compared to 41\ in 1985 (for 14 countries). Coverage was less than 50\ in two countries only. and reached the 80\ mark in seven countries. The minimum coverage was 48\. compared to 8\ in 1982.
8. ENVIRONMENTAL HEALTH
There was same degree of alarm in the Region following the Chernobyl accident. and the measures taken varied from one country to another. This attracted attention to the need for more strict surveillance of exposure to ionizing radiation. There were claims of resorting to chemical warfare in the war between Islamic Republic of Iran and Iraq. but it was formally denied. Toxic gases were said to have been used against demonstrators in the occupied Territories. leading to abortion in a number of women. or to a fear of occurrence of infertility among the affected females. Lately. the disposal of chemical wastes along the Lebanese coast came into the news.
9. HEALTH STATUS
9.1. General review
The number of confirmed malaria cases in 1987 was about 540 000. up from about 305 000 only three years earlier (1984). There was an outbreak of cholera in Somalia in 1985-86 that reached approximately 25 000 cases; limited outbreaks were also officially notified from Djibouti. Islamic Republic of Iran and Kuwait. The incidence of meningococcal meningitis has increased in some countries. reaching epidemic level in Sudan. The number of EMR countries reporting AIDS is increasing. reflecting riSing attention to the disease.
A more detailed situation analysis of such diseases may be found in the Annual Report of the Regional Director (for the period 1 July 1987 to 30 June 1988).
9.2. Infant mortality rate (IMR)
Global Indicator 9 calls for the IMR for all identifiable subgroups to be below 50 per 1000 live births.
The IMR in the Region made an impressive drop from III per 1000 live births in 1982 (range 16-182) down to 97 in 1985 then to 81 in 1988. It is already below 50 in 11 countries representing 57\ of the Region's live births. against eight countries (with 5\ of the Region's live births) in 1982. Urban/rural data were available for eight countries (four in 1982); the IMR is usually much higher in the rural population.
It is to be noted that some countries reported a spectacular drop. even down to less than one half of the levels reported 2-3 years earlier in 1985 (Islamic Republic of Iran. oman). This may be partly a revision-downward of estimates following recent surveys. and partly real due to successful immunization and diarrhoeal disease control programme~.

EMlRC35/10 page 19
9.3. Maternal mortality rate (MMR) (see Annex)
Data on this Regional Indicator were available for 20 countries (14 only in 1982). The average is 27 per 10 000 live births (compared to 37 in 1985 and in 1982). Though a few countries reported no maternal deaths at all, most likely the rates are underestimated in several countries, as a result of faulty certification of cause of death. This may be deduced through comparing the reported MMRs and the reported figures on coverage by care by trained personnel during pregnancy and at childbirth.
9.4. NUtritional status of children (see Annex)
Global Indicator 8 calls for at least 90% of newborns to have a birthweight of at least 2500 g. Data were available for 22 countries, and gave a Regional average of 87% with a range of 75-100% (compared to an average of 86% for 18 countries in 1985 and an average of 84% for seventeen countries in 1982). In many cases the figures were derived from the findings from limited hospital-based studies, and some of the reported figures seem to be rather unrealistic.
The figure was less than 90% in six countries (representing 48% of live births in the reporting countries). Actually, if one excludes Pakistan, with the largest number of live births and the highest proportion of low birth weight, the Regional average would become 91.3%. Urban/rural data were provided by seven countries only, and the proportion was always lower in the rural than in the urban areas.
Global Indicator 8 also calls for at least 90% of children to have a weight-for-age that corresponds to reference values defined by WHO. Data for 14 countries gave an average of 73%, compared to 60% for eight countries in 1982. EVidently intercountry comparability is really difficult because country data are usually based on small samples, at different ages, and in different subgroups in each country. Taking the data at their face value, the proportion was below 90% in eight countries, representing 66% of live births in the 14 reporting countries.
Though it was approved to add as a Regional Indicator weight-for-age at school entrance, four countries only provided this information.
9.5. Life expectancy (Global Indicator 10) (see Annex)
The desired level is over 60 years. All countries provided the data, although two did not provide them separately by sex (five countries in 1982). The Regional average showed an increase of five years over the average in 1982 (and 4.1 years since 1985), almost reaching the desired level (which now stands at 60.1 years; 58.4 for males and 60.6 for females). Sixteen countries, accounting for 82% of the Region's population, have reached the 60-years mark (compared to 12 with 32% of the Region's population in 1985 and to 10 with a mere 13% of the Region's population in 1982). Life expectancy is still below 50 years in two countries (five in 1982). This is a big advance. The increase in life expectancy since the 1985 evaluation was 6-10 years in three countries, mainly as revised estimates that followed a revision of IMR estimates.

10. THE PALESTINIAN POPULATION
EMlRC35/10 page 20
This chapter is included in accordance with resolution EM/RC31A/R.7. It is abstracted from the 1987 Annual Report of the Director of Health of UNRWA, as no recent information has been received from the Palestine Red Crescent society. The data refer to the refugee population registered with UNRWA, which amounted to 2.23 million at the end of 1987.
The annual rate of population increase is 2.8\, and the CBR is 30 per 1000 population, with an average family size of six persons. The IMR is estimated at 30-40 per 1000 live births; the big drop is mainly due to the decrease in the number of infant deaths from gastroenteritis and respiratory diseases. Coverage with immunization is almost complete, and no cases of diphtheria, poliomyelitis and adult tetanus (with only one case of neonatal tetanus) occurred during 1987. About 75\ of children under three years and 75\ of the expected number of pregnant women received care at the MCH clinics. With respect to deliveries, 72\ occurred in maternity centres or hospitals and 28\ at home (attended by UNRWA-trained midwives or by traditional birth attendants). The incidence of malnutrition (first, second and third degree together), as expressed in terms of weight-for-age, was 4.6\ for infants under one year, 5.1\ for children 12-23 months, and 2.1\ for children 24-35 months. A study at the West Bank field of operation revealed that 10\ of pregnant women registered at MCH clinics were at high risk, and 12\ at moderate risk.
NO cases occurred during 1987 of several diseases (e.g. malaria, cholera, other diseases subject to international health regulations, schistosomiasis); measles, pertussis and tuberculosis are under control. However, the incidence of communicable diseases transmitted through environmental channels, including diarrhoea among children, dysentery, infectious hepatitis and typhoid, were on the increase. This emphasizes the need for major improvements in camps' sanitation infrastructure to interrupt disease transmission. Regarding water supply, 85\ of the population were served by private connections and 15\ by public points. On the other hand, 97\ of the population were served by public latrines and 3\ by private latrines.
The state of unrest which prevailed in the occupied territories of the West Bank and Gaza fields of operation led to increased casualties. FUrthermore, general clinics, school health, environmental health and supplementary feeding services were disrupted in many camps due to curfew measures, or limitations on movement of staff, refugees and supplies.
11. SUMMARY AND CONCLUSIONS
The overall assessment of progress is definitely on the positive side, yet mixed, in the sense that progress has been quite marked in certain areas and limited in others.
To start with, it should be reiterated that the mere increase in the number of countries providing data on most indicators is very encouraging in itself. One should know where he stands in order to be able to know in which direction and how far he has moved.

BM/RC35/10 page 21
11.1. Development of health system based on PHC
1. sustained political commitment to HFA Strategies. translated into giving more attention to the health development.
This needs to be sector in national
2. Big efforts towards HFA leadership development.
3. Good progress in the reorientation of health systems Bstablishment of separate units for PHC, whether at the "Under-secretary" level. could lead to better coordination, approach should permeate all levels of health services.
towards PHC. "Director" or
but PHC as an
4. Reasonable progress in intrasectoral coordination. Greater attention needs to be paid to appropriate and adequate intersectoral coordination, and to follow up on mechanisms initiated for the purpose.
5. Insufficient community involvement, despite the prevailing economic condit ions.
6. Greater attention should be given to: (a) health systems research in order to identify priority problem areas and to solve problems in implementation; and (b) the role of NGOs.
7. Substantial efforts towards training of various categories of health personnel. More is needed towards reorienting existing staff in the concept of PHC, and towards equitable distribution of manpower, particularly to rural areas or underserved population groups.
8. Reasonable attention has been paid to development of managerial capabilities.
11.2. Health resources
1. Sizeable drop in per capita GNP, coupled with increased unemployment.
2. The increase in percentage of GNP spent on health is not a real increase, but merely a reflection of decreased GNP. Per capita expenditure on health decreased.
3. Budgetary allocations to health concentrate on meeting the soaring day-today running expenses, almost ignoring investment in health. The gap between the percentage spent on health as recurrent expenditure and that as total (including development) expenditure has widened.
4. Proportion of health expenditure devoted to PHC increased.
5. International transfer of economic situation. There international support.
resources was seriously affected by the current is greater need for better coordination of
6. Better utilization of WHO resources was noticed.

11.3. Availability of PHC
EMlRC35/l0 page 22
1. Evident increased coverage with safe water supply in urban areas, and to a lesser extent in rural areas. Coverage with urban sanitation also improved. Rural sanitation has a long way to go.
2. Evident increase in the availability of local health care, in general, and of immunization coverage and MCH services in particular.
11.4. Health and socio-economic status
1. Reasonable drop in infant mortality rate.
2. No change in nutritional status.
3. Marked reduction in mortality from childhood diarrhoeal diseases and acute respiratory infections.
4. Incomplete reporting of communicable diseases is still a serious handicap. Taking the figures at their face value, there has been:
drop in incidence of pertussis, measles, respiratory tuberculosis, diphtheria and (to a lesser extent) polio; minimal change regarding tuberculosis (all forms), and tetanus; increased incidence of malaria; limited outbreaks of cholera and meningococcal meningitis; increased number of countries reporting on AIDS.
5. Increased life expectancy.
6. Improved adult literacy. Greater attention is needed regarding female literacy, particularly rural females.
11.5. OUtlook for the future
In spite of these obstacles, the Region's progress towards the goal of HFA through PHC has been encouraging, and Member States believe it can be maintained. even accelerated, provided attention is paid to the following areas:
one priority is training: training of more health personnel; training specifically oriented towards PHC and programme management; continuing education for those already employed; training during supervisory visits. Health workers will have to be motivated to stay and work in rural or other disadvantaged areas. Another priority is health education of the community, to improve their understanding of PHC and encourage them to take responsibility for their own health, both as communities and as individuals. other essential areas for attention are cost control, the reallocation of funds and the optimization of their use. This implies further decentralization of administration and the integration of vertical programmes so that multiple services can be provided by each health worker. operational research will be required here.
Linked to these priority areas is the necessity for an improved information system to provide timely. valid data for the management of services. and improved intersectoral coordination to ensure that
health health vital

EM/RC35/10 page 23
services such as water and sanitation are provided to all, and that the environment is protected in the process. The health dimension must be taken into account in all development plans.
Given the expressed political will of Member States, the innate capacity of their people, the goodwill of multilateral and bilateral aid donors and the technical collaboration with WHO and between countries, it is not too much to hope that gains can be made in these areas over the next three years, so that by the time of the next evaluation the Region will be able to report continuing good progress in its march towards Health for All.

I!M/RC35/10 page 25
Annex
STATISTICAL TABLES
(A) SOClO-ECONOMIC INDICATORS
1. Adult literacy rate 2. Per capita GNP and GOP 3. Unemployment rate
(B) HEALTH EXPENDITURES
1. Percentage of GNP spent on health 2. Percentage of national health expenditure devoted to PHC 3. Percentage allocated to Health Ministry from Government regular
(recurrent) and total budget 4. Selected indicators on health expenditure 5. Per capita (us$) of budget of Health Ministry. total public
(Government) expenditure on health and national health expenditure including private sector
(C) AVAILABILITY OF HEALTH CARE
1. safe drinking water in the home or within 15 minutes' walking distance 2. Adequate facilities for hygienic waste disposal in the home or
immediate vicinity 3. Immunization
3(a) Immunization coverage 3(b) Average immunization coverage (\) 3(c) Average incidence rates
4. Local health care. within one hour's walk or travel 5. MeH services
5.1. Women cared for during pregnancy and infants cared for. by trained person
5.2. Women cared for during childbirth by trained personnel 5.3. Percentage delivered in institutions 5.4. Maternal mortality rate (MMR) 5.5. Summary of certain MCH indicators
(D) SELECTED HEALTH STATUS INDICATORS
1. Infant mortality rate (IMR) 2. Life expectancy at birth 3. Percentage of newborns with a birth weight of at least 2500 g 4. Percentage of children below 5 years of age with
corresponding weight-for-age

(A) SOCIO-!;:CONOMIC INDICATORS
1. Adult literacy rate (Desired level: over 70\)
Sex Rate (\) 1982
C p
No data 1 0.1
Total Below 30\ 7 52 30-70\ 10 45
Above 70\ 5 3
No data 2 0.2
M Below 30\ 2 4 30-70\ 10 87
Above 70\ 9 9
No data 2 0.2
F Below 30\ 11 88 30-70\ 8 10
Above 70\ 2 2
* Regional average
Both sexes Males t7emales
35\ 47\ 22\
C = Number of countries
EM/RC35/10 page 26
1988
C
0
5 10
8
1
1 11
10
1
8 10
4
45\ 56\ 32\
P
0
41 47
12
3
2 80
15
3
51 42
5
p = \ of the Region's population therein weighted average for the reporting countries *
EMlRC35/l0 page 27
2. Per capita GNP (Desired level: over $500) Per capita GOP (Regional indicator)
Interval (US$)
1982
GNP
Below $300 2 8 $300-500 5 41
$500-2000 6 38 Above $2000 10 13
G D P
Below $300 4 39 $300-500 3 10
$500-2000 6 38 Above $2000 10 13
* Regional average
GNP GDP
3. unemployment rate (Regional indicator)
Interval (US$)
$1504 $1616
1982
C P
No data 12 40
Below 3\ 4 1 3-5\ 4 36 Above 5\ 3 23
* Regional average 4.6\
C = Number of countries
1988
C T P
3 7 3 37
8 45 9 11
2 11 4 35
7 26 10 28
$1131 $1560
1988
C P
5 14
6 11 5 36 7 39
5.8\
P = \ of the Region's population therein weighted average for the reporting countries. *

(B) HEALTH EXPENDITURES
OORC35/10 page 28
1. Percentage of GNP spent on health (Desired level: at least 5\)
Interval 1982 1988 (\)
C P C
No data 10 36 12
Below 3\ 4 32 0 3.0-4.9\ 6 16 6
5\ and above 3 16 5
" Regional average 3.0\ 4.9\
2. Percentage of national health expenditure devoted to PHC (Desired level: A reasonable percentage)
Interval 1982 1988 (\)
C P C P
No data 9 35 9 24
Below 20\ 4 5 3 4 20-49\ 8 57 8 28 50\ and above 2 3 3 44
" Regional average 31\ 53\
C = Number of countries
P
36
0 46
18
P = \ of the Region's population therein Weighted average for the reporting countries. "

EM/RC35/10 page 29
3. Percentage allocated to Health Ministry from Government Regular (Recurrent) and Total Budget
Budget proportion (\) 1982 1988
C P C P
NO data 10 41 3 18
Regular Below 3\ 3 39 3 36 3.0-4.9\ 3 4 3 13
Budget 5\ and above 7 16 14 33
* Regional average 3.2\ 6.9\
No data 2 4 0 0
Total Below 3\ 5 48 6 61 3.0-4.9\ 5 39 8 20
Budget 5\ and above 11 9 9 19
* Regional average 3.1\ 4.7\
4. Selected indicators on health expenditure 1988
Indicator 1988
C P Average
Ministry of Health Budget. As \ of GNP 12 60 2.7 As \ of GOP 16 69 3.0
Per capita expenditure (US$) By Ministry of Health 23 100 $30
Additional by: Other Governmental sectors 12 74 $11 Private sectors 7 55 $11
C = Number of countries P = \ of the Region's population therein
weighted average for the reporting countries. *
*

5. Per capita (us$) of Budget of Health Ministry, Total public (government) expenditure on health, and national health expenditure including private sector
Per capita (US$)
1982
C I P
Health Ministry
NO data 10 25
Below $10 2 47 $10-49 3 6 $50 and above 8 22
1988
C I P
0 0
5 50 8 25
10 25
Total Public Expenditure
No data 17 60 11 26
Below $10 1 31 1 29 $10-49 2 7 5 23 $50 and above 3 2 6 22
National Health Expenditure
No data 18 52 14 42
Below $10 0 0 0 0 $10-49 2 32 3 38 $50 and above 3 16 6 20
C = Number of countries
I!MIRC35/10 page 30
P = \ of the Region's population therein

(c) AVAILABILITY OF HEALTH CARE
EM/RC35110 page 31
1. Safe drinking water in the home or within 15 minutes' walking distance (Desired level: the whole population)
Area
Total
Urban
Rural
Total Urban Rural
Coverage (\) 1982 1985
C C
Below 50\ 8 7 50-79\ 5 3 80\ and above 10 12
No data 1 1
Below 50\ 2 1 50-79\ 7 5 80\ and above 13 15
No data 1 1
Below 50\ 12 8 50-79\ 3 7 80\ and above 7 6
* Regional average
53 78 36
61 85 45
C = Number of countries
1988
C P
7 46 4 23
12 30
0 0
1 2 3 23
19 75
0 0
8 65 6 18 9 17
63 (20-l00\) 90 (38-l00\) 43 (l7-1Q0\)
p = \ of the Region's population therein * weighted average for the reporting countries

EMlRC35/10 page 32
2. Adequate facilities for hygienic waste disposal in the home or immediate vicinity (Desired level: the whole population)
Area
Total
Urban
Rural
Total Urban Rural
Coverage (\) 1982 1985
C C
No data 5 2
Below 50\ 8 9 50-79\ 6 5 80\ and above 4 6
No data 8 2
Below 50\ 4 2 50-79\ 4 8 80\ and above 7 10
No data 11 6
Below 50\ 8 12 50-79\ 0 0 80\ and above 4 4
• Regional average
41 63 22
41 73 23
C = Number of countries
1988
C P
0 0
8 54 5 21
10 25
0 0
4 28 4 6
15 66
1 4
13 76 4 19 5 1
45 (0-100\) 79 (2-100\) 22 (0-100\)
p = \ of the Region's population therein weighted average for the reporting countries • •

3(a) Immunization coverage·
EM/RC35/10 page 33
(Desired level: the whole target population)
Type Coverage \ 1982 1985 1987
C C C L
No data 1 3 0 0
DPT (3) Below 50\ 17 8 5 17 50-79\ 4 10 8 58 80\ and above 1 2 10 25
No data 1 3 0 0
Polio Below 50\ 16 9 5 17 (3) 50-79\ 3 9 8 58
80\ and above 3 2 10 25
No data 2 3 0 0
Measles Below 50\ 18 13 5 17 50-79\ 3 7 11 64 80\ and above 0 0 7 19
No data 5 6 5 2
BCG Below 50\ 14 10 6 17 50-79\ 3 4 6 60 80\ and above 1 3 6 21
No data 6 7 6 3
TT (2) Below 50\ 17 15 14 88 50-79\ 0 1 3 9 80\ and above 0 0 0 0
C = Number of countries P = \ of survivors. first year of life. therein
• Data compiled by BPI/HQ. Morocco included. and Israel excluded. all through.

EMlRC35/10 page 34
3(b) Average immunization coverage (\).
Type 1982
C Average C
DPT-3 22 24 20 Polio-3 22 28 20 Measles 21 22 20 BCG 18 22 16 TT-2 17 4 16
• Data compiled by EPI/HQ •
3(c) Average incidence rates (per 100 000 population)
Disease
C
Diphtheria 19 Pertussis 19 Tetanus (all forms) 21 Poliomyelitis 20 Measles 20 TUberculosis (all forms) 16 Resp. tuberculosis 15
1985
Average
45 45 39 51
9
1982
Rate
2.0 51 5.3 0.83 90 73 42
C = Number of countries reporting
1987
C Average
23 65 23 65 23 61 18 67 17 20
1987
C Rate
23 1.3 22 33 23 7.5 23 0.77 22 49 19 76 15 37

BM/RC35/l0 page 35
4. LOCAL HEALTH CARE. WITHIN ONE HOUR'S WALK OR TRAVEL (Desired level: the whole population)
Area
Total
Urban
Rural
coverage \
No data
Below 50\ 50-79\ 80% and above
NO data
Below 50\ 50-79\ 80\ and above
NO data
Below 50\ 50-79\ 80\ and above
Regional
Total Urban Rural
C = Number of countries.
1982 1985 1988
C
6
3 4
10
13
1 0 9
13
1 2 7
69
C C P
1 1 0
4 3 10 4 4 28
13 15 62
8 5 8
1 0 0 1 2 3
12 16 89
8 6 49
3 3 16 3 3 14 8 11 21
* average
73 94 62
79 (20-100\) 96 (50-100\) 64 (15-100\)
p = \ of the Region's population therein.
* weighted average for the reporting countries. Urban/rural averages not calculated for 1982 due to large number of non-reporting countries.

EM/RC35/10 page 36
5.1. Women cared for during pregnancy and inputs cared for, by trained personnel (Desired level: the whole population)
Area Coverage \ 1982 1985 1988
C C C I L
Women during pregnancy
No data 12 0 3 24
Total Below 50\ 3 10 5 30 50-79\ 3 7 8 39 80\ and above 5 5 7 7
No data 19 9 10 77
Urban Below 50\ 1 4 1 6 50-79\ 0 6 4 10 80\ and above 3 3 8 7
I n fan t s
No data 16 10 8 24
Total Below 50\ 2 4 2 1 50-79\ 1 3 6 27 80\ and above 4 5 7 48
No data 21 17 15 68
urban Below 50\ 0 1 0 0 50-79\ 0 0 3 14 80\ and above 2 4 5 18
C = Number of countries. L = \ of Region's live births therein.

EM/RC35/10 page 37
5.2. women cared for during childbirth by trained personnel (Desired level: the whole population)
Area Coverage \ 1985
C
No data 1
Total Below 50\ 10 50-79\ 6 80\ and above 5
No data 10
Urban Below 50\ 3 50-79\ 3 80\ and above 6
5.3. Percentage delivered in institutions
\ delivered 1982 1988
C C L
No data 15 7 48
Below 50\ 1 5 43 50-79\ 1 6 8 80\ and above 6 5 1
5.4. Maternal mortality rate (MKR) per 10 000 live births
MMR 1982 1988
C C L
No data 9 3 8
Below 5 8 7 5 5-9 1 2 16 10 and above 5 11 71
C = Number of countries.
1988
C L
1 15
5 13 11 66 6 6
11 77
1 6 1 3
10 14
L = \ of Region's live births therein.

EM/RC35110 page 38
5.5. Summary of certain MCH indicators
Indicator 1982
* C Average C
Care during pregnancy \
Total 11 28 22 Urban 4 (44-100) 13 Rural 4 (37-100) 9
Care during childbirth \
Total ** 20 Urban ** 12 Rural ** 8
Institutional delivery \ 8 (l0-100) 19
Maternal mortality R 14 37 20
Infant care \
Total 7 (8-100) 14 Urban 2 12 Rural 2 8
C = Number of reporting countries.
1985 1988
* * Average C Average
39 20 52 45 13 81 (5-100) 10 (40-100)
27 22 58 54 12 86 (5-100) 10 (35-100)
15 16 20
37 20 27
41 15 82 (28-100) 8 (55-100) (5-100) 8 (34-100)
* weighted average for reporting countries, not calculated if these are not the majority and the range is given instead.
** Data not compiled.

EM/RC35/10 page 39
(D) SELECTED HEALTH STATUS INDICATORS
1. INFANT MORTALITY RATE (IMR) PER 1000 LIVE BIRTHS (Desired level: below 50 per 1000)
Area
Total
Urban
Rural
IMR per 1000
No data
100 and above 50-99 Below 50
No data
100 and above 50-99 Below 50
No data
100 and above 50-99 Below 50
Reg ion a 1
Total Urban Rural
C = Number of countries.
19B2 1985 19B8
C C C
0 0 1
10 7 5 5 8 6 8 7 11
19 18 14
2 2 2 1 0 2 1 2 5
19 18 15
2 2 1 1 2 6 1 0 1
* a v era g e
111 (31-145) (39-189)
97 (41-146) (67-189)
L
0
20 23 57
61
6 9
24
61
6 33
0
L = \ of the Region's live births therein.
81 (12-187) (14-200) (10-189)
* Weighted average for the reporting countries; not calculated if there are not the majoritY and the range is given instead.

2. LIFE EXPECTANCY AT BIRTH (Desired level: over 60 years)
Sex Life expectancy 1982
years C
Below 50 years 5 Total 50-60 years 8
Over 60 years 10
No data 5
M Below 50 years 5 50-60 years 3 OVer 60 years 10
No data 5
F Below 50 years 4 50-60 years 5 OVer 60 years 9
IlM/RC35/10 page 40
1985 1988
C C P
7 2 7 3 5 11
12 16 82
0 2 30
6 5 17 4 4 23
12 12 30
0 2 30
6 3 7 4 3 10
12 15 53
Reg ion a 1 • a v era 9 e
Both sexes Males Females
C = No. of countries.
55 54 55
56 56 57
60.1 (38-75) 58.4 (36-73) 60.6 (39-77)
p = \ of the Region's population therein. • Weighted average for the reporting countries.

EM/RC35/10 page 41
3. PERCENTAGE OF NEWBORNS WITH A BIRTH WEIGHT OF AT LEAST 2500 g (Desired level: at least 90\)
Area \ birth weight 1982 1985
2500g and above C C
No data 6 4
Total Below 80\ 1 1 80-85\ 4 5 90\ and above 12 12
No data 20 17
Urban Below 80\ 0 0 80-89\ 0 1 90\ and above 3 4
No data 20 18
Rural Below 80\ 0 1 80-89\ 0 0 90\ and above 3 3
Reg ion a 1 a v era g e
Total Urban Rural
C = No. of countries.
.
84 86
1988
C L
1 3
1 28 5 19
16 50
16 60
0 0 1 6 6 34
16 60
1 5 2 19 4 16
*
87 (75-100) (85-100) (70-100)
L = \ of the Region's live births therein.
* Weighted average for the reporting countries; not calculated if these are not the majority and the range is given instead.

EM/RC35/10 page 42
4. PERCENTAGE OF CHILDREN BELOW 5 YEARS OF AGE WITH CORRESPONDING WEIGHT FOR AGE (Desired level: at least 90%)
Area
Total
Urban
Rural
Total Urban Rural
% with corresponding
weight for age
No data
Below 80% 80-89% 90% and above
No data
Below 80% 80-89% 90% and above
No data
Below 80% 80-89% 90% and above
C ; No. of countries.
19B2
C
15
4 1 3
22
0 0 1
22
1 0 0
60 * *
1985
C
9
8 0 5
19
1 0 2
20
1 0 1
77
* *
L ; % of the Region's live births therein.
1988
C L
9 38
7 37 1 3 6 22
18 89
3 6 0 0 2 5
19 94
3 4 0 0 1 2
73 (32-97) (39-98) *
* weighted average for the reporting countries; not calculated if these are not the majority and the range is given instead.