Reflective to Resilient to Remarkable Teaching PAGE Presented by Mike White The Leadership &...
42
Reflective to Resilient to Remarkable Teaching PAGE Presented by Mike White The Leadership & Learning Center [email protected]
-
Upload
posy-cummings -
Category
Documents
-
view
218 -
download
0
Transcript of Reflective to Resilient to Remarkable Teaching PAGE Presented by Mike White The Leadership &...

Reflective to Resilient to Remarkable Teaching PAGE
Presented byMike White
The Leadership & Learning [email protected]

Administrative Notes
HandoutsScheduleShare your questions, road blocks
and success stories with the groupContinuing dialog

First Some Good News
After more than a decade of fairly flat achievement and stagnant or growing gaps, we appear to be turning the corner.

NAEP Reading, 9 Year-Olds:
Record Performance for All Groups
150
170
190
210
230
250
1975 1980 1984 1988 1990 1992 1994 1996 1999 2004 2007
Ave
rag
e S
cale
Sco
re
African American Latino White
Source: National Center for Education Statistics, NAEP 2007 Trends in Academic Progress
Note: Long-Term Trends NAEP

African American-White Gap Narrows to Smallest Size in History
NAEP Reading, 9 Year-Olds
150
170
190
210
230
250
1975 1980 1984 1988 1990 1992 1994 1996 1999 2004 2007
Ave
rag
e S
cale
Sco
re
African American White
29 3526
Source: National Center for Education Statistics, NAEP 2007 Trends in Academic Progress
Note: Long-Term Trends NAEP

Latino-White Gap Narrows to Smallest Size in History
NAEP Reading, 9 Year-Olds
150
170
190
210
230
250
1975 1980 1984 1988 1990 1992 1994 1996 1999 2004 2007
Ave
rag
e S
cale
Sco
re
Latino White
24 2821
Source: National Center for Education Statistics, NAEP 2007 Trends in Academic Progress
Note: Long-Term Trends NAEP

Bad News
At end of Middle School, gaps between groups are the same today as they were in 1990
At the end of High School, gaps are larger today than they have ever been

African American and Latino 17 Year-Olds Read at Same Levels As White 13
Year-Olds
0%
100%
150 200 250 300 350
Average Scale Score
Per
cent
of
Stud
ents
White 13 Year-Olds African American 17 Year-Olds Latino 17 Year-Olds
Source: National Center for Education Statistics, NAEP 2004 Trends in Academic Progress
Note: Long-Term Trends NAEP

African American and Latino 17 Year-Olds Do Math at Same Levels As
White 13 Year-Olds
0%
100%
200 250 300 350
Average Scale Score
Per
cent
of
Stud
ents
White 13 Year-Olds African American 17 Year-Olds Latino 17-Year Olds
Source: National Center for Education Statistics, NAEP 2004 Trends in Academic Progress
Note: Long-Term Trends NAEP

And these are the African American & Latino students who remain in high school.
What do the Dropout numbers look like?

Best available estimates of national four-year graduation rates
Class of 2006
Source: Ed Trust analysis of enrollment data from the National Center for Education Statistics, Common Core of Data using the Averaged Freshman Graduation Rate (AFGR) methodology. For more information on the AFGR methodology, see National Center for Education Statistics, Users Guide to Computing High School Graduation Rates, Volume 2, August 2006.

Of Every 100 Students in 9th Grade…
90 will make it to 10th grade
81 will make it to 11th grade
76 will make it to 12th grade
70 will graduate on-time33 will graduate from college
Source: Ed Week, EPE Research Center, Diploma Counts 2007, uses the Cumulative Promotion Index (CPI).

This means that of the approximately 4 million
students who entered 9th grade this year,
1.2 million will not graduate by 2011-12
Source: Ed Trust analysis of enrollment data from the National Center for Education Statistics, Common Core of Data using the Averaged Freshman Graduation Rate (AFGR) methodology. For more information on the AFGR methodology, see National Center for Education Statistics, Users Guide to Computing High School Graduation Rates, Volume 2, August 2006.

The Government’s Response to Achievement Gaps: NCLB
“There must be a moment when a parent can say, I have had enough of this school. If a school can not perform or catch up, parents should have options.”
A Better Public SchoolA TutorA Charter School

The Public Response to Achievement Gaps: Leave
Charter Schools (Ohio, Arizona,
Washington DC & Kansas City)Home SchoolsNot Passing Levies

Our Responses to Achievement Gaps

We Often Spend LessGap
High Poverty vs. Low Poverty Districts
-$907 per student
Georgia +$331 per student
Source: The Education Trust, The Funding Gap 2005. Data are for 2003

We Often Spend LessAdjusted 40% Adjusted
Gap
High Poverty vs. Low Poverty Districts
-$1532 per student
Georgia -$436 per student
Source: The Education Trust, The Funding Gap 2005. Data are for 2003

We Often Spend Less
In eight states – Illinois, Kansas, Montana, Nebraska, New Hampshire, New York and Wyoming – high-minority districts received at least $1,000 less (unadjusted) per student than districts with lower percentages of minority students.

Poor and Minority Students Get More Inexperienced* Teachers
20%
11%
21%
10%
0%
25%
Perc
en
t o
f T
each
ers
Wh
o A
re I
nexp
eri
en
ced
Source: National Center for Education Statistics, “Monitoring Quality: An Indicators Report,” December 2000.
*Teachers with 3 or fewer years of experience.
High poverty Low poverty High minority Low minority

Students Who Start 2nd Grade at About the Same Level of Math Achievement…
55 57
0
20
40
60
80
100
Group 1 Group 2
Ave
rag
e P
erce
nti
le R
ank
Beginning of 3rd Grade
Source: Heather Jordan, Robert Mendro, and Dash Weerasinghe, The Effects of Teachers on Longitudinal Student Achievement, 1997.

…Finish 5th Grade Math at Dramatically Different Levels Depending on the Quality of
Their Teachers
55 57
77
27
0
20
40
60
80
100
Group 1 Assigned to ThreeEFFECTIVE Teachers
Group 2 Assigned to ThreeINEFFECTIVE Teachers
Ave
rag
e P
erce
nti
le R
ank
Beginning of 2nd Grade End of 5th Grade
Source: Heather Jordan, Robert Mendro, and Dash Weerasinghe, The Effects of Teachers on Longitudinal Student Achievement, 1997.

Teacher Quality
Teachers sometimes feel that they deserve a certain schedule and to teach certain groups of kids. The research leads us to something very contrary to that – that the most skillful teachers need to be with the most reluctant learners. And we need to begin to do this. And this is not for the faint of heart!

Results are devastating.
Kids who come in a little behind, leave a lot behind.

Identify Specific Strategies to Meet Goals ---- What Can We Do?
Sure Bets
You already Know what to do. Close your “Knowing-Doing” Gap
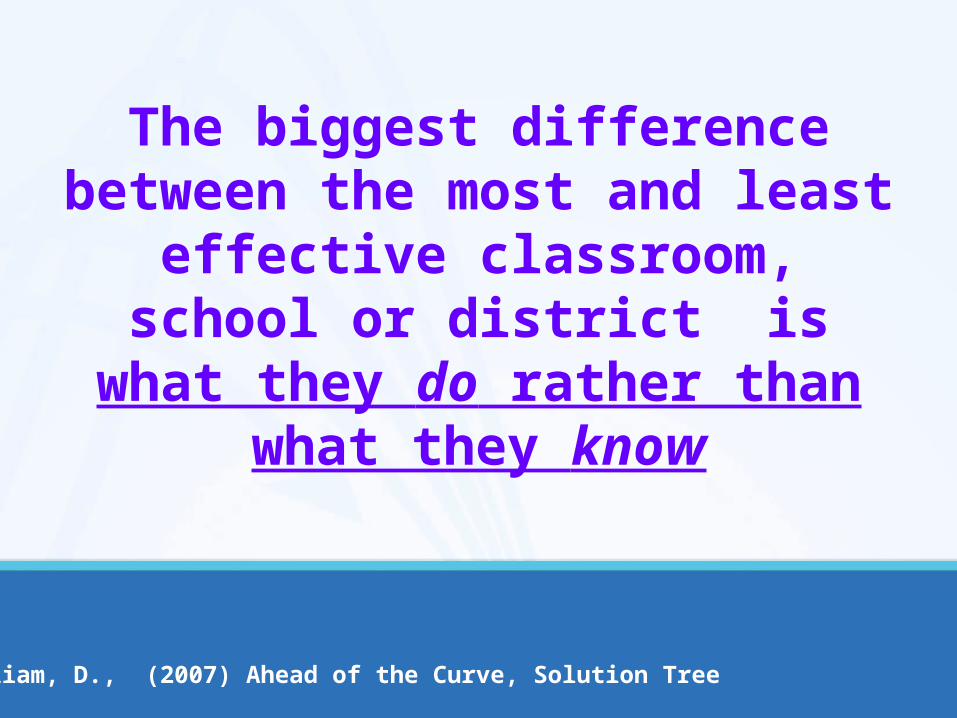
The biggest difference between the most and least effective
classroom, school or district is what they do rather than what
they know
Wiliam, D., (2007) Ahead of the Curve, Solution Tree

Getting To Know The Players
Your ColleaguesYour ParentsYour Students

Steph Uneedtono is the person who loves the students, the school and helping everyone in it. Her compassion, civility and genuineness can make her the hub of the building. She may not have an advanced degree or be at the top of the pay scale. She probably is not an administrator and may not even be a teacher.
Who’s Who in Your Building?

Ken Tankerous Ken can be toxic. Although he may have some solid teaching
and classroom management skills, he likes to speak first, speak loudly and speak long. He is often disrespectful and behaves as though everyone’s primary concern should be to make his life easier.
He usually starts sentences with the phrase, “kids now-a-days,” or “if we’re going to prepare them for the real world.” Ken will sacrifice relationships for rigor. He will set the bar high, but will fail to support students in reaching that bar. He believes in the normal curve and designs his instruction to achieve that curve. Ken expects all students to know how to behave in his class because they “should know that by now.”

Kay Serra Kay is child-centered and caring. Her room smells like cookies
and some days you’ll swear you see a rainbow in it. There is laughter and smiling faces and hugs for everyone.
Kay’s philosophy is about building relationships with students and families. She is often requested by parents and has a reputation of loving the hardest to love students. Admirable qualities to be sure!
The problem with Kay Serra is that she doesn’t have a sense of urgency for teaching the standards. Kay will not complete her morning meeting time until every student has had the opportunity to share their weekend success on the soccer/baseball/football field. She will personally mediate every playground scuffle through to the sincere apology

Be on the Lookout for Iras Ira Flect is a remarkable teacher who humbly approaches each
day with urgency and passion. He divides material into small chunks, divides the students into small groups, checks for learning, and makes adjustments. Ira doesn’t always have all students at the proficient level, but Ira has a nose for finding those who aren’t and making mid-unit corrections.
He celebrates his successes, big and small, analyzes his failures and reflects on the lessons he learned. His lesson plans aren’t laminated because he’s always refining them.
Ira comes in early and works in the classroom rather than gossiping in the copy room. Ira is the one who will discuss student achievement at the grade level meeting instead of the Christmas party. Ira is the one from whom you learn something every time you meet. He might be a 30-year veteran or a 3rd year rookie. Here

Parents At times teachers, administrators, board members
and support staff lose sight of who really owns the schools. First, and always, we must acknowledge that parents are our customers, our stockholders. They pay our salaries, are our ultimate evaluators, and can be our greatest partners or roadblocks in the day-to-day business of teaching their children.
Over the last few years, too many educators, have hung a “Testing - do not disturb” sign on the school’s front door and chased parents from their buildings.
This is ironic since parents and educators want the same thing –maximum student achievement.

Your Students What’s your first order of business? Put aside
teaching standard 4.01 for a moment. Instead, concentrate on getting to know your students, students getting to know each other and students getting to know themselves. The time spent collecting this data will pay big dividends throughout the year.
The more you know about your students’ background knowledge, interests, culture and learning styles the better your relationship, classroom management and instruction will be.

Robert Marzano in The Art and Science of Teaching says…..
“the quality of relationships teachers have with students is the keystone of effective management and perhaps even the entirety of teaching”
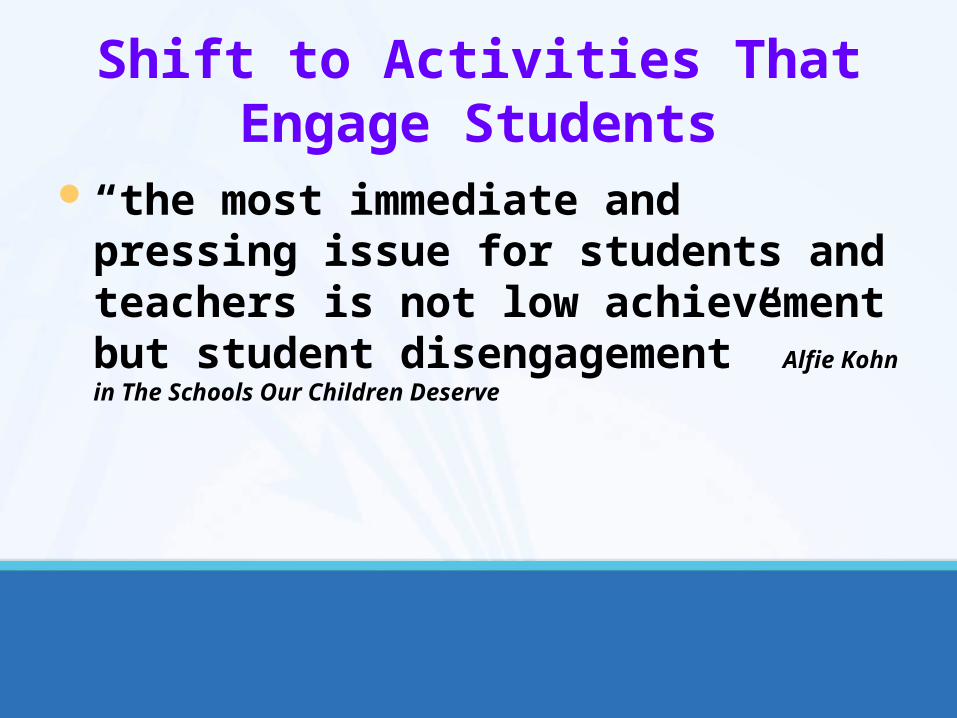
Shift to Activities That Engage Students
“the most immediate and pressing issue for students and teachers is not low achievement but student disengagement” Alfie Kohn in The Schools Our Children Deserve

Emotional Engagement“The reason I work hard is because
my teacher demands it”
0
5
10
15
20
25
30
% RESPONDING "YES"
BLACK
WHITE
LATINO
ASIAN
MIXED RACE
Ferguson, R., (2001) Harvard University & Minority Student Achievement Network

“Reason I work hard is because my teacher encourages me”
05
101520253035
404550
% REPONDING "YES"
BLACK
WHITE
LATINO
ASIAN
MIXED RACE
Ferguson, R., (2001) Harvard University & Minority Student Achievement Network

The Culture of Achievement
Source: Fryer, R. G. (Winter 2006). Education Next. Calculations from National Longitudinal Study of Adolescent Health data
The popularity of white students increases as their grades increase. For black and Hispanic students, there is a drop off in popularity for those with higher GPAs.
Popularity and Grades
-0.1
0.0
0.1
0.2
0.3
0.4
0.0 1.0 2.0 3.0 4.0
Grade-Point Average
Po
pu
lari
ty I
nd
ex
Note: A grade of 1.0=D; 4.0=A
Black/Hispanic Popularity
White Popularity

1. Shift Expectations
The Powerful 23/49 StatisticPrincipal Effectiveness — 23%Teaching Qualification and Practice
— 49% Economics, Ethnicity, Language —
24%People are The Critical VariablesTruth in Bumper Stickers!
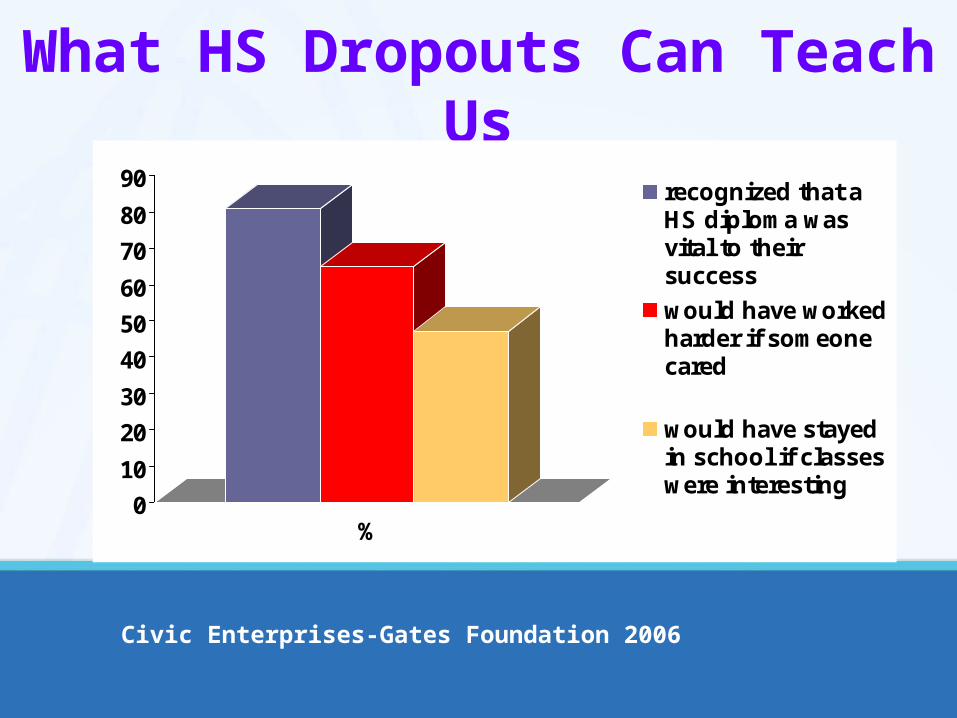
What HS Dropouts Can Teach Us
0
10
20
30
40
50
60
70
80
90
%
recognized that aHS diploma wasvital to theirsuccess
would have workedharder if someonecared
would have stayedin school if classeswere interesting
Civic Enterprises-Gates Foundation 2006

Equitable Design in Instruction and Assessment
Tic-Tac-Toe as a design tool
Design a poster
that…
Develop a movie script that…
Write a different ending to…
Design a game that…
Make a timeline that…
Develop a song lyric that…
Write a report that…
Draw a picture that…
Develop a concept map that…

The Leadership and Learning Center(866) 399-6019
www.LeadandLearn.com