Refinery Fenceline Monitoring & Method 325A/B Fenceline Monitoring & Method 325A/B National Air...
28
Refinery Fenceline Monitoring & Method 325A/B National Air Toxics Monitoring and Data Analysis Workshop October 28 th , 2015 Jason M DeWees US EPA OAQPS Measurement Technology Group
Transcript of Refinery Fenceline Monitoring & Method 325A/B Fenceline Monitoring & Method 325A/B National Air...

Refinery Fenceline
Monitoring & Method 325A/B
National Air Toxics Monitoring and Data Analysis Workshop
October 28th, 2015
Jason M DeWees
US EPA OAQPS
Measurement Technology Group
Overview
► Clean Air Act Requirements
► Refinery Rulemaking History
► Refinery Sector
► Risk Assessment
► ORD/OAQPS Fenceline Pilot Project
► Fenceline work practice standard
► Method 325A/B and evaluation
2

What Does the Clean Air Act (CAA) Require?
► New Source Performance Standards (NSPS)
► CAA Section 111(b) requires to EPA to set and periodically review, emission standards for new sources of criteria air pollutants (CAP), volatile organic compounds (VOC), and other pollutants
► Air Toxics Rules: Maximum Achievable Control Technology (MACT) and Residual Risk and Technology Reviews
► CAA Section 112(d) requires EPA to set emission standards for hazardous air pollutants (HAP) based on performance of the maximum achievable control technology (MACT)
► EPA is required to conduct two reviews and update the existing standards, if necessary
• Residual Risk Assessment: To determine whether additional emission reductions are warranted to protect public health or the environment. This is a one-time review.
• Technology Reviews: To determine if better emission control approaches, practices, or processes are now available. Technology reviews are required every eight years.
3
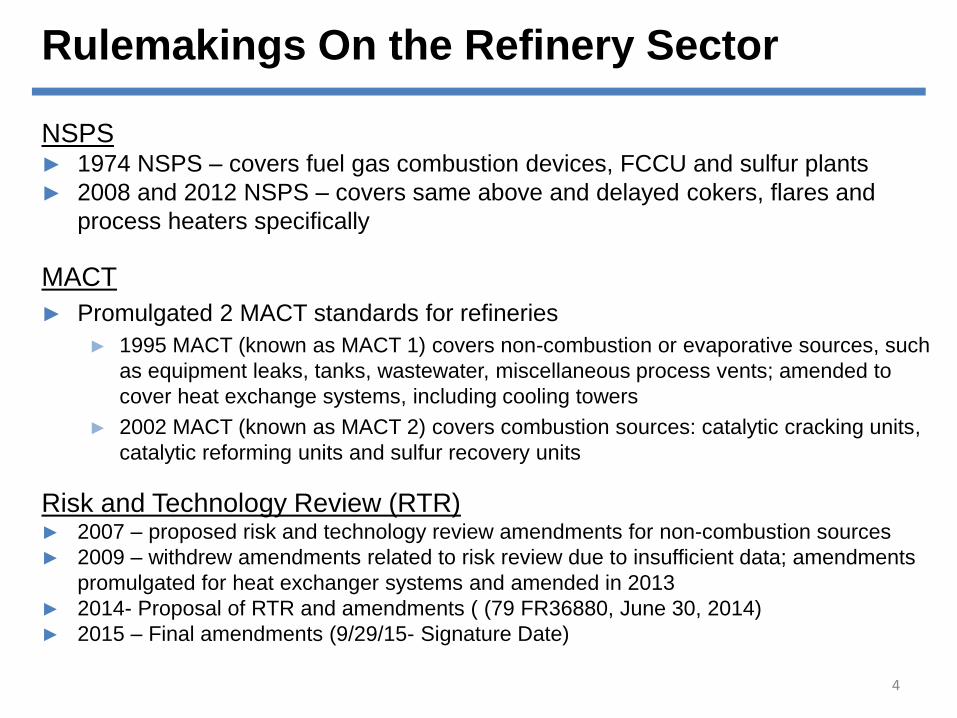
Rulemakings On the Refinery Sector
NSPS► 1974 NSPS – covers fuel gas combustion devices, FCCU and sulfur plants
► 2008 and 2012 NSPS – covers same above and delayed cokers, flares and
process heaters specifically
MACT
► Promulgated 2 MACT standards for refineries
► 1995 MACT (known as MACT 1) covers non-combustion or evaporative sources, such
as equipment leaks, tanks, wastewater, miscellaneous process vents; amended to
cover heat exchange systems, including cooling towers
► 2002 MACT (known as MACT 2) covers combustion sources: catalytic cracking units,
catalytic reforming units and sulfur recovery units
Risk and Technology Review (RTR)► 2007 – proposed risk and technology review amendments for non-combustion sources
► 2009 – withdrew amendments related to risk review due to insufficient data; amendments
promulgated for heat exchanger systems and amended in 2013
► 2014- Proposal of RTR and amendments ( (79 FR36880, June 30, 2014)
► 2015 – Final amendments (9/29/15- Signature Date)
4

Overview of Refinery Source Category
► There are currently 142 large (major sources) and 7 small (area source)
petroleum refineries in the United States
► Refineries are responsible for 20,000 tons per year hazardous air
pollutant (HAP) emissions
► In 2011 EPA completed first-ever comprehensive information collection request(CAA Sec 114), requiring all refineries to provide:
• Complete HAP emission inventories
• Comprehensive process and equipment information
• Required Source Testing
• Crude Analyses
• Information collected is accessible at : http://www3.epa.gov/ttn/atw/petref/petrefpg.html
► This information was used as supporting information for the risk and technology review
5

Refinery Emission Sources
► Fugitive emission sources
► Tend to be open sources or not emitted through a stack or vent, thus difficult to directly measure pollutants
► Examples include equipment leaks and pressure relief devices, tanks and transfer operations and wastewater handling and treatment
► Emission models and estimates are used to predict pollutant emissions
► Point sources (vents or stacks)
► Emissions generally well understood and well characterized, and some test data available where pollutants were directly measured
► Examples include vents at catalytic cracking, fluid coking, delayed coking, catalytic reforming, sulfur recovery, hydrogen plants
► Flares
► Destruction of pollutants in an open flame
► Difficult to directly measure pollutants
► Flare studies available to develop correlations for parameters that affect flare destruction efficiencies (2012 peer review)
► September 2012 NSPS flare amendments require all flares to eventually have monitors to measure waste gas flow
6

Air Toxics Emissions from Refineries
7
Petroleum Refinery HAP Emissions
Source: 2011 ICR
Equipment Leaks
Cooling Towers
Wastewater Treatment
Flares
Storage
Misc Processes
FCCU
Combustion
"fugitive" sources account for half of the air toxics inventory and most of the VOC inventory

16. 8
Planning and Scoping
Exposure AssessmentExposure Assessment Toxicity Assessment
Risk Characterization
Quantitative and Qualitative Expressions of Risk/Uncertainty
POPULATION CHARACTERISTICS
Measures of
Exposure
CHEMICAL
CONCENTRATIONS
Air, Soil, Water, Food
(monitor/model)
Human Risk Assessment Process
Dose/
Response
Assessment
Y
X
Chemical
Release SOURCES
FATE AND TRANSPORT ANALYSIS
Hazard Identification
EXPOSURE
informationDOSE/RESPONSE
information
SOURCE IDENTIFICATION
8
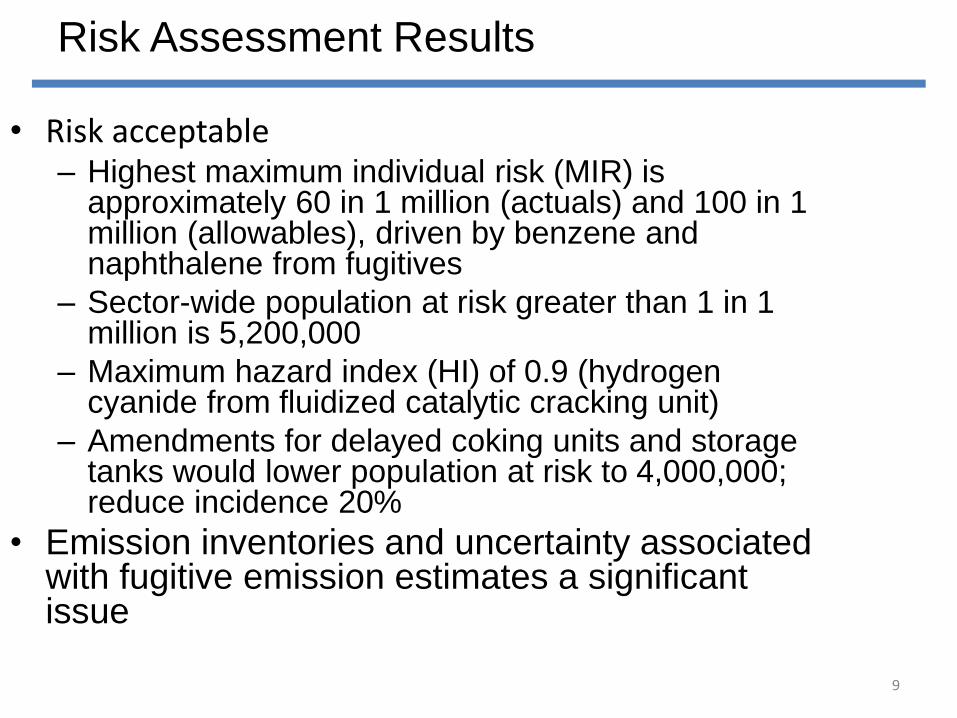
Risk Assessment Results
9
• Risk acceptable– Highest maximum individual risk (MIR) is
approximately 60 in 1 million (actuals) and 100 in 1 million (allowables), driven by benzene and naphthalene from fugitives
– Sector-wide population at risk greater than 1 in 1 million is 5,200,000
– Maximum hazard index (HI) of 0.9 (hydrogen cyanide from fluidized catalytic cracking unit)
– Amendments for delayed coking units and storage tanks would lower population at risk to 4,000,000; reduce incidence 20%
• Emission inventories and uncertainty associated with fugitive emission estimates a significant issue

N
Passive Fenceline Monitoring – ORD/OAQPS Pilot Study 2009
Facility fenceline monitoringPassive Sampling
• Locate passive samplers around the perimeter of each refinery

Pilot study – Monitored vs Modeled
11

What is a work practice standard?
► 112(h) Work Practice Standards and Other Requirements:
Allows the EPA, in cases where it is not feasible to prescribe or
enforce an emission standard [under Section 112(d) or (f)], to
promulgate a design, equipment, work practice, or operational
standard. Also allows an owner or operator to use an alternative
means of emission reduction if it can be proven that an equal
reduction in emissions of any HAP will be achieved.
► From Brick MACT decision
► “The Clean Air Act allows EPA to set work practice standards instead
of emissions standards in certain situations, such as when
measuring emission levels is technologically or economically
impracticable.”
12

Why Fenceline Monitoring of benzene?
► Fugitive emission sources may not be well characterized in the inventories but are likely
significant contributors to overall emissions
• Fugitives from process piping
• Wastewater sources
• Tanks
► Highest concentrations of these fugitive emission sources outside the facility likely occur
by the property boundary near ground level
► Air monitoring at the property boundary can provide a direct measure of the annual
average concentrations of air toxics directly surrounding the refinery
► Benzene is a refinery risk driver and also primarily emitted from fugitive sources; 85% of
benzene emissions from refineries is from fugitive, ground-level sources, so reducing
emissions of benzene from fugitive sources will reduce emissions of other toxic pollutants
► Perimeter or fenceline monitoring provides an indicator of the level of emissions at
refineries and is a way of ground-truthing fugitive emission estimates
13

Fenceline Monitoring Work Practice
14
• Regulatory Objective– Program is designed to manage fugitives by requiring perimeter
monitoring and corrective action upon exceeding trigger of 9 ug/m3 (2.8 ppbv)• Requires sub-3 ppb level monitoring capability for benzene• Auto-GCs and Passives are the only commercially available monitors capable
of doing this.
– Trigger is based on highest concentration modeled at any fenceline• Addresses concerns about inaccurate emission inventories for fugitive sources
– Sampling system based on passive monitoring• Continuous, 2-week sampling periods• Complete coverage of fenceline• Provides average concentration over each 2 week period• Simple high-low Subtraction to account for background• Trigger for Root Cause Analysis / Corrective Action based on annual average
concentration– Rolling average of 26-2 week readings (Delta of the high and low concentration)

Work practice (con’t)
15
• Fenceline WPS is located in 40 CFR 63.658• Rule promulgates and references Method 325A
& B• Allows site specific monitoring plan to identify
confounding sources and make corrections• Allows the use of alternative monitoring
method (next slide)• Contains a reduced monitoring option
Pre-publication draft availablehttp://www3.epa.gov/ttn/atw/petref.html

Alternative Methods
16
• 40 CFR 63.658 (k)– Can be used for all or a number of passive samplers– MDL must be <=0.9 ug/m3– Spatial coverage must be equal to M325A
• Physical path length for open path systems must be equal to M325 spacing• Open path instruments must be able to resolve an average concentration
over each passive sampler footprint within the path length of the instrument
– Non-integrating alternative methods must provide a minimum of one cycle of operation for each successive 15-minute period
– Real time alternative methods may be used to eliminate outside confounding sources
– All results measured under MDL must use MDL for “high reading”; “0” for “low reading”.

The gaseous VOC target compound(s) migrate through a constant
diffusion barrier (e.g. an air gap of fixed dimensions) and adsorb onto
the sorbent.
The rate of sampling depends on
the diffusion of a target VOC through air and
the sampler dimensions/characteristics.
Useful over a range of approximately 0.1 g/m3 to at least 500 g/m3
Cross Section View of Passive Sorbent Tube
Method 325 A & B - Diffusive Tube Primer
17

Samplers are protected from weather by a
simple shroud
Collection of local meteorological data is
part of the process.
PS Tube Sampler
PS Sampler ExamplePVC Pipe version with weatherproof hood
Diffusive Sampler Configuration
18

The number and placement of the monitors depends on the size and shape of the facility• Two Option
• Angular Approach• Linear footage Approach
Method 325A
Passive Sampler Locations for Facility Monitoring
19

Thermal Desorption Gas Chromatography based on Guidance in
Compendium Method TO-17
• Heat and a flow of inert carrier gas used to extract (desorb) the VOCs
from the tube
• Separation and analysis by Gas Chromatography/Flame Ionization
Detection or Gas Chromatography/Mass Spectrometry.
Method 325 B - Analysis for Target Compounds
20

Method 325A & B Evaluation
21
• Multiple ORD/Regions/OAQPS Round Robin Studies (not presented)
• Second ORD Refinery Study (not presented)
• Exposure Chamber Evaluation
• “Pulse” Study
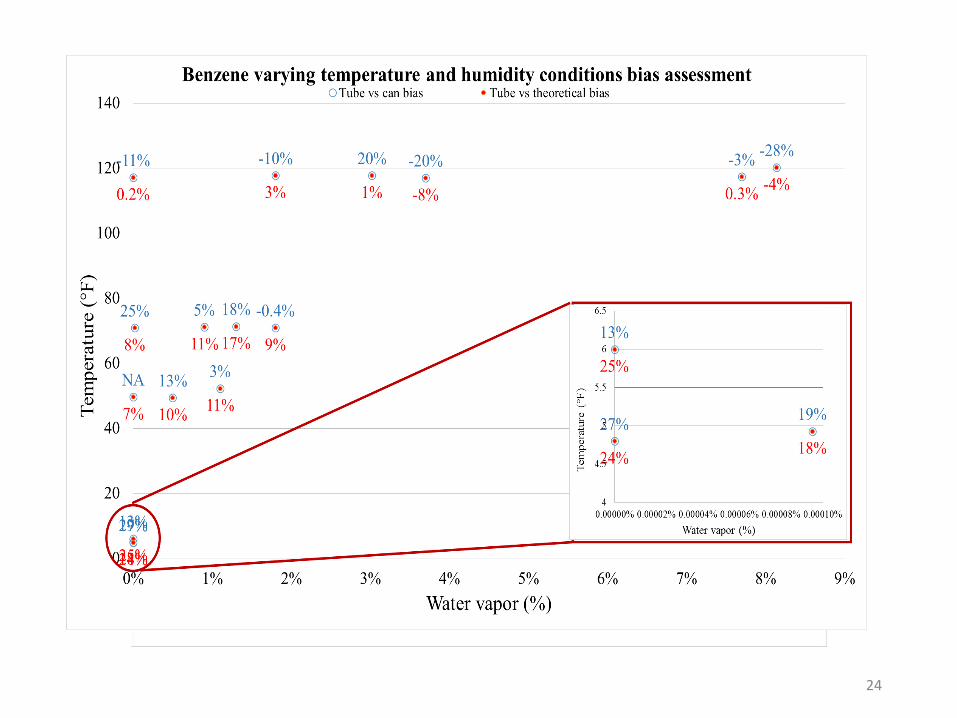
• Temperature and Relative Humidity Study
• Hold time study
• External API/AFPM Study

ERG - Passive Sorbent Exposure System
• ERG designed and built
• Control benzene concentration, moisture, temperature for 24hr exposures
• Single pass for exposure

Pulse Results
y = 0.9964x + 0.4853R² = 0.9968
0.00
2.00
4.00
6.00
8.00
10.00
12.00
14.00
16.00
0.00 2.00 4.00 6.00 8.00 10.00 12.00 14.00 16.00
Pass
ive
sorb
ent
resu
lts(
pp
b)
Theorectical Concentration (ppb)
24

Hold Time Study
25

• API did a 12 refinery study using passive monitoring over 6 weeks• Study showed the fenceline approach can be implemented, and
produces good data• We see the same gradients as with our data, and the same stable
readings• Sources or locations of high benzene are apparent• Consistent benzene background levels in relation to action level• Cost of the program consistent with our estimates• Trigger is reasonable• Data shows reductions will occur at sites from implementing the
program• 3 of the 12 sites had readings that approach our trigger• Study was conducted over the winter months
API/AFPM Study October 2014submitted as comment
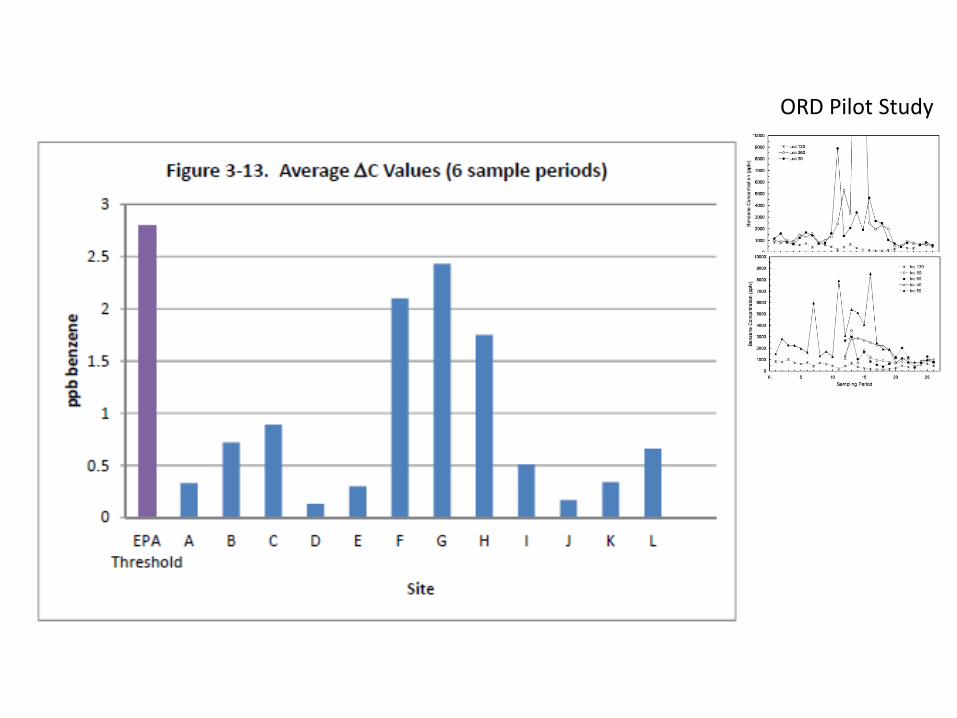
ORD Pilot Study

Questions
28
• Refinery Sector NSPS RTR
– Regulations.gov - Docket # EPA–HQ–OAR–2010–0682
– Website http://www3.epa.gov/airtoxics/petref.html
– (google refinery RTR)