
Refereed Papers by Leading Author Paper no. Title …...Fourth International Event Research...
390
Fourth International Event Research Conference Re-evaluating the City/Town: Events as a Catalyst for Change Refereed Papers by Leading Author Paper no. Title Author(s) #3507 ENVIRONMENTAL ACCREDITATION FOR EVENT MANAGEMENT Charles Arcodia & Scott Cohen #3407 ACCESS: DEVELOPING A RESEARCH AGENDA FOR EDINBURGH FESTIVALS AND EVENTS Jack Carlsen, Jane Ali-Knight & Martin Robertson #4107 CELEBRATING A NATIONAL DAY: THE MEANING AND IMPACT OF AUSTRALIA DAY EVENTS Marg Deery, Leo Jago & Liz Fredline #1807 MAJOR SPORTS EVENT MANAGEMENT: THE LOCAL ORGANISING COMMITTEE PRACTITIONER PERSPECTIVE – CURRENT PRACTICE AND FUTURE TRENDS Paul Emery #1507 RESEARCH FINDINGS INTO THE LEVEL OF OCCUPATIONAL HEALTH & SAFETY LEGISLATIVE COMPLIANCE AMONGST A SAMPLE GROUP OF EVENT MANAGEMENT COMPANIES Anthony Evans #0707 AUSTRALIA DAY ALTERNATIVE EVENTS: AN EXPLORATION OF NATIONAL IDENTITY AND NATIONALISM Elspeth Frew & Leanne K. White #1107 PARTNERSHIPS, SOCIAL CAPITAL AND THE SUCCESSFUL MANAGEMENT F SMALL SCALE CULTURAL FESTIVALS: A CASE STUDY OF HOBART’S ANTARCTIC MIDWINTER FESTIVAL Bree Hadley #2407 AN ANALYSIS OF THE ANTECEDENTS INFLUENCING FEMALE ATTENDANCE AT SPORTING EVENTS John Hall, Barry O’Mahony, Peter Oppenheim & Michael Valos #2707 BIG SCREENS: EXPLORING THEIR FUTURE FOR THE SPECIAL EVENT SECTOR Anne-Marie Hede & Stephen Alomes #3907 RETAINING LOYAL VISITORS IN ORGANISING A FESTIVAL; RELATIONSHIP BETWEEN SERVICE QUALITY OF FESTIVAL AND BEHAVIOURAL INTENTION (THE CASE STUDY OF GWAN-JU KIMCHI FESTIVAL) Jung Hwan Kim & Soon Hwa Kang
Transcript of Refereed Papers by Leading Author Paper no. Title …...Fourth International Event Research...

Fourth International Event Research Conference Re-evaluating the City/Town: Events as a Catalyst for Change
Refereed Papers by Leading Author Paper no. Title Author(s)
#3507 ENVIRONMENTAL ACCREDITATION FOR EVENT MANAGEMENT Charles Arcodia & Scott Cohen
#3407 ACCESS: DEVELOPING A RESEARCH AGENDA FOR EDINBURGH FESTIVALS AND EVENTS
Jack Carlsen, Jane Ali-Knight & Martin Robertson
#4107 CELEBRATING A NATIONAL DAY: THE MEANING AND IMPACT OF AUSTRALIA DAY EVENTS
Marg Deery, Leo Jago & Liz Fredline
#1807 MAJOR SPORTS EVENT MANAGEMENT: THE LOCAL ORGANISING COMMITTEE PRACTITIONER PERSPECTIVE – CURRENT PRACTICE AND FUTURE TRENDS
Paul Emery
#1507 RESEARCH FINDINGS INTO THE LEVEL OF OCCUPATIONAL HEALTH & SAFETY LEGISLATIVE COMPLIANCE AMONGST A SAMPLE GROUP OF EVENT MANAGEMENT COMPANIES
Anthony Evans
#0707 AUSTRALIA DAY ALTERNATIVE EVENTS: AN EXPLORATION OF NATIONAL IDENTITY AND NATIONALISM
Elspeth Frew & Leanne K. White
#1107 PARTNERSHIPS, SOCIAL CAPITAL AND THE SUCCESSFUL MANAGEMENT F SMALL SCALE CULTURAL FESTIVALS: A CASE STUDY OF HOBART’S ANTARCTIC MIDWINTER FESTIVAL
Bree Hadley
#2407 AN ANALYSIS OF THE ANTECEDENTS INFLUENCING FEMALE ATTENDANCE AT SPORTING EVENTS
John Hall, Barry O’Mahony, Peter Oppenheim & Michael Valos
#2707 BIG SCREENS: EXPLORING THEIR FUTURE FOR THE SPECIAL EVENT SECTOR Anne-Marie Hede & Stephen Alomes
#3907 RETAINING LOYAL VISITORS IN ORGANISING A FESTIVAL; RELATIONSHIP BETWEEN SERVICE QUALITY OF FESTIVAL AND BEHAVIOURAL INTENTION (THE CASE STUDY OF GWAN-JU KIMCHI FESTIVAL)
Jung Hwan Kim & Soon Hwa Kang

#3707 EVENT MANAGEMENT EDUCATION: THE STUDENTS’ PERSPECTIVE Olga Junek, Leonie Lockstone & Linda Osti
#1607 A STUDY OF THE CHARACTERISTICS OF BUSAN AS A CONVENTION VENUE: ON THE CASES OF BUSAN INTERNATIONAL TRANSPORTATION & LOGISTICS FAIR 2006 AND UN ESCAP MINISTERIAL CONFERENCE
Haesang Kang
#2807 COMMUNICATING WITH RESIDENTS OF HOST DESTINATIONS: AN EXPLORATORY STUDY OF A DISPERSED MEGA-EVENT
Pamm Kellett, Anne-Marie Hede & Laurence Chalip
#3607 DEVELOPING A PROFILE STRATEGY FOR FESTIVALS AND SUPER SCALE EVENTS Chris Kemp
#3207 VOLUNTEER MANAGEMENT OF THE HI SEOUL FESTIVAL Sea Youn Kwak
#2907 “LEARNING THROUGH EXPERIENCE” - A STRATEGY FOR INTEGRATING THEORY WITH PRACTICE IN EVENT MANAGEMENT
David Lamb
#2507 CHARACTERISTICS OF UK ASSOCIATION CONFERENCE DELEGATES Judith Mair & Karen Thompson
#1407 TOWARDS A SYSTEMS-BASED TOOL FOR EVENT EVALUATION AND DECISION SUPPORT
G. Michael McGrath
#2107 COMPARING PERCEPTIONS OF EVENT MANAGEMENT CURRICULUM: A FACTOR CORRESPONDENCE ANALYSIS
Kyong Mo Lee, Myong Jae Lee & Hee Jung Kim
#2207 EVENT SPONSORSHIP BY INDIA’S BEVERAGE SECTOR Miguel Moital, Arjun Bahl & Caroline Jackson
#1307 THE EVOLUTION OF TWO MUSIC FESTIVALS Trevor Mules
#0607 PUTTING ON A GRAND EVENT: BRINGING THE CLASSROOM INTO THE REAL WORLD AS STUDENTS PRODUCE A REAL LIFE EVENT
Josephine Pryce

#1707 LONDON 2012 - WILL IT BE REGENERATION OR RENAISSANCE? Deborah Sadd, Janet Dickinson, Ian Jones & Keith Wilkes
#1907 SUCCESSFUL MANAGEMENT AND ACHIEVEMENTS OF A CITY BASED EVENT AS A STRATEGY FOR DESTINATION MARKETING: THE CASE OF PUSAN INTERNATIONAL FILM FESTIVAL
Eunhee Seong
#2307 HOMELESS WORLD CUP 2006 – PARTICIPANT OUTCOMES Emma Sherry
#4207 RESIDENTS’ PERCEPTIONS OF THE SOCIAL IMPACTS OF COMMUNITY FESTIVALS: A CLUSTER ANALYSIS
Katie Small
#0207 RECRUITMENT AND SELECTION OF FESTIVAL VOLUNTEERS Karen A. Smith & Leonie Lockstone
#2607 APPLICATION OF A VISITOR TRACKING STUDY AS AN EVENT MARKETING RESEARCH TOOL:BREEDEKLOOF FESTIVAL, SOUTH AFRICA
Dimitri Tassiopoulos & Norbert Haydam
#1207 COMPETITIVE EQUESTRIAN SPORTS TOURIST: PROFILE AND SPENDING T A REGIONAL EVENT
Andrea Williams
Working Papers by Leading Author
#4307 ANZAC DAY AT GALLIPOLI: THE EVENT, THE CONSUMER AND THE FUTURE V. John Basarin & John Hall
#0107 STATE INVESTMENT IN MAJOR EVENTS: INTEGRATING CBA WITH ECONOMIC IMPACT ANALYSIS
Larry Dwyer, Peter Forsyth & Ray Spurr
#3307 TELEVISED EVENTS AS AGENTS OF ENVIRONMENTAL INFORMATION IN ORDER TO ENFORCE WOMEN PARTICIPATION IN THE ENVIRONMENTAL-DECISION MAKING PROCESS: THE GREEN OSCARS 2007
Constantina Skanavis & Maria Sakellari

Fourth International Event Research Conference Re-evaluating the City/Town: Events as a Catalyst for Change
STATE INVESTMENT IN MAJOR EVENTS: INTEGRATING CBA WITH ECONOMIC IMPACT ANALYSIS
Larry Dwyer
School of Marketing, University of NSW [email protected]
Peter Forsyth
Department of Economics, Monash University
Ray Spurr Senior Research Fellow, STCRC
INTRODUCTION In recent years a new paradigm has been proposed for assessing the impacts of major events (Dwyer, Forsyth and Spurr, 2005, 2006 a,b, Blake 2005, Madden 2006). One element of this approach emphasizes that the economic assessment models used for estimating the economic impacts of major events should reflect contemporary developments in economic analysis, particularly regarding the use of Computable General Equilibrium modeling. More specifically, this has involved an attack on the uncritical use of Input-output modeling, hitherto the standard technique of economic impact assessment of major events. The thrust of this argument is that computable general equilibrium analysis should replace Input-output analysis as the preferred technique for economic impact assessment of major events. A second element in the new approach involves the argument that event assessment which focuses only on economic impacts is too narrow in scope to provide sufficient information to policy makers and government funding agencies and that where practicable, a more ‘holistic’ approach should be employed to embrace the emerging importance of social and environmental impacts in addition to economic impacts. This holistic approach goes beyond the economic to include considerations such as an event’s social and environmental impacts. For such purposes a cost-benefit analysis is recommended (ACT Auditor General 2004, Jago and Dwyer 2006). Adopting an even wider perspective on post event assessment a growing number of researchers also advocate a triple bottom line approach which also considers the degree to which risks were effectively managed, the compatibility of the event with destination branding strategy and brand exposure, and the highlighting of opportunities to introduce further improvements to future events (Jago and Dwyer 2006). Interestingly, the recently released report of the Victorian Auditor General (State Investment in Major Events May 2007) supports each of these important elements of the new approach to event assessment. The rationale for the report (audit) was that since Victoria’s investment in major events is substantial, decisions about whether or not to invest in major events need to be informed by systematic and rigorous analysis. Appropriate mechanisms are also required to ensure that funding is managed effectively to account for costs incurred and to assess the economic value and broader community benefits generated from the public funds invested. The audit therefore sought to provide independent assurance to Parliament and the community on the robustness of the pre-event and post-event assessment processes.

Specifically, the audit objectives were to examine: first, the soundness of pre-event assessments leading to the recommendation to financially support a major event; second, the management of funding agreements and contractual requirements with major event organizers; third, the post-event evaluations of the economic value derived from major events; fourth to provide independent assessments of the level of economic value derived by Victoria from the 2005 Australian Formula 1 Grand Prix (15). Among the various recommendations were the following (2, 3): That economic impact assessment reports become more rigorous and transparent in terms of the economic models used to estimate economic effects such as changes to the Gross State Product and employment (and) the rationale for key assumptions that have a material effect on the level of economic impacts. In order for government to be more comprehensively apprised of the full range of major event impacts, post-event assessments should be broadened to take, where practicable, a triple bottom line approach embracing not only economic but social and environmental factors but the effectiveness of risk management and continuous improvement arrangements. That cost benefit analysis be employed at the pre-event stage for all events to determine the degree to which anticipated net benefits match the funding sought. For economic impact assessment of special events the audit recommends that Computable General Equilibrium (CGE) replace Input-output (I-O) modeling. To gain a broader perspective on the various costs and benefits associated with an event the audit recommends that a comprehensive cost benefit analysis (CBA) be undertaken, not simply a listing of possible costs and benefits. We agree with the broad thrust of the recommendations made. However, there is one issue that we wish to explore further. The audit treats CGE and CBA as distinct techniques of assessment. It is the purpose of this paper to explore in further detail the relationship between the preferred economic impact assessment tool, CGE modeling and CBA. Ultimately, there can only be one answer to the question of whether an event is economically justified or not. Well conducted CGE impact and CBA studies might point in opposite directions, with one indicating that an event is positive in terms of its economic impacts yet the other indicating that measured benefits are smaller than costs. CGE models and CBA studies focus on different aspects of the economic gains and losses from a project such as an event -neither is entirely comprehensive. There can also be some degree of overlap between the effects taken account of by each of the techniques. The purpose of this paper is to analyse how the information from both studies can be integrated to provide a single answer. The structure of the paper is as follows: First, the recommendations of the audit will be put into perspective within the event assessment literature. Second, the paper will address the issue of how economic impact analysis and CBA can be integrated. We provide a method for integrating the two techniques. Third we provide a case study demonstrating the integrative method. So far as is possible, the measures used in the case study are based upon the results of the CGE modeling of economic impacts and the CBA estimates of benefits and costs published in the audit. The paper concludes with some observations about future challenges in event impact assessment and wider evaluation issues. REFERENCES

ACT Auditor General (2002). ACT Auditor General’s office performance audit report V8 car races in Canberra –costs and benefits, Canberra, ACT
Blake A (2005) ‘The Economic Impact of the London 2012 Olympics’ TTRI Discussion Paper 5/2005 Christel DeHaan Tourism and Travel Research Institute Nottingham University Business School
Dwyer, L., Forsyth, P. & Spurr, R. (2005). ‘Estimating the impacts of special events on the economy’, Journal of Travel Research, vol. 43, pp. 351-359.
Dwyer L, P. Forsyth, R. Spurr (2006a) “Assessing the Economic Impacts of Events: A Computable General Equilibrium Approach” Journal of Travel Research Vol. 45, pp 59-66.
Dwyer, L., Forsyth, P. & Spurr, R. (2006b). ‘Assessing the economic impacts of special events’ in: L. Dwyer & P. Forsyth (Eds). International Handbook of Tourism Economics, Edward Elgar, England.
Jago L., and L. Dwyer (2006) Economic Evaluation of Special Events: A Practitioners Guide Common Ground Publishing Pty. Ltd. Altona, Australia
Madden J. (2006) ‘Economic and Fiscal Impacts of Mega Sporting Events: A General Equilibrium Assessment’ Public Finance and Management Volume Six, Number 3, pp. 346-394
Victorian Auditor General (2007) State Investment in Major Events Victorian Government Printer, Victoria, May

Fourth International Event Research Conference Re-evaluating the City/Town: Events as a Catalyst for Change
RECRUITMENT AND SELECTION OF FESTIVAL VOLUNTEERS
Karen A. Smith Victoria University of Wellington
Leonie Lockstone Victoria University
ABSTRACT Volunteers are a vital human resource for events and this paper evaluates approaches to their recruitment and selection. Taking a comparative organisational methodology, data is presented from qualitative interviews with organisers of twelve reoccurring festivals in Victoria, Australia. The analysis demonstrates that event organisers need to encourage bounce-back from past episodic volunteers through a combination of appreciation and rewards. New operational volunteers come from two sources: individuals in the local community largely recruited informally through word of mouth; and outsourced recruitment of groups of volunteers. The latter can strengthen relationships with a festival’s community and other stakeholders, including sponsors. Unlike mega-events, little selection of volunteers takes place at these reoccurring events. Any screening of individuals is largely informal, unless in roles working directly with children. Examples are included of events thinking creatively about ways of diversifying their volunteer base and increasing formalisation of their volunteer management.
INTRODUCTION Volunteers play a vital role in the organisation and delivery of many events, the importance of which has only recently gained wide acknowledgement in the literature (Ralston, Lumsdon and Downward 2005). Volunteers contribute to the economic viability of events (Ralston et al. 2005), the quality of service delivery (Reeser, Berg, Rhea and Willick 2004) and the visitor experience and satisfaction (Karkatsoulis, Michalopoulos and Moustakatou 2005). Volunteers can become the public face of an event, with their enthusiasm, commitment and service drawing praise from organisers, spectators, participants, and the media. To date, events research has largely focused on volunteers once they are involved with a specific event. In contrast, this paper focuses on how event organisers attempt to recruit volunteers to provide the human resources necessary to run events and festivals. Recruitment is crucial for the success of a volunteer programme and often the sustainability of an event organisation. However, recruitment is a significant challenge for those managing volunteers (Hager and Brudney 2004; Zarinpoush, Barr and Moreton 2004; Volunteering Australia 2006). Hall, McKechnie, Davidman and Leslie (2001) suggest that volunteers are becoming more selective in their choice of volunteering activities and are looking for new ways of volunteering. In response to changing demands and needs of volunteers, there is an acknowledged trend towards more flexible volunteering commitments (Gaskin 2003; Brudney 2005; Merrill 2006), including one-off and short-term volunteering. These can be referred to as ‘episodic’ volunteering, and increasingly this form of volunteering is being seen as distinct from the on-going or sustained commitment of many traditional volunteering situations (Bryen and Madden 2006). The volunteering literature often cites special events as a typical episodic volunteering arrangement (Borgiattino 2005; nfp Synergy 2005). Nevertheless, from the events

literature it is evident that the event volunteering situation is more multifaceted. A number of studies make the distinction between core and non-core event volunteers (for example, Saleh and Wood 1998; Handy, Brodeur and Cnann 2006). Core volunteers make greater time commitments, typically over a longer period, and often in organisational, managerial or governance roles within the event organisation. In contrast, non-core (or rank-and-file) volunteers largely work only during the delivery of the event. It is this latter group that can be classified as episodic, and these form the focus on this paper. Increasingly, more complex typologies or continua of event volunteering are being proposed, recognising that while the volunteering activities may be short-term, the volunteers may return or re-engage with a single organisation in a series of episodic relationships. Bryen and Madden (2006) use the term ‘bounce-back’ to describe this situation. Macduff (2005), Bryen and Madden (2006) and Handy et al. (2006) each offer multiple categories of episodic volunteers based on the time, duration, and bounce-back of service. There is a growing body of literature examining volunteer workers at events, mainly, but not exclusively, at sporting and mega events. These works primarily consider volunteer motivations, expectations and satisfaction (Saleh and Wood 1998; Kemp 2002; Twynam, Farrell and Johnston 2002/03; Ralston, Downward and Lumsdon 2004; Reeser et al. 2004; Monga 2006); and aspects of commitment (Elstad 2003; Cuskelly, Auld, Harrington and Coleman 2004; Green and Chalip 2004). Researchers have also considered particular volunteer management challenges for event organisers, including scheduling (Gordon and Erkut 2004), training (Kemp 2002), assessment of the economic value of volunteers’ work (Solberg 2003), and recruitment and retention (Coyne and Coyne 2001). The majority of this research focuses on collecting data from the volunteers themselves, rather than an organisational perspective. Case-studies of individual events dominate, with a few exceptions where multiple events are compared (for example, Monga and Treuren 2001; Cuskelly et al. 2004; Handy et al. 2006). This paper study also takes a multi-event approach, and attempts to contribute to the understanding of the organisational approaches to volunteer management. Previous studies considering the recruitment and selection of event volunteers are discussed before the presentation of findings from twelve festivals involving volunteers. The findings discuss the ways in which event organisers can encourage volunteers to return, or bounce-back, and then consider the dominant approaches to the recruitment, selection and screening of new volunteers. RECRUITMENT AND SELECTION OF EVENT VOLUNTEERS Notwithstanding an increased desire for episodic volunteering opportunities, recruitment is a particular challenge for events (Saleh and Wood 1998). The pulsating nature of event organisations creates challenges in retaining personnel throughout the event operating cycle; Hanlon and Jago (2004) consider this in relation to paid employees, however similar concerns may exist in retaining a pool of volunteers from year to year. The recruitment process is important for inspiring volunteers whilst creating realistic expectations regarding workload commitments, responsibilities, organisational support, and the overall volunteer event experience (Williams, Dossa and Tompkins 1995; Ralston et al. 2004). During recruitment, the core values of the organization (Karkatsoulis et al. 2005) and the benefits of volunteering can be communicated (Downward, Lumsdon and Ralston 2005). The recruitment process can also be a source of dissatisfaction which can influence other expectations of the event volunteering experience (Ralston et al. 2004). For those recruiting episodic volunteers, it also has to be considered that the retention or re-enlistment rate of ‘veteran’, or repeat, volunteers will partly determine how many new

volunteers need to be recruited (Coyne and Coyne 2001). Bryen and Madden (2006) conceptualise this as ‘bounce-back’, the re-engagement or return of episodic volunteers, although the extent to which this is incorporated into recruitment policies is not clear. Event organisations can use a range of methods to recruit volunteers, and previous research indicates the importance of informal word-of-mouth recruitment (Williams et al. 1995; Coyne and Coyne 2001; Monga and Treuren 2001). While case studies and post-event evaluation reports (for example, Manchester 2002; SOCOG 2002) detail the recruitment methods events have used to attract volunteers, there is little work exploring the range of options available to the event organiser, or how organisers perceived the value of different recruitment methods. Once attracted to volunteer at an event, how are individuals then selected to fill the available volunteering roles? Selection and screening for the most suitable, competent and motivated candidates is important for the success of the event, the quality of service delivery (Reeser et al. 2004) and also contributes to a volunteer’s evaluation of their experience (Ralston et al. 2004). Data suggest that sporting mega-events suggest receive many more applications than there are volunteer positions and post-event reports (for example, Manchester 2002; SOCOG 2002; Walker 2002; Karkatsoulis et al. 2005) contain descriptive details of the selection process and sometimes the selection criteria. Many events have application forms, variously submitted by post or online, and even at large scale events, interviews are a commonly used selection tool. However, the event organiser’s rationale for adopting particular selection procedures (for example, interviews), and the perceived value and usefulness of these strategies, has not been explicitly considered in previous research. At reoccurring events, retaining volunteers reduces the requirement for future recruitment, and builds a core of experienced and competent volunteers (Saleh and Wood 1998; Coyne and Coyne 2001; Downward et al. 2005). While the desirability of retaining past volunteers is widespread, it is not clear in studies (for example, Coyne and Coyne 2001) whether previous volunteers who are interested in return are automatically taken on, undergo any additional screening or assessment of their past performance, or perhaps have to re-apply with other new applicants. METHODOLOGY This paper addresses two aspects of the involvement of event volunteers. First, which methods are used to recruit event volunteers and what factors influence an organiser’s choice of recruitment methods? Second, how, if at all, does the screening and selection of potential volunteers occur and what is the perceived value of the different methods? In contrast to the dominant approach of event volunteering research to date, with its emphasis on case studies of single events and collecting data from the volunteers themselves, this study takes a comparative organisational perspective. Data was gathered using semi-structured interviews with the person, or persons, responsible for the management, specifically the recruitment, of volunteers at twelve special events across the Australian state of Victoria. Interviews lasted between forty minutes and two hours, and covered the role of volunteers in the organisation, the rationale for their involvement, approaches to recruitment and selection, including the reasons for using particular recruitment, selection and screening methods. This qualitative approach produced rich data and enabled themes to be explored in depth with participants. Notes were taken at each interview and, where permission was given, interviews were recorded and later transcribed. These were analysed by identification of key themes which were developed from the research questions, with additional themes emerging from the data. To maintain the confidentiality of respondents (a requirement human ethics committee approval), the selected direct quotes and case studies used to support the discussion are referred to anonymously. A profile of the festivals is given in Table 1.

All twelve events are cultural festivals, and are large enough (in size or profile) to attract both local and non-local attendees. The sample includes arts, music, food and wine, and annual celebrations (Christmas, Easter, etc.); originally sporting events were included in the study, but those approached declined to participate. The events were selected purposefully to obtain a mix of locations (metropolitan, regional centres, country). Five events were managed by local councils. The remainder were voluntary organisations governed by a volunteer committee or trustees. Of these, in four cases [I, J, K and L] the event was managed by these volunteer committee members; events B and H employed paid management staff year-round; and event G was managed as a short-term paid consultancy. All events reoccur on an annual basis.
Table 1 Profile of Festivals
Type of festival
Type of governance
Type of management†
Location Approx no. of volunteers involved in most recent
event
Event duration
A Community Council Paid staff Metropolitan 100 1 day B Arts Voluntary Paid staff Metropolitan 30 17 days C Community
arts Council Paid staff Metropolitan 1,000+ 4 days
D Floral Council Paid staff Regional centre
100 3 days
E Community Council Paid staff Regional centre
400 4 days
F Children’s Council Paid staff Regional centre
1,100 8 days
G Music Voluntary Paid staff Regional centre
33 3 days
H Arts Voluntary Paid staff Regional centre
220 3 months
I Wine & Food
Voluntary Volunteer Country 30 2 days
J Music Voluntary Volunteer Country 80 3 days K Community Voluntary Volunteer Country 67 5 weeks L Music Voluntary Volunteer Country 1,000 4 days † Event managed primarily by paid staff or volunteer committee; some volunteer-run events may additionally employ paid staff in support roles or during the delivery of the event. FINDINGS This analysis focuses on the involvement of non-core or rank-and-file volunteers (classified as episodic), those working in operational roles, primarily during the event but also in the immediate build-up and shut-down periods. It excludes those volunteers working primarily in managerial and governance positions, although it is important to acknowledge that they may also give their time in operational roles during the event. Many events rely on returning volunteers, therefore firstly, the ways that organisations encourage volunteers to bounce-back are considered. Second, the recruitment, selection and screening of new volunteers is discussed. Examples are used to illustrate best practice of events that have moved beyond the dominant word of mouth approach to recruitment and have been innovative in their approach to involving new volunteer workers. Encouraging Volunteers to Bounce-back

All but one of the events heavily rely on returning, or bounce-back, volunteers; having three-quarters of volunteers returning each year is not unusual. The main advantage to the event of bounce-back volunteers is they bring their past experience and knowledge of the event and tasks; for example: “[They] understand the culture of how the Festival operates” [Festival B]. Often volunteers return to the same role, and over time build up confidence, expertise and ownership. Repeat volunteers often require less training and involvement from management. One organiser suggested that as volunteers “become more regular they become more reliable” [Festival L] and experienced volunteers can also be more flexible and open to last minute requests. In general, past volunteers are contacted first to ascertain how many want to return; other recruitment methods will then be considered to fill the gaps. Organisers did reflect on a volunteer’s past performance, and if they were judged to have been unsuitable, they may be invited back but in a different role, or simply not contacted again. In general, returning volunteers did not have to formally reapply; an exception was the children’s event which requires an annual police check, so past volunteers have to re-submit an application. Event organisers were asked why they thought volunteers returned to volunteer at their event, and how they encourage bounce-back. From the organisation’s perspective, this was related to how they treat volunteers during their volunteering, and how they reward them; summarised by one respondent as: “Because we look after them during and after the event” [D]. During the event, organisers focus on the intangibles: enjoyment, atmosphere, making the volunteers feel welcome and involved: “they’re all acknowledged by name and they feel like they’re actually part of it, [that] they are an important part” [F]. Following the event, the focus is on thanking the volunteers (in person and by letter), showing appreciation, and giving opportunities for socialising, including post-event functions. Acknowledgement can also come from and via other external stakeholders. Those offering free tickets in return for volunteering felt that while this might attract first-time applicants, it was not a significant factor in retaining bounce-back volunteers. Most event organisers maintain a volunteer database and use this to target previous volunteers. In addition, occasional, but on-going, communication with these volunteers has a role in maintaining their involvement, and commitment to, the event: “touching base with volunteers, not just disappearing from their lives” [D]. The notion of a being part of the festival ‘family’ was referred to on a number of occasions. Encouraging bounce-back is not without its challenges, not least making volunteers feel involved in the event. Other commitments mean volunteers are often not available every year. The only event without a strong returning cohort of volunteers observed that they found it “difficult sometimes to keep up with volunteers because we find sometimes some of the younger ones, they move on, they disappear, […] we lose contact with them” [E]. Relying on returning volunteers also means they age with the event and it can be a challenge to involve new and younger people. Recruiting New Volunteers While relying on bounce-back volunteers can bring benefits, all events require at least some new volunteers each year to replace those who have left or are unavailable, or to grow the volunteer pool. The remainder of this discussion focuses on the ways event organisers attempt to attract new volunteers to their festival. While each event has a different strategy, they all use a combination of multiple recruitment methods. Evidence from these festivals is that event organisers recruit new rank-and-file volunteers from two main sources: individuals from the local community; and groups of volunteers from local clubs and associations, educational institutions, and other event stakeholders.

The first source of volunteers is to recruit individuals from within the local community, and occasionally beyond. The main way of getting individuals involved is through word of mouth with potential volunteers suggested by existing volunteers, committee members, and the organisers themselves. This has a number of advantages: “…they know the festival and they know someone who works [here], so they know what the work entails” [L]. Consequently, “because of the way we recruit people, word of mouth, it’s very unusual for people come and say look I don’t like this” [H]. The willingness to suggest friends as volunteers also indicates that the current volunteers feel satisfied and appreciated. Personal contacts are also often used when there is a last-minute need for additional volunteers, and whilst they may be “doing it as a personal commitment to you”, rather than a commitment to the event, you “know them and know them to be reliable” [G]. This ability to judge reliability and trust via word of mouth was a reoccurring theme. The notion of community, and knowing everyone within a community, was strong not just in the country settings but also in the larger regional centres; indeed, this was mentioned everywhere except Melbourne. Event organisers place recruitment advertisements for volunteers in a range of outlets, including print media (particularly local newspapers and council newsletters), the event’s own publications (programmes and website), and occasionally on general volunteering websites (for example, www.govolunteer.com.au). While most event organisers noted a limited response to adverts, one festival [B] had previously being overwhelmed with applicants following an advert in The Age. Overall, adverts were mainly seen as a way of raising awareness of the event and its need for volunteers, with other recruitment methods also required. Most events primarily recruit from their local community, however there are cases, particularly arts and music festivals, where volunteers are sourced from a special-interest community that can be spread over a wider geographical area, potentially including overseas. For these festivals, the Internet is a key recruitment tool. In comparison, most of the other festivals use their website primarily for information about the event, rather than as an active volunteer recruitment tool. Where events attract non-locals to volunteer, there is scope to recruit individuals from the volunteer pools of other similar events; this cross-fertilisation was evident at the two music festivals. A perceived disadvantage of some recruitment methods, particularly advertisements and responding to unsolicited applications, was they attract the ‘wrong’ volunteers. To overcome some of the concerns over recruitment methods, some events out-source elements of their volunteer recruitment and selection. While there were mixed attitudes towards using job or employment networking organisations, there were generally more positive experiences of volunteer resource centres.
CASE STUDY: Event E is an annual community celebration managed within the city council. Previously they relied on a range of recruitment methods, including advertisements and responding to enquiries, however, they now source most new volunteers through the local Volunteer Resource Centre. The event organisers provide the Centre with job specifications and the Centre access their database of potential volunteers and also advertise the roles in the Centre and via their publications and website. The Centre takes on co-ordination for recruitment and screening, both time consuming activities; this leaves the event staff able to focus on other responsibilities. The Centre “act as a filter”, and have enabled the event to formalise its approach to volunteers and feel more confident about the suitability of the individuals recruited to volunteer.

Targeting those who already have links with the event is also an option. For example, previous visitors have both witnessed the roles volunteers undertake, and may also see volunteering as a way of giving back to the festival as an acknowledgment of previous enjoyment at the event, often with an element of nostalgia or personal heritage attached to the event. At events with competitors or other participants, their friends and relatives can be recruited as volunteers, particularly when they can benefit from free tickets to other elements of the event. The second source of volunteers is through various established groups within the community. This can work in two ways. First, groups are seen as a source of individual volunteers, for example, advertising for volunteers through a group’s newsletter where interested members contact the event direct. Second, and more common, events work with particular groups who then access their membership to provide the event with volunteers. The event focuses on recruiting the groups, and the groups then recruit the volunteers, and may also manage them during the event. Those interviewed work with a diverse range of community groups and associations, including scouts, sports clubs, churches, Rotary, Lions, Probus clubs, and specialist groups such as woodwork clubs. Often the event already has a link to the group, either historically or typically an event committee member will also be involved in the group. Out-sourcing volunteer recruitment and, potentially co-ordination, to established groups brings a number of benefits to the event organiser. There is one contact point within the group and the event’s relationship can focus on that person, which makes communication more effective. The volunteers already know each other and hopefully work well as a team: “We don’t have to worry about breaking down boundaries as far as people not being comfortable around each other” [A]. The contact person will have a better knowledge of each person and their capabilities and how best to manage them. Normally, events will allocate a particular duty or area to each group (for example, car parking, stewarding, or the children’s area); importantly, this can give the group and members a sense ownership. Successful group arrangements involve building on-going, long-term and mutually beneficial relationships with a group and their key contact, and having clear lines of communication. This creates a situation of trust and reliability. There are suggestions that in this model, individuals may feel more commitment towards their club or group rather than the event, and while this is not necessarily a problem, it is an area that warrants further investigation. Many council-run events tap into other volunteering groups within their council, most notably, visitor information centre or city ambassador programmes. These have a large pool of available volunteers, and their experience and knowledge mean that training often involves only a briefing about the specifics of the event. They often undertake tourist information-based responsibilities at the events, which is “fantastic as that’s their usual volunteering role” [C]. These volunteers may be integrated into the general pool of volunteers or, more commonly, co-ordinated by their usual visitor information centre volunteer manager. Two events have looked beyond community groups for their volunteers and work with local businesses who provide staff, either through an organised employee volunteer programme, or as part of a sponsorship arrangement with the event.
CASE STUDY: Event D, has been concerned about the ageing profile of their current volunteers and the organisers have attempted to attract younger volunteers. Most successful has been linking with a bank’s employee volunteering scheme. As part of their commitment to community involvement, the bank provides staff with two days of paid volunteer leave each year. The festival participates in the scheme and these bank employees are brought into the main volunteering pool during the event and individual’s details are entered into the volunteer database for future contacts. A

relationship is also maintained directly with the bank and a separate information session is run for these volunteers.
CASE STUDY: The council events team [A] run events and celebrations throughout the year and work with a range of community groups who provide their members’ services as volunteers. In particular, they have encouraged local businesses who sponsor the events to get their staff involved: “A lot of organisations are looking for staff to donate their time in a way that’s fun” and it also gives them more involvement and ownership over the events. In addition, each year a charity benefits from funds raised at the Christmas event, and as part of this agreement the charity supply volunteers to work at the festival, either drawn from their existing volunteer supporters, or recruited by the charity to volunteer specifically at the event. This festival has successfully tapped into their network of stakeholders to expand their supporters’ contributions to the event.
The final established group of volunteers that can be accessed are students, usually on degree or TAFE courses, but also at secondary school. Recognising the need to gain experience for future employment, some events work with institutions offering event management, tourism and hospitality qualifications, and involve students in event planning and behind-the-scenes: “we try and make it so as their volunteering can actually complement the study that they’re doing” [F]. Organisers stress the need for aspirant event professionals to understand the realities of the industry: “get out there and see what it’s all about because it is an incredibly rewarding experience but it’s also a lot of hard work” [A]. Particular courses can be targeted to recruit students with specific skills, for example, those on early education courses to run children’s activities. As with community groups, the initial, and often ongoing, contact is with one person, the lecturers and teachers. A fundamental element of volunteering definitions is a lack of payment, however, two of the voluntary organisations in this study paid their volunteer groups for their services [I and L]. For these voluntary events, both in rural locations with small resident populations, paying the contributing groups is a means to recognising the community’s commitment and ownership of the event, and a way of investing the proceedings of the event back into the community and local economy. Payments, or fees, are calculated on the number of volunteers hours required for a particular task. Despite the payment, these are still perceived as volunteers, “because you’re not giving each individual person money” [I]. Selection and screening While most event organisers are happy with the current number of volunteers, they would also be willing to take more. Only two [B and J] had to turn excess volunteers away, and in one case this was people approaching them just before the event. Others expressed a desire for additional volunteers in particular roles, or to be able to get volunteers to commit earlier. Only one event felt it had a serious recruitment problem, largely due to the late organisation of volunteering at the festival. However, few were in the position to turn down prospective volunteers due to an over-supply of applicants. Given this situation, organisers take a relatively open approach to selection, wanting to encourage participation, and are willing to give people a chance. For example:
“The Festival really does embrace the volunteers. We’re very open to whoever wants to come along and if there are issues with volunteers we try and manage those issues rather than turn them away from the event and put them in positions that would be suitable.” [F]
Although selection, or choosing between candidates, was not a requirement for the majority of these events, there was a general recognition of the need to screen applicants; this was seen as a duty of care: “to the audience as well as to ourselves and the volunteers themselves, that it has

to be done in a formal way” [E], screening can also be a “safeguard” for the event organisers [H]. Nevertheless, overall, screening of volunteers is kept relatively informal. More formalisation is avoided for a range of reasons: it would put people off applying, particularly some younger and older applicants; screening “is not that big a deal for people, because they are recruited through word of mouth” [G]; and the volunteer-run nature of an event, and its small scale, does not fit with a highly formalised approach. Even those adopting more formalised screening methods, typically council-managed events, mentioned “people often judge their own suitability for a role” [D]. Broadly, there could be five stages in the screen of event volunteers: the initial contact, written application, interview, references, and police check (figure 1). In practice, screening may be confined to a single conversation with a prospective volunteer, particularly when recruited through word of mouth channels.
Figure 1 Main recruitment and screening methods for festival volunteers
Screening begins at the first contact point, and organisers use this to get an initial impression of the applicant. Less than half of events in this study had a formal application form; those that did generally used it to collect contact information, availability, and an indication of the role or area applicants wanted to volunteer in. Subsequently, an interview of some kind may take place, although organisers stress that this is very informal and may be face to face or by telephone or email. This interview is usually focused around finding out more about the applicant and their motivations or interest in volunteering, and matching them to a suitable role. This informal nature suits many organisations, because of their small size, their informal working culture, and the nature of the volunteering relationship. References may be asked for on an application form; however these are often not taken up unless doubts are raised during other parts of the screening process. Recruiting via word of mouth often means that organisers feel additional more formalised screening methods are not required. Organisers usually ask the person who recommended the prospective volunteer or “we know them and what they are able to do, and in [this city] everyone knows everyone, especially within communities such as the music community, or if we don’t know someone, we know someone who does” [G].
Community group or
association
Volunteer Resource
Centre
Advertisements (inc. Internet)
GROUPS
Word of mouth
INDIVIUDALS
Rec
ruitm
ent
Scre
enin
g
“Interview”
Initial contact – informal chat
Written application
References
Police Check / Statutory Declaration
VOLUNTEER AT EVENT

It is acknowledged that some volunteers may find overt checking a sensitive topic and its can go against a desire to “embrace community spirit” [D], and some volunteers, particularly those previously involved, may feel insulted. Nevertheless, “people are mostly okay with police checks as they understand they are required” [D]. Events and roles working directly with children require police checks or a statutory declaration that they have no police record. None of the events reported having to reject any one on the basis of a police check, but two noted that if volunteers are not happy with being asked they are likely to place themselves in other roles not with children or “if they know that they’ve got history then you just don’t hear from them again” [F]. When volunteer recruitment is outsourced, to either a Volunteer Resource Centre or other groups, the responsibility for screening individuals is also passed on, with the exception of the children’s festival who, given the focus of their event, process all police checks themselves. CONCLUSIONS AND IMPLICATIONS By focusing on reoccurring events and cultural festivals, this study offers a counterbalance to the dominance of research on volunteering at sporting and mega events. It moves away from a focus on the volunteers themselves and the single case study event, and takes a comparative approach, drawing on the experiences and opinions of event organisers responsible for volunteer management. Although the sample size is restricted to twelve festivals, the qualitative approach has produced rich, in-depth data and goes beyond just detailing research and selection methods to start identifying the perceived value of different recruitment strategies. This research gives weight to the observation that event volunteering is not just once-off, rather episodic volunteering can incorporate bounce-back, and this can be related to motivation, satisfaction and commitment. It is evident that involving volunteers in reoccurring events brings different challenges to one-off mega events, and there is scope for the application of work on pulsating organisations (Hanlon and Jago 2004) to include the implications for the management of volunteers as well as paid staff. The reality for reoccurring events is they come to rely on a returning cohort of volunteers, so recruitment is as much about retention: satisfying volunteers by offering them a rewarding experience and acknowledging their input, in an effort to encourage their return. Future research should explore, from the volunteer’s perspective, what encourages them to bounce-back, and include a more overt consideration of repeat volunteering in the established areas of volunteer motivation and commitment. For new volunteers, there are two main sources of operational volunteers: individuals and groups. Choice of recruitment methods is linked to whether organisers believe they are able to attract reliable and trustworthy volunteers. An informal approach to recruitment relies on a sense and knowledge of community and, as suggested in previous research (Williams et al. 1995; Coyne and Coyne 2001; Monga and Treuren 2001), for individuals, word of mouth recruitment dominates. Advertisements also play a role in raising awareness of event volunteering opportunities, and festivals which can tap into an established special-interest community are also using the internet for recruitment. Outsourcing recruitment and co-ordination to a trusted third party, such as a Volunteer Resource Centre, can increase the formalisation and rigour of an event’s recruitment processes and free event staff from this time-consuming role. The benefits of outsourcing also lie behind the recruitment of groups of volunteers, where the event organiser can focus on building relationships with the key contact, and the group can take ownership of the event, or an element of it. While the focus is on local community groups, the case studies in this paper demonstrate the scope to use volunteering to strengthen relationships and involvement of the local business community through employee volunteering schemes and sponsorship arrangements. Unlike once-off mega events whose volunteer programmes are typically hugely over-subscribed (Manchester 2002; SOCOG 2002; Walker 2002; Karkatsoulis et al. 2005), reoccurring events

are rarely in a position to choose between various applicants to fill a limited number of roles. Rather, selection focuses on screening volunteers to assess their individual suitability. An informal approach to selection and screening, along with a focus on word of mouth recruitment, fits with the organisational cultures of these festivals. Screening may be confined to an informal discussion with a potential volunteer, although some events, particularly those run by councils, have procedures for more structured written applications, interviews, and reference checks. The only standardised step is for volunteer roles that involve working directly with children, when police checks or statutory declarations are sought. Further analysis will be undertaken to explore what makes a suitable, or unsuitable, candidate, but the overwhelming evidence is that few, if any, applicants are rejected. Future research should contrast this organisational perspective with the opinions of newly recruited and veteran volunteers and their subsequent volunteering experiences. This could explore the relationship between the means of recruitment and retention rates, or the extent of selection and screening and the subsequent performance of volunteers. By taking a comparative methodology, it is evident that while each festival has its own approach to recruitment and selection, there are commonalities in the event sectors’ involvement of volunteers, but also innovation and examples of events thinking creatively about ways of diversifying their volunteer base and increasing formalisation of their volunteer management. REFERENCES Borgiattino, S. (2005). Promoting + Developing Volunteering. Brussels, EFIL. Brudney, J., Ed. (2005). Emerging Areas of Volunteering. ARNOVA Occasional Paper Series.
1 (2). Bryen, L. and K. Madden (2006). Bounce-back of episodic volunteers: what makes episodic
volunteers return? Working Paper No. CPNS 32. Brisbane, Queensland University of Technology.
Coyne, B. S. and E. J. Coyne (2001). "Getting, keeping and caring for unpaid volunteers for professional golf tournament events’ Human Resource Development International 4(2): 199-214.
Cuskelly, G., C. Auld, M. Harrington and D. Coleman (2004). ‘Predicting the behavioural dependability of sport event volunteers’ Event Management 9: 73-89.
Downward, P., L. Lumsdon and R. Ralston (2005). ‘Gender differences in sports event volunteering: insights from Crew 2002 at the XVII Commonwealth Games’ Managing Leisure 10: 219-236.
Elstad, B. (2003). ‘Continance commitment and reasons to quit: a study of volunteers at a jazz festival’ Event Management 8: 99-108.
Gaskin, K. (2003). A Choice Blend: what volunteers want from organisation and management. London, Institute for Volunteer Research.
Gordon, L. and E. Erkut (2004). ‘Improving volunteering scheduling for the Edmonton Folk Festival’ Interfaces 34(5): 367-376.
Green, B. C. and L. Chalip (2004). ‘Paths to volunteer commitment: lessons from the Sydney Olympic Games’ in R. Stebbins and M. Graham. (Eds) Volunteering as Leisure/Leisure as Volunteering: an international assessment. Oxfordshire, CABI Publishing: 49-67.
Hager, M. and J. Brudney (2004). Balancing Act: The challenges and benefits of volunteers. Washington, The Urban Institute.
Hall, M., A.-J. McKechnie, K. Davidman and F. Leslie (2001). An Environmental Scan on Volunteering and Improving Volunteering. Toronto, Canadian Centre for Philanthropy.
Handy, F., N. Brodeur, et al. (2006). ‘Summer on the island: episodic volunteering’ Voluntary Action 7(3): 31-46.
Hanlon, C. and L. Jago (2004). ‘The challenge of retaining personnel in major sport event organizations’ Event Management 9(1/2): 39-49.

Karkatsoulis, P., N. Michalopoulos and C. Moustakatou (2005). ‘The national identity as a motivational factor for better performance in the public sector: the case of the volunteers of the Athens 2004 Olympic Games’ International Journal of Productivity and Performance Management 54(7): 579-594.
Kemp, S. (2002). ‘The hidden workforce: volunteers' learning in the Olympics’ Journal of European Industrial Training 26(2): 109-116.
Macduff, N. (2005). ‘Societal changes and the rise of the episodic volunteer’ in J. L. Brudney (Ed) Emerging Areas of Volunteering: ARNOVA Occasional Paper Series. 1 (2): 49-61.
Manchester 2002 (2002). Post Games Report. Manchester, Manchester 2002 The XVII Commonwealth Games.
Merrill, M. V. (2006). ‘Global trends and the challenges for volunteering’ The International Journal of Volunteer Administration XXIV(1): 9-14.
Monga, M. (2006). ‘Measuring motivation to volunteer for special events’ Event Management 10(1): 47-61.
Monga, M. and G. Treuren (2001). ‘Employment relations without paid work: an exploration into the HRM and motivations of special event volunteers’ in K. Spooner and C. Innes (Eds) Employment Relations in the New Economy: Proceedings of the Ninth Annual Conference of International Employment Relations Association, University of Technology, Sydney. 445-458.
Monga, M. and G. Treuren (2001). ‘Human Resource Management practices in several South Australian special event organisations’ in K. Spooner and C. Innes (Eds) Employment Relations in the New Economy: Proceedings of the Ninth Annual Conference of International Employment Relations Association, University of Technology, Sydney. 459-474.
nfp Synergy (2005). The 21st Century Volunteer: A report on the changing face of volunteering in the 21st Century. London, nfpSynergy.
Ralston, R., P. Downward and L. Lumston (2004). ‘The expectations of volunteers prior to the XVII Commonwealth Games, 2002: A qualitative study’ Event Management 9(1/2): 13-26.
Ralston, R., L. Lumsdon and P. Downward (2005). ‘The Third Force in event tourism: volunteers at the XVII Commonwealth Games’ Journal of Sustainable Tourism 13(5): 504-519.
Reeser, J. C., R. L. Berg, et al. (2004). ‘Motivation and satisfaction among polyclinic volunteers at the 2002 Winter Olympic and Paralympic Games’ British Journal of Sports Medicine 39: e20.
Saleh, F. and C. Wood (1998). ‘Motives of volunteers in multicultural festivals: the case of Saskatoon Folkfest’ Festival Management and Event Tourism 5(1/2): 59-70.
SOCOG (2002). Official Report of the XXVII Olympiad. Volume One: Preparing for the Games. Sydney, Sydney Organising Committee for the Olympic Games.
Solberg, H. A. (2003). ‘Major sporting events: assessing the value of volunteers’ work’ Managing Leisure 8: 17-27.
Twynam, D., J. Farrell and M. Johnston (2002/03). ‘Leisure and volunteer motivation at a special event’ Leisure/Loisir 27(3/4): 363-377.
Volunteering Australia (2006). National Survey of Volunteering Issues 06. Melbourne, Volunteering Australia, Inc.
Walker, M. P. (2002). ‘Going for customer service gold’ T&D May: 62-69. Williams, P. W., K. B. Dossa and L. Tompkins (1995). ‘Volunteerism and special event
management: a case study of Whistler’s Men’s World Cup of Skiing’ Festival Management and Event Tourism 3(2): 83-95.
Zarinpoush, F., C. Barr and J. Moreton (2004). Managers of Volunteers: a profile of the profession. Toronto, Canadian Centre for Philanthropy.

Fourth International Event Research Conference Re-evaluating the City/Town: Events as a Catalyst for Change
PUTTING ON A GRAND EVENT: BRINGING THE CLASSROOM INTO THE REAL WORLD AS STUDENTS PRODUCE A REAL LIFE EVENT
Josephine Pryce
School of Business, James Cook University [email protected]
ABSTRACT This paper reports on students experiences as participants in managing a real life event for a conference and event management subject. It presents students evaluations of their experiences in planning, organising, and managing the event. The event was a culminating experience for students in their final semester at university. Results were collated from a questionnaire administered to students at the completion of the event. While the questionnaire focused on particular dimensions, students were encouraged to provide comments on their experience. The paper presents both quantitative and qualitative findings. The quantitative findings are drawn from responses to the eleven questions on a five-point Likert scale. The qualitative responses add richness to the depth of understanding of students’ experiences in running the event. The overall consensus was that authentic learning provides a valuable opportunity for students to learn first hand about the industry. Further, the results emphasise the value of authentic learning in hospitality education. They highlight the importance of communication, teamwork and enthusiasm for such an experience to be rewarding and successful. In addition, the results show that dependability, cooperation, and respect are key factors.
INTRODUCTION Hospitality is a dynamic and industry-based specialization. As Richards (2000) states, “[It is] global in nature and real-world oriented”. Hence, it makes sense to teach hospitality subjects in a non-traditional classroom fashion. Educators have long recognised the value of learning through participation (Edwards, 2005). Moscardo and Norris (2005, p. 47) note, “Convention and event management is a relatively new area of hospitality and tourism education that offers an opportunity to provide students with the real world practical and applied experience that many seek”. Ritchie (1993, in Moscardo & Norris, 2005, p.1) supports this view and concludes that hospitality educators need “to prepare students for long term success in their careers”. Similarly, Edwards (2005, p. 60) acknowledges that it is important to focus on “the authenticity of the learning situation as representative of the specific practice”. Prospective hospitality professionals need to learn to think and act as hospitality workers. Edwards (2005, p. 60) refers to this process as “development of expertise”. For hospitality as an applied occupation, it is increasingly important that educators ensure students meet the required outcomes. It is recognised that one of the greatest challenges for tertiary institutions is to ensure that their graduates have the necessary skills to be successful professionals. Neilsen (2000) surveyed 1100 employers in Australia and found that the five most important skills

for a tertiary graduate were oral business communication skills, creativity, problem-solving skills, independent and critical thinking skills, and flexibility. Further, he noted that the first three of these skills were deficient. Greenan, Humphreys, and McIveen (1997) reported similar results from their UK study. Likewise, Braxton, Eimers, and Bayer (1996) detailed similar findings in their literature review of studies in the United States. Some authors have suggested that students experience increased retention if they have been subject to a stimulating active role rather than passive role in their learning environment Astin, 1985; Van Rossum, 1988; Ineson, 1991). Hence, the nature of hospitality predicates itself to methods of curricula delivery which are innovative, flexible and creative. Edwards (2005) suggests case studies and practical exercises as effective tools for teaching of subjects in such areas. Pearce (1993 in Edwards, 2001, p.2) describes tourism education as, “a soft, unrestricted, applied, pre-pragmatic, rural and content based specialism, with a concrete, reflective learning style”. Hospitality is like tourism in nature and therefore, the same can be said of hospitality. Authentic learning and assessment for hospitality subjects allows the hospitality classroom to be transformed into a real world playground. This paper focuses on a real-life exercise incorporated into a third year hospitality subject at a regional Australian University. The capstone subject is a double point one. It is run as a five day intensive in late July followed by thirteen weeks of two two-hour practical sessions per week for the semester. During the intensive students learn about the theory side of conferences and events and are exposed to guest speakers who bring the real world into the classroom. Throughout the semester students are expected to plan, organise and run a real-life event: a fund-raising event. The exercise is aimed to teach students not only the fundamentals of Conference and Events, but also generic skills in areas of written and oral communications, logical and analytical thinking, and teamwork. It is a comprehensive project which requires extensive out-of class activities and interaction, culminating in the grand event. For the particular year discussed in this paper, eleven students facilitated a fund-raising event. The event was held ten weeks after the first lecture and was highlighted by a formal dinner in which business and community members joined university staff to help raise funds for a non-profit organisation. The project was ambitious and presented many challenges. Equally for students there were many rewards. Students came from several business disciplines, ranging from commerce to tourism. They possessed varying degrees of experience in hospitality, from non-existent to considerable. In addition, there were differences in student’s level of motivation, sense of urgency, and agendas. The end result was that students recognised that attendance at meetings, assuming an active role and contributing were important factors for the event to succeed. This paper will discuss students’ evaluations of each other’s performance. It begins by examining the value of using real world events as a teaching tool to promote authentic learning. In addition, it discusses the findings and implications for teaching hospitality subjects, such as conference and events management, in such a participatory manner. AUTHENTIC LEARNING The pedagogical underpinning for this learning experience was to expose students to experiential learning through “authentic experiences”. Kolb (1984, p. 41) defines experiential learning as “the process whereby knowledge is created through the transformation of experience. Knowledge results form the combination of grasping and transforming experience”. The grasping and transforming of

experience to which Kolb refers is what authentic learning strives to create within a real life learning environment. In defining authentic experiences, Brown, Collins and Duguid (1989) consider a number of activities such as ones that emulate real life situations, problems and tasks, and activities that are considered important to the learner. They emphasise that authentic activities provide opportunities to for learners to access the context that enables practitioners to perform their work effectively (Brown et al. 1989). In essence, Brown et al. (1989) argue that through authentic experiences, knowledge and skills are learnt from the perspective that reflects the way they will be meaningful and purposeful in real life. Carver (1996, p. 10) supports this view. He states that authentic experiences are “understood by participants as relevant to their lives…students can identify reasons for participating”. Newmann and Wehlage (1993) acknowledge that authentic learning is achieved through tasks, activities and assessments which produce significant and meaningful outcomes. Williamson & Nodder (2002) add that these activities can be related to real-world situations. Equally, Woolfolk (2001) clarifies that an authentic task connects students to real-life problems and situations. This aligns with Ormrod’s (2000) considerations. He posited that authentic activities promote problem-solving, critical thinking, synthesis of knowledge, and application of skills to real-life contexts. This lends itself to the perspective that authentic learning is constructivist in nature. Constructivism refers to a school of thought, which maintains, “Individuals are understood to construct their own knowledge, through interaction with their environment” (Fenwick, 2001, p.9). Roblyer and Edwards (2000) stated that the contructivist approach entails the generation of knowledge by the learner through activities which are participatory and meaningful. Hence, from a pedagogical perspective, constructivism relates to knowledge as constructed by the learner as a means of creating awareness and not necessarily as a tool to address specific questions (Roblyer & Edwards, 2000). Driscoll (1994) notes that authentic learning is a constructivist approach and consists of five elements: (a) complex, challenging learning environments and authentic tasks; (b) learning through social negotiation and shared responsibility; (c) multiple representations of the content; (d) understanding that knowledge is constructed; and (e) student-centered instruction. Collins (1991) promotes authentic learning by acknowledging that it benefits students in a number of ways, including: (a) learning to apply knowledge; (b) fostering of invention and creativity; (c) awareness of implications of the knowledge; (d) understanding that knowledge is organised for suitable uses in context (Collins, 1991). Biggs discusses the ‘surface’ and ‘deep’ learning which can occur through such approaches to learning. Surface learning encourages recall but can result in fragmented outcomes or failure to communicate meaning. The subject reported in this paper was designed to encourage a deeper level of understanding. It was expected that students gained understanding through the lectures and discussions and then used and extended that understanding through an authentic experience. Some authors extend authentic learning to encompass the term “authentic assessment”. Morgan and O’Reilly (1999, p. 57) define authentic assessment as:
…tasks that are usually drawn from the working world and require students to identify issues or problems, draw upon their knowledge to carry out solutions, respond to contingencies as they arise, and evaluate their results. These assessments support learners in developing vocational skills and experience and provide an applied context for their learning. An authentic assessment

task is often the culmination of incremental skills development and acquisition of knowledge over time, with the benefit of formative feedback.
Authentic assessment is often related to performance assessment (Hambleton, 1996). In light of these considerations, it was felt that the notion of using an authentic experience in this subject was a great idea. Planning, organising and managing a real life event certainly presents students with ample opportunities to develop and exhibit many of the generic skills valued of graduates. However, there were a number of challenges that should be noted, including:
The ambitiousness of the project, The varying agendas of the different students within the cohort, The timeframe The lack of cohesion within the group The lack of experience in some students The lack of motivation and a sense of urgency The lack of preset procedures and practices
Nonetheless, the advantages of enhancing the learning experience were considered to be of enormous value to these students before they graduated. It was felt that in this environment, authentic learning and assessment facilitates the learning of critical generic skills for those seeking long-term success in their hospitality careers. These generic skills for hospitality professionals include problem-solving, teamwork, communication, understanding of processes, and development of attitudes (McCann, 1996, Edwards, 2001). Further, Cooper, Shepherd, and Westlake (1996) proposed that assessment methods for tourism and hospitality studies should ensure that the student develops the following:
An analytical and critical approach to the study of tourism and hospitality An understanding of the issues An understanding of the industry, its structure and its operation The assessment method selected must be appropriate for the level and type of course
under discussion. Bush-Bacelis (1998) added that the workplace requires skills such as flexibility, teamwork, problem-solving and creative thinking and these skills should be nurtured in tourism and hospitality students and reflected in the subject assessment. Assessment for the Conference and Events subject discussed here was designed to ensure the linking of basic declarative knowledge of the subject (i.e. surface learning) with more abstract, conceptual and procedural knowledge (i.e. deep learning) relating to the hospitality industry. Further, the subject was seeking to provide students with opportunities to develop conditional and functioning knowledge (i.e. deeper learning). It was considered that the subject could achieve these aims by incorporating an industry component, in which the assessment was relevant and encouraged students to use and adapt knowledge gained in the lecture to real world situations. Prest (cited in Southcott) notes reflection and transfer are critical if the learning is to be truly experiential. He adds that reflection should affect change in attitudes and transfer by influencing future behaviour. To encourage reflection, students were asked to participate in peer evaluations. Further, in an attempt to understand the pedagogical processes within this subject and inform the future development and delivery of the subject, students were asked to reflect on their experiences throughout the course of the subject and evaluate their peers and themselves. Boyd (1989, p. 2)

argues that evaluation can be used to “provide constructive criticism and suggestions to improve weak areas and amplify strengths”. Reese-Durham (2005) considers peer evaluation as a valuable addition to traditional formative and summative evaluations. She contends that peer reviews promote deeper approaches to learning. METHODOLOGY The research data for this study was drawn from surveys of students’ opinions, thoughts and feelings about the effectiveness of the efforts and contributions made by their peers to the organising and running of this real life event. Through this, the survey sought to capture the teams’ collaboration and students’ experiences. All evaluations were confidential. The survey instrument used in this study was based on that by Paswan and Gollakota (2004). It had previously been developed in the context of research into peer evaluation in management education and was therefore, thought to have some relevance. Paswan and Gollakota (2004) contend that “peers have more information and can evaluate performance more accurately than supervisors” (p.225). They based their peer evaluation on findings from earlier studies (e.g. Bales, 1970; Napier & Greshenfeld, 1993, Williams, Beard, & Rymer, 1991), which showed three categories of group behaviours: task, maintenance, and individual. Paswan and Gollakota (2004) define these categories as follows:
1. Task behaviours include helping the group define its goals and working toward attainment of those goals through techniques such as:
a. initiating discussions b. offering information and opinions c. elaborating from experience d. clarifying issues e. summarising ideas f. keeping the discussion on track g. evaluating ideas presented
2. Maintenance behaviours include helping the group members work together by creating an atmosphere conducive to achieving the task, through such behaviours as:
a. encouraging reticent members to contribute b. supporting ideas c. mediating group member differences d. keeping group’s climate harmonious
3. Individual behaviours focuses on meeting individual needs and may be evaluated on individual competence (such as command over task-related knowledge and skills) or take the form of disruptive participation, domineering behaviour, discounting of the importance of others’ contribution, withdrawal from the group, or free-riding.
From this, Paswan and Gollakota (2004) proposed a multidimensional scale of six factors: dependability, task-oriented, maintenance-oriented, domineering, free-riding, and personal competence. In their study, both task and maintenance behaviours emerged as one factor, which they re-named as ‘the effectiveness dimension’.

Questions for this study were formulated from the work of Paswan and Gollakota (2004) and discussions with other instructors and students. The final questionnaire contained 11 items for peer evaluation based on the task-maintenance orientation and dependability, as described above:
Task-Maintenance Orientation o interest & enthusiasm, active role assumed, creativity, contribution (quantity of
work), respect, cooperation, team player, and communication Dependability
o attendance, volunteerism, dependability,
Responses were measured on a five-point Likert scale anchored between 1 (poor) to 5 (excellent). Peer evaluations were sought from the twelve students who were involved in this subject after the event had occurred. Students were also encouraged to write comments on their experiences. Data collected from students’ responses were analysed in two ways. First responses to the close-ended questions were averaged to determine the overall mean for each element noted above. Secondly, a thematic investigation of the responses to the comment section was conducted. This allowed the identification of a number of key areas. Responses to this latter section were interesting because they highlighted two of the other dimensions which had been identified by Paswan and Gollakota (2004): domineering behaviour and free-riding behaviour. EVALUATION OF STUDENT EXPERIENCES Analysis of students’ responses to the 11 items showed that overall students were moderately to highly satisfied with the approach and contributions of their peers to the planning and running of the event. Students’ responses are detailed in Table 1.
Table 1 Overall mean ratings of students’ peer evaluations
Dimension Overall evaluation Interest & enthusiasm 4.11 Respect 4.09 Attendance 3.94 Active role assumed 3.88 Cooperation 3.87 Team player 3.86 Contribution 3.80 Volunteerism 3.77 Dependability 3.72 Creativity 3.55 Communication 3.34
Table 1 shows that overall students felt that their peers were dependable and task and maintenance oriented. Responses indicate that students were very interested and enthusiastic (mean rating = 4.11) toward the experience and that there was a high level of respect (mean rating = 4.09) amongst the team members. The lowest scoring element was communication with a mean score of 3.34. These findings were supported by students’ comments on their peers and what they saw as good and necessary qualities for this project. These comments are presented in Table 2 under various themes.

Table 2
Key Themes in Student Evaluations Theme Example
Interest & enthusiasm ‘Dedicated himself to an exceptionally high level’ ‘Enthusiastic approach’ ‘He had a very positive attitude toward the event & always worked hard.’
Respect ‘Open to all ideas and suggestions’ ‘A kind, respectful demeanour’ ‘Was respectful’
Active role assumed ‘Very proactive hands-on involvement’ ‘She was our leader and the glue that held us together.’ ‘Effective, no nonsense approach, which gets things done’
Cooperation ‘Worked well together’ ‘Got along well with everyone’ ‘Very cooperative. Went out of her way to make event a success’.
Team player ‘Good team member’ ‘Good to have on the team’ ‘Was good at encouraging teamwork’
Contribution ‘Outstanding contributor. Put a lot of work & effort in. very motivated.’ ‘He gave his all’ ‘Worked hard’
Volunteerism ‘His volunteering was much appreciated’ ‘Always volunteered to help. Great job.’ ‘Always willing to offer her assistance whenever needed.’
Dependability ‘Always did what he needed to do’ ‘Quiet achiever’
Creativity ‘Had lots of good ideas’ ‘Always full of new ideas’
Communication ‘Was very good at communication. A very important factor’. In addition, students’ comments reflected the presence of free-riding and domineering behaviours and have been collated under the theme of ‘challenges of working with others’. Table 3 presents some of these comments and others which supported the importance of good decision-making.

Table 3
Additional key themes in students’ evaluations Theme Example
Decision-making ‘Made some good decisions’ ‘Made decisions when needed’ ‘Made some tough calls’
Challenges of working with others
‘It was frustrating when people didn’t turn up for meetings.’ ‘Great guy but needs to work harder’ ‘Lack of attendance at meetings meant that …was unable to stay up to date on the progress of the event’ ‘No understanding of time frames’ ‘Does what is asked but in his own time. No sense of urgency.’ ‘Means well but doesn’t complete tasks set; rides on others’. ‘Did not follow through’ ‘At times a little controlling’ ‘At times not trusting towards classmates’
DISCUSSION The results highlight that overall students found this experience very rewarding and that there were certain attitudes to the project which were considered to be important. For example, Table 1 shows that ‘interest & enthusiasm’ and ‘respect’ were rated high. This indicates that students were motivated to undertake the project and that they did have high regard for their colleagues. However, while intentions may have been good, several issues did surface. For example, Table 1 shows good to moderate ratings for ‘cooperation’ and ‘team player’, indicating that there was conflict in working together. The following section discusses these issues. Paswan and Gollakota (2004) acknowledge that task and maintenance behaviour reflects group dynamics, behaviour during meetings, and whether or not group members have fulfilled their tasks. In essence they are referring to team work. For an event such as the one discussed here, a high level of team solidity and individual effort is required to make the event successful. Moscardo and Norris (2005, p. 57) note that “High levels of team cohesion were associated with more efficient work practices and overall with more successful events and greater perceptions of learning and gains in self-confidence”. Table 1 indicates that the level of team work (3.86) and cooperation (3.87) was moderate to good. This is supported by Table 2 which highlights that there was a reasonable level of cooperation and team effort. Relevant comments included: ‘Good to have on the team’ and ‘was good at encouraging teamwork’. However, students identified the challenges of working with others and there were times when the team felt let down, e.g. when people failed to turn up for meetings or failed to complete assigned tasks, as noted in comments from Table 3. Experiences gained from running an event such as the one described in this paper parallel those in the management of real-life events and provide a valuable learning experience for students. For example, Larson and Wikstrom (2001) acknowledge that teams play a critical role in running events but they also note that managing conflict can influence success of events. Further, it has been commented that the development of relationships is an important part of experiential learning. The Association of Experiential Education (2004) notes the importance of “learner to self, learner to others, and learner to the world at large”. Through their comments it is evident that students realised

the challenges of working with others. For example, comments in Table 3 included ‘At times not trusting towards classmates’ and ‘At times controlling’ suggest that students resented domineering and free-riding characteristics. Comments on domineering behaviour are not surprising because as Paswan and Gollakota (2004, p. 230) state “in an academic setting, where no one student has a higher status, domineering behavior is likely to be resented.” Similar thinking applies to free-riding behaviour. These characteristics may be seen to decrease a group’s accomplishments. By contrast, Paswan and Gollakota (2004) note that task and maintenance behaviour reflects the group dynamics and perhaps consideration as to whether the group fulfilled its task or not and to what level. Those characteristics increase a group’s accomplishments Such accomplishments are evidenced by Larson and Wikstrom (2001) who in their discussion on organising events describe the consensus perspectives as a process used within projects. They argue that “mutual commitment, trust, and conversation are important to build fruitful relationships’ and that these elements form part of the consensus perspective (Larson & Wikstrom, 2001, p. 51). It would appear that students in this study valued the consensus approach. For example, the value that students noted for a number of the other dimensions is testimony to the importance of interpersonal skills and relationships. Table 1 shows high scores for ‘interest & enthusiasm’ (4.11) and ‘respect’ (4.09). Equally, Table 1 shows that assuming an active role (3.88), contribution (3.80), and communication (3.34) were moderate to good. However, these results suggest that such attitudes could be improved and this is something that will need to be considered in the future delivery of this subject. For example, it may be that the subject needs to be spread over two semesters allowing time for students to develop team cohesion and understand more holistically the requirements and complexities of running an event before attempting to plan, organise and manage one. As was noted earlier, students had limited knowledge and experience of taking responsibility for an event. This was evident in the leadership role which was allocated to a couple of students early on. While the cohort welcomed the strong leadership presented by these individuals, there were times when it did impact on the group dynamics. Nonetheless, all students recognised that such a role resulted in these students making some critical decisions, which in the long run contributed to the success of the event. Larson and Wikstrom (2001, p. 51) describe this as the conflict perspective in organising events. They relate this approach to social interactions where “tensions, conflicts, and power games” are unavoidable. In pursuing the idea of “the role of power-holders in event production”, Larson and Wikstrom (2001, p. 52) acknowledge the process of decision-making, an issue which was also considered to be of importance to this study. In discussing the basic tenets of experiential learning, Luckmann (1996, p.7) states that “the learner [is required] to take initiative, make decisions, and be accountable for the results”. Throughout the preparation period, students were given a great deal of autonomy. For example, in seeking sponsorship for the event, students had to decide on which companies to approach and more critically, when they were in the field, face-to-face with executives, they had to make some ‘hard calls’ in relation to how far they would push the deal and always conscious that they were representing the university. Comments in Table 3 show that this was a valued quality among students. This adds to McDonald and McDonald (2000) in their tenet that managing real-life events requires risk, responsibility and decision-making and the learning experience provided here creates awareness in students of such facets, be it that not all students would be able to handle this well. Students demonstrated both in their ratings (Table 1) and comments (Table 2) a good level of attendance (3.94), volunteerism (3.77) and dependability (3.72). Students’ value of such efficient work practices could be considered as concerns for getting tasks done and running a successful event. This is of importance as Moscardo and Norris (2005, p. 10) recognise “efficient work

practices [lead] to more successful events and greater perceptions of learning and gains in self-confidence”. With the moderate ratings obtained in this study it appears that in future, this activity should be adjusted so that the role of individuals to the success of the event is stressed. In addition, it seems worthy of including team building activities to emphasise self-reliance, dependability, responsibility and willingness to work hard and contribute to the task and its maintenance. Further, the results from this study highlight the need to imbue students with conflict management skills prior to undertaking such real-life events. Overall, students applauded the value of this experience to their learning. They saw this subject as the capstone of their courses. It allowed them to draw on the knowledge, skills and understanding they had gained through other subjects, such as marketing, management, accounting, project management and organisational behaviour. Students felt that the opportunity to put on a grand event was challenging, consuming and hard work but they also realised that it was achievable and immensely rewarding. This can be summed up by some final comments from students: ‘It was great to do an event with someone who works hard and wants to achieve’ and ‘I have learnt a lot and look forward to another event.’ LIMITATIONS AND FUTURE RESEARCH IMPLICATIONS Research on peer evaluation in event management projects is limited. Consequently, this study relied on research from non-academic and other academic environments. While Paswan and Gollakota (2004) included an ‘overall satisfaction’ dimension, this dimension was not included in the evaluation. Students’ comments throughout the time of the project and after the event indicated that students’ were extremely satisfied with the experience. They emphasised that this project had drawn together much of the knowledge and many of the skills they had learnt throughout their course and that this subject was a capstone to their degree. However, generalisation of the findings from this study to other projects needs to be done cautiously. This was a magnanimous event, which raised a substantial amount of money for charity and so, was a highly emotive and rewarding experience for students. The high feelings generated from experiencing the grand event could have masked students’ satisfaction with various aspects of the project. In fact, this was evident in the frustrations and tears that were witnessed during the time leading up to the event. Perhaps in future research satisfaction can be considered in relation to the various stages of planning, organising and running the event, and in relation to how each element of behaviour impacts on satisfaction. In this way, a richer picture of the experience can be developed. For example, it may be possible to determine if “a bossy or a free-riding group member is likely to lead to feelings of irritation and dissatisfaction” or whether “satisfaction is influenced strongly by perceived status consensus, progress toward group goals, and freedom to participate” (Paswan & Gollakota, 2004, p. 226). In addition, review of further literature after the administration of the questionnaire, suggests that the findings from this study could have been extended if a more comprehensive questionnaire was administered. A richer insight into students’ experiences can be captured if more dimensions of peer evaluations are incorporated in future studies. Further, this study is limited by the sampling frame, which focused just on one cohort of students. Future studies should explore students’ experiences for different cohorts and gather of data over a number of years so as to build a valuable longitudinal study. CONCLUSION

In the experiential learning approach reported by Moscardo and Norris (2005), it was found that along with encouraging self-confidence, there were a number of other beneficial learning outcomes. For example, students felt a sense of control over their learning, built networks for their future careers, and developed team skills such as negotiation, trust, and delegation. Similarly, Barron and Henderson (2000) recognise that students in tertiary programs, such as hospitality management, should be provided with learning opportunities that interest and motivate them. It is argued that students should be active participants in the learning environment (Bobbitt, Inks, Kemp, & Mayo, 2000). This study supports these findings. By placing students in real life experiential learning situations, they are encouraged to apply theory to practical situations and develop skills which can be immensely valuable to their future employability. The implications for future design of courses in hospitality is that employing an experiential learning approach as described in this study is invaluable in ensuring engaging and meaningful learning for students. Authentic learning provides a valuable opportunity for hospitality students to learn first hand about the industry. The hospitality industry is an operational industry and the best way to gain knowledge of the industry is by providing opportunities for students to be exposed and experience various aspects of the industry. Through such authentic learning, students will gain both surface and deep learning. For the students involved in this project, it provided a tremendous opportunity to showcase what they had learnt in their respective degrees and create awareness in the local community of their calibre as citizens. The Association for Experiential Education (2007) notes the Chinese proverb, “Tell me, and I will forget, Show me, and I may remember. Involve me, and I will understand.” This project encouraged students to work toward a goal, which was to have a successful event. The experiential learning that occurred along the way was effective in promoting a number of characteristics, including interest and enthusiasm, respect, volunteerism, cooperation, dependability, and creativity. Also, through raising funds for a charity, students were also able to link with the community and experience a sense of altruism. As the field of event management grows, there is an increasing realisation of the need to develop professionals with the knowledge and skills to be able to create, organise and manage successful events (Arcodia & Reid, 2002). Effective event management education serves to meet this need. Experiential learning through authentic activities provides a medium through which students gain valuable practical skills to augment theoretical understanding and ultimately make them employable in this dynamic industry. REFERENCES Arcodia, C. & Reid, S. (2002). The mission of event management associations. In K. W. Wober
(Ed.), City Tourism 2002 (pp. 63-72). Vienna: Springer. Astin, A. W. (1985). Involvement: The cornerstone to change. Change, July/August, 35-39. Association for Experiential Education. Experiential education is. Retrieved January 30, 2007 from
http://www.aee.org/customer/pages.php?pageid=47 Bales, R. F. (1970). Personality and Interpersonal Behavior. New York: Holt, Rinehart, & Winston. Barron, P. & Henderson, D. (2000). Achieving deep learning in higher education programs:
Hospitality and leisure management students’ perceptions of the potential use of virtual reality technology. International Journal of Hospitality Information Technology, 2(2), 63-76.
Biggs, J. (1999). What the student does: Teaching for enhanced learning. Higher Education Research and Development, 18(1), 57-75.
Biggs, J. (2003). Teaching for Quality Learning at University (2nd Edition). Suffolk: St Edmundsbury Press Limited.

Bobbitt, L. M., Inks, S. A., Kemp, K. J., & Mayo, D. T. (2000). Integrating marketing courses to enhance team-based experiential learning. Journal of Marketing Education, 22(1), 15-24.
Braxton, J. M., Eimers, M. T., & Bayer, A. E. (1996). The implications of teaching norms for the improvement of undergraduate education. Journal of Higher Education, 67(6), 603-625.
Brown, J.S., Collins, A. and Duguid, P. (1989). Situated cognition and the culture of learning. Educational Researcher, 18(1), pp.32-42.
Bush-Bacelis, J. L. (1998). Innovative pedagogy: Academic service-learning for business communication. Business Communication Quarterly, 16(3), 20-35.
Carver, R. (1996). Theory for practice: a framework for thinking about experiential education. Journal of Experiential Education, 19(1), 8-13.
Collins, A. (1991). Cognitive apprenticeship and instructional technology. In L. Idol & B. F. Jones (Eds.), Educational values and cognitive instruction: Implications for education (pp. 121-138). Hillsdale, NJ: Lawrence Earlbaum Associates.
Cooper, C., Shepherd, R., & Westlake, J. (1996). Educating the Educators in Tourism. Madrid: World Tourism Organisation.
Driscoll, M. P. (1994). Psychology of learning for instruction. Boston, MA: Allyn and Bacon. Edwards, A. (2005). Let’s go beyond community and practice: The many meanings of learning by
participating. The Curriculum Journal, 16(1), 49-65. Fenwick, T. (2001). Experiential Learning: A Theoretical Critique from Five Perspectives.
Available at: http://www.cete.org/acve/docs/fenwick/fenwick1.pdf. Accessed March 2006. Gibbs, G. (1992). Improving the Quality of Student Learning. Bristol: Technical and Educational
Services. Greenan, K., Humphreys, P., & McIveen, H. (1997). Developing work-based transferable skills for
mature students. Journal of Further and Higher Education, 21(2), 193-204. Hambleton, R. K. (1996). Advances in assessment models, methods, and practices. In D. C.
Berlinger & R.C. Calfee (Eds.), Handbook of educational psychology (pp. 899-903). New York, NY: Simon & Schuster Macmillan.
Ineson, E. M. (1991). Moving towards new horizons in experiential learning through “live” tourism enterprise projects. In New Horizons Conference Proceedings. Calgary: University of Calgary.
Knobloch, N. A. (2003). Is experiential learning authentic? Journal of Agricultural Education, 44(4), 22-34.
Kolb, D. A. (1984). Experiential Learning. Englewood Cliffs, NJ: Prentice Hall. Larson, M. & Wikstrom, E. (2001). Organizing events: managing conflict and consensus in a
political market square. Event Management, 7, 51-65. Luckmann, C. (1996). Defining experiential education. Journal of Experiential Education, 19(1), 6-
7. McCann, T. M. (1996). A pioneer simulation for writing and for the study of literature. English
Journal, 85(3), 62-87. McDonald, D. & Mc Donald, T. (2000). Festival and event management: An experiential approach
to curriculum design. Event Management, 6, 5-13. Morgan, C. & O’Reilly, M. (1999). Assessing Open and Distance Learners. London: Kogan Page. Moscardo, G. & Norris, A. (2005). Bridging the academic practitioner gap in conference and events
management running events with students. Journal of Convention and Event Tourism, 6(3), 47-62.
Napier, R. W. & Greshenfeld, M. K. (1993). Groups: Theory and Experience (5th Ed.). Boston: Houghton Mifflin.
Neilsen, A. C. (2000). Employer Satisfaction with Graduate Skills. Canberra: Commonwealth of Australia.

Newman, R. M. & Wehlage, G. G. (1993). Five standards of authentic instruction. Educational Leadership, 50(7), 8-12.
Ormrod, J. E. (2000). Educational psychology: Developing learners. Upper Saddle River, MJ: Merrill.
Paswan, A. K. & Gollakota, K. (2004). Dimensions of peer evaluation, overall satisfaction, and overall evaluation: An investigation in a group task environment. Journal of Education for Business, March/April, 225-231.
Reese-Durham, N. (2005). Peer evaluation as an active learning technique. Journal of Instructional Psychology, 32(4), 338-345.
Richards, F. (2000). Role playing in the classroom: A tourism experience. In A. Herrmann and M.M. Kulski (Eds), Flexible Futures in Tertiary Teaching. Proceedings of the 9th Annual Teaching Learning Forum, 2-4 February 2000. Perth: Curtin University of Technology. Retrieve 28 January, 2007 from http://lsn.curtin.edu.au/tlf/tlf2000/richards.html
Roblyer, M. D., & Edwards, J. (2000). Integrating educational technology into teaching (2nd Ed.). Upper Saddle River, NJ: Prentice Hall.
Southcott, J. (2007). Putting on a show: Engaging and authentic learning in experiential music education. Retrieved 5 February 2207 from http://www.aare.edu.au/06pap/sou06693.pdf
Van Rossum, E. J. (1988). Student’s conceptions of learning and good teaching in Dutch higher hotel education. Hospitality Education and Research Journal, 12(2), 425-429.
Williams, D. L., Beard, J. D., & Rymer, J. (1991). Team projects: Achieving their full potential. Journal of Marketing Education, 13, 45-53.
Williamson, A. & Nodder, C. (2002). Using online learning to enable reflection upon authentic tasks. In A. Williamson, C. Gunn, A. Young, & T. Clear (Eds.), Winds of change in the sea of learning: Proceeding of the 19th Annual Conference of the Australasian Society for Computers in Learning in Tertiary Education. Auckland: UNITEC.
Woolfolk, A. (2001). Educational psychology (8th Ed.). Boston, MA: Allyn & Bacon.

Fourth International Event Research Conference Re-evaluating the City/Town: Events as a Catalyst for Change
AUSTRALIA DAY ALTERNATIVE EVENTS: AN EXPLORATION OF NATIONAL IDENTITY AND NATIONALISM
Dr Elspeth A. Frew
School of Sport, Tourism and Hospitality Management La Trobe University
Leanne K. White School of Hospitality, Tourism and Marketing
Victoria University
ABSTRACT Events staged to celebrate Australia Day on January 26 range from those supported by government funding via the National and State Australia Day Councils, to independent informal gatherings of friends and neighbours. The more unusual events staged on Australia Day are described as alternative events and range from events celebrating Australia’s relationship with the bush and outdoor lifestyle, to those reflecting Australia’s love of gambling. This paper examines alternative events held on or around Australia Day and considers their existence in the context of national identity development and Australian nationalism. One highly indicative case study examined is the annual cockroach racing championships. Attention is also given to the contrast between the official events program and the unofficial events staged, which may be described as commercial nationalism - where money is made from the venture. The findings are related to the literature on national identity and, festival and event management. Key words: nationalism, national identity, Australia Day, alternative events
INTRODUCTION This paper is concerned with an exploration of how Australians celebrated Australia Day in 2007. The authors are particularly interested in examining the ways in which Australianness is celebrated through alternative Australia Day events. One particular Australia Day alternative event, which reflects some of the themes and issues raised in this paper, is then examined. Selected words and images presented in the promotional literature for this event are analysed. The paper aims to demystify the various ways in which the nation was both imagined and celebrated on January 26, 2007. The central questions of this paper are: what words and images of Australia are projected when Australians find alternative ways to celebrate their national day? Furthermore, what does this tell us about who Australians are, or who Australians like to think they are as a nation? THE NATION, THE NATION-STATE, NATIONAL IDENTITY AND NATIONALISM An exploration of the concepts of nation and nation-state and some consideration of the arguments surrounding the debate on these terms provides a useful basis from which to examine theories of

national identity and nationalism, particularly with reference to nationalism as it is celebrated in Australia. There is no question that the nation has a significantly broader meaning than the geographic boundaries of a particular country. The term encompasses more far-reaching notions than territory alone. Writers on the subject have acknowledged that the nation can embrace a combination of political, social, cultural, historic, economic, linguistic and religious factors. When an individual is said to belong to a nation, it is generally understood that the person has their foundations in that country. The word nation originated from the Latin term natio, or community of birth. Nation is therefore associated with words such as native, nature, innate, natal and renascent. Anthony Smith defines nation as a “named human population” with shared territory, myths, history, culture, economy, and rights and responsibilities by all members of that community (1991, p. 14). While Smith’s notion is useful, it has been Benedict Anderson’s theories on the subject that have made a significant contribution to the discourse of the nation in recent years. Anderson claims that the nation is an “imagined political community”. Unlike previous theories, he breaks away from the interpretation that the nation is intrinsically bound up with factors such as religion or kinship, by emphasising the imagined status of the community by the people. Anderson states:
It is imagined because members of even the smallest nation will never know most of their fellow members, meet them, or even hear of them, yet in the minds of each lives the image of their communion (1983, p. 15).
Without entering into an examination, at this stage, of the abundant methods by which the idea of nation is presented to the citizen, it is worth noting one regularly used technique. A popular strategy employed by image makers which most Australians encounter daily is the representation of the landmass of their island continent in various forms. According to Benedict Anderson, nationalism is a taken-for-granted frame of reference (1991, p. 12). An example is the words and logo of the masthead of Australia’s national newspaper, The Australian. The concept of the nation is doubly reinforced in both the title of the newspaper and the red image of the Australian landmass. Although the citizen may not always consciously register that they are viewing the symbol, the point remains that these images are being generated and presented by numerous individuals and organisations. While one acknowledges arguments which enter into the debate about the nation and the nation-state, such as the existence of states without nations and nations without states, the nation-state remains the effective political entity in terms of the way the world is organised. In a world which is operating increasingly at a global level, and political and trade associations often emphasise regional alliances, there is significant reason to argue that the nation-state might be becoming somewhat redundant as these larger forms of association assume increasing importance. However, the Australian nation-state is a distinct entity and, through the Australia Day Committee and other bodies, regularly organises the celebration of its own existence each year on January 26. The concept of national identity appears to be much broader than nationalism. Anthony Smith examines the nature, causes and consequences of national identity and explains that it is “fundamentally multi-dimensional” (1991, p. 14). He acknowledges that national identity and the nation are constructions formed from many interrelated components such as the cultural, territorial, economic and political. Members of communities are consequently united by shared memories, myths and traditions.

The intensity of an individual’s feelings about their national identity seems to be directly related to their level of national sentiment. Sentiment for the nation involves a sense of personal identification and empathy with something larger than oneself. As a particular level of emotion is involved, national sentiment is a highly subjective feeling and can vary enormously in different circumstances. To illustrate the point, while it is possible that possessing Australian citizenship might not register any emotional involvement, it is often the case that being a member of the nation-state does carry some meaning, even if it is regarded as one of the more abstract identities which the individual possesses. Additionally, national sentiment might be more concentrated when the citizen is younger and possibly more impressionable, than when they become older and increasingly aware of various manipulative forces such as multinational corporations using nationalism to promote their message. This phenomenon might best be demonstrated by the propensity of young Australians, particularly in more recent times and, at sporting events, to wear the Australian flag as something of a potentially divisive jingoistic cloak. THE INVENTING OF AUSTRALIAN NATIONALISM While official nationalism is the nationalism of the nation-state, the term commercial nationalism was chosen to describe the style of nationalism promoted by advertisers, advertising agencies and other sections of popular culture, as it encompasses the idea that the commerce and the nation are deliberately constructed entities. The term alludes to the notion that the once clearer boundaries of these two domains have been eliminated and that the broader concept of nationalism which deals with ideas and beliefs, has combined with the economic forces in the world of commerce which compete for the consumer dollar. Thus, commercial nationalism is essentially a paradox - two potentially conflicting sectors combining their influences and occupying the same space. Commercial nationalism operates like a paradigm - it continues the pattern that has been firmly established by the official body. Both types of nationalism contribute to the total discourse on nationalism at any given moment in history (White, 2004). While important discussions about Australian culture emerged in the 1950s, a closer examination of Australian images in popular culture developed in the late 1960s and early 1970s. It could be argued that the phenomenon of commercial nationalism took on a more public profile when the Australian Labor Party was elected to office in 1972 with the campaign slogan ‘It’s Time’! Donald Horne claimed it was in the 1960s that a discourse emerged on the subject of severing constitutional links with Britain, changing anthems and flags, examining the symbolism of stamps and currency, and generally re-assessing the images projected in many forms of national symbolism. He asserts that Australia experienced a genuine “cultural awakening” which essentially consisted of Australian participation in the arts and entertainment, and in works produced by intellectuals. It was an acceptance that there was nothing embarrassing in being an Australian and that our country’s themes and legends were as valid as any others (1981, p. 67). In Myths of Oz: Reading Australian Popular Culture (1987) John Fiske, Bob Hodge and Graeme Turner explored the beach, the pub, shopping and a range of other ‘lived texts’ to “reveal the processes, the languages through which ‘Australia’ is constructed” (Fiske et al, 1987, p. xi). Elizabeth Jacka also notes that art critics, cultural critics and media commentators have been unable to define Australianness and that when it comes to debates in the arenas of film and television, writers are still asking the same sorts of questions that they did in the 1960s and 1970s (Jacka in Turner, 1993, p. 107).

CELEBRATIONS OF AUSTRALIA’S NATIONAL DAY As Australia did not become a federated nation until 1901, celebrations of the national day prior to this time were known as Foundation Day and Anniversary Day. Governor Lachlan Macquarie held the first official celebration of British settlement (Foundation Day) in 1818 - marking the 30th anniversary with a 30 gun salute. A public holiday was declared for the first time in 1838, while January 26 became known as Anniversary Day 50 years later (1888) when the year also marked the 100th anniversary of the First Fleet landing at Sydney Cove. The anniversary only became known as Australia Day in 1946 and the national day was generally celebrated as a long weekend as the nearest Monday was taken as a public holiday. The Federal Government’s National Australia Day Council was established in 1979 to coordinate and promote the official celebrations, with their vision to “inspire national pride and spirit to enrich the life of the nation” (National Australia Day Council, 2006). Indigenous Australians generally refer to the day as Invasion Day or Survival Day, and the first Survival Concert was held in 1992. On Australia Day 2000, a quietly confident and relaxed form of patriotism seemed to be emerging. In Sydney the day was celebrated by people choosing to wave flags, wear green and gold and sing the national anthem. The theme of the celebrations was ‘Australia G’Day’, a campaign designed to encourage strangers to greet each other (Overington, 2000, p. 4). In Melbourne, the festivities were reported as ‘…more of a people’s day than a whiz-bang celebration, but that seems to be the Australian way’ (Farouque, 2000, p. 4). The National Council for the Centenary of Federation (NCCF) was established by the Committee of Australian Governments to plan and coordinate the year-long program of national events for Australia’s Centenary of Federation in 2001. The NCCF embarked on an extensive advertising campaign which involved asking Australians questions beginning with the statement “What kind of country would…?” Headed ‘Fair Dinkum Fun’, an advertorial which reported on NCCF events asked ‘What kind of country would celebrate its centenary with a camel race? The NCCF explained that activities listed on its official events calendar in 2001 “ranged from the serious to the seriously strange. After all, it wouldn’t be a truly Australian celebration without a tribute to the Aussie sense of humour”. Events included: beard-growing contests, hotdog eating competitions, and a dunny race. GAMBLING: AUSTRALIA’S NATIONAL OBSESSION More than 80% of the Australian adult population gambled in 1998, while 40% gambled at least once a week. These figures represent the highest rates in the world. While it is estimated that the average Australian loses about $625 a year, problem gamblers are said to lose around $12,000 annually (Hudson, 1999, p. 1). A popular Australian saying “You’ve got to be in it to win it” helps justify the national obsession. In 2002-03, Australians spent $15 billion gambling (Veal and Lynch, 2006, p. 319). Alarmingly, Australia’s losses in gambling outweigh its household savings (Donaldson and Vesk, 2004, p. 2). While Australians gamble at all times of the year, it is on particular public holidays – such as Melbourne Cup Day, Anzac Day and Australia Day – that gambling is elevated to something of an art form. In 2004, Australians spent $124 million gambling on the Melbourne Cup horse race through the Totalisator Agency Board (TAB). The considerable amount of betting that takes place through bookmakers and office sweeps is not included in the above figure. Anzac Day can often end up with the ‘national game’ of two-up (where two painted coins are thrown into the air via a flat stick or kip); while races that are essentially games of chance – such as gambling on two flies

climbing up a wall, cockroach racing, rubber duck racing or cane toad racing - is often the chosen sport that one may indulge in on Australia Day. In order to provide ideas for Australians to help celebrate their national day, the NADC in 1988 published the 24 page booklet Hundreds and Thousands of Ideas for Australia Day. The book provided ideas for Australia Day activities under headings such as Ceremonies and Commemorative Services, Competitions, Contests, Demonstrations, Displays, Festivals and Feasts, and Sport and Recreation. Some of the Contests suggested included Cockroach Races, Gum Boot Throwing, Melon Bowling, Seed Spitting, Thong Throwing, Toad Races, and Yabbie Races. Some of the suggested activities listed under Sport and Recreation included: the Fair Go Games, Lizard Derby, Ball and Chain Race, Frog Race, and Tortoise Race. McDonald’s restaurants also promoted some of the activities in the NADC book with tray mats headed ‘50 Things to do on Australia Day’. Some of the more offbeat activities chosen by the hamburger multinational were: organise an Aussie joke festival, say g’day to everyone you meet on the day, hold a ‘cooee’ calling competition, have a gumnut throwing competition, and make the world’s biggest vegemite sandwich. FESTIVALS AND EVENTS Festivals and special events are staged around the world to celebrate various aspects of culture and heritage. Some events celebrate famous cultural happenings, while others are showcases for the performing arts and some are sporting events and competitions. A special event is described as “a one-time or infrequently occurring event of limited duration that provides the consumer with a leisure and social opportunity beyond everyday experience” (Jago and Shaw, 1998, p. 29). Loy (1979, p. 41) defines sport as an “institutionalized game demanding the demonstration of physical prowess” while Veal and Lynch (2001, p. 21) define a game as “an activity generally engaged in for its own sake, but with rules and including non-physical pastimes such as board games and gambling as well as physical activities such as sports”. If a tourist travels to a special event to view or engage in a sport or game then sports tourism may be experienced, where the tourist is actively or passively involved in the activities which are “participated in casually or in an organised way for non-commercial or business/commercial reasons” (Standeven and De Knop, 1999, p. 7). In recent years, the number and range of festivals and events occurring around the world has increased substantially and this has lead researchers to investigate various aspects of these events. Jago and Shaw (1998) note that most of this research has focused primarily on the impacts and outcomes of special events, ranging from consideration of the increased visitation to a region, and its subsequent improvement of a destination’s image, to the reduction of seasonal fluctuations and increased local employment. Other benefits of festivals and events have been identified as extension of the tourist season; and, enhancement of community pride (Getz, 1997). In addition, Waterman (1998) suggests that cyclical arts festivals transform places from being everyday settings into temporary environments that contribute to the production, processing and consumption of culture, concentrated in time and place. Thrane (2002) notes research has also been conducted into the reasons or motives people have for visiting these attractions, while Taylor and Shanka (2002) suggest a need for further research on the socio-demographics of festival participants and psychographic research into the various segments within the visitor groups. Sports tourism has been given recent attention in the literature (see, for example, Ritchie and Adair, 2004 and Weed and Bull, 2004) but mostly the research has focused on large-scale sporting events. Ritchie (2004) notes that despite the popularity and number of small-scale sporting events, little research has been published concerning the nature or tourism potential of these events. He notes that this is particularly surprising given the potential that small-scale sporting events have for

marketing and attracting economic development in an era when cities are competing against each other to attract investment and tourism. Higham (1999) suggests that these smaller sporting events may be particularly beneficial to smaller communities as they may use existing infrastructure, require reduced investment of funds, can minimise tourism seasonality, and are more manageable than larger “hallmark events”. He suggests that the benefits of “travel flows (domestic, regional and international) and traveller awareness of destinations” are “well in excess of the administrative costs of hosting such events” (Higham, 1999, p. 87). According to Higham (1999, p. 87), small-scale sport events include:
“regular season sporting competitions (ice hockey, basketball, soccer, rugby leagues), international sporting fixtures, domestic competitions, Masters or disabled sports, and the like”.
The Australia Day alternative events examined in this paper could be described as the ‘and the like’ part of Higham’s definition as they are sporting events which are staged regularly, are on a small scale but are not otherwise included in the list provided. Dimmock and Tiyce (2001, p. 357) note that these smaller community-based festivals or events may be referred to as “a carnival, tournament, contest, competition, exhibition, fete or fiesta” and may be particularly beneficial to the local region in which they are staged as they “do not tax the resources of the host city in the same manner as hosting a mega event” (Gibson et al., 2003, p. 182). Australia is often described as a sport-loving nation, where sport has had a substantial influence on the shaping of Australian society (Stoddart, 1988) with Veal and Lynch (2001, p. 286) describing sport as being one of the key social forms through which the “values of the British Empire were cemented into the Australia culture via activities such as horse racing, cricket, tennis and fox hunting”. In modern day Australia, one of the most popular sports is racing - which may reflect colonial times when early white settlers were heavy gamblers and even gambled on “the proverbial ‘two flies crawling up a wall’ – betting on which one would reach the top first” (Veal and Lynch, 2001, p. 55). In 1988 a beer commercial on television noted in song that “Australians love a race” and indeed, the Melbourne Cup horse race is described as the “race that stops the nation”. In 2000, the nation watched transfixed when indigenous Australian athlete Cathy Freeman won the 400 metres final during the 2000 Sydney Olympic Games. Rowe and Stevenson (2006, p. 211) note that “almost everyone in Australia participated in the Cathy Freeman moment in some way, and virtually all of those who observed and were interviewed believed it to be of importance well beyond the sporting arena”, particularly in the areas of Australian identity and indigenous relations. However, Carter (2006) suggests that although sport is often seen as being fundamental to what makes Australians truly Australian, he suggests that identifying sport with national characteristics is difficult - particularly given that such sporting enthusiasm is not uniquely Australian and, that Australian sport is not particularly egalitarianism. Instead Carter (2006) states that sport, along with television and cinema, simply offer symbols of what unites and distinguishes the Australian nation. Recent studies in tourism have considered the role of heritage attractions in helping create a national identity (see, for example, Palmer, 2005; and, Pretes, 2003). Fewer studies have considered festivals and events in this regard (see, for example, Green, 2002; and, Gibson and Davidson, 2004). Pretes (2003) notes that tourists receive messages sent to them by the creators of the sites they visit, and these sites of significance, presented as aspects of a national heritage, help to shape a common national identity, or “imagined community” among a diverse population. He notes that “each of these attractions helps to disseminate national guiding fictions, promoting a discourse of national inclusion” and a shared past (Pretes, 2003, p. 139). He notes that a shared identity is often an official goal of countries comprised of many different cultures where there exists a common urge

to create a national identity to overcome diversity and difference within the nation-state. He suggests that, in particular, monuments represent something shared by all citizens, helping to “popularize a hegemonic nationalist message of inclusion” (Pretes, 2003, p. 127). If sites can help create a common identity or imagined community among a diverse population, can a series of events held on a country’s national day, represent aspects of the nation’s culture and help to develop a common national identity? METHODOLOGY As suggested above, this paper is concerned with addressing the question: In what ways do Australia Day alternative events contribute to Australian national identity and Australian nationalism? An Australia Day alternative event is described here as an event staged on Australia Day which involves an unusual or alternative event, where locals and tourists either compete or are spectators during the unusual sport or game which reflects an aspect of Australian culture, with some of these events involving some form of a race, with some even racing untrainable animals. Two researchers independently searched the internet for Australia Day mainstream events and alternative events held on Australia Day 2007. Of the alternative Australia Day events found, one was chosen to focus upon, namely, the Story Bridge Hotel, Brisbane Annual Cockroach Race. The event raises money for charity but also creates income and awareness for the hotel. This alternative event was chosen as it was an event which reflected many of the aspects of Australian national identity examined earlier in this paper. The database Factiva, which contains the full text of major national and regional newspapers in Australia and overseas, was searched, to determine how the selected alternative event was promoted and reported in the run up to and following Australia Day, 2007. In addition, the most recent editions of the most popular travel guides for Australia were examined for mention of the selected Australia Day alternative event, namely Australia (Smitz et al., 2004), Australia: The Rough Guide (Daly et al., 1999) and Let’s Go Australia (Pegg, et al., 2005). The researchers then analysed the data using structuralism, semiotics or content analysis. A textual analysis consisting of structuralism (a way of thinking about the world which views all items in relation to an overall structure); semiotics (examining how signs generate meaning); or content analysis (a counting strategy) is incorporated into the discussion of some of the alternative Australia Day texts – particularly the Story Bridge Hotel Annual Cockroach Race. These methodologies are helpful for deconstructing mediated representations of national events. A combination of primary and secondary research has also been integrated to analyse the way in which Australia Day has been imagined, created and relayed - often for commercial purposes. Structuralism is the theory that culture is understood as a result of the formal structures that operate below the surface. In structuralist thinking it is argued that “the world is made up of relationships rather than things” (Hawkes, 1977, p. 17). Structuralism is a useful way of making sense of the larger narrative. The qualitative methodology of semiotics encompasses the relationship between a sign and its meaning, the way in which signs are combined into codes, and the wider culture within which signs and codes operate. Semiotics can be efficiently applied to the analysis of events. Semiotics is also a particularly useful methodology for deconstructing aspects of cultural representations and experiences. The quantitative methodology of content analysis is concerned with the frequency of content contained in a data set. Content analysis is effectively a counting strategy and is put forward as an objective method for counting content as the end result should be able to be replicated by another researcher. The aim of content analysis is to produce a relatively systematic overview of a particular

data set. It is concerned with “the denotative order of signification” (Fiske, 1990, p. 136). An essential feature of content analysis is the use of categories. In the case of alternative events, content analysis is therefore primarily concerned with studying what is actually evident at the event. It does not concern itself with questions of quality or interpretation. WORLD CHAMPIONSHIP COCKROACH RACING The 26th Annual World Championship Cockroach Races were held on Australia Day 2007 at Story Bridge Hotel in Brisbane, Queensland. The event originated when two locals argued over which Brisbane suburb had the fastest cockroaches. The two men decided to race some cockroaches at the hotel (Goldsmith, 2004) and now the event attracts about 6,000 people each year (Moore, 2004) and about 500 cockroaches (Lord, 2007). There are 14 cockroach races held during the day and entrants can bring their own cockroaches or hire some for the day (McNamara, 2006). With 14 races to entertain the crowd, the drinks continue to flow while the hotel raises maximum revenue on Australia Day. All the proceeds raised from the event are donated to the Brisbane Royal Children’s Hospital. At the start of each race the cockroaches are placed in a clear bucket, the steward upturns the bucket and the cockroaches race about three meters to a circular perimeter rope with the one crossing the rope first being the winner. There is also a steeple chase where the cockroaches have to race over an obstacle which is a garden hose (Goldsmith, 2004). In semiotic terms, the clear bucket represents transparency and that the event will be fair, while the ropes and garden hoses are the common household objects used as human-imposed boundaries and hurdles that these much-maligned Australian pests will have to conquer to achieve victory. Sometimes audience members are encouraged into eating cockroaches to raise money for charity (Goldsmith, 2004) and, the last race of the day is called “Crazies Cockies Crunch” where most of the cockroaches are stomped on by the spectators. This particular race is described by a hotel spokesman, as being “not very classy” (Niesche, 1998) but the range of experiences reflect the extremes of race day where, “thousands of onlookers raised beer cans and cheered lustily or, “ooohed” in disgust” (Sydney Morning Herald, 2004). A semiotic analysis of the names given to the cockroaches being raced reveals that they reflect Australian popular culture, politics and current affairs. For example, in 1998 there was a cockroach named “Crawline Hanson” (Niesche, 1998) (named after the right wing Australian politician Pauline Hanson) and in 2004 there was “Meaty Peter Beattie” (Sydney Morning Herald, 2004) (named after the Premier of Queensland). Some cockroaches were named after pop groups such as “Roach Spice”, owned by a syndicate of five English tourists (Niesche, 1998) and “Guns ‘n Roaches” named after the American heavy rock group Guns ‘n Roses (Goldsmith, 2004). The holder of the race record from 1992 was named “Drain Lover” which reflected the two times Melbourne Cup horse race winner “Rain Lover” (McNamara, 2006). Other cockroach names included “Roach Rage” and “ER - Emergency Roach” (Niesche, 1998); “The Great White Cock” (Sydney Morning Herald, 2004) and “Soft Cocky” (McNamara, 2006); “Sir Roach a Lot” (McNamara, 2006) and, “Millennium Bug” (Goldsmith, 2004). In 2003 the cockroach winner named “Osama Bin Liner” was “lovingly reared by his owners who turned up on the day in full beards and headwear, dressed as the world’s most wanted man” (Goldsmith, 2004) reflecting another fun and irreverent aspect of the event when attendees dress up for the occasion. Lane also noted that at the 2006 event there were pleasant motherly types wearing cockroach necklaces, kids with shirts saying “I am very appROACHable” or family groups with matching t-shirts displaying the words “Dwarf Roach” and “Papa Roach” (Lane, 2006).

The reason why the event has become popular was suggested by an audience member who said, “we’ve taken one of our national animals and made it into a mascot, after all they’re as much a part of Australia as the koala or kangaroo and far more common” (Lane, 2006). This reflects the role that cockroaches have in Australian society, suggesting that every household experiences cockroaches irrespective of the owners’ class and standing, so they have become an integral part of a supposedly egalitarian Australian society. Some cockroach owners attempt to make their cockroaches more ready to win a race by giving them sugared water, by placing them in ice to bring down their metabolism, by avoiding feeding them and/or by allowing them to get rid of all excrements as a way of making them lighter (Moore, 2004). One of the cockroach owners, who put a selection of cockroaches on ice, said that, as they came out of the ice, the feelers start moving around and, “that tells you their activity. If the feelers are moving, that means you have got a good one, that’s for sure” (Moore, 2004). This pre-race preparation reflects the seriousness that some participants view the event and perhaps reflects the competitive sporting nature of Australian society. Indeed, anyone disagreeing with any race rules or arrangements will be considered “wowsers” and “not very Australian at all” (Lane 2006). As Lane (2006) suggests, the races bring out all the best of Australiana – the beer, the water guns, the Australian hat with the dangling corks, the tattoos. She suggests that “its Australian bogan culture at its understated best”. DISCUSSION Events held on Australia Day can range from the serious to the frivolous and the formal to the informal. They can range from barbeques and games, to sporting activities. The level of professionalism involved in the event can range from amateur backyard cricket to the professional cricket of an Australia match against England. There are federally-sponsored events, state-sponsored events and, locally-sponsored events. There are mainstream events and then there are alternative events. Weed (2006, p. 311) notes that provision for sports events in the overwhelming majority of cases will take place through a partnership of the public, commercial and voluntary sectors. He suggests that the lead sector will vary, depending on the event, but “it is unlikely to be the commercial sector unless it is an event for which that sector owns the trademarks and rights (such as World Series Baseball)”. A content analysis revealed that this appears to be the case with the range of Australia Day alternative events discovered in 2007 in that the event organisers range from local councils, tourism boards, voluntary non-profit organisations and private sector companies. The range of events taking place on Australia Day may reflect Spillman’s (1997) suggestion that, in a diverse country, diversity itself becomes an aspect of national identity. Some events were organised by commercial operators aiming to make money from the alternative event but most events raise money for local, non-profit organisations. Some event organisers now receive sponsorship to stage these events which suggests they have become more mainstream and therefore, possibly less alternative. However, one wonders to what extent these events are designed for local residents, intra-state, inter-state or international tourists? Some Australia Day alternative events are held at locations which have no obvious link to the event being held, so, in effect, the event could be held on any site as the location is incidental to the core activity of the event. Robinson, Picard and Long (2004, p. 187) suggest that “generic and socially decontextualised – “placeless” – festival forms are increasingly being invented and scheduled with a main purpose of attracting tourist audiences as well as catering for various types of communities”. However, some Australia Day alternative events had a strong association with the location, reflecting the culture and identity of the area. For example, the Best Pioneer Dress Up competition held in Gympie, Queensland reflects the pioneering element of the early white settlers to the region.

Physical participation in the event through competition is offered at the Australia Day alternative events, with the opportunity provided for the attendee to experience and participate in the core activity of the event. The participants in the Australia Day alternative events did not require a range of specialist skills, knowledge or expertise to fully engage in the core activity of the event, meaning that the event is open to all types of people, perhaps reflecting Australian egalitarianism. From the perspective of structuralism, all men and women are equal when it comes to participation in these Australia Day events – thus communicating a clear message about Australia’s perception of itself as a classless society. In addition, some of the alternative racing events appear to involve introduced species such as cane toads while some feature “untrainable species” such as cockroaches which ensures the winning animal or insect is more random, perhaps reflecting the “fair go” attitude of Australians. Many Australia Day alternative events are not serious but simply provide an opportunity for participants and spectators to have fun and enjoyment. Weed (2006, p. 306) notes that sport “while still pursued by some for traditional motives of fitness, health, competition and achievement, is now increasingly participated in simply for fun and pleasure”. Similarly, Hede, Jago and Deery (2003, p. 8) note that in relation to events, attendees tend to seek more immediate gratification, suggesting that “from a value perspective, many are driven by a sense of ‘fun and excitement’ or other hedonistic values”. Similarly, Frew (2006) notes that when tourists experience fun and humorous events and festivals it helps ensure the experience is a positive one for all involved namely, the tourist, the tourism employees and, the locals. She suggests that the generation of pleasant emotions when attending a humorous event may result in high satisfaction levels and, positive word of mouth recommendation about the experience and/or destination. Therefore, the provision of fun and lighthearted events such as Australia Day alternative events may have numerous tourism related benefits and, may reflect the Australian satirical sense of humour. Jackson and Weed (2003) note that, regardless of size or importance, all events attract both participants and spectators and this appears to be is true for Australia Day alternative events. Such events may have an important part to play in the success of a region due to the enthusiasm of the repeat visitors who may attend each year to watch and/or compete in the event. Australia Day alternative events often receive greater media coverage than would be expected for the size and status of the event, possibly because the events provide a light-hearted story which may be suitable as a filler story or a final story on the television news following more serious news items. From a semiotic perspective, television news editors are keen to present the more quirky side of the Australian character. Such news items appeal to the Australian audience and are occasionally given a run by news editors of other countries to reinforce the bizarre characteristics of the land ‘Down Under’. From a destination management perspective, the strategic provision of such alternative events has the potential to enhance a region economically and socially and, to create high levels of post-trip satisfaction, repeat visits and positive word-of-mouth recommendation. CONCLUSION This paper has considered the images projected when Australians find alternative ways to celebrate their national day and discusses what this tells us about who Australians are and how they view themselves as a nation. Horne noted that national identity entails more than simply “flapping flags, singing folk songs or telling heroic anecdotes” (1981, p. 62) and indeed, this paper has noted that Australia Day includes many ways to celebrate nationalism from mainstream events funded by the government, to self-effacing, satirical and offbeat alternative events such as the annual cockroach racing championships.
The Australia Day celebrations of 2007 were similar in many ways to the Australian Centenary of Federation celebrations in 2001 when it was reported that “Australia yesterday managed to pull off a medley of the sentimental, the commemorative and the down-right bizarre” (Hurrell, 2001, p. 4). The staging of such “down-right bizarre” events on Australia Day is appropriate in a country that prides itself on not taking itself too seriously, where these off-beat events highlight and reinforce the non-conformist and irreverent mocking nature of many Australians. This was also evidenced by the wide-spread support for the ‘not so athletic’ mascot Fatso at the Sydney 2000 Olympic Games which represented Australia’s clear preference for the irreverent, the unauthorised, and the sometimes uncouth. While Australia Day Committees across the country can work to encourage patriotic flag-raising and citizenship ceremonies, the many alternative events staged on a limited budget provide an attractive lure for Australians. Australia Day alternative events should be recognised by local governments and tourism planners as a means of continuing to develop tourism in their region. From a supply side perspective, future research could examine the provision and adequacy of the other interdependent tourism components of; transportation, services, information and promotion (Gunn 1997) to more fully understand their potential impact in the local area. Further research could consider the type of people who engage in these Australia Day alternative events and examine their motivation for involvement. Gibson et al (2003) suggest that one of the challenges in understanding sport tourism and travelling fans is to recognise that for many fans, their primary motivation is to watch the sporting competition and little else, suggesting that they make little economic contribution to the local area. Further research could consider the best means of encouraging these spectators and participants to spend more time and money in the local region. However, as these events are under-researched, systematic research is required to identify the principal components and distinguishing features of such events, to document and enumerate their presence, and to locate them more explicitly in the general tourism system. REFERENCES Anderson, B. (1983). Imagined Communities: Reflections on the Origins and Spread of
Nationalism, London: Verso. Anderson, B. (1991). Imagined Communities: Reflections on the Origins and Spread of Nationalism
(Revised Edition), London: Verso. Carter, D.J. (2006). Dispossession, Dreams and Diversity: Issues in Australian studies, French
Forest: Pearson Education. Daly, M., Dehne, A., Leffman, D., & Scott, C., (1999). Australia: The Rough Guide (Fourth
Edition), London: Rough Guides Ltd. Donaldson, J., & Vesk, K (eds.) (2004). Gambling in Australia: Thrills, Spills and Social Ills,
Sydney: Powerhouse Publishing. Dimmock, K. & Tiyce, M. (2001). ‘Festivals and Events: Celebrating Special Interest Tourism’ in
Douglas, N., Douglas, N., Derrett, R. (eds.) Special Interest Tourism: Context and Cases, Queensland: John Wiley and Sons Australia.
Farouque, F. (2000). ‘Celebrating Our day the People’s Way, With Just a Dash of Pomp’, The Age, Melbourne, January 27, 4.
Fiske, J. (1990). Introduction to Communication Studies. London: Routledge. Fiske, J., Hodge, B., & Turner, G. (1987). Myths of Oz: Reading Australian Popular Culture,
Sydney: Allen and Unwin.

Frew, E. A. (2006). ‘The Humour Tourist: A Conceptualisation’. Journal of Business Research, 59 (5), 643-646.
Getz, D. (1997). Event Management and Event Tourism. New York: Cognizant Communication Corporation.
Gibson, C. & Davidson, D. (2004). ‘Tamworth, Australia’s ‘Country Music Capital’: Place Marketing, Rurality, and Resident Reactions’, Journal of Rural Studies, 20, 387-404.
Gibson, H., Willming, C., & Holdnak, A. (2003). ‘Small-scale event sport tourism: fans as tourists’, Tourism Management, 24, 181-190.
Goldsmith, B. (2004) ‘Gambling-Mad Aussies Flock to Annual Cockroach Race’ Website: http://www.enworld.org/showthread.php?t=74930 [Accessed on February 3, 2007]
Green, G. L. (2002). ‘Marketing the Nation: Carnival and Tourism in Trinidad and Tobago’, Critique of Anthropology, 22 (3), 283-304.
Gunn, C. A. (1997). Vacationscape: Developing Tourist Areas (3rd ed.). Washington: Taylor and Francis.
Hawkes, T. (1977). Structuralism and Semiotics. London: Methuen. Hede, A., Jago, L., & Deery, M. (2003). ‘An Agenda for Special Events Research: Lessons from the
Past and Directions for the Future’, Journal of Hospitality and Tourism Management, 10 (Supplement), 1-14.
Highham, J.E.S. (1999). ‘Sport as an avenue of tourism development: an analysis of the positive and negative impacts of sport tourism’. Current Issues in Tourism, 2 (1), 82-90.
Horne, D. (1981). ‘National Identity in the Period of the New Nationalism’, Nationalism and Class in Australia: 1920-1980, Brisbane: Australian Studies Centre, University of Queensland.
Hudson, P. (1999). ‘Nation Hooked on Gambling: Report’, The Age, Melbourne, July 20, 1. Hurrell, B. (2001). ‘Stand Up and Enjoy Being Silly’, Herald Sun, January 2, 4. Jacka, E. (1993). ‘Australian Cinema: An Anachronism in the 1980s?’ in G. Turner (ed.) Nation,
Culture, Text: Australian Cultural and Media Studies, London: Routledge, 106-122. Jackson, G. A. M., & Weed, M. E. (2003). ‘The Sport-Tourism Interrelationship’, in B. Houlihan
(ed.) Sport and Society, London: Sage. Jago, L., & Shaw, R. (1998). ‘Special Events: A Conceptual and Definitional Framework’, Festival
Management and Event Tourism, 5 (1/2), 21-32. Lane, J. (2006). ‘Roach Racin’’ Website: http://www.2camers.com/world-championship-
cockroach-racing-php [Accessed on February 3, 2007] Lord, K. (2007). ‘Eve of the Cockroach Races’, The Sunday Mail, January 28, 16. Loy, J. (1979). ‘The nature of sport: a definitional effort’ in Gerber, E., & Morgan, W. (eds), Sport
and the Body: A Philosophical Symposium, Philadelphia: Lea and Febeger, 38-47. McNamara, C. (2006). ‘Today: Go’, The Courier Mail, January 26, 26. Moore, T. (2004). ‘Celebrating our Freedom in a Dinky-Di Manner – Top Cocky Wins, Ice and
Easy’, The Courier-Mail, January 27, 9. National Australia Day Council (2006). Website: http://www.australiaday.gov.au/pages/page86.asp
[Accessed on December 1, 2006] Niesche, C. (1998). ‘Crunch Time for Racing Roaches’, The Australian, January 24, 16. Overington, C. (2000). ‘Aussie, Aussie, Aussie, By Jingo’, The Age, Melbourne, September 9, 5. Palmer, C. (2005). ‘An Ethnography of Englishness: Experiencing Identity through Tourism’,
Annals of Tourism Research, 32 (1), 7-27. Pegg, J., Shafroth, A., and Lonsdorf, R. C., (2005). Let’s Go: Australia,(Eighth Edition), St
Martin’s Press, New York. Pretes, M. (2003). ‘Tourism and Nationalism’. Annals of Tourism Research, 30 (1), 125-142.

Ritchie, B. W. (2004). ‘Exploring small-scale sport event tourism: The case of Rugby Union and the Super 12 competition’, in Ritchie, B. W. & Adair, D. (eds.) Sport Tourism: Interrelationships, Impacts and Issues, Clevedon: Channel View Publications, 135-154.
Ritchie, B. W. & Adair, D. (2004). Sport Tourism: Interrelationships, Impacts and Issues, Clevedon: Channel View Publications.
Robinson, M., Picard, D., & Long, P. (2004). ‘Introduction: Festival Tourism: Producing, Translating, and Consuming Expressions of Culture(s)’. Event Management, 8 (4), 187-189.
Rowe, D. & Stevenson, D. (2006). ‘Sydney 2000: Sociality and Spatiality in Global media Events’ in A. Tomlinson and C. Young (eds) National Identity and Global Sports Events, Albany: State University of New York Press.
Smith, A. (1991). National Identity, London: Penguin Books. Smitz, P., Ashworth, S., & Bain et al. (2004). Australia (Twelfth Edition), Footscray: Lonely Planet
Publications. Spillman, L. (1997). Nation and Commemoration: Creating National Identities in the United States
and Australia, Cambridge University Press. Standeven, J. & De Knop, P. (1999). Sport Tourism, Champaign: Human Kinetics. Stoddart, B. (1988). ‘The Hidden Influence of Sport’, in V. Burgmann and J. Lee (eds),
Constructing a Culture: A People’s History of Australia since 1788, Melbourne: McPhee Gribble, 124-35.
Sydney Morning Herald (2004). ‘The War of the Roaches’ Website: http://www.smh.com.au/articles/2004/01/28/1075088086429.html [Accessed February 3, 2007]
Taylor, R. & Shanka, T. (2002). ‘Attributes for Staging Successful Wine Festivals’, Event Management. 7, 165-175.
Thrane, C. (2002). ‘Jazz Festival Visitors and Their Expenditures: Linking Spending Patterns to Musical Interest’, Journal of Travel Research, 40, 281-286.
Veal, A. J., & Lynch, P. (2001). Australian Leisure, Frenchs Forest: Pearson Education. Veal, A. J., & Lynch, P. (2006). Australian Leisure (Third Edition), Frenchs Forest: Pearson
Education. Waterman, S. (1998). ‘Carnivals for Elites? The Cultural Politics of Arts Festivals’. Progress in
Human Geography, 22 (1), 54-74 Weed, M. (2006). ‘Sports Tourism’, in Beech, J. and Chadwick, S. The Business of Tourism
Management, Essex: Pearson Education. Weed, M. and Bull, C. (2004). Sports Tourism: Participants, Policy and Providers, Oxford:
Elsevier Butterworth-Heinemann. White, L. (2004) ‘The Bicentenary of Australia: Celebration of a Nation’, in Linda K. Fuller (ed.)
National Days / National Ways: Historical, Political and Religious Celebrations around the World, Westport, Connecticut: Praeger, 25-39.

Fourth International Event Research Conference Re-evaluating the City/Town: Events as a Catalyst for Change
PARTNERSHIPS, SOCIAL CAPITAL AND THE SUCCESSFUL MANAGEMENT OF SMALL SCALE CULTURAL FESTIVALS: A CASE STUDY OF HOBART’S ANTARCTIC
MIDWINTER FESTIVAL
Dr Bree Hadley Lecturer in Performance Studies
Queensland University of Technology [email protected]
ABSTRACT This paper uses a case study of the Antarctic Midwinter Festival held annually in Hobart, Australia, to analyse the ways in which cooperation, partnerships and social capital contribute to the successful management of small scale cultural festivals. It argues that the strategic use of partnerships evident in much event management practice is especially important in small communities, where issues with cost, infrastructure and market scale make it even more challenging to create the critical mass of thematically linked activities that characterise a successful festival. An emphasis on marketing, branding and relationships management in the context of a partnerships approach can help festival coordinators establish a bedrock of social capital to support a small scale cultural festival like the Antarctic Midwinter Festival. This approach can, however, have implications for succession planning as stewardship of the festival, and the social capital that supports the festival, is transferred to different coordinators down the years.
INTRODUCTION Shifts in Australian cultural policy in the past three decades have increased the profile of festivals as a means of celebrating a city’s identity, building a sense of wellbeing amongst its citizens, and bolstering its competitiveness in attracting tourists and trade. Traditionally one-off or once-a-year events that bring people together to connect and celebrate, cultural festivals today come in all shapes and sizes. Local events run by community organisations, trade organisations and councils offer a forum for a day of fun, and for consolidating the social and trade relationships that exist in a community. Niche events celebrate the contribution one or more of a city’s different communities – artistic, ethnic, social or geographical – make to its character. Larger scale sport, art and cultural spectacles can be subject to competition amongst capital cities for the chance to build their global profile. This paper focuses on issues facing councils and other organisations seeking to produce a festival as one part of the plan for building a sustainable future for a smaller city or community. Much of the literature on community-oriented festivals to date has looked at the degree of formality with which they are programmed, managed and positioned in the marketplace (Lade & Jackson, 2005; Mehmetoglu & Ellingsen, 2005; Mayfield & Crompton, 1995; Getz & Frisby, 1988). Looked, in other words, at the way they are tailored to external market environments. The range of recipients of funding from bodies like Festivals Australia in recent years suggests many small cities have, with the help of cultural mapping techniques, managed to identify a facet of their artistic, economic, educational or environmental profile they can successfully build and market a festival around. For these smaller communities, though, a great idea, well grounded in local culture, with a little government subsidy, is not necessarily enough. In a small city, where there may not be an established event culture, it can be costly and challenging to try to pull together the critical mass of thematically linked activities that characterises a successful

festival. Especially when the festival coordinator – it may be a local, an officer of the local council, or a coordinator contracted by the council to run the event – finds themselves working in a context without the systems, infrastructure, resources or target-market scale to make a focus on significant levels of sponsorship and corporate support a practical option. Whilst this is suitable for larger-scale sports, arts and food festivals, with a chance of achieving the national and international profile attractive to major sponsors, it can be counterproductive for coordinators of smaller events to focus exclusively on this strategy. Festival coordinators thus need to come up with new strategies to create a successful festival, with a trade, tourism or social benefit, for their smaller city. This paper investigates one strategy festival coordinators use to create enough exciting programming for a successful event with minimal resources. It is best described as a partnerships strategy, based on cooperation, trust and social capital. The concept of social capital has been popular in community development literature of late (Emery & Flora, 2006), because it (like the events of which it is a part (Derritt, 2003)) is seen to have some potential to remedy a perceived decline in interpersonal cohesion in society (Putnam, 1995a; Putnam, 1995b; Putnam, 2000). This paper does not set out to critique the merits of the concept of social capital per se, or to speak to the ways in which the concept has been harnessed by politicians, community development practitioners and theorists. Instead, it focuses on social capital in the specific context of small cultural festivals, arguing that coordinators can use cooperation, partnerships and social capital to encourage other organisations to contribute to their programming, especially in the context of smaller cities. This is not, of course, to suggest that large-scale events in major capitals can exist without social capital. In small cities, though, such capital can be more than just a foundation on which formally contracted programming, or community outreach programming, operates. It can be the critical factor in guaranteeing the participation of other people and organisations at their own cost, and can even see festivals become umbrella brands to which people are free to hitch their own events and exhibits with minimal vetting or control. To understand the part this partnerships strategy plays in small festivals, this paper starts with a closer look at how shifts in Australian cultural policy have changed the face of cultural festivals in the past three decades, the sort of festival programming expected by audiences today, and the steps festival coordinators can take to encourage partner producers to help them create a critical mass of programming. It then offers a case study of one event, the Antarctic Midwinter Festival held annually in Hobart, Tasmania. The Antarctic Midwinter Festival celebrates Hobart’s identity as a gateway to the Antarctic continent and its seasonal climate – seasonal, not cold, given there is also currently a push to market the fact that Tasmania sits on the same latitude as Spain (cf. Launceston City Council, 2004). The Antarctic Midwinter Festival has had more success with this than other ventures in recent years – the prime example being the short lived Antarctic Adventure, a permanent display along the lines of a science museum for tourists and students. A good idea and a good grounding in Hobart’s unique history notwithstanding, in a city of less than 200,000 the Antarctic Midwinter Festival does still face challenges finding and funding the critical mass of acts, activities and exhibits it needs to attract audiences of 40,000 over a 10 day period. This makes it an ideal example to tease out the issues central to this paper. In analysing the Antarctic Midwinter Festival, this paper looks particularly at the ways in which marketing, branding (to establish a strong cultural signature for Hobart and this event), and relationships management are critical to the success of a partnerships strategy. In doing so, it shifts the focus to the internal marketing mix that McCleary (1995) identifies as critical to a festival’s success, exploring the potential it has to attract partner producers as well as audiences, and so build social capital around an event. The paper concludes with a brief consideration of the issues this strategy – based on trust in the festival coordinator, the festival and fellow producers – presents for succession planning, as festivals are transferred from one coordinator to another over the years.

THE CHANGING FACE OF CULTURAL FESTIVALS As analysis in anthropology and other fields has shown, festivals traditionally provide a forum for celebrating community and seasonal change (Alomes, 1985), as well as a time-out-of-time in which challenges to social authority are briefly sanctioned (Bakhtin, 1994). Festivals are thus, traditionally, as Bakhtin (1994) argues, “not a spectacle seen by the people; they live in it, and everyone participates because its very idea embraces all the people” (p. 198). The emergence of new cultural and community structures in the twentieth century has not spelled the end for the public celebrations of a city’s art, culture and heritage festivals provide (Boissevian, 1992). But their nature and function has shifted as cultural priorities and policies shift. In particular, a shift in emphasis from elite arts to community engagement in the arts in Australian cultural policy since the 1970s has contributed to the growing importance of local festivals. The Australian events calendar is now dotted with festivals, placemaking and heritage projects in which the public directly participates (Druett, 1998), as well as elite international sports and arts festivals, in which both are important indicatators of a city’s liveability. While these festivals are not the medieval carnivals Bakhtin described, as themed celebrations (Getz, 1997) with an emphasis on social, skills and economic development, they do still strive to “embrace all the people”. Themes typically come from a city’s colonial history (filtered through contemporary perspectives), its environmental features, or its economic features (Boissevian, 1992; Alomes, 1985). Cultural policy in Australia has continued to evolve in the 1990s, shifting from a supply to a market orientation, particularly since the Creative Nation policy produced by the federal government in 1994 (Rentschler, 1998; Radbourne, 1997). This means festivals are now positioned to build cultural capital, to strengthen the entertainment, tourism and trade profile of a city, and so contribute to its economic capacity (Quinn, 2005; Derritt, 2004; Boissevian, 1992). The festival’s portrayal of a community’s values thus becomes more than a means of consolidating its identity, and forging functional links. It serves a broader range of urban objectives, selling the city to locals, tourists and the skilled newcomers it seeks to attract. This shift has also, according to Skinner and Rukovina (2003), resulted in a change in festival management structures. Festivals are, they say, bigger, better, and rely on more paid professional staff than ever before, thanks to a shift from grants to self-generated funds and sponsorship, along with a greater focus on audience satisfaction (a strong focus in arts and cultural practice across the board, as Rentschler (1998) and Radbourne (1997) suggest). Audiences expect a greater range of facilities, a greater range of activities, and greater variety in both favourites and new features. This shift prompts the question at the core of this paper. How do smaller cities wanting to create a festival, with all its attendant social and economic benefits, do this? The concern is not necessarily lack of a distinctive heritage to tap into. Current thinking suggests even the smallest community can map important facets of its artistic, architectural, trade, scientific or educational traditions, crystalising an identity to showcase to itself and to others (Druett, 1998). But, whereas large festivals may have the financial subsidy to pay for a critical mass of programming, or an audience pool large enough to make a push for significant sponsorship a practical option, small festival producers may find it challenging to find enough programming in the local area, let alone pay for it. This means small festivals, with small levels of subsidy, need a coordinator who will look for other ways of establishing an engaging program of events. When a festival coordinator cannot fund enough activities, one way of bolstering the program is with partner produced events and exhibitions, an approach which relies on the coordinator’s ability to use trust-based networks, rather than traditional, vertical, transactional relationships, to build a strong program for the event, and to persuade people to be part of it. TRUST, COOPERATION AND SOCIAL CAPITAL

Though the term social capital has only recently come into popular usage through Bourdieu’s (1986) differentiation of the forms of capital, and the subsequent work of Coleman (1988, 1990) and Putnam (1993, 1995a, 1995b, 2000), the ideas about social interaction it carries have been current since Durkheim’s and Marx’s foundational sociological theories (Farr, 2004; Portes, 1998). Social capital is defined as a resource that comes from relations of mutual recognition, responsibility and obligation between people, relations that given people access to capital they can bargain with for benefits (Coleman, 1990; Bourdieu, 1986). “Social capital refers,” as Putnam (2000) suggests, “to connections among individuals – social networks and the norms of reciprocity and trust that arise from them” (p. 19). People participate in social relations, pool their passions, ideas and resources, in anticipation of some return (Dasgupta, 2005). This creates a currency of trust whereby they commit to working together, and risk ostracisation if they do not carry through this commitment, or carry out the obligation with due competence (both being fundamental to the trust relations in play (Atkinson & Butcher, 2003)). Social capital has been differentiated into the tighter structure of the bonding capital that exists within a group, and the looser structure of the bridging capital that establishes ties with other groups (Narayan, 1999), and the term entrepreneurial social capital has also been used to describe the use of bonds, bridges and goodwill in economic development (Emery & Flora, 2006). Because it is based on social relationships which will disintegrate without regular replenishment (Colman, 1990; Putnam, 2000), social capital is more a circular process than a thing, a process that produces, maintains and is produced by strong community ties. Which is why Hawkes (2001) suggests it may be better described as a lubricant of society than a glue for it. Governments have seized on the notion of social capital, seeking to increase it to hold together and heighten the impact of capital-building exercises in other areas (Emery & Flora, 2006), and to move beyond traditional market transactions into more transformational relations. Not all theorists see social capital as an effective component of community development strategies, though. The difficulty is that this type of bond is not a formal, measurable, controllable bond of the sort that guarantees the ‘proper’ behaviour of the people involved. For Bridger and Alter (2006), the shifting, changing, isolating and dislocating structures of modern society make it difficult for people to feel they can count on future return from cooperation today. They make it difficult for people to trust that their cooperation will result in some sort of reciprocity or shared obligation, and this means the networks on which social capital depends are diminished. While this is an issue, it is clear that many people involved in cultural development are still interested in shaping relations between people, encouraging them to act in a way that will establish loyalties across the geographical, class, ethnic or educational lines that have, as Bridger and Alter (2006) suggest, conventionally tended to diminish the potential for trust, cooperation and social cohesion. Festival coordinators seeking to build social capital amongst partners contributing to a critical mass of programming can take steps to counteract this lack of trust, and create bridging networks. The critical thing, as Atkinson and Butler (2006) argue, is to avoid generalisations about how beneficial social networks can be, and instead identify specific factors that build the trust, bridges and social networks that will encourage partner producers to commit programming to a festival. This discussion will focus on three factors contributing to trusting relationships amongst partner producers, all connected with the internal marketing mix. The first factor is the festival coordinator’s ability to frame the festival, its function, and its experiential properties, as part of a strong cultural signature or brand. As analysis of the Antarctic Midwinter Festival will show, a strong brand can help persuade partner producers that they will benefit from investing in the festival, even in a shifting, changing, transitory event climate. It can help persuade them that the personal, experiential and/or economic payoff of

participating in the festival once will also lead to a longer running relationship, with further benefits for them in the future. The second factor is the festival coordinator’s ability to identify the most suitable government, corporate, community or arts partners to bring under the festival’s umbrella, in order to increase its artistic and administrative capacities, and its community links. Because, as Dasgupta (2005) notes, while theorist tend to think of networks as things that exist, they do still need to be established. The festival coordinator needs to find partners that may be able to fulfil their own objectives by participating in the festival, making pitches to people with similar passions, or a similar market. They need to avoid partner matches that overwhelm a festival’s current identity, seem strange in the context of the festival’s current identity, or seem too much like commercialised money-spinners. The third factor is the festival coordinator’s ability to create the management and communication systems that will best support the interpersonal and interorganisational bridges on which this partnership strategy is built. Differences in motivation, priorities, professionalism and resources amongst partners contributing to a common goal can cause strain at the best of times (Ostrower, 2004). But this will be compounded if there is a lack of transparency, integrity or trust, or lack of commitment to promises made. Festival coordinators need to clarify goals, roles, relations, projected benefits, and periods of commitment from the start (Ostrower, 2004). They need to make certain partners are positively disposed to each other, willing to put their own reputations on the line, willing to agree to incentives and conditions, and, ideally, willing to commit for the long term (Dasgupta, 2005). Making this happen can, for festival coordinators, mean moving from transactional leadership to more creative, charismatic, transformational leadership within horizontal rather than vertical networks (Dasgupta, 2005). THE ANTARCTIC MIDWINTER FESTIVAL The Antarctic Midwinter Festival began in 2001 after a proposal from the Australian Antarctic Division, the agency responsible for representing the federal government in Antarctica, for a one day event on a winter weekend. The brief was to showcase the contribution the Australian Antarctic Division, the international players in the Tasmanian Polar Network, and the more than 800 Antarctic administrators, academics and scientists make to the city, and to offer the community a chance to meet people working in the Antarctic sector in Hobart and on the continent (Laskey, 2005; Tasmanian Department of Economic Development, 2005; Tasmanian Department of Economic Development, 2004a). In this respect, the Antarctic Midwinter Festival has characteristics of a niche event designed to celebrate a uniquely Hobart trade, and a community- or council- run festival designed to consolidate Hobart’s social and trade relationships. It is designed to contribute to the viability, vitality and liveability of Hobart, and thus of Tasmania as a whole, at both symbolic and concrete levels. In today’s festival climate it might be assumed that the local Hobart City Council – the level of government closest to the community, with the greatest interest in cultivating the community’s identity (Stevenson, 2000; Mercer 1998, 35; Dixon-Ward & Atwell 1998; Hawkins & Gibson 1995) – would take responsibility for running a small city-based festival like the Antarctic Midwinter Festival. It has, however, been run under the auspices of Antarctic Tasmania, a division of the state-level Tasmanian Department of Economic Development from the start, because Hobart is a small capital, of a small state, and because the festival is pulling artefacts and technologies associated with Hobart’s Antarctic history together to promote economic, social and political agendas important to the liveability of this small state as a whole. After being assigned to the Executive Officer of Antarctic Tasmania in 2001, and to a Station Master from the Australian Antarctic Division in 2002 and 2003, the festival director position was put to tender in 2004, with the contract awarded to David Laskey. Laskey was tasked to breathe new life into the festival, without losing the features that had already gained support. To do this he

had to develop an innovative festival management model that gets large outcomes with limited financial resources (Laskey, 2005). In 2005, for instance, Laskey had an operational budget of about $40,000 from the Tasmanian Department of Economic Development (increasing to $55,000 in 2006 (Tasmanian Department of Economic Development, 2005)), with smaller but still significant funding from the Hobart City Council, the Tasmanian Polar Network, and in-kind support from newspapers, airlines and hotels to create a critical mass of activities for 40,000 people over a 10 day period (Laskey, 2005; Tasmanian Department of Economic Development, 2005). In other words, less funds to showcase the state capital Hobart than some of the larger municipalities in Sydney and Melbourne spend on suburban events. Although Laskey does seek sponsorship for the Antarctic Midwinter Festival from organisations like the Tasmanian Polar Network, he does not necessarily see this as a primary focus in managing the success of the festival, given it is a niche event with a mainly Hobart market, and given the other demands on local sponsors from events like his own larger Summer Festival (Laskey, 2005). Instead, Laskey has concentrated on curating a core program of iconic events that make the Antarctic Midwinter Festival brand strong enough that partner organisations will see it as beneficial to contribute to a parallel program of partner events under the festival’s banner to create critical mass (Laskey, 2005). The first step in making this model work has been a rebranding which broadens the festival’s scope beyond the scientific orientation of the first few years to a broader celebration of Hobart’s identity targeted to local families and tourists (Laskey, 2005; Tasmanian Department of Economic Development, 2004b). He has been using the Antarctic Midwinter Festival’s core and partner programming to re-image and re-imagine the city of Hobart – that is, to provide images, impressions and experiences only possible in Hobart, as Australia’s “stopping point” (Tasmanian Department of Economic Development, 2005) on “the way south” (Antarctic Tasmania, 2002 p. 16). These include images of ice, fire, animals, people, the polar technologies that have opened up the continent over the past century, and the changing seasons linked to the southern Winter solstice (Bruce, 2002). One emphasis has been on images of the Midwinter Solstice coming mainly out of community participation in the festival’s core program of events – the annual community arts project building giant penguins and petrel lanterns, the parades, parties and markets in Salamanca square with snow, ice sculpting, drummers, firetwirlers and warm mulled wine, the Midwinter Dinner established to link to a more bawdy event on the continent itself, and the Huskies picnic in the botanical gardens that closes the festival (Antarctic Tasmania, 2005; Laskey, 2005). The idea is to use this celebration of Hobart, the only Australian capital seasonal in this way (Bruce, 2002), to link into the lights, lanterns, fire, colourful characters and feasts traditional used in solstice celebrations like Christmas. Another emphasis has been on scientific images of Southern Ocean exploration, this time coming mainly from partner events like discovery days at the CSIRO, the Tasmanian Museum and Art Gallery, and the Antarctic Base Station at Kingston (and, in 2004, tours of the Aurora Australis icecutter), Screen Tasmania’s The Longest Night Film Festival, and other displays of artefacts, archival footage and artworks at the State Library of Tasmania, the City of Hobart Gallery, the National Archives, the Maritime Museum of Tasmania, and the Hadley’s Hotel where Antarctic explorers like Roald Amundsen stayed. The idea has been to shift the emphasis from polar technologies to the people who use them, in the past and the present, in Antarctica and in Hobart (Laskey, 2005; Antarctic Tasmania, 2005). Laskey has tied all these polar images together with a logo scheme based around a family-friendly cartoon image of polar creatures cavorting with people on the Antarctic ice, transitioning up into the Hobart harbour around which the festival’s activities take place. A strong cultural signature for the Antarctic Midwinter Festival is not just a means to an external marketing or economic end. It establishes a level of interest, legitimacy and

momentum, and what Petitdemange (1998) would call a “human soul” (p. 56). It contributes to a sense that people’s investment of time, effort and ideas in the event will be rewarded, in an immediate way through connection, celebration and learning, and in a more ongoing way as the connections translate to strong community, corporate, artistic and educational links in the city of which the event is part (Derritt, 2003). A strong cultural signature for the Antarctic Midwinter Festival thus gives Laskey a greater scope when it comes to the second step in making this model work, the courting of other organisations he thinks will be able to share in the benefits the festival brings, the profile it brings, and the potential for networking it brings, by creating partner events. In his tenure as director of the Antarctic Midwinter Festival, this has helped Laskey broaden the circle of partners he is actively working with to plan and create programming to include the Hobart City Council, the Tasmanian Museum and Art Gallery, the National Archives of Australia, the CSIRO, the Maritime Museum of Tasmania, community artists, even local theatre companies and football clubs who have put on midwinter events that coincide with the festival and create a critical mass of events in Hobart. Laskey is also constantly making connections with new potential partners, putting as many irons in as many fires as possible (Laskey, 2005), and seeing to partnership and production logistics only after interest has been sparked. New possibilities include programming opportunities with the University of Tasmania, new links with artists who have participated in the Antarctic Fellowships Summer Program, and new links with authors through an Antarctic Literary Festival. These new possibilities are important not just to inject new life into the festival, but to limit the possible impact of any one partner pulling out, a process which might otherwise diminish or destroy the commonly held social capital accrued to the event. Branding, and a constant effort at bringing new events under the brand, thus become a way of future-proofing the festival (Laskey, 2005), protecting the social capital. Naturally, it is difficult to balance the interests of many different stakeholders, to be sure each gets a chance to showcase their collections and passions, and to create their own new networks, under the festival’s banner, without dissipating the distinctive image and identity Laskey has started to define for the festival, or risking the quality of the programming. Not least because Laskey is working with so many different partner organisations, with such different priorities and degrees of professionalism, and there is such a difference in the degree of formality with which the different relationships are defined. While the Antarctic Midwinter Festival has some contracted sponsorships and subsidies, many of the partnerships and relationships it relies on are informal, grounded in promises and trust. Accordingly, the third step in making this model work has been managing the balance between formal control and informal collaboration to create synergies without too many surprises (Laskey, 2005). One critical consideration here is the fact that the partner produced elements are often safe events at safe venues (Laskey, 2005). There are fewer unanticipated risks in these regulated activities, both for Laskey and his overall program, and for the partners themselves (Laskey, 2005). An activity outside this category was the Australian Antarctic Division’s Aurora Australia tours in 2003 and 2004, and Laskey believes the boat not being in harbour in 2005 may have been a blessing both because of the risk, and because reliance on this one feature of the festival year after year may have become counterproductive anyway (Laskey, 2005), letting too much of the festival’s capital accrue in one area. Laskey has also been pursuing initiatives to define the relationships between the Antarctic Midwinter Festival’s diverse programming, partnership and sponsorship categories more strongly, so all producers will know what is being invested in the mutually held capital, in what ways. He has differentiated the Antarctic Midwinter Festival’s own core events from other events, including through a bar chart in the 2004 and 2005 programs (Laskey, 2005). He has also begun defining the cash or in-kind support behind the sponsorship categories more strongly, using the Expeditioner, Husky and Penguin categories (Laskey, 2005; Antarctic Tasmania, 2005). All of which suggests transparency is an important factor in creating the trusting, collaborative relationships that will produce and replenish the Antarctic Midwinter Festival’s social capital.

PARTNERSHIPS, SOCIAL CAPITAL AND SUCCESSION PLANNING As this case study of the Antarctic Midwinter Festival suggests, a partnerships strategy, whereby a festival coordinator creates a strongly branded event, encourages partner producers to contribute programming to the event, which strengthens the event, and encourages still more partners to come on board, can be a way of generating large outcomes with limited resources. It is a strategy dependant on the festival coordinator’s ability to create transparent, trusting relationships and social capital amongst partners. One significant questionmark over this strategy, however, is its implications for succession planning. In today’s festival management climate it is common for a coordinator to spend several years with an event, and then pass control to someone new. It happens with local festivals, as well as large-scale international arts and cultural festivals. It also happens in event management organisations (councils, arts centres), where control of an event may be rotated each year. This is, most would argue, positive for the momentum of cyclical events, as well as for the careers of those who manage them. The questionmark, in the context of this paper, is what then happens to the social capital that has accrued to a festival, its coordinator, and its network of partner producers. It is an issue foreshadowed in this case study of the Antarctic Midwinter Festival, with Laskey’s wariness of allowing the energy invested in the event to accrue around a single element of the program, such as the Aurora Australis. And yet – as Bridger and Alter’s (2006) concern that social capital diminishes as face-to-face contact decreases in a technologically mediated society indicates – trusting relationships are rarely generated in a ‘faceless’ way. Trust is attached to specific people, specific things, or specific brands, with specific characteristics that people can identify and feel comfortable with. Which is why branding was such a vital factor in Laskey’s effort to build positive relationships with potential event partners as well as with audiences. Is there, then, a risk that a director like Laskey will carry the accrued capital with him when he leaves the festival? On the one hand, this is a concern. On the other hand, though, it is worth remembering that other networks, other loyalties, have also been built up as part of the process. And because social capital is not a concrete, mathematically quantifiable thing, the amount of loyalty Laskey takes with him does not necessarily decrease the amount of loyalty that remains with the festival, and the network of partners. The next step in researching the part social capital plays in the successful management of small cultural events, then, is empirical study of the shifts in the social capital surrounding a festival that take place when there is a change in leadership. Do partners stay with an event through changes in leadership? What factors drive their decisions to stay or not stay with an event? Questions that can soon be asked of the Antarctic Midwinter Festival itself, as Laskey leaves to pursue other opportunities (Tasmanian Department of Economic Development 2006), and new festival director Anne Kerr takes the reins for the first time in 2007. CONCLUSIONS AND IMPLICATIONS This paper has used a case study of the Antarctic Midwinter Festival held annually in Hobart, Tasmania, to analyse the ways in which cooperation, partnerships and social capital contribute to the successful management of small scale cultural festivals. It has shown that an emphasis on branding, marketing and relationships management in the context of a partnerships approach has helped the Antarctic Midwinter Festival establish a bedrock of social capital that supports the festival, and the positive image of Hobart’s Antarctic history and connections the festival conveys. This approach has encouraged people to participate in the event, pooling their passions, ideas and resources in anticipation of cultural and economic returns. Which, in turn, has helped extend the festival’s programming to include a far wider range of community-oriented activities, events and exhibitions to bring life to the city over the ten days of the festival. The case study shows that relationships based on shared passions and responsibilities can, as the literature on social capital suggests, bring ongoing benefits for producers, partners, participants and audiences. Moreover, it raises the possibility that the multidimensional loyalties

created as part of this partnerships approach may build capital that continues to benefit the festival, the community and the city even as staff and stakeholders change over the years. ACKNOWLEDGEMENTS This paper was developed during my time in the Arts and Entertainment Management program at the Bowater School of Management and Marketing at Deakin University, and I would like the thank the program’s staff, particularly Associate Professor Ruth Rentschler, Dr Hilary Glow and Amelia Bartak, for their support and advice. I would also like to thank former Antarctic Midwinter Festival director David Laskey both for providing a fantastic example of what can be achieved in the context of a small scale cultural festival like this, and for his generosity in discussing his work on the festival. REFERENCES Alomes, S. (1985). Parades of Meaning: The Moomba Festival and Contemporary Culture.
Journal of Australian Studies, 17, 3-17. Antarctic Tasmania. (2005). Antarctic Midwinter Festival [Website]. Antarctic Tasmania and
Tasmanian Department of Economic Development, Hobart. <www.antartic-tasmania.info> Accessed 30 August 2005.
Antarctic Tasmania. (2002) Antarctic Midwinter Festival [Program], Antarctic Tasmania and Tasmanian Department of Economic Development, Hobart.
Atkinson, S. and Butcher D. (2003). Trust in the Context of Management Relationships: an empirical study. SAM Advanced Management Journal, 68.4, 24-34.
Bakhtin, M.M. (1994). Rabelais and his World, in P. Morris ed. The Bakhtin Reader: Selected Writings of Bakhtin, Medvedev and Voloshinov. E. Arnold, London and New York, 194-244.
Boissevian, J. ed. (1992). Revitalising European Rituals. Routledge, London and New York. Bourdieu, P. (1986). The Forms of Capital, in J. Richardson ed., Handbook of Theory and
Research for the Sociology of Education, Greenwood, New York, 241-258. Bridger, J.C. & Alter T.R. (2006). Place, community development, and social capital. Journal of
the Community Development Society, 37.1, 5-19. Bruce, C. (2002). Warm Glow from Midwinter’s Festival. Australian Antarctic Magazine, Issue 4
Spring. <www.aad.gov.au/default.asp?casid=4382> Accessed 30 August 2005. Coleman, J. S. (1988). Social Capital in the Creation of Human Capital. American Journal of
Sociology, 94 (Suppl.), S94-S120. Coleman, J. S. (1990). Foundations of Social Theory, Belknap Press, Cambridge. Dasgupta, P. (2005). Economics of Social Capital. The Economic Record, 81.255, 2-21. Derritt, R. (2004). Festivals, Events, and the Destination, in I. Yeoman, M. Robertson, J. Ali-
Knight, S. Drummond, and U. McMahon-Beattie eds. Festival and Event Management: An International Arts and Culture Perspective. Elseveier Butterworth-Heinemann, 32-50.
Derritt, R. (2003). Making Sense of How Festivals Demonstrate a Community’s Sense of Place. Event Management, 8.1, 49-58.
Druett, V. (1998). Festivals, visual and performing arts in our community, in R. Rentschler ed. Shaping Culture: Arts and Entertainment Management. Deakin University Press, Geelong, 119-136.
Dixon-Ward, B., & Atwell, C. (1998). Arts and cultural policy, in R. Rentschler (ed) Shaping Culture: Arts and Entertainment Management. Deakin University Press, Geelong, 61-74.
Emery, M. & Flora, C. (2006). Spiraling-up: Mapping Community Transformation with Community Capitals Framework. Journal of the Community Development Society, 37.1, 19-36.
Farr, J. (2004). Social Capital: A Conceptual History. Political Theory, 32.1, 6-33. Getz, D. (1997). Event Management and Event Tourism. New York, Cognizant Communication
Corporation.

Getz, D. & Frisby, W. (1988). “Evaluating Management Effectiveness in Community-Run Festivals”, Journal of Travel Research, 27.1, 22-27.
Hawkes, J (2001). The Fourth Pillar of Sustainability: Culture’s Essential Role in Public Planning. Community Development Network Victoria, Melbourne.
Hawkins, G. & Gibson, K. (1995). Cultural Planning in Australia: Policy Dreams, Economic Realities, in K. Gibson and S. Watson eds. Metropolis Now: Planning and the Urban in Contemporary Australia. Pluto Press, Sydney, 217-228.
Laskey, D. (2005). Personal interview, 27 July 2005. Lade, C. & Jackson, J. (2005). Key Success Factors in Regional Festivals: Some Australian
Experiences. Event Management, 9.1-2, 1-11. Launceston City Council. (2004). Launceston, Tasmania, Australia. Launceston City Council,
Launceston. Mayfield, T. & Crompton, J. (1995). The Status of the Marketing Concept Among Festival
Organizers. Journal of Travel Research, 33.4, 14-22. McCleary, K.W. (1995). Applying Internal Marketing Techniques for Better Festival
Organization and Management. Festival Management and Event Tourism, 3.1, 1-7. Mehmetoglu, M. & Ellingsen, K.A. (2005). Do Small-Scale Festivals Adopt “Market
Orientation” as a Management Philosophy?. Event Management, 9.3, 119-132. Mercer, C. (1998). Culture, the city and the community, in R. Rentschler ed. Shaping Culture:
Arts and Entertainment Management. Deakin University Press, Geelong, 29-49. Narayan, D. (1999). Bonds and Bridges: Social Capital and Poverty. World Bank Report 2 67,
Washington. Ostrower, F. (2004). Partnerships Between Large and Small Cultural Organizations: A Strategy
for Building arts Participation. Building Arts Participation: New Findings from the Field. The Urban Institute, Washington, and The Wallace Foundation, New York.
Petitdemange, J. (1998). Cultural identity, in R. Rentschler ed. Shaping Culture: Arts and Entertainment Management. Deakin University Press, Geelong, 49-60.
Portes, A. (1998). Social Capital: Its Origins and Applications in Modern Sociology. Annual Review of Sociology, 24, 1-24.
Putnam, R. D. (2000). Bowling Alone: The Collapse and Revival of American Community. Simon and Schuster, New York.
Putnam, R. D. (1995a). Bowling Alone: America's Declining Social Capital. Journal of Democracy, 6, 65-78.
Putnam, R.D. (1995b). Turning In, Tuning Out: The Strange Disappearance of Social Capital in America. Political Science and Politics, 28, 664-683.
Putnam, R. D., with Leonardi, R. & Nanetti, R.Y. (1993). Making Democracy Work: Civic traditions in modern Italy. Princeton University Press, Princeton.
Quinn, B. (2005). Arts Festivals and the City. Urban Studies, Vol. 42.5/6, 927-943. Radbourne, J. (1997). Creative Nation: A Policy for Leaders or Followers? An Evaluation of
Australia’s 1994 Cultural Policy Statement. The Journal of Arts Management, Law and Society, Winter, pp. 271-283.
Rentschler, R. (1998). The changing shape of culture, in R. Rentschler ed. Shaping Culture: Arts and Entertainment Management. Deakin University Press, Geelong, 1-8.
Skinner, B.E. & Rukovina, V. (2003). Event Sponsorship. Wiley and Sons, New York. Stevenson, D. (2000). Art and Organisation: Making Australian Cultural Policy. University of
Queensland Press, Brisbane. Tasmanian Department of Economic Development. (2006). New Director for Antarctic Midwinter
Festival [Media Release], Tasmanian Department of Economic Development, Hobart, 6 December.
Tasmanian Department of Economic Development (2005) Funding for Midwinter Festival to Rise [Media Release], Tasmanian Department of Economic Development, Hobart, 26 June.

Tasmanian Department of Economic Development (2004a) Triple Bottom Line Report – Australian Antarctic division. Tasmania Department of Economic Development, Hobart. <www.ded.gov.au/about/puyblication/tbl/03-04/aad.html> Accessed 30 August 2005.
Tasmanian Department of Economic Development (2004b) “Midwinter Festival promises great event”, News, Tasmanian Department of Economic Development, Hobart, 29 May. Online. Available www.development.tas.gov.au/publicaitons/news/newsMay04.html. Accessed 30 August 2005.

Fourth International Event Research Conference Re-evaluating the City/Town: Events as a Catalyst for Change
COMPETITIVE EQUESTRIAN SPORTS TOURIST: PROFILE AND SPENDING AT A REGIONAL EVENT.
Andrea Williams
Charles Sturt University [email protected]
ABSTRACT Sport and events make up significant segments of the total tourism sector and hold great opportunities for regional areas. This paper examines the profile and spending of competitive equestrian sports tourists with regard to competitive equestrian events being staged in rural and regional Australia. The author concludes that competitive equestrian sports tourists appear to place most emphasis on the competition per se and the standard of facilities provided at the competition site. While these tourists do contribute to the region in a general economic sense, there overall interaction within the region is limited and narrow in its nature. The key to extending this interaction would seem to lie with increasing the likelihood of competitors staying for at least one night, as these competitors are more likely to use off site accommodation, go shopping, eat at restaurants and participate in other entertainment away from the competition site. To encourage overnight stay event and site management need to place a high priority on fulfilling the key motivational requirements of these sports tourists which in turn will assist to extending the size and duration of the events. Keywords: Sport tourism; sports tourist; equestrian; regional, motivations, benefits sought, spending patterns;
INTRODUCTION Sport plays a pivotal focus in the lives of many Australians. Levels of involvement can range from regular participation in a serious structured competition at a local or international level, watching children play in organized competitive teams, unstructured recreational participation in sport type hobbies or as sport fans at all of the above situations (Higham and Hall, 2003). For the most part competitive sport is undertaken at structured events run under strict competition rules or guidelines, offering participants the opportunity to test their skills, strength, or endurance against others (Bjelac and Radovanouic, 2004; Deery M., Jago M., and Fredline, L., 2004). Due to the geographic expanse of Australia, regular participation in their chosen sport often means traveling great distances on a frequent basis in order to attend these events. It is not uncommon for this sports motivated travel to involve overnight or longer stays, thus qualifying participants as sport tourists (Douvis, Yusof and Douvis, 2001). Within Australia the equestrian non racing sector (recreation and competitive equestrian activities) is large with the contribution to Australia’s GDP for expenditure associated with keeping event and recreational horses being calculated at approximately $1.9 billion per annum, with the more serious competition end of the sector contributing close to $1.3 billion per annum. This contribution to

Australia’s Gross Domestic Product (GDP) exceeds the estimated contribution of the racing industry, not including wagering thus demonstrating the significance of this sector within the Australian economy (Rural Industries Research and Development Corporation, 2001), and highlights the possible opportunities with respect to the equestrian sports tourist market. This paper explores the motivations and benefits sought by the competitive equestrian sport tourist specifically dressage competitors while attending and participating in the competitive event and their level of participation in leisure and recreational activities away from the competition site within the region hosting the event. Also the paper provides insight in to the spending patterns of these tourists while attending a competitive event staged in regional New South Wales. These aspects of the competitive sport tourist although receiving increasing interest by previous authors (Hinch and Higham, 2004; Gammon and Robinson, 2003; Green and Chalip, 1998;Maier and Weber, 1993), much of the emphasis has been on team competition such as Rugby (Ritchie, 2004) or motivations and spending of sport fans. Additionally, little imperial research has been undertaken in relation to smaller scale event sport tourism (Ritchie, 2004) particularly when staged in regional areas. Thus, by extending the study to the competitive equestrian sports tourist who compete on an individual basis at an event staged in regional New South Wales both expands present knowledge in this field and makes a significant new contribution to the knowledge and understanding of the individual competitive sports tourist. THE SPORT TOURIST AND THE EQUESTRIAN COMPETITOR Authors such as Hinch and Higham, (2004); Gammon and Robinson, (2003); Gibson (1998) and Hall, (1992) have engaged in considerable debate in an endeavor to define the sport tourist and sport tourism. Considerable time and energy has been spent on developing concise models and definitions to enable the sport tourist to be studied and analysed. Previous discussion has centered on the importance that is placed on the sporting element of the tourism experience, and the extent to which participation in the sporting activity influenced key aspects of the tourist decision process including areas such as destination choice, length of stay and additional activities participated in. Gibson’s (1998) divided the sport tourist sector into three broad categories: those that watch sporting events, those visiting sporting related attractions, and those who actively participated in sporting activities and events. The Active Participants category can be further split into ‘Activity Participants’ being those who’s leisure time includes sport related travel and ‘Hobbyists’ who are amateur sports enthusiasts undertaking travel in order to participate in their chosen sporting competition (Hall, 1992). This broad approach to defining the sport tourist although not without merit as it provides a simple approach to analyzing this sector, does not take into consideration the differing motivations that may be held by those within the same category. Additionally, there is no clear indication if the prime motivation for travel was the sport element or the tourism element. This distinction is important as it has implications from a marketing, economic and social perspective (Gammon and Robinson, 2003). ‘The Sport and Tourism Model’ developed by Gammon and Robinson (2003) endeavors to extend the understanding of the sport tourist by providing a more detailed examination of the coupling of sport and tourism by exploring firstly motivations of the various groups within the sport tourism sector. Where the prime motivation for travel is the participation in competitive or recreational sport with the touristic element possibly providing positive reinforcement for the total experience, the classification is ‘Sports Tourists’. The second category is where sport and tourism meet in a situation where the sporting element is the secondary motivation or activity – something healthy and fun to do while visiting a particular destination and is classified as ‘Tourism Sport’. In order to

improve understanding of the motivations within each category further analysis of the tourist’s commitment to the sport in question is undertaken. The ‘Sports Tourist’ and the ‘Tourism Sport’ are split into ‘Hard’ and ‘Soft’ to indicate the level of involvement and commitment held by the individual towards the sporting element of the overall experience. ‘Hard Sports Tourists’ are those tourists who are actively or passively participating in a competitive sporting event. ‘Soft Sports Tourists’ are those who actively participate in recreational sporting activities. The distinction between the two is in the competitive nature of the events attended and the individual involved. Previous research focused on motivations and benefits sought for those individuals positioned in the ‘Hard Sports Tourist’ category demonstrate that they are more likely to focus on issues such as standard of training facilities, access to competition, access to professionals such as doctors or physiotherapists (Maier and Weber, 1993), suitability of competition venue/facilities, quality of competition, and ease of access from accommodation to competition site as key priorities (Williams, 2005). Whether the competition is being held in a holiday region is of a low priority. Prime motivation for the ‘Hard Sports Tourist’ is the sport element (Gammon and Robinson, 2003). Where the competition event is held would seem to have little if any impact on the decision to attend or the behaviour of the competitor outside of the competition timetable. This brings into question the actual contribution these events have within the host community. Event tourism is now the fastest growing component of the leisure travel market (Schifflet and Bhatia, 1999). Competitive sporting events are increasingly being seen as being key participants in this event tourism growth. The reason for this is that sport tourism mostly in the form of sport events have been seen to be an effective contribution to the economic mix of cities and regions (Burgan and Mules, 2001), improve future amenities both sporting and other (French and Disher, 1997), improve or reposition a destinations image in regard to its competitors (Brown, Chalip, Jago and Mules, 2002) and assist in managing demand (Higham and Hinch, 2002). However, there is evidence to suggest that frequently the economic contribution of these events are over estimated due to a lack of accurate data and the desire of political forces to demonstrate a positive contribution or result. Also previous studies have found that spending patterns by participants at these events tends to be quite narrow and thus impacting on only a small section of the host community. Putis (1998) found that most spending by visitors and athletes who attended the 1995 Special Olympics World Games made the bulk of their purchases at the event site, and thus there was very little positive impact within the retail and business houses away from site. Therefore, although the overall economic impact may have been positive the results were felt in only a very narrow section of the host community. Ritchie (2004) found that nearly one third of the complete sample of sport tourists attending and participating in a Rugby 12 competition in Canberra, Australia did not stay in paid accommodation, with many only visiting for a day and staying with family and friends. Similarly, Costa and Chalip (2005) in their study of paragliders in a regional community of Portugal found that for the most part these visitors did not engage in any of the leisure and recreational activities that were available in the town and were not inclined to spend money locally as they tended to bring their own food supplies. The study found that this group of sports tourists was motivated by the paragliding per se and secondly by the opportunity to socialize with other paragliders. The only exception was when the town hosted the week long tournament, which saw local accommodation and restaurants filled with competitors, spectators and their families. This would suggest that in order for sports tourists and sporting events to have a significant positive economic impact it is necessary to attract a substantial number of competitors, which in itself

creates a greater draw card or spectacle, thus increasing the likelihood of drawing more spectator and or media coverage. As a sporting sector the equestrian competitor has many variations ranging from the occasional participant in organized competition at a very low skill level within their local area, to serious and highly skilled individuals who compete on a regular basis and travel extensively to do so. Additionally, the activities participated in are extremely broad ranging from the Olympic disciplines of Dressage, Show Jumping and Eventing (run under the Equestrian Federation of Australia banner) to Polocrosse, Campdrafting, Cutting and Pony Club just to name a few. In each discipline there are many who would qualify as Sports Tourists and a large number of these would be classified as ‘Hard’ according to Gammon and Robinson’s (2003) ‘Sport and Tourism Model’. These particular equestrian competitors demonstrate a very serious and committed approach to the sport regularly traveling 2 to 5 hours to compete. There is no doubt that the serious end of the equestrian competitors qualify as ‘Hard Sports Tourists’ as per Gammon and Robinson’s (2003) model as their travel is very clearly motivated by the purpose of participating in competitive sport. However little is actually known about the motivations and benefits sought by these ‘Hard Equestrian Sports Tourists’ when attending these large sporting events particularly when staged in regional areas. Additionally, there is limited understanding regarding the participation of these visitors in recreational and leisure activities available in the surrounding region and whether these opportunities influence the decision to attend the competition. This paper begins to address this void as it provides insight into the motivations and benefits sought and spending patterns of a particular cohort of ‘Hard Equestrian Sports Tourists’ - dressage competitors while competing at an event in regional New South Wales, Australia. METHODS Background The results detailed in this paper are the first stage of a year long research project which aims to identify and explain the tourism motivation, behavour and spending patterns of a wide variety of competitive equestrian sports tourists who are members and users of the Albury Wodonga Equestrian Centre. Located in regional Australia, Albury Wodonga has a population of approximately 75,000 residents. The immediate surrounding area, being predominately rural, is dispersed with small townships bringing the total population close to100,000. The tourism industry generates approximately $160 million revenue annually, and attracts 1,400,000 visitors per year (Investment Albury Wodonga, 2002). Additionally, Albury Wodonga has a strong history with sport in general and has hosted a large and successful ‘Festival of Sport’ for many years during the months of February and March. Also, the Region has a strong connection and involvement with the equestrian community demonstrated by the establishment approximately 10 years ago of the only purpose built publicly owned equestrian complex of international standard outside of the metropolitan area. The purpose of the study is two fold. Firstly it will provide valuable insight for the future management of the equestrian centre and infrastructure development. Secondly, the study will provide insight into the present and potential of the equestrian sports tourist as a viable tourist market for the region. Method

The research was conducted in two phases comprising exploratory research and descriptive research. The exploratory involved a review of relevant academic and industry literature. This stage provided insight into the general context of sports tourism and sports tourists and assisted with the development of the data collection instrument utilized in the second phase. In the descriptive research a survey was conducted of persons competing at the Albury Wodonga Regional Dressage Championships in 2006, which was held at the Albury Wodonga Equestrian Centre. The data was collected by way of a structured self-completion questionnaire that was returned via a reply paid envelope. The design of the survey was drawn from literature and previous studies by the author in relation to equestrian sports tourists (Williams, 2005). The survey collected predominately quantitative data, using nominal, ordinal and interval scales; however, some qualitative data were also collected. A seven point Likert scale, where 1 represented very strongly disagree and 7 represented very strongly agree, was used to measure the motivations and benefits sought by competitors while attending the event. All 85 competition riders were given the opportunity to participate in the survey and the response rate was 30%. The data from the survey were analysed using basic statistical techniques, including means, modes and standard deviations as appropriate. Additionally, independent t test was applied to the 7 point Likert scale to identify if there were any significant differences between the competitors who were day attendees and those who stayed for at lease one night. RESULTS The cohort of equestrian competitors attending this competition appear to be quite homogeneous; with 96% of those who responded being females with a large percentage being aged between 31 and 50 (65.4%) and indicating there main equestrian interest as dressage. These demographics of dressage competitors would be inline with competitors at similar Equestrian Federation of Australia (EFA) events held within Australia with national figures showing female membership accounting for 86.1% of all EFA members with senior members (those over 18 years) making up just under half the membership base (Equestrian Federation of Australia, 2005/06), thus any possible non-response errors are minimalised. Their level of commitment to their competition activities is high with 96% indicating that they compete either very regularly (compete on average 12 or more times per year) or regularly (compete on average between 6 and 10 times per year). Traveling long distances also seems to be quite common with just over half (53.8%) of those who responded indicting that they traveled between 2 and 5.5 hours to arrive at the event site. Dressage competitors appear to travel and compete on an individual or paired basis with the mean travel party being 2.15 persons and 1.62 horses. The most likely combination of travel party comprised of 1 rider, 1 strapper and 1 horse and represented 38.5% or all participants. Other popular travel party compositions included competition riders traveling on their own (19.2%), and two competition riders traveling together (19.2%). Results indicate that those dressage competitors who traveled more than 2 hours stayed at least one night either at the competition site or in accommodation away from the ground. Of those who stayed at least one night 64.3% stayed at the event site in their own trucks and floats using powered sites provided by the centre at a cost of $18.00 per vehicle. Off site accommodation such as motels, hotels, or caravan parks was only used by 35.7%.

The total mean spend by a travel party while attending the competition was $220.35 with a standard deviation of $212.12. This variation is partly explained by the difference in those competitors who stayed off the competition site in a hotel and those who stayed on the competition site. This equates to approximately $102.00 spent per person or $136.00 spent per competition horse entered (based on the means stated previously). As numbers in travel parties are often difficult to ascertain, spending per horse entered could be a more tangible, measurable and accurate approach for ascertaining total expenditure for future equestrian events. The biggest spending area for competitive dressage sports tourists aside from entry costs, which can be considerable (but are paid prior to attending the competition), is transport/fuel costs. Results show that the mean spend per travel party on fuel was $89.00. The other key area of spending was on meals/food with the mean spending per travel party being $39.00. Total direct spending by competitors and their traveling companions was just over $13,000 as there were 97 horses entered. This does not include previous paid entries, which would be in the vicinity of approximately $9000, or total spending by spectators and sports officials. Additionally, any spending by the committee to stage the event is not included in this figure. Initial analysis of the means of the 26 factors relating to motivations and benefits sought of the whole sample measured via a 7 point Likert scale where 1 equated to very strongly disagree and 7 to very strongly agree appear in Table 1. The results demonstrate that competitive dressage sports tourists are on the whole motivated to attend a competitive event by the standard of facilities and the opportunity to compete, demonstrate and hone skills in the competition environment. Factors relating to; opportunity to test skills against other competitors, surface quality in warm up and competition space, quality of stabling and yard facilities, mixing with other successful competitors, level of previous success of other competitors and standard of competition were all felt to be important influences on the decision to attend this competition as these factors all returned a mean of 5.19 or above. Although competitors indicated that social interaction with fellow competitors while at the competition site were important with a mean of 5.42, little if any emphasis was placed on leisure and recreational activities off site and or outside of the competition timetable. These factors which included opportunity to get away and relax, the trip is like a holiday, wine and dine in town and enjoy the night life on offer do not appear to provide any motivation for attending the event as they all returned means of 3.08 or less. These competitive dressage sports tourists are primarily motivated by the competition per se and the competition site facilities. They appear to be not interested in pursuing other interests or activities while on the competition trip. .

Table One Motivations and Benefits Sought by Competitive Dressage Sports Tourist: Total Sample
Description of motivational factor N Mean Std. dev.
Facilities, competition and skill development factors
I have entered this competition as it provides me with an opportunity to rub shoulders with some of the best rider/horse combinations going around at present 26 6.12 1.107
I have entered this competition as the facilities at the equestrian centre make it very pleasing to compete 25 6.38 .941
I have entered this competition because I always enjoy coming to this equestrian centre 24 6.19 .981 I have entered this competition as the competition and practice area surface is excellent 26 5.96 1.311 I have entered this competition because the equestrian centre where it is held has good stable/yard facilities 25 6.12 1.532
Although we have to travel a long way to get to this competition it is worth it as the facilities are excellent 25 5.19 2.191
Social interaction on site I have entered this competition to have a day out with my horse and equestrian friends 26 5.42 1.27 Leisure and recreation off - competition site I have entered this competition as it provides me with the opportunity to get away from home for a few days 26 2.69 1.594
I have entered this competition because my partner likes to come with me as there are lots of nice places to have a meal 25 2.38 1.813
I have entered this competition because it is a 2 day event and it gives me an opportunity to get away and relax for a few days 25 3.27 2.108
As we do not go on holidays attendance at this competition is really like a holiday 26 2.38 1.835 A group of us come to this event every year so it is a good opportunity to catch up with friends 25 3.08 2.331
As Albury Wodonga has a good selection of night life it is a good opportunity to compete and have a social weekend away with my partner and or friends
24 2.04 1.341
During the competition we usually go into town and do some shopping or have a coffee with other friends at the competition
26 2.12 1.583
At some stage during the time we are here we usually visit something ‘non-horsy’ like wineries, art galleries or the movies 26 1.77 1.21
The literature indicates that extending the time of the competition and thus increasing the likelihood of participants staying over in the area increases the likelihood of improved economic impacts, subsequently independent t test was used to ascertain if there was a significant difference in the motivations and benefits sought by those who stayed for at least one night and those who attended

each day. The results appear in Table 2, and indicated that there is a significant difference between these 2 groups for a number of the factors.
Table 2 Results of Independent t Test
Between Competitors Who Stayed for at Least One Night and Those Who Did Not.
Factor Stayed over N Mean Std
Deviation Sig
Worth the long travel/facilities
Yes No
14 11
6.07 3.82
.997 2.601
.000
Partner wine and dine
Yes No
13 12
2.69 1.58
1.548 1.084
.022
Shopping/coffee Yes No
14 12
2.57 1.58
1.950 .793
.008
Those competitors who stayed over for at least one night demonstrated a significantly more positive appreciation for the standard of facilities provided at the equestrian centre. This is not surprising as many traveled many hours to attend the competition, with approximately half camping on the ground and all leaving their horses at the competition site. Additionally, although both groups demonstrated limited interest in recreation, night life, shopping and off competition site entertainment results show that those that stayed at least one night were significantly more interested in these activities. DISCUSSION The results for the total sample indicate that although this cohort of equestrian competitors qualify as ‘hard sports tourists’ as per Gammon and Robinson’s (2003) ‘Sport and Tourism Model’, they possible to not perceive them selves as tourists and are not motivated by leisure and recreational activities outside of the competition time table. For these tourists traveling long distances and staying overnight is a necessity and minimal expenditure appears to be the norm. There is little interaction with the host community away from the competition site resulting in limited spending except for bare necessities such as food and fuel. This strengthens previous findings of Maier and Weber (1993) who found that for the highly competitive sports tourist the tourism element is of little importance. These results also support previous studies (Putsis, 1998 and Costa and Chalip, 2005) which have found that travel motivated primarily by a strong commitment to participate in competitive sporting events as a competitor appears to reduce the opportunities of the host communities to capitalize on the visitation from an economic perspective. However, as Costa and Chalip (2005) found attendance of larger numbers of competitors will improve the total contribution and also the spread or distribution of the spending within the host community. An increase in competitor numbers creates a larger spectacle resulting in improved drawing power for media and spectators. CONCLUSION As these sports tourists appear single mindedly motivated by the standard of competition site facilities and the competition per se, attention by organizers, site management, tourism authorities and local government bodies need to focus on maintaining and improving these elements of the competition and event experience. Additionally, all communication to the prospective competitors needs to continually focus on the quality of these aspects to ensure the competitors are aware of the standard of facilities and level of competition offered. In this way the size of the events can be

increased in order to attract a larger number of competitors and subsequently improved media attention and spectator interest and attendance. Increasing the critical mass of competitors at each event will also provide opportunities to increase the length of the event thus encouraging competitors and spectators to stay longer. The results clearly show that competitors who stay over night are more inclined to participate in leisure activities away from the competition site. In this way the event management may be able to foster a wider distribution of benefits within the host community. LIMITATIONS This paper provides results form the first round of data collection for a year-long research project which will explore various cohorts of competitive equestrian sports tourists. Although providing considerable insight in to the demographic and motivational make up of the competitive equestrian sports tourist more research is required to establish a clearer understanding of this market. Therefore, these results provide only an introduction to the total equestrian sports tourism market, as they focus on one specific cohort; dressage competitors. Also, the study was conducted in regional Australia, and thus the results may not be transferable or compatible with similar events in metropolitan areas. Further much of the data collection relied on the use of a Likert scale, which is not a true interval scale and thus the mean may not be the true mid point. However, the results show that there is minimal variation from the mean and thus it was deemed appropriate to use this measurement. REFERENCES Bjelac, Z. and Radovanaovic, M. (2003) ‘Sports events as a form of tourist product, relating to the
volume and character of demand’ Journal of Sport Tourism, 8(4), pp260-269. Brown, G., Chalip, L., Jago, L. and Mules, T. (2002) The Sydney Olympics and brand Australia. In
N. Morgan, A. Pritchard, and R. Pride (Eds), Destination branding: Creating the unique destination proposition (pp. 163-185). Oxford, UK: Butterworth-Heinemann.
Burgan, B. and Mules, T. (2001) ‘Reconciling cost-benefit and economic impact assessment for event tourism’ Tourism Economics, 7, 321-330.
Costa, C. A. and Chalip, L. (2005) ‘Adventure sport tourism in rural revitalization – An ethnographic evaluation’ European Sport Management Quarterly, Vol. 5, No. 3, 257-279, September.
Deery, M. Jago, L and Fredline, L. (2004) ‘Sport tourism or event tourism: are they one and the same?’ Journal of Sport Tourism, v9, no 3, pp235-245.
Douvis, J. Yusof, A., and Douvis, S. (2001) ‘An examination of demographic and psychographics profiles of the sport tourist’ The Cyber-Journal of Sport Marketing, http://www.cjsm.com/vol2 (down loaded 5/3/01).
Equestrian Federation of Australia, (2005/06) Annual Report http://www.efanational.com/default.asp?MenuID=The_EFA/11754/0,Reports_and_Plans/11722/667 (down loaded 1/6/07)
French, S. P. and Disher, M. E. (1997) ‘Atlanta and the Olympics: A one-year retrospective’ Journal of the American Planning Association, 63, 379-392.
Gammon, S. and Robinson, T. (2003) ‘Sport and Tourism: A conceptual framework’ Journal of Sport Tourism 8(1), 21-26.
Gibson, H. (1998) ‘Active sport tourism: who participates?’ Leisure Studies, 17, 155-170. Hall, C. M. (1992) Adventure, sport and health tourism, Special Interest Tourism (edited by B.
Weiler and C. M. Hall), Bellhaven Press, London.

Higham, J. E. S. and Hinch, T. D. (2002) ‘Sport, tourism and seasons: The challenges and potential of overcoming seasonality in the sport and tourism sectors’ Tourism Management, 23, 175-185.
Higham. J. E. S. and Hall, C. M. (2003) ‘Sport Tourism in Australia and New Zealand; Responding to a Dynamic Interface’ Journal of Sport Tourism 8(3), 131-143.
Hinch, T. and Higham, J. (2004) ‘Sport tourism development’ Channel View Publications, Great Britain.
Investment Albury Wodonga. (2002). Albury Wodonga Economic Indicators. Maier, J. and Weber, W. (1993) ‘Sport tourism in local and regional planning’ Tourism Recreation
Research, 18(2), 33-43. Putsis, W. P. (1998) ‘Winners and losers: Redistribution and the use of economic impact analysis in
marketing’ Journal of Macromarketing, 18, 24-33. Rural Industries Research and Development Corporation, (2001) The horse industry contribution to
the Australian economy. Shifflet, D. K. and Bhatia, (1999) ‘Event tourism market emerging’ Hotel and Motel Management,
Sept 6, 26. Williams, A., (2005) ‘Are Equestrian Competitors a valuable sports tourism segment? – an
exploratory study’ CAUTHE, Sharing Tourism Knowledge, Alice Springs, 1 – 5, February.

Fourth International Event Research Conference Re-evaluating the City/Town: Events as a Catalyst for Change
THE EVOLUTION OF TWO MUSIC FESTIVALS
Trevor Mules School of Business and Government
University of Canberra [email protected]
ABSTRACT This paper sets out to explore the notion that strategic management is an important skill for event managers. As the events industry matures, more attention is being focussed on the survival of events and the competitive strategies of event organisers. The two events reported upon are the Tamworth Country Music Festival, and the Gold Coast Wintersun Festival. Both are large, long running festivals, and have evolved with both similarities and differences. Structured interviews were conducted with organisers, Local Government, and tourism agencies in both places. The paper will describe their historical development, organisational structures, and strategic management.
INTRODUCTION As the events industry has matured, the management of many long-running events has become more professional. While Getz (2005, p.32) notes “the majority of event professionals came into their careers from some other background”, annual events that are managed by paid professional rather than volunteers are increasingly analogous to consumer services in general. The management of regular annual events requires expertise in marketing, finance, people management, risk management and project management in order to ensure the short term success of the event. Long run success is more dependent upon strategic management. Strategic management is a well defined business process which is forward looking, long run, and iterative. These are all general management skills and chapters on them are specifically included in most business management texts as well as texts on event management (Getz, 2005; Allen, et al, 2005). The research literature on event management includes personnel management (Hanlon and Stewart, 2006), volunteer management (Monga, 2006), organisational management (Long, 2000), and sponsorship (Coughlan and Mules, 2002), amongst others. There appears to be little research on strategic management for events, which raises the question of whether it is absent from event management practice. This paper considers the issue of whether long running, successful festivals owe their success to strategic management processes, or to good fortune, or a combination of the two. Two long-running successful Australian music festivals were chosen as convenience case studies, and their evolution is considered in a strategic sense. Comparisons are made between their strategy practices and the textbook framework of strategic management. Historically, they are found to diverge from the text book ideal. This divergence is seen to be changing, and is a further step in the evolution of professionalism in event management. RESEARCH METHODS

Replicated case study research is the method used in this paper. Jennings (2001) states that case studies operate “within the holistic-inductive paradigm”, wherein researchers are attempting to reach general conclusions from studying particular cases. Case study methods are common in events research (Getz, Andersson and Larson,2007; Reid, 2006). Case studies allow the focus to evolve as more information comes to light (Jennings, 2001, p.178) and allows richer theoretical development than sample surveys (Getz, et al, 2007, p.107). Use of a random sample was rejected for this study because of:
1. the lack of a sample frame of events to draw from. 2. the great variety of events would have led to very high sampling error. 3. the difficulty of designing a questionnaire that would capture processes and relationships.
Replicated case studies may reveal relationships which may subsequently be tested using sample surveys (Yin, 1989, p.53).
The aim of this research was to assess the extent to which festival managers use strategic management processes. Two particular music festivals were chosen as case studies because their longevity suggested that they had been successful in adapting to change, in competing with other leisure opportunities, and in meeting consumer needs. Face to face interviews were held in each location with festival management and with local tourism and government officials. The interviews followed the same sequence of questions in each case, with the questions being designed to detect the use, either explicitly or implicitly, of strategic management processes. THE TWO FESTIVALS The two festivals chosen for this comparison are the Tamworth Country Music Festival and the Gold Coast Wintersun Festival. These were chosen partly as a convenience because some research material already exists (Mules, 2004), and partly because they were long running events with some continuity in theme and management. A summary of their main features is shown in Table 1. Both events are music festivals featuring a mix of free and ticketed performances, both indoors and outdoors. Both events are away from the mainstream of popular music and cater to a specialised audience. Both events form part of the tourism destination image strategy of their host local governments. The Tamworth Country Music Festival is held every January and dates back to the 1960’s when a radio station in Tamworth experimented with a country music format in response to lost nigh-time audience when television came to the region. The format proved to be successful, and station management devised the first Australian country music awards in 1969 as a way of promoting the radio station. The Golden Guitar awards continue to be the focal point of the annual festival, but the awards ceremony now fights for attention with concerts and performances in the streets, parks, clubs and hotels around town. There is no single organising entity for the festival, with the Country Music Association of Australia being responsible for the awards and new talent quest, the Tamworth City Council being responsible for concerts in the streets and parks, and private organisations running concerts at other venues around town. Tamworth City Council has stated its intention to take a more active role in management and coordination of the festival. This is partly in response to past issues of unruly behaviour in public places, and partly recognition of how important the event is to Tamworth’s image, both as a tourism

destination and as a rural centre. Tourism Tamworth uses the country music connection in year round tourism promotion, and even designed its visitor centre in the shape of a guitar. The airport and the taxi cabs are also adorned with the golden guitar symbol. The festival enjoys strong support from the Australian country music recording industry and this profile plus adroit public relations has attracted sponsorship from national corporations. National media coverage has ensured annual crowds of 50,000 to 70,000. Commercial accommodation providers are unable to cope with these numbers, and so sports grounds and school ovals become tent cities during the festival, providing a cash injection into the schools and sports clubs. The Wintersun Festival is held every June at Coolangatta at the southern end of Queensland’s Gold Coast. Initiated by local business people, its original aims were to boost demand for accommodation at a time which was previously a seasonal low-point, and to promote the southern part of the Gold Coast which is not as famous as the northern part around Surfers Paradise. Its musical theme is the rock and roll era of the late 1950’s and early 1960’s, and it also celebrates the cars, clothes and popular dance styles of the era. It is unashamedly a baby-boomer nostalgia festival. The main feature of Wintersun is the free beachside street performances, with several portable stages being set up in two main streets that are closed to vehicle traffic for the weekend. This area is also used for a street parade and a display of hundreds of restored street cars of the era. Over the years the musical entertainment has spread to clubs and hotels, and began to occur earlier in the week, just as happened in Tamworth. Most of these performances were ticketed rather than free and stimulated demand for more nights accommodation with commercial providers. The festival has a full time Director, and a Board comprising representatives of business and government. While the Director is a focal point for the festival organisation, he has limited power to control the nature of performances at private venues such as lifesaving clubs, services clubs, etc. This is also similar to the situation at Tamworth, except that Tamworth has no equivalent person to Wintersun’s Director. Over time, the Wintersun organisation has acted strategically in adding new elements. Initially a musical event, cars were added in 1989. There followed a dance competition, merchandising of clothing and compact discs of Wintersun artists, street parade, car cruise, dance lessons and street market. It has also moved to extend the festival over more days than the original two day event.
Table 1 Comparison of Wintersun and Tamworth Festivals
Wintersun Tamworth Commencement in current form 1988 1973 Crowd size 50-70,000 50-70,000 National corporation as major sponsor No Yes National media coverage No Yes Local sponsors Yes Yes State Government funding Yes No Local Government funding Yes Yes Single organising entity No No Board of Directors Yes No

Committee structure Yes No Continuity of personnel Yes Yes Capacity constraints Yes Yes Satellite events Yes Yes Diversified product Yes No Irritation for locals Yes Yes STRATEGIC MANAGEMENT Getz (2002) finds that festival managers see “lack of advance or strategic planning” as an important reason for why festivals fail. The strategic management process as seen by Viljoen and Dann (2000) is shown in Table 2. Sitting behind the five steps are the vision, mission and values of the organisation. These are often formally articulated by large organisations and guide their strategic direction.
Table 2 Strategic Management Process
The Steps The Components Strategy analysis Analysis of the external environment
Analysis of internal skills and resources Analysis of stakeholder needs and expectations
Strategic direction Formulate strategic objectives Identify performance measures
Strategy choice Generate strategic options Choose a preferred strategy
Strategy implementation Develop appropriate systems Acquire and utilise skills and resources Develop appropriate organisation structure Manage the culture
Strategy evaluation and control Measuring strategic performance Take corrective action
Source: Viljoen and Dann (2000, p.47) Formal strategic management along these lines may not be practised by event managers who are pre-occupied with the operational issues surrounding getting an event up and running. While attention is given to strategic planning in event management texts, it could be argued the topic should appear as a capstone at the end of the text rather than in the middle (Getz, 2005; Allen, et al, 2005). Furthermore, the Wintersun and Tamworth festivals would be unlikely festivals for it to be used because they are not controlled by a single entity but rather happen as a result of largely uncoordinated decision making. Nevertheless, there have been instances of decision making in the two case studies which point towards an evolving strategy. In its early days, the Tamworth Country Music festival was organised by the local radio station which sponsored the Golden Guitar awards. The Tamworth City Council began to take more control of the country music festival from the early 2000’s because the radio station management wished to withdraw from running the event and because of problems with drunken behaviour in the main street. The decision was made to close off the main street to cars and to make it an alcohol-free zone for the duration of the festival. In addition the Council became

concert promoter and ran a large free concert in the park, featuring some of the best known Australian country performers. The Tamworth City Council also became a coordinator in relation to the tent city that houses the overflow from commercial accommodation. The use of school ovals and sports grounds as camping areas is fully coordinated by the Council. Two obstacles to full control of the festival are: 1. The Golden Guitar awards ceremony is run by the Country Music Association of Australia. This is a major drawcard of the festival and receives national media attention. 2. Major concerts and shows are staged by the large clubs and hotels in the town. While these venues are effectively practising ambush marketing, the festival benefits from the added sense of celebration and excitement that they bring. The Tamworth City Council sees the festival as an important part of tourism and business development and has stated its intention to be more hands-on in managing the event. It has also articulated (in interview with the author) its intention that the festival be family-oriented and free from anti-social behaviour. This is clearly a voicing of values and vision. The mission seems to be to accommodate as many visitors as possible without causing undue stress to local residents and businesses. To this end the Council has an officer dedicated to Festival management, and part of the time of a senior Council manager is also spent on Festival issues, particularly the issue of minimising irritation for local residents and businesses. The Council’s objective is to become such a significant player in the festival that it is able to influence the future direction of the event despite the existence of many satellite performances. The Wintersun Festival started under the control of an incorporated body, the Wintersun Festival Association Incorporated, and initially the only performances were organised by the Board of Directors and the Executive Director. However, as happened at Tamworth, venue owners such as clubs and hotels saw the opportunity to capitalise on the event by staging their own performances. This was not opposed by the Festival organisers who saw it as a chance to grow the size of the event. In addition, as most of these satellite performances were ticketed, they provided a source of revenue which the event organisers have been able to access to help pay for the free street entertainment which is a large part of the event. This has been achieved by the Festival acting as entrepreneur in signing up bands for the festival, and then selling them on to ticketed venues for a fee. It is not uncommon for a patron to pay to see a band perform on a weeknight, and then see the same band for free in the street on the weekend. In interview with the author, the Executive Director articulated the vision that the Festival should be family-oriented, with a high proportion of artists on the free street program. The strategy of having the Festival act as entrepreneur is directed towards this objective. In addition, the Director stated that a Festival philosophy was to add attractions within the nostalgia theme, without jettisoning any activities that were successful. This explains how a musical performance event has come to have added to it the cars, dancing, clothes, street parade, street markets and a fun-fair. The Director also stated that management of the event occurred on two levels:
1. Individual Committees of volunteers were formed for each aspect of the Festival – a Bands Committee, a Cars Committee and so on. Each Committee comprised the Executive Director plus one other Board member, and its role was both operational and strategic.

2. Consultation with local businesses, police, local government, accommodation providers, and sponsors was carried out throughout the year by the Executive Director and the Chair of the Board. This is both strategic and operational in that solutions to current problems are canvassed, and opinions sought on future initiatives.
The Wintersun Festival has grown to the size where it faces serious capacity constraints. This is evidenced by the complete sell-out of commercial accommodation within a 10 kilometre radius of Coolangatta, the capacity bookings on aircraft into Coolangatta Airport on the Saturday of the festival, as well as the traffic congestion on access roads around the closed off streets. Local residents and business owners have expressed frustration over lack of access and parking. Future options include moving the festival to a larger area, restricting the number of performances, and moving some parts of the festival to other sites. Organisers are loathe to move, although they flirted with the idea publicly in the early 2000’s in order to generate more sponsorship from Coolangatta businesses. Promoting Coolangatta is one of the main objectives of the Festival, and so moving is not really an option given the current mission and vision. Both festivals are at a stage in their evolution where management of their interaction with their host community may be more important strategically than expansion of their size. Research has shown that community support for an event is an important component of the successful use of events in destination image building (Jago, et al, 2003). Fredline and Faulkner (2000) point out that host communities are not homogeneous in their reactions to events, that different groups need to be managed in different ways to accommodate points of irritation. For example, it would be pointless giving free passes as compensation to Tamworth residents who did not like country music. A significant issue for the strategic management of both events is the existence of satellite musical performances at both. In interviews with the author, organisers at both destinations said that this was an advantage and a potential issue. Satellite performances made the events last longer and appear more attractive to visitors. They enhanced the image of celebration of the culture and made each festival seem important, which was valuable in attracting artists as well as visitors. They generated revenue for business in the destination which in various ways flowed in part to the event. On the other hand, organisers in each destination expressed a sense of unease about the lack of control that they had over these performances. They were not able to specify any particular incident which had caused problems, and their unease seemed to be more about the way such lack of control inhibited them from developing strategy for their festivals. COMPETITION In the strategic management literature, competitors tend to be analysed in terms of similarity of product. Applying this idea to music festivals would entail an analysis of similar festivals. The web site of the Country Music Association of Australia shows that there is a country music festival scheduled for every weekend of the year somewhere in Australia. The officials from Tamworth regard most of these as being too small to pose a threat to their customer base. However, the Gympie Music Muster, held every August on private property near the Queensland town of Gympie, was seen as a potential threat because of its size, success at attracting major national sponsors, and media attention. Competition between events has received some attention in the events literature. Verhoven et al (1998) suggest that events need to be refreshed with new

attributes to prevent “decreasing novelty”, and the Tamworth City Council achieved this in 2002 with the addition of the “Concert in the Park”, a large, free concert featuring major recording artists. The Wintersun festival director did not see other rock and roll musical festivals as competitive threats, but he did see other uses of peoples’ leisure time as a threat. He also had a philosophy of refreshing the festival with new aspects to prevent the decreasing novelty referred to by Verhoven et al (1998). One aspect of this refreshment was the extension of festival performances to weekday evenings prior to the weekend of open street performances. These weekday evening events are ticketed, and feature the more popular artists. The intent is to encourage interstate visitors to plan a week’s holiday on the Gold Coast and to raise revenue from ticket sales to cover the cost of the free weekend entertainment. The literature on competitive strategy is usually focussed on organisations which produce substitutable goods and services. For example, in Evans (2003), the case study of Ryanair is discussed in terms of low cost airlines competing with full service carriers. Following Porter (1985), such competition is usually thought of in terms of price or product. Thus organisations may choose a strategy of being the lowest cost (and therefore lowest price) producer, or being the most innovative with product differentiation. It could be argued that both the Tamworth and Wintersun festivals have chosen a competitive strategy based upon product rather than price. Evidence of this would be the refreshing of both festivals over time with new aspects and attributes. However, both have articulated a philosophy of being family oriented, and both have perhaps recognised the price sensitivity of this segment by maintaining a strong element of quality free entertainment. COMMUNITY IMPACTS The Wintersun festival causes major traffic congestion in a radius of some ten kilometres around Coolangatta. Local business owners and residents have also complained about lack of parking and access to the main shopping areas during the two days of the Wintersun weekend. There have been no reported incidents of unruly behaviour and even the traffic congestion is accepted good naturedly by patrons. While Coolangatta gets crowded, some thirty kilometres up the Gold Coast strip at Surfers Paradise the festival is barely noticeable, and if it were not for local media coverage, most Gold Coast residents would not know of its existence. For local businesses in Coolangatta, the event is both a blessing and a curse. Interviews with hotel and club managers indicate that they double their usual turnover in the festival weekend, and some cafes do most of their year’s business during the week of the event. Their one complaint has been about the difficulty of getting deliveries through the traffic and parking obstacles. Because of its smaller population size (20,000 people compared with 500,000 on the Gold Coast), Tamworth is more heavily impacted by its festival. It has had similar complaints about parking and access, and in the past had experienced problems with unruly, alcohol induced behaviour. The Tamworth City Council’s strategy has been to allow schools and sports clubs to earn revenue by supplying camping space and facilities for festival attendees. Some residents are sufficiently inconvenienced that they leave town for two weeks to avoid the event, in some cases renting out their houses. FUTURE DEVELOPMENT

There are some similarities in the current situations and future prospects of both festivals, and there is also a significant difference. Both events have grown to a size where their host destination is under some community stress. The Wintersun Festival has hinted occasionally that it may be interested in moving to the northern end of the Gold Coast where mass tourism prevails and its contribution to traffic congestion and parking problems would be less noticeable. However, the intention of such hints may be to garner more sponsorship from Coolangatta businesses. Tamworth is a town which has unashamedly hitched its star to the country music festival. The guitar theme permeates the town, the local entertainment centre would never have been built without the festival, and year-round tourism is stimulated by the country music ambience. Despite some growing pains, the event seems highly valued by the town, something which could not be said of Wintersun at Coolangatta. The single issue facing both events is capacity. Both events have grown to the limit of their host destination’s ability to cope with the influx of short term visitors. Wintersun is responding to this issue by attempting to spread the performances out over several days. This is not an option for the Tamworth event as it already runs for almost two weeks. An option being considered for organisers of Tamworth is to utilise some of the surrounding towns for accommodation, and perhaps some satellite performances. DISCUSSION Based on the information from the interviews in each location, an attempt was made to assess the compliance of each festival with the strategic management process. Table 3 lists the components of the various stages of the process and gives an assessment of whether there was evidence of each component from each festival. Both events appear to follow the process at the beginning and end, but less so in the middle. Developing strategic options and performance measures are two areas where the festivals do not fit the template of the process. They do fit the process in terms of self-assessment (internal and external situation analysis), and in choosing strategies and measuring their performance. Further research is needed to consider whether these features are causes of the festivals’ longevity.
Table 3 Evidence of Strategic Management Process
Components of the Process Wintersun Tamworth Analysis of the external environment Analysis of internal skills and resources Analysis of stakeholder needs and expectations
Yes Yes Yes
Yes Partially Partially
Formulate strategic objectives Identify performance measures
Partially No
No No
Generate strategic options Choose a preferred strategy
Partially Yes
Partially Partially
Develop appropriate systems Acquire and utilise skills and resources
Partially No
Yes Partially

Develop appropriate organisation structure Manage the culture
Yes Yes
No No
Measuring strategic performance Take corrective action
Yes Yes
Partially Yes
CONCLUSION The ongoing process by which festivals and events are maturing has seen more attention being paid to their strategic management. This paper documents the evolution of two large Australian music festivals and looks for elements of the classic strategic management process in their development. It has found clear evidence of strategic thinking deriving from a deliberate vision, but has also found that the multiplicity of independent stakeholders operates against the development of strategic choices. Both events have practised a strategy of refreshing their product to avoid patron fatigue. In terms of the strategic management process, these events seem to fit the model in terms of strategic analysis and strategy choice. Comparisons with other events are needed to see if this is an ingredient of success. Both festivals are facing a number of management issues such as the proliferation of satellite performances, as well as traffic congestion and parking restrictions. The latter are impacting on local residents and causing increased community irritation. These require strategic decision making rather than management by evolution. The management of these events will need to become even more professional than the past in order to ensure continued success of their events. REFERENCES Allen, Johnny, William O’Toole, Ian McDonnell and Robert Harris (2005) Event Management, 3rd
edition, Wiley, Sydney. Coughlan, Duane and Trevor Mules (2002). Sponsorship awareness and recognition at Canberra’s
Floriade festival. Event Management, 7(1), 1-9. Evans, Nigel, David Campbell, and George Stonehouse (2003). Strategic Management for Travel
and Tourism, Butterworth-Heinemann, Oxford. Fredline, E. and Bill Faulkner (2000). Host community reactions: a cluster analysis. Annals of
Tourism Research, 27(3), 763-784. Getz, D. (2002). Why festivals fail. Event Management, 7(4), 209-219. Getz. Donald (2005). Event Management & Event Tourism 2nd edition, Cognizant, New York. Getz, Donald, Tommy Andersson, and Mia Larson (2007). Festival Stakeholder Roles: Concepts
and Case Studies. Event Management, 10;2/3, 103-122. Hanlon, Clare and Bob Stewart (2006). Managing Personnel in Major Sport Event Organisations:
What Strategies are Required? Event Management, 10(1), 77-88. Jago, L., Chalip, L., Brown, G., Mules, T. and A. Shameem (2003). Building events into destination
branding: Insights from experts. Event Management, 8(1), 3-14. Jennings, Gail (2001). Tourism Research, Wiley, Brisbane. Monga, Manjit (2006). Measuring Motivation to Volunteer for Special Events. Event Management,
10(1), 47-62. Porter, M.E. (1985). Competitive Advantage, Free Press, New York. Reid, Gavin (2007). The Politics of City Imaging: A Case Study of the MTV Music Awards
Edinburgh 03, 10; 1, 23-34.

Viljoen, John and Susan Dann (2000). Strategic Management, 3rd edition, Longman, Sydney. Yin, R. (1989). Case study research – design and methods, Newbury Park; Sage Publications.

Fourth International Event Research Conference Re-evaluating the City/Town: Events as a Catalyst for Change
TOWARDS A SYSTEMS-BASED TOOL FOR EVENT EVALUATION AND DECISION SUPPORT
G. Michael McGrath
Centre for Hospitality and Tourism Research (CHTR) and School of Information Systems
Victoria University [email protected]
ABSTRACT There would appear to be little point in promoting specific events if social and environmental costs outweigh the economic benefits. In recognition of this, a number of tourism researchers have proposed and experimented with more all-encompassing (or holistic) approaches to event evaluation. A weakness of these approaches, however, is that most do not readily allow impacts over time and delays to be factored into the evaluation process. In this paper, ‘system dynamics’ is proposed as the basis for a solution to this problem. An additional benefit of the recommended approach is that the events evaluation model can readily be implemented as a decision support system. Keywords: Holistic event evaluation; system dynamics; simulation.
INTRODUCTION Events often bring considerable economic benefits to their host regions. At the same time, many events have substantial environmental and social impacts and, quite frequently, these are negative. One consequence of this is an increasing, recent body of research directed at a more holistic approach to event evaluation (see e.g. Gursoy et al., 2005; Fredline et al., 2005; Fredline et al., 2006). Events though, are also highly-complex phenomena. The many variables within each of the economic, environmental and social (sub)systems interact with each other (within and between systems) in a myriad variety of unpredictable and complex ways. The result is a classic example of a problem domain described by Vennix (1996) as ‘messy’: i.e. a domain characterized by complexity, uncertainty, recursive dependencies and interrelated sub-problems (Vennix, 1996: 13-25). System dynamics (SD) is a problem-solving, modelling and simulation approach that has proven itself to be well-suited to understanding and analysing messy problems (Maani and Cavana, 2000) and, in this paper, we explore its application to the events domain. We contend that two significant benefits result from this: first, time-dependent factors are inherent in the evaluation framework, thereby addressing a significant weakness with other approaches to holistic event evaluation (Fredline et al., 2005: 4); and, second, our events model may readily be implemented as a powerful, simulation-based decision support tool. Note, however, that this research is very-much conceptual and preliminary. While the SD, events and more-general tourism literature bases have been drawn on liberally, the various models presented here are not supported by any detailed, empirical research. Our intention in this paper is simply to draw attention to the power and potential of the SD approach and to

specify a broad framework that might serve as a useful foundation for more serious development of a detailed and evidence-based model (and associated decision support system). BACKGROUND Holistic Event Evaluation There is an increasing recognition that, consistent with more general trends in tourism research and industry practice, event evaluation must move beyond its traditional focus on economic issues to encompass the social and environmental dimensions (Fredline et al., 2006). Essentially, this is in recognition of the fact that, while some events may result in significant economic benefits for the host region, they may also have other, negative consequences: e.g. increased traffic noise, crime, waste, spikes in energy and water usage, and more general environment despoilment. Thus, any serious attempt to specify a holistic events evaluation framework must include both: i) factors within each of the economic, social and environmental systems; and ii) interactions within and between each of these three systems. One of the more significant, recent attempts at specifying such a framework is that of Fredline et al. (2005). Their approach is grounded squarely in the ‘triple bottom line’ (TBL) concept (Elkington, 1999; Adams et al., 2004) and one of their key objectives is to represent the outcomes of an event evaluation in a form that is comprehensive but sufficiently non-complicated that it affords an overall view without the need for complicated interpretation and analysis. To accomplish this, they employ a ‘synthesis diagram’ an example of which is presented in Figure 1. Here, the TBL impact of an event can “be expressed by the ratio between the area of the plotted triangle and the theoretical maximum defined by the outer limits of the diagram” (Fredline et al, 2005: 12). Thus, Figure 1 might represent a moderately successful event overall, an extremely successful event from an economic viewpoint but something of a worry when viewed from an environmental perspective (e.g. some sort of motorsport event might fit this profile).
Figure 1 Synthesis diagram for TBL event evaluation (source – Fredline et al., 2005: 12).

Each of the three TBL dimensions represented in the radar chart presented in Figure 1 is composed of a number of underlying variables. Examples of these are presented in Table 1 and it is readily apparent that many of these variables impact on each other (within and between dimensions). Moreover, many of these cause-effect relationships will vary significantly with time and this suggests that the ‘snapshot’ view of an event evaluation could usefully be extended to encompass dynamic (or time-dependent) aspects. We now turn our attention to a modelling and simulation approach that seems to have much to offer in this respect.
Table 1 Examples of underlying economic, social and environmental variables.
Economic Social Environmental Income and profits Yield Local employment Business development Regional development Local taxes
Traffic noise Traffic congestion Crowding Crime Anger and stress Visual despoilment Access denial (amenities etc.) New facilities and amenities Entertainment Community pride Social opportunities ‘Feelgood’ factor
Waste and rubbish Energy and water demands Over-development Poorly-planned development Ecosystem damage
The Systemic View of a Sustainable Tourism System The systemic or holistic view of a ‘sustainable tourism system’ is considered by some (e.g. Gammack et al., 2004: 1) to have its roots in the work of Brundtland (1987) and its many manifestations include the Mill and Morrison (2002) model (focusing on a ‘chicken-and-egg’ like relationship between consumer travel decisions and destination marketing), the TBL concept (see above), and the ‘competitive destination’ model of Ritchie and Crouch (2003). The WTO (1998) defines a sustainable tourism destination as a region where:
“---- tourism development meets the needs of present tourists and host regions while protecting and enhancing opportunities for the future. It is envisaged as leading to management of all resources in such a way that economic, social and aesthetic needs can be fulfilled while maintaining cultural integrity, essential ecological processes, biological diversity and life support systems.”
The holistic view of a tourism destination seems to be now almost universally accepted among researchers and policy makers (if not industry practitioners) and, given this, it is perhaps a little surprising that greater advantage has not been taken of methods, tools and techniques commonly employed in ‘system dynamics’ (SD) (or ‘systems thinking’) research and practice. SD has its origins in the work of Forrester (1961) and, more recently, has enjoyed something of a resurgence – largely due to Peter Senge’s (1990) very influential work on ‘ the learning organization’ and the development and release of easy-to-use, powerful, SD-based software modelling and simulation tools (such as iThink, Vensim and Powersim). Recent examples of where SD has been used to good effect in tourism include the ‘Tourism Futures Simulator’ of Walker et al. (1999), the hotel value chain modeling work of Georgantzas (2003), the tourism multipliers model of Loutif et al. (2000), the ‘Sensitivity Model’ of Chan and Huang (2004) and the tourism information architecture modelling work of McGrath and More (2005).

In their simplest form, SD models are represented as ‘causal-loop diagrams’ (CLDs). The reader looking for a more thorough introduction to CLDs is referred to Maani and Cavana (2000) but, essentially, only one modelling construct is employed; an arrow connecting two domain variables, indicating a causal connection between them. Arrows are generally annotated with either a ‘+’ or ‘-‘; a ‘+’ symbol meaning that both variables move in the same direction (i.e. increase or decrease together) and a ‘-‘ symbol meaning that the variables move in opposite directions. We employ a third annotation symbol, the question mark, ‘?’ – meaning that we are unsure of the exact nature of the causal connection or that the connection is too complex to represent with the two basic annotations. The usual approach in developing a SD model though, is to: i) specify the problem domain as a CLD and, then, ii) implement it in the slightly more complex stock-flow syntax employed by the software packages listed above. In this section we restrict ourselves to CLDs. Examples of stock-flow models (implemented in Powersim, 2003) will be introduced in later sections. An example of a CLD is presented in Figure 2. This is a high-level representation of the ‘Tourism Enterprise Planning Simulator’ (TEPS) detailed in (McGrath, 2006). The aim here was to provide prospective and existing tourism enterprise operators with a planning tool, based on a total systems view and designed to complement traditional business planning tools. Region attractiveness is at the heart of the model presented in Figure 2. An attractive region makes local enterprises more attractive themselves and, together, region and enterprise attractiveness lead to more tourists. More tourists result in healthier room occupancy rates and (with qualifications) this, in turn, improves enterprise profitability. As enterprises become more profitable, more development takes place and, up to a point, developed regions and enterprises will draw even more tourists, resulting in a classic reinforcing loop. This, of course, holds true only to a point as, consistent with the ‘tourism life-cycle model’ (Butler, 1980), over-development eventually leads to a tourism decline. (This accounts for the ? annotation on the development tourists link in Figure 2.) Reinforcement is also moderated by the tendency of development to impact negatively on both enterprise profitability and occupancy rates.
Figure 2 System dynamics representation of some critical factors associated with tourism
enterprise profitability within a regional context.

In addition, development leads to environment despoilment and, in turn, this detracts from both region and enterprise attractiveness. Thus, with the addition of this balancing loop, we now have the essence of the classic sustainable tourism model (Ritchie and Crouch, 2003). Damage to the environment, however, may be limited by appropriate mitigation measures. There is a cost associated with effective and committed environment despoilment mitigation though and, ultimately, part of this must be borne by local tourism enterprises (as indicated by the despoilment mitigation profitability link in our diagram). The model presented in Figure 2 is specified at a very-high level. Already though, a degree of complexity is apparent and this illustrates one of the benefits of SD modelling as claimed by its proponents: specifically, the approach can counter our tendency to over-simplify complex problems and issues into simple cause-effect relationships we can readily understand within the limits of our cognitive powers (Vennix, 1996). Of course, this is true of many conceptual modelling approaches and each of these have their own strengths and weaknesses. SD, however, is particularly well-suited to domains where feedback loops and time are significant (Richardson and Pugh, 1981) and both of these feature prominently in tourism models (see e.g. Ritchie and Crouch, 2003: 60-78). A further strength of SD models is that, in basic CLD form, they are comprised of combinations of only one, simple construct (a causal connection between two variables), meaning that key stakeholders and end-users may readily contribute to modelling sessions. As noted earlier, CLD models are generally implemented in the stock-flow form favoured by the more popular SD software packages. This increases complexity but it also enables the specification of critical concepts such as delays, queues, events and major environmental perturbations (e.g. the impacts of SARS or the recent, dramatic increase in global oil prices). At the same time, the more variables a problem has, the more difficult it is to solve. In fact, problem difficulty tends to increase exponentially with the number of variables. Thus, (seemingly) simple systems can rapidly become very complex – and even our gentle introductory example above should leave little doubt that, in tourism, we are dealing with a very complex system. The essence of our TEPS model is that we have specified the operations of a tourism enterprise within a destination-level model of the type described by Walker et al. (1999). Essentially, there seems to be no reason why tourism events should not be treated in the same way and this is our focus in the remainder of the paper. TOP—LEVEL MODEL (CLD REPRESENTATION) The top-level of our events model, in CLD form, is presented in Figure 3 below.
Figure 3 Level 0 CLD model – the interrelationships between economic, environmental and social
impacts of events.
events impact
social impact
economic impact
environmentalimpact
+
?
-+
-
?

Any non-trivial events model that attempts to take a multi-dimensional (or holistic) view of the domain will necessarily be fairly complex (Fredline et al., 2005). To manage this complexity, we employ the time-honoured modelling approach of decomposition and, in particular, we (loosely) adopt conventions and techniques used in ‘data flow diagrams’ (Yourdon, 1989). Thus, our top-level view is illustrated in the ‘Level 0’ model presented in Figure 3. This is simply the CLD representation of the TBL view of an event, indicating that each event has economic, social and environmental dimensions and that these are all interrelated. At Level 1, the economic impacts component has been (arbitrarily) designated as Model 1, the social impacts component as Model 2 and the environmental impacts component as Model 3. In this paper we focus to a large extent on event transport impacts (and the consequences of these for the social and environmental subsystems). We turn our attention to transport in the following section. Before that, however, we illustrate some of the more important causal connections between transport and social system variables in Figure 4 following. A number of these connections are considered in greater detail later in the paper but, to follow just one chain of causal connections, starting from top-left: the larger the event size, the greater the crowding and this, in turn, may lead to an increase in both crime and restrictions. Restrictions may cause frustration and this (together with crime) may result in increased levels of anger and stress among the local community. Some of this anger will be directed at the event and, consequently, local attitudes (towards the event) may suffer, leading to a decline in local participation etc. As Maani and Cavana (2000) note, the beauty of CLDs (such as that in Figure 4) is that they improve our ability to cope with and analyse complex problems and phenomena1 To unleash the full potential of SD, however, and provide ourselves with a useful policy-making aid and decision-support tool, CLDs must be converted into stock-flow form. We now turn our attention to this issue.
Figure 4 Level 1 – Model 2. CLD representation of some social impact event variables (impacted by
transport).
1 Should one doubt that events are, indeed, complex, one glance at the (still far-from-complete) picture contained in Figure 4 should dispel that notion!

event size
crowding
restric tions
event transport impact
event infrastructure impact
event economic impact
media exposure
local employment
local participation
facilities denied
event environmental impact
? +
++
-
?
+
+
+
crime
?
+
+
+
+ +
-- <crowding>
- extra transport
?
+ +
frustration
anger and stress
+
+
- +
-
+
local attitude-
+
+
+
<local partic ipation>
+
+
profile match
volunteers
altruism soc ial opportunities
+
+
+
+
+
+
TRANSPORT IMPACTS (STOCK-FLOW REPRESENTATION) The SD simulator has been initialized to run for 40 quarters from the commencement of the current year (t = 1). All variables are specified as indices. For example, TransportImpactt is an index of the predicted impact of an event on transport, plotting percentage changes over time, on a quarterly basis against a base quarter. The December quarter year 0 is used as the base quarter and is assigned a value of 100. Where later values exceed 100, it indicates growth in comparison to the base quarter while values less than 100 indicate decline. The method is the same as that employed in (TRA, 2005) and, where possible, the assumption is made that trends will be similar to actual figures that are generally available. Most model variables (real and artificial) are standardised in this way. The broad approach employed here is based loosely on that detailed by Burns et al. (1986). Here, the total value of time lost in traffic, at a particular destination at time t (TravelCostraw,t), and where t is measure in quarters, is specified as:
trawTravelCost , = GNPCont . ∑=
n
iii TravPopTravTime
1
91..
where:

TravelCostraw,t is the is the total quarterly dollar value of the destination travelling population’s time lost in traffic, while commuting via location route i at time t; Each i signifies one of a representative sample of n commuter routes within the destination2; GNPContt is the average (national) quarterly contribution to GNP per individual at time t; TravTimei is the is the average, daily travelling time (in hours) for the travelling population using route i; and TravPopi is the size of the travelling population using route i.
The standardised cost of travel at time t may then be specified as:
TravelCostt = (TravelCostraw,t/TravelCostraw,0).100 The stock-flow implementation of the transport impact component of our model is presented in Figure 5 below. The basic building blocks of system dynamics models are stocks (represented as rectangles), flows (represented as arrows with circular flow regulators attached), converters (represented as circles) and constants (represented as diamonds). In our model, examples of stocks are Travel Cost and Transport Impact. There is a level associated with each stock, which can be an actual value or a value bounded by some artificial scale. Transport Impact for example, is measured on an artificial scale (as defined previously) and we have set the system up so that, when its value is 100, the system is in equilibrium. That is, any other system parameters, dependent on errors, will also remain constant (at 100). Stock levels vary with flows, which may be inflows, outflows or bidirectional. For example, TIVarn (transport impact variation) is a bidirectional flow such that:
TransportImpactt = f(TransportImpactt-1, TIVarnt).
That is, in our model, the transport impact level at time, t, is a function of the transport impact level at time, t-1, and its variation at time, t. These equations are the foundation of Powersim’s formidable simulation capabilities. The third of our basic constructs, converters, serve a utilitarian role: they hold values for constants, calculate mathematical relationships and serve as repositories for graphical functions. In general, they convert inputs into outputs (hence, the name, “converter”). A converter with double circles indicates an array and a diamond indicates a constant (essentially a converter that does not change its value during the course of a simulation). A model construct represented in the style of period below indicates a snapshot (a copy of a variable specified primarily in some other area of the model).
Figure 5 Stock-flow implementation of the transport impacts component.
2 The n locations must be representative demographically: e.g. in terms of both geographical position (in relation to major residential areas, and commercial and industrial centres) and socio-economic groupings.

Travel Cost
TCVarn
base travel costsperiod
Transport Impact
TIVarn
Immediate TransportImpactETIVarn
IofITIonTI
TransportInfrastructure ImpactTIIVarn
IofTIIonTI
base ITI
period
event quarter
quarter
For a major metropolitan city, where a large percentage of commuters use their cars to get to and from work and where the bulk of transport infrastructure investment is directed towards roads (rather than rail and other forms of public transport), travel costs over a 10-year period might look something like the pattern illustrated in Figure 6. This, of course, is the classic ‘freeway effect’, where major road projects are completed every few years This results in a short-term improvement in travel times, followed by a fairly rapid return to the longer-term worsening trend (as the number of vehicles increases – and then exceeds – available freeway capacity).
Figure 6 Base travel costs (standardised) over a 10-year period.
Travel Cost
2006 2007 2008 2009 2010 2011 2012 2013 2014 201580
90
100
110
120
130
TimeNon-commercial use only!

Events may have an impact on travel and transport in two basic ways: first, if significant enough, events may generate new transport infrastructure (both public and private); and, second, additional transport costs are generally associated with the running of the events themselves3. Thus:
TransportImpactt = EventTransportt(TransportInfrastt(TravelCostt))
where: TransportImpactt is a standardised index indicating the impact of transport at time t on the population of the location where an event is held; TravelCostt is the standardised cost of travel at time t (as defined above); TransportInfrastt is the standardised impact of the development of transport infrastructure at time t (and is a 1st-order function applied to TravelCostt); and EventTransportt is the standardised impact of the conduct of an event on the cost of transport (and is a 2nd-order function applied to TravelCostt).
Rarely will an event have an immediate, direct and clearly identifiable impact on a destination’s transport infrastructure. Consequently, TransportInfrastt (for all t) is set to neutral (i.e. it does not transform its argument). A large event (relative to location size) may result in transport infrastructure changes that can be readily identified and, perhaps, quantified. For example, the development of enhanced road and rail links was clearly (at least in part) a direct result of the Sydney 2000 Olympics. Similarly, an annual series of semi-large events at a medium-sized provincial location (or even one annual, relatively-large event at a remote location) may also have an impact on transport infrastructure4. Where this does occur (and a quantifiable impact can be estimated with a reasonable degree of confidence), the model can be adjusted by directly instantiating the IofTIIonTI (impact of transport infrastructure impact on transport impact) variable at the level of the base model (see Figure 5). The actual running of an event though, will have an impact on transport in many cases. Thus, EventTransportt is not assumed to be neutral and the user is required to establish a base value for this variable by selecting the appropriate option from a ‘Transport Impact’ control box (part of the users ‘control panel’ and illustrated in Figure 7. This has the effect of setting the base ITI (base immediate transport impact) variable in Figure 5 to a value that will remain constant for the duration of the simulation5.
3 In some (possibly rare) cases, the reverse may occur and benefits may ensue – e.g. traffic congestion seemed to decrease markedly during the Sydney Olympics. 4 For example, the annual 8-11 (major national league) football games held at the Victorian provincial city of Geelong has clearly been a factor in the various upgrades to Melbourne-Geelong road links over the last 100 years. However, clearly distinguishing this from the effects of daily commuter Geelong-Melbourne traffic (or the steady stream of summer holiday and tourist traffic heading for Victoria’s Western region surf beaches and Great Ocean Road via Geelong) would not be easy. 5 At present, the model is set up so that: Nil = 0, Minimal = 0.5, Significant = 1 and Major = 2. If desired, these assignments may be varied at the base model level (i.e. by the modeler – not directly by the user).

Figure 7 Part of the user’s simulation control panel.
Transport Impact
NilMinimalSignificantMajor
Event Quarter
MarchJuneSeptemberDecember
Note also that the user is required to select an ‘Event Quarter’ (again, see Figure 7). This is the quarter in which the event takes place. It is recognized that some events may take place in more than one quarter, that others may straddle quarters and that still others may not take place in the same quarter every year. At present, the model does not cater for these That is, at this stage the model has been customised for annual events run at the same time each year. Results of a sample simulation run are presented in Figure 8. This is, essentially, the base travel cost graph presented earlier (see Figure 6), inverted and modified to take into account the transport impacts of a major annual event. This profile could fit (for example) a Formula 1 Grand Prix, where the transport impacts are almost entirely negative and are indicated by the regular, annual, blips (negative pulses) clearly evident on the graph.
Figure 8 Impact of an event on transport – sample simulation output.
Event Transport Impact
2006 2007 2008 2009 2010 2011 2012 2013 2014 201570
80
90
100
110
120
130
TimeNon-commercial use only!
To this point, development of our SD model has been reasonably straightforward, in that we should be able to instantiate our base transport impacts model variable (see Figure 5) with values that are reasonably accurate. In addition, much of the base data required is publicly available or can be derived from same and, thus, standard statistical variance tests can be performed against simulation outputs to ensure that the model behaves ‘sensibly’. Event transport, however, may impact significantly on a number of variables that belong primarily to the social domain and many of these are more ‘fuzzy’ in nature. We now turn our attention to how we might extend our base transport impacts model to include some key variables from the social subsystem.

SOME EXTENSIONS TO THE TRANSPORT IMPACTS MODEL: THE SOCIAL DIMENSION In this section, we extend the transport impacts model presented in Figure 5 to include the impacts of event transport on community anger and stress, health, event attitudes and consequent participation levels. A CLD representation of this extended model is presented in Figure 9. Starting from centre-left of Figure 9, one event transport impact may be traffic congestion and this, in turn, is likely to cause anger and stress. Anger and stress may have impacts on community health in two ways: first, there may be an increase in traffic accidents; and, second, it may have more direct impacts as a result of heart problems, nervous conditions etc. Next, it is highly probable that at least some of this anger might be directed towards the event, with a consequent decrease in local support (local attitudes). In addition, if health-related problems (and costs) increase beyond a certain point, this may also reflect itself in decreased levels of local support. Finally, if support suffers, so too will local participation and, if this happens, event-related transport problems may well diminish to some extent.
Figure 9 The transport impacts model extended to include some social factors.
The stock-flow representation of this model is presented in Figure 10. Insofar as instantiating model variables is concerned, we may well be able to locate (or derive) reasonably accurate data for traffic congestion, accidents, community health and participation. However, the likes of anger and stress, and local attitudes pose more problems. As noted in Fredline et al. (2005), some form of survey is often required to estimate values for these softer variables and detailed examples of how this might be accomplished are presented in (Fredline et al., 2006).
local attitudes
local participation
transport impact
traffic congestion
anger and stress
accidents
community health
+
+
+
+
-
+
--
+

Figure 10 Extended transport impacts model – CLD representation.
Derivation of the various impact relationships (converters with the form, IofXonY) though, may be more problematic again. Once more, surveys might be required but, oftentimes, we might need to rely on the ‘best guess’ of relevant experts and those closest to the problem domain (in this case, those with considerable experience running events of the type under consideration). In producing an early SD prototype, however, it is frequently sufficient for the model development team to produce some rough, first approximation. So, for example, we might conjecture that the IofASonLA (impact of anger and stress on local attitudes) relationship might be of the form illustrated in Figure 116. That is, we assume that low anger and stress levels are neutral with respect to local attitudes, that the impact will be relatively mild up to values of 120 (or thereabouts) but, beyond that point, locals will become seriously antagonistic to the relevant event.
6 Note that Powersim has powerful built-in functionality that allows the convenient graphical specification of these relationships.
Transport Impact
Traffic Congestion
TCngVarn
IofTIonTC
Anger and Stress
ASVarn
IofTConAS
Local Attitudes
LAVarn
TIVarn22
Local Participation
LPVarn
IofLAonLP
IofLPonTI
Accidents
AVarn
IofASonLA
IofASonA
Community Health
CHVarn
IofAonCH
IofASonCH
IofCHonLA
Immediate TransportImpact

Figure 11 Graphical representation of the ‘IofASonLA’ converter relationship.
In Figure 12, some results of a typical simulation run are presented7. It can readily be seen that when the event is first run, participation is average (=100) and anger and stress levels are low. As time goes by though, the event becomes more popular and anger and stress increase. Eventually, a point is reached where the event becomes so unpopular that participation levels begin to drop off (at about year 6) and continue to do so for some time. Note that there is a reasonably significant time lag before locals’ anger has a noticeable effect on participation. This is typical of many real-world problems and a failure to factor such delays into decision-making processes is a frequent cause of policy failures (Vennix, 1996).
Figure 12 Typical simulation outputs: anger and stress and event participation levels over a 10-year
period (from the commencement of an annual event). In reflecting on this simulation though, we might (for example) be concerned about the accuracy of the values we have assigned to some variables. Powersim has a powerful risk analysis package and, using this, we may investigate our model’s sensitivity to changes in independent variables (or, more precisely, variables we decide to declare ‘independent’ for some particular 7 This graph has been smoothed and simplified for the purposes of this example.
Impact of Anger & Stress on Participation
06 07 08 09 10 11 12 13 14 1560
80
100
120
140
160
180
200
Anger & Stress
Local Partcpn
Time
0
20
40
60
80
100
120
0 20 40 60 80 100 120 140 160 180 200
Anger and Stress
IofA
SonL
A

purpose). Basically, all that is required is to specify a mean and standard deviation for each of our independent variables, stipulate that some other variable is the dependent (or ‘effect’) variable and, then, initiate a series of simulation runs (the default is 40 runs) through the risk analysis software.
Figure 13 Example of a Powersim sensitivity analysis assessment.
As an example, assume we are concerned about the model’s sensitivity to changes in traffic congestion. We declare this variable (traffic congestion) to be the independent variable and local participation to be the dependent variable. The result is the ‘high-low’ graph presented in Figure 13 and, here, it can be seen that around 80% of the variance (the area between the (90% and 10% lines) is within a 14-15% range (approximately)8. We conclude, therefore, that the model is somewhat sensitive to change in traffic congestion but not unduly so. We could then conduct further risk analysis experiments to determine precisely which variables (or combination of variables) do influence model behaviour most. The importance of conducting this type of ‘sensitivity analysis’ has long been known in SD circles – early guidelines having been formulated by Coyle (1977: 193) almost 30 years ago. MODEL VALIDATION SD models are notoriously difficult to validate (Richardson and Pugh, 1981). As noted by Forrester and Senge (1980: 209-210), there is no single test which might be employed to validate an SD model but, rather, confidence in the model accumulates gradually as it passes more tests and as new points of correspondence between the model and empirical reality are identified. Maani and Cavana (2000: 69-70), drawing on the work of Coyle (1983: 362), describe this process as consisting of:
• Verification tests – which focus on the equivalence between the structure and parameters of the real system and the model;
• Validation tests – which are concerned with demonstrating the correspondence between the behaviour of the real system and the model; and
• Legitimation tests – which determine whether the model is in accord with any generally-accepted system rules.
Essentially, the aim of validation is to “show that there is nothing in the model that is not in the real system and nothing significant in the real system that is not in the model” (Maani and
8 e.g. the range is roughly 125-145 at year 2011 and 60-70 at the end of the simulation (year 2015).
Local Participation: Sensitivity to Traffic Congestion
06 07 08 09 10 11 12 13 14 15
80
100
120
140
Local Partcpn (90 Percentile)
Local Partcpn (75 Percentile)
Local Partcpn (Average)
Local Partcpn (25 Percentile)
Local Partcpn (10 Percentile)
Time

Cavana, 2000: 69). An excellent example of how much of this can be accomplished through desk checking has been provided by Georgantzas (2003) where statistical measures, such as coefficient of determination and Theil’s inequality statistics (TIS) (Theil, 1966), were employed to compare the predictive results of an SD model focused on various key measures of the performance of Cyprus hotels against actual data (over a 40 year period). Similarly, we could subject our own model to similar tests, concentrating on measures for which data is readily available (such as accidents, community health and local participation). An example of the type of output that results from this type of analysis is presented in Figure 14.
Figure 14 Model validation – actual versus simulation results for Accidents.
Sample TIS Results for Accidents Validation
Uc
Us
Um
0.00
0.10
0.20
0.30
0.40
0.50
0.60
0.70
0.80
1 2 3
The basis of Theil’s approach is that the mean square error (MSE) is divided into three components: i) bias (Um); ii) unequal variation (Us); and iii) unequal co-variation (Uc). The sum of all three components equals one and, briefly, a large Um indicates a potentially serious systemic error and, to a somewhat lesser extent, this applies to Us as well. If Uc is large though, most of the error is unsystematic and, as noted by Sterman (2000: 877): “a model should not be faulted for failing to match the random component of the data”. The sample TIS results presented in Figure 14 indicate that, in this case, model behaviour provides a reasonable approximation to reality. Nevertheless, there is significant room for improvement: specifically, the variance in our model is considerably greater than that of the actual data. The TIS results, however, are also useful in that they quantify the extent of the various error types. CONCLUSION Few would argue that the tourism landscape is evolving at an express (indeed, some might say terrifying) pace and issues that need to be considered when developing tourism events are certainly messy (according to the criteria listed earlier). For example, Buhalis (2000) nominates the number of different stakeholders, stakeholder relationships and goals, contradictions between these goals, and difficulties in maintaining an acceptable and sustainable balance between the interests of stakeholders, natural resources and development activity as major problems that must be confronted in destination marketing and management – and exactly the same factors must be taken into account when analysing the impact of any significant event. We have argued that the SD approach is well-suited to events evaluation, policy development and operational-level decision-making. Moreover, building on previous applications of SD in the tourism domain, we have specified the outline of a model (and associated decision support tool) designed for these tasks. Examples, designed to demonstrate the potential power and utility of our proposed approach, were presented.

This, however, is probably the easy part: i.e. filling out the detailed, lower-levels of the conceptual model presented here will be a challenging undertaking, as will the task of turning the model into a convenient, easy-to-use, fully-functioning decision support system. Substantial input from experienced events researchers and managers will be absolutely essential if this is to be accomplished successfully. REFERENCES Adams, C., Frost, G. and Webber, W. (2004). Triple Bottom Line: A Review of the Literature.
In A. Henriques and J. Richardson (Eds.), The Triple Bottom Line: Does it All Add Up (pp. 17-25). London, UK: Earthscan.
Brundtland, G.H. (1987). Our Common Future. Federal Office for Spatial Development, Berne. Retrieved December 1, 2005, from http://www.are.admin.ch/are/en/nachhaltig/international_uno/unterseite02330/.
Buhalis, D. (2000). Marketing the Competitive Destination of the Future. Tourism Management. 21(1), 97-116.
Burns, J., Hatch, J. and Mules, T. (1986). The Adelaide Grand Prix: The Impact of a Special Event, Adelaide: The Centre for South Australian Economic Studies.
Butler, R. (1980). The Concept of a Tourism Area Cycle of Evolution: Implications for Resources. Canadian Geographer. 24(1), 5-12.
Chan, S.L. and Huang, S.L. (2004). A Systems Approach for the Development of a Sustainable Community – the Application of the Sensitivity Model. Journal of Environmental Management. 72, 133-147.
Coyle, R.G. (1977). Management System Dynamics. Chichester, UK: Wiley. Coyle, R.G. (1983). The Technical Elements of the System Dynamics Approach. European
Journal of Operational Research. 14, 359-370. Elkington, J. (1999). Cannibals with Forks: The Triple Bottom Line. Oxford: Capstone. Forrester, J.W. (1961). Industrial Dynamics. Cambridge, MA: MIT Press. Forrester, J.W. and Senge, P.M. (1980). Tests for Building Confidence in System Dynamics
Models. TIMS Studies in the Management Sciences, 14, 209-228. Fredline, L., Raybould, M., Jago, L.K. and Deery, M. (2005). Triple Bottom Line Event
Evaluation: A proposed framework for holistic event evaluation. In J. Allen (Ed.), Proceedings of the Event Management Research Conference. University of Technology Sydney, 13-14 July, 2005, pp. 1-15.
Fredline, L., Deery, M. and Jago, L. (2006). Development of a Scale to Assess the Social Impact of Tourism within Communities. Sustainable Tourism Cooperative Research Centre, Technical Report Series: Gold Coast, Qld, Australia.
Gammack, J., Amaya Molinar, C., Chu, K. and Chanpayom, B. (2004). Development Needs of Small to Medium Size Tourism Businesses, Asia Pacific Economic Cooperation Secretariat (APEC): Toowong, Qld, Australia
Georgantzas, N.C. (2003). Tourism Dynamics: Cyprus’ Hotel Value Chain and Profitability. System Dynamics Review. 19(3), 175-212.
Gursoy, D., Jurowski, C. and Uysal, M. (2002). Resident Attitudes: A Structural Modelling Approach. Annals of Tourism Research. 29 79-105.
Loutif, M., Moscardini, A.O. and Lawler, K. (2000). Using System Dynamics to Analyse the Economic Impact of Tourism Multipliers. In P.I. Davidsen, D.N. Ford and A.N. Mashayeekhi (Eds.), Proceedings of the 18th International Conference of the System Dynamics Society. Albany, NY: System Dynamics Society, pp. 132-232.
McGrath, G.M. (2006), System Archetypes as a Learning Aid Within a Tourism Business Planning Tool. Proceedings of the 20th Annual Conference of the Australian and New Zealand Academy of Management – ANZAM2006. Yeppoon, Qld, 6-9 December, 2006, pp. 1-18.
McGrath, G.M. and More, E. (2005). An Extended Tourism Information Architecture: Capturing and Modelling Change. In A.J. Frew (Ed.), Proceedings of the 12th

International Conference on Information Technology in Travel and Tourism. Innsbruck, Austria, 26-28 January, 2005, pp. 1-12.
Maani, K.E. and Cavana, R.Y. (2000). Systems Thinking and Modelling: Understanding Change and Complexity. Auckland, New Zealand: Prentice-Hall.
Mill, R.C. and Morrison, A.M. (2002). The Tourism System, 4th ed., Dubuque, Iowa: Kendall/Hunt Publishing.
Powersim (2003). Powersim Studio 2003: Reference Manual. Bergen, Norway: Powersim Software AS.
Richardson, G.P. and Pugh, A.L. (1981). Introduction to System Dynamics Modelin.g. Oregon: Productivity Press.
Ritchie, J.R.B. and Crouch, G.I. (2003). The Competitive Destination, CABI Publishing: Cambridge, MA.
Senge, P.M. (1990). The Fifth Discipline: The Art and Practice of the Learning Organization. Milsons Point, NSW: Random House.
Sterman, J.D. (1980). Business Dynamics: Systems Thinking and Modeling for a Complex World. Boston, MA: Irwin McGraw-Hill.
Theil, H. (1966). Applied Economic Forecasting. New York: North-Holland. TRA (2005). Domestic Overnight Travel: Recent Trends and Challenges. Canberra, ACT:
Tourism Research Australia. Vennix, J.A.M. (1996). Group Model Building: Facilitating Team Learning Using System
Dynamics. Chichester, UK: Wiley. Walker, P.A., Greiner, R., McDonald, D. and Lyne, V. (1999). “The Tourism Futures
Simulator: A Systems Thinking Approach”, Environmental Modelling and Software. 14, 59-67.
WTO (1998). Guide for Local Authorities in Developing Sustainable Tourism. Madrid: World Tourism Organization.
Yourdon, E. (1989). Modern Structured Analysis. Englewood Cliffs, NJ: Prentice-Hall. ACKNOWLEDGEMENT This research an outcome of Project No. 80049, funded by the ‘Sustainable Tourism Cooperative Research Centre’ (STCRC). The STCRC is an Australian Government initiative.
Fourth International Event Research Conference Re-evaluating the City/Town: Events as a Catalyst for Change
RESEARCH FINDINGS INTO THE LEVEL OF OCCUPATIONAL HEALTH & SAFETY LEGISLATIVE COMPLIANCE AMONGST A SAMPLE GROUP OF
EVENT MANAGEMENT COMPANIES
Anthony Evans University of Technology, Sydney
[email protected] ABSTRACT This report presents the findings of research conducted on a sample group of event management companies/organisations to ascertain the level of Occupational Health and Safety (OHS) legislative compliance existing amongst the group, specifically relating to the area of Occupational Health and Safety administrative controls. As a way of managing the risks associated with OHS and to provide evidence of legislative compliance, an Occupational Health and Safety Management System (OHSMS) is implemented into a business’s overall operations, which provides for the ongoing assessment, consultation, review, promotion and improvement of all matters associated with the administration of OHS. This research has attempted to assess the level of OHS ‘administrative’ compliance amongst a sample group of 33 event management companies/organisations through analysing research data on participants OHSMS collected by means of a self-completing questionnaire survey. The data collected from the questionnaires was then compared to what had been assessed as a benchmark OHSMS. The research showed that if called upon to provide evidence of OHS legislative compliance, not one of the participating event management companies/organisations would be able to fully comply.
INTRODUCTION The purpose of this research project was to assess to what extent a sample group of companies and organisations responsible for managing professional events within NSW, comply with their legislative responsibilities to manage all issues relating to occupational health and safety (OHS). The key role within the events industry responsible for overlaying specialised project management skills to the overall event production is the event manager, or as is the case with most events, an event management company. The type of events these companies will manage will fall into one of four categories highlighted here by Shone and Parry (2001); personal events (weddings, birthdays, anniversaries), leisure events (leisure, sport, recreation), cultural events (ceremonial, sacred, heritage, art, folklore) and organisational events (commercial, political, charitable, sales) Regardless of the type of event being managed, as a registered business within Australia, event management companies, as with all employers, accept a ‘Duty of Care’ to ensure the health, safety and welfare at work of all the employees of the employer. This duty extends, without limitation, to ensuring that any premises, plant, equipment or substance controlled by the employer where the employees work (and the means of access to or exit from the premises) are safe and without risks to health. This ‘Duty of Care’ also requires the employer to provide a safe

and healthy environment to anyone entering the workplace (NSW OHS Act 2000. Section 8, Part 2, Division 1 – 8 Duties of Employers). This section of the Act is of particular relevance to event management companies/organisations as an event that attracts hundreds or thousands of people to a site or venue is also classified as a workplace, and It is at this point that the line between public safety and workers safety becomes very blurred and regulations are enforced by a number of different government departments such as; emergency services, police, council inspectors, WorkCover. The broader issue however, which this research forms a part of, deals with the concept of risk and how risk is managed in the context of the events industry. This research has identified three main areas of risk associated with the staging of events:
• Financial Risk • Public Safety Risk • OHS Risk
It is difficult to separate these three areas as they are all interrelated, for example; incurring a fine for non compliance of OHS regulations represents a financial risk as well as an OHS risk. Similarly, potential hazard identified as a public safety risk may also represent a risk to employees or contractors. As interrelated as they may be however, these three areas all require their own particular form of strategic planning and an individual management system to administer and document their specific processes. Event management companies in NSW are required through legislation to manage all workplace risks associated with their operations. To achieve legislative compliance a business needs to implement an appropriate occupational health and safety management system (OHSMS) as a means of providing documented evidence of their compliance. Although the legislative responsibilities outlined in the NSW OHS Act (2000) require an employer to maintain appropriate document and data controls to administer workplace health and safety, and an Australian Standard exists that defines what an OHSMS is and what areas it should address (AS/NZ 4804:2001), there is no specific systems framework that is either prescribed or promoted in any Australian OHS legislation. This situation allows for flexibility when considering the design of such systems and will be governed by the size and nature of the business implementing the system. When considering the analysis of the collected data we have to take into account the context in which an event management company would be required to produce evidence of OHS legislative compliance. Leaving aside the possibility of WorkCover NSW (hereafter WorkCover) conducting an audit of a company’s OHSMS if they suspect, usually through informants, they are not complying with legislative requirement, the main reason an event management company would be subjected to such an audit would be if a company was unfortunate enough to experience a serious workplace incident involving an employee, contractor, and in some cases attendees at events/members of the public. If this occurred an employer is required by NSW OHS legislation to report this incident to WorkCover immediately. This initial reporting of an incident initiates an investigation into its cause, which may include an audit of the company’s OHSMS. This audit is conducted applying the five Principles outlined in the Australian and New Zealand Standard for OHSMS (AS/NZS 4801:2001 & 4804:2001).

There is also a strong possibility that if a serious incident occurs involving a member of the public that this same WorkCover auditing process will be applied, as was the case with the incident involving Jessica Michalik at Big Day Out in 2001 which included WorkCover’s investigation of the incident as part of the NSW Coroners’ inquest, and subsequent report (2002) into her death. The possibility of this occurring however is not forgone and would depend on the nature of the incident. Regardless of the type of OHSMS employed by an event management company, or the nature of the incident being investigated, if called upon to conduct an audit, an experienced WorkCover auditor will use the company’s existing system as a guide to assess whether they have been proactive or reactive in their efforts in managing workplace risks at an administrative and operational level, and whether or not the company has invested an appropriate amount of time, money and resources into their OHS legislative obligation. It should be mentioned that with OHS law in NSW, and in the case in of a serious incident occurring and the subsequent audit, the onus is on the business being audited to prove they were not negligent in their ‘Duty of Care’, as this would be seen by WorkCover as contributing to the occurrence of the incident. The only two defences a business would have in proving they had not been negligent are; 1) It was not reasonably practicableI to comply with the Act; and 2) The incident was due to causes over which the person had no control and it was impracticable to make arrangements to prevent it. The original research hypothesis that event management companies in NSW were not achieving a suitable level of OHS legislative compliance by failing to implement an appropriate OHSMS was supported by the findings of this research. Not one of the sample group’s 33 participating companies received the required 100% compliance rating when compared with the OHSMS used as the benchmark in this research. With the sample group only representing 33 event management companies, this was originally viewed as not being large enough to provide any creditable data that would be representative of the events industry as a whole. However, the fact that the research found that not one of the companies participating in the sample group would be able to prove compliance when put to the test, and that the sample group was made up of some of the industry’s most professional event management companies/organisations, gives greater weight to these research findings regardless of the size. LITERATURE REVIEW Introduction This section provides a review and summary of the main features found in literature relating to Occupational Heath and Safety (OHS) and Occupational Health and Safety Management Systems (OHSMS). This Masters Research project, of which this literature review forms a part, examines the question:
“To what extent are Australian Event Management companies aware of Occupational Health and Safety legislation relevant to their business operations, and to what extent have these companies developed a formal
I ‘Reasonably Practicable’ means that the requirements of the law vary with the degree of risk in a particular activity or environment which must be balanced against the time, trouble and cost of taking measures to control the risk. It allows the duty holder to choose the most efficient means for controlling a particular risk from the range of feasible possibilities preferably in accordance with the ‘hierarchy of control’ (source National Occupational Health & Safety Commission NOHSC).

response to their legislative responsibilities, specifically in the area of administrative controls.”
Although the data collected from this research is concerned with a sample group of event management companies and their ability to implement and maintain an effective OHSMS that fulfils the company’s legislative responsibility. A number of related areas of literature associated to the research topic have also been explored to enable a broader analysis of the collected data. Some of these topic areas include current OHS legislation/Standards and safety cultures or climates within organisation. It should also be mentioned that due to the constant revising and updating of OHS legislation and regulations, the amount of material relating to this research was limited. OHS in Australia Since the early seventies the evolution of OHS legislation in Australia had developed from an overly prescriptive system of regulations with an emphasis on enforcement mechanisms, into a system that is described as self-regulating (Mayman 2003). This self regulating approach to OHS is brought about by the ‘Duty of Care’ placed on employers which makes them responsible for finding the best way of dealing with OHS matters within their own workplaces. In Australia, OHS is primarily the responsibility of the states. The Australian Constitution confers no express legislative powers on the Federal Government with respect to OHS. However there are several heads of power, which could be relied upon to ground Federal OHS legislation if needed (Lee & Quinlan 1994). Each state and territory in Australia has their own legislation that outlines OHS policies and regulations, and although all these Acts differ slightly in their directives, in general their purpose is to provide for the promotion, coordination, administration and enforcement of OHS policy. Two other organisations that are concerned with national OHS issues are the Standards Association of Australia (Standards Australia) and the National Health and Medical Research Council (NHMRC). As this research was undertaken within NSW, it will only be the New South Wales OHS Act 2000 that is cited for the remainder of this research. The NSW OHS Act 2000, which is currently the overriding legislation that covers all NSW workplaces, is supported by the NSW OHS Regulation 2001 (the Regulation). The Regulation sets out requirements for implementation of a systematic risk management approach to workplace hazards. It continues existing requirements for manual handling, hazardous substances, noise control, certificates of competency, business licensing and injury reporting. It introduces revised requirements for the working environment, the management of plant safety, inorganic lead and carcinogenic substances (WorkCover NSW Background information). Regardless of which state or territory’s legislation a business falls under, they all require controllers of a workplace to systematically manage all health and safety risks associated with the business’s operations. To fulfil the administrative requirement associated with legislation a business needs to implement an appropriate OHSMS that incorporates all policies and procedures required by t OHS legislation and Australian Standards. Occupational Health & Safety Management System (OHSMS) According to Pearse (2000) an OHSMS can be seen as “providing evidence that the general ‘Duty of Care’ is being exercised”. The present Australian/New Zealand Standards for OHSMS, AS/NZ 4801:2001 and 4808:2001 defines an OHSMS as follows:

“Occupational health and safety management system – that part of the overall management system which includes organisational structure, planning activities, responsibilities, practice, procedures, processes and resources for developing, implementing, archiving, reviewing and maintaining the OHS policy, and so managing the OHS risk associated with the business of the organisation”
The most interesting feature of the above mentioned definition is the inference that an OHSMS is ‘integrated’ into a business’s overall management system and not something that has been added on or treated as separate from the rest of the business. An OHSMS will vary depending on size and nature of a business. An event management company for example requires an OHMS that considers the daily operating of their business, that is their office, transport etc., and for each individual event they manage. A company may only have one or two full time employees during the daily operations of the business but could be responsible for up to a hundred contractors and crew when an event is taking place. Although an OHSMS will assist a business in organising and maintaining the appropriate levels of document and data controls required by OHS legislation. There is one theme that regularly arises within the literature related to this topic, and that is the dangers of over reliance on a company’s OHSMS (Elsa & Beaumont 2001), (Pearse, Gallagher, Bluff 2001), (Mansfield, 2000). Furthermore, Bottomley (1999) points out that there is limited evidence about the ability of OHSMS to prevent major incidents involving death, serious injury, ill health or disease and damage to property and the environment. Hudson (2001) asserts, that to successfully implement an affective OHSMS a company needs to look at the underlying characteristics that make up the business [the corporate culture] and use this information to develop, what he describes as, a ‘safety culture’ within an organisation. Pearse (et al, 2001) also observes that employers need to “move beyond paper compliance and develop a cultural change within organisations to support an effective OHSMS”. Hudson (2001) identifies five different stages a company or business will go through to achieve this cultural shift in what he calls “The evolutionary model of safety culture” (see Figure1.)
Figure 1
“The evolutionary model of safety culture” (Hudson 2001) Event Industry Health & Safety All of the literature reviewed specifically relating to event management and event health and safety risk management (Van der Wagen 2005. Tarlow 2002. Allen et al 2002. Getz 2005), although providing some useful information, failed to identify two of the most important areas truly relevant to this subject. Firstly, there was next to no mention of the relationship existing

between the three key areas of event health and safety risk management i.e. Public Health and Safety, Occupational Health and Safety, and Volunteer Health and Safety or the fact that there is different legislation covering the three areas. The second point overlook by all the authors mentioned above was any emphasis on the need for event company’s/organisations to implement some form of a health and safety management systems to deal with the ever increasing administrative requirement legislation demands. As the diagram below suggests, each of the individual areas requires specific consideration but at the same time are interrelated to a great extent and an event management company would benefit greatly by developing an overriding Health and Safety Management System that would administer the three areas collectively.
Figure 2 Integration of Health & Safety Management Systems
Summary The literature review provides an overview of the development of OHS legislation within Australia and describes the means by which an employer can achieve legislative compliance, that is, through the implementation, maintenance and review of an OHSMS. Although the relative newness and continual revising of OHS legislation has created a lack of current and relevant literature on the subject, particularly relating to events. Over the past ten years, there has been an increasing amount of research conducted in the area of OHSMS and it was this area of the literature that provided the background in the design of the questionnaire benchmark OHSMS employed in this research. METHODOLOGY The method of data collection employed in this research was through the use of a self-completing questionnaire survey. A sample group of event managers, representing their respective event management companies/organisations were randomly selected over a three day period from a group of industry professionals attending the Festivals and Events Association’s National Events Summit, held at Old Parliament House in Canberra in early August 2004. Attendees at the Events Summit were randomly approached and asked to participate in the survey. Prior to being allowed to participate, those approached were asked if they worked for an event management company or organisation such as a local council, not for profit organisation etc., at a senior level of operations as this was a prerequisite for participation in the survey. Although the sample size was only 33 participant and subsequently relatively small, the attendees at the Events Summit and participant in the survey represented a good cross section of

the industry i.e. promoters producing only one large event a year, local council representatives producing or facilitating a number of varying size community events or event management companies contracted to produce corporate or promotional events. The fundamental question that the survey endeavoured to answer explored the concept of OHS legislative compliance and what percentage of a sample group of event management companies/organisations was achieving an acceptable level in their daily business operations. To achieve compliance a business needs to operate an OHSMS that addresses the five Principles contained within the two Australian Standards covering OHSMS (AS/NZS 4801:2001 & 4804:2001):
1. Commitment and Policy 2. Planning 3. Implementation 4. Measurement and Evaluation 5. Review and Improvement
This research assessed administrative legislative compliance amongst the sample group through questions relating to their company’s documented OHSMS. The questions asked attempted to cover all the five Principles listed above and related to specific policies, procedures, employee consultation, training and planning. To make the assessment that one event management company is achieving legislative compliance and another is not necessitates the introduction of a benchmark OHSMS that all collected research data would be compared against. The design and content of the benchmark OHSMS used to construct the survey’s questionnaire and subsequently to assess the level of legislative compliance amongst the sample group was constructed by consulting a number of different sources; the NSW OHS Act 2000; the NSW OHS Regulations 2001; a WorkCover NSW draft document “Occupational Health and Safety Management Systems – Best Practice Guidelines” (March 2004), and the Australian Standards covering OHSMS AS/NZS 4801:2001 & 4804:2001. While the operations of the event management companies participating in the sample group vary, the requirements outlined in the benchmark OHSMS are all representative of the key elements a WorkCover auditor would expect to see addressed if auditing a company’s OHSMS. The benchmark OHSMS was designed to provide data on a company’s OHS legislative compliance in the following areas of administration: General Policies and Procedures; Employment and Training and General Operations and On-Site Operations With regards to the format of the Q & As, the participants were presented with questions that could either be replied to with a ‘Yes’ or ‘No’ answer or questions that could be answered from a multiple of choices. Once the first draft of the questionnaire was completed, a pilot survey was conducted in late July 2004. The people chosen for the pilot survey were draw from a number of professionals and academics working in areas relevant to this study i.e. OHS professionals, lecturers in the of event management and people with a legal or academic background. The feedback received from the pilot survey resulted in minor changes occurring to the layout and content of the questionnaire.

Data Analysis This research has shown an OHSMS is a collection of policies, procedures and administrative tasks that require ongoing reviewing, maintaining, evaluating and updating. Although such a system will assist an event management company in meeting their legislative responsibilities and the requirement of the various Australian Standards, more importantly, an OHSMS is reflective of a company’s commitment to the management of OHS risks. It is important to remember that it is this commitment to the prevention of workplace incidents, through pro-actively and systematically managing workplace risk, that will be evident in any OHSMS and subsequently, the sum and substance of any systems audit where compliance is being determined. During the analysis of the completed questionnaires it was identified that a number of the questions in the survey were assessed as either too task specific to provide relevant data or felt the same data was obtained through other questions. Subsequently a number of questions were omitted from the final analyses. To be assessed as achieving legislative compliance, all of the remaining ‘Yes’ and ‘No’ questions required a ‘Yes’ response and all remaining multiple choice questions require a tick in all boxes. The finding of the research is as follows:
No Survey Question % Yes % No
1 Does your company/organisation have documentation that clearly outlines the management/employee structure of your organisation
97
3
2 Does your company’s documented structure clearly identify the OHS responsibilities of all staff within the company?
57.6 42.4
3 Documented annual Objectives relating to occupational health and safety?
54.5 45.5
4 A documented annual Action Plan relating to occupational health and safety?
54.5 45.5
5 Does your company/organisation have documented policies and procedures relating to the following areas of occupational health and safety? (a) An OHS policy (b) Risk Management Policy & Procedure (c) Purchasing policy & procedure (d) A Rehabilitation policy & procedure (e) First Aid Equipment Controls, Admin & Maintenance (f) Personal Protective Equipment Controls, Admin &
Maintenance (g) Incident Management policy & procedures (reporting,
recording & investigation)
81.8 87.9 57.6 48.5 72.7 51.5
87.9
18.2 12.1 42.4 51.5 27.3 48.5
12.1
6 Does your company/organisation have a documented policy for an annual external audit of the company’s OHSMS?
51.5 48.5
7 Does your company/organisation have documented policy and procedures for regular OHS consultation with all staff members?
66.7 33.3
9 Does your company/organisation have documented policy and procedures relating to Contractor Management?
57.6 42.4
10 Does your company/organisation’s Contractor Management 48.5 51.5

system require sub-contractors to provide a copy of their Workers Compensation certificate of currency
12 Does your company/organisation have: (a) Documented job description for all positions within your
organisation? (b) Documented Standard Operating Procedures covering all
duties and tasks outlined? (c) Documented Policy and procedures relating to induction
of new employees and contractors?
30.3
45.5
24.2
69.7
54.5
75.8
14 Does your company/organisation have a Workplace Hazard Identification program? (principle place of business)
42.4 57.6
16 Does your company/organisation have documented Emergency Preparedness & Response relevant to your principle place of business?
100
20 Does your company/organisation have a documented policy relating to the developing of site-specific Emergency Preparedness & Response procedures?
45.5 54.5
21 Does your company/organisation have a document site specific hazard identification program
60.6 39.4
The principle analysis required from the collected data is ‘what percentage of the sample group responded affirmatively to the all the questions selected from the survey’. Although the above results show interesting trends relating to the individual questions, the survey revealed that not one of the sample group’s participants achieved the required 100% affirmative response to all the selected questions. These findings indicate that the OHSMS the sample group participants operate in their respective businesses/organisations, if put to the test, could be assessed as being legislatively non-compliant. CONCLUSION Two main factors identified by this research as contributing to this environment of OHS legislative non-compliance amongst what is believed to be the broader events industry are; Firstly it is thought that because the foundation for the current NSW OHS legislation was only laid in the early eighties, and has barely been in its present form since 2001, there has not been enough time for the broader events industry to fully comprehend the importance of fulfilling OHS legislative requirements or to appreciate the potential financial and operational risks associated with non-compliance. Secondly, the fact that it has only been within the last thirty years that an events industry has evolved to be recognised for the specialised services it offers, and that specific event management training has only been developing for the past ten years, have both contributed to an environment where event management companies have not been pro-active in their efforts to manage workplace risk. Although the process of legislative change is ongoing, the current period being experienced dictates an increased responsibility on behalf of employers to develop safe systems of work. Employers are also responsible for integrating these systems into the business’s daily operations and the mind-set of the workforce. The unique nature of the events industry with regards to utilising teams of contractors and resources to create temporary installation that often attract large numbers of people, creates a paramount need to operate an effective OHSMS.

The above mentioned factors, that is the newness of the industry and the legislation, coupled with the ever increasing legislative pressure placed on event industry employers, has created an environment where industry OHS support is needed, but noticeably lacking. If legislative compliance is to be achieved and maintained within the broader events industry there needs to be a fundamental shift in the attitude and understanding of OHS, even though this process can frequently be time consuming, expensive and difficult to implement. If integrated change is to take place within the events industry, it is felt that an increase in industry support in the form of resources, industry training and networking opportunities to increase the flow of information, will be needed to achieve effective outcomes. The original research completed in late 2004 identified a need for industry support in the form of providing relevant information on the requirement and content of OHSMS for event management companies/organisations. In April 2007 the first steps in developing such a resource was taken when the author of this paper was commissioned by the Australian Centre for Event Management based at UTS, to write guidelines for inclusion on their website specifically relating to OHSMS for event management companies. The first draft of these guidelines was completed just prior to the submission of this paper in June 2007. REFERENCES New South Wales Occupational Health and Safety Act 2000 No 40. New South Wales Occupational Health and Safety Regulations 2001. AS/NZS 4801:2001 Occupational Health and Safety Management Systems – Specifications and
guidelines for use. AS/NZS 4804:2001 Occupational Health and Safety Management Systems – General
guidelines on principles, systems and supporting techniques. NSW Government Construction Agencies’. Occupational Health and Safety Management
Systems, Best Practice Guidelines-March 2004 (Draft) Allen, J. O’Toole, W. McDonnell, I. Harris, R. Festival and Special Event Management. (2002
Second Edition) Australia, Wiley & Sons Bottomley, B. (1999). OCCUPATIONAL HEALTH & SAFETY MANAGEMENT SYSTEMS:
STRATEGIC ISSUES REPORT. Canberra, ACT, National Occupational Health and Safety Commission: 88.
Bottomley, B. (2001), OHSMS Performance Measures That Add Up. Occupational Health and Safety Management Systems: Proceedings from the First National Conference. University of Western Sydney, NSW, Australia, Crown Content.
Elsa, D., Beaumont, P. (2001). Expect the Worst, Achieve the Best: What is the role of OHSMS in helping to secure healthy and safe workplaces. Occupational Health and Safety Management Systems: Proceedings of the First National Conference, Surfers Paradise, Australia, Crown Content.
Getz, D. (2005 Second Edition) Event Management and Event Tourism. New York, Cognizant Communication.
Hudson, P. (2001). Safety Management and Safety Culture The Long, Hard and Winding Road. Occupational Health and Safety Management Systems: Proceedings from the First National Conference, University of Western Sydney, NSW, Australia, Crown Content.
Lee. M., Quinlin, M. (1994). The Australian Journal of Labour Law 7: p38. Mansfield, B. (2000). An ACTU Perspective on OHSMS. Occupational Health and Safety
Management Systems: Proceedings from the First National Conference. University of Western Sydney, NSW, Australia, Crown Content.
Mayman, S. (2003). The Carrot's Failed, It's Time for Some Stick. OHS Regulation In The 21st Century Conference, Surfers Paradise, Australia.

NOHSC (2003). Compendium of Workers’ Compensation Statistics,Australia, 2000-01, NOHSC.
Pearse, W. Gallagher C. Bluff, Liz. (2001). Conference Papers Introduction. Occupational Health and Safety Management Systems: Proceedings of the First National Conference, Surfers Paradise, Australia, Crown Content.
Shone, A. Parry, B. (2001). Successful Event management. London, Thomson Learning. Tarlow, P.(2002) Event Risk Management and Safety. New York, Wiley and Sons The Jessica Recommendation (8 November 2002), Senior Deputy Coroner, Ms. Jacqueline M.
Milledge. The NSW Coroner’s Report into the death of Jessica Michalik at the Sydney Big Day Out Concert in 2001.
Van der Wagen, L (2005). Event Management for Tourism, Cultural, Business and Sporting Events. Australia, Pearson Education.
ACKNOWLEDGMENTS I would like to acknowledge and thank the following people for their assistance in making this research possible. Firstly I would like to thank my supervisor Dr Paul Jonson, Senior Lecturer, School of Leisure, Sports & Tourism and Associate Professor Bruce Hayller, Head of School, School of Leisure, Sports & Tourism for their guidance and input over the past ten months. Johnny Allen, Lecturer, School of Leisure, Sports & Tourism for his assistance in arranging access to the sample group and Julian Bedford, Auditor, WorkCover NSW, Colin Parkin, independent OHS Consultant, Dr Simon Darcy and Rob Harris, Senior Lecturers, School of Leisure, Sports & Tourism, all deserve special thanks for their assistance during the drafting and piloting stages in the development of the questionnaire. Finally I would to thank all directors and staff of the Festivals and Events Association for their assistance during the research sampling process and to all participants who contributed data for the survey.

Fourth International Event Research Conference Re-evaluating the City/Town: Events as a Catalyst for Change
A STUDY OF THE CHARACTERISTICS OF BUSAN AS A CONVENTION VENUE: ON THE CASES OF BUSAN INTERNATIONAL TRANSPORTATION & LOGISTICS FAIR 2006 AND
UN ESCAP MINISTERIAL CONFERENCE
Haesang Kang Department of Event & Convention
Dongseo University [email protected]
ABSTRACT This paper studies Busan as a convention venue by examining its image as a destination, the purpose of visiting, and evaluation factors in order to provide basic data to establish convention marketing strategies. Surveys were conducted with participants of Korea Railways Fairs, in 2003 and 2006. A time series analysis was also performed. Research findings showed that Busan has gradually changed its image from an ocean port city to a tourist and convention location. Amongst the convention evaluation factors, facilities and operation were highly scored. However, tours, shopping, easy access to the airport, and interpretation scored relatively low. This study is limited as surveys were conducted on only occasions under different conditions involving only convention participants. Keywords: Busan City, Convention Industry, Destination Image, Convention Evaluation Factor
INTRODUCTION Research Purposes The convention industry is one of the fastest-growing tourist industries and is being intensively cultivated as a strategic industry for future in the U.S.A. and European countries as well as in many Asian countries. A variety of events involving a great number of people from all around the world such as conferences, conventions, meetings, symposia, workshops, and seminars have become a key trend in today’s business environment. Economic globalization simultaneously promotes the growth of international conventions, which enables many countries to aggressively attract both major conventions and small meetings and to host international events (Ro, 2004). One of the integral aspects in this movement is that convention tourism has great potential to attract high-spending visitors who often stay longer, and subsequently make repeated visits to the destination country (Spiller, 2002). The cultivation of the convention industry contributes to both advancing the globalization of hosting countries but also a vitalization of the local economies. Importantly, it is a high value-added tourist product that can artificially create demand, without relying on original resources from the country. It also provides an opportunity to develop a new tourist market (O'Neil. 1998). Advanced tourist countries and other peripheral countries in Asia have already recognized the growth potential of the convention industry. They have thus directed their energies to attracting a variety of conventions, exhibitions, expositions, academic seminars, cultural and artistic events, sports events,

incentive tours of foreign companies, and establishing promotional strategies (Morrison, Bruen and Anderson. 1998). Moreover, as a knowledge-intensive industry of the 21st century, the convention industry may be a green industry that causes little damage to the environment and additionally the rate of foreign exchange earning can be much higher than that of any other industry. Regarding convention industry, the average growth rates of the exhibition industry were 7% in the United States and 10% in Germany in the 1990s. Since the convention industry has a great ripple effect to the relevant industries such as culture, tourism, transportation, and communication, it is deemed to be an alternative industry to accelerate the growth of underdeveloped cities and reorganize stagnant local industries. Therefore investments are continuously made at national and local levels. In particular it encourages the building, remodeling, or repairing of transportation, accommodation, and tourist facilities in cities. It also encourages the establishment of cultural infrastructure such as theme parks or high-quality performances for convention participants. Thus, it presents a great opportunity to develop relevant industries, and to help raise the quality of local residents’ life. For example, during the 2005 Asian Pacific Economic Co-operation in Busan, Korea not only increased its stature as a convention country but it also allowed South Korea convention industry to take off internationally. According to the UIA (Union of International Associations) statistics, South Korea was ranked 14th, and Seoul was ranked 9th city in the world as a convention destination in 2005. Also, South Korea was ranked the 2nd country among the Asian countries, and Busan was ranked the 10th city among the Asian cities. Also, the statistics compiled by the Korea National Tourism Organization stated that a total of 306 international meetings, including exhibitions and sports events, were held in Korea in 2005. Furthermore, foreign convention attendees visiting Korea totaled 69,941 in 2005; this was an increase of 70% from 2004. This is attributed to the fact that the number of medium- or large-scale meetings with more than 300 attendees was 182 cases which was approximately a 59% increase. In terms of an area of facilities, 8 South Korean cities currently operate convention facilities. In addition to the existing convention centers, Kim Daejung Convention Center was opened in the metropolitan city of Gwangju in September 2005, and the Changwon Exhibition and Convention Center (CECO) was opened in the city of Changwon. Local organizations in Daejeon and Ulsan continue to make preparations for the establishment of a convention center in their cities, while Busan pushes forward the expansion of the BEXCO (Busan Exhibition and Convention Center) building. Busan selected the convention industry as one of 4 strategic industries and has thus intensively cultivated it. In 2005, the South Korean government designated Busan as a city for international meetings, which further raised its image as a convention city. This study examines the image of Busan as convention city. Convention participants were surveyed on a variety of diverse convention evaluation items including facilities, management, shopping, and accommodation. This was done in order to present basic data, which can be used to help establish strategies to improve Busan as a convention city in the future. Research Method and Survey

This study consists of a literature review on previous research, the existing data and empirical analysis based on a survey of participants at actual conventions. For data analysis, a time series analysis was selected to compare the survey results 2003 and 2006 with the same items. Each survey was conducted by the researcher and survey assistants visiting BEXCO, where conventions were taking place so that it could be executed face-to-face with participants. Surveys were performed by Busan Research Center which is a professional research institute in Busan. A self-administered survey was used at convention sites from November 7 to November 10 2006, during which time the 2006 UN ESCAP Transportation Ministerial Conference and ‘Korea Railways Fair’ were held. Survey questionnaires were prepared both in Korean and English and distributed to foreigners and native participants. Moreover Busan residents were excluded. The survey was composed of four sections: demographic information, information channels, destination image of Busan City and convention evaluation factors. Fourteen evaluation factor items were measured on a five point Likert-type scale (1 = very poor; 2 = poor; 3 = average; 4 = good; 5 = excellent). Of the 1,768 collected questionnaires, 1,687 were used in final analysis. The 2003 data was based on a survey was conducted at the Korea Railways Fair between May 28 and June 2, 2003, using the same questionnaire items. A total of 750 questionnaires were collected and 600 were used in final analysis. Survey respondents may or may not have been the same participants from both events, and the data provided by the organizing groups are considered for the aspects that require detailed data. Additional information for the International Transportation & Logistics Fair 2003 and The International Transportation & Logistics Fair 2006 is as follows: The 2003 Korea Railways Fair was held between May 28 and June 2, 2003, in which 62 companies from 12 countries participated. During the event, a total of 32,000 people visited the site and it is estimated that export consultation performance reached the amount of 2 billion dollars. The International Transportation & Logistics Fair 2006 was held between November 7 and November 11, 2006 at BEXCO. There were 610 booths installed by a total of 154 companies in the areas of distribution, railways, harbors, flight, and ground transportations. 1,544 cases of export consultation adding up to 930 million dollars occurred and about 25,000 visitors came to the exhibition. During the UN ESCAP Ministerial Conference that was held at the same time, 42 ministers and vice-ministers from 40 member countries attended, as well as 300 representatives of international organizations. LITERATURE REVIEW Destination Image Tourist destination image is a visual and mental impression regarding place, products and services, and experiences shaped by the general public (Milman & Pizam, 1995). It combines various forms of information obtained before visiting a destination and the overall perceptions formed through actual experiences in a tourist destination (J. Lee, 1997). Destination images include socio-cultural experiences directly had or felt in a tourist site, as well as relevant facilities and tourist attractions. Even if not actually visiting a tourist place, one can have destination images through photographic and video materials and the transmission of words. While everyone has different images on a particular tourist destination, some parts are shared by many people and when these shared images are generalized, destination images are formed.

Destination image plays an important role when deciding upon a convention venue. Even though many factors are considered in selecting a convention location, many studies have shown that destination image (especially city image) was found to be a crucial attribute (Oppermann, 1998; Go & Govers, 1999; Balouglu & Love, 2001). As shown in Table 1, Oppermann’s (1998) study includes city image amongst 14 other selection attributes - meeting & exhibition facilities, hotel service quality, hotel room capacity, clean and attractive location, safety/security, accessibility, food and lodging costs, overall affordability, transportation costs, restaurants, sightseeing, climate, and night life. A study by Go & Govers (1999) also included city image along with facilities, accessibility, service, climate, environment and attractions. In addition to meeting & exhibition facilities, hotel room capacity, affordability, safety/security of destination, food and beverages facilities, number of hotel rooms, accessibility, hotel service, technical resources, union labor requirement, local attraction, and climate, a study by Balouglu & Love (2001) includes city image as one of 13 selection criteria when evaluating a location. Therefore, tourist destination image is one of the critical attributes when choosing a convention venue. For the places with a strong city image as an exhibition and convention location in Asia (Singapore and Hong Kong in particular), it is a vital factor when selecting a venue or for attendees’ making a decision to participate in an event.
Table 1 Convention Destination Attributes
Researchers Sample Attributes Opperman (1996 & 1998)
Meeting planners
Meeting & exhibition facilities, hotel service quality, hotel room capacity, clean and attractive location, safety/security, accessibility, food and lodging costs, overall affordability, city image, transportation costs, restaurants, sightseeing, climate, night life
Upchurch, Jeong, Clements, & Jung (1999)
Organizers Meeting & exhibition facilities, affordability of hotel rooms, hotel service quality, accessibility, safety and security, local attractions, food and lodging costs, restaurant facilities, hotel images
Go & Govers (1999)
Organizers Facilities, accessibility, service, image, climate and environment, attractions
Choi (2000) Meeting planners
Accessibility of facilities, meeting facilities, cleanliness level of hotel, food and beverage, appropriateness of cost, human services, audio and video equipments, security, local hospitability, business service, cultural attractions, accessibility, close leisure facilities
Baloglu & Love (2001)
Meeting planners
Meeting & exhibition facilities, hotel room capacity, affordability, safety/security of destination, food and beverage facilities, city image, number of hotel rooms, accessibility, hotel service, technical resources, union labor requirement, local attractions, climate, transportation, CVB service
KNTO (2005)
Visitors Facilities, operation of meetings, accessibility, accommodation, special event related to theme, tour, shopping, experiences of entertainment & night life, destination environment (e.g.

infrastructure, safety) Lee (2005)
Visitors Accessibility, programs, event creativity, human network, safety and customer hospitability, physical environment
Similar to meeting planners and organizers, images those individuals have and feel about tourist destinations are a very significant decision factor when selecting a tourist destination (Mill & Morrison, 1998; Tapachai & Waryszak, 2000). Research on destination images in the last few decades indicates that it functions as an important concept in verifying the destination selection process (Chon, 1991; Baloglu & Mccleary, 1999; Gartner, 1989; Echtner & Ritchie, 1993; Tapachai & Waryszak, 2000). Research by Oberoi and Hales (1990), Hinkin and Tracey (1998), and Robinson and Callan (2002), which studies convention evaluation factors, has mainly focused on the aspect of service quality. In their evaluations of events including conventions, Carlsen, Getz, and Soutar (2001) performed pre-tests and post-tests. They presented pre-test factors such as accommodation of a venue and agreement with local image, and post-test factors including problem-solving ability, kindness toward visitors, and image strengthening. In one of the most recent studies, Lee (2005) classified five convention evaluation factors.
Table 2
Convention Evaluation Attributes (Lee, 2005) Factors Attributes Items Information & Operation Provision of information and materials, websites, site
operation 5
Destination Accessibility to airport, public transportation, safety and security
4
Physical Environment Cleanness of hotel rooms, audio/video equipment 4 Program Exhibition, connected tours, networking activities 6 Human Interaction Kindness and foreign language ability of the personnel 6
RESULTS Characteristics of Respondents For survey questionnaires included in the final analysis, overall frequency analysis of each item and the analyses by residence, sex, and age were performed with SPSS WIN 11.5. The data were analyzed 100% including no those with response in terms of the characteristics of the samples, and the data was processed 100% excluding the non responses in analyzing research results. The number of foreign participants was 212 (12.6%) in 2003 and 115 (23.7%) in 2006. While the number of samples decreased, the rate of participants increased. In 2003, the largest Group of foreigners was European participants, there were 126 (61.2%); but, in 2006, 79 Asian participants made up 58.6% of the total number. There was little difference in sex ratio between the two occasions and male participants had a higher percentage in both times.
Table 3 Characteristics of Respondents (2003)
Index Number of Cases Ratio (%) Nationality Foreigners 212 12.6

Natives 1,475 87.4 Asians 29 14.1 North Americans 51 24.8
Foreign residence by continent Europeans 126 61.2
Seoul 406 31.5 Incheon & Gyeonggi 274 21.3 Chungcheong & Gangwon 104 8.1 Jeolla & Jeju 82 6.4 Daegu & Gyeongbuk 146 11.3
Residence Domestic residence by region
Ulsan & Gyeongnam 275 21.4 Participants 787 46.7 Respondent Status Visitors 900 53.3 Males 1,501 89.8 Sex Females 171 10.2 10 – 19 9 0.5 20 – 29 394 23.7 30 – 39 683 41.1 40 – 49 422 25.4 50 – 59 126 7.6
Age
60 - 28 1.7 Total 1,687 100.0
Table 4
Characteristics of Respondents (2006)
Index Number of Cases (persons) Ratio (%)
Total 600 100 Foreigners 115 23.7 Nationality Natives 485 76.3 Asians 79 58.6 North Americans 4 3.4 Residence
(Foreigners) Europeans 32 27.8 Seoul 162 33.4 Incheon/Gyeonggi 33 6.8 Daejeon/Chungcheong/Gangwon 57 11.7 Gwangju/Jeolla/Jeju 37 7.6 Daegu/Gyeongbuk 70 14.5 Ulsan/Gyeongnam 119 24.5
Residence (Natives)
Others/No Responses 7 1.4 Males 532 88.7 Sex Females 68 11.3 20 – 29 106 17.7 30 – 39 252 42.0 40 – 49 175 29.2 50 – 59 52 8.7
Age
60 - 15 2.5 Occupation Administration/Management/ 177 29.5

Professional/Freelancer Office jobs/ Technicians 282 47 Self-Employed 33 5.5 Service/Sales/Marketing 36 5.5 Assembly Worker/Laborer 3 0.5 Housewives 3 0.5 Students 44 7.3 Unemployed/Others 22 3.7
Information Channel, Purpose of Visiting The findings on the information channel or information sources – where respondents found the information on the convention – are as shown in Figure 1.
Figure 1 Information Channels
20.6
28.2
39.7
22.3
9
13.8
5.2 4.8
24.1
27.8
05
10152025303540
Internet BusinessAqaintance
Newspaper Magazine Other
20032006
One of the notable findings from Figure 1 is that business acquaintances are the largest information source with 39.7% in 2003. However, the Internet was the largest source of the information on convention in 2006. That is, in 2006, the information gathered through business networks considerably declined, while the information collected from the Internet increased significantly. This finding affirms that the information on conventions or exhibitions used to be mainly obtained through human networks or associated businesses. But as Internet users have increased in recent years, a trend has shifted towards the Internet becoming the primary source of information for conventions or exhibitions.

Instead of using traditional methods to provide information on meetings or exhibitions through mailing, catalogues, or magazines, it is necessary to build a system which allows a variety of informative materials to be shared on the main website of an event. Many events nowadays make pre-registration available only on line, but not via phone. This not only increases accuracy and efficiency, but also reduces the costs of operation.
Figure 2 Purposes of Visit
14
44.3
36.2 34.1
42.3
9.7
2.2
12.9
5.3
05
1015202530354045
Conference Information Viewing Purchasing Other
20032006
The results on participants “purposes of visit” show the followings. In the case of the item, “to participate in the meeting,” for 2003 this information is not available, as there were no meetings in that year. However, 14% of participants indicated it as the main purpose of their visit in 2006. In 2003, 44.3% of participants answered that they came “to obtain information on new products,” but this rate decreased to 36.2% in 2006. Participants whose purpose was simply viewing increased considerably from 34.1% to 42.3%. This can be explained by the increase in the general public’s interest in exhibitions, indicating that the characteristics of conventions shifted from trade shows to public shows. Destination Image of Busan City Destination image (or city image) is an aspect that is always considered for large events or conventions. Cities that have previously hosted a convention or made an intensive investment in tourism or the convention are industry at an advantage when being selected as a convention venue.
Figure 3 Destination Image of Busan City

64
11.47.1
3.70
50
100Ocean Port
Tourism
Convent ion
Film
2006
67.7
8.94.4
4.40
50
100Ocean Port
Tourism
Convent ion
Film
2003
64
11.47.1
3.70
50
100Ocean Port
Tourism
Convent ion
Film
2006
67.7
8.94.4
4.40
50
100Ocean Port
Tourism
Convent ion
Film
2003
Only 10 years ago, Busan was far from having an image of tourism or convention destination. The city had long been recognized for its shoe or lumber industries. It had been considered primarily as a marine city with traditional ports. However, this study shows that Busan’s destination image for tourism and convention has gradually increased in recent years. Traditionally, Busan’s image of being an ocean port was strong due to the ports. Until recently, Busan had been ranked second in Asia for its total container loading capacity. However, its image has gradually changed to a tourist and convention city. Even though more than 60% of participants still retain Busan’s ocean port image, the numbers also indicate that its ocean port image has decreased from 67.7% to 64%, while its image of a tourist destination has increased from 8.9% to 11.4%. Its image of a convention destination has increased from 4.4% to 7.7%, this showing a slow change of Busan’s image. Therefore, it can be said that Busan took the first step towards becoming a tourist and convention city and its new image is becoming known to the world. Convention Evaluation Factors Table 5 shows the results of reliability test for participants’ evaluations factors. Based on previous literatures, total 12 evaluation items were selected and the responses for each item were used for reliability test and factor analysis. Varimax rotation was used and 2 evaluation items were extracted from the analysis. Generally, when a value of Cronbach’s α is 0.8 or higher, it is considered to be of high reliability. As shown in Table 5, all Cronbach’s α values were over 0.8, indicating high reliability. All three factors were drawn from factor analysis and they were entitled; ‘Facilities & Operation,’ ‘Convenience of Visitors,’ and ‘Destination.’ The overall explanatory power of factors was 66.642% and the loading values of the items for these factors were all over 0.5, it is thus analyzed that validity is secured for each factor.
Table 5 Factor Analysis of Evaluation

reliability test Factor Subscales Factor Loading Cronbach' α
Facilities .733 .180 .389 Operation .713 .317 .299 Facilities
&Operation PR & Promotion .588 .460 .163 .909
Shopping .203 .808 .186 Flight .220 .761 .198 Interpretation .304 .742 .085 Information .277 .737 .243 Tour .382 .703 -.065 Accommodations .226 .632 .401
Convenience
Public Transportation .243 .627 .372
.900
Friendliness of people .290 .252 .827 Destination Competitiveness of Busan as a Convention
City .348 .203 .814 .868
Eigen value Variance Explained (%) Total Variance Explained ((%)
8.791 51.71251.712
1.510 8.881 60.594
1.028 6.048 66.642
-
Regarding evaluation factors for conventions, most items showed higher mean values in 2006 than the 2003 results. First, the findings related to “Facilities and Operation” are as follows: in terms of facilities, “Nurimaru House” was newly built for the APEC, a large-scale renovation of facilities was carried out, which contributed to increasing the evaluation value in participants’ responses. In terms of operation, in 2003, there was little know-how on the operation of a large event with a new facility. But, in 2006, operation abilities as well as facilities seem to have improved considerably. Public Relations and Promotion is an area related to destination image. In Busan, when BCVB was launched in 2004, destination marketing has officially begun in full force. Starting with ‘Dynamic Busan,’ various campaigns were carried out with such slogans as ‘Dream Fair’ and ‘Unforgettable Busan.” Compared to 2003, the results on the 2006 event show that a lot has improved in PR and Promotion.
Figure 4 Comparison of Evaluation Factors
(Facilities, Operation, PR & Promotion, Friendliness, Competitiveness)

3.493.32
3.13
3.68
3.34
3.81 3.69
3.463.79
3.74
22.22.42.62.8
33.23.43.63.8
4
Facilities Operation PR &Promotion
Friendliness Competitiveness
20032006
Note: Respondents utilized a 5point Likert type scale to indicate evaluation factor of each item (1 = very poor; 2 = poor; 3 = average; 4 = good; 5 = excellent). Secondly, the items regarding the convenience of a convention location for visitors include shopping, convenient airport, interpretation, provision of tourist information, connected tourist goods, lodging facilities, and convenient use of public transportation. In case of shopping, participants evaluated that little improvement was made with relatively low scores. This can be explained by the fact that there are little souvenirs or specialties that represent Busan. Regarding airport use, it is an important factor for there to be a direct flight. In Busan, there are direct flights between Busan and 21 cities in only 10 countries. But there are no direct flights from Europe or Australia, which makes it inconvenient for these countries hosted for international conventions. Many participants are forced to take an inconvenient route which includes an additional domestic flight via Incheon International Airport. The mean value for convenient use of airport shows a little improvement but is still lower than other items. Interpretation is a highly important factor with regard to convention operation because it is directly related to communication which is one of the most fundamental operation abilities in meeting participation. Particularly as Korea is not an English-speaking country, so the English-speaking population is smaller than places such as the Philippines and Singapore. Therefore, even when it does not affect a meeting operation, there might be a difficulty with regard to communication at connected tours or city tours. The result shows that interpretation also shows an only little improvement compared to 2003. The average value of information provision increased from 2.95 to 3.32. Although the overall value is low, Busan (which was building U-Convention) has shown improved levels of information provision both through the Internet and at the event site. As mentioned above, since the way to

obtain information on line is becoming more common, it is expected that information provision using the Internet and mobile phone continues to develop. Connected tour is an item of which importance is becoming more emphasized. This is more and more convention visitors participate in conventions not only for the event itself, but also for other reasons such as family trip or entertainment. Even though the average value of this area increased from 2.74 in 2003 to 3.15 in 2006, it still has the lowest average value. This item suggests a significant point that convention industry is directly related to destination image.
Figure 5 Comparison of Evaluation Factors
(Shopping, Information, Tour, Interpretation etc.)
3.14 3.283.03 3.06 3.062.95
2.74
3.51
3.48
3.233.26 3.3 3.32
3.15
22.22.42.62.8
33.23.43.6
Shop ping Fl ightInterpretat io n
Inf ormation To ur
Ac co mod atio ns
Transp ortat ion
20032006
Lodging received relatively high scores. Including five-star hotels, Busan currently has about 8,000 rooms. Additionally when the facilities currently in construction are included, approximately 10,000 rooms will be available. Also, most hotels are a 10-minute drive away from convention facilities with excellent accessibility. A relatively high score for public transportation can be explained by the fact that the subway is convenient to use and bus and taxi usage is easy. Also, in large-scale meetings or exhibitions, shuttle buses are operated between the airport and the event venue or between the venue and the lodging facility. So it appears that participants had no trouble using public transportation. Friendliness received the highest scores compared to other items. The mean values were 3.68 in 2003 and 3.79 in 2006. This indicates that not only general citizens, but also associated employees such as convention personnel show great kindness to convention participants.

Based on these scores, responses on Busan’s competitiveness as a convention city improved from 3.34 to 3.79 with a relatively high value. This can be attributed to the efforts in improving city infrastructure and operation ability as a convention city as well as city marketing. CONCLUSIONS Globally the convention industry is considered an optimal alternative for local development. As a local key industry or a development model for declining industry or an underdeveloped region, it is intensively cultivated not only in North America and Europe but also in Asia. A substantial budget is assigned to building large-scale exhibition and convention facilities, aggravating competitions among regions or countries. However, the convention industry cannot be developed solely with facilities. Various factors including destination image, accessory facilities, operation, and accommodation should also be considered. Therefore, in order to establish marketing strategies appropriate for a given city or area, it is necessary to do research using participants, and basic surveys on diverse factors such as destination image, lodging, and connected tours to understand the effect of each factor. The findings of this research are as follows. Firstly, the image of Busan is changing from the traditional image of marine port city, to a new image of tourist city or convention city. Destination image is not fixed and can change little by little over time depending on industrial structure, environment and the tourist infrastructure of a city. Therefore, this research demonstrates that Busan has a great opportunity to develop as a convention city. Secondly, the types of exhibitions can be divided into professional exhibitions and public exhibitions depending on their characteristics, but they are not necessarily exclusive. As trends and industrial structure change, the propensity of any exhibition can change from that of professional exhibition to public exhibitions. It is necessary to be equipped with the measures to cope with this change. Information sources are also shifting from the previous business networks to online sources. Therefore, it is imperative for event organizers to keep up with these changes and latest trends. As seen in the cases of the U.S. COMDEX and CES, trends of exhibitions change rapidly, it is necessary for an exhibition to not only catch up with industry but also move forward by reading trends. Thirdly, respondents of this study gave a relatively good assessment to some convention evaluation factors such as facilities or operation and friendliness and competitiveness. However, connected tours, convenient use of airport, interpretation, and shopping received relatively low evaluation. This is not just an issue for Busan. Recently, convention participants’ desire for connected tours, entertainment, or shopping has gradually increased. In the case of the United States, Las Vegas is emerging as a convention city. In Hong Kong and Singapore, a strategy involving night life and shopping is emphasized more and more, which reflects this trend. Thus, development of connected tours and night life that participants can enjoy besides the meetings or exhibitions is a vital strategy. In addition, it is also important to develop diverse and high-quality shopping items that appropriately demonstrate local characteristics. This study analyzed the data empirically collected from the actual convention sites. This time-series analysis involves two surveys evaluating the same items from two events of similar nature held at different times. However, the two events were not exactly the same. Particularly with regard to size, and the added meeting held in 2006. Therefore some errors are expected to be present. Additionally

survey respondents were participants, so questions for participating businesses or organizers were excluded. Future research should be more in-depth and include greater variety of research subjects. REFERENCES Astroff, Milton T., & Abbey, James R., (1998), Convention Management and Service, 5th edition,
Waterbury Press. Baloglu, S. & Love, C., Association meeting planners perceptions of five major convention cities:
Resilts of the pre-test, Journal of Convention & Exhibition Management Coltman, Michael M.(1989), Tourism Marketing, 3(1), 21-30.
Baloglu, S. & McCleary, K. (1999), A Model of Destination Image Information, Annals of Tourism Research, 26, 868-897.
Carlsen, J., Getz, D. & Soutar, G. (2001), Event Evaluation Research, Event Management Vol.6, 247-257.
Chon, K. (1991), tourism Destination Image Modification Process: Marketing implications, Tourism Management, 12, 68-72.
Choi, J. (2000), Association convention planers site selection and satisfaction, Unpublished Doctoral Dissertation, Kansas state University, Manhattan.
Echtner, C. & Ritchie, J. (1993), The measure of destination image an empirical assessment, Journal of International Business Studies, 21(1), 23-40.
Gartner, W. (1989) Image Formation Process, Communication and Channel Systems in Tourism Marketing, 191-215.
Go, F. & Govers, R.(1999), The Asian perspective: Which international conference destination in Asia are most competitive? , Journal of Convention & Exhibition Management, 1(4), 37-55.
Hinkin, T. & Tracey, J. (1998), The service imperative: Factors driving meeting effectiveness, Cornell Hotel & Restaurant Administration Quarterly, 39(October), 1-6, 59-67.
Kang, H. S. (2005), A Case Study of the Convention Industry of U.S. Event & Convention Research, 1(1), 1-18.
Korea Convention Forum (2005), A Collection of the 2005 Korea-Japan Joint Seminar for the Development of Convention Industry in Northeast Asian Countries.
Korea International Trade Association – New York Branch. (2003), Current State of the U.S. Exhibition and Convention Industry and Suggestions.
Korea National Tourism Organization (2006), Annual report: 2005 Conventions in Korea. Lee, H. (2003), The effects of convention participants’ perceptions on service quality on behavioral
intention, Tourism Science Research, 27 (1), 23-37. Lee, J. (1997), A Study on Development Scale of Festival, Doctoral Dissertation, Kyonggi
University. Lee, K. & Cho, Y. (2005), Convention Practice, Samyang Media. Lee, M. & Lee, K. (2005), Association members' perceived importance & performance of
convention destination attributes, Event & Convention Research, 2(2), 159-173. Mill, R. C & Morrison, M. A (1998), The tourism System: An Introductory Text, Third Edition: 69-
88. Milman, K & Pizam, A. (1995), The Rolle of Awareness and Familiarity with a Destination: The
Central Florida Case, Journal of Travel Research winter, 21-27. Morrison, Stacey, Bruen and Donald. (1998), Convention and Visitor Bureaus in the USA: A
profile of Bureaus, Bureau Executives and Budgets, Journal of Travel and Tourism Marketing, 7(1).
Oberoi, U. & Hales, C. (1990), Assessing the quality of the conference hotel service product: towards an empirically based model, Service Industries Journal, October, 700-721.

Oppermann, M. (1996), Convention destination images: Analysis of association meeting planners’ perceptions, Tourism management, 17(3). 175-182.
O'Neill and John, W. (1998), Effective Municipal Tourism and Convention Operations and Marketing Strategies: The Case of Boston, San Antonio, and San Francisco, Journal of Travel and Tourism Marketing, 7(3).
Ro, Y. (2004), Core and Peripheral Convention Service, Doctoral Dissertation of Graduate School , Kyonggi University.
Spiller, J. (2002), History of Convention Tourism: International Research and Industry Perspectives, 3-19, Haworth Hospitality Press: New York.
Tapachai, N & wary, R. (2000), An Examination of the Role of Beneficial Image in Tourist Destination Selection, Journal of Travel Research, 39, 37-44.

Fourth International Event Research Conference Re-evaluating the City/Town: Events as a Catalyst for Change
LONDON 2012 - WILL IT BE REGENERATION OR RENAISSANCE?
Deborah Sadd, Janet Dickinson, Ian Jones & Keith Wilkes School of Services Management
Bournemouth University, UK [email protected]
ABSTRACT When London won the bid to host the games, the London 2012 games vision was underpinned by the themes of delivering the experience of a lifetime for the athletes, leaving a legacy for sport, benefiting the community through regeneration, a legacy in itself, and supporting the IOC and the Olympic movement. The regeneration of the Lower Lea Valley will involve the rejuvenation of an entire community for the direct benefit of everyone who lives and works there at present, involving significant social and economic advancement. The bid committee believe this model of social inclusion will open up opportunities for education, cultural and skills development and jobs not just across the London area but also across the whole of the UK (IOC, 2005). The intention of London 2012 is to deliver a transformation process whereby people’s lives will improve through the social, physical and economic landscape changes in the poorest and most deprived areas of London. However, Mace et al (2007) draw parallels between the urban regeneration seen in Manchester and Leipzig. Their studies explain the difference between renaissance for middle classes and regeneration for the working class and that for regeneration to work in a place like East Manchester, where incomers have more money, the social policies need to be reviewed. Could this happen in east London and despite Government plans, the developments end up as an extension of the Docklands renaissance, inhabited instead by mostly middle class workers? This discussion paper explores the difference between regeneration and renaissance in the context of London 2012 other Olympic Games and large scale sporting events. Much of the published literature regarding London’s legacy of urban regeneration has a positive slant. Through the analysis of documentation in a case study format of previous games, the research highlights a number of issues that London 2012 will need to address. Fundamental is the need to provide infrastructure opportunities and jobs that are relevant to the local population.
INTRODUCTION Cashman (2006) writes extensively about the legacies of the Sydney 2000 Games, which according to the former president of the IOC, Juan Antonio Samaranch, were considered to be ‘the best games ever’ (Cashman 2006). However, despite this resounding endorsement at the time of the closing ceremony, on reflection, Cashman writes that Sydney did not get long-term legacy planning in place until a few years after the Games had finished. Cashman (2003) proposes that there are 4 distinct periods of planning and impacts for hosting an Olympic Games; the bid preparation and winning; 7-year preparation phase; actual games period including the Paralympics; the longer post-Games era. Ritchie (2000) writing after the Calgary and Salt Lake City Olympic Games, believes the Games can provide a short term period of intense excitement for residents of host cities and even nations, and long term awareness of the host destination in tourism markets, yet without proper strategic planning it can be difficult to justify the immense expense involved. He also believes that legacy planning in respect of the

Olympics can lead to the attainment of long-term benefits to host destination residents. The city transformations that can be undertaken as a result of hosting mega events depend on the quality of the planning. Ritchie (2000) further writes that due to importance placed on Olympic legacies the process to identify and plan for realistic legacies must involve all relevant stakeholders and include as much information as possible including any potential ‘non-positive’ legacies. Many of these initiatives should be put into place before the games as distinct from those following the games. He developed a 10 point plan combining a previous study (Ritchie, 1987) and proposed that not only should all stakeholders have an inclusive role but also the values must be agreed by all to which planning refers, including engaging community cohesion; parallel educational, the importance of cultural and commercial events with legacy synergy; regionality; not letting events become ‘cold’; engaging the young; training residents to be agreeable hosts and avoidance of irritation. An International Symposium on ‘Legacy of the Olympic Games’ was held in Barcelona in 2002 to discuss and explore the various aspects of Olympic Legacy at all levels. Over 150 experts from National Olympic Committees, Olympic Games Organising Committees, Bid Committees, International Olympic Committee Members, Games Participants and researchers all discussed and focussed on Summer and Winter Games from 1984-2000, yet also taking into account the 2002 and 2008 Summer Games. The symposium agreed that legacy is multidisciplinary and dynamic and evolving constantly, therefore whilst being difficult to define ‘it is a local and global concept existing within cities, regions and nations as well as internationally’. (IOC, 2002). The IOC developed within the Olympic Charter, Rule 2.13 that states,
“The IOC takes measures to promote a positive legacy from the Olympic Games to the host city, including a reasonable control of the size and the cost of the Olympic Games, and encourages the Organising Committees of the Olympic Games (OCOG’s), public authorities in the host country and the persons or organisations belonging to the Olympic Movement to act accordingly” (IOC, 2002)
The IOC’s findings concur with Cashman’s suggestions especially that legacy begins with the decision to bid for the Games, but that sustainable development is paramount within legacy planning and that more attention needs to be paid to research into the legacy of the games, especially longitudinal research. Legacy will become a crucial component within the bid process especially evidencing post-games initiatives. Within this the creation of libraries and the sharing of knowledge and best practice between Games are important. Luckily, most Olympic Games of modern times have kept comprehensive records with numerous documents, and in connection with the relevant Olympic Study Centres, can allow for the transfer and assimilation of much Olympic knowledge. It is vital to begin to keep records as soon as is practically possible in relation to the staging of an Olympic Games, especially in the value of what these records can show in the future. During the hosting this valuable information can be overlooked, yet its importance may only come to light on reflection. Whilst there are various types of legacy and different interpretations on how to classify them; soft or hard, tangible or intangible; objective or subjective; it is only economic and to some extent environmental, physical and technological legacies that can objectively be measured. Can legacy ever be measured and why would we want to measure it in the first place? The social and psychological legacies are sometimes the most valuable (Ritchie 2000), those that will ‘enhance the long-term well-being or lifestyle of destination residents in a very substantial manner – preferably in a way that reflects the values of the local population (p156.) including urban transformation. Hiller (2000) writes that the holding of an event is often legitimised in economic terms. However the economic impacts alone are not enough as by ignoring the other impacts, which

could have greater negative impacts but are not able to be accurately measured, could make a substantial difference about whether to host or not. Again, returning to the theme that, we are in a society that will only accept that phenomena that are measurable and quantifiable. Malfas, Theodoraki and Houlihan (2004) write that whilst the prospect of economic growth often encourages the bidding for the right to host the Games, the legacies that result from the hosting of the games are ‘difficult to quantify, prone to political interpretation and multifaceted’ (p209). The economic regeneration of cities has long been a powerful factor in the decision to host mega-events. Mega-events are therefore an ideal means to boost economic growth strategies for long-term development and job creation (Hiller 2000). URBAN TRANSFORMATION As mentioned in the introduction, this paper explores the notion of regeneration as opposed to revitalisation or even renaissance as discussed as far back as the late 1960’s by McKay and Cox, (1979). It will then look at some examples and the unique opportunities available for London 2012 through a discussion paper. Booth (2005) defined urban regeneration as ‘being singularly broad, yet encompassing physical regeneration and the development of urban projects, the restructuring of economic activity and the reconstruction of social frameworks (p258).’ In 1968 the UK Government White Paper, ‘Old Houses into New Homes’ highlighted the need for special attention to be given to areas in inner UK cities and called for a shift from renewal to rehabilitation and the recognition that certain areas were suffering more from dispersing the population as a result of worries about over crowding and that these dispersal policies had been part of the cause of the deprivation. Community development projects approached the problems of urban poverty by believing that self-help and positive discrimination measures were all that was needed to solve the issues. However, as the guidelines for deciding which areas would receive help were vague and Government departments were not necessarily supportive of the directives, the housing aid part of the urban programme failed to materialise and therefore the programme did not address housing issues of the poorer sections of the community and those most in need of the support. It was left to various agencies and government departments to view their own particular services and what they could offer to the development projects without any central co-ordination leading to more of a renaissance than revitalisation McKay & Cox, (1979). Returning to current writings, Hiller (1998) argues that the motivation to host an event creates awareness that can lead to urban transformation and in post-industrial cities the mega-event is often linked to inner city renewal and gentrification a much different terminology than that of McKay and Cox. He further writes that as a consequence of the event there is often a social class change within the event location as a by product of the displacement of the existing low income community to be replaced by high income residents and consumers, similar to the suggestions of Mace et al (2007) . What happens to the working class, where are they removed to and does that removal escalate further social problems? Locals need to know what difference the hosting of the event will make to them despite the expectations and ideals of the Government. Hiller (2000) further writes that the processes to transform urban spaces through regeneration receive little attention and that the Barcelona example of the extensive waterfront development is a prime example of these opportunities. Similarly, Manchester suffering from economic decline in a post-Fordist era, decided to bid for the 2000 Olympics and although they were unsuccessful losing out to Sydney, the impetus for the bid was transposed into bidding for the Commonwealth Games of 2002. Mace et al (2007) draw parallels between the urban regeneration seen in Manchester and Leipzig, Germany drawing on the promise of more compact, inclusive and equitable developments in these cities. Yet, the results from Manchester highlight how difficult it is to stem the population loss and to attract back into the regenerated inner city the population that relocated to suburbia, particularly families. This section of the

community is vital to maintain long-term sustainable population growth. Their studies explain the difference between renaissance, for middle classes encompassing the ‘rebirth’ of an area, raising its social status, and regeneration, for the working class, improving basic social conditions. For regeneration to work in a place like East Manchester, where incomers have more money, then the social policies needed to be reviewed and these lessons can be passed on to London. Smith and Fox (2007), write about the softer impacts of hosting large events as being the opportunities for social and economic regeneration particularly in the regeneration of East Manchester and have called it ‘event-themed’ regeneration as opposed to ‘event-led’. Smith and Fox acknowledge the criticism of regeneration polices particularly the writings of Lenskji, 2002 and also the criticism of the public expenditure often associated with the hosting of large scale events, nonetheless they discuss the specific plans designed to direct regenerative impacts. Manchester in particular left a legacy of sports facilities and partnership working. The Manchester Commonwealth Games were the first time in Britain that an ambitious legacy programme was designed specifically around a major sporting event Gratton (2005). Manchester 2002 was also an excellent example of legacy planning in terms of the regeneration and helped to demonstrate the positive impact mega sports events could have on the domestic population in terms of raising awareness and participation levels and volunteering in sport with many of the specific initiatives related to the sporting initiatives rather than the Games themselves. LONDON SITE DEVELOPMENT Given the magnitude of the London Olympic Games in comparison to the Commonwealth Games and the fact they will be based in the South East and beyond, there is little doubt of the legacies that London 2012 could bring to the country as a whole. The facilities, the volunteering programme, the infrastructure, the cultural integration and awareness must all be harnessed and focussed towards the legacy goals being set. The question arises as to whether London will see a renaissance and middle class development or true regeneration for the locals in East London and how will they get the social capital for sustainable development. The 'Towards a One Planet Olympics' report which has been written by the London Bid team, BioRegional, (who have over 10 years experience in sustainable development projects) along with the WWF details solutions for zero waste and low carbon strategies, local supply networks, sustainable transport , wildlife biodiversity and an ongoing legacy for a sustainable community (www.panda.org). The Sustainability strategy for London's 2012 Olympic and Paralympic Games will make it possibly by far the greenest Games the world has ever seen through a strategy that impressed the IOC very much with the use of independent environmental experts (www.oneplanetliving.net). Using the example of the London Docklands developments, unless certain income earners populate the area and spend their money within the local services, there risks being a narrow based economy making sustainable regeneration impossible. The social impacts can be direct improvements to the living environment of the locals as well as impacting on the spectators of the games in that they feel inspired to take part in sport and lead healthier lives. IPSOS-Mori research (2006) has shown that sport and leisure facilities are low down in the list for people’s priorities for quality of life, yet sport has been proven to have an effect on important social issues by encouraging young people to take part and thereby reduce crime and anti-social behaviour (Collins, 2003). However, it should not be forgotten that the actual hosting of a mega-event could result in a phenomena called ‘civic boosterism’ (Waitt, 2001), which has the capacity to unite polarised socio-economic sections of the community. Waitt writes that whilst civic boosterism has the power to unite and generate feelings of community pride, what actually happened in Sydney showed that support for the Games was not unanimous and that the local reactions to the Games were far more complex, especially with regard to environmental concerns. These concerns were directly linked to social class through level of education achieved. The conclusion drawn from

Waitt’s study is that the local response to mega-events is more complicated than first thought and agrees with other writers such as Fredline and Faulkner, (2000), and Ley and Olds, (1988). Mihalik and Simonetta (1999) in carrying out a trend survey of resident perceptions of the Atlanta Games, found that the residents ranked intangible benefits higher than the economic ones in terms of level of citizen support, although support diminished towards the commencement of the Games got they became more concerned about the negative benefits. The lesson for future games is that is it imperative to garner, foster and maintain community support, especially if they perceive they are not getting value for money out of the infrastructure improvements in comparison to the disbenefits. So in future organising committees must ensure funding is in place at the earliest possible stage of capital improvement projects. If support and financing are delayed, the London Organising Committee of the Olympic Games (LOCOG) may experience civic resistance to the financial obligations. Shoval (2002) believes that the growing interest in hosting mega-events such as the Olympic Games is based upon the desire to emphasise global awareness in an age of ever competitiveness between major cities in conjunction with the ensuing opportunities to fund large-scale urban construction projects. What is interesting is that the North American style of organising the Olympics relies heavily on private funding and so to carry out a direct comparison between previous games, including the American ones, is somewhat complicated by this. Business interests dictate a lot of the funding with very limited commitment from the public sector (Shoval, 2002). Also very little new infrastructure is built with significant amounts of cash being used to upgrade existing facilities and that the main stadium are often used by sporting teams after the games. The Los Angeles Games generated a profit of $200 million, not from increase in revenues but more from decreases in expenditures of the organising committee (Preuss, 2005). Interestingly, the Los Angeles Games were the first Games to use the sale of television rights and sponsorship revenues to represent the bulk of the Games budget. Since then the bulk of the IOC income has come from these two sectors (Shoval, 2002). However, in 2002 the IOC stated that they would no longer endorse or allow a city to use private funding for future Games. Hampton (2006) also looks at the lessons to be learned from the history of the North American Games and identifies some lessons he thinks would be of use to future Games organisers, yet he glosses over the funding aspects of the North American Games which negates a direct comparison with non- North American Games. The Olympic Park development will be the biggest regeneration project in Europe in 150 years with the Games and the legacy forming part of the overall plan including a network of restored waterways and new wildlife habitat. The Lower Lea Valley area earmarked for the Olympic Development is derelict and polluted land that has suffered from decades of under investment. The landscape is industrial and the surrounding communities are some of the most deprived in the country with 40% unemployment in the 5 Olympic boroughs of Tower Hamlets, Newham, Greenwich, Hackney and Waltham Forest and 50% of children live in poverty in Newham (ODA, 2006). Alarmingly the ODA report that for every stop travelled east on the Jubilee Line from Westminster to Stratford a year is lost in life expectancy. The ODA (2006) forecast that the games will result in a new town the size of Exeter being built in the Lower Lea Valley including 40,000 new homes with priority assigned to key workers, new schools, and community and health facilities. New transport links including new roads, enhanced train services, line extensions and new stations in conjunction with improvements to utility infrastructure, including a new and improved sewage system will help to provide sustainable growth and development. Stratford will become a major town and business centre (1.5 million square feet of retail space and 2 million square feet of office space) with its close proximity to the Olympic Site but also because of its improved transport network including the high speed links to the Channel Tunnel. Other transport improvements include an increase to the capacity of the Docklands Light Railway, upgrading of the Jubilee Line, upgrading other over ground

and other underground lines, all underground operations to have been refurbished by 2012 (Andrews, 2006) The project also has 50,000 new jobs planned within the Lower Lea Valley with skills related training targeting the long-term unemployed with special targeting towards Black and Minority Ethnic led businesses to encourage entrepreneurship. The five boroughs are collectively working together to build social cohesion and attitudinal change. The actual construction will create 14,000 full time equivalent jobs within the construction industry and another 12,000 jobs created as a result of the legacy development in the Olympic Park Area, this being a contribution towards the government target of 249,000 jobs planned in east London by 2016. A new employer-led London 2012 Employment and Skills Passport (LESP) has been established and is drawing up a business plan to maximise the employment benefits for Londoners (ODA, 2006) Site as it looks now and below projected development
Photos copyright LOCOG 2007 LONDON LEGACY PLANS INCLUDING REGENERATION INITIATIVES The 4 main legacy benefits of London 2012 are:
• to bequeath to the nation world class sporting facilities that become the heart of the existing communities

• to increase the sporting opportunities and also the necessary support to enable British competitions to excel across the full spectrum of Olympic and Paralympics sports.
• to drive the regeneration of east London, improving the environments of both the businesses and the local people.
• to create the largest new urban park in Europe in 150 years. (London Bid Document, 2005)
Already the British Government has announced a blueprint for Legacy that includes; (bbc.co.uk 04/04/06)
• Two new agencies to boost employment opportunities created by the Olympics • £35m to raise the skill level of workers • action to address the shortage of affordable housing • at least 60 new academies and at least 15 new sixth forms or sixth form centres • more measures to tackle crime including extending the use of anti-social behaviour
orders • building on events such as London Fashion Week, London Film festival to create a
single season showcasing the capital’s cultural wealth. The first five of these initiatives are specifically designed for the regeneration of the area in question for the benefit of the local residents and it will be an on-going issue for the Government to ensure that these initiatives are pursued as stated in the long-term. However, it is not just the Government who is accountable for creating the legacy from the games for the East End. The three major stakeholders involved are the Government (mainly DCMS), the Mayor of London and the British Olympic Association. The DCMS will have to lead all the other governmental departments and interface with other agencies and non-governmental bodies. Olympic regeneration benefits are interlinked with Sustainable Communities Plan. Governance will be a key element with clear rules and accountability being essential before any dividend benefits is operational and to this end the Mayor of London has been given Olympic-specific powers e.g. overriding some existing planning laws. The economic benefits are to be realised by The London Development Agency especially in their mission to acquire the land necessary for the building of the Olympic Park. This will include relocation those businesses and other residents from the site of the park, including the Travellers Park in Waterden Road, The Evangelical Church and the East London Bus Depot. Other players involved within the regeneration programme include the Lea Valley Regional Park Authority, The London Thames Gateway Development Corporation and the 5 local London Boroughs of Tower Hamlets, Newham, Greenwich, Hackney and Waltham Forest. For a sustainable legacy, all the objectives of the various stakeholders need to be addressed and a holistic approach taken to the development and management of Olympic Park. The regeneration dividend should become a blueprint for future Olympic cities. Felli (2004) argues that partnerships in the organising of the games will only succeed if some basic principles are adhered to; a clear understanding of each parties defined contributions; mutual confidence and understanding through effective monitoring, early identification of problems and risks, sharing information, use previous games experience, transparency, and commonality of language; competent collaborators sharing common values. THE CURRENT SITUATION AS AT MAY 2007 There is tension appearing already between region and nation in regard to the UK 2012 Olympics. The IOC commented in 2005 that they were unsure of the whole nation’s commitment to the games, but are they the London Games or the UK Games? In Barcelona they were for the benefit of the city and its inhabitants, not for the Spanish nation as a whole yet much is now being made of the whole British nation becoming involved with the structure of

the Nations and Regions group, an organisation that has not before appeared in the organisation of any previous games. Indeed LOCOG’s contract with the IOC does not contain any commitment to the rest of the UK, yet this puts LOCOG in a position to ensure that in order to fund the games in London they are not denying sporting opportunities for the rest of the country. However, if the 2012 remit of legacy is to succeed it must involve the whole country as if the Olympics can make a difference to the nation and its regions, the legacy will be even greater and possibly longer lasting. The 2012 games are going to have the biggest impact on the real estate market in London according to Grantham (2006). He believes that the key impacts will be seen in the immediate period prior to 2012. Stratford City will feel the real estate impacts the most as the surrounding area will be transformed with improved transport links, increases in office and retail, leisure and social space. He also believes that residential property prices in the area will show significant increases, Barcelona prices rose by 131% in the five years running up to 1992, compared to 83% across Spain as a whole over the same period. What will the impact of this be on the local residents and on the prices of the properties post the games, especially the key worker properties, part of the new 9000 new homes planned for the Olympic zone, mentioned in the bid document. What will happen to the ‘poorer communities’ how will they survive, will homelessness rise and unscrupulous landlords capitalise on the property rises to demand over inflation rent increases? (Olds, 1998, Calgary Games). House prices in Manchester grew by 102% in the run up to the 2002 Commonwealth Games, considerably higher than the 52% increase in the North West over the same period. CONCLUSION Legacy is important as it is not only about the ability to host the largest and most prestigious sporting event in the world; it is also about understanding how the Games will affect life in East London for future generations (Andrews 2006) and this aspect is the one that impressed the International Olympic Committee, the potential for lasting legacy. However, from lessons seen from the hosting of previous large scale events a very important positive legacy can be the opportunities for urban regeneration. The problem that arises is the form of regeneration that occurs, will it be renaissance or revitalisation and how will the ‘local’ population ultimately be affected? Will it result in the regeneration of the area or a renaissance with the area being populated by high-income city workers? The build environment needs to be practical yet exciting and one that will entice people to want to live there and raise future generations there; family units vital for long term sustainability but affordable for key workers such as teachers, nurses and bus drivers etc. Also they will need new schools, medical facilities combined with new skills to create recurring wealth to support the economy in the future. The development must support a growing and culturally diverse population including the thousands of additional workers who will be involved in the construction of the Olympic facilities. But how can it be developed to ensure that the locals also get to compete for jobs generated by the Olympics? However, leaving it all up to the Government will result in no positive urban regeneration legacy whatsoever; it must be a collaborative partnership between private, public and voluntary sectors to move beyond 2012 by developing a new approach to such mutual targets especially in the opportunities for regenerating the area for the local population of East London. These consultations will guide the development and seek to realise the potential of the development over the next 20 years through public and private investment to identify new areas for housing and services, shops and schools, health services and eventually to create new employment clusters in the area (Andrews, 2006). This discussion paper will develop in the future into a case study research project, examining previous large scale mega events and the lessons that can be taken from these events with regard to the urban regeneration opportunities for London from the 2012 Games. In addition, key in

depth interviews will be carried out with officials involved in previous large scale events that have urban regeneration as a core positive legacy of these events. The findings from the research will form the basis of a blueprint to perhaps become the ‘London’ Model of urban regeneration. REFERENCES ANDREWS, P. (2006) Gateway to the future. Locum Destination Review, 18, 14-16. BBC (2004) Blair's Plan for Olympic Legacy. UK.
http://news.bbc.co.uk/1/hi/england/london/4877306.stm accessed 12/10/06 BOOTH, P. (2005).partnerships and networks: the governance of urban regeneration ion Britain.
Journal of Housing and the Built Environment, 20, pp 257-269 CASHMAN, R. (2003) Impact of the Games on Olympic Host Cities. IN (UAB), C. D. E. O.
(Ed.) University Lecture on the Olympics. Barcelona, CEO-UAB. CASHMAN, R. (2006) The Bitter Sweet Awakening - The Legacy of the Sydney 2000 Olympic
Games, Sydney, Walla Walla Press. COLLINS, M. (2003) Sport and Social Exclusion, London, Routledge FELLI, G. (2004) Setting the stage for hosting a major sporting event. SportAccord. Lausanne. FREDLINE, E., & FAULKNER, B. (2000). Host community reactions: A cluster analysis.
Annals of Tourism Research 27 (3), 763-84 GRANTHAM, G. (2006) Capital gains? Locum Destination Review, 18, 28-30. GRATTON, C., SHIBLI, S. & COLEMAN, R. (2005). Sport and economic regeneration in
cities, Urban Studies, 42(5/6), pp 985-999 HAMPTON, A. (2006) Putting on a show -Olympic lessons from across the pond. Locum
Destination Review, 18, 31-32. HILLER, H. H. (1998) Assessing the Impact of Mega-Events: A Linkage Model. Current Issues
in Tourism, 1, 47-57. HILLER, H. H. (2000) Mega-Events, Urban Boosterism and Growth Strategies: An Analysis of
the Objectives and Legitimations of the Cape Town 2004 Olympic Bid. International Journal of Urban and Regional Research, 24, 439-458.
IOC (2002) Conclusions and Recommendations. International Symposium on Legacy of the Olympic Games, 1984-2000
IOC (2003) Olympic Games Study Commission. IN RICHARD POUND, C. (Ed.) Prague, IOC. IOC (2005) Singapore 2005: London elected as the host city for the Games of the XXX
Olympiad. IPSOS-MORI (2006) London 2012 - The Legacy Challenge. LENSKJI, H. (2002) The Best Olympics Ever? Social Impacts of Sydney 2000. New York,
State University of New York Press LEY, D., & OLDS, K. (1988) Landscape as spectacle; World's Fairs and the culture of heroic
consumption. Environment and Planning D: Society and Space 6, 191-212 LONDON BID TEAM. (2005) Official Bid Document. London, London 2012 Bid Team. McKAY, D. H. & COX, A. W. (1979) The Politics of Urban Change. London, Crown Helm
Ltd. MACE, A., HALL, P. & GALLENT, N. (2007) New East Manchester: Urban Renaissance or
Urban Opportunism? European Planning Studies, 15, 51-65. MALFAS, M., THEODORAKI, E. & HOULIHAN, B. (2004) Impacts of the Olympic Games
as mega-events. Municipal Engineer, 157, 209-220. MIHALIK, B. J. & SIMONETTA, L. (1999) A Midterm Assessment of the Host Population's
Perceptions of the 1996 Summer Olympics: Support, Attendance, Benefits, and Liabilities. Journal of Travel Research, 37, 244-248.
OLDS, K. (1998) Urban Mega-Events, Evictions and Housing Rights: The Canadian Case. Current Issues in Tourism, 1, 2-46.

OLYMPIC DELIVERY AUTHORITY. (2006) Key Benefits and Opportunities from London 2012. "Countdown to London 2012: How Will the Games Deliver for the Country?" Westminster, London, Westminster Briefing. Talk by Stephen Duckworth
PREUSS, H. (2005) The Economic Impact of Visitors at Major Multi-sport Events. European Sport Management Quarterly, 5, 281-301.
RITCHIE, J. R. B. (1987) The Impacts of the 1988 Winter Olympics on Calgary: A tourism perspective. 18th Annual Conference Travel and Tourism Research Association. Seattle, WA, USA.
RITCHIE, J. R. B. (2000) Turning 16 days into 16 years through Olympic Legacies. Event Management, 6, 155-165.
SHOVAL, N. (2002) A New Phase in the Competition for the Olympic Gold: The London and New York Bids for the 2012 Games. Journal of Urban Affairs, 24, 583-599.
SMITH, A. & FOX, T. (2007). From 'Event-led' to 'Event-themed' Regeneration: The 2002 Commonwealth Games Legacy Programme. Urban Studies, 44 (5/6), pp 1125-1143
WAITT, G. (2001) The Olympic spirit and civic boosterism: the Sydney 2000 Olympics. Tourism Geographies, 3, 249-278.
WOOD-ALLUM, D. (2006) Going for Gold. Locum Destination Review, 18, 49-50. www.oneplanetliving.net/uk/olympics.html accessed 30/05/07 www.panda.org/about_wwf/what_we_do/policy/one_planet_living/opl_projects/opl_uk/opl_uk_olympics/index.cfm accessed 30/05/07

Fourth International Event Research Conference Re-evaluating the City/Town: Events as a Catalyst for Change
MAJOR SPORTS EVENT MANAGEMENT: THE LOCAL ORGANISING COMMITTEE PRACTITIONER PERSPECTIVE - CURRENT PRACTICE & FUTURE TRENDS
Paul R Emery
School of Sport, Tourism & Hospitality Management, La Trobe University [email protected]
ABSTRACT Sport offers one of the few truly global experiences where there is universal demand to host and view intense unscripted competitive activity and emotion driven entertainment. Yet despite the many benefits of hosting major sports events and their history often dating back many centuries, there are still too many contemporary examples of financial and crowd mismanagement, ticketing fiascos, unethical practice and event fatalities. To this end, this international study investigates current and future major sport event management practice from the local organizing committee practitioner perspective. Data collected from senior event managers from 10 different countries via 46 self administered questionnaires and 5 semi-structured interviews, revealed a very experienced event management profile from which a number of critical success factors and issues affecting them now and in the future were identified. More specifically current success was reported to be based upon effective and efficient management of people, finance, media, in depth plans/contracts and ‘other’ factors. In particular practitioners believed that the symbiotic relationship between sport, the media, and finance, characterises the current landscape and provides the key issues of concern for the future. Future trends related to issues of control, increased service quality demands, greater competition, and more diverse event career opportunities. It was concluded that the global drivers of economics, technology and more recently culture are likely to directly influence the future survival and growth of some events as well as need to embrace the new era of professionalism in managing major sports events. Keywords - Major Sport Event, Management Practice, Profession
INTRODUCTION From tribal rituals and ceremonies to significant individual celebrations, events have existed for thousands of years. However, despite their very long history and meteoric growth in the last decade (Abbott and Geddie, 2001; Breakey, McKinnon and Scott, 2006), the international practice of event management is still regarded as a relatively new and immature academic field of study (Getz, 2000). Goldblatt (2000; p. 2) on the one hand believes that the event management profession is ‘confusing and lacking in credibility’ and Silvers (2003) on the other hand concludes that event management can only be described as an ‘emerging profession’, since no credentials are required to practice this complex and responsibility-laden activity. Without academic, government or occupational licensing standards, “professional” status is suspect and subject to degradation by the actions of untrained and inexperienced practitioners. This has led Emery (2001) and Silvers (2004) to assert that the event industry is sometimes more renowned for its unenviable record of incidents than professional management. No more is this apparent than with reference to recent major sport incidents around the world that have included;
• Ticketing fiascos - 2006 World Cup Football; 2007 Ashes

• Crowd problems - 2007 Australian Tennis Open - ethnic riot; 2007 Police death in Italian football league
• Legal problems - 2003 Prosecution of a New Zealand event organiser for criminal negligence due to a participant death
• Financial problems – 2005 Malaysian Professional cycling tour debts of more than one million US dollars; London 2012 Olympic costs could be underestimated by as much as 830% (Hammond, 2007)
• Weather related problems - 2006 Sydney-Hobart yacht race - crew rescued by soldiers; 2007 Australian Tennis Open - heat related incidents
• Other – 2006 Commonwealth Games – Defection of Sierra Leone asylum seeking athletes; 2007 World Netball Championships problematic search for a host for this year’s world championships.
More importantly it is not just the nature of these problems, but the fact that so many appear to be a recurrence of previous incidents. In referring just to the universal sport of football, crowd management problems have been an ongoing concern that has existed for at least forty years. Emery (2007) for example reported that since 1964 more than 1000 spectator deaths and 1000 injuries have occurred, which equates to an average of 28 spectator deaths per year over a 40+ year period! Clearly this is unacceptable and there is a need to better understand what is known about major sports event management both in theory and practice. Whilst much has been written about event management theory (Jago and Shaw, 1998; Getz, 2005; Goldblatt, 2005) there is virtually no in-depth review from the major sports event manager practitioner perspective. Who manages them and why are they so difficult to manage? What does current practice entail? What are the current concerns and trends of the future? Against this background this research set out to address the following aims;
• to examine the profile and skills of major sports event organisers • to identify current management practice in planning, and to ascertain the critical
success factors and issues affecting current major sport event organisers • to determine future trends of managing major sports events
Conceptual Framework and Sports Event Management Environment What constitutes an event? There are probably ‘as many definitions of events as there are event texts’ (Brown and James, 2004; p.54). Event typologies are equally plentiful in the literature. For example, events have been categorised according to their purpose, geographic location, appeal, theme, scale, as well as degree of economic impact (Walsh-Heron and Stevens, 1990; Getz, 1991; Hall, 1992; Richards, 1994; Jago and Shaw, 1998; Gratton, Dobson and Shibli, 2001). However, Doyle (2004) argues that it is their scale and theme that often provide the distinguishing features that make them so difficult to manage. A review of the literature reveals that there is some consistency that ‘special’ or ‘planned’ events can be subdivided into the scale categories of major and minor events (Masterman, 2004). But the nature of exactly what these categories and sub-divisions include is currently unclear. Major events have sometimes being regarded as being synonymous with hallmark events (Ritchie, 1984); being smaller (Bowdin, McDonnell, Allen and O’Toole, 2003) and larger (Breakey et al, 2006) than hallmark events; being the umbrella term for hallmark and mega events (Masterman, 2004); and in the case of UK Sport (2007) being the umbrella term to include mega (e.g. FIFA World Cup), calendar (e.g. the Wimbledon Tennis Championship), one-off (e.g. Cricket World Cup), and showcase events (e.g. World Judo Championships).

Given such different interpretations, this study has decided to adopt the latter classification system since it is the only one that provides both an international standard of comparison and a sport specific theme focus - namely;
• involving competition between teams and/or individuals representing a number of nations
• attracting significant public interest, both at home and overseas, through spectator attendance and media coverage
• the event being of international significance to the sport(s) concerned (i.e. World, European or Commonwealth level), and features on their international calendar
UK Sport (2007)
However, it is not just the scale that creates management complexities it is the specialist nature of sport and its unique industry organisation that differentiates it from managing so many other types of major events. It is on this basis that major sports events, with their large, pulsating, temporary and volunteer dependent workforce (Hanlon & Jago, 2000 and 2004) have been described as some of the most complex projects imaginable (Emery, 2003). For practitioners at the local organising committee level this often means working with more than 1000 different organisations ‘in a time-bound, low level contractor role …. in an environment of working with relatively unknown people and numerous organizations, often with very different agendas.’ (Emery, 2003; p.276) Sport, with its original foundations in amateur and voluntary participation, has in many cases entailed managers consisting of ex-performers who have entered into sport management positions once their playing careers are over. They largely have no formal management training/experience behind them and Rubingh (1993) suggests that they learn their management trade by trial and error learning. As illustrated in Figure 1, this he refers to as the ‘subjective concept of management’, which can also be achieved by undertaking a theoretical qualification in a management oriented subject that entails limited or no practical experience.
Figure 1 Management Education (adapted from Rubingh, 1993)
PRACTICE
THEORY
SUBJECTIVE CONCEPT OF MANAGEMENT
PROFESSIONAL WORKING CONCEPT OF SPORT
MANAGEMENT
PRACTICE
THEORY
INTEGRATION REFLECTION

More recently and with the proliferation of undergraduate and postgraduate qualifications around the world, more integrated and specialist sport management degrees have become available. Progressive and developmental educational programs that involve integration of theory and practice as well as reflection over time, are what Rubingh (1993) suggests are the ideal education of managers which he refers to as the ‘professional working concept of sport management.’ Westerbeek and Smith (2003) similarly review the past as well as future sport management environment and suggest a sport society evolving from tribal, through to pleasure needs and the current environment of a gratification society. Their predictions for the future are that the next phase will be a dream society, where emotional needs will need to be met possibly through technological advances, followed by the imagination and then ultimate spiritual societies respectively. Accompanying these developmental societies they assert that sport management is also moving from trial and error management, through commercial and media influenced management, to its current format of more global, accountable and partnership oriented management practice. Driven by the current nexus of economic, technology and cultural influences they further suggest that greater complexities will be encountered than ever before and this will require unprecedented standards of management professionalism. This appears to be mirrored in the event management literature where a number of authors have commented that the events industry nationally and globally is slowly becoming more professional (Silvers, 2003; Harris, 2004) in their actions. But to date no one appears to be claiming that event management is even close to warranting the status of a legitimate profession unlike that of the medical and legal professions. Indeed O’Toole (2002) makes the comment that ‘The event industry is perhaps the only industry that allows anyone to work, be in charge of up to 100,000 people, volunteers and staff in a public area, without any type of proof of their competency.’ Progress towards the establishment of an event management profession has begun with the emerging international and independent proposal of an ‘event management body of knowledge’ (International EMBOK Executive, 2007). However this has started at a conceptual and knowledge domain level, where ‘considerable confusion regarding scope and definitions’ remain (International EMBOK Executive, 2007). Concurrent with this development, the attention of focus could also address the analysis of contemporary industry practice. For example, one aspect that may demonstrate professionalism in the marketplace is the degree to which planning takes place. As highlighted by Watt (1994; p.14); It is always a little dangerous to select one management function rather than another, but in terms of event organization, it would appear quite legitimate to select planning as the prime factor of success…. Planning is so valuable because it reduces uncertainty; focuses attention on goals and produces unity of purpose; makes for efficient operation; and ensures appropriate control systems are established. Furthermore, in a major sports event management context of so much uncertainty, temporality uniqueness, and complexity of stakeholder involvement, planning is considered to be so fundamental to event management success (Westerbeek et al, 2006). What types of plans are used in practice and are they written down (formalised). Why, why not? In summary, major sport events have evolved from largely reactive amateur trial and error practices to more accountable and business oriented practices. Despite contemporary management entering a more professional era, event management per se still lacks credibility (Goldblatt, 2000) and this will continue until its unenviable record of disasters cease. Given this scenario, this study intends to further explore and better understand the current and future major

sport event management scenario from the local organising committee (LOC) event manager perspective. METHODS Since the total population frame of practitioners was considered to be all major sports event organisers in the world, sampling became a necessity. In the absence of any known major sports event database, the sample frame was based upon the sport event management scenario of England – originally the researcher’s home country. Namely, of the 92 different recognised sports existing in England this study focused on just the 20 priority sports of Sport England (2006). Furthermore given the need to gain access to a widely dispersed geographical population a mailed questionnaire was deemed to be the most appropriate research tool to initiate this data collection. In light of virtually non-existent empirical data collection on LOC event management practice and to ensure practical relevance, the questionnaire was designed in consultation with two major sports event organisers from England. Loosely based on the work of Torkildsen (1994 – key features of successful event organisation) as well as Hawkins and Goldblatt (1995 – event management skills) the questionnaire contained both closed response and open ended questions relating to the manager’s background (academic qualifications, event training, experience and skills) and current management practice (event planning, critical success factors, concerns and issues). It adopted a logical progression developing from basic data (event management background) to more qualitative data (event opinions). The England questionnaire sample constituted 30 sport governing bodies (the event owner/sanctioner), the increased number being due to some sports possessing more than one governing body, and 56 of the largest public sector organisations (venue host) in England. This was determined by including all of the London and Metropolitan boroughs as well as other public sector organisations who were known to have hosted a major sports event in the last three years. Using the annual and internationally attended European Association of Sport Management conference, other non-England major sport event organisers were identified creating a similar overseas sample frame. Drawing upon delegates from 30 different nationalities snowballing sampling permitted 95 contacts to be established representing the priority sport governing bodies as well as major sport event venue hosts from around the world. The second phase of data collection involved in-depth interviews. These were used to focus more specifically on future trends and management practice, as well as tease out some of the issues that emerged from the questionnaire findings. Such questions for example included ‘what likely trends do you envisage in the future management of major sports events’; ‘how might some of these trends affect managers’; as well as opinion questions focussed on the readily identified case study of the Olympic Games e.g. ‘Do you believe that some mega events such as the Summer Olympic Games are becoming unmanageable?’ (Probed by solutions as to why and if yes, what might be realistic solutions to illustrate future trend application). Interviewees were selected from the returned questionnaires purely on the basis of all those that were located within a 50 mile radius of the researcher. This constituted five face to face interviews that provided a richer and more in depth qualitative basis on understanding current and future event management practice. Quantitative data was then analysed using a computer statistical package and all qualitative data themed and coded manually. RESULTS Respondent Profile and Skills of Major Sports Event Organisers
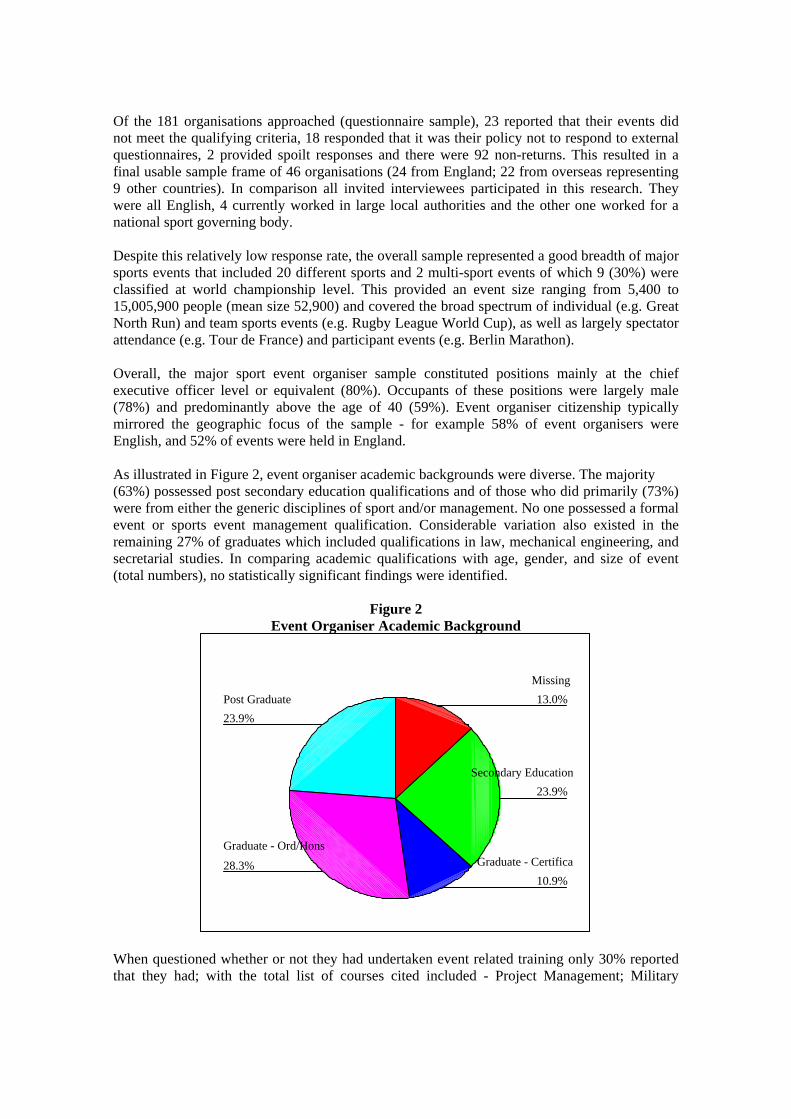
Of the 181 organisations approached (questionnaire sample), 23 reported that their events did not meet the qualifying criteria, 18 responded that it was their policy not to respond to external questionnaires, 2 provided spoilt responses and there were 92 non-returns. This resulted in a final usable sample frame of 46 organisations (24 from England; 22 from overseas representing 9 other countries). In comparison all invited interviewees participated in this research. They were all English, 4 currently worked in large local authorities and the other one worked for a national sport governing body. Despite this relatively low response rate, the overall sample represented a good breadth of major sports events that included 20 different sports and 2 multi-sport events of which 9 (30%) were classified at world championship level. This provided an event size ranging from 5,400 to 15,005,900 people (mean size 52,900) and covered the broad spectrum of individual (e.g. Great North Run) and team sports events (e.g. Rugby League World Cup), as well as largely spectator attendance (e.g. Tour de France) and participant events (e.g. Berlin Marathon). Overall, the major sport event organiser sample constituted positions mainly at the chief executive officer level or equivalent (80%). Occupants of these positions were largely male (78%) and predominantly above the age of 40 (59%). Event organiser citizenship typically mirrored the geographic focus of the sample - for example 58% of event organisers were English, and 52% of events were held in England. As illustrated in Figure 2, event organiser academic backgrounds were diverse. The majority (63%) possessed post secondary education qualifications and of those who did primarily (73%) were from either the generic disciplines of sport and/or management. No one possessed a formal event or sports event management qualification. Considerable variation also existed in the remaining 27% of graduates which included qualifications in law, mechanical engineering, and secretarial studies. In comparing academic qualifications with age, gender, and size of event (total numbers), no statistically significant findings were identified.
Figure 2
Event Organiser Academic Background
23.9%
28.3%10.9%
23.9%
13.0%Post Graduate
Graduate - Ord/HonsGraduate - Certifica
Secondary Education
Missing
When questioned whether or not they had undertaken event related training only 30% reported that they had; with the total list of courses cited included - Project Management; Military

Experience; Sport & Television; Management Development; Health & Safety at Pop Concerts; Scottish University Golf Team (!). In comparison, respondents reported abundant previous event experience, with 66% of the sample citing more than 5 events, and many recording a very high quality and quantity of event experience. One person’s experience for example included two World Wrestling Championships, a World Student Games, two Commonwealth Games as well as a long list of many other events. Similarly, impressive quantitative examples existed - ‘300 national/various events since 1990!’ and another made reference to ‘100 events/year - 25 years’. Such findings were further confirmed when respondents were asked to quantify their level of experience in managing major sports events (mean = 5.4; where 1 = very low and 7 = very high). 78% described themselves as possessing more than average experience (4-7), and 64% reporting classifications of 6 or 7 (high/very high experience levels). As is evident from Figure 3, all event management skills as identified by Hawkins and Goldblatt (1995), were considered to be important.
Figure 3 Means of Event Management Skills (1 = Non Essential → 7 = Essential)
Information Tech.LeadershipInterpersonalMarketingCoordinationAdministration
MEA
N IM
PORT
ANCE
SKILLS
7.0
6.0
5.0
4.0
3.0
2.0
1.0
Coordination skills were the highest valued (mean of 6.6), but all scored very high values, with the exception of information technology (IT) skills. On the other hand, at least three respondents added that IT skills were presently not essential, but they would become increasingly important in the not too distant future. Other valued skills that were added to the list were - creativity/innovation, politics/negotiating, protocols, planning, flexibility, decision making, communication, team-work and knowledge of foreign cultures. Current Practice – Planning, Critical Success Factors and Issues Affecting Major Sport Event Organisers In identifying current usage of different planning techniques, Table 1 summarises the percentage usage of specific planning techniques. From such findings it is apparent that the most widely used planning techniques are the financial plan (90% used), followed by the

marketing plan (80%). Conversely, the most under utilised plan was the feasibility study, with 60% of respondents not using them.
Table 1
Type of Plan Used
TYPE
NO
USAGE (%)
FORMALISED
(%)
DEPTH OF
FORMALISATION (MEAN*)
Financial Plan Marketing Plan Technical Plan Crowd Control Plan Master Plan Time Plan Human Resources Plan Crisis Management Plan Bidding Plan Feasibility Study
38 40 39 39 39 40 40 40 40 40
90 80 75 72 69 68 65 63 43 40
97 94 90 96 93 93 93 92 89 88
5.9 5.4 6.0 5.8 6.1 5.4 5.4 5.9 5.3 5.1
* 1 = Basic → 7 = Detailed Further cross tabulations were established between planning technique usage and organisation sector, inaugural year, event status, and event nature. The only significant differences identified were that;
• public sector organisations were less likely to use a bidding plan than other organisations (Kruskal-Wallis/Jonckheere trend - 8.478; p<0.04)
• events held for the first time, were more likely to use a technical plan than other events (Kruskal-Wallis/Jonckheere trend - 1.829; p<0.04).
Once used, the respective plans were nearly all formalised (minimum of 88%), and their depth of detail was minimally scored at 5.1 (utilising means, where 1 = basic → 7 = detailed). The most detailed plan appears to be the master plan (6.1) and then the technical plan (6.0). Other plans used and formalised, but not included in the categories presented were the - medical, transport, administration, media and catering plans. Overall, 93% of respondents believed that their planning for their respective event was above average - the mean being 5.8, and the mode being 6 (where 1 = under planned, 4 = average, 7 = over planned). No one reported anything less than average planning, but 16% believed that their event was over planned. Applying statistical analysis to overall planning and event status, nature, organisation sector, free entry, inaugural year, location, age, gender, and levels of investment, innovation, risk and complexity, the following statistically significant findings were noted;
• the greater the level of innovation, the greater the level of overall planning (t-test -3.269; p<0.01)
• events with histories of more than 50 years, scored their overall planning levels higher than younger events (Kruskal-Wallis/Jonckheere trend - 11.097; p<0.05).
DISCUSSION Profile of Major Sports Event Organisers

This very experienced profile of sampled managers seemed to suggest that Rubingh’s (1993) ‘subjective working concept’ of sport management exists. Current event management practice appears to be dominated by ‘hands on’ learning, with education and training, not necessarily event management related, offering only a peripheral yet supportive role. Only 30% of respondents reported that they had attended any event related training courses. Such findings may perhaps be explained by the age and seniority of the managers ~ namely, younger and more junior positions may have experienced a greater opportunity structure of event management specialist education and training courses that have become available in the last few years. On the other hand, these senior managers although reportedly aware of them, did not seem particularly inspired by the range of current courses available criticising the relevance, the practical application, the depth of detail, the cost, and often the lack of facilitator/presenter’s event management experience. Typical major sports event management comments included;
• ‘There are some really good introductory event management courses appearing, but they do not understand the complexities of sport. (Interviewee 1)
• ‘Where do you find the time to attend and who pays – the event organiser wont they pay you to be the expert and to do the job’(Qu. Respondent 3)
• ‘Fundamentally, we base our knowledge on our own personal experiences and networks.’ (Interviewee 3)
• Academics are unfortunately on a different planet to practitioners … theory is very different from ‘hands on’ practice.’(Interviewee 4)
The general opinion appeared to be that practitioners supported the principle that some introductory event education/training was valuable but also added that ‘expectations of undergraduate students were totally unreasonable’ (Questionnaire Respondent 21) and ‘an apprenticeship in the work place as well as working on a number of different events is essential before any responsibility can be given.’ (Qu. Respondent 6). Despite Goldblatt (2005; p.368) arguing that ‘Event Leaders must continually develop their skill sets’ most appear to be doing this via experience in the working environment and not necessarily via the ‘150 colleges and universities throughout the world offer[ing] curriculum, certificates, and/or degrees in the Event Management-related studies field’ (Goldblatt, 2005; p.369). Of the skills particularly valued in the industry, the findings seem to concur with Hawkins and Goldblatt (1995) where, coordination, leadership, interpersonal, marketing, administration and information technology were all considered essential. Coordination and leadership skills were regarded as particularly vital in all sports event management positions endorsing the perspective that they have to manage a diverse range of stakeholders and networks in the major sports event scenario (Westerbeek et al, 2006). Current Management Practice Reporting on current practice, the findings highlighted that all managers believed that their major events were well planned, although given such positions of authority, who is perhaps likely to suggest anything to the contrary? Some even suggested via the questionnaires that they over planned certain aspects of the event. Where plans were not written down (formalised) respondent comments to justify their actions included;
• ‘We are talking here of an organisation that has evolved for 80 years’ (Interviewee 2) • ‘This makes the event look terribly disorganised – unplanned and ad hoc. The truth is
all the systems, formal and informal have developed over 16 years, and with one exception, the management team is the same as 1981.’ (Interviewee 4)
Perhaps it is a little surprising that feasibility and bidding plans were infrequently used and commenting upon the statistically significant findings, that public sector organisations use

bidding plans less than other sectors. Major events usually entail substantial investments and cash flow problems at the start of the project and it would appear that an early understanding of the level of uncertainty, risk and complexity would aid in the determination of the project scope and ultimately final success (Westerbeek et al, 2006). As to the reasoning that public sector organisations are less likely to use bidding plans than others, why this is the case is unclear. Given that the public sector is dependent upon tax payer money, it might be expected that bidding plans are more frequently used by this sector where greater levels of transparency and accountability are often seen. Perhaps these findings reinforce those of Emery (2001) who found that bidding to host a major sports event was often based more on personal and political conviction than of careful appraisal of merits. On a positive note nearly all events consider as a priority using a financial plan, perhaps suggesting that the financial bottom line drives so much of major event management practice today. Similarly, the statistically significant findings that inaugural events were more likely to use a technical plan than other events (greater complexities in the first instance), that innovative events report greater levels of planning, and that older events are likely to demonstrate greater depth of plans (developed over time), all appear sound rational management practice and common sense. Derived from the questionnaire data on critical success factors and current issues, it is apparent that practitioners believed that contemporary success depends principally upon effective and efficient management of people, finance, the media, in depth plans/contracts, and ‘other’ factors. In briefly reviewing each in turn, it is evident that the importance of people has long been recognised in the general management, project management and event management literature (Goldblatt, 2005). Respondents referred to the full spectrum of staff, as can be exemplified by the following comments - ‘Quality of the 5000 temporary staff’(Qu. Respondent 16); ‘We are as safe as the most stupid/ignorant person with responsibility’(Qu. Respondent 23); ‘Importance of having the best skilled/experienced people’(Qu. Respondent 26); ‘Nurturing volunteer commitment’(Qu. Respondent 31). Continued reference to volunteer management must not be underestimated. In an environment where financial rewards appear to be the main driving force behind work involvement/commitment, the focus upon volunteer needs (team and individual) rather than just task outcomes, will need to become a management necessity if safe quality events are to be the norm of the future. As previously introduced, economic arguments and concerns similarly dominated current practice findings. As a fundamental decision in hosting major sports events, manager comments emphasised the need to ‘dramatically improve the accuracy of estimating budgetary components’ (Qu. Respondent 8), as well as being able to provide more timely control and coordination of financial data. But in general, practitioner concerns centred upon gaining more money to underwrite the escalating event costs. With the dramatic costs of security post September 11, for example Athens Olympic Games spent £650 million (Hammond, 2007), respondents reported that present and potential sponsor relationships have become even more essential, as have the necessity for multi-national partnerships. With the substantial amounts of money now required to host a major sports event, innovative bidding partnerships are for example starting to prevail, and no more is this apparent than with the UEFA Euro 2008 bid where one joint bid included the four Nordic countries of Denmark, Finland, Norway and Sweden. A further very important stakeholder in the current landscape of major sports event production was identified as the media. Whilst practitioners recognised their importance, their concerns focussed upon their increasing power and control - ‘Media are essential, but they are now interfering with the sports product’ (Qu. Respondent 2); ‘We’re now facing increasing control/demands of TV’ (Qu. Respondent 6); ‘Entertainment motives are dictating the sporting

competition’ (Qu. Respondent 30). Whilst a symbiotic relationship has existed for more than three decades between sport, the organisations that provide finance, and the media, it has always been sport that has dominated the tripartite relationship. However, event organisers are now waking up to the growing realisation that media and finance organisations are beginning to buy and control sports events either in partnership or alone, resulting in a decreasing sport power base. This more complex relationship involving more stakeholders and greater organisational commitments to major events have also meant that planning and formalised documentation are now even more important than past decades. Given the complex framework of legal rights and litigation surrounding sport (Ammon, 2004), it is increasingly being recognised that planning is the fundamental requirement to any successful event, and that attention to detail is critical no matter how mundane (Goldblatt, 2005). As one manager reported ‘Specifications increased as did the risks; new methods of management and approval are now minimally required’ (Interviewee 2). Another commented ‘we have now reached the stage that there is greater morality, law and ethics in event management’ (Interviewee 4). However, this additional attention to detail and increased accountability has come at some cost. Emery (2007) for example cites practical examples of 15 hour working days being the norm so much so that Goldblatt (2005) suggests that an event management career is now unfortunately renowned for its very long work hours as well as high degrees of burnout. Some of the additional concerns expressed by the practitioner respondents were ‘other’ factors that perhaps were perceived to be difficult to plan and control. Interestingly, a number highlighted the importance of being able to manage weather extremes, as a critical success factor of an event. Technological developments are assisting here, such as snow cannons, artificial surfaces, and temporary convertible stadia (e.g. 2007 World Swimming Championships), however it is through the developments in risk management, contingency and incident planning, that these concerns are perhaps now being addressed. This has led to the development of more specialist knowledge and management training being introduced to the major sports event industry, particularly in the areas of security and crowd management (Abbott and Abbott, 2000; Doukas, 2005), project management (O’Toole, 2000; Silvers, 2004), and more sustainable management practices (Essakow and Bound, 2006). Future Trends and Management of the Largest Sports Events Increased media and sponsorship control were the most frequently reported future trend to affect major sports event organisers. In particular, the focus of comments were on the media aspects of the sport, money, media tripartite relationship, where the technological advances were perceived to be already revolutionising the sports event industry. Through television deregulation (e.g. pay per view, broadcast sponsorship) and significant technological developments (internet, digitisation, wireless technologies), the media, as the significant ‘enabler’ of global mass communication, appeared to be increasing its considerable power in the tripartite relationship. As one manager commented ‘opportunities created by broadcast sponsorship and virtual screen image transfer, have meant that many sponsors are turning directly to media sponsorship, rather than those offered by the sports event/facility’ (Interviewee 2). The direct affect of this has been that the exclusive attraction that sponsorship offered sport is slowly being eroded. ‘Ambush marketing has similarly created information clutter as well as greater competition, and thereby reducing the exclusive earning potential of sports governing bodies and/or local organisers’ (Interviewee 3). At the same time, event organisers reported that they are incurring greater expenditure costs, on a broader array of ‘essential aspects’ such as health and safety measures, as well as staff training. The question therefore arises as to the financial viability of those hosting and managing major sports events, now and in the future.

Sport is and always has been the key ‘content’ provider of the tripartite relationship, but what of the future? Participant concerns were expressed that any one of the three parties could now implement a fully integrated vertical growth strategy, whereby they could independently control both major sports event production and distribution. Examples of this are already being seen around the world - Murdoch’s global media empire controlling the professional sport of rugby league (Stevenson, 2007); Manchester United establishing their own pay per view channel; the Amaury Sport Organisation - a private company controlling all aspects of the production and distribution of the Tour de France; and Foxtel taking over more AFL matches from free terrestrial television (Ricketson, 2007) However, such examples also demonstrate the business and economic bottom line focus as well as the strong global market forces facing the major sports event manager. High profile events in high profile sports are likely to dramatically strengthen their global image and power, resulting in the search for even greater commercial/business profits/opportunities. By contrast, lesser sports and lesser events are likely to face even greater financial realities, with no guarantees of any television coverage, fewer sponsorship opportunities, and less chance of survival in the future. This was exemplified with one manager referring to the sport of netball in England, where the national governing body ‘had to spend their own money to televise their own event, with the vague hope that a broadcaster would take up their production’ (Interviewee 4). Greater competition will therefore exist between sports and within sports, each vying for more extensive media coverage. On a positive side, the increased media opportunities and global demand for more sports analysis and coverage, was perceived to mean ‘a broader and greater depth of career opportunities in sport event management’ (Interviewee 5). For example, it was envisaged that in the future, ‘new event technology positions will evolve to provide ever increasing spectacular effects’ (Interviewee 2), and major multi-nationals such as Coca Cola and Nike, will employ dedicated event managers to meet their own global sports entertainment and image needs. Why should they pay the large escalating sponsorship costs for event involvement, when they could use such monies to create/control a global sports event that can attract their own sponsored world’s best performers? This will in turn perhaps mean that sports event management competence will be at a premium, and a very competitive environment will operate in the future, possessing no place for complacency. Further demand for sport event training/education qualifications will be required, as will be the employment of specialist event agencies, such as Nova, a UK private sector organisation who are internationally renowned for the management of road running events offering the full remit of management, television, training, clothing products and services all under one roof. Furthermore, given the global trends identified by Westerbeek and Smith (2003) major sports events are likely to broaden their global, emotional and cultural appeal, with the result that the truly mega events are likely to be introduced more frequently, with more ‘world series’ sports events becoming the norm. Respondents reported that as the affects of globalisation become more entrenched and more sport competitions take place at the world level, national pride, as well as cultural and religious identity will become the source of much argument and conflict. These additional and very sensitive conflicts will need to be very carefully managed in the future. Westerbeek and Smith (2003) similarly assert that the current nexus of economic, technology and cultural drivers will create global networks and greater international complexities to be managed including potential event diary clashes. Live media coverage will then really be a sort after commodity, and mega events such as the Olympic Games, will perhaps not be about citius, altius, fortius, but about a select few media driven organisations/events/sports who are stronger, bigger, and considerably richer than the rest.

This raises further questions, namely of how big can mega events grow, or are they in fact already unmanageable in their present form? In using the Olympic Games as a case study focus, the findings revealed a diversity of management opinions on such topics. Those who suggested that they were unmanageable, claimed that ‘The Olympics are trying to be all things to all people’ (Interviewee 1); ‘History and philosophy are not compatible with rational management’ (Interviewee 2); ‘Money has precedence over the dictates of the planners!’ (Interviewee 2); ‘Olympic Games is massive - considered as 26 different games … Olympic Games choke themselves with people’ (Interviewee 4). Conversely, those that proposed that they were manageable, supported their views by elaborating that ‘Effective management is the key - scale of event shouldn’t make any difference’ (Interviewee 3); ‘The appointment of the best people, to be in charge of the different areas of responsibility, with a simple chain of command, should ensure the success of any sporting event - subject to overall financial status!’ (Interviewee 5). Interestingly, organisers with the largest events in this study all suggested that they were in fact manageable. But perhaps it is from both sets of comments, that future solutions can be proposed both for improved management at major sports events as well as the event industry in general. For example, in the case of the Olympic Games, complexity appears to be created by the number of organisations/people involved, the unique team established for each one off event, along with the infrastructure required at a different location at a particular moment in time. Product solutions suggested include, reducing the number of sports, the number of competitors, the timetable of events, and the usage of the same location each time. However, perhaps the most acceptable solution that would permit further growth and embrace the current nexus of economic, technology and cultural drivers is that of increasing the number of locations involved over a wider geographic remit than at present. Given the global technological advances it is possible that the Olympics could be awarded to a continent rather than a country, and various events could take place in different countries all linked by technology. Whilst the complexity of managing and coordinating more organisations around the world would initially be very difficult, it could be argued that this development of the Olympic Games could be the start of a more coherent event body of knowledge where best practice/expertise could be recorded, shared and developed into a more unified system than at present. Rather than change the unique hosting team for every event, continuation mechanisms and skill enhancement programmes could additionally be implemented for more effective and sustainable management of future events. Full time positions could be established, either within the international and/or national sports governing bodies who own or sanction the current portfolio of major sports events. This would in essence, make the chain of command shorter, and ensure that the best people are employed to optimise sport for sports sake objectives, rather than purely for commercial and media gain. Indeed and as elucidated by one respondent ‘sporting experience is essential: this isn’t a conference, it’s a forum in which players play and performers perform. Their needs are paramount’ (Interviewee 2). In summary, the practical implications that have been identified by this particular practitioner review suggest that sports events have developed from largely amateur domestic management origins into global major events demanding highly professionalized management practice. However given the traditional volunteer nature of sport and its unique yet complex network management requirements, educational and sport event management career pathways have not yet been fully established nor accepted. The findings of this study, which need to be further replicated and challenged, provide some initial practitioner insights into the demands, concerns, and future trends of the industry. It is from this knowledge that more relevant and useful educational programs, in terms of content, delivery, and assessment, can be better constructed,

implemented and reviewed. Accompanied by more focussed practitioner driven research, a more professional and respected event management industry can be established. However, as suggested by Harris (2004; p. 108); the seeking of professional status is one that has no definite conclusion …. The hardest things to achieve – unity and a common sense of purpose – are [still] yet to emerge. CONCLUSION AND IMPLICATIONS In the light of minimal practitioner research on current practice of major sports event management, the purpose of this international study was;
• to examine the profile and skills of major sports event organisers • to identify current management practice in planning, and to ascertain the critical
success factors and issues affecting current major sport event organisers • to determine future trends of managing major sports events
Whilst this exploratory research ambitiously attempted to gain data from an international practitioner perspective and often from very busy senior management personnel it clearly possessed a number of limitations – namely that the;
• methodology was driven by a UK sport related focus towards event management and participants needed an ability to communicate in the language of English
• questionnaire reflected a low response rate • interview sample was small and limited to just a local UK convenience sample
However despite these often common limitations to empirical data collections, the findings reveal that the sample illustrated a profile of very experienced, yet not specifically highly trained or qualified managers. Largely evolving from trial and error learning by committed managers, the major sports event management operating environment within the last thirty years has become more commercialised, media driven, accountable, international and professional. Current event management success at the local organising committee level was reported to be based upon the critical success factors of effective and efficient management of people, finance, media, in depth plans/contracts and ‘other’ factors. In particular, the symbiotic relationship between sport, the media, and finance, epitomises the current landscape from which the industry has both evolved and will develop. Sport is currently at the centre of this tripartite relationship, but with opportunities for vertical integration strategies, practitioner concerns were expressed as to how much power and control global media (technology) and sponsors (economics) will have in the future. Driven by globalisation and the key drivers of economics and technology, practitioners are concerned as to the future survival of many sports events. With an increased expectation of safety, accountability, transparency and global competition, the financial viability of hosting sustainable events is now being questioned. Furthermore, as more nations engage with sport, greater complexities, such as cultural differences, need to be understood and better managed. Whilst this was reported to provide a growth industry with broader and more specialist career paths it also assumes improved knowledge, processes, techniques and a more developed professional education/training environment. However despite local organising committee practitioners being very experienced and professing to use more formalised and extensive plans in comparison to the past, there appears to be an air of complacency given the fact that there are still so many incidents of management malpractice across the world. Practitioners were also found to not be overly inspired by the type and practical accessibility of current education and

training opportunities. Practical implications that derive from these findings include the development of;
• more professional, practitioner relevant, industry based event management education activities and career pathways
• independent and professionally accredited national or international licence(s)/qualifications pertaining to different levels and areas of sport event management practice
• a medium to share good/best practice and benchmarking minimum standards of acceptability
• closer integration between academic and practitioner research perspectives If as the practitioners suggest, sport is to remain the core of the major sports event product/service, then international and national sport governing bodies must take greater responsibility towards professional development of their event managers and fully embrace the economic, technology and cultural drivers of the 21st century. At the same time, there also appears to be the beginnings of coordinated developments in the broader conceptual framework of an emerging ‘international event management body of knowledge’ (International EMBOK Executive, 2007). While this is not targeted specifically at major sports event managers, or focussed just yet on event management standards, training, or competency assessment, this may provide the future forum from which major sports event managers can develop professionally and confine the high frequency of malpractice to one of history. REFERENCES Abbott, J.A., & Abbott, S.M. (2000), Event management: Minimising liability through effective
crowd management techniques. In Allen, J., Harris, R., Jago, L.K., & Veal, A.J. (2000), Events beyond 2000: Setting the agenda. Proceedings of the 2000 Event Evaluation, Research & Education Conference. Australian Centre for Event Management.
Abbott, J.L. & Geddie, M.W. (2001), Event and venue management: Minimizing liability through effective crowd management techniques, Event Management, 6, 259 -270. Ammon, R. (2004), Sport facility management: organizing events and mitigating risks, Fitness
Information Technology. Breakey, N., McKinnon, S., & Scott, N. (2006), Special event evolution: The schoolies festival,
Proceedings of the 2006 Global Events Congress, Brisbane. Bowdin, G., McDonnell, I., Allen, J., and O‘Toole, W. (2003), Events management,
Butterworth – Heinemann. Brown, S. & James, J. (2004), Event design and management: ritual sacrifice? In Yeoman, I.,
Robertson, M., Ali-Knight, J., Drummond, S., & McMahon-Beattie, U. (2004). Festival and events management: An international arts and culture perspective. Elsevier Butterworth-Heinemann.
Doukas, S. G. (2005), Crowd management: Past and contemporary issues, The Sport Journal, 9/2.
Doyle, S. (2004), Merchandising and retail ,In Yeoman, I., Robertson, M., Ali-Knight, J. Drummond, S., & McMahon-Beattie, U. (2004). Festival and events management: An international arts and culture perspective. Elsevier Butterworth-Heinemann.
Emery, P.R. (2001), Bidding to host a major sports event: Strategic investment or complete lottery? In Gratton, C. & Henry, P. (Eds), Sport in the city: The role of sport in economic and social regeneration. Routledge.
Emery, P.R. (2003), Sports event management, In Trenberth, L. (Ed.) The business and management of contemporary sport. Dunmore Press.

Emery, P.R. (2007), Major sports event management: the practitioner perspective – where have we been and where are we now? Paper submitted and accepted for 2007 British Academy Management Conference.
Essakow, M., & Bound, O. (2006), One planet living, one planet economics, one planet business: Reducing the ecological and carbon footprint of events, Proceedings of the
2006 Global Events Congress, Brisbane. Getz, D. (1991), Festivals, special events and tourism, Van Nostrand Reinhold. Getz, D. (1997), Event management and event tourism, Cognizant Communication Corporation. Getz, D. (2000), Developing a research agenda for the event management field, In Allen, J.,
Harris, R., Jago, L.K., & Veal, A.J. (2000). Events beyond 2000: Setting the agenda. Proceedings of the 2000 Event Evaluation, Research & Education Conference. Australian Centre for Event Management.
Getz, D. (2005), Event management and event tourism, 2nd Edition. Cognizant Communication Corporation.
Goldblatt, J. (1997), Special events : Best practices in modern event management, 2nd Edition, John Wiley & Sons.
Goldblatt, J. (2000), A future for event management: The analysis of major trends impacting the emerging profession, In Allen, J., Harris, R., Jago, L.K., & Veal, A.J.
(2000). Events beyond 2000: Setting the agenda. Proceedings of the 2000 Event Evaluation, Research & Education Conference. Australian Centre for Event Management.
Goldblatt, J. (2005), Special events: Event leadership for a new world, 4th Edition, John Wiley & Sons.
Gratton, C., Dobson, N., and Shibli, S. (2001), The role of major sports events in the economic regeneration of cities, In Gratton, C. and Henry, P. (Eds.), Sport in the city: The role of sport in economic and social regeneration. Routledge.
Hall, C.M. (1992), Hallmark tourist events: Impacts, management and planning, Belhaven Press.
Harris, V. (2004), Management practice. Event management: a new profession, Event Management, 9, 103-109.
Hammond, M. (2007), Olympic Fiasco, retrieved on 26th January, 2007 from http://www.worldarchitecturenews.com:80/index.php?fuseaction=wanappln.commentview&comment_id=36 on 26/1/2007.
Hanlon, C., & Jago, L. (2000), Pulsating sporting events: An organisational structure to optimise performance, In Allen, J., Harris, R., Jago, L.K., & Veal, A.J. (2000), Events beyond 2000: Setting the agenda. Proceedings of the 2000 Event Evaluation, Research & Education Conference. Australian Centre for Event Management.
Hanlon, C., & Jago, L. (2004), The challenge of retaining personnel in major sport event organizations, Event Management, 9, 39-49.
Hawkins, D.E. & Goldblatt, J.J. (1995), Event management implications for tourism education, Tourism Recreation Research, 20 (2), 42-45.
International EMBOK Executive (2007), International EMBOKTM event management body of knowledge, retrieved 28th May, 2007 from http://www.embok.org
Jago, L. & Shaw, R. (1998), Special events: A conceptual and definitional framework. Festival Management and Event Tourism, 5 (1), 21-32
Masterman, G. (2004), Strategic sports event management: an international approach, Oxford Elsevier Butterworth-Heinemann.
O’Toole, W.J. (2000), Towards the integration of event management best practice by the project management process, In Allen, J., Harris, R., Jago, L.K., & Veal, A.J. (2000). Events beyond 2000: Setting the agenda. Proceedings of the 2000 Event Evaluation, Research & Education Conference. Australian Centre for Event Management.
O’Toole, W.J. (2002), Competencies and maturity models, ISES Conference for Professional Devlopment, Sydney, Australia.
Richards, B. (1994), How to market tourist attractions, festivals and special events, Longman.

Ricketson, M. (2007), ‘Best deal’ for footy viewers comes under attack, The Age, February 9th, 2007.
Ritchie, J. R. B., (1984), Assessing the impact of hallmark events, Journal of Travel Research, 23(1), 2-11.
Rubingh, B. (1993), Training sport managers, Proceedings if 2nd European Forum of Sport Sciences in Europe, Koln.
Silvers, J. R. (2003), Event management body of knowledge project, retrieved 1st June, 2006 from http://www.juliasilvers.com/embok.htm
Silvers, J. R. (2004), Updated EMBOK structure as a risk management framework for events, retrieved 21st April, 2005 from http://www.juliasilvers.com/embok.htm
Sport England (2006), Priority sports, retrieved on 8th January 2002 from http://www.sportengland.org/priority_sports
Stevenson, A. (2007), So, where does all the money go? The Sydney Morning Herald. Weekend Edition, February 10-11th, 2007.
Torkildsen, G. (1994), Torkildsen’s guide to leisure management, Longman. UK Sport (2007), Major sports events, retrieved on 26th January, 2007 from
http://www.uksport.gov.uk/pages/world_class_events_programme/ Walsh-Heron, J., & Stevens, T. (1990), The management of visitor attractions and events,
Prentice Hall. Watt, D.C. (1994), Leisure and tourism events management and organisation manual,
Longman. Westerbeek, H. & Smith, A. (2003), Sport business in the global marketplace, Palgrave
Macmillan. Westerbeek, H., Smith, A., Turner, P., Emery, P., Green, C, & Van Leeuwen, L. (2006),
Managing sport facilities and major events, Routledge.

Fourth International Event Research Conference Re-evaluating the City/Town: Events as a Catalyst for Change
SUCCESSFUL MANAGEMENT AND ACHIEVEMENTS OF A CITY BASED EVENT AS A STRATEGY FOR DESTINATION MARKETING:
THE CASE OF PUSAN INTERNATIONAL FILM FESTIVAL
EUNHEE SEONG Department of Event and Convention Management
School of Tourism, Dongseo University [email protected]
ABSTRACT The city of Pusan, Korea launched the Pusan International Film Festival (PIFF hereafter) in an attempt to increase tourism revenue and to develop more effective destination marketing strategies. This study analyzes PIFF and its effects both locally and internationally, and how PIFF has successfully promoted Pusan. Through analyzing internal, external, and statistical data, this paper reports the key factors of PIFF’s successes and development. The results indicate that PIFF should take itself to the next stage by combining relevant industries with a broader view and put more efforts into providing varied conveniences and services for foreign visitors. Keywords: destination marketing, cultural event, film festival, city-based event
INTRODUCTION Events have been brought to the attention of many countries in the 21st century. They range from mega events, such as the Olympics and the World Cup, to cultural events like the Edinburgh Festivals and the Cannes Film Festival. Cultural events are recognized as a new tool for city marketing, particularly, hallmark events which aim to enhance brand images through them. Over the last few decades, festivals have been increasingly identified with community- based tourism and development, as they add vitality and enhance the appeal of destinations to visitors (Getz, 1991). In Korea, the Ministry of Culture and Tourism is making various efforts to improve the nation’s competitiveness, and promote the cultural industry as its key industry, by establishing an infrastructure of films, visual images, games, and also by fostering experts and developing higher value-added cultural products (Kim, 2005). Kotler & Haider (1993) suggest that the self-governing body makes use of image/ attraction/ indirect facility/human marketing, and the hosts of such marketing strategies include both the public and the private sector. The self-governing body tries to develop the community through city-based events. From a point of marketing strategy, it can be a base line for successful development, and can bring competitive advantage to local government. In this regard, PIFF has played a significant role in marketing Pusan for 11 successive years. It is a good example of a cultural event enhancing the image of a city, as well as promoting the region in the international community. Thus, the purpose of this study is to analyze the merits of PIFF, which has successfully promoted Pusan in a relatively short period of time. This study has been conducted by analyzing internal, external, and statistical data.

Cultural Festivals in Korea In Korea, the local self-governing system was introduced in 1995. It was a great turning point for local governments, as each governing body has been seeking methods to promote its community. As a result, unique local history and culture were viewed as key strategy areas for development. The cultural strategy of a city, which aims to renew old images to promote the local economy and integrate residents, has become an important local policy. In this process, destination marketing has become an effective force, and cultural events were recognized as effective and efficient promotional tools. Many self-governing bodies understand the importance of cultural events, and in effect, they are holding and developing various events. Development of a cultural event can benefit even those staying on track, for those events enable them to survive intensive competition, achieve a more balanced development, and improve their local environment. As self-governing bodies have competed intensively to organize their own cultural events (especially festivals), significant negative financial effects have resulted. In order to prevent such negative effects and develop only competitive festivals, the Ministry of Culture and Tourism selects and supports those festivals which relate to culture and those which promote tourism. Support from the Ministry is limited to off-peak festivals (held in January-March) The criteria for support includes: the potential for attracting tourists home and abroad, specialization of the festival programs, the professionalism of the festival organizer, infrastructure for the festival, effects of producing value added, and actual results from the previous year. In 2007, the Ministry selected 52 festivals (seven top festivals, nine excellent festivals, seventeen potential festivals, and nineteen preliminary festivals), providing subsidies and PR support. Based on their selection and concentration policy, the Ministry plans to cultivate and support cultural and tourism festivals that can successfully represent Korea. Continuous improvements will be made to the festivals in order to enhance their quality and competitiveness by intensifying overseas PR support, establishing a self-evaluation system of the local government, activating experts’ consulting systems, and developing a statistical system for visitors as well as festival evaluation systems. Self-governing bodies are also making such efforts for the development of local community. Film Festival as Destination Marketing Philo & Kearns (1993) define Destination Marketing as a series of economic and social activities promoted by an individual or an organization that supervise a destination. According to the theory, various efforts are put into making the image of a certain area more attractive, in order to increase its appeal to investors, tourists, and even to the local residents. Destination marketing is a strategy of increasing the value of an area by developing its image, systems, facilities, etc. so that the area will be favored by various companies, residents, and tourists. This marketing strategy helps financially struggling cities renew their images to their local residents, various investors, and to tourists, in order to re-vitalize their economies. Griffith (1995) divides destination marketing into the integrated cultural model, cultural industries model, and promotion or customer-oriented model. PIFF falls under the cultural industries model. CIM (Cultural Industries Model) is designed to revive a city by developing new cultural industries, when its former key industries are in decline. In case of Pusan, its previous key industry (shoe manufacturing) began to decline, as film making was about to replace it as the city’s key industry. PIFF is the start of the new culture industry process. A cultural event such as PIFF is preferred by cities in Korea because it is cost effective, in

comparison to the development of other cultural products. Also, the profits from such events can be returned to its local residents. A film festival, the most typical cultural event, shows movies (with one theme or various themes) during a particular period, in order to raise awareness about the movies. Such events can either be competitive or noncompetitive (Cho, et al, 1998). Film festivals are intended to generate economic growth by attracting tourists and developing tourist destinations, as well as promoting positive social and cultural images. These festivals help increase the popularity of their countries throughout the world. Since the world’s first international film festival was held in Venice in 1932, about 400 film festivals have been held throughout the world. The world's three most prestigious film festivals: Cannes, Berlin, and Venice, have contributed greatly to the economy of their host cities by attracting numerous tourists (Kim, 2004). CASE STUDY: PUSAN INTERNATIONAL FILM FESTIVAL (PIFF) PIFF is staged annually for nine days in September or October in Pusan (the second largest city of Korea). Located in the south-eastern part (Pusan Bay) of the peninsula, Pusan is the largest port city in Korea. Due to its economic crisis of shoe manufacturing and the IMF during the 1990’s, its sense of isolation from Seoul (Korea’s largest city) has created a negative image of Pusan. In order to alleviate this negative image, Pusan has attempted to popularize itself by creating visible local symbols and festivals, in an attempt to unify its residents. During this process, PIFF has emerged by making use of destination marketing. PIFF adds the vitality of modern art to folk festival-driven local culture, and it presents a model for future local development strategies based on cultural events (Lee, 2002). Background & Purpose PIFF, which held its 11th annual event in 2006, was created in 1996 to make Pusan one of the world’s most popular tourist attractions through cultural events. Since the local self-governing system was introduced in 1990’s, many local governments eagerly wanted to have film festivals in order to promote their respective cities. Of those cities, Pusan was already given a detailed guarantee from its local government and private businesses that they would provide financial support. Moreover, Pusan had an edge over others as a port city, and there were many theaters and hotels. Many questions were raised about the successes of the festival at its early stages, because of its limits/weaknesses as a local city. However, PIFF has gradually increased Pusan’s reputation. The local government of Pusan has presented a new model of the city through PIFF, and boosted its competitiveness by inviting the film industry, which in turn, generated higher profits as well as increased tourism resources. The purpose of PIFF is to increase tourism revenue and establish its image as a city of culture and tourism. Outline of PIFF PIFF is the only international film festival approved in Korea (Feb., 1997) by the International Federation of Film Producers Associations (FIAPF), and has approximately 180,000 visitors both home and abroad. PIFF is supervised by the PIFF Organizing Committee (an incorporated association), while Pusan city workers and volunteers take part in operating the festival. The Organizing Committee consists of film experts, the local press, and the economic sector, and the Executive Committee is in charge of administrative work. PIFF is held between September and October each year. The film scheduling is determined by the supply/demand of the films, and scheduled during those times as to not overlap with other film festivals. <Table 1> shows data of previous PIFF festivals.
Table 1 Status of PIFF
Category (Year) Period No. of Movies
(country/movieGuests
(country/pers. Visitors Budget

) ) 1st(1996) 9.13-9.21 27/170 27/224 184,071pers. US$2,200,000
2nd(1997) 10.10-10.18 31/166 30/450 170,206pers. US$2,450,000 3rd(1998) 9.24-10.1 41/211 25/659 192,547pers. US$2,500,000 4th(1999) 10.14-10.23 53/207 36/555 180,914pers. US$2,650,000
5th(2000) 10.6-10.14 55/207 39/3,017 181,706pers. US$2,700,000 6th(2001) 11.9-11.17 60/201 30/3,761 143,103pers. US$2,950,000 7th(2002) 11.14-11.23 55/226 25/5,318 167,349pers. US$3,250,000 8th(2003) 10.2-10.10 61/234 50/5,329 165,103pers. US$3,700,000
9th(2004) 10.7-10.10 63/264 50/5,638 166,164pers. US$3,950,000 10th(2005) 10.6-10.14 73/307 55/7,647 192,970pers. US$5,400,000 11th(2006) 10.12-10.20 63/245 51/8,321 162,835pers. US$7,400,000 Ref: Organizing Committee of PIFF(1996-2006) Main Program PIFF shows about 200 films from 40 countries, with exception to Hollywood movies, in order to avoid commercialism. There are seven major programs at present (after gradual adjustment was made to the early ones). <Table 2> shows the programs in 2007.
Table 2 Main Program of 2006 PIFF
Program Contents
World Cinema Films of certain figure or theme manifesting the current trends in world cinema
A Window on Asian Cinema Controversial works illustrating unique perspective and style in film
New Currents The competitive section promoting the first or second time Asian directors of a feature film
Wide Angle Section for shorts, animation, documentaries and experimental films demonstrating unique perspective
Korean Cinema Today Brand-new selection of top-quality films demonstrating the current trend in Korean cinema
Retrospective Section Films or notable directors of significant subject matter through a retrospective
Open Cinema Critically acclaimed, box-office smashes from around the world are screened at the special outdoor theater
Ref: Organizing Committee of PIFF(2006) Sponsorship PIFF has actively marketed the sponsorship of various companies and organizations. Of the total profits, subsidies from the central and local governments accounted for 57% in 2004, 60% in 2005, and 58% in 2006, so overall more than 50% (Organizing Committee, 2006). However, compared to governmental subsidies, the financial support from private companies and organizations was quite low. In order for PIFF to develop independently from the

government, it needs to increase its funding from private enterprises. Therefore, the Organizing Committee is developing various sponsorship opportunities and making active efforts to invite sponsors. <Table 3> shows various levels of the sponsorship opportunities.
Table 3 Sponsorship Opportunities of 2006 PIFF
Grade Amount Companies/Organization Diamond Premier Sponsor
Over US$1,000,000 -
Gold Premier Sponsor
Over US$500,000 NAVER
Premier Sponsor
Over US$300,000
CJ Entertainment, CGV, Primus Cinema, Lotte Cinema, MEGABOX, SHOWBOX, KIA MOTORS,
Pusan Bank, JoongAng Broadcasting
Prestige Sponsor
Over US$200,000
AtionFashion, Dongseo Univ., Canon JONNIE WALKER
Main Sponsor Over US$100,000
HERMES Korea, LOREAL Paris, Korean Air, KM Culture, Gyeongju Hilton Hotel, DHL,
PanStar Cruise Ferry, MK Pictures
Leadership Sponsor
Over US$50,000
Paradise Hotel Pusan, Korea Exchange, Taewon Entertainment, OCN, EugeneTech, SONY Korea,
Panasonic Korea, DigiLog System, KODAK Festival Sponsor
Over US$30,000 NAMOOACTORS, VARIETY
Partnership Sponsor
Less than US$30,000
Sfunz, Pusan Univ. of Foreign Studies, Youngsan Univ., Good Gang-an Hospital,
Ref: Organizing Committee of PIFF(2006) Characteristics and Competitiveness of PIFF Despite the many difficulties as a latecomer, PIFF has continued to increase profits throughout its eleven years, demonstrating the festival’s competitiveness. PIFF’s biggest strength is its uniqueness. From its beginning, PIFF has sought the promotion of Asian films outside the Asian continent. Although there are hundreds of film festivals in Asia, their influence in the international community is insignificant. PIFF is the sole Asian film festival organizer to represent Asia to the international community. This uniqueness has enabled PIFF to survive the intense competition (Hong, 2003). Secondly, the introduction of its non-competitive system, (not inviting works sent to other festivals), has allowed PIFF to show various and highly artistic films. This has been done in order to compete with Hollywood movies through the establishment and the identity of Asian films throughout the world. Thirdly, PPP (Pusan Promotion Plan), is a project supporting filmmaking/distribution of Korean and Asian movies. Through this pre-market program, about 15 works are selected every year to find their investors. This indicates that such an event, not limited to a festival itself, can play a competitive role in the industry. Finally, because of the success of PIFF, Pusan is gaining the reputation as a credible film producing city, that is not content with the current success of destination marketing. Pusan is establishing an infrastructure of visual industry by selecting one of its 10 strategic industries through PIFF. For example, the city has announced the plans for “CinePort Pusan,” and set a goal of being the visual industry hub of Asia by 2010.
Table 4

Strategic Tasks and Policies for Pusan Film Industry No. Main Tasks Sub Policies
1 Developing PIFF as one of the world’s top 5 film festivals
2 Developing Pusan as a film venue
- Increasing the support of the Pusan Film Commission - Construction of film studios for intensified support - Creation of a cinema venue
3 Creation of Pusan CinePort
- Financial support for research on comprehensive development plans - Construction of the Pusan Cinema Venture Center - Construction of a state-of-the-art post-production facility - Construction of a museum for film experience
4
Developing support, manpower, and a
technology related film industry
- Financial support for filmmaking - Active operation of Pusan Cinema Venture Center - Support for developing experts and technology - Raising funds for cinema & film promotion
5
Increasing Pusan’s competitiveness of film industry throughout the
world
- Establishment of Asian Film Commission Network(AFCN) - Opening of Asian Film Industry Center(AFIC) - Operation of Asian Cinema Industry Research Institute - Active operation of NetPac (organization for Asian film promotion)
6
Creation of Pusan cultural industry
complex with cutting-edge technology
- A cinema zone: centered on Swimming/Yacht Stadium first, and then extended to a tourism complex in the eastern area - Clustering a cultural theme park and DMZ(Digital Media Zone) together
Ref: Lee, Ikju(2004), Development Plans for “CinePort Pusan” in Asia, Pusan Development Forum 2004. ACCOMPLISHMENTS AND ACHIEVEMENTS OF PIFF PIFF has had a great impact on the local community, both economically, and culturally. PIFF, through the use of destination marketing has achieved the following: 1) improved the city’s image and welfare, 2) increased job opportunities and income, 3) unified its residents by raising their pride and establishing their identity, 4) attracted investors and tourists by using the city as a way of increasing sales 5) achieved profits through multi-purpose developments and cultural zones. Improvement for the Brand of Pusan Although the economic and social effects are enormous, the greatest achievement of PIFF is the improvement of the city’s image in the international community. During the most recent PIFF, about 700 journalists at home and abroad intensively covered the festival. The intense media coverage that PIFF received played a critical role in promoting the city as a hub of culture and tourism. Breaking out of cultural centralization, Pusan, as a local government, has succeeded in the culture industry, improving its reputation throughout the world. PIFF is not just a mere event, for it has been contributing in the development Pusan into a city of cinema culture. Movies with Pusan as its geographical setting have increased and have been successful at the

box office, establishing Pusan as a ‘film city’. In addition, the success of PIFF and PPP have brought Pusan to the attention of many as an attractive film venue. Economic Effects The economic effects of PIFF have been positive. Profits from film patrons have boosted Pusan’s economy, and PIFF has positively influenced the the tourism industry and other related industries. According to the Input-Output Model of Lee (2006), the spending of outside visitors of PIFF in Pusan had both direct/indirect impacts on the regional economy.
Table 5 Overall Economic Impact by the outside visitors of PIFF
overall economic impacts
Category product influence amount
income influence amount
employment influence persons
Value-added influence amount
Shopping US$2,882,000 US$284,000 183pers. US$788,000Restaurant US$2,988,000 US$577,000 112pers. US$1,246,000
Accommodation US$5,177,000 US$1,095,000 96pers. US$2,162,000Tourism
Transportation US$1,851,000 US$421,000 66pers. US$1,201,000
Cultural Entertainment
Service US$2,059,000 US$637,000 185pers. US$1,116,000
Film Entertainment
Service
US$712,000 (US$1,090,000
)*
US$201,000 (US$308,000)
16pers. (24pers.)
US$385,000 (US$589,000)
Total US$15,669,000 (US$16,047,00
0)
US$3,215,000 (US$3,322,000
)
658pers. (666pers.)
US$6,898,000 (US$7,102,000
)*( ): Amount impacted by the income of paid audiences Ref: Lee (2006) Analyzing the total economic effects of PIFF in 2005, as a mega event on the tourism industry, the total product influence amount was US $15,669,000, the total income influence amount was US$3,215,000, the total employment influence persons was 658 people, and the total value-added influence amount was US$6,898,000. In addition, of the 6 tourism industry categories, the Accommodation category ranked first in the total product influence amount (US$5,177,000), the total income influence amount (US$1,095,000), and the total value-added influence amount (US$2,162,000). Also, the Cultural Entertainment Service category and Shopping category ranked first (185 persons, 28.1%) and second (183 persons, 27.8%) respectively. Successful Factors of PIFF First, the film festival was held in Pusan due to its geographical advantages. Pusan is an open city surrounded by seas, and thus has been promoted as the city with a “sea of films.” The symbolic meaning was a great success and became a factor of PIFF’s success (Kim, 2003). Pusan contains Korea’s first theater and cinema company, so the city had enough potential for being the Mecca of films. Also, PIFF has satiated the desire of the citizens for more culture. Second, the president of the Executive Committee was another reason for its success. The president is in charge of supervising the event and has led the festival for about 10 years, developing the event into Korea’s best film festival and increasing the subsidies from the central and local government. The third is independency of the Organizing Committee and the

reasonable support from Pusan. The organizer of PIFF is not Pusan City but the Organizing Committee of PIFF. A film festival requires professionalism, and flexible decision-making is crucial to the operation of an international event, so the private organization took the lead. All the processes including from the operation, the selection of the personnel, and to budget execution are conducted by the Committee, while Pusan City and the central government provide only the financial and administrative support. No speech from a government official or a social leader is given at the opening and closing ceremony of the festival. The fourth successful factor is the strategic identity as a latecomer. Many other festivals, including the three top film festivals in the world, are competitive, but most of them fail to remain successful. Thus, PIFF has professed to be noncompetitive to pursue a pure film festival as its strategy, in order to remain successful. Finally, PIFF has successfully balanced a festival with the business. PIFF refused to merely be a cultural event, and took the practical role of supporting the Asian film industry. For instance, PIFF connects film investors, distributors, planers, and directors together in order to open a new opportunity for Asian film industry and culture by creating PPP. PPP has enabled the festival to be more productive in not only promoting the consumption, but also the production of more competent films. CONCLUSION From the local communities to the major cities in the world, the concepts of city-based marketing and destination marketing are being used to economically develop communities. Even though marketing was limited to a product or service in the past, now the concept is extended to a city, which has properties of space and time, motivating marketing experts to employ various methods to promote and develop a city. Since the beginning of the local self-governing system, many Korean local governments have organized various cultural events through destination marketing, in order to improve the social and cultural development of their respective communities. While numerous festivals are held in Korea, PIFF has been held for 11 successive years, and is recommended as a good example of destination marketing using a modern item. The key factor of PIFF’s success was the clear definition of its goal. Unlike previous film festivals focused on western movies, PIFF aimed at introducing and discovering Asian films, especially Korean movies. PIFF has a clear goal of making Korean films known to the world. This is well reflected in the programs. Moreover, the festival is not only limited to culture but has also drawn the attention of Asia through PPP, and thus has established itself as Asia’s Pre-Market. More recently, PIFF is becoming the hub of the visual industry of Asia. This study has shown that a cultural event can contribute to the significant development of local economy, especially with destination marketing. As a good example of a cultural event that can motivate the economic development of a host city, PIFF has had a great impact in formulating future plans for local development. In particular, Pusan has carried out a strategic cultural event by differentiating it from others. Other festivals have imitated previous successful cases and thus lost their identities. Various other local governments can learn from the PIFF case by differentiating and displaying their unique images through various programs. Nevertheless, PIFF does have its problems. Although it is an international film festival, more than 90% of the visitors are Korean, and little consideration for foreign audiences is given. A film festival is an event that can produce great synergy by combining the event with other industries, especially tourism, in order to enhance the economy of a local community. PIFF should take itself to the next stage by combining relevant industries with a broader view and put more efforts into providing varied conveniences and services for foreign visitors.

This case study has several limitations of brief study and further study will need to be specified on the management of successful events to develop and ensure the brand of PIFF. REFERENCES Busan Branch, The Bank of Korea. (2005). Retrieved November, 2006, from
http://www.bok.or.kr/busan Busan City. (2006). Retrieved December, 2006, from http://www.busan.go.kr Busan Development Institute, Retrieved January, 2007, from http://www.bdi.re.kr Cho, M. H., et al (1998). Plans to vitalize Pusan International Film Festival as a Tourism Event.
Research of Tourism and Leisure, 10(1), 115-129. Dongseo University. (2005). Retrieved October, 2006, from http://www.dongseo.ac.kr Getz, Donald (1991). Festival, Special Events & Tourism, VNR Getz, Donald (1993). Case Study: Marketing the Calgary Exhibition and Stampede. Festival
Management & Event Tourism, 1, 147-156. Griffiths, R. (1995). Cultural Strategies and New Modes of Urban Intervention. Cities, 12(4),
254-255. Hong, S. K. (2003). A Journal Exploring the Frontiers of Monthly Magazine, 228, December,
24-44. Hwang, Y. W. (2004), Problems and Promoting Strategies for World-City, Pusan. Busan
Development Forum. 85, Jan./Feb., 7-13. Jeong, J. D. & etc. (2002). Study on Strategies of Destination Marketing for improvement of
Local Image. Seoul Journal of Economics, 21. Kang, S. K. (2003). Study on Classification of Local Festivals Aimed at Reinforcing City
Marketing with Particular Focus on the Strategies (Master’s thesis, Graduate School of Urban Studies, The University of Seoul, 2003).
Kim, B. J. (2005). A Study on the Management and Achievements of Pusan International Film Festival (Master’s thesis, Dankook University, 2005).
Kim, C. A. (2005). A Study of Cultural Events as Tourism Resource-Korean Film Festivals. Tourism Information Research, 19, 127-151.
Kim, H. J. (2006). An Analysis of the Economic Impact of a Mega-Event by use of the Regional Input-Output Model-Centering on the Pusan International Film Festival-(Doctoral dissertation, The Graduate School of Kyung-Hee University, 2006).
Kim, J. S. (2003). From Festival into Industry - Identification and Prospect of Pusan International Film Festival. Soseol-Maeul.
Kim, J. Y. (2000). A Study on Destination Marketing and Pusan International Film Festival (Master’s thesis, Pusan University, 2000).
Kim, S. H. (2004). The Impact of Local Festivals on Local Economy (Doctoral dissertation, JoongAng University, 2004).
Kim, S. J. (1999). A Study on the Influences of Destination Marketing on Local Image and Economy (Master’s thesis, Seoul National University, 1999).
Korea Press Foundation. (2006). News. Retrieved December, 2006, from http://www.kinds.or.kr Korea Tourism Organization. (2004). Annual Report. Retrieved December, 2006, from
http://www.knto.or.kr Lee, H. J. (2003). Destination Marketing Strategies Applied by Local Cultural Festival-
Hampyeong Butterfly Festival- (Master’s thesis, JeonNam University, 2003). Lee, H. S. (2004). A Study on Status of Supporting Policies for Local Festivals in Korea. Seoul
Studies, 5(3), 136-140. Lee. I. J. (2004). Developing Strategies for “CinePort Pusan” in Asia. Busan Development
Forum. 85, Jan./Feb., 35-42. Lee, M. Y. (1997). Destination Marketing and Cultural Strategies of City Development, Space
and Society, 8. Lee, S. J. (2002). Reinvigorating Plans for Local Economy Applied by Regional Festivals-
Focused on Pusan International Film Festival-. Social Science Review, 20, 267-292.

Lim, J. D., & Baek, C. K. (2006). The Success Factors and Efficiency Analysis of Pusan International Film Festival, International Area Studies Review, 10 (1), 702-724.
Lim, S. W. (2002). The Effects of Cultural Event on the Region: in case of Pusan International Film Festival (Master’s thesis, Ewha Womans University, 2002).
Ministry of Culture and Tourism, Korea. (2005). Annual Report & News. Retrieved January, 2007, from http://www.mct.go.kr
Moon, S. H. (2004). Investigation into the visitors of the 9th Pusan International Film Festival. Organizing Committee(1996-2006). Pusan International Film Festival(Annual Report). Pusan. Park, J. H. (2003). Study on Strategies of Destination Marketing Applied by Local Festivals
(Master’s thesis, JeonNam University, 2003). Park, S. H. (1997). Global Strategies for Festivals and Events in Kyunggi Province, Jul./Aug.
Kyonggi 21 Centuries, 9-25. Philo, C., & Kearns, G.(1993), Culture, History, Capital: A Critical Introduction of the Selling of
Places. Selling the City and Cultural Capital Post and Present, Ox Pergamon Press, 1-32.
Pusan International Film Festival. (2007). Retrieved January 18, 2007, from http://www.piff.org Shin, Y. C. & Ahn, C. S. (1999). An Empirical Study on Regional Event in Local Community-
Centering on Concept of Destination Marketing. Research for Culture and Economy, 2(2), 54-74.
Um, K. B. (1999). Development of Strategic Plan and Positioning on Pusan International Film Festival (Master’s thesis, Dongkook University, 1999).
Uysal, M. & Gitelson, R. (1994). Assessment of Economic Impacts: Festival and Special Events. Festival Management & Event Tourism, 2, 3-9.
Wall, G., & Mitchell, C. (1989). Cultural Festivals as Economic Stimuli and Catalyst of Functional Change, The Planning and Evaluation of Hallmark Events, Avebury, 132-141.

Fourth International Event Research Conference Re-evaluating the City/Town: Events as a Catalyst for Change
COMPARING THE PERCEPTIONS ON EVENT MANAGEMENT CURRICULUM: A FACTOR-CORRESPONDENCE ANALYSIS
Kyong Mo Lee
Department of Events Management College of Tourism Science, Kyonggi University
Myong Jae Lee The Collins School of Hospitality Management
California State Polytechnic University, Pomona
Hee Jung Kim Department of Events Management
College of Tourism Science, Kyonggi University
ABSTRACT This study aims to provide some insights into the current status of event management curriculum in Korea as perceived by major stakeholders in event management higher education: industry professionals, students, and educators. Responses to 408 questionnaires were analyzed using factor-correspondence analysis. The factor analysis finds three most important dimensions of event management curriculum: Event Planning & Operations, Event Sponsorship and Marketing, and Field Experiences. A Correspondence analysis further exhibits the relationship between major stakeholders and the curriculum factors. The implications for the event management higher education are presented in the Discussion and Conclusion.
Keywords: Event management curriculum, factor-correspondence analysis.
INTRODUCTION The event, festival, convention and exhibition industry (hereafter, event industry) has received growing attention because this dynamic sector generates significant social, cultural, and economic benefits for host regions. According to Mistilis and Dwyer (1999), special events and conventions can result in associated social and cultural benefits to destinations: (1) enhance the exchange of ideas and information, (2) foster business connection, (3) provide forums and seminars for continuing education and training, and (4) facilitate technology transfer. In addition, hosting mega events provides a unique opportunity for the host destinations to build and showcase their skills and their capabilities and to create a sense of excitement, community, pride, and cohesiveness (Lee & Taylor, 2005). Most of all, however, mega events and festivals are major contributors to regional and national economies (Rutherford & Kreck, 1994). Due to such positive benefits, national and many local governments in Korea hold more than 1,000 events annually as a way to promote the tourism industry in various destinations (Seo & Choi, 2006).
As the event industry has grown rapidly, the need for an educated labor forces has become evident. Consensus among stakeholders in the event industry is that higher education in event management

is vital to the industry in terms of providing a foundation of knowledge for those who wish to pursue a career in the event industry and continuing professional development to those who are already employed in the industry. Not surprisingly, the initiative of developing event management program in Korea was undertaken by the established hospitality and tourism institutions. They first introduced the event management program as a sub-major or specialization program under the roof of hospitality and tourism management degrees. Notably, in 1990s, the hospitality and tourism higher education witnessed the inception of the four-year baccalaureate program in event management in the College of Tourism Science at Kyonggi University in 1998. Since then, event management programs in Korea have been proliferated. Four-year baccalaureate degrees and two-year diplomas in event management are currently offered to approximately 1,500 students at four 4-year universities and six 2-year colleges as of 2006. Also, graduate programs in event management are currently open at two universities, offering both masters and doctoral degree in event management. As more traditional hospitality and tourism programs seriously consider offering event management programs, it is expected that the numbers will increase substantially in the future.
A review of extant research on event management revealed that the research has been focused on three areas: 1) the economic impact of various events and festivals (Burgan & Mules, 1992; Della Bitta, et al., 1977; Gazel & Schwer, 1997; Gelan, 2003; Jones, 2001; Kang & Perdue, 1994; Lee & Taylor, 2005; Long & Perdue, 1990; Madden, 2002; Murphy & Carmichael, 1991; Pyo, et al., 1988; Tang & Turco, 2001), 2) sponsorship of events (Cunningham & Taylor, 1995; Kim, 2006; Mount & Niro, 1995; Park, et al., 2005; Peterson & Crayton, 1995; Seong, 2005), and 3) event market segmentation (Espelt & Benito, 2004; Formica & Uysal, 1998; Seo & Choi, 2006). Few, if any, studies have seriously addressed the issue of event management curriculum related to the comparative perspectives of all stakeholders (students, industry professionals, and educators). This significant research gap offered the opportunity for this study to examine three stakeholders’ perceptions of the current event management curriculum. The goal of event management education is to educate and train future generations of industry professionals. In order to achieve this goal, the attention should be placed on the development of event management curriculum that not only meet the desire of potential students, but also satisfy the needs of the event industry. In that regard, the purpose of this study is to examine and compare all stakeholders’ (students, educators, and industry) perceptions on the current event management curriculum, using a factor-correspondence approach. Specifically, this study identifies the similarities and differences of three stakeholders’ perceptions on the importance of each events management course through a correspondence analysis.
STAKEHOLDERS IN THE EVENT EDUCATION Today’s hospitality and tourism programs have the utmost pressure to develop the curriculum that satisfies all major stakeholders (industry, students and educators). Stakeholders in the events management education are all customers in their way. Their interests must be precariously reconciled (Johns & Teare, 1995). For example, students expect the events management curriculum that helps them prepare efficiently for employment, while the industry requires individuals with appropriate skills. On the other hand, institutions and educators must address the issues derived from the students and the industry, while maintaining its traditional academic structure of college curriculum (Johns & Teare, 1995). Under this circumstance, it becomes more obvious that there is a need to update and reshape the current event management curriculum, ensuring that it reflects industry needs, job prospects for students, and the integrity of higher education. Industry Perspective As the event industry has become complicated and globalized through the international events and festivals, the industry gives increasing importance to the academic education and career training for

tomorrow’s workforce. In this context, developing sector-specific curriculum that involves the industry in the curriculum design has become critical. Event management curriculum intended to serve the industry must mirror the environmental changes within the industry and must provide a balance of technical and professional skills to equip students with a detailed understanding of day-to-day operations. It must also offer a broader strategic outlook, dealing with every facet of event activities. The majority of the industry involvement in the hospitality tourism education involves a seat on the validation or revalidation board and the occasional guest lecture arranged by individual educators on an ad hoc basis, which are regarded as one-off insights into industry practice rather than a valuable contribution to the overall education package (Stuart, 2002). There should be an attempt to foster links between event management academics and the event industry because strong industry and academic ties, particularly in the curriculum development, will ensure the outcome that the graduates of event managements programs will be qualified for the professional jobs in the event industry. Thus, it has become critical that educators and industry professionals sit together and evaluate the whole event management curriculum in relation to the industry skills and knowledge required for various positions in the industry. Students Perspective Today’s hospitality and tourism curriculum is based on the learning needs of students. Likewise, event management curriculum for students serves as a better preparation for employment in the event industry. In that regard, students are clearly another key stakeholder who can provide valuable data and information that affects educators’ decision making in the curriculum development. Students’ perceptions on the current event management curriculum can enable institutions and educators to fine-tune various aspects of policies, procedures, and practices of event management education and thereby enhance the quality of the curriculum. Today, it is not unusual that students are fully involved in the educational process, particularly in the curriculum development in various disciplines (Smith & Cooper, 2000). There are strong supports for the use of students’ perception on curriculum for quality assurance purpose (Brookes, 2003; Kang et al., 2005; Knutson et al., 1997; Mount & Sciarini, 1999; Murray, 1997; Oldfield & Baron, 2000). Wilson (1997) stated that student feedback can be used as a mechanism for quality assurance and, thus, student evaluation of entire courses is critical in facilitating a more comprehensive assessment of hospitality and tourism education. Educators Perspective Another major player in the event management higher education is institutions or educators supplying event education. Their individual expectations, personal goals and values have been critical in shaping the curriculum (Stuart, 2002; Trowler, 1997). General hospitality and tourism educators have been inclined to exert some level of ownership over their courses and to ensure the appropriate content of the curriculum. Thus, traditional hospitality and tourism curriculum is teacher-led curriculum where the teacher decides on the objectives and content to be taught (Smith & Cooper, 2000; Stuart, 2002). Today, however, it is required that educators particularly in hospitality and tourism education should take a step back from their teaching and consider the wider implications for the curriculum as a whole of amending the contents of core courses. Also, hospitality and tourism education should strive for the blending of theory and practice in the preparation of a workforce seeking careers in the hospitality and tourism industry (Marshall, 1995). Well-blended composition of both theory and practice in hospitality and tourism curriculum will enable the programs to be more competitive and better serve their stakeholders (Hengst, 2004; Kang et al., 2005; Moreo, 2004). The mission of the event management academia is to develop highly skilled and competent future industry professionals. In order to achieve this mission, educators and institutions must continually adapt to changes in the needs of both students and industry partners.

Particularly, it is highly encouraged for the event management academia and educators to actively work to reduce the gap in the practical side of courses by incorporating opinions of industry professionals into the curriculum (Kang et al., 2005). METHOD Events Curriculum Selection The selection of event management curriculum involved several interrelated steps. There has been a significant increase in the number and the type of event-related courses offered in both university and college level. A total of 152 event-related courses offered at four 4-year universities and five 2-year colleges in Korea were initially collected through the Intrenet home pages, and school catalogs. Because many courses contained similar contents with various course titles, these courses were eliminated through a thorough content-analysis with course syllabus. Another selection criterion was the generalizability of course offerings. Courses that were offered by multiple institutions were chosen for the analysis to secure the general acceptance of the course and to avoid too area-specific courses offered by a particular institution. As a result of such screening process, 43 event-related courses were selected for the main survey (See Table 2 in Results section). After consulting with instructors teaching particular courses, brief course descriptions were included in the survey instrument in order to help prospective respondents (students, industry professionals, and educators) understand the contents and objectives of each course. The final questionnaire that included 43 event management courses and course descriptions was designed to measure respondents’ perceptions on the importance of each course using a 5-point Likert-scale of 1 = Very Unimportant, 5 = Very Important. In addition, questions asking respondents’ demographic information, such as age, gender and school year, were included in the questionnaire in order to examine demographic composition of sample.
Data Collection The target subjects in this study were industry professionals, students, and educators in event management. A common approach was sought for each of the target groups but the varied nature of the sample required some modification to the way in which the survey was eventually carried out. For the survey of industry professionals, 22 event-planning companies and their full-time employees including managers, directors, and junior staff members were contacted through the mail and on-site surveys. A total of 167 usable responses including 100 from the manager/director group were collected from the industry side. For the survey of students majoring in events management, six institutions offering event management degree or diploma participated in the survey. Instructors at those participating institutions distributed and collected questionnaires in their classrooms. Each institution contributed 30 to 45 student responses to the survey. As a result, a total of 223 usable student responses were counted for the data analysis. For the survey of educators, a total of 36 educators at eight different institutions were contacted through the mail survey. Among them, 16 educators returned the survey for the study. Overall, a total of 408 usable responses were collected from three target groups through a combination of mail and on-site survey (See Table 1 in Results section). Data Analysis The collected data were analyzed in two stages. First, 43 curriculum items were factor-analyzed using principal components analysis to delineate the underlying dimensions of event management curriculum. The factor analysis was carried out with a varimax rotation to make the factor structure more interpretable (Nicholson & Pearce, 2001). The reliability coefficients for each dimension were ten calculated. In the second stage, a correspondence analysis was conducted to examine three

different stakeholders’ (students, industry professionals, and educators) perceptions on the current event management curriculum. A correspondence analysis has been popularly employed in social science research because it transforms a table of numerical information in a contingency table into a graphical display to facilitate the interpretation of the information (Greenacre, 2000; Chen, 2001; Shanka et al., 2005). The primary merit of a correspondence analysis is the portrayal of categorical data in a joint-plot so that both row and column relationships are comparable in terms of a squared distance model (Bowden, 2002; Hair, Anderson, Tatham, and Black, 1998; Shanka, Quintal, and Taylor, 2005). In this study, the composite means of curriculum factors were calculated to examine the relative importance of each curriculum factor. Because correspondence analysis requires categorical data, the importance of ten curriculum factors and five groups were transformed into a contingency table. Thus, correspondence analysis produced a visual representation of the relationships about the perceived importance of event management curriculum among different stakeholders in the same space. In order to provide more specific implications, industry and students groups were divided into two sub-groups respectively, making a five-group comparison.
RESULTS Profile of Respondents A total of 408 usable responses were collected. Table 1 depicts the demographic information about the respondents. Females accounted for most respondents in the students groups (University students: 59%, College students: 74%, Overall: 66%), showing the popularity of events management among female students. On other hand, more than one half of the respondents in the industry side were males (Managers/Directors: 70%, Junior staff members: 52%, Overall: 63%). Instructors are almost evenly split. Overall, 53% of respondents were females. With regard to the age of the respondents, the majority (74%) in the industry-managers group were between 30 and 39, and 17% indicated they were between 20 and 29. For the industry-junior staff group, the majority (73%) were between 20 and 29, and 27% indicated they were older than 30. Not surprisingly, most of student respondents (99%) were between 20 and 29.
Table 1 Demographic Profile of the Samples
Industry Professionals Students
Managers/ Directors
(%)
Junior Staff Members
(%)
University (%)
College (%)
Educators (%)
Cumulative (%)
Gender Male Female Total
70 (70) 30 (30)
100 (100)
35 (52) 32 (48)
67 (100)
52 (41) 76 (59)
128 (100)
25 (26) 70 (74)
95 (100)
10 (56) 8 (44)
18 (100)
192 (47) 216 (53)
408 (100)
Age -19 20~29 30~39 40~49 +50 Total
0 (0)
17 (17) 74 (74)
9 (9) 0 (0)
100 (100)
0 (0)
49 (73) 18 (27)
0 (0) 0 (0)
67 (100)
0 (0)
127 (99) 0 (0) 0 (0) 1 (1)
128 (100)
1 (1)
94 (99) 0 (0) 0 (0) 0 (0)
95 (100)
0 (0) 0 (0)
8 (44) 8 (44) 2 (12)
18 (100)
1 (0)
287 (70) 100 (25)
17 (4) 3 (1)
408 (100)

Results of Factor Analysis Principal components analysis of the 43 curriculum items was used to delineate the underlying dimensions of event management curriculum. After initial principal components analysis, three curriculum items (Risk management, Event programming & design, and Event information system) were deleted for the further analysis due to the low communality (< .50). Principal components analysis was then re-run with 40 curriculum items and generated 10 curriculum factors. Table 2 presents the results of the factor analysis. The delineated factor groupings had a reasonable size of variance of components (eigenvalue > 1.0) and acceptable range of reliability (Cronbach’s alpha >.60 for exploratory study). Besides, most of factor loading was greater than .50, implying a reasonable correlation between the delineated factors and their individual items. Curriculum factors were labeled based on the appropriateness and relatedness of the individual items under each factor grouping generated. The ten dimensions were labeled as follows: (1) Event Coordination & Logistics (9.09% of the total variance), (2) Private & Political Events (7.56%), (3) Major Event Areas (7.15%), (4) Hospitality and Tourism Industry (7.04%), (5) Supporting Areas (6.34%), (6) Event Planning & Operations (6.0%), (7) Field Experiences (5.53%), (8) Sponsorship & Marketing (5.11%), (9) Business Administration (5.10%), and (10) Event Basics and Concepts (4.29%). Combined, ten factor groupings accounted for 63.21% of variance.
Table 2 Factor Analysis of Event Management Courses
Event Courses
Factor loading
s
Commu-
nalities
Means (Comp
.)
S.D.
Domain 1: Event Coordination & Logistics (Eigenvalue=3.36; Variance=9.09; Reliability Alpha=.822)
Venue Management Event Logistics Managing Event Ceremonies On-Premise Catering Event Innovations: Audio Visual & Event Production Arts & Science of Contract Negotiation Event Volunteering
.738
.693
.656
.625
.596
.585
.506
.651
.741
.547
.620
.636
.582
.657
3.98 3.65 3.71 3.32 3.56 3.94 3.49
(3.66)
.740
.923
.789
.803
.865
.856
.856
Domain 2: Private & Political Events (E.value=2.80; Variance=7.56; R. alpha=.787)
Wedding Planning & Consulting Entertainment and Party Planning On-line Event Management Government & Political Event Planning
.765 .698 .694 .629
.738 .645 .569 .578
3.10 3.14 3.46 3.16
(3.22)
1.02
.963
.85

8 .974
Domain 3: Major Event Areas (E.value=2.65; Variance=7.15; R. alpha=.772)
Exhibition & Trade Show Management Meetings and Conventions Management Sport Event Management & Marketing Corporate Event Management Festival Management Sales & Promotion Events
.690 .660 .653 .601 .542 .492
.569 .597 .587 .649 .583 .553
3.87 3.99 3.84 4.04 4.01 4.02
(3.96)
.766
.740
.765
.786
.752
.780
Domain 4: Hospitality & Tourism Industry (E.value=2.60; Variance=7.04; R. alpha=.857)
Hotel & Lodging Management Travel & Tourism Industry Introduction to Hospitality Industry
.806 .787 .781
.753 .774 .716
3.54 3.62 3.66
(3.61)
.869
.867
.799
Domain 5: Support Areas (E.value=2.35; Variance=6.34; Rel. alpha=.749) Management Information System (MIS) Economics Laws and Ethics Understanding of Arts and Culture
.750 .692 .657 .607
.688 .617 .612 .505
3.51 3.50 3.42 4.01
(3.60)
.838
.853
.838
.766
Domain 6: Event Planning & Operations (E.value=2.22; Variance=6.00; R. alpha=.676)
Event Initiation: Bid & Proposal Event Planning Event Operations
.732 .667 .608
.619 .671 .604
4.46 4.59 4.33
(4.46)
.714
.629
.695
Domain 7: Field Experiences (E.value=2.05; Variance=5.53; R. alpha=.666) Work-based Professional Practicum Event Site Inspection Project & Research Methodology
.698 .696 .501
.691 .679 .507
4.02 4.21 4.17
(4.13)
.852
.815
.72

3
Domain 8: Sponsorship & Marketing (E.value=1.89; Variance=5.11; R. alpha=.640)
Event Sponsorship Advertising & Public Relations Project Management Event Marketing
.782 .635 .582 .576
.715 .543 .613 .580
3.99 4.26 4.21 4.44
(4.23)
.796
.726
.745
.628
Domain 9: Business Administration (E.value=1.88; Variance=5.10; R. alpha=.631)
Communications Managing Event Services Budgeting and Financial Management Human Resources Management
.727 .721 .506 .485
.593 .668 .612 .516
4.18 4.13 3.94 3.66
(3.98)
.758
.770
.865
.837
Domain 10: Event Basics & Concepts (E.value=1.59; Variance=4.29; R. alpha=.607)
Strategic Event Management Introduction to the Event Industry; Concepts & Contexts
.668 .660
.650 .591
4.02 3.92
(3.97)
.750
.744
Note: 5-point Likert-type scales were used and given the following corresponding values: Very Unimportant (1) – Neutral (3) – Very Important (5). Results of Correspondence Analysis To interpret the relationship between the perceived importances of event management curriculum among the stakeholders in the event management education, a correspondence analysis was conducted. Table 3 shows the count of respondents’ perceived importance of each curriculum factor. Two most important event management areas perceived by most industry professionals (managers/directors) were Event Planning & Operations (44) and Business Administration (21). Also, another industry group (junior staff members) indicated that event courses in the area of Event Planning & operations (37) are most important, followed by Field Experiences (9) and Sponsorship & Marketing (7). Above descriptive results imply that the event industry, particularly managers and directors, needs events management curriculum that can provide students with competencies in event planning as well as in the general business administration, such as financial management, human resource management, and communications. On the other hand, students’ perceptions on the importance of event management curriculum spreaded out across all 10 study areas. Students tended to place more importance on Event Planning & Operations, Filed Experiences, and sponsorship & Marketing. Specifically, 4-year university students perceived that understanding the Hospitality and Tourism Industry (24) is important component in event management curriculum. Compared with university students, 2-year college students specializing in event management chose Field Experiences (28) as the most important component of the curriculum.

Table 3
Count of Respondents’ Perceived Importance Most Important Study Area*
Job
1 2 3 4 5 6 7 8 9 10 Active
Margin Industry – Managers/Directors 1 1 6 2 2 44 7 9 21 7 100 Industry – Junior Staff Members
1 1 3 2 2 37 9 7 4 1 67
Students – 4-Year University 5 2 6 24 2 31 29 15 5 9 128 Students – 2-Year College 1 2 6 3 2 25 28 14 6 8 95 Instructors 0 0 1 0 0 6 8 2 1 0 18 Active Margin 8 5 21 31 8 14
1 86 48 32 28 408
*Study Areas: 1 = Event Coordination & Logistics, 2 = Private & Political Events, 3 = Major Event Areas, 4 = Hospitality & Tourism, 5 = Supporting Areas, 6 = Event Planning & Operations, 7 = Field Experiences, 8 = Sponsorship & Marketing, 9 = Business Administration and 10 = Event Basics & Concepts.
The correspondence analysis on the perception on the importance of event curriculum among five different groups revealed a two-dimensional solution. Table 4 depicts the correspondence analysis summary. As presented in Table 4, first two dimensions were chosen as optimal number of solution (singular value > .20). Since the third and fourth dimension had an unacceptable singular value (<.20) and a small explained variance, the result concludes that the relationship about the perceptions of important event curriculum among five different stakeholders can be best represented by a two-dimensional solution. First dimension explained 70% of variance uniquely, while the second dimension accounted for 19% of total variance. Combined, these two dimensions explained 89% of total variance. With two optimal dimensions, a correspondence analysis was rerun.
Table 4
Correspondence Analysis on Curriculum Importance Proportion of Inertia
Dimension
Singular Value
Inertia
Chi Square
Sig.
Inertia
Proportion Explained
Cumulative Proportion
1 .451 .203 .203 .700 .700 2 .234 .055 .055 .188 .889 3 .161 .026 .026 .090 .979 4 .079 .006 .006 .021 1.000 Total .290 118.307 .000 .290 1.000 1.000 Table 5 shows the contributing groups and curriculum factors to each dimension. For the relative contribution of five different groups to dimensions, first three groups (industry - managers/directors, industry - junior Staff Members, and university students) were loaded in the first dimension, while two other groups (college students and instructors) were loaded in the second dimension. For the

relative contribution of curriculum factors, four curriculum factors shared a commonality in the first dimension, while two curriculum factors had a common trait in the second dimension.
Table 5
Relative Contribution to Dimensions Dimension 1 Dimension 2 Total Group
Industry – Managers/Directors Industry – Junior Staff Members Students – University Students Students – College Students Instructors
.768 .784 .888 .007 .000
.211 .127 .106 .542 .871
.979 .911 .994 .549 .871
Event Curriculum
Event Coordination & Logistics Special Event Planning Meetings, Conventions & Exhibitions Understanding of Hospitality & Tourism Industry Support Areas Event Planning & Administration Field Experiences Event Marketing Business Administration Event Basics & Concepts
.702 .230 .033 .783 .192 .730 .306 .171 .713 .011
.239 .012 .000 .195 .001 .006 .684 .276 .181 .534
.941 .241 .034 .979 .192 .736 .990 .447 .894 .545
In the joint plot (Figure 1), the relationships between the column variables (respondents’ perceived importance of curriculum factors) and the row variables (five stakeholders) were revealed. As discovered in descriptive count of respondents’ perceived importance of event management curriculum (See Table 3), industry professionals (managers/directors) tended to agree that general Business Administration courses are critical to the success in the event industry. Another part of industry group (junior staff members) tended to agree that courses in Event Planning & Operations are more important in event management curriculum. The correspondence analysis also revealed the interrelationship between Event Planning & Operations and Business Administration. The distance between two curriculum factors in Figure 1 was relatively close, constituting a distinct cluster appealing to the two industry groups. On the other hand, Sponsorship & Marketing was the most important component of event management curriculum for university students. College students tended to place more importance on the courses providing them with field experiences, such as professional practicum and site inspection. As for the similarity of curriculum importance among five stakeholders, Event Basics & Concepts, which as not identified as unique curriculum factor, constitutes the similarity among five groups.

DISCUSSION The factor-correspondence analysis employed in this study was an appropriate methodological approach to analyzing the underlying dimensions of event management curriculum and positioning identified dimensions on the merits of their appeals to various stakeholders in event management education. A few observations in the results of factor-correspondence analysis are worth discussion. First, composite means of curriculum factors in Table 2 showed that “Event Planning & Operations,” “Sponsorship & Marketing,” and “Field Experiences” were three most important curriculum dimensions perceived by all stakeholders. This result indicates that industry-oriented courses are to the focal point of event management curriculum and that strong industry and academic ties for the curriculum development is required to ensure the outcome that graduates of event management programs will be qualified for the professional jobs in the event industry. It should be noted, however, that as stated by Riegel and Dallas (2004), hospitality and tourism education is not vocational in the sense of providing students only with the narrow skills needed to function on a particular job within the industry. Rather the purpose of hospitality and tourism education is to produce educated and knowledgeable future industry professionals who are capable of growing and maturing in the chosen field. Thus, future events management curriculum should be constructed to meet the challenges and rapid responses in human resources required in training and developing future workforce in the event industry.
Uni. StudentsIndustry:
Managers/Directors
Note: 6.00 = Event Planning & Operations, 7.00 = Field Experiences, 8.00 = Event Sponsorship & Marketing, 9.00 = Business Administration, 10.00 = Event Basics & Concepts
Industry: Junior Staff
Instructors
Col. Students
Figure 1 A Joint Plot of Event Curriculum and Relevant Stakeholders

The joint plot of correspondence analysis highlighted a two dimension solution portraying the relationship between curriculum factors and stakeholders. The joint plot in Figure 1 showed interesting differences in the perceptions of event management curriculum among stakeholders. Industry managers and directors would more likely place importance on the courses in general business administration, such as financial management, budgeting, human resource management, and communications. Also, industry professionals tended to agree that courses in event planning and operations are critical for the students jumping into the event industry. These results indicate that the industry feels the need of new courses that combine the general management concepts and specific event functions, such as event budget planning and event promotion planning. On the other hand, university students would more likely think that event sponsorship and marketing is the important study area in the event management education. This result reflects that current 4-year event management curriculum offer various courses in marketing and sponsorship as core courses and students also showed their interest in sponsorship and marketing courses. This trend can be understood from the viewpoint that the major sources of industry revenue in Korea derive from sales and promotion events. Another player in the students’ side, college students specializing in event management, tended to place more importance on the courses providing various field experiences, such as site-inspection, professional practicum, and special project. This result indicates that in a relatively short span of education, college students are more eager to experience real industry practices. Overall, to meet the needs of students, the curriculum should focus on the convergence of marketing and field experience, such as event market research, consumer behavior, and promotion strategy in which filed study should in incorporated. CONCLUSION Event management is still a relatively new phenomenon which has featured at the college level for less than nearly 10 years in Korea. While there is an obvious need for the tailored event management curriculum, this study aims to provide some insights into the direction of event management curriculum by evaluating major stakeholders’ perceptions on the existing event management curriculums. The results of this study showed the importance of event management curriculum for different stakeholders, hence of significant benefit for educators and administrators of higher education institutions in Korea to develop the curriculum that reflect the needs of various stakeholders.
University curriculums in almost all disciplines have been changing all the time, adding or removing courses from the overall thrust of programs. Likewise, event management curriculum intended to serve the industry and the students must mirror the environmental changes within the industry and the general education public and must provide a balance of professional skills and knowledge to equip students with a detailed understanding of day-to-day operations and strategic management. This study provided a snapshot of students’ and industry professionals’ opinions and, therefore, the real value of student perception lies in its use in longitudinal studies. Given its purpose as a tool for quality control of the event management education, a longitudinal approach should be adopted in order to provide comparability and benchmark performance across different cohorts of stakeholders and over time. REFERENCES Bowden, R. (2002). Can you trust perceptual maps? Australian Journal of Market Research, 10(1),
3-25.

Brookes, M. (2003). Evaluating the student experience: An approach to managing and enhancing quality in higher education. Journal of Hospitality, Leisure, Sport and Tourism Education, 2(1), 17-26.
Burgan, B., & Mules, T. (1992). Economic impact of sporting events. Annals of Tourism Research, 19(4), 700-710.
Chen , J. (2001). A case study of Korean outbound travelers’ destination images by using correspondence analysis. Tourism Management, 22(1), 345-350
Cunningham, H., & Taylor, S.F. (1995). Event marketing; State of the industry and research agenda. Festival Management and Event Tourism, 2(3/4), 123-137.
Della Bitta, A. J., Loudon, D., Booth, G., & Weeks, R. R. (1977). Estimating the economic impact of a short-term tourist event. Journal of Travel Research, 16(2), 10-15.
Espelt, N.G., & Benito, A.D. (2004). Visitors’ behaviour in heritage cities: The case of Girona. Journal of Travel Research, 44(4), 442-448.
Formica, S., & Uysal, M. (1998). Market segmentation of an international cultural-historical event in Italy. Journal of Travel Research, 36(1), 16-24.
Gazel, R. C., & Schwer, R. K. (1997). Beyond rock and roll: The economic impact of Grateful Dead on a local economy. Journal of Cultural Economics, 21, 41-55.
Gelan, A. (2003). Local economic impacts: The British Open. Annals of Tourism Research, 30(2), 406-425.
Greenacre, M. (2000). Correspondence analysis of square asymmetric matrices. Applied Statistics, 49(3), 297-310.
Hair, J., Anderson, R., Tatham, R., & Black, W. (1998). Multivariate Data Analysis. Fifth Edition, Upper Saddle River, New Jersey: Prentice-Hall.
Harris, P. (1995). A development strategy for the hospitality operations management curriculum. International Journal of Contemporary Hospitality Management, 7(5), 29-32.
Hengst, T. (2004). Professional development: Stepping into academia: Transition from industry to the classroom. CHRIE Communique, November. Richmond, Virginia.
Johns, N., & Teare, R. (1995). Change, opportunity and the new operations management curriculum. International Journal of Contemporary Hospitality Management, 7(5), 4-8.
Jones, C. (2001). Mega-events and host-region impacts: determining the true worth of the 1999 rugby world cup. International Journal of Tourism Research, 3(3), 241-251.
Jeong, M., Horton, B., & Oh, H. (2004). Student evaluations of courses and instructors: An exploratory insight into the process and its implications. Journal of Hospitality and Tourism Education, 16(2), 34-42.
Kang, Y. S., & Perdue, R. (1994). Long-term impact of a mega-event on international tourism to the host country: A conceptual model and the case study of the 1988 Seoul Olympics. Journal of International Consumer Marketing, 6(3/4), 205-225.
Kang, S., Wu, C., & Gould, R. (2005). An exploratory study: Students; perceptions of academic faculty and industry practitioner instructions. Journal of Hospitality, Leisure, Sport and Tourism Education, 4(2), 44-53.
Kim, Y. (2006). A study of structural relationship of customer value and sponsor value on event. Event and Convention Research, 2(2), 19-42.
Knutson, B., Schmidgall, R., & Sciarini, M. (1997). Teaching evaluators in CHRIE member schools: Perceptions of students. Journal of Hospitality and Tourism Education, 9(1), 30-32.
Lee, C., & Taylor, T. (2005). Critical reflections on the economic impact assessment of a mega-event: The case of 2002 FIFA World Cup. Tourism Management, 26(4), 595-603.
Long, P. T., & Perdue, R. R. (1990). The economic impact of rural festivals and special events: Assessing the spatial distribution of expenditures. Journal of Travel Research, 28(4), 10-14.

Marshall, A. (1995). Hotel schools need fewer than doctors, more hoteliers. Hotel and Motel Management, 210(15), 11.
Madden, J. R. (2002). The economic consequences of the Sydney Olympics: The CREA/Arthur Anderson Study. Current Issues in Tourism, 5(1), 7-21.
Mistilis, N., & Dwyer, L. (1999). Tourism gateways and regional economies: the distributional impacts of MICE. International Journal of Tourism Research, 1(6), 441-457.
Moreo, P. (2004). Professional development: Hospitalioty faculty preparation: An overview. CHRIE Communique, March. Richmond, Virginia.
Mount, J., & Niro, B. (1995). Sponsorship: An empirical study of its application to local business in a small town setting. Festival Management and Event tourism, 2(3/4), 167-175.
Mount, J., & Sciarini, M. (1999). IPI and DSE: Enhancing the usefulness of student evaluation of teaching data. Journal of Hospitality and Tourism Education, 10(4), 8-13.
Murphy, P. E., & Carmichael, B. A. (1991). Assessing the tourism benefits of an open access sports tournament: The case 1989 B.C. Winter Games. Journal of Travel Research, 29(3), 32-36.
Murray, H.G. (1997). Does evaluation of teaching lead to improvement of teaching? International Journal for Academic Development, 2(1), 8-23.
Nicholson, R, & Pearce, D. (2001). Why do people attend events: A comparative analysis of visitor motivations at four south Island events. Journal of Travel Research, 39(4), 449-460.
Oldfield, B., & Baron, S. (2000). Student perceptions of service quality in a UK University Business and management faculty. Quality Assurance in Education, 8(2), 85-95.
Park, J., Seo, Y., & Jung, S. (2005). A research on the sponsorship for the performing arts. Event and Convention Research, 1(2), 73-97.
Peterson, K., & Crayton, C. (1995). The effect of an economic impact study on sponsorship development for a festival: a case study. Festival Management and Event Tourism, 2(3/4), 185-190.
Pyo, S. S., Cook, R., & Howell, R. L. (1988). Summer Olympic tourist market: Learning from the past. Tourism Management, 9(2), 137-144.
Riegel, C. D., & Dallas, M. (2004). Hospitality and tourism: Careers in the world’s largest industry. In: Guide to College Programs in Hospitality, Tourism & Culinary Arts (8th Ed.). Richmond, VA: International Council on Hotel, Restaurant, and Institutional Education (CHRIE), 5-18.
Rutherford, D. G., & Kreck, L. A. (1994). Conventions and tourism: financial add-on or myth? Report of a study in one state. Journal of Travel & Tourism Marketing, 3(1), 49-63.
Seo, S., & Choi, K. (2006). A study on the foreigners’ intention to participate in different types of events in Korea. Event and Convention Research, 2(2), 97-115.
Seong, E. (2005). A study on the benefit and effects of event sponsorship. Event and Convention Research, 1(1), 121-139.
Shanka, T., Quintal, V., & Taylor, R. (2005). Factors influencing international students’ choice of an education destination: A correspondence analysis. Journal of Marketing for Higher Education, 15(2), 31-46.
Smith, G., & Cooper, C. (2000). Competitive approaches to tourism and hospitality curriculum design. Journal of Travel Research, 39(3), 90-95.
Stuart, M. (2002). Critical influences on tourism as a subject in UK higher education: Lecturer perspectives. Journal of Hospitality, Leisure, Sport and Tourism Education, 1(1), 5-18.
Tang, Q., & Turco, D. M. (2001). Spending behaviors of event tourists. Journal of Convention & Exhibition Management, 3(2), 33-40.
Trowler, P. (1997). Beyond the Robbins trap: Reconceptualising academic responses to change in higher education. Studies in Higher Education, 22, 301-319.

Wilson, M. (1997). Women in educational management: A European perspective. London: Methuen.
Fourth International Event Research Conference Re-evaluating the City/Town: Events as a Catalyst for Change
EVENT SPONSORSHIP BY INDIA’S BEVERAGE SECTOR
Miguel Moital Centre for Event & Sport Research
School of Services Management, Bournemouth University, UK [email protected]
Arjun Bahl
Business Development Manager Elevate Nightclub, New Delhi, India
Caroline Jackson
Centre for Event & Sport Research School of Services Management, Bournemouth University, UK
ABSTRACT The events industry in India has grown significantly over the past years, supported by an emerging middle class eager to experience new leisure opportunities. While there is evidence that many companies are ever more involved in event sponsorship, there is also a growing competition among event organisers for the sponsors’ resources. This paper describes the findings of a study examining the event sponsorship patterns and preferences by India’s drinks industry. The results indicate that while the drinks industry was heavily involved in event sponsorship, less than 10 percent of the businesses accounted for more than 80% of the event sponsorship investment. Beverage companies in India used sponsorship to achieve a range of objectives, including creating goodwill among the community, gaining advantage over competitors and increasing brand awareness. Finally, the results have also shown that drinks businesses in India prefer in-kind sponsorship and being the single sponsor of the event. Keywords: Marketing, Event Sponsorship, Beverage Industries, India
INTRODUCTION Event sponsorship has become a very important tool for both event organisers and sponsors. For event organisers sponsorship has become one of the major sources of income, while for sponsors it adds a promotional tool to the traditional armoury of marketing communications tools (Parker, 1991). Given this ability of event sponsorship to provide reciprocal benefits to both sponsors and event organisers, it is not surprising that event sponsorship has been growing over the years (Bowdin et al., 2006). India has gone through significant social and economic change in the past two decades. On the economy front, India has been growing at the rate of 7 per cent per annum (World Bank, 2006). One of the net results of this growth is a profound change in India’s social landscape. The size of the middle class has more than tripled in the past 20 years and if India succeeds in maintaining a strong economic performance, half of the population will be middle class between 2020 and 2040 (Das, 2001). Economic prosperity has brought along social change, with India’s new middle class eager to adopt western lifestyles (Khairullah and Khairullah, 2005). Greater disposable income and more leisure time available increases participation in leisure activities (Fan and Pfitzenmaier, 2002) such as events.

Not surprisingly, the expenditure on drinks by Indian consumers has grown significantly between 2000 and 2005. The expenditure on alcohol rose 43.6 percent, the soft drinks market grew nearly 50 percent in value and the hot drinks market 16 percent (Euromonitor International 2006a, 2006b, 2006c). In 2005 the beverage sector in India was worth more than 250 billion Rupees. The aforementioned Euromonitor International reports further predict that the beverage market will continue to grow steadily. As a market becomes more mature it also becomes more competitive (Fan and Pfitzenmaier, 2002). Consequently, companies need to find innovative ways to promote their products. Traditionally, companies have communicated with their potential customers through advertising, sales promotions, publicity or by personal selling (Kotler and Keller, 2006). More recently, businesses recognised that event sponsorship, when used together with other media, can enhance the effectiveness of the promotional mix (Bowdin et al., 2006). For example, event sponsorship can increase awareness and enhance the image of the company or of some of its products/brands; create sales opportunities and provide companies with hospitality opportunities (Fan and Pfitzenmaier, 2002; Pope, 1998; Crompton, 1996). Moreover, one way of companies reacting to greater competition is by introducing new products in the market. Event sponsorship has also been shown to potentially play an important role in influencing new product adoption (Crompton, 1996). At a time where little tangible differences exists among many products, one way of differentiating products from competitors is through branding, notably emotional branding. However, it has been argued that the traditional marketing communication tools may not be totally effective in establishing an emotional relationship between the brand and consumers (Crompton, 1996). Events, as an experience based product, are usually emotional occurrences, and their main aim is to create positive emotions on participants. Thus, showcasing their products or brands during events provides businesses with an opportunity to make their brands more emotional. Despite the growing importance of event sponsorship for both event organisers and businesses, it is claimed that little research on event sponsorship decision making has been undertaken (Dolphin, 2003). Moreover, despite the fact that sponsorship activities are likely to vary across product categories, little research has been undertaken regarding event sponsorship by specific industries. There is virtually no publicly available research on the event sponsorship activities and decision making by beverage companies. One of the exceptions is the study by Meerabeau et al (1991), who analysed the external factors influencing sponsorship by the alcohol industry. The use of event sponsorship by Indian businesses, including beverage companies, is also largely unknown. Thus, the aim of this paper was to examine the use of event sponsorship by India’s beverage industry. The research objectives of this paper are: • To investigate the extent to which companies resort to event sponsorship as a marketing
tool; • To investigate the benefits sought when, and the barriers for, sponsoring events; • To explore the form and structure of event sponsorship favoured by companies. • To examine the potential growth of event sponsorship in India. This paper is divided in four sections. The first section reviews the existing literature on sponsorship decision making. In the next section, the methodology of the study is explained and the characteristics of the sample provided. Next, the results of the questionnaire are analysed and this paper finishes with a discussion of the results. SPONSORSHIP RESEARCH

Sponsorship is regarded as one the most rapidly growing areas of marketing (Meenaghan, 2001a) and there have been calls to treat sponsorship at the same level of other marketing communication tools (Dolphin, 2003). While the growth of sponsorship has been fuelled by many factors, a major force driving its growth has been the inability of the traditional promotion mix to deliver the results that it once did in a highly competitive environment. Sponsorship provides businesses with a potentially novel way of communicating with prospective customers. It has been used as the answer to the rise in advertising cost, the clutter and fragmentation of media, the advancement of technology, changing government policy and changing consumer lifestyles (Meenaghan 1983; Meenaghan 1991; Sneath et al, 2005). Not surprisingly, the rise in sponsorship activity has been accompanied by a growth in sponsorship research. Sponsorship research has focused on three main areas: sponsorship activity and decision-making (e.g. Slack and Bentz, 1996; Mack, 1999; O’Hagan and Harvey, 2000; Fan and Pfitzmaier, 2002; Thjomoe et al, 2002; Shen, 2004; Maher et al., 2006), the management of sponsorship (Farrely et al, 1997; Amis et al, 1999; Thjomoe et al, 2002) and the effects of sponsorship on consumers (e.g. Crompton, 1996; Lee et al, 1997; Pope, 1998; McDaniel and Mason, 1999; Meenaghan, 2001a; Meenaghan, 2001b; Tripodi, 2001; Sneath et al, 2005). Motivation to Sponsor Sponsorship decision making research has covered different areas of the process. However, the depth of understanding has been hampered by the reluctance of sponsors to disclose information regarding their decision-making process (Fan and Pfitzenmaier, 2002). Perhaps due to its importance and relatively low degree of sensitivity, several studies have attempted to understand the general benefits sponsors seek to achieve from sponsorship (Fan and Pfitzmaier, 2002; O’Hagan and Harvey, 2000). Irwin and Asimakopoulos (1992) argued that the sponsorship decision is driven by a combination of corporation or product/brand-related objectives. Table 1 provides a summary of sponsorship objectives and their rationale. While past research has shown that businesses use event sponsorship to achieve a number of benefits, results have failed to provide a clear pattern in relation to which are the most important ones. This is perhaps because the benefits sought by sponsors depend on the type of sponsoring company, products sold and event (Mack, 1999; Bowdin et al., 2001; Walliser, 2003). Given that the range of benefits sought is influenced by many and different factors, event managers need to understand the mix of benefits sought by sponsors for their specific event. Sponsorship Form and Structure Sponsors will also consider whether sole sponsorship or co-sponsorship is preferred (Masterman and Wood, 2006). For the sponsor, solus sponsorship structure has the benefit of taking maximum advantage of the communication opportunities provided by the event as no other company/product is associated to the event. If sponsorship by more than one sponsor is regarded as acceptable, then further consideration must be given to the hierarchical relationship between the sponsors. In a tiered hierarchical structure, sponsors’ rights and payment terms may differ according to their level in the structure. Unlike the tiered hierarchical structure, in a flat structure all sponsors are acknowledged with the same level of status. Empirical research on the sponsors’ decision-making has also covered the level in the organisation at which the different sponsorship decisions are made (O’Hagan and Harvey, 2000; Thjomoe et al, 2002) and the factors influencing choice of potential sponsorship activities (Webb and Carter, 2001). Despite some industries being more involved in sponsorship (Crompton, 1993) and the differential decision making according to the sponsors industry (Walliser, 2003), analysis of specific industries are rare. The beverage industry, notably alcoholic drinks sector, has long been a major sponsor of events, but this importance has not been matched by research on the industry’s event sponsorship. The few exceptions include the studies by Meerabeau et al. (1991)

and Crompton (1993). Most empirical research on sponsorship decision making has used samples containing businesses operating in various industries. While some studies did include beverage companies in their samples (e.g. Farrelly et al., 1997), they did not focus on the beverage sector, either in isolation or in comparison to other industries. METHODOLOGY In order to understand the usage of event sponsorship by the Indian drinks producers, a self-administered questionnaire was used to collect data. The questionnaire covered four areas related to the event sponsorship decision: (1) event sponsorship activity, (2) Form and structure of event sponsorship, (3) motives for sponsoring events and (4) event sponsorship budget trends. Companies often regard that much of the information about their marketing practices is sensitive and confidential and as such are reluctant to share that information. Past research has shown that sending questionnaires to companies is an ineffective method of data collection about event sponsorship, notably when complex information regarding event sponsorship or financial information is requested (Fan and Pfitzenmaier, 2002). Fan and Pfitzenmaier (2002) further noted that having previous personal contact with people was a major factor contributing to actual participation in the survey. Thus, snowball sampling (Sarantakos, 1998) was used as the sampling method.
Table 1
Event Sponsorship Objectives OBJECTIVE RATIONALE
Drive product sales Most events offer direct selling opportunities (Van der Wagen and Carlos, 2005) such as food and drinks. Many sponsors are sponsoring event for their ability to generate sales, which can be directly attributed to sponsorship of the event (Masterman and Wood, 2006; Dolphin, 2003).
Reach niche audiences
Many events attract very specific audiences, enabling sponsors to achieve high levels of communication efficiency that would have been difficult using other communication tools. By accessing specific audiences at one time, sponsors can communicate more economically with potential buyers and decision makers (Allen et al., 2005).
Increase brand awareness
According to the customer based brand equity model (Keller, 2003), salience must be achieved if the equity of the brand is to be enhanced. Event sponsorship provides a good platform to increase brand awareness (Cornwell et al, 2001), either by selling and promoting the brand on site or through media coverage of the event (Skinner and Rukavina, 2003).
Increasing merchandising opportunities
Events provide a perfect platform for sponsors to invest in merchandising (Skinner and Rukavina, 2003; Bowdin et al., 2001). Sponsoring events enables the company to give away branded merchandising such as jerseys, t-shirts and umbrellas. This helps the sponsor to extend the exposure of its brands to a large number of people, both within and beyond those attending the event, an opportunity that is highly valued by the sponsor (Allen et al, 2005).
Corporate hospitality Business relationships are often very formal and leave little scope for socialisation between business partners (Allen et al, 2005). However, creating and developing social relationships is very important for business success. Event sponsorship provides

corporate entertainment opportunities that facilitate the development of social ties between the sponsor and its suppliers, clients and employees (Masterman and Wood, 2006; Bowdin et al., 2001; O’Hagan and Harvey, 2000; Crompton, 1996)
Associate products with particular lifestyles
Companies often sponsor events because they attract individuals whose lifestyle is closely linked to the consumption of the products they sell (Ashill et al., 2001). For example, companies often sponsor youth-oriented events such as music events/festivals because the lifestyle of the youth makes them potential buyers of their products.
Gain advantage over competitors
Sponsorship provides the sponsor with an opportunity to ensure category exclusiveness. This category exclusiveness, in turn, enables the sponsor to stand out from their competitors thereby gaining competitive advantage (Skinner and Rukavina, 2003; Amis et al., 1997; Crompton, 1996).
Increase media coverage
Many events, notably the larger ones, attract media attention, which provides businesses with an opportunity to communicate with audiences beyond those attending the event. Thus, one of the important reasons why sponsors use events as a communications tool is their ability to attract media coverage (Crompton, 1996).
Create goodwill among the community
By sponsoring events that are likely to be attended by the community, the sponsor can generate goodwill among the community (Mack, 1999; Parker, 1991). Greater goodwill enables the sponsoring company to raise its profile and easily get the message across (Dolphin, 2003). Creating goodwill is likely to be a very important benefit for companies selling products that entail negative social impacts, such as alcohol and tobacco.
Corporate image Event sponsorship enables companies to reposition or strengthen its corporate image (Tripodi, 2001). According to FitzGerald and Arnott (2000), the cosmetic company Yardley changed its feminine connotation by sponsoring Formula 1. Sponsoring a male dominated sport enabled the company to develop a more masculine image which contributed to the successful introduction of male cosmetics in the market.
One of the authors works in the entertainment industry in India and has developed personal contact with many managers of beverage companies. These individuals were approached and asked to fill in the questionnaire as well as if they knew managers of any other beverage companies who could be willing to participate in the study. Companies based in both New Delhi and Mumbai participated in the study. Initially, an online survey was chosen as the means of collecting the data. However, many respondents mentioned difficulties of accessing the Internet. Consequently, a paper version of the questionnaire was handed in person to those who indicated preference for this means. Given that confidentiality is an important issue when disclosing business information, the respondents were assured that the information would be treated with the strictest confidentiality. A total of 64 questionnaires were delivered and 61 were returned, yielding a response rate of 95 percent. The questionnaire was administered in August 2006. As far as the characteristics of the sample is concerned, the respondents were predominantly male (75%) and relatively young (around two thirds were under 35 years old). Respondents were mainly sales managers (31.1%) and marketing managers (31.1%). Virtually all companies sold either non-alcoholic drinks (49.2%) or alcoholic drinks (45.9%), with only a few selling both types of drinks. The annual turnover of the 61 companies was 156 billion Rupees, equivalent to around 1.77 billion GBP (1 GBP=88 Rupees).

RESULTS Event Sponsorship Activity As Table 2 demonstrates, the annual event sponsorship budget of the 61 businesses exceeded 55 million GBP, with the drinks industry sponsoring 3,748 events in two years. On average, each company sponsored 61 events in the last two years and spent more than 900 thousand GBP per year. However, these relatively high values are influenced by four businesses (6.6% of the sample), which accounted for nearly half of the total events sponsored and more than than 80 percent of the sample’s total sponsorship budget. In fact, more than half of the sample appeared to have a modest involvement in event sponsorship. These businesses sponsored twenty or less events in the past two years and accounted for only slightly more than 3 percent (1.76 million GBP) of the annual spending.
Table 2 Events sponsored in the past two years and annual event sponsorship budget (N=61)
Events Number of companies Event Sponsorship Budget (GBP)
sponsored N % Mean All % of
Total None 1 1.6 0 0 0 1-5 12 19.7 22 064 264 773 0.5 6-10 10 16.4 87 500 875 000 1.6 11-20 11 18.0 56 612 622 727 1.1 21-100 16 26.2 323 011 5 168 182 9.3 101-200 7 11.5 454 545 3 181 818 5.7 +200 4 6.6 11 434 659 45 738 636 81.9 All 3748 915 592 55 851 136 100 Mean 61.44 - - -
Form and structure of event sponsorship The findings indicate that in-kind sponsorship was the most frequently used form of sponsorship (Table 3), a result that is in line with companies’ preferred form of sponsorship. In contrast, sponsorship in cash was the least used and the least preferred by the respondents. The results also suggest that, in hierarchical terms, the current form of sponsorship follows a similar pattern to that of the managers’ preferences. However, there is an apparent difference between the levels of actual and the preferred forms of sponsorship. For example, nine out of ten respondents indicated in-kind as the preferred form of sponsorship, but only 70 percent of the events that were sponsored by the sample in the past two years took this form. Similarly, while cash and both forms were favoured by only less than 10 percent of the managers, 30 percent of the events had been sponsored using these forms. As far as the structure of sponsorship is concerned, solus structure was clearly the favoured by managers. Not only was it the preferred structure for nearly 80% of the respondents, but it was the least preferred for only a minority (8.2%). The results suggest little difference between the preference for tiered and flat structures. For each of these structures, around 10 percent said it was the most preferred and more than 40 percent it was the least preferred.
Table 3 Form and structure of sponsorship

Past two years (n=3748 events)
Most preferred (n=61)
Least preferred (n=61)
N % N % N % Form of sponsorship
Cash 527 14.1 2 3.3 51 83.6 In-kind 2615 69.8 55 90.2 3 4.9 Both 606 16.2 4 6.5 1 11.5
Total 3748 100 61 61 28 100 Structure of sponsorship
Solus Structure - - 48 78.7 5 8.2 Tiered Structure - - 6 9.8 26 42.6
Flat Structure - - 7 11.5 30 49.2 Total - - 61 100 61 100
Motives for sponsoring events Respondents were asked to indicate the importance of a range of benefits for sponsoring events. It was not possible to undertake a factor analysis due to the insufficient number of questionnaires required to run this procedure. The results suggest that Indian drink companies seek to achieve a range of benefits from sponsoring events. As shown Table 4, with the exception of changing or enhancing the corporate image, more than six out of ten respondents rated each benefit as important or very important. Moreover, the five most important motives were viewed as important or very important by more than 80 percent of the respondents. The three most important motives, in descending order of the means, were (1) create goodwill among the community, (2) gain advantage over competitors and increase brand awareness (same mean value). The two least important motives were, driving product sales and change and enhancing corporate image.
Table 4 Importance of motives for sponsorship
Not
important
Little importan
t
Important
Very importan
t
Mean SDev
Create goodwill among the community 3.3 13.1 24.6 59.0 3.39 0.84
Gain advantage over the competitors 6.6 13.1 19.7 60.7 3.34 0.95
Increase brand awareness 3.3 11.5 32.8 52.5 3.34 0.81 Increase media coverage 3.3 9.8 41.0 45.9 3.30 0.78 Associate with particular lifestyles 6.6 11.5 32.8 49.2 3.24 0.91 Reach niche audiences 4.9 18.0 32.8 44.3 3.16 0.90 Increase merchandising opportunities 14.8 14.8 13.1 57.4 3.13 1.15
Entertain clients (corporate hospitality) 9.8 13.1 31.1 45.9 3.13 0.99
Drive product sales 8.2 29.5 41.0 21.3 2.75 0.89 Change or enhance corporate image 16.4 42.6 29.9 13.1 2.38 0.92
Note: SDev - Stardard Deviation

Respondents were also asked to indicate the main reason that prevented, or could prevent, their company from sponsoring events (Table 5). In other words, these are the factors that were discouraging, or could discourage, businesses from sponsoring events. In hierarchical terms, as defined by frequency of response of the main factor, the top three factors were, the inadequacy of the event’s audience to the brand’s target audience (28.3%), the greater effectiveness/value of traditional tools (18.3%) and budgetary constraints (15%).
Table 5 Factors influencing against event sponsorship
N % Mismatch event/brand target audiences 17 28.3 Traditional tools more effective/offer more value
11 18.3
Budgetary constraints 9 15.0 Lack of good proposals 8 13.3 Profile of the event 7 11.7 Evaluation of sponsorship is difficult 5 8.3 No brand exclusivity 3 5.0
Total 60 100 Event sponsorship budget trend Respondents were also asked whether their event sponsorship budget had increased in the past and if they expected further increases in the future (Table 6). The results indicate a positive trend, with around two thirds agreeing that event sponsorship had increased and would continue increasing. Moreover, only slightly more than 10 percent disagreed that their budget had increased in the past and an even lower percentage disagreed that the budget would increase in the future.
Table 6 Event sponsorship budget trend
SD D U A SA Mean SDev
Event sponsorship budget has increased in the past 3.3 8.2 21.3 55.7 11.5 3.63 0.81
Event sponsorship budget is likely to increase in the future 0.0 6.6 27.9 42.6 23.0 3.81 0.87
Note: SD - Strongly Disagree; D – Disagree; U – Uncertain; A - Agree; SA - Strongly Agree; SDev - Stardard Deviation. CONCLUSIONS AND MANAGERIAL IMPLICATIONS From an event organiser point of view, sponsors are customers that need to be attracted and satisfied. However, securing sponsorship is becoming more difficult and complex. On the one hand, the corporate sponsorship decision making process is becoming more rigorous (Bowdin et al., 2001). On the other hand, the growth of the events industry has led to greater competition between event organisers for sponsors’ resources. Thus, if event organisers are to successfully obtain the right sponsorship deals, they need to approach the right sponsors with the right ‘product’. This requires a thorough understanding the sponsorship decision making of potential sponsors. Focusing on India’s beverage industry, this paper investigated sponsorship activity, the reasons for sponsorship, the structure and form of sponsorship and event sponsorship budget trends. Information regarding sponsorship activity is difficult to obtain given the sensitity attached to this type of information. Building on findings of previous research (Fan and Pfitzenmaier,

2002), personal contact was used as a basis for data collection. This resulted in every single company participating in the study disclosing information regarding their involvement in event sponsorship, both financial and in terms of the number of events sponsored. The results indicate an industry heavily involved in event sponsorship. However, there were clear differences in the level of their involvement in event sponsorship. Four companies, sponsoring more that 200 events each in the past two years, accounted for 80 percent of the overall investment in event sponsorship. When asked about the company’s future financial involvement in event sponsorship, the majority of managers agreed that the financial resources allocated to event sponsorship were likely to increase in the future. Thus, event managers should be confident about this industry’s commitment to continue sponsoring events. Two of the issues that sponsors will evaluate when deciding whether to sponsor an event or not are the form and structure of sponsorship (Masterman and Wood, 2006; Van der Wagen and Carlos, 2005; Crompton, 1996). The results show that India’s beverage industry favour in-kind sponsorship. While Watt’s(1998) assertion that drinks companies can often become major sponsors through bartering is supported, the results suggest an apparent inconsistency between actual and preferred form of sponsorship. Even though 30 percent of the events sponsored over the two years involved cash payments (partially or fully), an overwhelming majority of managers preferred in-kind sponsorship. One plausible explanation for this discrepancy is the fact that the sponsorship rights of larger events are more valuable than the ‘in-kind’ value that they can offer. In other cases it may not be feasible to sponsor with drinks at all and thus sponsorship is paid in cash only. Nonetheless, it appears that the Indian beverage sector were reluctant to sponsor deals that involved cash, notably those that did not involve, at least partially, sponsorship in drinks. Regarding the structure of sponsorship, the results suggest a clear preference for solus structure. Thus, claims that companies generally prefer to be the single sponsor of an event (Meerabeau et al., 1991) are extended to the beverage industry in India. However, the results are inconclusive regarding the preference for tiered or flat structure. For event managers, it is clear that they need to be cautious when approaching drinks companies for sponsorship in cash and involving other sponsors. According to the results, sponsorship requests involving drinks and solus sponsor are more likely to succeed. Understanding the objectives that sponsors seek to achieve when sponsoring events is very important. Not only does it helps event organisers to identify those factors that they need to highlight in the sponsorship proposal, but they know what benefits they have to deliever if they are to keep one important event customer satisfied. The difference in mean value between the most important and the fifth most important motives was 0.15, suggesting that the Indian drinks industry uses sponsorship to achieve a range of objectives. Yet, the results suggest that highlighting the opportunities to create goodwill among the community, to gain advantage over competitors and increase brand awareness would be the most effective way of securing sponsorship by the drinks industry in India. These results regarding the motivation to sponsor events can be interpreted in light of the uniqueness of the Indian context. Traditionally, the Indian culture is reluctant to accept alcohol consumption. Many religious groups maintain a strong influence on India’s culture and these groups do not usually favour the consumption of alcohol. Hence, beverage companies, notably those selling alcohol, need to work hard in order to develop the community’s goodwill towards the consumption of alcohol and their own brands. The high importance of the brand awareness motive is perhaps a result of the strong restrictions to the advertisement of alcoholic drinks taking place in India (it is not legal to advertise alcoholic and tobacco products in any form of media) Given the existing legal framework,

drinks producers are compelled to use communication channels that do not clash with existing legal restrictions. In face of such restrictions, sponsoring events provide a good alternative in promoting brand awareness as alcoholic brands are allowed to sponsor them. The relatively high importance of the competitive advantage motive supports the contention that the Indian drinks market is becoming more mature. As discussed in the introductory section, not only has the drinks market has been growing considerably, but forecasts suggest that this trend is to continue. Drinks multinationals entered the country, threatening local businesses. Small drinks businesses were set up to cater for niche markets, denting the market share of larger players. These reasons are driving managers of drinks businesses to place competitive advantage high in the business priorities ladder. Given the aforementioned restrictions in terms of advertising and acceptance of alcohol in society, events appear to be regarded as an effective strategy to strengthen the company’s competitive position in the market. Contrary to previous research, which found promoting corporate image as the main reason for sponsorship (O’Hagan and Harvey, 2000), enhancing corporate image was clearly the least important motive for engaging in event sponsorship. This may be a consequence of the branding characteristics of the drinks industry, where the product’s brand name is often different from that of the name of the company. This further supports the contention that the relative importance of objectives may vary according to business context. Besides the factors that motivate businesses to engage in sponsorship, understanding those factors that discourage sponsorship could also provide valuable information for event managers. Whilst these factors were diverse, the results indicated that the single most important factor influencing against using sponsorship was the inadequacy of the event’s target audience. Thus, event managers need to ensure that the event’s target audience matches the characteristics of the sponsors’ target market. An analysis of the factors suggests that the reasons discouraging event sponsorship are related to the quality of the sponsorship proposals. Besides the aforementioned target audience issues, the effective sponsorship proposal should (1) highlight the benefits of sponsorship in comparison to traditional marketing communication tools, (2) emphasise the profile of the event and (3) offer brand exclusivity. Furthermore, despite the difficulties in measuring the effectiveness of sponsorship (Dolphin, 2003), event managers should stress how evaluation of the sponsorship results could take place. FUTURE RESEARCH While this study provides understanding regarding the sponsorship decision and involvement of drinks businesses in India, future researchers are encouraged to extend this work in a number of ways. One of the important features of this investigation was the focus on a non-western business context. As discussed earlier, the results suggest a close relationship between the business context and the factors influencing the event sponsorship. Hence, future research could give greater consideration to their relationship. While this paper has examined the sponsorhip decision making and involvement of the drinks industry as whole, comparison between drinks businesses’ characteristics should also be explored with a view to examine differential sponsorship patterns within the industry. One likely candidate is the type of drinks sold - companies that sell and do not sell alcohol. Other variables that could be used including the size of the company and involvement in sponsorship (number of events sponsored and investment). The other obvious lead will be to replicate this study in different contexts (e.g. other countries or industries). However, it should be noted that the drinks industry in India is made up of hundreds of businesses, which may not be the case of many industries in other countries. When there are only a few players operating in the market, perhaps a less structured methodology will be more appropriate. These research leads, if followed, will result in a better understanding of the sponsorship decision-making process, benefiting event management theory and improving sponsorship management practice.

REFERENCES Allen, J., O’Toole, W., McDonnell, I. and Harris, R. (2005), Festivals and special events
management (3rd ed), Milton, Wiley. Amis, J., Slack, T. and Berret, T. (1997), ‘Sport sponsorship as distinctive competence’,
European Journal of Marketing, 33 (3/4), 250-272. Ashill, N., Davies, J. and Anthony, J. (2001), ‘Attitudinal Constructs Towards Sponsorship
Scale Development using a National Sports Competition within New Zealand’, International Journal of Sports Marketing and Sponsorship, 2 (1), 291-313.
Bowdin, G., McDonnell, I., Allen, J. and O’Toole, J. (2001), Event Management, Oxford, Butterworth-Heinemann.
Cornell, T., Roy, D. and Steinard II, E. (2001), ‘Exploring managers’ perceptions of the impact of sponsorship on brand equity’, Journal of Advertising, 30 (2), 41-51.
Crompton, J. (1993), ‘Sponsorship of sport by tobacco and alcohol companies: a review of the issues’, Journal of Sport and Social Issues, 17, 148-167.
Crompton, J. (1996), ‘The potential contributions of sports sponsorship in impacting the product adoption process’, Managing Leisure, 1, 199-212.
Das, G., 2001. ‘India’s growing middle class’, The Globalist, 5th November. Retrieved August 15, 2006 from http://www.theglobalist.com/DBWeb/StoryId.aspx?StoryId=2195
Dolphin, R. (2003), ‘Sponsorship: perspectives on its strategic role’, Corporate communications: an International Journal, 8 (3), 137-186.
Euromonitor International (2006a), Alcoholic drinks in India. Retrieved August 15, 2006 from: http://www.gmid.euromonitor.com
Euromonitor International (2006b), Consumer lifestyles in India. Retrieved August 15, 2006 from http://www.gmid.euromonitor.com
Euromonitor International (2006c). Soft drinks in India. Retrieved August 15, 2006 from http://www.gmid.euromonitor.com
Fan, Y. and Pfitzenmaier, N. (2002), ‘Event Sponsorship in China’, Corporate Communications: An International Journal, 7 (2), 110-116.
Farrely, F., Quester, P. and Burton, R. (1997), ‘Integrating sports sponsorship into the corporate marketing functions: an international comparative survey’, International Marketing Review, 14 (3), 170-192.
Fitzgerald, M. and Arnott, D. (2000), Marketing Communications Classic, London: Thompson Press.
Irwin, R. and Asimakopoulos, M. (1992), ‘An approach to evaluation and selection of sports sponsorship proposal’, Journal of Sports Marketing Quarterly, 1 (2), 43-51.
Keller, K. L. (2003), Strategic Brand Management: Building, Measuring and Managing Brand Equity (2nd ed), New Jersey: Prentice Hall.
Khairullah, D. and Khairullah, Z. (2005), ‘A study of the extent of westernisation in India magazine advertisements’, Asia Pacific Journal of Marketing and Logistics, 17 (2), 2-15.
Kotler, P., and Keller, K. (2006), Marketing Management (12th Ed.), Prentice Hall, Upper Saddle River, NJ.
Lee, M., Sandler, D. and Shani, D. (1997), ‘Attitudinal constructs towards sponsorship: scale development using three global sporting events’, International Marketing Review, 14 (3), 159-169.
Mack, R. (1999), ‘Event sponsorship: an exploratory study of small business objectives, practices and perceptions’, Journal of Small Business Management, 37 (3), 25-30.
Maher, A., Wilson, N., Signal, L., and Thomson, G. (2006). ‘Patterns of sports sponsorship by gambling, alcohol and food companies: an Internet survey’, BMC Public Health, 6, 95-103.
Masterman, G. and Wood, E. (2006), Innovative Marketing Communications: Strategies for the Event Industry, Burlington, Elsevier Butterworth-Heinemann.
McDaniel, S. and Mason, D. (1999), ‘An exploratory study of public opinion towards alcool and

tobacco sponsorship of sporting events’, Journal of Services Marketing, 13 (6), 481-499.
Meenaghan, T. (1983), ‘Comercial Sponsorship’, European Journal of Marketing, 17 (7), 5-13. Meehaghan, T. (1991), ‘Role of sponsorship in the Marketing communication mix’,
International Journal of Advertising, 10 (1), 35-48. Meenaghan, T. (2001a), ‘Sponsorship and Advertising: a Comparison of consumer perceptions’,
Psychology & Marketing, 18 (2), 191-215. Meenaghan, T. (2001b), ‘Understanding sponsorship effects’, Psychology & Marketing, 18 (2),
95-22. Meerabeau, E., Gillet, R., Kennedy, M., Adeoba, J., Byass, M. and Taby, K. (1991),
‘Sponsorship and the drinks industry in the 1990s’, European Journal of Marketing, 25 (11), 39-56.
O’Hogan, J. and Harvey, D. (2000), ‘Why do companies sponsor arts events? Some evidence and a proposed classifications’, Journal of Cultural Economics, 24, 205-224.
Parker, K. (1991), ‘Sponsorship: the research contribution’, European Journal of Marketing, 25 (11), 22-30.
Pope, N. (1998), ‘Consumption values, sponsorship awareness, brand and product use’, Journal of Product & Brand Management, 7 (2), 124-136.
Sarantakos, S. (1998), Social research, Palgrave, New York. Shen, W. (2004), ‘A comparative study on corporate sponsorships in Asia and Europe’, Asia
Europe Journal, 2, 283-295. Skinner, B. and Rukavina, V. (2003), The Complete Guide to Event Sponsorship, New York:
Wiley. Slack, T. and Bentz, L. (1996), ‘The involvement of small businesses in sport sponsorship’,
Managing Leisure, 1, 175-184. Sneath, J., Finney, R. and Close, A. (2005), ‘An IMC approach to event marketing: the effects
of sponsorship and experience on customer attitudes’, Journal of Advertising Research, December, 373-381.
Thjomoe, H., Olson, E. and Brown, P. (2002), ‘Decision-making processes surrounding sponsorship activities’, Journal of Advertising Research, November/December, 6-15.
Tripodi, J. (2001), ‘Sponsorship – a confirmed weapon in the promotional armoury’, International Journal of Sports Marketing & Sponsorship, March/April, 1-20.
Van Der Wagen, L. and Carlos, B. (2005), Event management for tourism, cultural, business and sporting events, Upper Saddle River, New Jersey.
Walliser, B. (2003), ‘An international review of sponsorship research: extension and update’, International Journal of Advertising, 22, 5-40.
Watt, D. (1998), Event Management in Leisure and Tourism, Harlow: Addison Wesley Longman.
Webb, J. and Carter, S. (2001), ‘Sponsorship activities and the small firms sector’, Managing Leisure, 6, 168-179.
World Bank (2006), India: country data profile. Retrieved August 15, 2006 fromb http://web.worldbank.org

Fourth International Event Research Conference Re-evaluating the City/Town: Events as a Catalyst for Change
HOMELESS WORLD CUP 2006 – PARTICIPANT OUTCOMES
Emma Sherry Deakin University
[email protected] ABSTRACT Marginalised groups, such as people experiencing homelessness, are largely excluded from participation in sport events. Through participation in sport events, such as the Homeless World Cup (HWC), an annual international soccer event for people experiencing homelessness, both participants and the broader community can benefit and experience individual and social outcomes. Research undertaken via interviews with the Street Socceroos (Australian HWC team) during their 2006 HWC experience identified both intrinsic benefits for the individual sport event participants, including as increased self-esteem, and social outcomes for the community, including improved community housing outcomes.
INTRODUCTION The Homeless World Cup (HWC) was established in 2003 as an international soccer event developed to provide opportunities, including access to support services and interaction with others, for participants experiencing homelessness and associated social problems. National participation in the HWC has increased from 18 countries in 2003 to an expected 88 countries in Melbourne in 2008. This increase in international participation, and associated high profile media coverage, establishes the HWC as a major sport event. However, unlike many other major sport events on the international calendar, the participants are drawn from a marginalised, rather than mainstream or elite community. The aim of this study was to investigate the outcomes of participation in a sport event, the 2006 HWC in Cape Town, South Africa in 2006, at the individual level. The study specifically explored the experiences of the participants in the training program before the HWC, and two months after their participation in the event, to identify any social outcomes for this group. This paper will discuss the concepts of sport and social exclusion, sport and social benefit and provide additional background to the HWC. The research context and method will be outlined, and details of the results and their practical implications will be presented and discussed. The paper will conclude with a proposal for future research directions. Sport events have been identified by governments across Australia, both federal and state, as appropriate methods of developing social capital, as the development of a strong, integrated community, through shared experiences and regular contact with others, may have a positive impact on socially excluded groups. Participation in sport events is one way through which this interaction can be achieved (Jarvie, 2003). Participation in sport events is currently viewed in many countries, including the USA, Canada and United Kingdom as a medium for realising the goal of improved social welfare. Participation at all levels has been linked to both the development of personal self-esteem and a sense of community, and according to Jarvie (2003: 139), the “relationship between sport and the community has become central to policies of social inclusion and community regeneration”. There has been limited analysis of the social outcomes for participants in sport (e.g., Bailey, 2005; Sandford, Armour & Warmington, 2006; Sasidharan, Payne, Orsega-Smith & Godbey,

2006). There is extant literature on the roles and experiences of event volunteers (Downward, Lumsdon, & Ralston, 2005; Fairley, Kellett, & Green, 2007; Solberg, 2003; Twynam, Farrelll, & Johnston, 2002), event spectators (Kurtzman & Zauhar, 2005; Smith, 2006); event tourists (Higham & Hinch, 2006; Kurtzman, 2005; Weed, 2006) and management of events (Chalip & Leyns, 2002). There is however limited research on the event participants or athletes and their experiences of event participation. Rather, the participant level research focus has been in the fields of sport science and sport medicine. This study aims to address this gap. SPORT EVENTS AND THE DEVELOPMENT OF SOCIAL CAPITAL The concept of social capital has been identified as the features of social life, such as networks, norms and trust, which enable members of the community to act together more effectively to pursue shared objectives (DeGraaf & Jordan, 2003). Coleman’s (1988) interpretation of social capital has become popular within contemporary policy oriented discourses about sport and leisure (Jarvie, 2003). In addition, Putnam’s (2001) work Bowling Alone gave voice to the concern of a decline of social capital, by noting that the decline in both formal political activity and social activities was resulting in civic disengagement. Identified in these social activities was time spent participating in sport events, recreation and leisure activities. Social capital, according to Jarvie (2003), has attracted a great deal of attention as it has been seen as a way of contributing to social inclusion for marginalised groups. The impact of participation in sport events on marginalised or socially excluded groups has been an area of recent research focus. Social exclusion has been defined by Barry (2002: 14-15) as follows.
“… an individual is socially excluded if (a) he or she is geographically resident in a society but (b) for reasons beyond his or her control, he or she cannot participate in the normal activities of citizens in that society, and (c) he or she would like to so participate.”
Social exclusion can manifest itself in many different ways including unequal access to educational, occupational and political opportunity. However, Barry (2002: 27) identified that there are “obvious material conditions that have to be satisfied to avoid social exclusion. The most basic is a place to live: those with ‘no fixed abode’ (whether sleeping rough or moving between shelters and hostels) are excluded from most forms of participation” including sport and recreation. Participation in sport events (at all levels of ability) is an important aspect of social life for many Australians, with 4.6 million adults each year participating in some form of organised sport (Australian Bureau of Statistics, 2006). In addition, Australian households spent an average of $15.70 per week on selected sports and physical recreation products (Australian Bureau of Statistics, 2006), which indicates a clear financial cost for sport participation that may not be manageable for socially excluded people. Collins (2004: 729) stated that participating in a sport event “requires some confidence, some skills, some knowledge, an ability to manage time and relationships, and having a group of supportive friends and companions, including some who share the same desire to take part” in the activity. It has been argued that through participation in sport events the community benefits as well as the individual, via the development of social capital (Long & Sanderson, 2001). The concept of social capital has begun to gain legitimacy in the recreation and leisure studies literature (Misener & Mason, 2006) seen through the work of authors such as Jarvie (2003). In a review of literature undertaken by Long and Sanderson (2001), the most commonly claimed community benefits for sport event participation include: enhanced confidence and self-esteem;

empowering disadvantaged groups; encouraging pride in the community and improving health. Although there is a lack of substantiated research on the social outcomes and social benefits of sport event participation, authors (Jarvie, 2003; Long & Sanderson, 2001) suggest that sport event participation for socially excluded groups may have a substantial change for the individual, and can also make a valuable contribution to communities. Sport events may also be held up as social models of community benefit, through the development and support of volunteers in the community (such as those at the Sydney Olympic Games in 2000 and the Melbourne Commonwealth Games in 2006) and the community spirit that can be engendered by the sporting festival. The HWC appears to mirror this argument of sport events as a source of community benefit, particularly with the focus on marginalised members of the community and the concept of community development through sport. HOMELESS WORLD CUP AND THE STREET SOCCEROOS The HWC was established in 2003 by the International Street Papers organisation, with the HWC being hosted by Austria (2003, 2004), Scotland (2005) and South Africa (2006). Denmark will be hosting the HWC in 2007 and Melbourne, Australia won the bid to host the 2008 HWC. The findings of a study reviewing the outcomes of the 2004 HWC in Edinburgh indicated that participation in this sport event has the power to tackle issues of exclusion and poverty (Young, 2005). This research found that amongst the 204 participants at the 2004 HWC, 90% said that their participation in the HWC had a positive impact on their lives; 74% indicated that it had made significant changes in their lives as a direct result of their involvement. In addition to these findings, subsequent to their participation in the HWC 38% found regular employment, 46% improved their housing situation and 34% have pursued education (Young, 2005). The Street Socceroos were established in Melbourne in 2004 as the Australian HWC team. The Street Socceroos training sessions are open to anybody who would not otherwise have an opportunity to play soccer. To be eligible for selection for the HWC, the athletes must be over the age of 16, have experienced homelessness in the last two years, or participating in a drug rehabilitation program. With support from local and global corporations, State and Federal government and community organisations, in 2005 Australia sent its first team to the HWC in Edinburgh. Australia was voted the best new team after an impressive debut secured eighth place out of the 27 teams. In 2006, the Street Socceroos participated in the HWC in Cape Town, although their on-field results were not as successful as their 2005 efforts, the team achieved some excellent off-field outcomes. These outcomes will be discussed later in this paper. In 2006, a bid to host the 2008 HWC in Melbourne was prepared with the assistance for the Victorian Major Events Corporation together with an organising committee with members drawn from corporations, philanthropists and Government. The successful bid was announced in mid-2006, together with an announcement of a $500,000 grant from the State Government Department of Victorian Communities to assist with the hosting of the HWC in Melbourne in 2008. RESEARCH METHOD The method employed to explore outcomes of sport event participation was framed around a case study analysis of the Street Socceroos team members and their participation in the HWC in South Africa in 2006. The research question investigated was:
• What were the social outcomes for the team members of the Street Socceroos that resulted from their participation in the 2006 HWC?

Each team member (eight in total) of the Street Socceroos HWC team was interviewed prior to their departure for the 2006 HWC and again two months after their return. Pre and post-event interviews were held to identify the outcomes for the participants, where the focus of the research is on any change to their experience due to participation in the HWC. The pre-event interviews were used both to get to know the participant group, and also to establish a benchmark against which to measure any change after the event. The interviews were framed upon a semi-structured format and interview questions focussed on the experiences of the HWC team members. Areas of focus for these research questions were drawn from a study of social impact assessment and sport development (Burnett, 2001). All interviews were undertaken at a location of the team member’s choosing and were digitally recorded and transcribed for analysis. Interview transcripts were analysed using the NVivo software package to look for key themes in the data, such as the obstacles that the participants had to overcome to enable their participation in this major international sport event, their experience of that sport event and how their sport event participation affected or impacted their living conditions and social situation. These key themes are identified and discussed in the following section. HOMELESS WORLD CUP 2006 – THE STREET SOCCEROOS EXPERIENCE Two overarching themes were identified in the data: the intrinsic benefits of participation in the sport event (including: developing a sense of community, an obligation to others, a feeling of equality, a sense of belonging and a sense of pride), and social outcomes (at individual, program and State level) for sport event participants. Edited extracts from the interviews will be used as to demonstrate the existence of these themes and discussion of these themes in the following section. INTRINSIC BENEFITS OF SPORT EVENT PARTICIPATION Some respondents indicated that their participation as a member of the Street Socceroos 2006 HWC team helped to develop a sense of community, and for some, a sense of family, as illustrated in the quote below:
I enjoyed it thoroughly and it gave me the sense that I wasn’t the only one experiencing hardship … I could see that others were experiencing predicaments the same as mine but were willing to change their life too. (interview with Terence1)
Through the regular and supportive contact with team members and support workers, the participants were able to link into a community that they can relate to, share their experiences or seek help. Linked to the experience of the HWC was the sense of obligation to these team members and the support staff within the Street Socceroos team. Once a social network had been established, a sense of teamwork and even friendship developed, and as a result, a feeling of obligation to the others within the program transpired.
… then you realise if you don’t go you’ll kick yourself and the guilt will set in … you might have trouble pushing yourself but if there’s someone else there pushing you as well, they are relying on you … (Interview with Aaron)
1 Pseudonyms are used for all participants

Through the experience of a sense of community, an obligation and consideration of others develops, the participants regularly attend training session, sign a contract of behaviour for the HWC and help each other along the journey. As members of a marginalised group, many participants felt excluded from or different to the broader community, however, on the soccer field at training or at the sport event itself, participants experienced a feeling of equality, judged on their merits, as by one team member when referring to his experience of participating in the HWC:
… the thing I love about participating in sport is the fact that it doesn’t judge, it doesn’t care if you don’t earn a million dollars per game…it doesn’t matter if you’ve got no sponsors … when you’re homeless and society turns its back on you, sport’s the only thing that’s there to actually welcome you … (Interview with Aaron)
This sense of equality on the field appeared to be accompanied by a parallel increase in emotion and a sense of belonging, as identified in the post-HWC interview with Ernest.
[When we first went out and sang the national anthem] I was crying because I was happy, excited … I wasn’t just crying just because I’m sad or anything, I was happy. I was grateful for just being there. I felt like I’m very, very special. (Interview with Ernest)
For many of the Street Socceroos when they were given the opportunity to represent their community and their country in an international sport event, they began to see themselves in a different light. An experience of social connectedness was identified as a common thread throughout the interviews, and it became apparent to the researcher that participation in the 2006 HWC had been a motivating experience for each of the Street Socceroos. The HWC provided the participants with an opportunity to set goals for themselves and commit to the achievement of those goals with the support of their team mates and the support staff, as discussed with Nick after his return from the 2006 HWC.
… the program really helped with making a personal goal and following it through. Going to South Africa - that was a goal worth seeing through … my life is a lot better now than it was before … (Interview with Nick)
Through their experiences of the HWC, the team members proved to themselves that they are capable of setting direction and meeting commitments, and will be able to carry these skills and confidence in their abilities into the future. The opportunities provided to the Street Socceroos, through their experience at an international sport event had a significant impact on the team members, as neatly summarised by Aaron.
I saw Antarctica. I met Desmond Tutu. I played for Australia. And I had a free trip to South Africa. Harry Kewell gave us a speech. We got a letter from John Howard that wasn’t a dole form. Not bad … (Interview with Aaron)
For many of the Street Socceroos there was a distinct change in their sense of self. For some, selection into the HWC team was confusing and confronting, not confident of why they were chosen for this opportunity. However, after participating in this sport event, this sense of self changed, from being unsure, to wanting to create a legacy of their own, by passing on their

experience to others who need help, and through a sense of obligation to the Street Socceroos program. One example of this is demonstrated by the quote below:
… so after the trip I want to study community development because I want to bring the community together … because of my background I know that a lot of young teenagers have problems like drugs, gambling, homelessness. If I can get into this course, then I'm going to help the community... (Interview with Terence)
The outcomes from participation in the HWC are not just the intrinsic benefits, for many team members the experience of this event was a catalyst for change in their life at home in Australia. SOCIAL OUTCOMES In addition to the intrinsic benefits for the participants, a number of social outcomes were achieved at the individual, program and state level. At the individual level, social outcomes were identified which had a direct positive impact on the team members’ quality of life, including housing, education and employment. Most significantly, all the participants in the 2006 Street Socceroos team are now in a more stable housing situation, either in supported housing or in the private rental market. One member of the team has enrolled in a TAFE program to study community development as a direct result of his participation in the program and wishes to share his experiences and lessons with others. Improved relationships with family is yet another outcome for participants, with one team member being granted greater access to his two children now that his housing situation has been stabilised, and another returned to Perth to visit his family for Christmas for the first time in six years. The Street Socceroos program itself benefited from the participants experience of the HWC in 2006. The Street Socceroos program is now being developed into an educational program for schools, to discuss issues such as homelessness and the impact of sport event participation. Importantly, Street Socceroos team members are being paid for their role in these programs, which is a direct outcome of employment for these individuals. Also, in acknowledgement for community service, one team member won the City of Stonnington Young Citizen of the Year Award for his work and role with Street Socceroos. At a state level, the Victorian court system acknowledged the value of the Street Socceroos program by awarding a good behaviour bond to one team member, on the condition that he remains in the Street Socceroos throughout 2007. Through participation in the Street Socceroos team at the HWC, team members were provided with support for their living situation and an opportunity to develop a sense of community and increased self-esteem. Each of these outcomes, both individual and social, appears to reduce the social exclusion of the participants by providing opportunities to participate and develop relationships with others, and also contribute to community development. These findings add support to the argument presented by Long and Sanderson (2001) that sport event participation not only affects the individual participants, but can also make a valuable contribution to communities. CONCLUSION AND FUTURE RESEARCH Sport event participation can provide opportunities for people, including those from marginalised groups, to be active and accepted members of the community. By restoring the participants’ self-esteem and developing a sense of belonging, a number of positive benefits result for both the participants and the broader community.

Most noticeable was the social impact of sport event participation for marginalised or socially excluded groups. As noted earlier in this paper Barry (2002) identified that one aspect of social exclusion is being excluded from participation in normal activities when one would like to do so. The Street Socceroos team members through their involvement in the HWC were provided with an opportunity to participate in an international sporting event. Team members benefited from this participation with both intrinsic benefits by developing a sense of belonging and pride, and social outcomes, through more stable housing and better family relationships. Although these outcomes are at the individual level, a ripple effect inducing wider benefit may be obtained through the community. It is argued that these outcomes are more significant for this group of sport event participants, as the outcomes, such as secure housing and a sense of community and self-worth, are more important than just securing a personal best, or a team win. In addition, the impact of this sport event participation is enduring for this group of participants. The social outcomes and intrinsic benefits extend well beyond the initial sense of achievement at the event itself. The legacy of their sport event participation continues to date, as the researcher remains in contact with the Street Socceroos team, and for many, their social situation has continued to improve through increased employment opportunities with the schools program, and as ambassadors for the hosting of the HWC in Melbourne, Australia in 2008. For many major sport events, social assessment in the media and public discourse is often linked with the idea of sport and its influence on social attitudes and behaviour. Members of the HWC team associated their roles as representatives of their country and ambassadors for marginalised groups in society, noting the impact and challenge of their participation in this event on the social attitudes surrounding not only sport event participation, but broader community development. A number of limitations to this study are identified, including the sample size (eight members of one team), and the specific focus of the research on one marginalised group (i.e., homelessness). In addition, all of the participants in the HWC Street Socceroos for 2006 were male, and as such, no female participants were involved in the research project. The HWC is open to both male and female participants; however, very few teams have female team members. This limitation has been identified by the HWC organising body, which is currently investigating the opportunity to develop a separate women’s HWC. Future research efforts will be directed at better understanding the outcomes (intrinsic benefits and social outcomes) of sport event participation across a wider range of social groups. Research will be undertaken with sport event participants in regional and rural areas, female participants and with other marginalised groups (e.g., refugees). In addition, the hosting of the HWC in Melbourne in 2008 will provide an excellent opportunity to extend this research, to investigate the outcomes of participation across different cultures and nations. Initial findings from the experience of the 2004 HWC (Young, 2005) and the results from this research project investigating the 2006 HWC Street Socceroos team clearly points to an enduring social benefit from participation in sport events for marginalised groups in the community. REFERENCES Australian Bureau of Statistics. (2006). Sport and Recreation: A Statistical Overview,
Australia, Edition 2 (Cat. No. 4156.0). Bailey, R. (2005). Evaluating the relationship between physical education, sport and social
inclusion. Educational Review, 57, 1, pp. 71-90.

Barry, B. (2002). Social exclusion, social isolation and the distribution of income. In (eds) Hills, J, Le Grand, J and Piachaud, D. Understanding Social Exclusion. Oxford University Press, Oxford.
Burnett, C. (2001). Social Impact Assessment and Sport Development. International Review for the Sociology of Sport, 35, 1 pp. 41-57.
Chalip, L., & Leyns, A. (2002). Local Business Leveraging of a Sport Event: Managing an Event for Economic Benefit. Journal of Sport Management, 16(2), 132.
Collins, M. (2004). Sport, physical activity and social exclusion. Journal of Sports Sciences, 22, pp. 727-740.
DeGraaf, D and Jordan, D. (2003). Social Capital. Parks & Recreation, December, pp. 21-27. Downward, P., Lumsdon, L., & Ralston, R. (2005). Gender differences in sports event
volunteering: insights from Crew 2002 at the XVII Commonwealth Games. Managing Leisure, 10(4), 219-236.
Fairley, S., Kellett, P., & Green, B. C. (2007). Volunteering Abroad: Motives for Travel to Volunteer at the Athens Olympic Games. Journal of Sport Management, 21(1), 41-57.
Higham, J., & Hinch, T. (2006). Sport and Tourism Research: A Geographic Approach. Journal of Sport Tourism, 11(1), 31-49.
Jarvie, G. (2003). Communitarianism, sport and social capital. International Review for the Sociology of Sport, 38, 2, pp. 139-153.
Kurtzman, J. (2005). Sports tourism categories. Journal of Sport Tourism, 10(1), 15-20. Kurtzman, J., & Zauhar, J. (2005). Sports tourism consumer motivation. Journal of Sport
Tourism, 10(1), 21-31. Long, J and Sanderson, I. (2001). The social benefits of sport? Where’s the proof? In (eds)
Gratton, C. and Henry, I. Sport in the city: the role of sport in economic and social regeneration. Routledge, London.
Misener, L and Mason, D. (2006). Creating community networks: can sporting events offer meaningful sources of social capital? Managing Leisure, 11, pp. 39-56.
Putnam, R. (2001). Bowling Alone. Simon & Schuster, New York. Sandford, R, Armour, K and Warmington, P. (2006). Re-engaging disaffected youth through
physical activity programmes. British Educational Research Journal, 32, 2, pp. 251-271.
Sasidharan, V, Payne, L, Orsega-Smith, E and Godbey, G. (2006). Older adults’ physical activity participation and perceptions of wellbeing: Examining the role of social support for leisure. Managing Leisure, 11, pp. 164-185.
Smith, A. (2006). Tourists' Consumption and Interpretation of Sport Event Imagery. Journal of Sport Tourism, 11(1), 77-100.
Solberg, H. A. (2003). Major sporting events: assessing the value of volunteers' work. Managing Leisure, 8(1), 17.
Twynam, G. D., Farrelll, J. M., & Johnston, M. E. (2002). Leisure and volunteer motivation at a special sporting event. Leisure/Loisir: Journal of the Canadian Association for Leisure Studies, 27(3/4), 363-377.
Weed, M. (2006). Sports Tourism Research 2000-2004: A Systematic Review of Knowledge and a Meta-Evaluation of Methods. Journal of Sport Tourism, 11(1), 5-30.
Young, M. (2005). The Impact of the Homeless World Cup (www.streetsoccer.org)

Fourth International Event Research Conference Re-evaluating the City/Town: Events as a Catalyst for Change
AN ANALYSIS OF THE ANTECEDENTS INFLUENCING FEMALE ATTENDANCE AT SPORTING EVENTS
John Hall
Deakin University [email protected]
Barry O’Mahony
Victoria University
Peter Oppenheim Deakin University
Michael Valos
Deakin University
ABSTRACT While approximately seven million Australians attended sporting events in 2002, male spectators outnumbered female spectators by 25% (Australian Bureau of Statistics [ABS], 2003). To investigate reasons for these difference 175 female spectators were surveyed. The findings showed that motivating factors differed between football, horse racing and tennis. The results show that social dimensions and on site entertainment both influence female audience. Further females will not attend if the facilities provided are not of a high standard.
INTRODUCTION The purpose of this paper is to highlight the factors that determine sporting event attendance for females. The study is important because the female market represents a relatively untapped segment that can assist sports associations and communities to access the economic potential associated with hosting major sporting events. Three sporting events are compared in terms of inherent event characteristics, stadium environment and social experiences. These sporting events were selected because, according to the Australian Bureau of Statistics (ABS), they were among the 12 most attended sports events in Australia in 2002 (ABS, 2003). Over the last five years, attendance at sports events in Australia has grown at a rate of 13% per annum with approximately seven million Australians attending a sporting event in 2002 (ABS, 2003). The ABS report shows more Australian males (four million) than females (three million) attended at least one sporting event. This equates to 25% more male attendance. A comparison of the 12 most attended Australian sports echoes this disproportionate male attendance (ABS, 2003, p. 1). In the case of the Australian Formula 1 Grand Prix, for example, males are clearly the major attendees. The aim of this study was to investigate the factors that motivate women to attend sports events. Understanding these motivations would be useful to sporting event organisers who believe that male attendance has plateaued and greater potential exists to target females. For example, in the

2006 Australian vs. South African Cricket tests there were special marquee areas within the ground on the 3rd day specifically to attract female attendees. Previous studies suggest that attendance motivations are varied and include: economic, geographic and socio-demographic factors as well as accessibility, entertainment, performance, attractiveness of the game and individual preference for the product (Brokaw, 2000; Greenstein & Marcum, 1981; Hansen & Gauthier, 1989; Robertson & Pope, 1999; Schofield, 1983). Mullin et al. (2000, p. 42) advised, however, that in most previous studies, “marketers have traditionally focused solely on the male market” thus the factors that influence women may be different to those that influence men. As a result, an investigation into the attendance motives of women would be valuable to assist sports associations and venue operators to target this group. As Fink et al. (2002) asserted “if such differences do in fact exist, then it is critical to identify them in order to develop more effective marketing schemes” (p. 9). This study was designed to bridge this research gap by providing empirical data to assist in the development of strategies to market more effectively to this under-researched segment. LITERATURE REVIEW Entertainment Experience The obvious motivation for a leisure pursuit such as a sporting event is the engagement of the event as it plays out. This engagement is essentially a diversion from life’s routine as well as the entertainment value of the event (Al-Thibiti, 2004; Shank, 2001). In many cases according to Petrecca (2000) “... the game itself isn’t enough to draw people in [because] people get bored easily and need to be entertained” (p. 3). Within an event there are lulls in intense action and also problems with one-sided contests where the outcome is inevitable early in the event. Entertainment experience is put forward by Kahle & Riley (2004). They believe this construct refers to attendees “… who are less concerned with the outcome of the sporting event than they are with the overall quality of the entertainment experience” (p. 283). Socialisation Other researchers have found female motivation in attending sporting events is related to the opportunity to socialise with friends and family (Dietz-Uhler et al., 2000; Fink et al., 2002; Robertson & Pope, 1999; Wann et al., 2004). To some degree this motivation mitigates problems which occur when the event itself becomes predictable or repetitive. However for some attendees this may be virtually the only reason for attendance. Kahle & Riley (2004) showed that individuals consume sport in social groups and therefore the enjoyment of sport is often heightened through group interaction. It could be interaction regarding the event as it plays out or the interaction in food consumption or browsing the venue at breaks in the play. Participant Attractiveness The quality of the event can be perceived to be of a high standard if there are recognised “star players” present. The star quality of David Beckham regardless of his soccer skill makes the event more worthwhile to some spectators who may not be able to assess sporting skills. Tabloid fame of participants can make the sporting event more appealing especially to people who cannot appreciate skills. On the other hand clearly overtly perceivable skill levels, make the event more attractive when there are one or more stars. For example, the clearly perceptible skill differentials of Roger Federer or Marion Jones. (Al-Thibiti, 2004; Shank, 2001) Bjelac et al. (2003) explained that if the “actor of the event” possesses great skill, fans are even more inclined to attend the game.

Fan identification Shank (2001) defines “fan identification” as “… the personal commitment and emotional involvement customers have with a sports organisation” (p. 206). This could be a sporting club, a social group or an organised fan club. Those that show high involvement and interest in sports are considered to be “True Fans”. Other studies divide sports fans into social sports fans, who have lower levels of fan identification; medium sports fans, whose support declines when their team is losing; and hardcore fans who religiously attend every game (Pruegger, 2000; Wann et al., 2004). A study by Fink et al. (2002) determined that:
Loyalty was stronger for respondents attending women’s games than it was for respondents attending men’s games … [adding that if females are more loyal it justifies] “… marketers’ attempts to capture them as a viable segment of the sport spectator population (pp. 15-16).
Economic Factors Financial and economic factors cannot be excluded as attendance motivators. These can be divided into controllable and uncontrollable factors. The controllable factors include the “price of tickets or the perceived value of the sports product” (Shank, 2001, p. 194). Alternative Active Events Numerous studies suggest that competition for sporting event attendance can be extensive and can come from many different directions (Al-Thibiti, 2004; Buttle et al., 1995; Dietz-Uhler et al., 2000; Fink et al., 2002; Greenstein & Marcum, 1981; Kwon & Trail, 2001; Robertson & Pope, 1999; Shank, 2001; Zhang et al., 1997). Robertson & Pope (1999) noted that “the consumer’s decision to attend a game is typically a choice among entertainment alternatives” (p. 12). These alternatives include arts, motion pictures, dining and participating activities such as bushwalking and ten pin bowling. Zhang et al. (1997) suggest people are more likely to attend a sporting event if there are few competing events. The impact of the 2006 Commonwealth Games is likely to be felt on the Australian Tennis Open, Australian Grand Prix and the opening of the Australian Football League Season. This will be felt in terms of time limits to how many events one can attend and also the limited entertainment dollar being allocated over a longer period. There is a limited amount of discretionary leisure income according to Shank (2001). Media Television can also act as a direct competitor to attendance. Dietz-Uhler et al. (2000) acknowledge that some people prefer to watch the event on television instead of attending. In contrast to soccer, cricket and baseball sports such as golf or motor racing are often cited as examples of events where you miss much of the action when trackside. Unless a more expensive grandstand ticket is used a single vantage point misses much of the action. In 2006 Cricket Australia is allowing broadcasts of international cricket in the city the event are being held. In previous years the view was held that broadcasting in the city of event origin would reduce attendance as a significant number of people would just use television. The new view of Cricket Australia is that broadcasts in the city the event is occurring will expand the market and interest in the game and many people will believe you have to be there to be truly engaged and maximise enjoyment. Age

A report by the ABS (1999) found that “sports attendance declined gradually with age” (p. 1). The report found that the attendance rate for 15 to 24 year olds is twice the rate of the over 65 age group. Westerbeek & Shilbury (1999) provided an explanation for the different propensities of age groups to attend. They state that the “… environmental characteristics of the sport place …” may have an effect on older peoples’ attendance. Further, they suggest that “… the older sport spectator might be more inclined to watch the television sport product whereas the younger group still wants to go to the sport place and actually participate in the event as an active spectator” (p. 22). Stadium Several studies have found that the characteristics of the stadium have a strong influence on attendance (Brokaw, 2000; Buttle et al., 1995; Robertson & Pope, 1999; Shank, 2001; Wakefield & Sloan, 1995). Typically the stadium characteristics cited as important to spectators are size, aesthetics, seating comfort and access (Bitner, 1992; Buttle et al., 1995; Robertson & Pope, 1999; Shank, 2001; Tomlinson et al., 1995; Wakefield & Blodgett, 1996; Wakefield & Sloan, 1995). Other stadium aspects which influence spectators’ attendance include cleanliness of the stadium and the availability of car parking. Tomlinson et al. (1995) developed three classifications of stadium characteristics which impact attendance. These were behaviour; front room factors, back room factors and circumstantial factors. Servicescape Bitner (1992) identified a number of environmental considerations, which affect customers’ perceptions of satisfaction during a service experience. Bitner developed the concept of a “servicescape” to address these considerations. This concept was modified by Robertson & Pope (1999) to describe the service experience at a sports event. They developed the term “Sportscape”. Robertson and Pope (1999), contend that “the sportscape or physical environment of the stadium can influence whether or not a spectator attends, how long they will stay, and if they will return or not for a future event” (p. 8). Research Issues and Research Propositions In summary there is a gap in the sports marketing literature in terms of the relative importance of the numerous and wide-ranging factors which contribute to the decision of females to attend sporting events. It appears females are motivated by different factors than males as most events have a greater male to female proportion of attendees. Test Cricket and the Australian Grand Prix illustrate major discrepancies while Tennis and One day Cricket have more evenly balanced gender proportions. Accordingly we therefore propose the following hypotheses: H1 The motivations that influence females to attend sporting events vary with the attributes and nature of the sporting event. H2 The motivations that influence females to attend sporting events incorporates factors or dimensions which may be exogenous to the actual sporting event. RESEARCH METHODOLOGY Data Collection A quantitative research design was adopted in order to gain insights with respect to the factors influencing females to attend sporting events. A telephone interview process was used, with the white pages being used as a sampling frame, a sample of 175 female respondents was obtained, age, education, occupation and income quotas were applied to ensure suitable representation of these characteristics in the sample. Several insights emerged including a list of sports events respondents

had attended, interest and involvement in sporting entertainment and the likelihood of attending certain sports events in the future. As Melbourne is considered to be the sporting capital of Australia (Westerbeek & Ingerson, 2002) the city and suburbs of Melbourne were the basis of the sample. By sampling within a sporting capital the research design was able to address the issues of competition between sporting events and a wide range of alternative activities. Within a smaller city with less choice this may not have been achievable. Survey Instrument The survey instrument comprised behavioural and attitudinal items. The studies of Robertson & Pope (1999) and Brokaw (2000) provided a number of questions which were included in this survey which measured social factors and values. According to the literature these constructs were likely be particularly relevant to sporting event attendance. In addition Kahle’s (1993) List of Values (LOV), a typology that draws a distinction between external and internal values, and the Subjective Leisure Scale (SLS) developed by Unger & Kernan (1983) were used. The latter was included as the literature indicated other leisure activities compete against sports events. The questionnaire also included demographic and general questions. The questionnaire was piloted and pretested before use. FINDINGS Factor Analysis A factor analysis of the behavioural and attitudinal items included in the questionnaire resulted in nine factors. The factors were named as follows:
• Factor 1 = Emotional Factor • Factor 2 = Front Room Factor • Factor 3 = Entertainment Factor • Factor 4 = True Fan Factor • Factor 5 = Circumstantial Factor • Factor 6 = Perceived Freedom Factor • Factor 7 = Facility Factor • Factor 8 = Event Factor • Factor 9 = Back Room Factor
(See Appendix Tables 1 and 2 for details of the factor analysis.) The “Emotional Factor” refers to spectator’s emotions and includes variables such as whether the sports event was found to be stimulating, challenging or pleasant. The “Front Room Factor” relates to any factor, which could be said to directly influence the spectator’s enjoyment of the event experience. However each component of this factor must satisfy the condition of being amenable to management control within the time period of the service being delivered. Factor three the “Entertainment Factor” includes action, fun, excitement and general levels of enjoyment. The “True Fan Factor” refers to attendees for whom the enjoyment of the game itself is most important. In other words the process and outcomes of the event being played out to a competitive conclusion. The “Circumstantial Factor” comprises what could be termed the uncontrollable factors, such as the weather, other games being screened on TV and the performance of the game itself. The “Perceived Freedom Factor” centres on the voluntary nature of event attendance. This means that the attendee has volunteered to attend and has not been talked into or coerced into attending.

The “Facility Factor” describes facilities as elements under the control of management. These include stadium design, the standard of food and drink available, ticket prices, child facilities, stadium access, other entertainment provided before during or after the main game and seating access. Typically these are seen as key positive factors that management must concentrate on. The “Event Factor” is a mixture of back room (closeness to players) and circumstantial variables (special events). Finally, the “Back Room Factor” is described as any factor amenable to management control that contributes to the overall game experience. SPSS was used to measure the reliability and variance of each of these nine factors. Table 1 shows the majority of factors could be considered as having reasonable reliabilities except factors four and five whose alpha coefficients were below 0.7. Regression Analysis To determine the relationship between sporting event attendance and the female motivation factors derived from the factor analysis a multiple regression analysis was conducted. The regression analysis used sporting event attendance as the dependent variable and the nine attendance motivation constructs as the independent predictors in each regression model. Table 3 shows the event attendance constructs which were identified as significant predictors of attendance. (See Appendix Table 3 for details of the regression analysis.) Four Regression models were developed:
1. All sporting events 2. Australian Rules Football (AFL) 3. Australian Tennis Open 4. Spring Racing Carnival
The R squared statistic in each of the four regression models showed a moderate level of attendance variance explained by the attendance motivators. The two factors which had significant relationships with attendance within each of the four models were “True Fan Factor” and “Facility Factor”. As discussed earlier “True Fan” is an attendee for whom the enjoyment of the game itself is most important. This attendance motivation is derived from the process and outcomes of the actual game being played out to a competitive conclusion. On the other hand “Facility Factor” describes facilities under the control of management, ie stadium features, seating, food and drink, prices, child facilities, and other entertainment provided before, during or after the main game. In contrast the “Entertainment Factor” had only one significant relationship which was in the Spring Racing Carnival. Thus the facilities factor is particularly significant in any sports event and if not handled correctly, women would be more likely to boycott such events. Finally the “Front Room Factor” was significant in two models as shown in Table 3. Accordingly hypothesis H1 was supported. H1 The motivations that influence females to attend sporting events vary with the attributes and nature of the sporting event. For research proposition 1 the event attendance motivations varied in two ways. Firstly each of the four models had different significant independent attendance predictor variables. While three variables were related to the Spring Racing Carnival and AFL attendance only two attendance

motivation variables impacted the tennis. Secondly the “Facility Factor” had stronger impact on tennis attendance compared to other sports. The “True Fan Factor” had the strongest impact on AFL and the Spring Racing Carnival attendance compared to other sports. The “Front Room Factor” had strongest impact on AFL compared to other sports and the “Entertainment Factor” had the strongest impact on the Spring Racing Carnival. Hypothesis H2 was supported. H2 The motivations that influence females to attend sporting events incorporates factors or dimensions which may be exogenous to the actual sporting event. Each of the three sporting models had variables which predicted attendance other than the “True Fan Factor” which was a specific variable reflecting inherent sporting activity as opposed to off field or augmented aspects of event experience. In each of the four models the proportion of R squared explained by the “True Fan Factor” was approximately 50%. The biggest contribution for “True Fan Factor” was in the Spring Racing Carnival and the smallest contribution of “True Fan Factor” was in the tennis model. DISCUSSION AND CONCLUSIONS The results of this study will be useful for sports managers; however, the level of applicability will vary according to the sporting event. Some events are already well patronised by females ie. netball. Some events only want to focus on “True Fans” eg. professional boxing. For them the “True Fan Factor” is a more important driver than augmented features which range from clean toilets, gourmet food or Rolling Stones at half time in the Superbowl. An extreme comparison of “True Fan” motivation can be seen using professional boxing compared to WWF wrestling. WWF wrestling augments the actual ringside “fight” by having music, long interviews with wrestlers and videotaped “behind the scenes” or “soap opera” stories broadcast on big screens at events. On the other hand seeing a legitimate world boxing title fight would not gain from event augmentations as the “True Fan Factor” would be a bigger motivator. The “steak” being more important to these fans than the “sizzle”! However a key finding that females are only partially “True Fan driven” (and even then it varies according to the sport) is very relevant for sports which seek to either:
a) Become a more attractive spectacle for females. The move against violence in Rugby League and Australian Football League is an attempt to appeal to females. It appears females are less motivated by sport attendance tradition and less “True Fan” motivated compared to males. Sports such as Australian Rules Football makes annual rule changes or rule interpretations to ensure game flow and increase female interest. On the other hand Premier League Soccer, test cricket and baseball have rare rule changes and appear less motivated to appeal to females. They appear to be more dependent on “True Fan” factors. Or, b) Provide females with features that augment the sporting event itself and make non game related initiatives. For example the Spring Racing Carnival has seen major attendance growth through “Non True Fans” with the introduction of fashion parades, music entertainment, children’s fun fairs, special gourmet enclosures. It has also invited overseas celebrity fashion judges, such as Paris and Nikki Hilton in 2004 and celebrities from the TV fashion show “Queer Eye for the Straight Guy” in 2005 to move focus beyond horse racing. Unfortunately the example of the Melbourne Spring Racing Carnival shows a negative side effect of ‘appealing to “Non-True” fans’. Many people attend for social and food and wine reasons and arrive in party mood with little intention of seeing a horse! The attendance grew so large in terms of party and socially motivated attendees that the excess drinking in car parks and

enclosures has resulted in unruly behaviour and negative headlines regarding some violence and other attendees asleep on the ground by three o’clock in the afternoon. The bad publicity has prompted police and government statements and “true racing fans” complaining on talkback radio and saying they avoid the main days of the racing carnival such as Melbourne Cup Day and Oaks Day and only attend Derby Day.
Management Implications In terms of inherent sporting event related excitement and enjoyment, the custodians of each sport need to ensure polices of evenness and excitement regarding outcomes. In terms of football and basketball, this means salary caps and recruiting drafts, for horse racing this means appropriate weighting, for tennis, the use of wild cards and seeding. However purely concentrating on the game style and “flow of the game” and ensuring even contests and unpredictable outcomes are not enough. There are non-event motivations why females attend according to the regression models. The comfort of female attendees regarding cleaner seating and facilities, food hygiene, clear and clean walkways and rain protection compared to males also need addressing by management. FUTURE RESEARCH Future researchers should include measures of attendance frequency as there are likely to be linkages between attendance motivators when comparing “once a year attendees” compared to “frequent attendees”. It could be that socially motivated attendees choose from a wider range or basket of events and the “true fan” goes to a limited range of sporting events but attends on a more frequent basis. The impacts of weather may need to be more clearly understood in future research as typically tennis suffers most from weather due to the heat inside concrete stadiums and being staged in the hottest part of the Australian summer. None of the sports studied is predominantly a night sport such as basketball. Finally and possibly most obviously future research should investigate male and female differences. It is possible that perceptions of comfort differ. Other differences such as the importance of toilet facilities and access to alcohol may also differ according to gender regardless of sporting event. REFERENCES Al-Thibiti, Y. (2004). A scale development for sport fan motivation. Florida State University,
College of Education, Department of Sport Management. Australian Bureau of Statistics. (1999). More Australians are going to Aussie Rules. Retrieved from
http://0www.abs.gov.au.library.vu.edu.au/Ausstats/abs@nsf/Lookup/60868DB07CDF00DDCA2568A90013637A (17. March 2005) Issue 4174.0
Australian Bureau of Statistics. (2002) Culture and recreation special article – Sporting Australians. Retrieved from http://www.abs.gov.au.library.vu.edu.au/Ausstats/abs@nsf/dc057c1016dc057c1016e548b4ca256c470025ff88/44f57072c0bb05cbca2569de0025c186! OpenDocument (17. March 2005) Issue 1301.0
Australian Bureau of Statistics. (2003a). Numbers of Australians attending sport on the up. Retrieved from http://0-

www.abs.gov.au.library.vu.edu.au/Ausstats/abs@nsf/Lookup/1626E874230F3B8ECA256DEF007B3AA6 (17. March 2005) Issue 4174.0
Australian Bureau of Statistics. (2003b). Household expenditure on sports, physical recreation and other leisure. Commonwealth of Australia, Canberra: National Centre for Culture and Recreation Statistics.
Bearden, W.O., & Netemeyer, R.G. (1999). Handbook of marketing scales (2nd ed.). United States of America: Sage Publications.
Bitner, M.J. (1992). Servicescapes: The impact of physical surroundings on customers and employees. Journal of Marketing, 56(2), April, 57-71.
Bjelac, Z., & Radovanovic, M. (2003). Sports events as a form of tourist product, relating to the volume and character of demand. Journal of Sport Tourism, 8(4), 260-269.
Brokaw, A. J. (2000). An explanation of attendance in division II college football. Cyber Journal of Sports Marketing, 4(2-3). Retrieved from http://www.ausport.gov.au/fulltext/2000/cjsm/v4n2-3/brokaw42.htm
Buttle, F., Morres, B., & Tomlinson, M. (1995). The fan as customer: Customer service in sports marketing. Journal of Hospitality and Leisure Marketing, 3(1), 19-33.
Dietz-Uhler, B., Harrick, E. A., End, C., & Jacquemontte, L. (2000). Sex differences in sportfan behaviour and reasons for being a sport fan. Journal of Sport Behaviour, 23, 219-231.
Fink, J. S., Trail, G. T., & Anderson, D. F. (2002). Environmental factors associated with spectator attendance and sport consumption behaviour: Gender and team differences. Sport Marketing Quarterly, 11(1), 8-19.
Greenstein, T. N., & Marcum, J. P. (1981). Factors affecting attendance of major league baseball: Team performance. Review of Sport and Leisure, 6(2), 21-34.
Hansen, H., & Gauthier, R. (1989). Factors affecting attendance at professional sport events. Journal of Sport Marketing, 3(1), 15-32.
Hitchcock, B. (1997). Where the crowds are: Sponsors are finding the millions of fans of junior hockey a target worth shooting at. Marketing Magazine, 102, 35-37.
Howard, D. R., & Crompton, J. L. (1995). Financing sport. Morgantown, WV: Fitness Information Technology Inc.
Kahle, L. R., & Riley, C. (2004). Sports marketing and the psychology of marketing communication. New Jersey: Lawrence Erlbaum Associates Inc. Chapter 14
Kwon, H., & Trail, G. (2001). Sport fan motivation: A comparison of American students and international students. Sport Marketing Quarterly, 10 (2), 147-155.
Mullin, B. J., Hardy, S., & Sutton, W. (2000). Sport marketing (2nd ed.). Champaign, Illinois: Human Kinetics.
Petrecca, L. (2000). Fun games: MLB boost entertainment at the ballpark. Advertising Age, 71, 32-33.
Robertson, D., & Pope, N. (1999). Product bundling and causes of attendance and non-attendance in live professional sport: A case study of the Brisbane Broncos and the Brisbane Lions. Cyber Journal of Marketing, 3(1). Retrieved September 20, 2006 from http://www.ausport.gov.au/fulltext/1999/cjsm/v3n1/robertson&pope31.htm
Schofield, J. A. (1983). Performance and attendance at professional team sports. Journal of Sport Behaviour, 6(4), 196-206.
Shank, M. D. (2001). Sports marketing: A strategic perspective., Chapter 5, Upper Saddle River, NJ: Prentice Hall.
Wakefield, K. L., & Blodgett , J. G. (1996). The effect of the servicescape on customers’ behavioural intentions in leisure service settings. Journal of Services Marketing, 10(6), 45-61.

Wakefield, K. L., & Sloan, H. J. (1995). The effect of team loyalty and selected stadium factors on spectator attendance. Journal of Sport Management, 9(3), 153-172.
Wann, D. L., & Waddill, P. J., & Dunham, M. D. (2004). Using sex and gender role orientation to predict level of sport fandom. Journal of Sport Behaviour, 27(4), 367-378.
Westerbeek, H. M., & Shilbury, D. (1999). Increasing the focus on ‘place’ in the marketing mix for facility dependent sport services. Sport Management Review, 2(1), 1-24.
Zhang, J. J., Smith, D. W., Pease, D. G., & Jambor, E. A. (1997). Negative influence on market competitors on the attendance of professional sport games: The case of a minor league hockey team. Sport Marketing Quarterly, 6(3), 31-40.

APPENDIX
Table 1 Reliability and Total Variance Explained
Factor
Eigen Value
% of Total Variance Cumulative % Reliability
1 7.444 21.268 21.268 0.8452 2 3.082 8.806 30.074 0.7962 3 2.577 7.363 37.437 0.7986 4 2.438 6.966 44.403 0.6837 5 2.026 5.789 50.192 0.6375 6 1.659 4.741 54.933 0.7062 7 1.512 4.319 59.252 0.7112 8 1.451 4.145 63.397 0.9280 9 1.236 3.531 66.928 0.6055

Table 2 Rotated Factor Matrix (a)
Factors
Emotional
Front Room
Entertainment
True Fan
Circumstantial
Perceived Freedom
Facility Event Back Room
Desirable .729 Stimulating .707 Challenging .695 Astonishing .640 Of no concern .635 Essential .553 Pleasant .411 Cleanliness .817 Food and drink .683 Non game entertainment .563
Ticket price .521 Friends .507 Fan behaviour .477 Family .400 Fun .809 Exciting .701 Enjoyable .542 Action/excitement .529 .
Value for money .365 Tradition .703 Sports Fan .689 Sport itself .644 Not go if loss likely .774
Team winning .577 Odds of winning .536 I want to .714 Not talk into .495 Smoke free zones .877
Alcohol free zones .757
Easy to get to stadium .470
Special events .778 Players proximity .454
Easy to get seat .782 Parking .436

Notes. Extraction Method: Principal Axis Factoring. Rotation Method: Varimax with Kaiser Normalization. a Rotation converged in 7 iterations

Table 3 Regression Analysis
Front Room Factor Factor 2
Entertainment Factor 3
True fan Factor 4
Facility Factor 7
R squared
Total sports
3.59* ns 6.93# -5.83# 31.6
AFL 8.07# ns 11.62# -4.7* 46.6 Tennis ns ns 6.02* -12.25# 85.6 Spring Racing Carnival
ns 5.07* 12.13# -4.28# 75.1
Note.*=sig<.05 #=sig<.01, the values in the table represent the unstandardised beta coefficients.

Fourth International Event Research Conference Re-evaluating the City/Town: Events as a Catalyst for Change
CHARACTERISTICS OF UK ASSOCIATION CONFERENCE DELEGATES
Judith Mair Centre for Hospitality and Tourism Research,
Victoria University [email protected]
Karen Thompson
Department of Hospitality and Tourism University of Strathclyde, UK
ABSTRACT This paper presents the results of research carried out into the characteristics of UK Association Conference Delegates. The characteristics examined include membership and attendance characteristics, socio-demographic characteristics and demand and trip profile characteristics. The research examined the percentage of delegates who were members of the association hosting the conference, the distance travelled by delegates and the length of time that delegates had been members of the association. Additionally, the research investigated the age, and gender of delegates as well as who was financing their attendance. Finally, the research examined whether delegates were travelling alone, whether they were adding on holidays to the conference and how they had heard about the conference in the first place. This information will be of use to both researchers in the field, and to practitioners in the business events industry. Keywords: events, conferences, delegate profiles
INTRODUCTION According to McCabe, Poole, Weeks and Leiper (2000), the Meetings, Incentives, Conferences and Exhibitions (MICE) sector is one of the fastest growing and most lucrative areas of the tourism industry. It is estimated that 1.46 million conferences and meetings took place at UK venues during 2002 (BCVS 2004). Although there is some evidence that the corporate conference sector has contracted slightly, the association conference market appears more robust (Robinson and Callan 2005). An association is defined as “an organised and structured group of people who have similar interests or businesses” (McCabe et al 2000, p 43). Associations are an increasingly important market for business tourism destinations. In the UK, the number, value and budget of association meetings has overtaken corporate meetings (VisitScotland 2003). The sheer number of events is enough to draw attention to this sector of the tourism industry and this research has shown that 71% of all venues in the UK expect a further increase in their conference business. This seems to suggest that the business travel market will be important for some time to come and highlights the importance of understanding the nature and characteristics of UK conference delegates. The benefits of the MICE (hereafter referred to as business events) industry include not just the obvious financial benefits (e.g. revenue generation, creation of employment), but also benefits such as generating investment in the tourism infrastructure and providing facilities that can be

used for continuing education and training. Additionally there can be less tangible benefits of a successful business events sector, such as improving the reputation and image of a destination. However, the research that has been carried out in the business tourism and business events sectors has focused predominantly on the supply side, in areas such as economic impacts and convention destination competitiveness. It appears that the conference market is being defined primarily from the supply-side and that there is a gap in the literature concerning the individual conference delegates and their needs and wants, which offers an opportunity to advance knowledge in the area of conference and business tourism. Additionally, it appears that very little is known about the characteristics of association conference delegates in the UK and this study aims to widen understanding of these characteristics by examining membership and attendance, socio-demographic, and demand and trip profile characteristics and structuring these characteristics into meaningful groupings in order to create a classification system that can be used as a basis for any future research. Business Events Business tourism, where the trip is undertaken for business purposes and not for leisure, is a major segment of the tourism market and is vitally important to the economies of many countries worldwide. Paradoxically however, the business tourism sector is less well- researched than other sectors of the tourism industry. This is particularly apparent in the area of conference tourism. Work by Yoo and Weber (2005) is one of the more recent studies to highlight the lack of research in the area of business events: “Despite its economic significance and rapid growth rate, convention tourism has received relatively little research attention” (Yoo and Weber 2005, p 194) One particular point with reference to the lack of research in this area is that the majority of the research that has been carried out has not focussed on the individual delegate, but has rather been directed at the level of the meeting planners, and conference organisers (inter alia Baloglu and Love 2001, Crouch and Ritchie 1998, Oppermann 1998) or even at a national or international level (inter alia Deery, Jago, Fredline and Dwyer 2005, Mistilis and Dwyer 1999, Qu, Li and Kei Tat Chu 2000). The research that has been carried out in the business tourism and business events sectors has also focused predominantly on the supply side, in areas such as economic impacts (Kim, Chung and Chon 2003, Mistilis and Dwyer 1999, Grado, Strauss and Lord 1998) and convention destination image and competitiveness (inter alia Oppermann 1996a, Oppermann 1996b Oppermann 1998, Go and Govers 1999). It appears that the conference market is being defined primarily from the supply-side and that there is a real gap in the literature concerning the individual conference delegates and their needs and wants, which offers an opportunity to advance knowledge in the area of conference and business tourism. According to Robinson and Callan (2005, p 79) in the business events field, “in spite of the importance of customer satisfaction, there is a dearth of detailed research into customer needs”. It can be supposed that the success of marketing any given product or service depends to a greater to lesser extent on full knowledge and understanding of the needs and wants of the purchaser. This is certainly part of the rationale behind the copious amounts of market research that are carried out on a daily basis by industry and as Middleton (2001, p. 19) states: “In terms of customers, marketing is concerned with understanding the needs and desires of existing and prospective customers, i.e. why they buy”. In the specific case of conference and business tourism however, this market research is at a much less developed stage than other sectors of the tourist industry. As has been explained, there has been some research into the supply side of the business tourism industry and a certain amount of research has been carried out into meeting planners and their site selection criteria. However, research has not as yet focussed to any great extent on the individual conference delegate, who after all creates the demand for the business

events product. Work by Jago and Deery (2005) and Robinson and Callan (2005) has considered convention attendance from the point of view of the delegate, but neither work examined in detail what might be termed delegate characteristics. A deeper understanding of the characteristics of delegates attending conferences would be of practical value, particularly to conference organisers and convention destination marketing bodies, as analysis of these characteristics would provide much-needed information on the delegates who have chosen to attend. This information could include details on the association membership and conference attendance profiles of delegates, the socio-demographic profile of delegates and the demand and conference trip profiles of delegates. The National Business Events Study (Deery et al 2005) did examine some characteristics of convention delegates in an Australian context, including delegate origins, occupations, duration of stay, expenditure and transport used amongst other variables. However, this is all information that is not widely available for UK association conference delegates at present. The membership and attendance characteristics of delegates may throw up some interesting revelations. It may be that there are relationships between length of membership and attendance patterns, or perhaps there are differences between members and non-members of associations in terms of their priorities for attending a conference. These points would be of interest to conference organisers and associations, and these issues have not been covered in depth in the existing research. Severt, Wang, Chen and Breiter (2007) studied convention delegates attending a regional convention in the South East United States and found that 37.4% of delegates were first time attendees, and that 23.8% of delegates had attended the same convention the last time it was held. Further, another 23.8% of delegates had attended the conference five times in the past five years, showing high levels of repeat attendance. It will be useful to carry out further research in order to ascertain whether these findings are repeated. It is feasible that examination of the socio-demographic characteristics of conference delegates may reveal interesting demand-side issues. In particular, the gender of delegates attending conferences may reflect what may be termed “gender professions”, such as nursing, which is predominantly female and this may have implications for the marketing, administration and organisation of certain conferences. There may be links between socio-demographic traits such as age and gender, and financial constraints to attending conferences, occasioned by questions of relative salaries, and level of responsibilities in the home and the workplace. This is an area where knowledge is currently sparse and therefore this research will investigate this further. Robinson and Callan (2005) did establish in their research that female conference delegates were younger than males, held positions with less responsibility and earned less money. This research hopes to investigate some of these areas to see if similar results are obtained. Finally, the characteristics of the demand and trip profile may also be of interest, in that propensity to add on a short holiday to a conference may be related to other trip or membership characteristics. It might be the case that delegates who are travelling alone are less likely to want to spend extra time away from home and therefore would be less likely to add on any holidays to a conference. Deery et al (2005) found that in Australia “about 10% of visitors to events (not including locals) undertook a pre-or post event trip to another region. Of the international respondents, 46% took a pre- or post event trip” (Deery et al 2005, p.45). It has also been argued that delegates “spent the minimum amount of time at the convention destination, and appeared to have decreasing amounts of spare time” (Jago and Deery 2005). Nevertheless, it is feasible that delegates at UK association conferences (the focus of this study) are more prone to travelling with their partners or families and would therefore be more likely to want to add on a holiday to the conference. Again, these are issues about which very little is currently known, and this research will investigate them. METHODOLOGY
As has already been noted, there is very little in the business tourism literature that could be used as a conceptual framework to base this research upon. This research is therefore exploratory in nature. It was decided to design a questionnaire to elicit the information required about the characteristics of UK Association conference delegates. A thorough literature review was carried out, from which potential topics for inclusion in the questionnaire arose. Since it is argued that the best way to minimise errors is to use multiple research methods (Trochim 2004), a way of triangulating and validating the key areas of interest which had arisen from the literature review was sought. Short structured interviews were held with experts in the conference industry in Scotland (professional conference organisers, and representatives from local and national convention bureaus) in order to gain further insight into the UK association conference industry. The rationale for carrying out these interviews was to inform the questionnaire development. The interviews provided support for the questionnaire elements that had arisen from the literature review. The questionnaire included both demographic questions and questions aimed at generating further information about delegates at UK association conferences (see Table 1).
Table 1 Questions used in Questionnaire
Question Number
Questions
1 Where have you travelled from to attend this conference (nearest town/city)? 2 Are you a member of this association? 3 If yes, how long have you been a member? 4 How many times have you attended this conference in the past? 5 Who is financing your attendance at this conference
(employer/association/self/other/rather not reply)? 6 Apart from the association membership fee, have you personally incurred any
financial cost in attending this conference? 7 How did you originally hear about this conference (association membership
mailing/word of mouth/advertising/other)? 8 Did you seek additional information on the conference destination before you
decided to attend? 9 If yes, which of the following did you find most useful (internet/local tourist
information office/VisitScotland/ conference organiser/other)? 10 Are you adding on a short holiday to the conference (yes, before the
conference/yes, after the conference/no)? 11 Are you travelling alone, with colleagues or with a partner or family
(alone/with colleague/s/with partner/with partner and family)? 12 Please state below your main reasons for attending this conference 13 How likely are you to attend this conference in the future (extremely likely/quite
likely/neither likely nor unlikely/quite unlikely/extremely unlikely)? Data Collection A pilot study was carried out at the Travel and Tourism Research Association (Europe) Conference held at the Royal Scottish Academy of Music and Drama, Glasgow in September 2003. No major issues were highlighted during the pilot study and the questionnaire was distributed to 1400 delegates at six UK association conferences during the Spring and Summer of 2004. A total of 220 usable questionnaires were returned, giving a response rate of 15.6%. The lowest response rate was 4% and the highest was 52%. Response rates varied between conferences surveyed as can be seen from Table 2. There were no discernible reasons for the differences in response rates between the different conferences surveyed.

The study used a convenience sample, and acknowledges its limitations. There were problems in getting permission to conduct the survey at some conferences and this limited the number of delegates that could be approached. Attempts were made to minimise the limitations of the convenience sample, and conferences in different UK locations were surveyed. Had all the conferences surveyed been in the one location, this would have meant that the results were only applicable to that one location, so the use of different conference destinations has allowed a more comparative approach. RESULTS AND DISCUSSION The results of the research into delegate characteristics will now be presented. It is worth stressing that the results obtained by this research are from those delegates who responded and may not always accurately represent the wider conference delegate population Demographics The sample was composed of 36.1% men and 63.9% women, which (although departing from the generally accepted 50-50 male-female split in the general population) was an accurate reflection of the attendees at the conferences surveyed. With regard to the age of the sample, 96.8% were between 15 and 64 – working age. This is no surprise as it is to be expected that those attending association conferences will to a certain extent be members of the working population. For further information on the conferences surveyed, please see Table 2.
Table 2 Conferences surveyed as part of this research
Name of Association Conference Location
Conference Dates
Approx. No. Delegates
Responses & Response Rate
Law Society of Scotland
SECC, Glasgow 12th March 2004
600 25 (4%)
Royal College of Radiologists
Glasgow Caledonian
16th-17th June 2004
200 43 (21.5%)
Tourism Society John Moores University, Liverpool
17th -18th June 2004
80 42 (52.5%)
British & Irish Law Librarians Association
EICC, Edinburgh 30th June 2004 100 18 (18%)
Royal College of Nursing
Glasgow Radisson SAS Hotel
2nd-4th July 2004
180 56 (31%)
British Medical Association
Glasgow Hilton Hotel
8th-9th July 2004
250 36 (14.5%)
Total 1410 220 (15.6%)
Delegate Characteristics The aim of this study was to define some of the characteristics of UK association conference delegates, information which up to now has been generally unavailable. The discussion of these characteristics will be divided into three sections – membership & attendance characteristics, socio-demographic characteristics and demand and trip profile characteristics. Tests as to the suitability of the data to parametric testing showed a pattern of non-normal distribution. It can

be the case that data produced as a result of research in the field of social science is not normally distributed, and therefore the fact that normal distribution cannot be assumed does not lessen the results of the study (Pallant 2001). It merely requires different statistical tests – non-parametric instead of parametric testing. Non-parametric tests are less powerful than their parametric equivalents but still result in perfectly acceptable measurements of the relationships within the data. Membership and Attendance Characteristics of UK Association Conference Delegates Over 68% of those who attended the conferences surveyed were members of the association. However, it is perhaps more interesting to note that over 31% (a sizeable minority) were not members of the association. It might be expected that members would have made up a larger percentage of delegates than non-members since it is often the case the association conferences are more heavily marketed toward the members of the association, but this may give food for thought to those trying to encourage higher attendance at association conferences, as it seems that a good proportion of those who attended were willing to do so without being members. There were significant differences between the different associations regarding whether their delegates were members of the association1 [χ2 = 16.373, (df=5, n=219), p=.006]. Analysis of the crosstabs appears to show that delegates attending the Law Society of Scotland Conference and the British and Irish Law Librarians Association are significantly more likely to be members of the respective associations. In fact, 92% of delegates attending the Law Society Conference and 94.4% of delegates attending the Law Librarians Conference were members of the association holding the conference. This might be explained in part by the fact that both are professional associations who use their association conferences as platforms for continuing professional development, and that both associations require a certain level of attendance at these events over time in order to achieve the professional development standards set out by these associations. The mean length of time that delegates had been members was 13.53 years, with a std. error of 0.884 years (see Table 3). The range of membership length went from 1 year to 48 years. This question was only answered by those who had already answered “yes” to the previous question “Are you a member of this association?”. This variable was also positively skewed and with a negative kurtosis value, showing again that there was a tendency for extreme values (those attending either to have been members for only a short time or to have been members of their associations for a very long time). In this case, the 5% trimmed mean of 12.94 years may be more representative of the variable membership length, as this allows the extreme cases to be removed.
Table 3 Descriptive Statistics for continuous variables
Mean 213.03 miles 5% Trimmed Mean 209.44 miles
Where have you travelled from? (TRAVEL) Range 1 - 540 miles How long have you Mean 13.53 years
1 The assumptions for the chi square for independence test have not been violated – in particular, there are no cells with an expected count of less than 5 in the first table, and 20% with an expected count of less than five in the second table. This is in alignment with the advice of Field (2000) who states that although it is preferable to have no cells with expected counts less than five, up to 20% with an expected count of less than five is acceptable. It can be assumed from this point onwards that all chi square tests meet this assumption unless otherwise stated.

5% Trimmed Mean 12.94 years been a member? (MEMLONG) Range 1 - 48 years
Mean 2.26 times 5% Trimmed Mean 1.36 times
How many times have you attended this conference before? (TIMESATT)
Range 0 - 33 times
It can be seen in Table 3 that the delegates travelled various distances to attend. The mean distance travelled was 213.03 miles (with a std. error of 9.878). The range was 1 mile to 540 miles. This variable was positively skewed, with negative kurtosis. This refers to a clustering of scores at the low end, and a relatively flat distribution, with too many scores at the extremes. In this instance, this can be explained by a large number of delegates travelling very short distances to attend, and a much smaller number of delegates travelling very long distances to attend. Finally, the variable “how many times have you attended this conference in the past?” (TIMESATT) was analysed. Once again, it was shown to have a non-normal distribution (Table 3). In this instance however the pattern of distribution was slightly different from the previous two variables.
This variable had positive values for both skewness and kurtosis, indicating a cluster of scores at the low end, and a very high peak of scores around the 0 value, indicating that a high number of delegates had never attended this conference before. The range of times attended was from 0 times to 33 times, with a mean of 2.26 times (std. error of .358). This again shows that although there was a range of 33, there was a considerable clustering of scores near the lower end of the range. The vast majority of delegates (82%) had attended 3 or fewer times. Only approximately 5% of delegates had attended 10 or more times. Severt et al (2007) found that 37.4% of the delegates they sampled were first-time attendees of the conference. This study has found that 61.6% of delegates had never attended the conference before and were therefore first-time attendees. This study therefore did not replicate the findings of the Severt et al (2007) study in this respect. The reason for this may lie in the fact that this study surveyed delegates at six different conferences, which gives a wider range of results, whilst their study concentrated on one conference only which narrows the generalisability of their results. Following analysis of the gaps in knowledge in the existing literature, several points emerged as being of interest or of practical value to the association industry. It was suggested that members of the association will have attended the conference many more times in the past than non-members of the association and further that non-members are unlikely to have attended the conference before in the past. A Mann-Whitney U test (the non-parametric equivalent of the independent t-test) was performed in order to test for differences in how many times members had attended the association conference as opposed to non-members. The results showed significant differences in times attended, with membership of the association as a grouping variable – details are shown in Table 4.
Table 4 Mann Whitney U Test on Variable TIMESATT by MEMBER
How many times have you attended this conference before?
Mann-Whitney U 2946.000

Wilcoxon W 5292.000 Z -5.235 Asymp. Sig (2-tailed) .000
Further investigations showed that on average, members had attended the conference 3.3 times before, whilst non-members had on average attended on 0.22 times before. In fact, over 85% of non-members had never attended this conference before, showing that there is no evidence for any culture of attending conferences repeatedly without being a member of the association. This may represent an opportunity for the association to increase its membership by targeting those delegates at the conference who are not currently members. It was also surmised that the variable “how many times have you attended this conference before?” (TIMESATT) would show a positive correlation with another variable which was concerned with membership - “how long have you been a member of this association” (MEMLONG).
Table 5 Correlation between TIMESATT and MEMLONG
**Correlation is significant at the .01 level (1-tailed) The high correlation coefficient between ‘times attended’ and ‘membership length’ shows that these two concepts are strongly linked. A correlation co-efficient of more than 0.5 is defined by Pallant (2001) as large. It may seem to be stating the obvious that the longer one has been a member, the more times one will have attended the conference, but it is still of interest to note that this is a positive correlation and therefore the number of times a delegate has attended the conference before does not diminish as length of membership increases. This suggests that members continue to attend conferences run by their association. In fact, of those delegates who were attending the conference and who were members of the association, 49.4% had been members for more than 10 years. Interestingly there is no significant correlation between how long a delegate has been a member of the association, or how many times they have attended in the past, and their future likelihood of attendance. The conclusions that can be drawn from these findings are as follows. It can be argued that membership of the association is an important variable in attending the association conference, although these events are often open to non-members, who simply pay a higher conference fee to attend. Tests have shown that there is a strong correlation between the number of times a delegate has attended the conference in the past and how long they have been members of the association. Socio-Demographic Characteristics of Delegates Variables that were considered to be representative of the socio-demographic characteristics of delegates were analysed in the next phase of analysis. These included age group, gender and attendance finance.
MEMLONG How long have you been a member?
Spearman’s Rho Correlation Co-efficient
.613
Sig (1-tailed) .000 N 138

Age Group With regard to the age spread of delegates, 1% of the sample were aged 15 – 24 years, 51.8% of the sample were aged 25 -44 years, 44.1% were aged 45 – 64 years and 3.2% were aged 65 years and over. Therefore This provides similar results to other research carried out in this area (Robinson and Callan 2005), who found that 51% of the UK delegates that they surveyed were aged between 25 and 44 and Severt et al (2007) who found that 80.3% of their delegates were aged between 24 and 57. It was surmised that financially-related variables would provide the most likely between-groups differences, since people have different financial responsibilities and different earning power at different times of their lives. In order to investigate this area further, a breakdown of the frequencies of the categorical variable “who is paying for your attendance” (FINANCE) by each age group was produced. This showed that for the 25-44 age group, 70% were being financed by their employer and only 13% were financing themselves. For the next age group (45-64) only 65% were being financed by their employer whilst 25% were paying for themselves. Those who were past retirement age were predominantly financing themselves (57%). This shows support for the suggestion that age is an important differentiating factor when it comes to questions of a financial nature. Gender Moving on to consider the gender of delegates, the results for the variable “are you male or female?” were analysed. As mentioned, 36.1% of the sample was male and 63.9% were female. This is clearly a departure from the generally accepted approximate 50% - 50% in the general population. The unbalanced spilt in this survey can be explained in part by the fact that one of the conferences where the delegates were surveyed was the Royal College of Nursing, an association with a high percentage of female members. In fact 96% of the delegates at this conference were female. However, there is no particular reason to suppose that the fact that women feel differently to men with respect to some of the variables in the questionnaire has any significant potential for biasing the results. Therefore having a higher number of women than men in the sample offers an interesting opportunity for research and will not bias these results. Indeed, Jago and Deery (2005) state that there are now more female convention delegates than ever before and therefore the needs of women at conventions should be studied in more depth. A Chi Square test for independence was run to establish whether there were any significant differences between men and women regarding the variable FINANCE which refers to who was paying for the delegate’s attendance at the conference [χ2= 13.704 (df=1, n=219), p=.008]. Analysis of the crosstabs showed that many more women than men were being financed by their employer and many more men than women were paying for their attendance themselves. This does tend to suggest the usual workplace stereotypes, where women are paid less than men and were only able to attend by being financed by their employers. This would be in line with the findings of Robinson and Callan (2005) who found that the female conference delegates in their survey earned less money than the male delegates. However, this is merely a suggestion and would require further investigation. Robinson and Callan (2005) also suggested that the female conference delegates in their sample were younger than the males. This study found that the percentage of female delegates within the 25 – 44 age bracket (36.5%) was higher than the percentage of female delegates within the 45 – 64 age bracket (25.6%) whilst the percentage of male delegates within the 25 – 44 age bracket (15.5%) was lower than the percentage of male delegates within the 45 – 64 age bracket (18.7%). Therefore, this study has also found that female delegates tended to be younger, whilst male delegates tended to be older.
Table 6

Age by Gender Cross tabulation Gender Total Male Female
Age 15-24 years Count 2 2 % of Total .9% .9% 25-44 years Count 34 80 114 % of Total 15.5% 36.5% 52.1% 45-64 years Count 41 56 97 % of Total 18.7% 25.6% 44.3% 65 years and
over Count 4 2 6
% of Total 1.8% .9% 2.7%
Total Count 79 140 219 % of Total 36.1% 63.9% 100.0%
Financing Conference Attendance The next variables to be examined related to financial issues. They were “who is paying for your attendance?” and “did you incur any personal expenditure in attending this conference?” A high percentage (65.9%) was being financed by their employer to attend the conference. The question of finance is of course an important one, and even those who are being financed by someone else still have to justify their reasons for attending. Only 20% of the delegates were financing themselves, which may be a reflection of the type of conferences surveyed – they were mostly professional conferences, and so perhaps were more relevant to people’s jobs than would have been the case had the associations been of a more social or leisure type (e.g. birdwatchers or beekeepers). In this instance there were no statistically significant links between the association conference that delegates were attending and who paid for their attendance. However, there was a significant link between the distance that delegates travelled and the variable “have you personally incurred any financial cost in attending this conference?” The results of a Kruskal-Wallis H Test (the non-parametric equivalent of the one-way between groups analysis of variance, or ANOVA) showed that those delegates who had personally incurred a financial cost in attending the conference had also travelled the furthest to attend – see Tables 6 and 7. This suggests two possible scenarios – either the delegates who had incurred personal costs had strong motivations for attending (and were thus willing to travel further) or those delegates who had not incurred any personal costs were not travelling far to attend the conference. The latter may suggest that perhaps their employer was financing them and did not want employees taking more time that necessary out of the work place travelling to the conference – employees might therefore be constrained to attending conferences near their workplace.
Table 7 Mean Ranks on Variable PERSFIN
Personal expenditure
N Mean Rank
Where have you travelled from?
Yes 125 121.78
No 89 91.52 Don't Know 4 125.63
Total 218

Table 8 Kruskal Wallis Test Statistic with Personal Expenditure as Grouping Variable
Where have you travelled from? Chi-Square 12.245
df 2 Asymp. Sig. .002
Demand and Trip Profile Characteristics of Delegates The remaining variables will be considered under the heading demand and trip profile characteristics, since they generally represent demand-side variables. These are areas which are of particular interest to those bodies marketing association conferences, such as the associations themselves, and also destination marketing organisations. Variables under consideration include “where did you hear about the conference?” and “did you seek further information on the conference destination before you decided to attend?” as well as “are you adding on a short holiday to the conference?”, “who are you travelling with?” and finally “how likely are you to attend this conference again in the future?” With regard to the variable “where did you hear of this conference?” the source of information for most people was predominantly association mailings (65.6%), but 25% heard about the conference either through word of mouth or by advertising. Those who gave another source of information as to where they heard about the conference gave a selection of sources, but these sources can be broadly summarised as either their employers or other associations that they are members of. Therefore, if associations are interested in attracting non-members to their conferences, it might be a good starting point to target large employers in a field pertinent to the association in order to attract more non-members of the association to attend. Targeting members of other related associations might be seen as unfair. A Chi Square test for independence [χ2=59.57, (df=3, n=219) p=.000] showed significant differences between those who were and those who were not members of the association whose conference they were attending with regard to how they heard about the conference. 85.7% of non-members heard about the conference through word-of-mouth. Perhaps associations who want to attract more delegates to their conferences could appeal to their members to spread the word amongst colleagues and friends, as this may to be how most non-members hear about association conferences. This avenue is important for attracting delegates to the conferences who are not members of the host association. Although the results for this variable show support for association mailings, word of mouth and advertising being the main ways that potential delegates hear about association conferences in the first place, further research could carried out into the effect on motivation to attend a conference that each of these sources of information have on potential delegates. Severt et al (2007) did find that positive word of mouth was a good predictor of future intention to return to the conference and therefore it would be interesting to see if these findings could be replicated at other conferences. The results for the variable “did you seek further information on the destination before you decided to attend?” proved problematic. The results showed that only 25.5% of respondents said “yes” and therefore 74.5% of respondents either did not seek further information or did not respond to this question. The low numbers that replied to this question mean that although some general comments can be made about sources of information, statistical tests cannot be carried out with any certainty. It can be surmised that the number of delegates who require further information once they have heard about the conference is fairly low, but further research

is required in order to clarify this. Therefore, further definitive statements about the information search cannot be made on the basis of the results of this study. The following two variables exhibit a strong conceptual link – they deal with the conference trip profile, and more specifically whether the delegate is adding a short holiday to the conference or not (HOLIDAY) and whether the delegate is travelling accompanied or alone (ALONE). Jago and Deery (2005) suggested that international conference delegates were “cash rich, but time poor” and that as a result of this, convention delegates had very little spare time before, during or after the convention. It seems reasonable to consider that this may be the case for UK association conference delegates too. It may also be the case that those delegates travelling alone would be much less likely to want to add on a short holiday before or after the conference. This will be of interest to associations organising conferences, and destination marketing bodies in terms of how much effort they should expend in trying to market add-on holidays to association conference delegates. A Chi-Square test for independence was carried out in order to test this hypothesis, but the assumptions for this test (that ideally no cells should have an expected count of less than 5) was not met. An attempt was made to collapse the groups and another Chi Square test was carried out, but again the assumptions for the test were not met and therefore other methods of analysis were used. A conclusive 89.1% of delegates were not adding on any holidays to the conference, and although this cannot be taken to be representative of every association conference in the UK, it seems possible that those who take a holiday before or after attending an association conference in the UK may well be very much in the minority. This is in line with the findings of Jago and Deery (2005) that delegates spend the minimum amount of time at the convention destination and have decreasing amounts of spare time. Interestingly the finding is also very similar to the results of the National Business Events Study in Australia which also found that about 10% of domestic event attendees took an additional pre- or post event tour (Deery et al 2005). Although the Australian context and the UK contexts are very different, particularly in terms of the distances travelled, it may be reasonable to argue that about 10% of delegates at a domestic association conference are likely to add on a trip to their attendance at the event. This may be helpful to destination marketing bodies that might be spending a disproportionate amount of time and money trying to market add-on holidays to delegates at UK association conferences. In addition, and in some ways to further strengthen the above argument, 57.3% of delegates were travelling alone. It could be argued that those travelling alone are slightly less likely to want to extend their stay, as they may have left family and/or friends at home although it is also possible that those travelling alone would find it easier to extend their stay as they may not need to co-ordinate their travel plans with others. Further, another 37.7% of delegates were travelling with colleagues, which suggests a business relationship, and much less likelihood of those delegates wanting to add on a short holiday. In fact, only 4.5% of delegates were travelling with a partner/family. This may suggest that there is little need for any accompanying persons’ events or facilities to be organised during UK association conferences. Again, these findings are remarkably similar to those of the National Business Events Study (Deery 2005) which found that overall only 3.1% of all delegates brought accompanying people with them. This may be an area where associations could perhaps save money from their conference budget. Of the 126 delegates who replied that they were travelling alone, 115 (91.3%) were not adding on a short holiday to the conference. Only 11 delegates travelling alone were adding on a short holiday to the conference – two before the conference and nine after the conference. This seems to support the suggestion that delegates travelling alone are much less likely to be adding on a short holiday. However, no statistical test was able to confirm this.

CONCLUSIONS It should be stressed again at this point that the conferences surveyed in this research were UK association conferences held in the UK, and it is to be expected that conferences with an international dimension would show different results all round, especially on the questions of travelling with family and adding on a short holiday before or after the conference. That said, there were some remarkable similarities between the findings of this research and some of the findings from the National Business Events Study (Deery et al 2005) regarding Australian domestic event attendees. The results of this research should prove interesting both to destination marketing bodies and to association conference organisers. These findings have contributed to the aim of understanding and defining the characteristics of the delegates attending UK association conferences. The characteristics of the delegates were divided into three types – membership & attendance characteristics, socio-demographic characteristics and demand and trip profile characteristics. This enabled information to be sought on each of these types of characteristics. With regard to the membership and attendance characteristics of the delegates, results showed that there is a strong correlation between the number of times a delegate has attended the conference in the past and how long they have been members of the association. Finally, the results of the data analysis illustrated that it was not possible to state conclusively that delegates travelling alone were significantly less likely to add on a short holiday to the conference than delegates travelling accompanied. However, examination of the data does suggest that this may be the case. The results of this study should prove useful to those charged with marketing business events, particularly in the area of business events. This research has highlighted a number of delegate characteristics can be used in the future as the building blocks for a typology of UK association conference delegates – an invaluable tool for associations and professional conference organisers alike. REFERENCES BCVS (2004). British Conference Venues Survey 2004, Business Tourism Partnership. Baloglu, S. and Love, C. (2001). "Association Meeting Planners' Perceptions of Five Major
Convention Cities: Results of the Pre-Test." Journal of Convention and Exhibition Management 3 (1): 21 - 30.
Crouch, G. I. and Ritchie, J. R. B. (1998). "Convention Site Selection Research. A Review, Conceptual Model and Propositional Framework." Journal of Convention and Exhibition Management 1(1): 49-69.
Go, F. and Zhang, W. (1997). "Applying importance-performance analysis to Beijing as an international meeting destination." Journal of Travel Research 36: 42–49.
Go, F. M. and Govers, R. (1999). "The Asian Perspective: Which International Conference Destinations in Asia are Most Competitive?" Journal of Convention and Exhibition Management 1(4): 37-49.
Grado, S. C., Strauss, C. H. et al. (1998). "Economic Impacts of Conferences and Conventions." Journal of Convention and Exhibition Management 1(1): 19-33.
Jago, L. K. and Deery, M. (2005). "Relationships and Factors Influencing Convention Decision-Making." Journal of Convention and Event Tourism 7(1): 23 - 41.
Kim, S. S., Chung, K. Y. et al. (2003). "Convention industry in South Korea: an economic impact analysis." Tourism Management 24(5): 533-541.
McCabe, V., Poole B,.. Weeks, P & Leiper N. (2000). The Business and Management of Conventions. Brisbane, John Wiley & Sons.
Middleton, V. (2001). Marketing in Travel and Tourism. Oxford, Butterworth-Heinemann.

Mistilis, N. and Dwyer, L. (1999). "Tourism Gateways and Regional Economies: the Distributional Impacts of MICE." International Journal of Tourism Research 1: 441-457.
Opperman, M. (1996a). "Convention Cities - Images and Changing Fortunes." The Journal of Tourism Studies 7(1): 10-19.
Opperman, M. (1996b). "Convention Destination Images: Analysis of Association Meeting Planner's Perceptions." Tourism Management 17(3): 175-182.
Opperman, M. (1998). "Perceptions of Convention Destinations: Large-Half versus Small-Half Association Meeting Planners." Journal of Convention and Exhibition Management 1(1): 35-48.
Pallant, J. (2001). SPSS Survival Manual - A Guide to Data Analysis Using SPSS. Maidenhead, Open University Press.
Qu, H., Li, L.et al. (2000). "The Comparative Analysis of Hong Kong as and International Conference Destination in South-East Asia." Tourism Management 21: 643-648.
Robinson, L. S. and Callan, R. J. (2005). "UK Conference Delegates' Cognizance of the Importance of Venue Selection Attributes." Journal of Convention and Event Tourism 7(1): 77 - 91.
Severt, D., Wang, Y. et al. (2007). "Examining the motivation, perceived performance, and behavioral intentions of convention attendees: Evidence from a regional conference." Tourism Management 28: 399 - 408.
Trochim, W. M. (2004). The Research Methods Knowledge Base (2nd Edition). VisitScotland (2003). Business Tourism Update on Trends, Edinburgh Yoo, J. J.-E., and Weber, K. 2005. “Progress in convention tourism research”. Journal of
Hospitality & Tourism Research 29 (2):194-222.

Fourth International Event Research Conference Re-evaluating the City/Town: Events as a Catalyst for Change
APPLICATION OF A VISITOR TRACKING STUDY AS AN EVENT MARKETING RESEARCH TOOL: BREEDEKLOOF FESTIVAL, SOUTH AFRICA
Dimitri Tassiopoulos
School of Tourism & Hospitality Walter Sisulu University, South Africa
Norbert Haydam Cape Peninsula University of Technology, South Africa
ABSTRACT The main purpose of the study was to focus on the strategic marketing aspect of an event. The study sought to determine the profile and perceptions of attendees at the 2004, 2005 and 2006 Breedekloof Outdoor Festival (South Africa). Respondents were selected through random sampling. A structured questionnaire was used. The main findings suggest that between 2004 and 2006 there was a consistent increase (+8.6%) in the 18 to 25 years age group at the expense (-16.1%) of the 36 to 50 years group, more visitors (+16.9%) came from the metropolitan area (some 120 km away) and travelled without their children (79.4% in 2006). Word-of-mouth stayed a very prominent (60.3%) informal way of attaining information with regards to the Festival. This study seeks to contribute toward the body of knowledge of event management tourism. Visitor profile studies, as marketing research vehicle, should be a standard tool in the management of events. Keywords: Profile tracking, strategic marketing research, South Africa, demographic segmentation, tourism behaviour.
INTRODUCTION It is widely recognised that major events, according to SAT & DEAT (2002), across the events, sport, arts and culture spectrum, contribute significantly towards increasing tourist traffic and driving economic development in a region. As a result, hosting and bidding for events have now become integral components of the overall tourism offering of many countries. Getz (1991) (as in SAT & DEAT, 2002) and Tassiopoulos (2005) define event tourism as tourism that is concerned with the roles that festivals and special events can play in destination development and the maximisation of an event’s attractiveness to tourists. A primary qualifier for event tourism is that non-residents are participating in or attending a predetermined event. Notwithstanding the debates pertaining to definitional clarification, the above aspects are key to ensuring that the critical elements of event tourism is retained and informs the development of a national event strategy. Destination marketers should consider a portfolio of events in which the occasional mega-event is balanced by bidding on smaller, regular events and periodic local or regional-scale events (Getz, 1999) (as in SAT & DEAT, 2002). It is further advised that although many communities can never aspire to host the world’s largest events, they can create a suitable niche. Communities can focus on a particular type of sport or event to find competitive advantage. The capacity of venues and visitor services in a community will largely determine the size of events attracted. Event destinations can make use of more focused strategies such as creating new events, pursuing participant events and developing media events.

There are events that are more appropriate to certain regions, and it will be necessary to identify these regional “competitive advantages”. Subsequent strategies, such as “Tourism in GEAR, 1997-2000”, were formulated to direct the implementation of policies contained in the White Paper. These strategies sought to position South Africa as a globally competitive tourist destination attracting more tourists and creating significantly more tourism related jobs, and increasing tourism’s contribution to the South African economy. Special events, of all kinds, have been increasing in number, size, and diversity (as in SAT & DEAT, 2002). The development of tourism attractions is often seen as a means toward counteracting the poor economic activity that rural and regional areas experience. Such areas are considered to need new or more diversified economic activity. A strategy for encouraging tourism in areas with little obvious appeal could involve the creation and promotion of a niche-market attraction, that is, rather than attempting to change attitudes to the existing destination, something new and unusual is added to increase the appeal of the destination to tourists. While this paper does not set out to specifically debate this strategy, focussing investment of specific projects or concepts is an attempt to increase tourism visitation to a region and thus improve the socio-economic impacts of a low tourism profile area (Hughes & Macbeth, 2005). Besides various kinds of attractions that “pull” tourists to event destinations, according to Bruwer (2003), other factors play a role in the decision process when choosing a particular destination. These factors are indicated as: geographical distance between the generating region and the wine tourism destination; travel time needed to cover the geographical distance, the amount of money needed by the tourists to cover the geographical distance; and, the cognitive distance (or perception of the distance) between the generating region and the destination. It is further highlighted that events can have push (motives and the like) and pull (the attractiveness of destinations) factors that affect event tourism destination choice. Brown & Getz (2005) propose a five generic choice factors model as a framework for analysing event tourism destination choices. These 5 factors are: tourist variables (needs, personality, lifestyle, life stage and experience); marketing variables and destination awareness (marketing activities carried out by tourism organisations and wineries); affective associations of destinations (positive association with certain event destinations i.e. cultural, historical and pilgrimage event icons); tourist destination preferences (potential tourists possess a short list of preferred or likely destinations);and, situation variables (final choices are related to constraints and risk-reduction behaviour rather than the attributes of a destination). Breedekloof is about 120km from Cape Town and forms part of the Route 62 wine route (purportedly the longest wine route in the world) which stretches from Cape Town, to Oudshoorn, the Garden route and Port Elisabeth. The Breedekloof region1 is traditionally a low tourism profile area and long-distance event tourism destination. It is one of the youngest of 15 wine routes in South Africa comprising of 23 wineries. Breedekloof is considered a long-distance event tourism destination for the following reasons: its main event tourism source, market is the Cape Town Metropolitan area about 120km away, and requires at least 90 minutes of drive-time to access it. In addition, there are further psychological barriers that need to be overcome i.e. there is a the Du Toitsberg and Hex River Mountains2 that needs to be traversed (“have to go over the mountains”) between Breedekloof and the Cape Town Metropole. Further, the Huguenot Tunnel tollgate fees that may need to be paid if the scenic, but treacherous, Du Toitskloof Pass road option is not used might be a psychological barrier. Historically, the Breedekloof region’s wines were produced by co-operative cellars that focussed on producing 1 Comprising of Goudini, Rawsonville, Slanghoek, Villiersdorp, Bainskloof, Breede River and Dutoitskloof. 2 Forming a part of the greater Cape Folded Mountain range.

wine in bulk. In October 2003, Rawsonville Wine and Tourism (RWT), a non-profit organisation was launched with an overall goal to promote the said area to become a event and wine tourism destination and consequently reap the benefits of expected increased employment. RWT would, therefore, not only be involved in the marketing of the region, but also in community development and upliftment (via infrastructural developments). In May 2004 Breedkloof made a strategic decision to improve its tourism profile through the staging of a main event i.e. the Breedekloof Outdoor Festival. The Breedekloof Outdoor Festival, a sport and outdoor lifestyle festival, was launched in October 2004. The festival combines a multi-sport team challenge called the Breedekloof Outdoor Challenge with other competitive outdoor sporting events such as the Deetlefs Night Run and an event programme of music, food and cultural events hosted throughout the region at the various wineries. The event aims at attracting tourists from both Cape Town and other surrounding areas as well as tourists from upcountry who are heading south along the N1 in search of sea and sand. (Breedekloof, 2006). METHODOLOGY Longitudinal studies involve surveying respondents at different times, thus allowing to observe changes that occur over a certain period. Two types of longitudinal studies are noted: tracking studies and consumer panels. Longitudinal tracking studies3 use consecutive samples to compare trends and identify changes in variables such as consumer satisfaction, brand image or advertising awareness. A longitudinal consumer panel on the other hand, uses the same sample of individuals or households to record their attitudes, behaviour or purchasing habits over time. This type of longitudinal study is particularly important where the researcher wants to learn, for example, about brand switching behaviour (Zikmund & Babin, 2007). A tracking study was chosen for the Breedekloof Event, as this type of longitudinal study is particularly useful in assessing aggregate trends (as per Zikmund & Babin, 2007). The work of Thomas (1995) was used as a benchmark for this study and the following indicators, amongst other, in which the effectiveness of any profile tracking research can be evaluated. These are:
i. A good sampling plan and management is regarded to be absolute crucial to attain consistently accurate tracking data. In this regard, the sample should be as broad and inclusive as possible, using a structured randomised sample procedure.
ii. The questionnaire must remain the same over the tracking period. It was noted that even small changes to the questionnaire could create unexpected changes in the results.
iii. All interviewing procedures and controls must remain constant over time. This includes all supervisory and all training aspects of the tracking study.
iv. Editing, coding and tabulation must remain constant over time, which includes the handling of key definitions, no answers and blanks, and,
v. It is recommended that in order to enable comparable data, the same research company should do the research over the longer tracking term. The strategic value of tracking research can only fully realised after several years of consistent longitudinal data.
For the profile tracking study, a cross sectional time series research design was used spanning a 3-year period from 2004 to 2006 to track the profile of tourists to the Breedekloof Outdoor Festival. Diagrammatically, this design can be depicted as follows:
EG (RR):
X1
O1
X2
O2
X3
O3. Oct 2004 Oct 2005 Oct 2006
3 Referred as quantitative market research tracking studies by Callington (2004, 95).

Where Xi = the Outdoor Festival, Oi = profile tracking at these events. EG = the Experimental Group for the tracking study who were who were exposed to the event i.e.
independent variable (Xi) and randomly chosen (RR). However, with regards to Xi, it must be noted the format of the Festival changed over time.
The following table summarizes the make-up of the Festival over the past 3 years.
Table 1
Festival characteristics over the past 3 years Characteristics X1
2004 X2
2005 X3
2006 Festival grounds / central venue
Yes Yes No
Festivities at various wine cellars:
Yes Yes Only wine cellars offerings
Days of Festival: Friday, Saturday & Sunday
Friday & Saturday only
Friday, Saturday & Sunday
Time: 2nd week October 2nd week October 2nd week October Format of main sport challenge:
Various independent sport events.
Participants choose the events of the main
sport challenge they want to compete in.
One main sport event. Participants have to compete in all the events of the main
sport challenge.
One main sport event Participants have to compete in all the events of the main
sport challenge.
The only unchanged characteristic of the Festival over the past 3 years has been the timing of fieldwork that has been the second weekend of October. In total 200, 201, and 107 outdoor event tourists were intercepted during 2004, 2005 and 2006, respectively. A personal interviewing technique with a structured questionnaire was used. It must be noted that the sample size was limited to the research funds available, and the smaller sample in 2006 was mainly attributed to a substantial cut in available research funding. A systematic time-based sampling procedure i.e. where respondents were intercepted at pre-determined time intervals was applied at all three events. The tourist group to the Festival acted as a sample unit and to qualify as a sample element, the respondent had to be at least 18 years of age (inclusion) and not be involved in any way to the festival itself (exclusion). In the case where more than one sample element qualified, the birthday rule was applied to select the eligible respondent. FINDINGS The research findings are discussed under the following main headings, namely, (i) market segmentation, (ii) promotion (iii) and customer satisfaction. Market Segmentation Being an intercept study, only a limited amount of information can be obtained. Hence, for segmentation purposes, only geodemographical and behavioural segmentation were examined using priori segmentation. Geodemographic variables The generic geodemographic characteristics of the tourists to the Breedekloof Festival have been presented in Table I by age, gender, population group, family-life cycle, and place of origin and home language. The tracking study identified the following shifts since 2004:
There was a substantial increase from 18.5% to 27.1% in the age group 18 to 25 years at the

expense of the 36 to 50 year age group that dropped from 37.5% in 2004 to 21.5% in 2007. Secondly, the Festival attracted more attendees of European descent (93.5% of all tourists in 2006). In a multi-cultural society, and with Government attempts at making South Africa more inclusive, the Outdoor Festival has failed in this regard. Furthermore, concerning the family life-cycle, the Bachelor grouping (33.0%), Full Nest I (14.2%) groupings and Empty Nesters (11.3%) entrenched themselves as main tourist groups to be catered for in the Festival since 2004. These groups (making up 58.5% of all tourists) require different market offerings and need to be positioned accordingly (see discussion of findings in this regard).
There also has been a steady increase from 20.5% to 37.4% during 2004 to 2006 of tourists from the furthest and most dense catchment area i.e. the Cape Metropolitan area – some 100km away. The language split seems to have ‘settled’ at some 70% Afrikaans speaking and 18% English-speaking tourists.
Table 2
Geodemographic variables Demographic variable: 2004 2005 2006 Age 18 to 25 years 18.5% 22.9% 27.1% 26 to 35 years 32.5% 24.4% 30.8% 36 to 50 years 37.5% 35.8% 21.5% 50 years + 11.5% 16.9% 20.5% Gender: Male 49.0% 36.3% 68.2% Culture European 88.5% 78.6% 93.5% Coloured 10.5% 20.4% 4.7% Family life cycle1 Bachelor 35.5% 28.9% 33.0% Newlywed I 5.5% 4.0% 12.3% Newlywed II 2.5% 2.5% 2.8% Full Nest I 15.0% 13.4% 14.2% Full Nest II 23.0% 23.4% 14.2% Full Nest III 5.5% 6.0% 4.7% Empty Nest 5.0% 10.9% 11.3% Single Parent I & II 5.0% 8.5% 1.8% Senior Citizen I & II 3.0% 2.5% 5.7% Area of residence Goudini / Rawsonville (immediate) 12.5% 26.9% 15.9% Worcester (13km) 22.5% 25.4% 16.8% Winelands: (70km) 8.5% 8.0% 13.1% Other: Western Cape (100km+) 26.5% 4.5% 6.5% Cape Metropolitan Area (120 km) 20.5% 27.4% 37.4% Language Afrikaans 76.0% 80.1% 72.0% English 19.0% 13.9% 17.8% All other languages 5.0% 6.0% 10.2% Base 200 201 107 1 The following definitions were used with regards to the family life cycle were used: • Bachelor: not older than 65 years of age, single, and living/not living at home. • Newlywed I: not older than 35 years of age, married and no children. • Newlywed II: between 36 and 65 years of age, married and no children.

• Full Nest I: not older than 65 years of age, married, and children not older than 6 years of age,.
• Full Nest II: not older than 65 years of age, married, and children between 7 and 17 years of age.
• Full Nest III: not older than 65 years of age, married, dependants staying at home, over the age of 18 years.
• Empty Nest: not older than 65 years of age, married, no children living at home anymore. • Single parent I: not older than 65 years of age, single, and children not older than 6 years of
age. • Single parent II: not older than 65 years of age, single, and children between 7 and 17 years
of age. • Senior citizen I: over 65 years of age, and no dependants. • Senior citizen II: over 65 years of age, and dependants under the age of 18 years. Behavioural variables The travel trip behavioural characteristics (or tripographics as per Hu and Morrison, 2002) of the event attendees are discussed in this section. These factors include aspects such as the accommodation preference of event attendees, travel party characteristics, number of days attended, overnight stays, area of residence whilst visiting the event, and the number of days in the area. In addition, total expenditure of tourists whilst in the area will also be looked at. a) Travel-party characteristics There is no certainty with regard to the size of the travelling party over the past 3 years. Further tracking studies need to be conducted to establish a fixed pattern with regard to the travel party size which varied from 4.4, 3.6 and 5.5 in 2004 to 2006 respectively. However, the make-up of the travelling party has changed since 2004 with more tourist groups travelling without children reflecting an increase from 55.5% to 79.4% from 2004 to 2006. b) Accommodation and attendance preferences More than half (56.0%) of all tourists to the Festival stayed longer than one day, which is much higher than in previous years: 39.5% (2004) and 31.3% (2005). The latter percentage can mainly be attributed to the fact that the 2005 Festival only ran over 2 consecutive days instead of the 3 days as in 2004 and 2006. Compared to previous years, a higher percentage i.e. 33.6% from 24.5% in 2004 of tourists stayed overnight in 2006 specifically for the Festival. Although there was a marginal drop of 4.1% in overnight tourists in 2005 from the previous year, it can be ascribed that the fact that the Festival ran over 2 days in 2005 instead of the 3 days as in 2004 and 2006. The research, in addition, also indicated a proportional increase of tourists staying in more expensive types of accommodation. Over a three-year period the usage in Guest houses and Bed & Breakfasts increased by 8% and 13.5% to 16.2% and 13.5% respectively. However, the local Goudini Spa holiday resort showed a proportional drop of 4.8% to 5.4% in 2006. In 2005 and 2006 the Breedekloof Tourism Bureau’s reservations office mentioned that all available accommodation in the area was booked out. To put this into perspective, in 2005 73.2% of all tourists stayed in the immediate catchment area of the Breedekloof region with a 9.8% ‘overflow’ going to the Worcester area (some 12km away). However, with more people staying overnight in 2006, this resulted that nearly a third of tourists had to find alternate accommodation in neighbouring area of Worcester.

Table 3 Behavioural variables
Category: 2004 2005 2006 Size of travelling party Sole traveller 5.0% 15.4% 7.5% Two 30.0% 25.9% 18.7% Size of travelling party: mean value 4.4 persons 3.6 persons 5.5 persons No children in the travelling party 55.5% 66.2% 79.4% Number of days attended One day 60.5% 68.7% 44.0% Two days 20.0% 31.3% 26.0% Three days 19.5% n/a 30.0% Stayed overnight in the region Yes 24.5% 20.4% 33.6% Number of days: mean value 2.4 days 2.4 days 1.8 days Area residing during Festival Breedekloof area (immediate) 59.2% 73.2% 58.3% Worcester area (13km afield) 32.7% 9.8% 30.6% Type of accommodation used Staying with friends and relatives 24.5% 36.6% 24.3% Camping 18.4% 22.0% 13.5% Guest house 8.2% 12.2% 16.2% Holiday resort 10.2% 9.8% 5.4% Bed and breakfast - 7.3% 13.5% Base 200 201 107 (*) Multiple answers. c) Event related expenditure The tracking study indicated a significant increase in the proportion spent on accommodation by a travelling party to the Breedekloof Outdoor Festival. This significant change is attributed to the following factors: (i) The size of the travelling party increased significantly from 4.4 in 2004 to 5.5 persons in
2006. (ii) In 2006, fewer adults were accompanied by children4. In this regard, in 2004, 40.8% of
tourists had children in their travelling party compared to only 20.6% in 2006. (iii) More tourists stayed overnight in 2006 (33.6% compared to 20.4% in 2005). Finally the net expenditure per person per day increased by 44.9% over a 3-year period from R129 in 2004 to R187 in 2006. The inflation rate (as measured by the CPI) in the respective years were 1.4%, 3.4% and 4.7%, giving it a cumulative percentage of 9.8% (SARB, 2007: S-138). Hence, the real growth in expenditure by tourists to the Festival is 35.1%. Refer to table III in this regard.
Table 4 Event related expenditure
Category 2004 2005 2006 Restaurants / fast food / take-aways 59.8% 51.3% 28.1% Accommodation 8.5% 11.3% 29.6% Wine purchases 8.5% 9.4% 21.9% Curio, gifts and souvenirs 2.6% 3.6% 3.7% 4 In terms of expenditure, children under the age of 16 years, count as half.

Groceries 1.0% 6.8% 2.7% Unclassified expenditure 19.8% 17.4% 13.9% Mean expenditure per travel group R583 R520 R1,173 Mean net expenditure per person per day R129 R138 R187 Base 178 183 72 Promotion A proportionate increase in the usage of the regional newspaper ‘Die Burger’ and the Internet was recorded over the 3-year tracking period. Over 80% of respondents have read the Burger and 82.2% of tourists used Internet access to obtain information about the Festival. One key reason explaining this is that the regional newspaper ‘Die Burger’ became the main sponsor in 2005 through to 2006. The study noted that the regional radio station and posters/flyers were used less by tourists to the Festival. Sports clubs ceased to exist as a source of information in 2006.
Table 5 Sources of information
Category: 2004 2005 2006 Radio: Kfm (regional) 91.5% 74.1% 65.8% Radio: RSG (national) 8.5% 14.8% 10.5% Newspaper: Die Burger (regional)(**) 55.9% 63.9% 80.7% Newspaper: Worcester Standard (local) 54.4% 56.7% 33.3% Word-of-mouth 50.4% 49.1% 60.3% Posters / flyers 38.3% 25.8% 16.7% Referrals: business / friends / family 7.8% 14.5% 16.7% Internet access 69.0% 72.6% 82.2% Used web to obtain information about Festival 30.4% 22.6% 31.8% Base 200 201 107 (**) Also main sponsor in 2005 and 2006. Customer satisfaction Tourist satisfaction was divided into two interrelated sections, namely customer satisfaction and customer relationships. Event attendee satisfaction of the Festival Respondents were asked to rate various aspects of the Festival on a 5-point scale. The results were then weighted to depict a percentage as reflected in Table VI.
Table 6 Rating of Festival
Category Mean score 2004
Mean score 2005
Mean score 2006
Cleanliness of the Outdoor Festival 83.1% 80.4% 92.1% Other attractions in the area 78.3% 78.7% 88.1% Overall experience at the Outdoor Festival 83.6% 74.7% 87.8% Overall service at the Outdoor Festival 82.0% 75.5% 87.2% Competitive event: The Outdoor Challenge 80.4% 77.1% 86.4% Hospitality: food and drinks 79.6% 77.2% 86.0% Winery activities - 77.9% 85.9% Access to the Outdoor Festival 76.7% 72.7% 82.3% Overall family entertainment 75.0% 73.4% 81.2% Security at the Outdoor Festival 79.8% 77.6% 76.1%

Children's adventures / facilities 71.9% 76.1% 74.7% Road signs to the Outdoor Festival 69.1% 69.5% 70.5% Information on the Outdoor Festival 74.3% 67.9% 66.5% Base 200 201 107 The study found that there were constant increases since 2004 in road signage usage to the Outdoor Festival and other attractions in the area. Security and information to the Festival however showed a declining trend the over 3-year period. Apart from the aforementioned mentioned factors, all other factors showed an increase when comparing 2004 to 2006. Event Attendee relationships In 2005, some 70% of all tourists to the event were first-time tourists. This figure dropped significantly in 2006 to 59.8% - an indication that the event attracts more repeat tourists (percentages listed in table VII).
Table 7 Future behaviour
Category: 2004 2005 2006 Attended Festival in the previous year First time attendance to Festival (overall) 100.0% 72.1% 59.8% Compared to previous year, the Festival was Much better than the previous year - 35.7% 32.6% Better than the previous year - 39.3% 39.5% The same as the previous year - 3.6% 18.6% Likelihood of attending Festival in the next year Most likely to attend 77.5% 61.2% 75.7% Likely to attend 14.0% 21.4% 13.1% Maybe 6.0% 10.4% 4.7% Would recommend Festival to friends / family Most definitely 64.5% 58.2% 76.6% Definitely 23.5% 17.4% 17.8% Maybe 8.0% 14.9% 3.7% Reasons for recommending / not recommending Festival(*)
Positive statements: all 87.4% 79.3% 94.6% Overall experience 54.4% 40.7% - Events related positives 11.0% 13.6% 12.0% Negative statements: all 4.9% 12.9% 4.3% Poor entertainment 2.2% 5.7% - General / neutral comments: all 9.3% 8.6% 1.0% Base 182 140 92 (*) Multiple answer. A high percentage of attendees who visited the Festival in 2004 and 2005 (72.1%) indicated that more than 70% of all respondents rated the Festival in 2006 as better/much better. Concerning long-term tourist relationships, the incidence of not likely to attend/most unlikely to attend the Festival in the future was very small: 2.0%, 5.0% and 2.8% in 2004, 2005 and 2006 respectively. Similarly, only 2.5%, 5.0% and 3.6% of tourists mentioned that they would definitely not/most definitely not recommend the Festival to either friends and/or family. Most comments made in this regard were very positive. DISCUSSION OF FINDINGS
It should be noted that because of the aforementioned limitations of the study, it is not possible to claim that the findings in this study are representative of the entire event tourism population in South Africa; however, this study provides critical information for event tourism development. It is a groundbreaking study that could be explored further through longitudinal studies with larger samples. The collection and interpretation of event tourism statistics in South Africa can be described as being in its formative stage. The results suggest that the typical demographic profile of the South African visitor at this event is as follows: they are mostly people in the age group of 26 to 35 (and to a lesser extent the 18 to 25 years old group), are most likely male (68.2%), of European descent (93.4%) and mostly speak Afrikaans (72%), are Bachelors (33%), and originate from the Cape Town Metropolitan Area (37.4%). An age-based sub-culture can be described as a generation of people who have experienced a common social, political and economic environment. Generations can be roughly sub-divided into 20-year blocks and can help to explain different consumer behaviours (Koutras, 2006). The 18 to 25 years group can alternatively be called Generation Yers who were born from 1979 to 1994 (13 to 28 year old). In the context of the South Africa event tourism industry it is suggested that they represent the new upcoming target market that requires continual research. Generation Yers is the largest generation to hit global markets since the Baby Boomers. “In South Africa, the impact of Generation Y is important. Generation Yers makes up 64% of the local population and spend ZAR200 billion a year. Marketing campaigns are beginning to target younger and younger audiences making Generation Yers an ideal target market because they have a basic desire for anything new, fresh, and increasingly able to influence their parents’ spending habits” (Koutras, 2006: 106). Generation Yers have the following social characteristics: are good, critical thinkers; cherish autonomy; lean towards libertarian (egalitarian) ideals; want to be treated fairly and with respect; have tremendous self-confidence; are distrustful of governments, large organisations and the elite; are extremely networked (technologically and personally); depend socially on relationships with selected, but changeable, peers; and are informal and situational in their approach to ethical and work issues (Leonardi, 2007). The study also further notes the so-called “Generation Xers” (Kotler, Bowen & Makens, 1999). The Generation Xers (36 to 50 years old group) were born between 1965 and 1978 (or between 1964 to 1979, according to Fountain & Charters, 2004) and are associated with having lived through the dismantling of apartheid and have reached sexual maturity in the high-risk age of HIV/AIDS and have developed a pessimistic economic outlook that is aggravated by problems in finding highly sought after jobs. Consequently, the Xers are a more sceptical, and, cynical about frivolous marketing pitches that promise for easy success (Tassiopoulos et al, 2004). The study noted that the 36 to 50 year old generation has shown a steady decline during the tracking period (2004-2006). The segmentation of the event tourism market has direct implication for the type of event tourism offering that has to be developed and has direct implication for type and extent of event offering development. The study noted the following aspects over the tracking period (2004-2006): firstly, the Breedekloof Festival had become a more exclusive Afrikaans language event attracting mostly South Africans of European descent. Secondly, Bachelors, Full Nest II and Empty Nesters are the three key demographic target markets, which should be targeted and their needs met. Thirdly, since 2004, more tourists have originated from the Cape Metropolitan area and the Winelands. Fourthly, the size of the travel party varied all three years between 3.6 to 5.5 tourists and only further research will establish the actual size, however, there is a downward trend in the inclusion of children in the travelling party. Fifthly, although not depicted as a trend per se, there has been a considerable increase in the number of tourists staying over in the area in 2006 to attend the Festival. This trend has resulted in a vast increase in the total spend per

travelling party as well as in the proportion spent on accommodation. Sixthly, there has been a trend towards more tourists staying in Guesthouses and Bed & breakfasts. Seventhly,” Die Burger”, an Afrikaans language newspaper, the main sponsor, has entrenched itself as a key medium of communication with over 80% of attendees having referred to the newspaper for information concerning the Festival. Finally, more tourists have had access to the Internet (69 to 82.2%) with more searching for information concerning the Festival. CONCLUSION This paper has sought to determine the profile and perceptions of attendees at the 2004 to 2006 Breedekloof Outdoor Festival, a sport and outdoor lifestyle event to encourage people to visit the area to experience its natural beauty, outdoor adventure activities and its award-winning wine. Tracking research vehicle used in the Breedekloof Outdoor Festival has addressed the following strategic marketing issues: Firstly, it has provided for a priori segmentation strategy using a geodemographical segmentation approach, combined with a behavioural segmentation approach of the Festival attendees, over time. Key target markets have been identified. Secondly, to a lesser degree, the tracking study probed for improvements concerning the Festival. Although these comments were classified, valuable verbatim text could be analysed in this regard. Thirdly, advertising tracking i.e. information sources used to get to the Festival since 2004 have been confirmed. Finally, in view that key aspects of the Festival have been rated, relationship-marketing activities can now be engaged. The results of the study underscore the strategic importance of the event tourism for destinations such as Breedekloof. If managed and co-ordinated effectively, a well thought-out event development strategy, according to SAT & DEAT (2002), has the potential to bring the following benefits and achieve the following goals for a destination: • Provide a means by which to reinforce a destination’s benefits and attributes and generate a
favourable image for the destination as a tourist destination • Establish a destination as a major tourist destination by attracting high yield visitors,
especially repeaters • Enhance a destination’s competitive position within a country and put it on the global map • Generate increased rate of tourism growth • Truly bring a destination to life, showcasing its brand personality and instilling confidence
and pride in its local community • Maximise the use of, and revenue for, existing facilities • Favourable incidental media coverage through the event platform which extends the normal
communication reach • Improve the organisational, marketing, and bidding capability of the community • Increase community support for events Should behavioural segmentation be considered, then the offerings could be segmented in terms of those who stay over in the area and according to the duration of stay. Key questions have to be asked here, including: Are there enough activities in which over-night visitors can engage in over a 2 and 3-day period? How is the day visitor catered for (especially those who travel 120km to the event? What should be offered for specifically the local community? Secondly, product related developments should be considered. The key issue here is whether a central venue is appropriate for hosting the event or should the event be hosted on a decentralised basis on various wine farms. Furthermore, wine farm event offerings should be coordinated to address the various target markets identified (as per target marketing), otherwise the farms could all target the same groups e.g. Bachelors, and thus neglecting the other target groups. Thirdly, the effectiveness of media used should be analysed and the event response adjusted accordingly. For instance, although posters or flyers showed a decreasing trend in awareness since 2004, the information that was lacking is “what percentage of the total advertising budget is spent by the

Breedekloof committee on this advertising media?” This will provide an indication as to the cost effectiveness of such a medium. Finally, given the fact that targets should be set for customer satisfaction issues. With nearly 40% of all visitors being repeat visitors of which 72% having attended both 2004 and 2005 events, a relationship marketing plan must be developed. The website with an email component would aid in this regard. It is essential, according to Moule & Merrilees (2005: 225) that event tourism destinations understand what values they want their brand to deliver to event tourists and ensure that the brand consistently represents those values. A holistic approach should be further adapted to managing the brand and ensure that all business processes consistently convey the values desired for the destinations’ brand. Breedkloof will have to place a greater emphasis on the development of a strong brand image for the destination with clearly identified and projected brand values that resonate with the key-targeted segments. It will have to establish ongoing direct 2-way and networking consumer communication channels and key customer relationship strategies. Positioning and communication must address consumer desires and stimulate an emotional response in tourists rather than blandly presenting the destination’s attractions. South Africa’s key strengths and differentiating features as a destination must be creatively promoted through its positioning and marketing initiatives, events being one component of these. Events can play a critical role in changing the image of a nation. The ultimate goal of marketing is to influence and control the ultimate consumer (Thomas 1995). In this regard, strategic tracking answers five key questions, namely (Thomas, 1995): (i) how is the brand awareness trending over time in comparison to competition? (ii) how is the brand image i.e. the personality of the awareness of the brand evolving over time? (iii) what advertising messages do consumers remember about the brand over time? (iv) how are the competitive activities influencing the brand in the marketplace? (v) what are the demographics of the target market and which segments should be focussed upon? In the context of Breedekloof, it has some way to go given that, at the moment, it only addresses aforementioned question (v). The reasons for this are manifold, but the main issues being limited sponsorships and revenue. The issue here therefore is for the event organisers not to try to do everything, but rather do one thing at a time and do it properly. The initial tracking study would be the first step towards this. The systematic time-based sample procedure was judged the most appropriate sampling technique for the tracking study. Added to this sampling methodology, possible duplications of respondents who were present at more than one research portal, were eliminated using relevant screening questions and by means of contact details (where duplicate names were eliminated once duplicate telephone numbers occurred). Changes to the questionnaire were inevitable because the format of the Festival changed. In the final 2006 survey, new questions were added to the original questionnaire in an attempt to attain as much information as possible for the way forward. It is however noted that the demographic and psychographic variables, as well as the customer satisfaction rating scales, remained unchanged throughout the 3-year tracking period. In all three instances, the same supervisor was used. Although the research team changed completely in 2006, respondents were all trained and fully debriefed before the start of the survey. The same data processing house was used for the duration of the tracking study. As standard procedure, specific processing instructions were recorded and applied. These included for instance the synchronisation of time spent at the Festival as some respondents recorded this question from different bases i.e. nights vs. days spent. When calculating average expenditure of a travelling party, children counted as half and in the case of determining the family life cycle, a code sheet was also used. Concerning the consistency of the research, both researchers were involved since the inception of the study providing for valuable consistency.

In reference to marketing tracking, it is noted by Thomas (1995: 1) that: “… tracking of consumer awareness, perceptions, and behaviour delivers an essential marketing intelligence to help guide marketers through the turbulence and helter-skelter of rapid changes in marketing technology, media and distribution channels.” REFERENCES Ali-Knight, J. (2000). In search of the grape: Towards building a motivational framework for
international wine tourists to Australia. In Evans, N., Cong, P., Robinson, M., Sharpley, R., Swarbrooke, J. Motivations, Behaviour and Tourist Types. Centre for Travel and Tourism (in association with Business Education Publishers Ltd).
Brassington & Pettitt, S. (2003). 3rd ed. Principles of Marketing. Pearson Education, Essex. Breedekloof. (2006). Official website. Available from: http://www.breedekloof.com/index2.htm.
Accessed on: 17 October 2006. Brown, G. & D. Getz. (2005). Linking wine preference to the choice of wine tourism
destinations. Journal of travel research, 43, February: 266-276. Bruwer J. (2003). South African wine routes: some perspectives on the wine tourism industry’s
structural dimensions and wine tourism product. Tourism Management 24, 423-425. Callingham, M. (2004). Marketing Intelligence. How and why organisations use marketing
research. Kogan Page, London. Carlsen, J. & J. Ali-Knight. (2003). Wine festival and regional transformation. Proceedings
from Journeys of Expression II, IFEA Conference. Fountain J & Charters S. (2004) Younger wine tourists: a study of generational differences at
the cellar door. Proceedings of the 2004 International Wine Tourism Conference, Margaret River, Australia: 2-5 May.
Getz, D. & Brown, G. (2006) Critical success factors for wine tourism regions: a demand analysis. Tourism Management, 27: 146-158.
Getz, D. (1991). Assessing the Economic Impact of Festivals and Events. Research Issues. Journal of Applied Economic Research, 16(11), 61-77.
Getz, D. (1997). Event Management and Event Tourism, NY: Cognizant Communications. Getz, D. (1999). Trends, Strategies and Issues in Sport Event Tourism. Sport Marketing
Quarterly, 8(2), 8-13. Griffen, R. W. (1987). Management. 2nd ed. Houghton Mifflin, Boston. Hoffman, K. D. and Bateson, J. E. G. (2002.). Essentials of Services Marketing: Concepts,
strategies and cases. 2nd edition. Harcourt College. Fort Worth. Hu, B. & A. M. Morrison. (2002). Tripography: can destination use patterns enhance
understanding of the VFR market? In Journal of Vacation Marketing, 8 (3): 201-220. Hughes, M. & J. Macbeth. (2005). Can a niche-market captive-wildlife facility place a low
profile region on the tourism map? An example from Western Australia. Tourism Geographies, 7, (4): 424-443.
Jones, T. B. & Sasser (Jr.), W. E. (1995). Why satisfied customers defect. Harvard Business Review. November - December. pp. 88-99.
King C & Morris R. (1998). Wine Tourism: an Australian / New Zealand case study of cellar decision making at small and medium sized wineries. Proceedings of the 1998 ICSB Conference. Accessed on: 2 August 2001. [Available from: www.sbaer.uca.edu/DOCS/98icsb/8002.htm].
Koutras, E. (2006). The use of mobile phones by Generation Y students at two universities in the City of Johannesburg. Pretoria: University of South Africa Unpublished Masters Thesis.
Leonardi, C. (2007). Generation Y creates the Age of Entrepreneurship. In Marketingweb. Accessed on 15 June 2007. [Available from: http://www.marketingweb.co.za/marketingweb/view/marketingweb/en/page73590?oid=74756&sn=Marketingweb%20detail].

Mc Daniel, C. & Gates, R. (1999). Contemporary Marketing Research. 4th ed. South-Western College, Cincinnatti.
O’ Neill M & Charters S. (2000). Service quality at the cellar door: implications for Western Australia’s developing wine tourism industry. Managing service quality 10, (2): 112-122.
SAT& DEAT (South African Tourism and the Department of Environmental Affairs and Tourism). (2002). Towards a National Event Strategy for South Africa- Final Report (October). Pretoria: Octogon South Africa.
South African Reserve Bank. (2007). South African Research Bank Quarterly Bulletin. March. Tassiopoulos, D. (2005). Event Management: a professional & developmental approach
(Second Edition). Cape Town: Juta Pty Ltd. Tassiopoulos, D. Nuntsu, N. & Haydam, N. (2004) Wine tourism in South Africa: a
demographic and psychographic study. In Journal of Wine Research, 15 (1): 51-64. Thomas, J.W. (1995), Strategic Marketing Tracking. Accessed on: 14 June 2007. [Available
from: http://www.decisionanalyst.com/publ_art/track.asp]. Tourism White Paper. (1996). White Paper: development & promotion of tourism in South
Africa. Pretoria: Government of South Africa, Department of Environmental Affairs and Tourism.
Zikmund, W. G. and Babin, B. J. (2007). Exploring Marketing Research. Ninth edition. Mason: Thomson, South-Western.
ACKNOWLEDGEMENTS This research was supported in part by Walter Sisulu University and by Breedekloof Wine & Tourism, South Africa.

1
Fourth International Event Research Conference Re-evaluating the City/Town: Events as a Catalyst for Change
BIG SCREENS: EXPLORING THEIR FUTURE FOR THE SPECIAL EVENT SECTOR
Anne-Marie Hede Centre for Hospitality and Tourism Research
Victoria University [email protected]
Stephen Alomes
Deakin University ABSTRACT The aims of this conceptual paper are to explore how big screens might be deployed in the events sector in the future, explore the issue that may emerge from their diffusion, and propose a research agenda for their study within this context. Research questions driving this analysis were: In what ways is the big screen currently being used at special events? How might big screens be used at special events in the future? What research is required to assist the event sector to take advantage of the big screen? A brief history of the big screen is provided, and a range of possible issues resulting from the diffusion of the big screen in the event sector are posed. These issues include dispersing the main spectacle; increasing access to events; increasing the reach of sponsorship to new audiences; creating a sense of community; cannibalising the market; and crowd safety in public spaces at satellite events. A series of questions posed through the course of this paper provide the impetus for various lines of inquiry on the topic. Keywords: event, big screen, media, conceptual paper
INTRODUCTION After the Second World War, most Western societies experienced a boom in the number of events which were held in their local communities (Alomes, 1985). Many of these events were created as celebrations of community life aimed at creating social capital in, very often, new communities, and others which were in need of rejuvenation. Physical participation, whether this be in a parade, on a stage, as a volunteer, or as a spectator, was a quintessential element of post-war community festivals. The widespread diffusion of television in the 1940s and 1950s, however, was a catalyst for the gradual dissemination of many of these events from the “public space” to the “private space”. The beginnings of this diffusion can be traced back to the opening ceremony for the World Fair in New York in 1939, which was televised, albeit in a limited manner, by the American broadcaster, RCA (Lichentberg, 1938). Such a telecast gave rise to what Dayan & Katz (1992) have termed the ‘media event’. Since 1939, a number of media events, including the Olympic Games, the Coronation of Queen Elizabeth II (1953), the America’s Cup (1986), World Cup Soccer, and the Eve of the New Millennium, have attracted enormous audiences. Rothenbuhler (1988) concluded that the Olympic Games, for example, are mostly enjoyed as social experiences at home. Indeed, in the era of global satellite television relays, the statistics relating to the Sydney 2000 Olympic Games indicated that “nine out of every ten individuals on the planet over the age of four with access to television watched some part of the games” (IOC, 2001). The worldwide television audience (unduplicated) for the Athens 2004 Olympic Games was estimated at 3.9 billion people in Europe, North America, Asia, Oceania and Central and South America

2
(Anon., 2004), which further demonstrates the significance of the media event in contemporary society. There is no doubt that television has impacted many aspects of the event sector, including advertising and sponsorship, accessibility, the experience of event attendance, and their ‘spectacularisation’. In the last two decades social observers have noticed the emergence of large television screens in the public space, often referred to as ‘big screens’. McQuire (2006) noted that big screens provide flexible patterns for the dissemination of information and advertising in the public space, More specifically, however, and of particular relevance to this paper, is that he further noted their use at live events, such as rock concerts and sporting events. Indeed, early evidence of the use of the big screen in this capacity can be traced back to the 1980’s when Queen (the band) used big screens, specifically Sony Jumbotrons, at their concerts at Wembley Stadium. The key reason for using the big screens was to improve the clarity of the visual and audio performance for attendees (particularly for those at the back of the stadium), and, it would seem, to also elaborate upon the performance by delivering different, complementary, images, enhancing the performance to concertgoers. Big screens have been adopted by the event sector around the globe, not only in the confines of stadia but also outside of them. During France 1998, a number of screens relayed the Brazil versus Scotland match in the World Cup Soccer competition, to other locales in Paris, including at the Trocadero and the Place de la Concorde. During the Sydney 2000 Olympics, big screens were placed outside of the Olympic Games stadia, and in public spaces around the city, resulting in what have become known, in the Australian event sector, as ‘live sites’. By 2006 the prevalence of the big screen outside of event stadia increased substantially. During the Melbourne, 2006 Commonwealth Games, big screens were used to relay material from the official broadcaster, including the opening and closing ceremonies and competition, to public spaces in regional destinations...Cities and regions, metropolises and smaller cities, city squares and suburban outdoor malls, parks and sports grounds offered a range of locales, of multiple nuclei, for the big screen showing the big event. Indeed, the World Cup Soccer in 2006 highlighted the potential of using big screens in this context when a parallel event to the sporting event, Fanfest, was staged in 12 German cities. Further, cities around the globe broadcast screenings of the matches in public spaces (for example, in London, Manchester, Sydney, and Melbourne). The big screen has facilitated the development of ‘crowd’ or ‘participatory’ satellite events, or secondary events that run at the same time as the main event. In the New Millennium, television, in the form of the big screen, appears to be once again impacting on the events sector through creating new models of event delivery and participation. The aim of this conceptual paper is to explore how big screens might be employed in the events sector in the future and to propose a research agenda for their study within this context. The paper specifically focuses on their use outside the event stadia and in public spaces, rather than inside event stadia. Research questions driving this analysis are:
• In what ways is the big screen currently being used at special events? • How might big screens be used at special events in the future? • What research is required to assist the event sector to take advantage of the big
screen? There are both theoretical and practical and reasons for undertaking this conceptual exploration of big screens with the context of special events. Academically, McQuire’s work on the big screen suggested a research topic worthy of further investigation. It highlighted the need for the analysis of the role and potential impacts of the big screen within the context of special events. The current study aims to pursue questions suggested by McQuire. From a practical perspective, the questions raised in this in relation to the potential outcomes of the

3
big screen in the context of the event sector should lead to research on the topic that informs the event sector as to how to capitalise on the big screen and live sites for the sector’s sustainability and development. The paper proceeds with a brief history of the big screen to demonstrate how they have emerged within the event sector. Second, a range of potential issues for the event sector that might result from the diffusion of the big screen is suggested. Research questions are then posed in relation to each of these issues. Finally, a summary is provided that concludes this discussion, including consideration of the ways in which the increased use of the big screen may be detrimental to the event sector. Recommendations are then made as to the research required on big screens to prepare the event sector for their continuing diffusion in the sector. THE BIG SCREEN – A BRIEF HISTORY The pre-history of the big screen is a long one, paradoxically over a century old. It begins with the emergence of cinema in the late 19th century and early twentieth century, building on traditions of elaborate theatres and large scene backdrops in the culture of the live stage. Cinema evolved, into the silent era, through a larger social and cultural experience than the screen itself, one suggested by the grandeur of the 19th century theatres and their elaboration in the fantasy picture palaces of the 1920s. In the creation of grand story on the screen, Australia was a forgotten pioneer in the making of film for cinema when it created the first ever feature film, The Story of the Kelly Gang in 1906, as well as becoming one of the biggest film markets per head of population in the world (Collins, 1987). The role of the open air big screen itself followed the rise of cinema. The first outdoor cinemas came early in the twentieth century, as at the Sun Picture Theatre of 1916 in tropical Broome in the north of Western Australia, with its ‘grand’ corrugated iron front façade, entry area and shade sheltered as well as projection area and with most seats in the open, constructed to seat up to 500. It still exists today and has daytime showings (shaded areas only) and night showings. The development of the cinema (including sound, colour, Cinemascope, Panavision) and drive-ins (venues where cars were parked to view film on large permanent screens) in the 1950s, however, put the big screen on a larger map, especially in the suburban areas of spacious ‘New World’ cities in Australia, New Zealand and the USA. If the Sun Picture Theatre contrasted with the fantasy-rich environments of the picture palaces which rose to a height in the 1920s, the ‘big screen’ after World War Two reflected the rise of an automobile democracy or at least a consumer society in the era of suburbanisation, the post-war baby boom and the spread of the ‘family’ car. The prevalence of the big screen reflected the rise of the suburban, private life linked by cars and mass media (radio, television, newspapers) and the decline of the idea of community and of the centrality of the city, even in Western nations without the USA’s specific problems of class and race. At this time, from the 1950s, the term ‘big screen’ acquired its first meaning, as film rather than the ‘small screen’ of television. The expansion of billboard advertising, in cities and in the country, provides a parallel with moving images. It has grown from small posters to larger posters on railways stations, by highways, and on buildings, and by the late 20th century, to enormous images on buildings in New York, Hong Kong and elsewhere, also provided a visual context for the idea of large images. We now live in the era of the ‘Jumbo’ mirrored by the miniature, in several spheres. The emergence of the big screen from the late 1970s itself has been paralleled by new miniaturised and domestic visual technologies, including video recorders, computer images and digital imagery, wide screen and plasma television, home theatres and interactive image screens in cities and shopping malls. For example in Tokyo, when commuters walk out of one exit of the Shibuya train station, they are immediately in view of three big screens. As they enter nearby stores, they receive information on smaller screens, including, news, weather and

4
sports, practical information and advertising. The ultimate miniature screen appears to be the personal, portable screen - the mobile phone and the MP4 player. The technology associated with big screens and their diffusion at first developed slowly. The 35 mm projection of the drive-in gave way to some early video matrix screens which were effectively monocolour, even with a degree of tint inserted (i.e., slightly brown and yellow rather than merely black and white). In the mid 1980s the “JumboTron”, produced by Sony, pioneered Cathode Ray Tubes (‘CRTs’); at times the term ‘Jumbotron’, with its connotations of elephant size (c.f., ‘Jumbo 747 planes), became a generic popular term for big screens. Other technologies also appeared including Light Emitting Diodes (‘LEDs’). In image fidelity the big screens provided increased numbers of pixels and moved into high definition imagery. In size they also increased from around 10 metre diagonal screens to the "Godzillatron", the Daktronics Prostar scoreboard at the University of Texas at Austin’s stadium, measuring around 25 square metres with high quality definition. The largest big screen is reportedly now at the Fuchu racecourse big screen which uses Mitsubishi’s Aurora Vision LED technology and is measured at 11.2 x 66.4 metres or 37 x 218 feet, or similar in size to three tennis courts (Anon., 2006). The portability of big screens has improved their diffusion enabling their use at venues besides stadia (e.g., public spaces such as parks, plazas and outdoor malls). Furthermore, their declining cost, the development of leasing and event companies, and the role of government in the delivery of events, all contribute to the potential of the big screen to produce social and cultural impacts. ISSUES FOR CONSIDERATION The aim of this paper is to propose a way forward for future research on the big screen within the context of the event sector. In this section, the authors propose a range of positive and negative results following from the diffusion of the big screen in the event sector, and pose related research questions. DISPERSING THE MAIN SPECTACLE The demand for tickets to mega-events is often greater than the number available. Even aside from continued population growth, all stadia have limited seating capacities. The big screen can provide a focus for spaces outside event stadia to accommodate people who cannot be accommodated in the stadia. In the case of the 2006 Commonwealth Games, big screens were used in the host city and in regional destinations to broadcast the sporting events. The screens also acted as a focal point for community events which were staged parallel to the athletic competitions, creating “live sites”. They also extended the theatrical audience experience of sport, encouraging active spectator support for the national team and for individual competitors. Indeed, the opening ceremony for the 2006 Commonwealth Games was produced and designed to consider the three audiences: the television audience, the live audiences in the stadium and a live audience outside the stadium, which was situated at nearby “live sites”. Similarly, the big screens at 2006 World Cup parallel festival, ‘FanFest’ provided a focal point for spectators, reportedly up to 50,000, watching the televised soccer matches in 12 different German cities. Research questions arising from this issue for consideration include: what is the nature of the experience of attendance at these satellite events? Is the experience of attendance at a satellite event different from the in-stadium experience? If so, how is it different? Do tourism strategies need to be modified to take the big screen event into consideration? How might the big screen event impact event tourism? INMPROVING ACCESS TO EVENTS Participation in many events is only accessible to elite members of society (for example, elite sports people, dignitaries, and others with higher socio-economic profiles). Ticket prices for many events are prohibitive. For example, tickets to the Olympic Games or the World Cup (and particularly to opening and closing ceremonies) are exorbitant and priced out of the

5
reach of many members of society. The positioning of big screens in public spaces, such as piazzas and squares, means that people who would otherwise not have access to events can access them if they so choose. To some extent, the big screen has the potential to democratise events. This can assist in implementing the social policy ideal of wider access and diffusion often now associated with events. Research questions arising from this issue include: What are consumer perceptions of the big screen event? Does access to the big screen events make community members feel that they are part of the main event? Do they feel that the mega-event has been democratised? IMPROVING THE REACH OF SPONSORSHIP TO NEW AUDIENCES Very few events are delivered without the support of stakeholders and partner organisations, or their sponsors- whether from the public or private sectors. Sponsors of events communicate with event attendees; in the case of events that are broadcast, sponsors also communicate with television audiences. The big screen event is a new vehicle for marketing communications and provides opportunities to communicate with new or different target markets, such as people who would otherwise not have attended the main event. There is often a strong commercial presence at large events—sponsors, advertisers, and food and drink outlets in some places—hence, it is arguable that these new public spaces transcend the contemporary era of retailing in city shops and suburban malls and its more ordered, controlled and packaged and private experience. As fairs and festivals, past and present, provide a range of experiences for participants and opportunities for performers, community and commercial organisations, live sites may offer new opportunities for individual and communal experiences and for commercial and community outlets. They also can link past and present as when Berlin’s big screen for ‘Fanfest’ was located at the city’s most iconic historical site, the Brandenburg Gate. Research questions arising from this issue include: how can stakeholders and partner organisations, or their sponsors take advantage of the opportunities that arise from the big screen event? Is it worthwhile for event managers and marketers to develop different models of sponsorship to include both the big screen event and the main event? If so, how might these models of sponsorship look? CREATING A SENSE OF COMMUNITY In the era of the global village – of improving global communications and of rising populations in urban spaces – the big screen has potential to support the local and offers links with the national and the global. On the micro level, the big screen most often broadcasts what is happening at the main event (i.e. in the stadium). It can connect attendees in the main stadium with attendees at the big screen event. Further, attendees at the back of the big screen event can become physically connected through the use of visual imagery with the rest of the big screen audience. On a macro level, the big screen event may be connected to an event on the other side of the globe (take, for example, the screenings of the 2006 World Cup matches in Germany which were broadcast at big screen sites around the world, including in Australia or New Zealand). The big screen therefore might have the potential to develop a sense of ‘communitas’ (Turner & Turner, 1978) among its audiences, be these local, national or global. The big screen event parallels or contributes to a return to gatherings in public spaces. Ancient and traditional gatherings for politics, talk and markets in the ‘agora’ (Greece), the market square or area (Europe, Asia, Africa) and the village common and later the urban public square (Britain) have returned. Research questions arising from this issue include: Does the big screen enhance the experience of attendance and create communitas? If so, are there differences in the extent that communitas is developed when big screen events are local, national or global? If so, how and why do these differences occur? Or, alternatively, will crowd pressures for access to events, crowd control concerns and profit, lead increasingly to ticketed only access to off-site events before the big screens in cities, towns and suburbs?

6
CANNIBALISING THE MARKET The potential impacts of the big screen on the events sector may not always be positive. For example, the use of the big screen in public spaces might mean that markets for the event sector are cannibalised. This may be a function of the democratisation of events and the increased accessibility to events that the big screen offers consumers, who may not otherwise have the resources to attend paid events. The risk that the events sector is faced with when an alternative event (free and in the public space) is on offer is that potential consumers of the main event may decide not to attend the main event, but to attend the big screen event, which is invariably free and in the public space. Thus the marketing, including the product on offer and communications about it, needs to somehow distinguish it from the big screen event that is aligned to it. This is extremely important when the big screen event is held in the same destination as the main event. If the marketing of the main event is not compelling, and there is a free big screen event, the market for the main event might be cannibalised. Research questions arising from this issue include: how can the main event retain its market when a big screen event might provide comparable experiences for attendees? What are the attributes of the main event that can distinguish it from the big screen event? CROWD SAFETY IN PUBLIC SPACES AT SATELLITE EVENTS The big screen event is able to attract crowds into public spaces. As such, they have the potential to induce problems associated with crowd safety. The fear of the crowd has existed in most societies and has been written about by the eminent historian George Rudé regarding the French Revolution and in studies of the crowd in South Asia. The uncontrolled large crowd can have a political impact – as reflected in the street battles, and in some places bans on public marches and demonstrations in the Sixties – and through other forms, including individual or group bad behaviour due to alcohol, and perhaps also through overcrowding and raised, usually sporting passion. Conservatives have associated spaces for large public gatherings with the danger or riot, rebellion and even revolution, a fear in milder form that delayed the creation of Melbourne’s civic square in the 1970s. A more common fear, given recent histories of soccer violence, sometimes fuelled by alcohol, sometimes by national and ethnic rivalries (or simply emotional excess) is more everyday, random violence. In Moscow in June 2002, after Japan defeated Russia in the World Cup, and a 17-year old boy was stabbed to death and 100 people were injured as drunken fans went on the rampage, in Manzeh Square, Moscow authorities debated not showing future matches; they decided to increase policing and to limit alcohol sales instead (ESPN, 2002). In Britain, during the 2006 World Cup, Manchester ceased screenings, due to similar problems, and allowed access to one screen on a ticket only basis (BBC News, 2006). Research questions arising from this issue include: How can big screen events be managed to minimise the negative impacts they may cause resulting from crowding in public spaces? This research also links with other research into crowds in limited spaces, celebrations and alcohol. CONCLUSION The aim of this conceptual paper was to explore (1) the social and cultural phenomenon of the big screen event as a festive gathering and (2) how big screens might be employed in the events sector in the future and to propose a research agenda for their study within this context. The paper focussed on the use of the big screen in the public space, with particular reference to sporting events. It might be noted that it can also provide a visual, community and spectator vehicle for other public events, including the arts and even public debate. While this study was exploratory, it identified a number of issues that the big screen can potentially create which the event sector should be cognisant of when delivering events. This paper has highlighted the importance of undertaking research on this topic, and the questions posed through the course of this paper provide the impetus for various lines of inquiry. The big

7
screen has already begun to impact on the ways in which events can be delivered, yet there is very little information about them from an academic or practical perspective. Thus, a series of connected research projects would be useful in elucidating the impacts and potential uses of the big screen in this context. It would be useful to collect data from the event sector in the first instance to establish priorities. The information derived from undertaking the proposed research will inform the event sector and assist event managers to develop strategies which enable them to deploy effectively the big screen in this context. In this way, the sustainability of this burgeoning, and increasingly important, industry will be enhanced. REFERENCES Alomes, S. (1985). Parades of meaning: the Moomba Festival and contemporary culture.
Journal of Australian Studies, Number 17(November), 3-17. Anon. (2004). Global TV viewing of Athens Olympic Games breaks records. Retrieved 18
October 2004, 2004, from http://www.olympic.org/uk/news/olympic_news/full_story_uk.asp.asp?id=1117
Anon. (2006). Giant big screen constructed at Tokyo horse track. Retrieved 1st February, 2007, from http://www.pinktentacle.com/2006/07/giant-video-screen-constructed-at-tokyo-area-horse-track/
BBC News. (2006). Mozart opera shown on big screen. Retrieved 1 February, 2007, from http://news.bbc.co.uk/1/hi/england/manchester/5103076.stm
Dayan, D., & Katz, E. (1992). Media Events: The Live Broadcasting of History. Cambridge, MA.: Harvard University Press.
ESPN. (2002). Moscow mayor backs big screen. Retrieved 1 February, 2007, from http://worldcup.espnsoccernet.com/story
IOC. (2001). At a glance: Olympic Marketing Research. Marketing Matters: The Olympic Marketing Newsletter, May 2001.
Lichentberg, B. (1938). Business backs New York Trade Fair to meet the new deal propaganda. The Public Opinion Quarterly, 2(2 April), 314-320.
McQuire, S. (2006). The politics of public space in the media city. Retrieved February, Special Issue #4: Urban Screens: Discovering the potential of outdoor screens for urban society, from http://firstmonday.org/issues/special11_2/mcquire/index.html
Rothenbuhler, E. W. (1988). The living room celebration of the Olympic Games. Journal of Communication, 36, 61 - 81.
Turner, V., & Turner, E. (1978). Image and pilgrimage in Christian culture; anthropological perspectives Oxford: Blackwell.

Fourth International Event Research Conference Re-evaluating the City/Town: Events as a Catalyst for Change
COMMUNICATING WITH RESIDENTS OF HOST DESTINATIONS: AN EXPLORATORY STUDY OF A DISPERSED MEGA-EVENT
Pamm Kellett and Anne-Marie Hede
Bowater School of Management and Marketing Deakin University
Laurence Chalip Sport Management Program
University of Texas at Austin
ABSTRACT In 2006, the Commonwealth Games were hosted by the State of Victoria, Australia. This study examined the efficacy of the communication channels that were used to disseminate information to residents in three regions across Victoria about the community events that were associated with the 2006 Commonwealth Games (Games, hereafter). It also explored residents’ preferred communication channels regarding community events in each of the regions. The Games were a “dispersed mega-event”. That is, while they were largely staged in the City of Melbourne, parts of them were dispersed to other areas of the State of Victoria. While this is a newer model of event delivery, it is one that has been taken up quite well in the context of mega-events. The dispersed mega-event, however, raises challenges for event organisers and marketers including how to communicate with larger and more diverse communities than what might be the case of a single-location event. Focus groups were conducted with residents in three host destinations. Results suggested that traditional methods of disseminating event information were ineffective. Participants in this study reported a preference for (passively) receiving information about events in their respective communities through existing infrastructure and social networks. They reported a desire to receive information in places that are sympathetic with their lifestyles—such as at sport clubs, on public transport, at schools and childcare facilities, and at supermarkets. However, there were differences in the perceived efficacy of some of these methods among the destinations. Implications for practitioners are discussed, as well as implications for further research.
Keywords: mega-event, dispersed, marketing, Commonwealth Games
INTRODUCTION Special events, including mega-events, have a range of social outcomes for the residents of their host destinations. These can be positive (e.g., generating patriotism (Waitt, 2003) and negative (e.g., housing evictions (Olds, 1998); increased levels of crime in host destinations (Barker, Page, & Meyer, 2002)). As such, there is increasing recognition by governments around the globe, that special events have the potential to mobilise social policy within host communities (Chalip, 2006). The analysis of “mobilisation strategies” through leverage analysis, is however nascent, and gaps in knowledge about this aspect of event management remain. In leverage analysis, the event outcomes themselves are not important in-and-of themselves (as they are in impact research), but are instead pertinent to the degree it provides information about which particular implementation strategies and tactics have been effective.

McCartney (2006) argued that that in order for mega-events to generate positive benefits for the residents of their host destinations, residents need to actively participate in them. This is a challenge; the 20th century has seen the rise of the mega-event as a spectacle for gazing upon. Rothenbuhler (1988) noted that the Olympic Games, for example, are mostly enjoyed as social experiences, many of which are enjoyed in, what has become the centre of the home, the lounge room – almost always equipped with a television upon which to gaze. Indeed, audiences of the telecasts of the Olympic Games, for example, have steadily increased since television was first launched in the late 1930’s, and have particularly grown in the past decade (Chalip, Green, & Hill, 2003). In the case of the Sydney 2000 Olympic Games, for example, ‘nine out of every ten individuals on the planet over the age of four with access to television watched some part of the Games’ (IOC, 2001). Hence, participation in events, particularly mega-events, has most often become passive rather than active, and live. Various models of consumer behaviour highlight the need to create awareness of products or services on offer before consumption can eventuate. Smith (2006) noted that multiple channels are available to event organisers for the distribution of information about events, including print and broadcast media, direct mail, internet, travel providers, and word-of-mouth. If inappropriate channels are employed for the dissemination of information about events, it makes sense that less than ideal levels of awareness, and resulting participation, may result. Accordingly, participation in events will likely be less than ideal. The use, and the role, of marketing communications in enhancing residents’ awareness of events is, therefore, paramount in leveraging the social outcomes of events for residents of host destinations. Research questions driving this study were: How can event managers and marketers communicate with residents of host destinations to promote participation in mega-events? Do residents need to be communicated with differently than what is currently the case to promote participation in mega-events? These research questions are explored within the context of 2006 Commonwealth Games (Games), which were hosted by the State of Victoria, Australia. The paper has two key aims. First, the paper aims to examine the efficacy of the distribution channels that were used to disseminate information to residents about the community events that were associated with the Games. Second, the paper aims to identify residents’ preferred methods of communication regarding community events so that their participation in future mega-events is enhanced. The study compliments an existing line of inquiry that has been useful in understanding the types of information that are used by event attendees when they make decisions to attend events, and how frequently that information is used. Previous research in this area has shed light on the ways in which event-related information is distributed to event tourists (Hall, O'Sullivan, & O'Sullivan, 2003; Pearce, Tan, & Schott, 2004; Shanka & Taylor, 2004; Smith, 2006), and to residents of host destinations (Gitelson and Kerstetter, 2000). Previous studies have noted the utility of traditional methods of communication for event tourists (Pearce et al., 2004; Smith, 2006), such as print and broadcast media and the internet.. Gitelson and Kerstetter (2000), for example, found that 70% of residents of one host destination relied on personal experience to guide their decision-making regarding event attendance. Smith (2006) found that the Internet is not readily used for decision-making in relation to event attendance. Despite these contributions to knowledge, little information has been gained as to why different sources of information are used by event attendees. Moreover, little information has been gained about event attendees who are also residents of the host destination. This study specifically focuses on residents of a host destination. It was thought that an investigation wth this focus would inform event managers and marketers as to how they can effectively inform host destination residents about events in their local communities.

Furthermore, the 2006 Commonwealth Games were a “dispersed mega-event”. That is, while the Games were largely staged in the City of Melbourne, parts of them were dispersed to other areas of the State of Victoria. This is a newer model of event delivery and one which appears to have been readily adopted within the context of mega-events (see, for example, the 2006 World Cup Soccer and Fanfest which was delivered in 12 German destinations). This model of event delivery has potential to address some of the challenges associated with large-scale events, such as crowding and limitations of stadia capacity. The dispersed mega-event, however, raises other challenges for event organisers and marketers, including how to communicate with larger and more diverse communities than what might be the case of a single-location event. Very little research has been undertaken on the dispersed mega-event. Thus, this study initiates a new line of inquiry in event research. The paper continues by providing some background to the Games was the basis of the case study analysis. The method employed for this study is then described, the results and a discussion of them presented, and conclusions are then made based on the information that was gained from this study. Recommendations are made for further research on this topic. Limitations of the study are also acknowledged. THE 2006 COMMONWEALTH GAMES The Commonwealth Games are staged every four years in British Commonwealth destinations. The Victorian State Government secured the 2006 Commonwealth Games in 1999 through a bid process, and in 2002, established:
• the Office of Commonwealth Games Coordination (OCGC) to manage all bodies relating to the Games,
• M2006 as the organisation to deliver the Games.
While M2006 was focussed on event logistics, the OCGC’s role focused on policy development and its implementation (OCGC, 2006). The OCGC’s policy agenda was aimed at ensuring that all Victorians, not only Melbournians, were provided with opportunities to participate in the Games. As such much of the program was hosted by the City of Melbourne (the Central Business District (CBD) municipality), however, some of the program (athletic and non-athletic) was hosted in regional Victoria, including Bendigo, Ballarat and Geelong. The Games were held in March 2006. Equal First was the over-arching social policy developed by the OCGC for the purpose of enhancing participation in the community events associated with the Games, particularly of Victorian communities, and beyond into Commonwealth countries. The policy documentation stated that the Games would be “…remembered as a celebration of diversity within Victorian communities and across the Commonwealth. People of all cultures, ages and abilities will feel welcome to attend Games events and participate in related activities” (OCGC, 2004a, p.2). The policy document included five key themes: communicating for diversity; accessible events; inclusive employment, training and volunteering opportunities; connecting and celebrating our cultures; and active and inclusive communities. As such, the Victorian State Government used the Games as an impetus to develop and implement social policies related to community social engagement, accessibility, and inclusion, not only for the City of Melbourne, but also for local communities throughout the State of Victoria (Kellett, Hede, & Chalip, 2006). One of the unique features of the Games was that events were delivered in regional areas, as well as in the City of Melbourne, to encourage State-wide participation in the Games and its related activities. Importantly, festival-like events were staged in each of the regional areas, delivered by the local

municipalities under the auspice of Equal First, to leverage the social outcomes of the Games. This study focuses specifically on these events, rather then the athletic competitions.
METHOD The aims of this paper were to examine how effective the deployed communication channels were at disseminating information to residents about the community events associated with the Games; and to identify residents’ preferred methods of communication regarding community events. Given the exploratory nature of this topic, a qualitative approach was adopted. Information is provided about the research setting and the data collection methods used for this study. RESEARCH SETTING Three Victorian regions were examined in this study, namely City of Port Phillip (CPP), the City of Greater Geelong (CGG) and the City of Greater Bendigo (CGB). These three regions were chosen as they represented a cross-section of Victorian regions that hosted both official athletic events and non-athletic events (i.e. community events). A brief socio-demographic profile of each of the regions is provided. The CPP is an inner metropolitan city located on Port Phillip Bay, within five kilometres of Melbourne’s CBD, covering approximately 20.6 square kilometres. Almost three-quarters of the residents live in units/apartments or semi-detached dwellings; and almost half of the residents live alone (City of Port Phillip, 2003). Nearly half of the one person householders are aged between 25 and 44 years. Due to its inner city location and availability of public transport options, almost 30% of the residents travel to work by public transport, although 67% of households have a motor vehicle (City of Port Phillip, 2003 p. 58). The CPP is one of the most active metropolitan destinations for events in the State of Victoria outside the City of Melbourne. The CPP is host to the Australian Grand Prix, and a variety of cultural, art, and sporting events throughout the year. During the 2006 Commonwealth Games, the CPP hosted the triathlon event, and was part of the route for the road cycling and marathon events. The CPP also hosted a range of community events during the Commonwealth Games that were unique to the region including sand sculpting, beach markets and—all centred around a big screen “LiveSite”. The CGG is located on Port Phillip Bay approximately 70kms west of Melbourne’s CBD, covering an area of 1250 square kilometres. The majority (76%) of the residents live in separate houses (as opposed to units or apartments). Nearly half of the residents are couples with children (Commonwealth of Australia, 2002). The CGG, a provincial destination, is developing its events profile as it is securing number international events to expand its event portfolio. During the Games, the CGG hosted the basketball heats. The CGG also hosted a LiveSite and associated event and festival activities during the Games including theatre performances, music and live acts. The CGB is an inland regional city located approximately 150kms North West of Melbourne’s CBD covering almost 3000 square kilometres. The majority (87%) of the residents live in separate houses, and 45% of the residents are couples with children. Further, 91% of households in CGB have at least one car (id, 2007). The CGB hosts a variety of festivals and events throughout the calendar year. The CGB is hosts a number of events which are targeted to appeal regional constituents. During the 2006 Commonwealth Games, the CGB hosted shooting events, and some basketball heats. The CGB also hosted a LiveSite and associated unique festival activities including an art exhibition of local artists work. DATA COLLECTION METHODS

Focus groups were conducted in each of the research sites during November 2006. The focus groups consisted of 8 or 10 participants. Event attendance was not a criterion for participation in the focus groups, but half of the participants in each focus group had attended specific Commonwealth Games related events in their community. The sampling frame was designed to ensure that the gender, age and socio-demographic profiles of the focus groups were similar to that of their respective municipalities. A standardised interview protocol was used to ensure comparability between each of the focus groups. The focus groups were divided into two parts. In the first part, participants were shown a series of official marketing collateral about the community events that was distributed in their respective municipalities in the lead up to and during the Games. The marketing collateral, which included flyers, programs of events and activities, brochures, and letterbox drop postcards and collected by the researchers before and during the Games, were used to prompt participants given that the focus groups were undertaken six months out from the event. Participants were then asked to describe how they obtained information about community events associated with the Games when they were held in their local communities earlier in that year. For the second part of the focus group, participants were asked to assume that they were part of the local council which was planning to stage community events and activities in their local region associated with a large-scale event that attracts international media attention. The marketing collateral for the forthcoming 2007 12th FINA World Championships was distributed to the focus group participants to prompt them to consider the material and devise a strategy for their preferred methods of the dissemination of information about the event in their region. It was suggested to participants that the 12th FINA World Championships would be a dispersed event, similar to the Games. All focus groups were digitally recorded and transcribed verbatim. Co-authors used NVivo software to organise the data into initial coding categories and codes were revised until saturation eventuated (Lincoln & Guba, 1985; Strauss, 1987). Coding categories were verified using the check-coding process (Miles & Huberman, 1994) between the researchers. RESULTS AND DISCUSSION The data highlighted the efficacy of the methods that were employed to disseminate information to local residents about the community events associated with the Games. It also shed light on the ways in which residents prefer to gain information about events that might be staged in their local communities. The efficacy of traditional communication methods It seems that a traditional portfolio of communication methods, which was used to disseminate information (e.g., flyers, programs of events and activities, local newspaper advertising, brochures, and letterbox drops, postcards) across the regions, was not very effective in reaching those residents that participated in the focus groups. The key reason for these methods not being successful was because the approach did not accommodate the differences in the regions with regard to their socio-demographic and lifestyle profiles. For example in the CPP, where there is a large proportion of residents who live alone in apartments and semi-detached housing, the focus group discussion indicated the local newspaper was ineffective in reaching participants. For example, one participant noted that even if the local newspaper did include information about the Games, she would not have received it because of the type of dwelling in which she lives. She stated “…Normally I would never know [about community events] because we don’t get the local paper delivered to our apartment building”. The local newspaper is not delivered to individual units in large apartment blocks in

the CPP. In many instances the newspapers are not collected by residents, but left as litter in the mailbox areas. In contrast, in both the CGB and the CGG, where the majority of residents live in detached houses, local newspapers were seen as an important source of information regarding events in the community. For example, one participant from CGB said “…I’ve seen in the paper loads of times [information about community events]… there is a lot of that”. A participant from CGG had a similar perspective “…I just use the local paper and see what is on in there”. Focus group participants from the CGG and the CGB indicated that the local newspaper was central to increasing their awareness of events to be held in their communities. In regional areas such as CGB and CGG, it is likely that there is a greater reliance on local newspapers, as there are fewer alternatives in which to disseminate information about the local community and local events. Another traditional source of information that is often used by event organisers for dissemination of information is radio. Participants in CPP did not mention that they sourced information about the event via the radio. This is perhaps not surprising given that while there is community radio in Melbourne, it services the entire Melbourne community (nearing 4 million in population) and has a geographic reach of the entire metropolitan area. In contrast, focus group participants in the CGB and the CGG reported a reliance on local radio stations for information about events in their communities. For example, one participant from CGG stated “the [local radio station] is very good. If you listen to the radio for an hour, you hear something”. The CGB and the CGG each have their own community radio stations which are dedicated to providing a comprehensive coverage of news and events that are tailored to their respective communities and the needs of their residents, unlike in the CPP. It is perhaps more difficult to effectively tailor and deliver community information to residents in a metropolitan municipality (such as the CPP) in the context of a large city. However, in the context of the Games, the CPP delivered brochures via letter box drops to its residents. Participants of this study from the CPP indicated that the collateral that was generated by the local council was not congruent with their planning timeframes. Further, they felt that that the information in the collateral was ill-timed in relation to the staging of the Games. One CPP focus group participant explained: “I think the council actually sent out beforehand, a leaflet… all to do with road closures [around the event] and so on. It is too much information at that time…”. Another participant described her experience of receiving CPP community event promotional material for the Games: “I remember getting information and going ‘I can’t even look at that’. Participants evidently experienced a feeling of being overloaded with information that arrived in their letter boxes, rather than (as the council had most likely intended) a feeling of being informed of community events. Prior to and during the Games, each of the three municipalities provided information about the activities that they would be hosting during the Games. The CGB and the CGG participants did not mention that they accessed information about the Games-related events in their communities, or events in general. While the CPP Council provides a detailed calendar of events for the community on its website, participants in that focus group indicated that they did not think of it as an appropriate distribution channel for event-related information. One participant explained “…We all know that this website [council website] exists… I wouldn’t look at the website unless I needed to find out a phone number”. Other members of the focus group agreed with this comment. Hence, the CPP’s web-based information seems to have had limited use for participants of this focus group. Residents preferred methods of event communication In the second part of the focus group discussions, participants were asked to indicate how they would prefer to gain information about events that might be hosted in their local communities.

The analysis of the focus group data indicated that participants in all three regions prefer to be passive (i.e. information-receiving) rather than active (i.e. information-seeking) in terms of how they gain information about events in their local communities. Noticeably, participants in each of the three focus groups agreed that they wanted to receive information about events during the course of their normal routines. Participants identified that marketers of events could better use the existing infrastructure in their municipalities than what is currently the case. Furthermore, participants did not want to be inundated with detailed information about events in advance. One participant noted “they [the council] don’t need to give you a big blurb--they could just say “between such and such, the following events are on…”. Yet, the analysis of the data highlighted that there were differences between the regions as to how their access to event-related information might be operationalised. For example, in the CPP focus group participants indicated that they would prefer to access information about events while travelling on public transport (e.g. posters), that is, in their daily routines. One participant said “You know, the old trams used to have a notice board of some sort on them. Perhaps only the trams that run through the local area might have a notice board that could be utilised [to advertise local events]”. Another CPP participant suggested that she would prefer to receive information from her local council with her rates notices (which are distributed quarterly). She explained “when you receive your rates, you could receive a “what’s on” in the next three or four months. I mean they’ve got to organise it in advance…”. Another resident from CPP said that he would like to receive event-related information from the building management groups (such as body corporates, leasing and rental agencies) for the apartment building in which he lived. This was looked upon favourably by other participants of the focus groups: “…That [body corporate notice board] sounds like a great idea. We don’t’ have anything like that”. Given the high proportion of residents who are not rate payers, but tenants in the CPP, this strategy would seem to be an effective means of communicating with a large number of residents in the municipality. Similarly, the CGB and CGG focus group participants also suggested that existing community infrastructure could be utilised that would enable them to receive event-related information, rather than have them seek information out. For example, one participant from the CGG explained how existing in-store radio could be used to reach residents: “What about in the supermarkets? You know how they have they radio going and they are always telling you about how red hot [the supermarket chain] is? Everyone goes to the supermarket at least once a week…it should be on their in-store radio”. One participant from the CGB mentioned that noticeboards at supermarkets could be utilised more effectively. Participants from both regions mentioned using school newsletters to inform families about upcoming events, and noticeboards at child care centres and sport clubs and venues where their children attended. It was thought that if information were made available at these venues, residents would ultimately have more knowledge about events in their communities. The focus group data from the CGG and CGB highlighted the ways in which residents could effectively be reached during their routine activities—such as shopping and taking children to activities. Underpinning their desire to be alerted to information at these locations was also the recognition that they could be reached through the people within their local interest groups. Participants in both CGG and CGB noted that word-of-mouth could be more effectively used to inform them of upcoming events. For example, one participant from the CGG identified mothers as an important group within the community that assist to dissemination about events. For example she said “I think word-of-mouth [is important] because I hear about most of the things through other mums”. Another participant noted that she often finds out about events through her children. She explained “You hear about [events] at the kids’ schools”. Another participant noted that he finds out about activities through word-of-mouth at other events.

Focus group participants in the CGB perceived local swimming pools and swimming clubs to be a central focus if promotions were to be effective in reaching them (acknowledged this may be a function of the event which was used to probe participants). One participant explained “you could incorporate it [event information about a swimming championship such as FINA] with the swimming clubs in Bendigo”. Focus group participants in CGB were also mindful that different community groups might have different needs from an aquatic event. One participant explained “maybe we could look at, instead of trying to get everyone to one function [like one swimming event] we need to split it up into smaller groups…like elderly, 0-5 year olds, families with kids from 0 – 15 years old”. Discussion continued amongst the group to identify different swimming themed events that could be held in the community that could be promoted to the various target markets that the group had identified. Participants concluded this discussion by agreeing that to reach the various user-groups effectively a variety of existing community networks would need to be employed. CONCLUSION Research questions driving this study were: How can event managers and marketers communicate with residents of host destinations to promote participation in mega-events? Do residents need to be communicated with differently than what is currently the case to promote participation in mega-events? The overall objective of this study was to gain information as to how the social outcomes of mega-events can be leveraged for the residents of their host destinations through increased participation. This study focussed on the methods employed for the dissemination of information related to a dispersed mega-event, as it was thought that this was a key factor in raising awareness of the event and thus community participation in the event. While analysis of a mega-event has inherent case study limitations and the focus group technique does not generate data that is generalisabile, the information derived from this study is elucidatory and gives rise to the need for further research on the topic. There are three major findings from this study. First, the dispersed mega-event provides a challenge for event organisers in terms of coordination and control, particularly in reference to branding and the communication of event-related information. Centralised budgets and marketing strategies often require that marketing collateral is generated via “official” mega-event staffed headquarters. While centralised marketing communication strategies might be useful in distributing their cost across a large region, their use is unable to adequately account for, and respond to, diversity – which event organisers needed to better acknowledge to enhance the effectiveness of event-related information and thus event participation. The study highlighted the need to accommodate the socio-demographic differences between the main and satellite host destinations, even when a central marketing communication strategy is adopted. A dispersed mega-event such, as the Games or potentially the 12th FINA World Championships, requires that event promotions and advertising material is standardised across regions, yet that it be customised for participating satellite regions. Importantly, if this study had of included more than three municipalities, even further diversity would have likely been identified, thus accentuating the importance of this conclusion. Second, this study highlighted that residents within the host satellite destinations prefer to receive information about events passively. They indicated their preference to information-receiving rather than information-seeking behaviours are information. Participants in this study were critical of current methods of communication used by event organisers (including print and broadcast media and broadcast, and the Internet, which is generally viewed as a valuable source of information dissemination for event organisers in the past). They demonstrated a preference for being contacted in more efficient ways and more succinctly (to reduce “information overload” and clutter) than they currently perceive to be the case. In all three regions the research participants noted that they would be more conducive to event advertising and attendance if they are exposed to event information at a time, and in a place, that is congruent

with their lifestyles. The qualitative methods used in this study elucidate some important considerations that implicate the use of much more creative (and in some cases perhaps more cost efficient) methods of communication with local residents where they can passively access information. Finally, participants of this study noted the under-utilisation of existing community infrastructure (e.g. sport clubs, schools, public transport, notice boards in their apartment buildings, notices received with council rates, and supermarkets) and social networks. From a practical perspective, this implicates the necessity for partnerships between event organisers, community groups, and community organisations—which is consistent with many of the recently developed social policy outcomes established by event organisers (Chalip, 2006; Kellett et al., 2006). The current study suggests that engaging residents is a task that requires local knowledge and understanding of target markets—so that communication regarding events in communities can reach target markets in the most efficient manner possible for both residents and event organisers. FURTHER RESEARCH The dispersed mega-event is one that appears to be gaining support from the public and private sectors. Yet, little is known about the management, marketing and outcomes of such an event, particularly with regard to the ways in which their benefits can be leveraged for the residents of their host destinations. It is timely that event research is re-launched in the new and more complex domain of the dispersed mega-event. This study explored one aspect of such an event, the distribution of marketing information, to better understand how resident participation in a dispersed mega-event can be increased to enhance its social outcomes for residents. Importantly, the results of this study highlight the need for a balance between centralised marketing strategies for an entire mega-event destination and tailored marketing tactics for satellite host destinations. Further research is required to understand how this can be operationalised effectively. Thus, further analysis of the dispersed mega-event event—associated strategies, the tactics and the outcomes —is required to ensure that their benefits are enhanced for their residents, who are often disadvantaged because of the fact that they are residents of the host destination(s). The study suggests that residents are passive (i.e. information-receiving) rather than active (i.e. information-seeking) when accessing information about events. Indeed, their approach to accessing information about events seems to reflect the fact that attendance at events for residents is a leisure experience. In this instance, gaining information about events should be part of leisurely experience. Do marketers design communication strategies that reflect the leisurely nature of event attendance? Are they making access to information onerous? It would useful to undertake research that explores this notion. It is possible that instead of marketing the event as a product, further research is warranted to understand how events can be marketed to residents as leisure experiences, and as services marketing literature would suggest, to understand how residents can receive information about events at time and places that will match the event experiences they are seeking. More research needs to understand the passive and active nature of information-seeking behaviour regarding events so that we can further infiltrate consumer groups. Finally, this paper has suggested that existing community infrastructure and social networks can leverage participation in mega-events. Although this is not new information, it does point to different ways in which researchers and event organisers must tap into existing information from market research agencies and local governments. Many of the challenges that this paper has presented for communicating with local residents can be overcome by taking advantage of data and information that is already available.

The current exploratory study has extended the event communication literature by providing an understanding of why residents of event host destinations use various sources of information, and how they use them. Further, it has provided useful information regarding resident preferences for obtaining and receiving information about an event in their communities. The opportunities for research on this topic are broad, particularly in light of the embryonic nature of the dispersed mega-event.
REFERENCES Barker, M., Page, S. J., & Meyer, D. (2002). Modelling tourism crime. The 2000 America's
Cup. Annals of Tourism Research, 29(3), 762 - 782. Chalip, L. (2006). Towards social leverage of sport events. Journal of Sport & Tourism, 11(2),
109-127. Chalip, L., Green, C., & Hill, B. (2003). Effects of sport media on destination image and
intentions to visit. Journal of Sport Management, 17, 214 -234. City of Port Phillip. (2003). Port Phillip in profile: Our city's population, neighbourhoods and
people. Retrieved 6th Feb, 2007, from http://www.portphillip.vic.gov.au/attachments/o9086.pdf
Commonwealth of Australia. (2002). Region Aggregate--City of Greater Geelong. Retrieved 2nd Feb, 2007, from http://www.geelongcity.vic.gov.au/Business_In_Geelong/Census_Information/Census_data_by_Statistical_Local_Area/
Hall, L., O'Sullivan, C., & O'Sullivan, T. (2003). Creative Arts Marketing (2nd ed.). Oxford: Butterworth-Heinemann.
id. (2007). Community profile. Retrieved 6th Feb, 2007, from http://www.id.com.au/bendigo/commprofile/default.asp?id=134&gid=10&pg=1
IOC. (2001). At a glance: Olympic Marketing Research. Marketing Matters: The Olympic Marketing Newsletter, May 2001.
Kellett, P., Hede, A. M., & Chalip, L. (2006). Leveraging the Commonwealth Games in Melbourne for Community Engagement: An Examination of Equal First and the Adopt-a-Second-Team Program. In C. Arcodia, M. Whitford & C. Dickson (Eds.), Global Events Congress and Educators' Forum (pp. 109-119). Brisbane: University of Queensland.
Lincoln, Y.S., & Guba, E.g. (1985). Naturalistic inquiry. Beverly Hills, CA: Sage. McCartney, G. (2006). The influence of resident particpation on the perceived impacts of
hosting a mega-event. In C. Arcodia, M. Whitford & C. Dickson (Eds.), Global Events Congress and Educators' Forum (pp. 217-226). Brisbane: University of Queensland.
OCGC. (2006). About Us. Retrieved 31 July, 2006, from http://www1.dvc.vic.gov.au/ocgc/about.htm
Olds, K. (1998). Urban mega-events, evictions and housing rights: the Canadian case. Current Issues in Tourism, 1(1), 2 - 46.
Pearce, D., Tan, R., & Schott, C. (2004). Tourism distribution channels in Wellington, New Zealand. International Journal of Tourism Research, 6, 397-410.
Rothenbuhler, E. W. (1988). The living room celebration of the Olympic Games. Journal of Communication, 36, 61 - 81.
Shanka, T., & Taylor, R. (2004). A correspondence analysis of information used by festival visitors. Tourism Analysis, 9, 55-62.
Smith, K. A. (2006). The information mix for events: A comparison of multiple channels used by event organisers and visitors. Paper presented at the Global Events Congress and Educators' Forum, Brisbane, Australia.
Strauss, A.L. (1987). Qualitative analysis for social scientists. New York: Cambridge University Press.

Waitt, G. (2003). Social impacts of the Sydney Olympics. Annals of Tourism Research, 30(1), 194 - 215.

Fourth International Event Research Conference Re-evaluating the City/Town: Events as a Catalyst for Change
“LEARNING THROUGH EXPERIENCE” – A STRATEGY FOR INTEGRATING THEORY WITH PRACTICE IN EVENT MANAGEMENT
David Lamb
Lincoln University, New Zealand [email protected]
ABSTRACT The purpose of the paper is fourfold, firstly, to give a detailed description of an “experiential learning” paper in practice and secondly to demonstrate that such an approach to teaching can better meet the challenges involved in providing students, with the multiple skills required to work in event management. The paper then highlights, some of the difficulties of incorporating experiential learning into University curricula and fourthly suggest a range of strategies to overcome such difficulties in a practical and realistic manner.
INTRODUCTION The approach utilised in this paper is based upon the use of experiential learning rationale to provide undergraduate students as future event managers with the skills and knowledge to run events. Students, experience at ‘first hand’, all aspects of event management from the stage of planning through to the evaluation of a ‘real life’ event. Essentially, students ’do’ in addition to the hearing and seeing that occur in traditional forms of learning. Experiencing all stages of the event process enables students of event management to become multitasking and acquire potable events-related skills that can be applied to any event. It has been well documented that employers in event management desire practical and general transferable skills, which includes communication, human resource management, marketing and accounting (Bowdin et al, 2001; Yorke and Knight, 2003). Within the constraints of the traditional university curriculum there are often difficulties in relating the theory of event management to actual practice. Providing students with the opportunity to learn through experience better equips them with ‘hands on skills’ and experiences to draw upon in future involvement with managing events. This, hands on experience, yields learning (Kiser and Partlow, 1999). The approach outlined above has been in use since 2004 with second year undergraduate Recreation Management students at Lincoln University, enrolled in a paper entitled Recreation and Event Programme Planning (Rec 212), which is a core paper of the Bachelor of Recreation Management degree. Prior to 2004, learning for this paper was based around taught lectures and a series of unconnected and outdated readings available in a resource book for students to purchase. Assessment included a number of tests held throughout the semester and an exam based on underpinning knowledge gained from lectures and resource book readings. There was no assessment of the event whatsoever, or indeed of the student experiences in working individually or as pairs to organise their own event or as part of a management group.

In essence, prior to 2004 the organisation of Kiwi Sport events did not involve any aspect of experiential learning whatsoever. Students organise events on behalf and in partnership with Sport Canterbury (one of 17 regional Sports Trusts, throughout New Zealand). Sport Canterbury are involved in organising numerous sporting events to fulfil their stated role, “more people, more active, more often” (Tau, 2004). Under the auspices of Sport Canterbury, students are responsible for managing every aspect of the annual Rebel Kiwi Sport Challenge (a series of sport based half to full day events for Primary schoolchildren based throughout the Canterbury region (SPARC 2005). In undertaking this task, students explore the creation and manipulation of recreational experiences and acquire the skills and knowledge for planning, implementing and evaluating events in a variety of contexts to meet different objectives (Lamb, 2005). This paper details how student learning is organised and managed in Recreation 212. A range of views and opinions were gathered from those involved, including the students enrolled in recreation 212; key Sport Canterbury staff involved with the management and delivery of Kiwi Sports; individual teachers at the school who acted as key contacts for Recreation 212 students at the schools; each child who took part in a Kiwi Sport event and the parents of the children who participated. The research was undertaken, using both qualitative and quantitative methodologies including taped interviews; web based questionnaires and critical information from student reflective diaries. In summarising this paper, a number of innovative ways are given in which the rationale outlined could be successfully adopted. This is for the benefit of academic staff responsible for the delivery of event management curricula and for the students they teach and ultimately for the event management profession. THE EVOLUTION OF EVENT MANAGEMENT CURRICULA Events differ greatly in their size; complexity and frequency, in that some are planned as one off special events whereas others are staged on a regular basis. All events share common characteristics in that they are planned, prepared and produced. Bowdin et al. (2001) have usefully provided some structure to the events industry by identifying events as either one of the following: mega, hallmark or major events in the public, cultural, festival, sporting, tourism or corporate sectors. Event management has now become an established academic field of study within the tertiary sector (Getz, 2000). There are now a plethora of tertiary based courses and papers that focus on event management in specific disciplines, such as sport, recreation, leisure and tourism (Bowden, 2003). The antecedents of this development can be traced back to the strong British tradition of rituals, festivals and ceremonies largely based around local customs and the changing weather seasons in the 18th and 19th Centuries (Bowdin et al., 2001). In New Zealand however, there is an absence of degree level courses available in event management specifically related to the sport, and recreation sectors. The Graduate Diploma in Facility and Outdoor Events is a postgraduate level course taught at Christchurch Polytechnic and is a notable exception. However, the emphasis on this course is on material that is more generic to the event management industry, rather than specifically related to sport or recreation events (Burley, 2003). There is, however, a Bachelor of Recreation Management degree programme at Lincoln University, Christchurch. This programme includes a ‘core’ module in event management at Level Two of the Bachelor of Recreation Management degree. Entitled ‘Recreation Event and Programme Planning’,

it is coded ‘Recreation 212’, and hereafter will be called by that name in this paper. INTRODUCTION TO THE STUDY This paper evaluates the effectiveness of an experiential learning model in the teaching of ‘real life’ event management — “one of the most important components of the modern university curriculum” (Drummond, 2003: p.1). Firstly a critique of how event management has developed into an academic field of study is undertaken, followed by review of experiential learning theory. The paper then, outlines the context in which the study is based and leads to a discussion of the origins and philosophical basis of Kiwi Sport. The experiential learning assessment model devised for this study is then explained and an account is given of the potential of the learning model and the problems encountered. Subsequently, the methodology used in the study is explained and then a number of key research findings are presented. The last section of the paper summarises the findings and suggest a number of recommendations to further meet the objective of student learning through experiencing real life events. EXPERIENTIAL LEARNING EXPLAINED The term experiential learning is now a widely recognised technique to educate tertiary level students. The principle of this approach is useful where the integration of theory and practice in central to the rationale. For example, future employability, for event management students, is often determined by theoretical knowledge in event management and practical application of that knowledge in the workplace. (Tau, 2004 and Harvey, 2005). Ruhanen, 2005 has argued that experiential approaches work to enhance and stimulate student learning, enthusing students with an interest in event management. Experiential learning approaches have been advocated as a valuable educational tool to overcome the knowledge - based practice gap inherent in vocationally oriented disciplines (Hicks, 1996; Michelson, 1996; Estes, 2004 and Joshi et al, 2005). In using experiential learning theory, my primary concern was to facilitate student learning by designing a learning model to provide students with the opportunity of experiencing a real event. The opportunity for students to share their experience with their colleagues enrolled in Recreation 212 was important and throughout the module students were asked to relate this experience to prior and possible future event experiences. The objective of this was to enable students to apply their learning at a later date with another event. Simply providing an event experience was not my intention as had previously occurred prior to 2004, as this would not create experiential learning (Burley, 2003 and Connor, 2005). The students needed to understand their experience, utilise, record and reflect on their observations (experience) and adapt their experience (learning) to new situations. The theoretical underpinnings of experiential learning theory can be traced back to the pioneering work of Kolb (1984), who emphasised the important role experience plays in the process of learning. He defines experiential learning as “the process whereby knowledge is created through the transformation of experience” (Kolb, 1984, p.41). The origins of Kolb’s work, relies on a number of schools of thought including philosophical pragmatism (Dewey), social psychology (Lewin), and cognitive development theory (Piaget). His model consist of four elements or stages of learning that he describes as concrete experience, observation and reflection, abstract concept forming and testing new situations (see Figure 1). These four inter related elements have been clearly described by Connor (2005),

“Concrete experiences that allow us to reflect on new experience from different perspectives. From these different observations, we engage in abstract conceptualisation, creating generalisations or principles that integrate our observations into sound theories. Finally we use these generalisations or theories as guides to future action (active experimentation).”
(Connor, 2005, p.1) Figure 1
The experiential learning cycle and basic learning styles (Kolb, 1984) Concrete Experience Reflective Observation Active Participation Abstract Conceptualisation The outcome of the process described above is involvement in another concrete experience at a more complex level at a later date, which in the case of Recreation 212 students could take the form of involvement in organising or planning an event, after the module has been completed. Kolb’s model has been criticised by a number of commentators as over descriptive, principally by Atherton, (2005) and as unrealistic, prescriptive and needlessly academic (Race, 2005). Boud and Walker (1998) believe there is a lack of attention in the model to the process of reflection and Anderson (1988) has argued the model takes little or no account of cultural aspects involved in learning. Others, such as Jarvis (1995) and Rogers (1996) view the model as over simplified accusing Kolb of assuming that one stage of learning, naturally leads to another. Indeed Jarvis, (1995) has criticised the lack of research to test the model the lack of data produced and the fact that Kolb’s experimental research base was small. Kolb’s model may be limited but, “it is a useful framework for planning teaching and learning activities” (Tennant, 1997, p.2), and his ideas are useful in directing educational thought from the teacher, back to the learner (Rogers, 1996). Experiential learning has also been described as a type of holistic learning theory that identifies a range of learning styles (Atherton, 2005). Here the emphasis is on participants reflecting on their experiences to generate understanding and transference of skills and knowledge. In management education, experiential learning has been used
Accommodating Diverging Assimilating Converging

successfully in a number of innovative ways to match learning styles with the learning environment and programme design (Boyatzis et al, 1995). Experiential learning theory has been a useful vehicle to better understand learning as Boyatzis et al (1995), have argued, as it leads to a deeper and more comprehensive understanding of learning, when compared to other learning theories. THE EXPERIENTIAL LEARNING PROCESS The primary objective of utilising an experiential learning model was to stretch students out of their ‘comfort zone’ in developing career-orientated event management skills to: “engage students in active citizenship and real world preparation (Swiderski, 2000, p. 125). In other words, moving beyond what Yorke and Knight (2003), refer to as ‘knowing that’ and ‘knowing how’, to encourage elements for ‘doing’ and ‘reflecting’ (Schon, 1983). In the design and operation of Recreation 212, student engagement with the community in organising a real life event was central. As Battistoni (1995, p. 30) stated “students are supported through improved learning outcomes and furthermore the opportunity to support University research”. Moreover, as Swiderski (2000, p.128) noted the “integration of the academic curriculum with community services generates a winning teaching-learning model, that benefits the student, the school, the faculty and the community”. THE EVENT CONTEXT SPARC (Sport and Recreation New Zealand), plays an important role in government sporting policy in New Zealand through a range of broad policy aims, one of which prioritises “physical activity and sport in a broad and holistic manner, in particular the value created by people being physically active and participating in organised sport” (http:www.sparc.org.nz/research-and-policy/). At a regional level this policy is operationalised through work undertaken by Sport Canterbury as part of a strategic goal to “increase sporting and physical recreation participation to improve health and well being” (Tau, 2004). The national based Kiwi Sport initiative is a partnership programme launched by the Hillary Commission in 1988. It involves physical activity for young people using existing organisations such as primary and intermediate schools where the focus is on participation to promote physical growth, body awareness and active/healthy lifestyles rather than competition (SPARC, 2003). Kiwi Sport aims: • Offer variety of high quality sports when modified to suit stage of development and accessible to everyone; • Ensure equity in sport for all young people regardless of culture, age or gender; • Encourage everyone to take part in sport and improve skills; • Promote enjoyable and satisfying competition and discourage win at all cost attitude; • Promote fair play and good sporting behaviour and establish a good grounding for sport and other activities The Kiwi Sport programme aims to promote individual self-confidence and a positive self-concept through affirmative sporting experiences, to develop a life long interest in sport. Modified or miniature versions of adult sport are used with specialist equipment, reduced playing areas and

relaxed rules with the emphasis on active learning through full participation. Introductory coaching courses and the Kiwi Sport resources kit and manuals provide the materials to train Kiwi Sport leaders, coaches and co-ordinators. The Kiwi Sport programme has witnessed measurable success as outlined by Harvey (2005), who reports that, • Over two million schoolchildren have now been involved with over $NZ12 million of government money invested since the late 1980s; • 95% of all Primary and Intermediate schools are currently involved • There are now over 12,000 people trained to deliver Kiwi Sport, which greatly adds to the pool of potential volunteers in sport; and • Over 29 modified sports are now offered as part of the programme with resource guides available for each sport and specialist help available for adaptive forms of physical activity. THE EVENT/S Students engaged on Recreation 212 are part of a wider partnership for the provision of sporting experiences for young people (see Figure 2). Sport and Active Recreation New Zealand [SPARC] funds the Kiwi Sport Programme on a national basis and devolve funds to the Regional Sports Trusts, such as Sport Canterbury. In turn, Sport Canterbury works in partnership with Rebel Sports — a major sports retailer in New Zealand and the main sponsor of the Kiwi Sport Programmes (see below). This relationship provides the basis for the experiential learning model that underpins the paper. The rationale on which the model is based is centred on activity and experience, involving students in problem solving and decision making, working individually or collaboratively in pairs or as part of a team. Recreation 212 was designed to work with organisations identified in figure 2, to promote individual and collective learning amongst students with real life impact on the local community and this is an ideal case for experiential learning. The fundamental principle is that in order to learn effectively about event management, students need to be actively involved in the planning, managing and organisation of a ‘real life’ event. Hence, through Recreation 212, students have the opportunity to self-learn, learn with and from fellow students, and also from their wider engagement with the community when they organise their events. This situated form of learning enables students to move from the periphery to the centre of their learning (Lave and Wenger, 1991). Learning itself became a process of social participation within the community. Students are able to participate in, control and direct the learning process taking responsibility for their own learning (Estes, 2003), rather than being reliant upon the acquisition of knowledge from a third party (Lave and Wenger, 1991).
Figure 2 Working in Partnership

Through this approach to managing an event, students are provided with a variety of learning opportunities to “integrate those experiences into their education and engage in subsequent action based on the integration” (Canales and French, 2003, p. 1232). It is predicated on student learning extending beyond the lecture room and giving students experience of engaging with communities in organising an event for a specific group. In this case the community group is a group of schoolchildren, based at a local primary or intermediate school, within the Christchurch region. As part of their commitment to Junior Sport in the community, Sport Canterbury is involved on an annual basis with organising a number of school-based sporting events every year. These events based on the Kiwi Sport Challenge philosophy, take place in the August/September school holiday break. Lincoln University students enrolled in Recreation 212 take sole responsibility for organising one of these events, working in pairs at a selected school in the Christchurch region. Students are also involved collectively in one of five management groups covering ‘all’ key aspects of event management practice: from resource allocation; marketing and media relations; communication and coordination; health and risk assessment; and analysis and review (Bowdin, 2003). Each management group has an equally important role to play in supporting the events organised, and a representative from each management group meets formally with the examiner and graduate tutor for Recreation 212 on a weekly basis to report on their progress. These meetings are essentially a forum for information exchange that is critical to the success of each individual event, as they provide an opportunity to: • Monitor progress and discuss common issues; • Discuss and evaluate the progress of each management group; • Enable groups to communicate with each other directly and then report back key decisions and news from the other groups regularly to their own members THE EXPERIENTIAL LEARNING MODEL In the first week of the semester, Recreation 212 students are involved as active participants as part of a Kiwi Sport training day, set up and managed by Sport Canterbury staff and a number of coaches from various governing bodies. This training day serves a number of important functions: • It provides students with the essential pre-requisite skills and information

in order to lead, coach and manage their own and others Kiwi Sport events; • It introduces students to managing young people in groups; • It acquaints students with the rudimentary basics of coaching in a range of sports, identified as Kiwi Sports (SPARC, 2003). • It also gives students the impetus for “putting together an Event Plan for their selected school and enables students to utilise event management theory into actual real life practice” (taken from the Recreation 212 subject outline, Lamb 2005). The structure and assessment for Recreation 212, emphasises experiential learning methodology (see Figure 3). In particular, the self reflection diary instructs students to, “record, on a weekly basis their observations and comments with evidence, to a number of key questions, to help structure the content of their diaries” (Lamb, 2005: p.7). The diary requires students to record their experiences with honesty and integrity with the purpose of encouraging what Schon (1983) refers to as a ‘new understanding’, where thinking and doing are linked through the action of reflection.
Figure 3 The experiential learning model for recreation 212
The themes highlighted below in the form of questions, provided students with a frame of reference for students to critically reflect on their experiences and a suggested template to structure their observations and perceptions in their self reflection diaries.

• What did you contribute this week as an individual and as a group member? • What did you learn this week (skills/knowledge/experience)? • What went well/not so well this week? • What resources/information did you make use of this week? • What are your other comments/personal reflections on the week? • What have you provided in the text/appendices as evidence? In order to substantiate the diary entries, students are required to attach evidence and supporting information and to learn from their experiences by actual real-life practice (Boud and Walker, 1998). They are also required to reflect critically on their experiences and observations, a universal goal for all higher education, but one that is seldom confirmed as a measurable outcome in the curriculum (Brookfield, 1987). The diary in practice provides a useful means in which students can, debrief their own experience. This moves their experience of event management beyond learning, by the action of doing in compiling their diary entries on a regular basis. This gave the students the opportunity to think critically and reflect on their learning, giving meaning to their experience, expanding what Jarvis (1995), refers to as the ‘learning’ potential. The assessment of Recreation 212 is continuous as learning is ongoing and requires the following: • attendance at the Kiwi Sport training day; • planning prior to the event; • performance on the event day; • coaching at 3 events that their colleagues have organised; • a series of individual student tutorials where progress and contribution of each individual student is discussed; • preparation and delivery of a Management Group presentation • presentation and submission of a Management Group professional report. To support them in their learning, students are encouraged to make effective use of the Resource Book for Recreation 212 that consists of a number of selected readings from both academic and professional journals focusing on different aspects of event management. The information contained within the resource book provides the basis for supporting evidence needed for the self reflection diary. In addition, lecture materials are available on-line for students, with each lecture based around a different aspect of event management, so that students were provided with the principles upon which good event management practice is based (Bowdin et al., 2001 and Bowdin, 2003). Finally, since communication was the key to the success of the Experiential Learning Model, students were encouraged to contribute on a regular basis to the Recreation 212 web discussion forum. This enabled students to stay in regular contact with the examiner, graduate tutor, Sport

Canterbury staff and fellow students. In doing so, they were able to reinforce key skills in using information technology, which are crucial to securing future employment in the event management industry (Christchurch City Council, 2003). Engaging in reflective and interactive online learning activities was an important part of the learning process and encouraged students to help each other in evaluating issues and problems and making decisions. STRATEGIES TO MANAGE THE PROBLEMS WITH THE EXPERIENTIAL LEARNING MODEL During the design stage of the Recreation 212 web discussion forum, I encountered some difficulties in communicating with the Learning and Teaching Services Unit (LTS) at Lincoln University and students experienced a range of teething problems with accessing the forum and posting messages to it. This was also the case when students first accessed the forum as in some student ID numbers had not been recognised. Encouraging students to use the forum in the early weeks of the paper was problematic, as some students had mentioned in their diary entries that they had not understood how to access the forum. To overcome this problem the LTS contact person visited the class to further clarify how students could log on to the forum ‘on’ and ‘off’ campus. Some students developed a reluctance to utilise the forum and instead used mobile texts or email to communicate with each other. In order to encourage students to make better use of the forum, students were asked to post messages on a regular basis and encouraged to use this material as evidence for their diary. Also, in conjunction with the LTS contact person, the forum was adapted so that all students were able to access posted forum messages via their email address. This proved very successful, as students could now read and if need be, respond to any message posted on the forum. Furthermore, this facilitated more effective communication channels between the students, Sport Canterbury staff and the examiner and tutor for Recreation 212. The list of Schools where Kiwi Sports events were to be held was provided by Sport Canterbury and managed by the Human Resource Management Group. Students worked in pairs to plan an event in consultation with their selected school and had the choice of two days provided by the school to run the event. Most events were scheduled for late August or early September, each year, depending on which dates the school had selected. This caused two problems, as some dates clashed with the inter semester break for students at the University or with timetabled classes. This was unavoidable as traditionally Kiwi Sport events were an essential part of the yearly programme for Junior Sport in Canterbury. The other factor concerned the timing of the events, was the fact that events took place in the middle of winter and subject to inclement weather. A strategy to manage this problem was to have a cancellation date for the event and if the event was rained off on the second date, to have an alternative indoor plan for the event on the second date. So, in reality students had to plan three events, an outdoor event for two different dates and an indoor event, if the two outdoor events were cancelled, due to bad weather. This experience was crucial for students to consider contingencies when planning events, again stressing the realities of real life event management. Working in pairs to organise events required regular consultation and communication with schools to discuss the event plan, to meet the needs of the participants. Conflict issues did arise that needed management by the students, in particular problems arose between the contact person at the school and the student pair organising the event. This issue concerned the agreement of a confirmed date

for the event, due largely to the lack of adequate and regular communication between the two parties involved. This problem was overcome by regular discussions between the school and the pair to work towards an agreed understanding of the purpose of the event. For this purpose, the importance of open dialogue was stressed to the students and students were encouraged to visit their allocated school in the early part of the semester and then on a weekly basis to maintain regular contact face to face. Allocating coaches to events caused some problems as students were required to coach at a minimum of three events, other than their own event. Once all Recreation 212 students had been allocated to three events, it became evident there was a shortfall of coaches to cover all events, due to the large number of events assigned to the students from Sport Canterbury. This problem was managed by the Human Resource Management Group (HRM) in Recreation 212, as they secured the services of students studying at the New Zealand Institute of Sport in Christchurch. Although students were made well aware of their responsibilities as coaches, some event pairs reported that some coaches had not shown up to their event or had failed to attend briefing meetings to discuss the running of the event. Penalties for missing coaching were therefore incurred by a small number of students. The HRM Management Group reported some difficulties with allocating coaches to specific events, where event pairs had failed to communicate their coaching needs. In these cases, event pairs were allocated coaches that had not already been assigned to three events. Although all students had attended a full day on coaching methods and instruction specifically geared towards Kiwi Sport, a couple of student with no prior coaching experience required further assistance from the more experienced coaches in the Recreation 212 group. It was very encouraging to witness more seasoned coaches in the group, giving up their own time in offering coaching assistance to less experienced colleagues. Diary entries differed greatly in quality and detail, amongst students with regard to fully utilising, underpinning lectures, the Recreation 212 Resource Book readings and reflection on their experiences during the 12 weeks of the paper. Some students provided a wealth of evidence in their diaries, discussing in some detail how they had utilised lecture material and resource book articles to help them throughout the various planning stages of their events. Other students, simply reported what they had done in a descriptive manner or what had happened to them during the event process, with little critical reflection of their experience and a lack of in-depth analysis. The structure of the diary was composed around a number of key prompts (questions) to encourage students to be critically reflective in a number of ways. This comprised a critique of their own contribution and their effectiveness as an event pair and as a member of a management group. Students were asked to reflect on what went well or badly and what they learnt from their experience, with the objective of generating understanding and transference of skills and knowledge to the event management arena. METHODOLOGY
Figure 4 Research methodology

The Research Study
Online Questionnaire
(100)
Interviews(30)
EvaluationResearch
(Children; Teachers; Parents and Coaches)
The evaluation of the success of Recreation 212 was based on a mixed method approach (figure 4), incorporating three different sets of data: Firstly, the Individual interviews (n=30) were undertaken with a randomly selected set of students towards the end of the semester in early October 2006, who were enrolled in the Recreation 212 paper. The themes and ideas that emerged from the 2005 student evaluation for Recreation 212 formed the basis of the interview questions. These questions were then augmented by a series of ‘prompts’ (Tolich and Davidson, 1999,) which encouraged students to talk freely and give detailed feedback about their thoughts and opinions on the experiential style of learning in which they were engaged. The interviews were taped and transcribed verbatim. The interview guide approach used consisted of a number of open ended questions or sometimes described as ‘prompts’ (Tolich and Davidson, 1999), that encouraged students to talk freely and give detailed feedback. The interview guide was not simply a list of fixed questions, but used as an, “outline of things to ask that evolve constantly as more and more knowledge about the research is gained” (Tolich and Davidson, 1999, p. 108). Becker, (1998) further clarified this assertion that small scale and detailed studies bring forth, lots of rich and useful data but,
“Without knowledge, based on first hand experience to correct our imagery, we not only don’t know where to look for the interesting stuff, we also don’t know what doesn’t need extensive investigation and proof. Lacking personal knowledge we assume that the ordinary things are among the great social science mysteries that need to be cleared up with a big study and a lot of data”
(Becker, 1998, p. 16) Secondly, an on-line questionnaire (n=100) generated from the interview data gathered, was completed by the students at the end of October 2006. This timeframe gave the students the opportunity to reflect on their experience after completing the module before leaving for their summer break. The on-line questionnaire was accessed via the Recreation 212 webpage. Students were asked to give their honest opinions and observations of their experience in response to a number of statements put to them. Thirdly, the Analysis and Review Management Group designed a range of questionnaires to evaluate the views of other key stakeholders (coaches, event planners, parents/supporters and

children). These were distributed at each Kiwi Sport event, by the event pair responsible for that particular event. The questionnaire for the children was modified to keep it short and simple (for example, a limited range of options presented as ‘happy’ or ‘sad’ faces). RESEARCH FINDINGS a) The Interviews Two main themes emerged from the interviews: working individually in developing personal skills and working collectively as a group. Indeed the former was reported by many students as a unique learning experience (in Recreation 212) when compared to previous styles of learning they had encountered in other papers based at Lincoln University. Many students commented that the planning of the events had encouraged them to manage their time more effectively and had helped them design strategies to make better use of their available time. They also commented that they had gained confidence as a result of responsibility for the key tasks that enabled the event to actually take place. This was consolidated when their success in key tasks, was acknowledged by others. Although mistakes were made during the organising, planning and staging of the events, collective responsibility for them was shared by the group. Additionally the web discussion groups and group meetings were used as a forum to resolve conflict and outstanding issues. Working as a pair and as part of a bigger management group brought many challenges which students had not faced before. For example, some students reported that they had improved their ability to consult with one another which lead to better delegation of event associated tasks through negotiation. Decisions had to be made that required leadership amongst students and often well-laid plans were curtailed because of outside influences beyond the control of students. As a result students had to plan for contingencies, which was often the case when school events were cancelled because of bad weather or lack of an indoor alternative event. During the interviews it became apparent that a number of students had realised the importance of individual and collective responsibility, in taking ownership of their event. As one student remarked:
“It’s a new kind of learning; we need to work it out for ourselves. The idea of Recreation 212 is to expose us to new ways of learning to acquire skills in running events. Holding our hands too much will not achieve true learning and in turn teach us little about organising real life events”
(Recreation 212 student in 2006) b) The On-line Questionnaire The on-line questionnaire was developed in two parts. The first part asked students a number of open ended questions to ascertain their views about Recreation 212. In response to one of the open-ended questions, one student commented that the event had created:
“A good feeling, knowing that I have managed to learn some new skills form scratch .another aspect I really enjoyed was working in a team environment. I have to say I was very fortunate to be working in a great group with great hard working people. We all got

along really well and had distributed the responsibilities and tasks evenly. It was a really good experience”.
(Recreation 212 student in 2006) In terms of specific skills needed to manage their event, one student remarked that, “it was really useful on the field trip day, to learn about basic coaching strategies in leading groups in sport, as I have never coached before, without it, I would not have known the basic points in order to coach young children”. Analysis of the data from the open ended questions formed the basis of the statements, which the students were requested to respond to. Statements were presented to the students on-line and students were instructed to select one option to indicate whether they strongly agreed, agreed, showed no opinion or disagreed to each statement. The statements presented to the students asked their opinion on a number of issues including, the training day; working in a team; development of event skills, resource book for Recreation 212; confidence in running an event post paper and the web discussion forum. The overwhelming majority, reported that they had developed their team working skills during the paper (80% strongly agreed) and that the Kiwi Sport training day had been very useful in preparing them to coach at events and plan their own event (95% strongly agreed). There was some variability in the usefulness / effectiveness associated with different learning resources (70% strongly agreed), but in the main, all were received positively. The results quantified from the on-line questionnaire demonstrate that most students found the module interesting (85% strongly agreed). Likewise, the web based resources were well utilised (70% strongly agreed) with only 10% of students giving no opinion, due largely to their lack of interaction with the web. It is pleasing to note that 70% of students strongly agreed that they made good use of the Recreation 212 Resource book, whereas 10% of students, who had no opinion, had not purchased the book. Over 65% of students strongly agreed at the end of the paper, that they would now feel confident in organising and running their own event. 80% of students strongly agreed that they enjoyed working as part of a team, whereas only 5% disagreed, as they preferred independent styles of learning. 90% of students reported strong agreement with the statement “‘I developed many different event skills during the paper”. It is disappointing to report that only 45% strongly agreed that they had made effective use of the web discussion forum, with 10% of students reporting disagreement and non use of the forum. Clearly there is a need for more work to ascertain why some students are reluctant to engage with technology in the form of a web discussion forum. Students developed confidence through involvement with organising events, students showing 90% strong agreement with only 5% of students reporting disagreement at the end of the paper. This was due largely, to unfamiliarity with experiential styles of learning. In summary, the results from the on-line survey were very encouraging and confirmed many of the findings from the interviews. c) Analysis and Review Management Group Findings An important aspect of event planning is to learn from the experience and evaluation of past events. For the purpose of the Recreation 212 events, the Analysis and Review Management Group were given the task of designing a range of evaluations tools in order to make this possible. Separate

evaluation questionnaires were designed for coaches, event planners, parents/supporters and children. The questionnaires for each event were distributed through the Recreation 212 web page, so that students could easily access and download the evaluation forms. Each individual event pair was given the responsibility of distributing the questionnaires to the different evaluation groups that was collected at a later time by the Analysis and Review Management group. Designing the evaluation questionnaire for the children posed several problems, so it was decided to keep the questionnaire short and simple. For this purpose, children were simply asked if they had fun or not by lining up behind one of two signs. One sign was used to indicate if they had fun, whereas the other sign indicated they did not have fun. For other questions such as whether they had learnt something new or whether they would like to take part in a similar event again, children were given the option of a ’smiley face’ or a ‘sad face’ to indicate their response to the question. A total of 70 responses from a possible research audience of 100 people were received from all stakeholders, and there were some important ‘headlines’ to emerge from this element of the research. Given that an underlying principle of Kiwi Sport is that children have fun participating in physical activity, it was reassuring that an overwhelming majority reported that they did. Event planners generally considered that their own events had been a success. This view was corroborated by teachers from the various schools involved. Some problems were reported when dealing with disruptive children during coaching sessions, but most students did not encounter any serious misbehaviour that warranted teacher involvement. Parents and their supporters (normally friends) were mostly enthusiastic, although they would have preferred to have more information about the Kiwi Sport day before the event took place. This was not solely the responsibility of students, but also Sport Canterbury staff. Many parents were unsure of the purpose of the event, and this was important feedback for the Marketing and Media Management Group. In general, however, the parents / supporters were very pleased with the quality, promotion, timing and content of the events and were unanimous that the events were successful in achieving their stated aims. Coaches played an important role in the success of the events, although there were some problems in a small number of events where there was confusion over the detail of the logistics of events. The coaches in general were rated as very enthusiastic, with good delivery of coaching sessions and appropriate content for the age groups involved at the different schools. Importantly too, all students dealt with and followed good health and safety procedures created by the Health and Risk Assessment Management Group. SUMMARY AND CONCLUSIONS Building relationships and networking were essential to student success in the Recreation 212 paper. In planning their events, students liaised with a number of different people and organisations, as an individual, in a small team as a pair and in a larger management group consisting of 20 people. This real life experience was invaluable in helping students appreciate that key tasks and decisions associated with events required prior planning, consultation and networking before, decisions could be made. ‘Learning by doing’ was central to the philosophy on which the

Recreation 212 paper was designed and delivered, giving students the unique opportunity of planning their event for a real organisation. Hence, the events planned held mutual benefit for the students; Lincoln University; Sport Canterbury; Primary and Intermediate schools in Christchurch and the community in which the events were held. Gaining practical experience in event management was thought to be a worthwhile endeavour by most students and they regarded it as very useful for their future careers in recreation management. With over 50 events and 300 coaches involved each year, Recreation 212 is a major undertaking that requires liaison with a number of different people and a number of levels. Students interacted and communicated with other students enrolled in recreation 212 on an individual level, as part of a small team and as part of a bigger management group. This ‘real life’ experience was central to the ‘learning by doing’ approach that was adopted, and was invaluable in helping students appreciate the importance of proper consultation and effective networking before decisions can be made. Students were able to reflect on their experience in their own words through critical reflection in a structured format provided in the critical reflective diary, as explained earlier. Although, Michelson (1996), has argued that reflection can depersonalise the learner and presumes knowledge will result from experience learning. This model of combining service with learning brings many benefits where the “whole is greater than the sum of the parts, because both are transformed and the value of both is increased (Canales and French, 2003, p. 1238). In summary, planning an event provided Recreation 212 students with a good grounding in the professional practice of event management - a key feature of the effective delivery of good work experience embedded in the curriculum of vocational programmes (Yorke and Knight, 2003 and Bowdin, 2003). Students were encouraged at all times to conduct themselves in a professional manner, as they had an important ambassadorial role within the community on behalf of Lincoln University. Their influence is difficult to measure, although students received a large number of ‘thank you’ letters from the schools and from parents of the children involved in the Kiwi Sport programme. Once all events had been completed, a debriefing session was held with all students, to discuss their involvement and debate how the skills and knowledge they had acquired could be applied in the future. To facilitate this discussion and to build upon and utilise their experience, students were asked a number of questions related to their involvement in Recreation 212. This forum gave the students an opportunity to reflect on their own experience and to share their experience with fellow students. This discussion was a useful vehicle to review the paper and provide suggestions for the future. The questions asked, provided useful feedback for the experiential learning model used and provided a basis for planning in 2007. REFERENCES Anderson, J.A. (1988). ‘Cognitive styles and multicultural populations’, Journal of Teacher
Education, 39, 2-9. Atherton, J.S. (2005). Learning and teaching: experiential learning (on-line), UK. Retrieved March
16, 2007, from http://www.learningandteaching.info/learning/experience.htm Battistoni, R. (1995). ‘Service learning, diversity and the liberal arts curriculum’, Journal of Liberal
Education, 81, 30-35. Becker, H.S. (1998). Tricks of the trade — How to think about research while you’re doing it.

Chicago: University of Chicago Press. Burley, P. (2003). Graduate Diploma in Event Management — Student resource book.
Christchurch, NZ: Christchurch Polytechnic. Bowdin, G. (2003). Resource guide in events management. Retrieved February 22, 2007, from: http://www.hlst.ac.uk/resources/events/html. Bowdin, G., McDonnell, I., Allen, J. and ‘O’ Toole, W., (2001). Events Management. Oxford:
Butterworth-Heinemann. Boud, D and Walker, D. (1998). ‘Promoting reflection in professional courses, the challenge of
context’, Studies in Higher Education, 23, 197-207. Boyatzis, R.E., Cowen, S.S., and Kolb, D.A. (Eds., 1995). Innovation in professional education:
Steps in a journey from teaching to learning. San Francisco: Josey Bass. Brookfield, S. D. (1987). Developing critical thinkers. Milton Keynes: Open University Press. Brookfield, S.D. (1983). Adult Learning, adult education and the community. Milton Keynes: Open
University Press. Canales, M.K. and French, H. (2003) ‘Experiential learning as a service to others’, AORN Journal,
77, 232-1239. Christchurch City Council (2003). Planning and running a community event. Christchurch, NZ:
Christchurch City Council Leisure, Recreation and Arts Team. Connor, M.L. (2005). ‘Learning from Experience’, Ageless Learner, 1997-2004. Retrieved 21
February, 2007, from http://agelesslearner.com/intross/experiential.htm Drummond, C.N. (2003). ‘Carl Rogers and the origins of experiential learning’, Journal of Geoscience Education, 51, 1-2. Estes, C.A. (2004). ‘Promoting student centred learning in experiential education’, Journal of
Experiential Education, 27, 141-161. Getz, D. (2000). Defining the field of event management. Event Management, 6, 2-4. Harvey, T. (2005). ‘Kiwi Sport - the story so far’, guest lecture to Recreation 212 students at
Lincoln University: Christchurch, NZ. Hicks, R.E. (1996). Experiential learning in a postgraduate management programme. Education and
Training, 38, 28-38. Jarvis, P. (1995). Adult Continuing Education - Theory and Practice (2nd Ed). London: Routledge. Joshi, M.P., Davis, E.B., Kathuria, R. and Weidener, C.K., (2005). Experiential learning processes:
Exploring teaching and learning of strategic management framework through the winter survival exercise. Journal of Management Education, 25, 672-695.
Kiser, J. W. and Partlow, C.G. (1999). Experiential learning in hospitality education: An exploratory study. Journal of Hospitality and Tourism Education, 11, 70-74.
Kolb, D.A. (1984). Experiential Learning: Experience as the source of learning and development. New Jersey: Prentice-Hall.
Lamb, D, (2005). Recreation 212 - subject outline. Christchurch: Lincoln University. Lave, J and Wenger, E. (1991). Situated learning- legitimate peripheral participation. Cambridge:
Cambridge University Press. Michelson, E. (1996). ‘Usual Suspects - experience reflection and the (en) gendering of
knowledge’, International Journal of Lifelong Education, 15, 438-454. Race, P. (2005). Making Learning Happen. London: Sage. Rogers, A. (1996). Teaching Adults (2nd Ed.). Buckingham: Open University Press. Ruhanen, L. (2005). Bridging the divide between theory and practice: Experiential learning

approaches for tourism and hospitality students. Journal of Teaching in Travel and Tourism, 54, 33-52.
Schon, D. (1983). The Reflective Practioner. London: Temple Smith. Sport and Active Recreation New Zealand (2003). Sport Leader - Kiwi Sport Leadership Resource
Manual, Wellington, NZ: SPARC. Sport and Active Recreation New Zealand, (2005). ‘Research and Policy’. Retrieved 14 March,
2007 from http://www.sparc.org.nz/research-and-policy Swiderski, M. (2001). ‘Book review: Dunlop, M.R - Reaching out to children and families’, Journal
of Experiential Education, 24, 125-128. Tau, N., (2004). ‘Sport Management - the role of Sport Canterbury in the community’, guest lecture
to Recreation 212 students at Lincoln University. Christchurch, NZ. Tennant, M. (1997). Psychology and Adult Learning (2nd Ed.) London: Routledge. Tolich, M. and Davidson, C. (1999). Starting fieldwork, an introduction to qualitative research in
New Zealand. Auckland: Oxford University Press. Yorke, M. and Knight, P. (2003). The undergraduate curriculum and employability. York: Learning
and Teaching Support Network Group.

Fourth International Event Research Conference Re-evaluating the City/Town: Events as a Catalyst for Change
VOLUNTEER MANAGEMENT OF THE HI SEOUL FESTIVAL
Sea Youn Kwak Department of Events Management
Kyonggi University, Korea [email protected]
ABSTRACT For the success of a festival, effective volunteer management is axiomatic. Given the dramatically increased size and quality of festivals and special events in Korea over the past ten years, the importance of effective volunteer management has been overlooked among festival organizations in comparison to similar festivals in Western countries. This paper provides a description and an assessment of the Hi Seoul Festival 2006 volunteer program based on an seven-step ideal process of an effective festival volunteer program with suggestions for the program development by reviewing organizational documents, and an interview with staff of Hi Seoul Festival organization, and a survey pertinent to festival volunteers’ motivation. This study shows college students are more interested in volunteering at festivals in Korea with the primary motivation of developing relationships and gaining work experience. It also suggests that the Hi Seoul Festival organization should fully appreciate the importance of an effective volunteer program and the position and work of a volunteer coordinator. Keywords: Festival volunteers, Volunteer motivation, Hi Seoul Festival, Festival volunteer management.
INTRODUCTION Volunteers are one of the primary concerns of most festival administrators because many festivals have limitations on their funding and resources. S. W. Schmader, Executive Director of the Boise River Festival (1997, p.5), indicated that volunteers can augment event staffs, expand outreach and support, provide professional expertise and direction, maximize resources and minimize expenses, and boost involvement in “community events.” For the success of festivals and events managing volunteers effectively is essential.
Although many experts in special event and festival management agree that volunteers play a crucial role in the success of their events (Getz, 1991), the literature has not yet fully addressed the issue of festival volunteer management. Most contemporary research has considered volunteerism in social and community services, and only recently have some studies been focused on volunteerism in the context of events and festivals (Yi, 2000; Cuskelly & Boag, 2001; Slaughter, 2002; Cuskelly et al., 2006). Pam Cheriton, a freelancer special event professional, noted that the use of volunteers in the production and management of events is not new; but, more organizers use them poorly than wisely (qtd. In Goldblatt & Supovitz, 250).
During the past ten years, festivals and events in Korea have grown remarkably in both quality and quantity. However, many Korean festival organizations still do not have enough experience with volunteer management since volunteerism, as a whole is not as dominant in Korea as in Western countries. Additionally, the majority of festivals and events in Korea are operated by event agencies, mostly based on year-to-year contracts without a systematic organizational body. Hence, understanding of the importance of volunteerism among current Korean festival

organizations has been relatively poor.
This study will provide a description of the current volunteer program of the Hi Seoul Festival, the largest-scale festival in Seoul. The seven-step ideal process of festival volunteer management outlined by Jouyeon Yi (2000), as applied to the festival, will also be presented. In addition, this study will analyze and evaluate the Hi Seoul Festival volunteer program by reviewing organizational documents, an interview with staff of the Hi Seoul Festival organization, and a volunteer survey pertinent to festival volunteers’ motivation.
FESTIVAL & VOLUNTEER MANAGEMENT Kathy A. Hastings (1997), Executive Director of Seattle SEAFAIR, introduced a master strategy to build a volunteer work force: recruit, retain and reward. She mentions that principles of working with volunteers come from good business practices and are similar to working with qualified paid staff. Cuskelly and Boag (2001) stated that recruiting and retaining volunteers with a sense of commitment to organizational goals and values is significant. Since many events and festivals are run almost entirely by volunteers, effective volunteer management is critically important to success.
Sue Twyford (1990) presented an overview of organizational charts based on the size of festivals. She explained that a typical festival organization has a board of directors, an executive director and executive committees. The executive committees consist of an administrative committee (secretary, treasurer, funding and sponsorship manager, human resources manager), show/program operation committee, concession committee and a volunteer program committee. Based on Twyford’s organizational chats, Yi (2000) suggested that a volunteer coordinator/volunteer director should be directly positioned under the executive director to manage volunteers effectively as shown in Figure 1. The chart below shows the organizational structure of a festival organization, making it easier to understand the relationship between paid staff and festival volunteers.

Figure 1 Typical Relationships of Festival Volunteers with Paid Staff
A volunteer coordinator is not able to wholly manage the entire festival volunteer program since volunteers are positioned at a variety of committees and their job responsibilities are diverse. Though a volunteer coordinator plans a volunteer program, recruits volunteers, places them, provides orientation, and evaluates the volunteer program, each executive committee staff needs to train volunteers and supervise their performance.
Differing from social volunteers, unique characteristics of festival volunteers from varying job positions, various working terms, and diverse workloads, all demand a different kind of volunteer management program. Yi (2000) suggested an ideal model for an effective festival volunteer program based on a management process with seven steps: planning, recruiting/positioning, training (orientation and pre-service training/on-the-job training), supervising, recognition, retention and evaluation of the volunteer program, as shown in Table 1.
Table 1
Ideal Process of an Effective Volunteer Program
Executive Committees
Volunteers for Show/Program
Committee
Volunteers for Concession Committee
Volunteers for Other
Committee
Administrative Committee
Concession Committee
Show/Program Operation Committee
Other Committee
Administrative Coordinator (Paid Staff)
Show/Program Operation Coordinator (Paid Staff)
Concession Coordinator (Paid Staff)
Other Committee Coordinator (Paid Staff)
Executive Director (Paid Staff)
Board Members (Volunteers)
Volunteers for Administrative
Committee
Volunteer Coordinator (Paid or Unpaid Staff)
Volunteer Program Committee
Volunteer Coordinator’s overall management of Festival Volunteers
Staff of each committee partially manages Festival Volunteers

Major Task Process
Sub-Tasks Area Relationship with Festival Management Timeline
1.Planning -Set objectives and a timetable -Develop position guides -Budgeting
Implemented within the step of developing the festival program
-Governance volunteers’1 recruitment (Key volunteer staff)
Key volunteer staff hired when they are needed by a festival organization
-Behind-the-Scenes (BTS) volunteers’2 recruitment
Depending on the need of each executive committee
2.Recruiting/ Positioning
-Public Service (PS) volunteers’3 recruitment
Hired at least one week before actual festival
3-1.Training (Orientation)
-Key, BTS, PS volunteers orientation 1 week before beginning to work
3-2.Training (Pre-service /On-the-job)
-Key volunteer staff -BTS volunteers -PS volunteers
Pre-service training: At least 1 day before beginning to work On-the-job training: during the entire work period
-Relation-oriented tasks : Managing relationships between staff and volunteers
During the entire work period 4.Supervising
-Task-oriented tasks: Tracking and evaluation of volunteer performances
During the entire work period
5.Recognition -Volunteer party, newspaper, thank you letter
Within 1 week following festival
6.Retention -Reminder letter -Newsletter -Webpages for the volunteers
Ongoing after festival
7.Evaluation of the Program
-Analyze records pertinent to volunteers -Reporting the results
Within 8 weeks following Festival
FESTIVAL VOLUNTEERS’ MOTIVATION To retain volunteers, organizations need to understand the motivation of the individual volunteer. Clary, Snyder and Ridge (1992) argued that identifying individual volunteer motivation allows a volunteer manager to assign volunteers appropriate tasks. Additionally, providing feedback on their performance related their motivation to volunteers may increases their satisfaction, which in turn boosts their commitment. Their desire to remain a volunteer is hence likely to increase. Slaughter (2002) pointed out the benefits of retaining volunteers and investigated the motivations of long-term volunteers at events. She insisted that it is a vital component of volunteer retention to understand why an individual is motivated to volunteer.
The literature on volunteer motivations has mainly focused on the area of human services with few studies targeting motivations to volunteer at festivals and special events (Ryan & Bates, 1995; Williams et al., 1995; Farrell et al., 1998; Saleh & Wood, 1998; Johnston et al., 1999-2000). Generally, volunteer motivation can be reflected as two distinct dimensions: altruistic
1 Yi (2000) divided festival volunteers into three types, based on the type of jobs performed. First, “Governance Volunteers” include board members who participate in planning and important decision-making processes, key volunteer staff who mainly work in fundraising, marketing or financial management, and volunteer team leaders who supervise other volunteers for each committee. 2 Secondary, “Behind-the-Scenes Volunteers” mainly assist staff of each committee with clerical support, mailings, errands and technical assistance. 3 “Public service Volunteers” provide their services directly to the public, as ticket takers or parking lot attendant s, during the festival period.

motivation, or desire to help others, and egoistic motivation, or specific rewards to the individual (Johnston et al, 1999-2000). Altruism can be essential for volunteers in the area of human services, yet it cannot fully explain the reason why volunteers participate in special events and festivals.
Karen Churchard (1997), Associated Executive Director of the Fiesta Bowl, cited some general reasons why people volunteer for events and festivals: pride of ownership, source of pride, personal development, friendship and networking, excitement, and good use of spare time. In a study of a Men’s World Cup Skiing event held in Whistler, Canada, in 1994, Williams et al. (1995) found the most significant motivation for resident volunteers was an interest in supporting their community and the national team. For non-resident volunteers, working with people who share similar interests was the most important reason to volunteer. Ryan and Bates (1995) studied the motivations of unique types of volunteers for the Manawaru Rose and Garden Festival in New Zealand. Four typical leisure motivations were shown: relaxation, social interaction, sharing knowledge and showing competency. Saleh and Wood’s research (1998) on the motivation of ethnic festival volunteers showed that ethnic volunteers are more strongly dedicated to a specially ethnic event with particular culture-related motivations: sharing their cultural heritage with others, and strongly believing their commitment is good for the community. Farrell et al. (1998) suggested that volunteer motivation may differ depending on the nature of the particular event, for instance, volunteers at sporting events might be motivated by reasons that are different from those of volunteers at cultural events. DATA COLLECTION To describe and evaluate the Hi Seoul Festival volunteer program, this paper uses both qualitative data collected by participative observation and an interview with the Hi Seoul Festival’s staff, and quantitative data gathered through a survey of the Hi Seoul Festival 2006 volunteer applicants. In addition, a review of other documents and articles relevant to Hi Seoul Festival was conducted. The resources and research methods are as follows:
(1) Interview with the volunteer coordinator4 of Hi Seoul Festival; this interview was conducted after the festival.
(2) Written documents: materials include the Hi Seoul Festival 2006 White Book5, articles in newspapers and magazines, Hi Seoul Festival official website (www.hiseoulfest.org), volunteer handbook, brochure, and the Hi Seoul Volunteer web community.
(3) Hi Seoul Festival 2006 Volunteer Motivation Survey: a questionnaire that asked volunteers to identify their reasons for participating in the festival. This survey was conducted on-site at the volunteer orientation meeting in the annex of Seoul City Hall, the evening of April 24th, 2006. While the focus of this survey was the 328 volunteer applicants, the sample consisted of 216 volunteers who attended the volunteer orientation. Of theses, 192 applicants completed the survey, and 185 were finally in the final analysis. OVERVIEW OF THE HI SEOUL FESTIVAL Hi Seoul Festival began in 2003 and held around early May every year, with residents and visitors gathering in downtown Seoul to enjoy the annual event. The origin of the Hi Seoul Festival was the “Seoul Citizens’ Day Celebration,” held annually every October since 1994. The festival aims to become an international festival that showcases the history, traditions, diversity and uniqueness of Seoul, displaying Seoul's dynamism and unity to the world. Activities have been located in major downtown areas, Seoul Plaza in front of the City Hall, the embankments of Cheonggyecheon Stream, Sejong Center for the Performing Arts, several royal 4 The volunteer coordinator has worked for Hi Seoul Festival since 2003 and mainly works on programming and volunteer management. As a contracted staff position, the job runs for an 8-12month period, depended on the annual contract. 5 A report for the festival published by the festival organization

palaces, World Cup Park, as well as parks along the Han River. For over four years, Hi Seoul Festival has developed into the representative festival of the city and is now recognized as the largest-scale festival in Seoul. Table 2 offers a brief outline of the Hi Seoul Festival since 2003. Hi Seoul Festival 2006 was held in downtown areas around the City Hall from Friday, May 5 to Sunday, May 7 under the theme of “Seoulites in Seoul.” More than 50 events and programs were held at 13 different venues in downtown. For the planning and implementation of festival programs, one general director and five program directors were responsible for Hi Seoul Festival 2006. There were six administrative staff members, including four regular and two temporary employees, as well as four interns. Most of administrative staff members belong to the Seoul Foundation for Arts and Culture as full-time employees. The Hi Seoul Festival Organizing Committee was composed of ten people in 2006.
Table 2
Information of Hi Seoul Festival Organized by Hi Seoul Festival Citizens Group, Seoul Metropolitan Government Supervised by Seoul Foundation for Arts & Culture, Hi Seoul Festival Organization
Sponsored by Seoul Metropolitan Government, the Ministry of Culture and Tourism, Korea Tourism Organization, Cultural Heritage Administration
Event Locations Major downtown areas (Seoul Plaza, royal palaces, performing arts centers, Han River parks, etc.)
Website www.hiseoulfest.org Period 2003 2004 2005 2006 2007
May 24~25 (2 days)
May 1~9 (9 days)
May 1~5 (5 days)
May 4~7 (4 days)
April 27 ~May 6 (10 days)
VOLUNTEER MANAGEMENT OF THE HI SEOUL FESTIVAL Hi Seoul Festival could not exist without hundreds of volunteers who each give generously of their time and talent to make the event a success. Volunteers are called “Seoul Mania,” mostly university students, and serve as an inspiration to their fellow volunteers, citizens and visitors. The volunteer coordinator of Hi Seoul Festival insists that volunteers not only augment event staff, but also contribute to promote the festival to the public and attract Seoul citizens’ participation and interest. For the first year of the Hi Seoul Festival in 2003, more than one thousand volunteers were supplied by the Seoul City Volunteer Center. However, they were mostly untrained, largely unmanageable middle-age volunteers, and were considered not to have contributed substantially to the smooth operation of the festival. The next year, the Hi Seoul Festival organization tried to set up a volunteer program, and recruited and trained their own festival volunteers. All Hi Seoul Festival volunteers are asked to abide by the following; (1) attend orientation; (2) retain a kind attitude with a smile; (3) be mindful of time and their positions; (4) report their activities to the volunteer coordinator or team leader; (5) wear the official uniform and ID card; and (6) work under the supervision of the volunteer coordinator or team leader. In this section, the Hi Seoul Festival 2006 volunteer program, following the ideal process of an effective festival volunteer program model as suggested by Yi (2000) in Table 1, will be described. Planning The Hi Seoul Festival organization usually embarks on planning the volunteer program in the middle of March when the festival website is launched, as on-line promotion and volunteer

advertising are started at the same time. According to the model in Table 1, planning a volunteer program includes: (1) establishing goals and objectives for the volunteer program; (2) setting a timetable; (3) planning a budget for the volunteer program and fundraising; and (4) mapping job positions and developing position guides. The Hi Seoul Festival volunteer program had neither specific goals and objectives in 2006 nor a specifically allocated budget. According to the 2006 Hi Seoul Festival White Book, the schedule for the volunteer program was as follows:
Advertising for recruiting volunteers: March 6 – April 2, 2006 (4 weeks) Screening applicants and selecting volunteers: April 3 – April 16, 2006 Placing and Pre-service training volunteers: April 27, 2006 Supervising: May 4 – May 7, 2006 (Festival period) Recognition party: May 14, 2006
Pertaining to mapping job positions and developing position guides, although the volunteer coordinator had created job positions under each area, she was not able to devise them specifically because details of festival programs were not complete at the time of recruiting volunteers. Recruiting The phases of recruiting Hi Seoul Festival volunteers were as follows: (1) advertise Hi Seoul Festival volunteer opportunities through school bulletin boards and career centers of major universities in Seoul and through websites of major festivals and culture-related web communities; (2) receive volunteer application forms through the internet; (3) screen application forms; and (4) contact and place volunteers.
Compared with Table 1 “Ideal Process of an Effective Volunteer Program,” the Hi Seoul Festival organization recruits volunteers at the same time, regardless of the different types of festival volunteer workers. In fact, most volunteers for the Hi Seoul Festival are public service volunteers who provide their services directly to the public. Governance volunteers and behind-the-scenes volunteers are practically nil.
Since the degree of volunteer work and commitment expected was relatively high - full-time for four days - the Hi Seoul Festival organization targeted college students, who were available to work on weekdays and could participate in the volunteer workshop prior to the festival. Korean people’s general attitude toward volunteering was also anticipated to lead to a higher participation of students. Unlike American volunteering trends6, younger Korean people are more interested in volunteering because many Korean schools require volunteer activities as part of the curriculum. Additionally, internship programs are not as developed in Korea, therefore many college students may think of volunteering as an opportunity to learn new skills and gain knowledge for future jobs. In fact, the vast majority of volunteers who responded to the “Hi Seoul Festival 2006 Volunteer Motivation Survey” were, in fact, college students (96.7%), as seen in Table 3.
Table 3
Demographic Information of Respondents of “Hi Seoul Festival 2006 Volunteer Motivation Survey” Item Frequency Percent Item Frequency Percent
6 According to findings reports from the September 2006 Current Population Survey (CPS) by the Bureau of Labor Statistics of U.S. Department of Labor in the United States, the age group that volunteered the most in 2006 was 35-54 year olds (31.2%), compared to early 20s (17.8%). See http://www.bls.gov/news.release/volun.nr0.htm.

Female 127 68.6 Yes 97 52.4 Male 58 31.4 No 88 47.6
Gender
Total 185 100
Religious Affiliation
Total 185 100 19-21years 63 34.1 College students 179 96.7 22-27 years 122 65.9
Graduated from college
2 1.1 Age
Total 185 100 Grad student or higher
4 2.2
First time 82 44.3
Educational level
Total 185 100 2-3 times 78 42.2 4-7 times 20 10.8
Single 185 100
8 times- 5 2.7
Marital status
Total 185 100
Prior festival volunteer experience
Total 185 100 Friends/relatives 62 33.5 High 8 4.3 Middle 171 92.4
College career center
31 16.8
Low 6 3.3
Financial level
Total 185 100 Festival Homepage
13
7.0
Seoul 132 71.4 Ads at college 39 21.1 Other province near Seoul
50
27
Websites related to special events & festivals
31
16.8
Others 3 1.6 Others 9 4.8
Place of residence
Total 185 100
Introduction to/
involvement through
Total 185 100 Since the Hi Seoul Festival organization targeted college students as the largest segment, advertising through college career centers and ads placed at college campus (37.9%) were powerful marketing channels to recruit volunteers, as shown in Table 3. In addition, many volunteers first heard of Hi Seoul Festival volunteering opportunities through friends and relatives (33.5%), as peer groups tend to share information together.
In 2006, a total of 1,011 people applied for volunteer positions and 328 (3.1:1) were selected through a screening of application forms based on availability, interests and abilities, without an interview. Table 4 shows four different volunteer positions and their duties with the number of volunteer placements in each position.
Table 4 Volunteer Operations of the Hi Seoul Festival 2006
Position Number of Volunteers Duties Total 328
Program Supporter 304 On-Site Supporters for each Program Promotion/Marketing 9 Creating On-Line Newspaper (Articles, Photos, Movies) Language Service 8 Guiding Foreign Tourists (English, Japanese, Chinese) Office Supporter 7 Working at Festival Office
According to the volunteer motivation survey, respondents indicate the importance of each of the 28 items7 on a motivational scale influencing their decision to volunteer at the festival. Table 5 outlines the ten highest-ranking reasons for volunteering. The most important reason, with an
7 A recently developed motivational scale, the Special Event Volunteer Motivation Scale (SEVMS) by Farrell, Johnston, and Twynam, 1998

average response of 4.449 (on the 5-poiint Likert scale), was “I want to develop relationships with others.” Other high-ranking reasons related to gaining some practical experience (4.432), working with different people (4.378), and interacting with others (4.362), show that volunteers pursue personal development and new relationships and experiences through their volunteering activities. These egoistic motivations8 demonstrate the distinctive difference between festival volunteers and social volunteers. Nevertheless, in this survey, altruistic reasons such as contributing something back to the community (4.324) and feeling that volunteering create a better society (4.427), also ranked highly as top motivators.
The finding that developing relationships and gaining practical experience are the most important reasons to volunteer is significant to festival volunteer management in many ways. The Hi Seoul Festival coordinator should consider how to coordinate the work to help volunteers achieve what they want.
Table 5 Reasons for Volunteering for Hi Seoul Festival
Highest Ranking Reasons Mean I want to develop relationships with others. 4.449 I want to gain some practical experience. 4.432 I want to work with different people. 4.378 I want to interact with others. 4.362 I want to put something back into the community. 4.324 I want to broaden my horizons. 4.314 Volunteering creates a better society. 4.427 I can obtain an educational experience. 4.130 I want to learn new knowledge or skills. 4.016 Being a volunteer with Hi Seoul Festival is considered prestigious. 3.962
Training A week before the start of the 2006 Hi Seoul Festival, all volunteers were requested to attend an orientation session. When volunteers arrived, they were asked to sign up and register, received the volunteer’s handbook and confirmed their volunteering position (Table 6). This orientation session consisted of two sections. In the first section, the festival organization introduced Hi Seoul Festival’s organizational structure, programs and staff through visual materials. Then, the volunteer coordinator provided general information about the volunteer program, using the volunteer handbook. In the second section, volunteers met their supervisory staff - mostly program directors - who would supervise them each committee and other volunteers as they worked together. Official training took place only once, but volunteers for the “Tug of War” program received additional training on a subsequent day.
Although training period was short, volunteers received new directions and announcements from the festival organization and were able to communicate with the volunteer coordinator and other staff through a volunteer web community (http://club.cyworld.com/ hiseoulmania2006). As most volunteers are young and part of a generation highly familiar with IT (Information Technology), utilizing the web was the best way to advertise, train, supervise and evaluate volunteers. The web community also provided connections to previous Hi Seoul Festival 2005
8 Volunteer motivations is generally reflected two distinct dimensions: altruistic motivations which relate to a desire to help others, and egoistic motivations involving specific rewards to the individual (Cnaan & Goldberg-Glen, 1991).

volunteers, helping to retain former volunteers and maintain continuity, as well as solicit future applicants. Continual upkeep and constant activity of this volunteer web community and the Hi Seoul Festival blog (http://blog.naver.com/hiseoulfest) served the goal of securing more “Seoul Manias” for the festival.
Table 6 Hi Seoul Festival 2006 Volunteer Placement
Program Period Location Duties Number of volunteers
Main Events May 4-May 7 Program support (am) Program support (pm)
16 30
Information Booth
May 4-May 7 English service Chinese service Japanese service
2 2 2
Promotion Booth
May 5-May 7
Seoul Plaza
Souvenir Sales 4
Tug-of-War May 7 Street Program support 120 Castle Tour May 6 Inwang(Mt.) Program support 46 Amateur Programs
May 6-May 7 Cheonggyecheon Stream Center for Performing Arts
Program support 14
Flea Market May 5-May 7 Deoksu Palace Program support 30 Magic Fest May 4-May 7 Changdong Theater Program support 12 Promotion/ Marketing
April 27-May 7 All areas Articles Photos Movie
4 4 1
Office Support April 27-May 7 All areas Office work 7 Monitoring May 4-May 7 All areas Monitoring support 34 Total 328
Supervising The supervision of volunteers was placed upon each program director and staff members. The program director or staff checked the volunteers who were present, and reported results to the volunteer coordinator. Volunteers who could not participate in the festival were obliged to contact the volunteer coordinator in advance. If prior notice of absence was not given or their volunteer performance was under than 70%, a volunteer certificate was not granted. Each evening, program directors and staff informed the volunteer coordinator of their volunteers’ performance, and discussed the next day’s schedule and any change at a daily staff meeting. Because the Hi Seoul Festival includes various outdoor programs in different venues, changes occurred often. Given different daily additional programs and an uneven distribution of the volunteer force, the volunteer coordinator had to ask some volunteers to take on different job responsibilities. At times, volunteers had to work at new, different jobs with very little instruction.
Recognition In the planning phase, the Hi Seoul Festival organization prepared the following recognition items and benefits to volunteers: festival T-shirts, one loop-tie with an ID card, meals, a volunteer certificate, insurance and a recognition party. The festival T-shirts were provided at the orientation session. The ID cards and meal tickets were offered at each program venue by the program director or staff. The volunteer certificates were delivered after the festival by mail. One week after the festival, volunteers (about 50% of all participants) and staff gathered at the recognition party. Apart from dinner and casual drinking, the party did not have any other

special programs planned. Retention Because festival volunteering opportunities are not common in Seoul, to become a volunteer of Hi Seoul Festival is fairly competitive. In fact, the volunteer coordinator had no concerns about securing enough volunteer workers. However, as the Hi Seoul Festival grows in size and breadth, the volunteer coordinator has felt the need for more experienced and better trained volunteers who are more dedicated to the festival. While the volunteer coordinator wished to keep qualified volunteers by communicating through the web community, it was difficult to retain a good volunteer workforce due to her non-permanent position in the organization as contract staff. Evaluation of a the Volunteer Program The Hi Seoul Festival organization did not prepare any special tools for evaluating the volunteer program. They simply gathered opinions from program directors, staff members, including the volunteer coordinator, and approximately ten volunteers who related their volunteering experiences. Volunteer participants’ afterthoughts on the volunteers’ web community also were assessed. DISCUSSION, SUGGESTIONS & CONCLUSION In general, the Hi Seoul Festival volunteer program has an appropriate timetable for volunteer management within the environment of festival operations and proper job positions allocated for volunteers, although the organization needs to develop more detailed position guides. In the planning phase, the Hi Seoul Festival organization should specify and detail position guides in order to implement more effective training programs, supervise volunteers’ activities and properly evaluate their performance. Compared with the ideal process of an effective volunteer program in Table 1, the Hi Seoul Festival volunteer program did not have specific goals and objectives as standards from which to evaluate its volunteer program. By comparing goals and objectives with results from the volunteer program, it will be much easier for the Hi Seoul Festival organization to evaluate its volunteer program. This paper emphasizes that a volunteer coordinator should understand the motivations for volunteering in order to retain current volunteers. Based on this understanding, the volunteer coordinator should check whether job positions and responsibilities match volunteers’ needs, and whether training programs are helpful for volunteers in performing their duties. The organization should also develop more careful strategies and methods to place volunteers, train them well, and supervise them, especially considering the fact that most of the Hi Seoul Festival volunteers are college students, with the primary motivation of developing relationships and gaining work experience.
From the perspective of recruiting and positioning, it may be easier and more expeditious for the Hi Seoul Festival as an organization to manage a group of volunteers composed of one dominant type (students and the young) rather than a more diverse group. However, it is difficult to retain college students as long-lasting volunteers, because college students tend to stop participating in volunteering activities, when they find jobs after their graduation. Therefore, in order to ultimately retain more long-term volunteers and cultivate stronger relationships with the community, the Hi Seoul Festival organization should consider reaching out to other different groups of volunteers as well. However, the intensive work commitment may limit volunteering for those who are not students. Therefore, perhaps only one volunteer work term could suffice, especially for those such as housewives and full-time employees, to widen and diversify participation in the Hi Seoul Festival volunteer program. In addition, the Hi Seoul Festival could deploy former volunteers as volunteer team leaders or as the instructors in the orientation program in order to retain experienced volunteers. This strategy could be

especially valuable in retaining experienced volunteers and responding to more experienced persons’ challenges and changing needs. Regarding the evaluation the volunteer program, the Hi Seoul Festival volunteer program did not develop clear evaluation methods and checklists. Since the Hi Seoul Festival organization did not employ sufficient staff to implement this kind of evaluation, and the volunteer coordinator had more duties beyond managing volunteers, it was difficult for the Hi Seoul Festival to perform a well-planned evaluation process. The Hi Seoul Festival may also need to conduct a volunteer satisfaction survey for a deeper understanding of their volunteers. This could be helpful in discovering the reasons why some volunteers want to leave the volunteer program during the festival working period, and why other volunteers wish to stay on for the duration of the festival. In addition, during the working period, supervisory staff or other staff should respond to volunteers’ needs promptly, give feedback to volunteers, recognize their performance in a timely way, and respect volunteers as partners. This study suggests that the Hi Seoul Festival organization should fully appreciate the importance of an effective volunteer program and the position and work of a volunteer coordinator. It seems that the organization does not fully realize the value of volunteer management because the current volunteer coordinator is overburdened with job responsibilities and lacks a properly allocated budget for the volunteer program. The organization needs a well-trained volunteer coordinator who can develop a volunteer program and manage the volunteer system among program directors, other staff members and volunteer participants. Moreover, the development of an internship program could be another way to train behind-the-scenes (BTS) volunteers. One possible limitation of this study is that the ideal model of festival volunteer management used in this study (Yi, 2000) was drawn from models of volunteer management developed in the United States, so it may be difficult to apply this model to a Korean festival volunteer program. In Korea, volunteering is not a dominant and concerted social activity as it is in the US, and Korean people do not have as long a tradition of volunteering as American people. The origin and growth of the Hi Seoul Festival, however, is similar to an American festival in many ways. Therefore, the model could be aptly applied to the Hi Seoul Festival despite these social and cultural differences in volunteerism.
REFERENCES Churchard, K. (Ed.) (1997). Ch 10. Effective Volunteer Management, Managing Volunteers, Port Angeles, Washington: International Festivals and Events Association (IFEA),
57-62. Clary, E., Snyder, M., & Ridge, R. (1992). Volunteers’ Motivations: A Functional Strategy for
the Recruitment, Placement, and Retention of Volunteers. Nonprofit Management & Leadership, 2(4), 333-350
Cnaan, R. A., & Goldberg-Glen, R. R. (1991). Measuring Motivation to Volunteer in Human Services, Journal of Applied Behavioral Science, 27(3), 269-285. Current Population Survey. (2006). http://www.bls.gov/news.release/volun.nr0.htm Cuskelly, G., & Boag, A. (2001). Organizational Commitment as a Predictor of Committee
Member Turnover among Volunteer Sport Administrators: Results of a Time-Lagged Study, Sport Management Review, 4, 65-86
Cuskelly, G., Taylor, T., Hoye, R., & Darcy, S. (2006). Volunteer Management Practices and Volunteer Retention: A Human Resource Management Approach, Sport Management Review, 9, 141-163
Farrell, J., Johnston, M. E., & Twynam, G. D. (1998). Volunteer Motivation, Satisfaction, and Management at an Elite Sporting Competition, Journal of Sport Management, 12(4), 288-300.

Getz, D. (1997). Event Management & Event Tourism, Cognizant Communication Corporation. Goldblatt, J. J., & Supovitz, F. (1999). Dollars and Events: How to Succeed in the Special
Events Business, New York: John Wiley & Sons, Inc. Hastings, J. C., & Cole, K. M. (1997). Volunteer Development Programs: How to Keep a
Skilled Interested Volunteers, Managing Volunteer, Ed. Schmader, S. W., et al. Port Angeles, Washington: International Festivals and Events Association (IFEA), 27-32.
Hi Seoul Festival Blog (http://blog.naver.com/hiseoulfest) Hi Seoul Festival Official Website (www.hiseoulfest.org) Hi Seoul Festival Volunteer Web Community (http://club.cyworld.com/hiseoulmania2006) Johnston, M. E., Twynam, G. D., & Farrell, J. M. (1999-2000). Motivation and Satisfaction of
Event Volunteers for a Major Youth Organization, Leisure/Loisir, 24(1-2), 161-177. Ryan, C., & Bates, C. (1995). A Rose by Any Other Name: The Motivations of Those Opening
Their Gardens for a Festival. Festival Management & Event Tourism, 3, 59-71. Saleh, F., & Wood. C. (1998). Motives of Volunteers in Multicultural Events: The Case of
Saskatoon Folkfest, Festival Management & Event Tourism, 5, 59-70. Schmader, S. W. (1997). Introduction, Managing Volunteers, Ed. Schmader, S. W., et al. Port
Angeles, Washington: International Festivals and Events Association (IFEA), 5. Seoul Foundation for Arts & Culture. (2006). Hi Seoul Festival 2006 White Book. Slaughter, L. (2002). Motivation of long term volunteers at events, Events and Place Marketing,
Australian Centre Event Management, 232-252 Twyford, S. (Ed.) (1990). Personal Issues and Trends, Event Trends, Port Angeles, Washington: International Festivals and Events Association (IFEA). Williams, P.W., Dossa, K. A., & Tompkins, L. (1995). Volunteerism and Special Event
Management: A Case Study of Whistler’s Men’s World Cup of Skiing. Festival Management & Event Tourism, 3, 83-95.
Yi, J. (2000). Developing an Effective Festival Volunteer Program: A Case Study of the Puppet Festival Chunchon Volunteer Program, Master Thesis, University of Illinois at Springfield.
Interview Park, So-Hyeon (Volunteer coordinator & staff of Hi Seoul Festival since 2003). Personal
Interviews, March 15, 2007.

Fourth International Event Research Conference Re-evaluating the City/Town: Events as a Catalyst for Change
TELEVISED EVENTS AS AGENTS OF ENVIRONMENTAL INFORMATION IN ORDER TO ENFORCE WOMEN PARTICIPATION IN THE ENVIRONMENTAL-DECISION MAKING
PROCESS: THE GREEN OSCARS 2007
Constantina Skanavis Department of Environmental Studies
University of the Aegean, Greece [email protected]
Maria Sakellari
Department of Environmental Studies University of the Aegean, Greece
ABSTRACT Environmental Education is particularly important as it can educate and increase environmental awareness of local populations. Citizen participation in the environmental decision-making process constitutes a fundamental goal of Environmental Education. Women report stronger environmental attitudes and behaviors than men and the dissemination of environmental information is needed in order to encourage their participation in the environmental decision making process. The 79th Annual Academy Awards, a major televised event with a majority of female viewers, first-ever greening initiative reached millions of viewers across the world and served as an agent of environmental information in order to enforce women’s place in sustainable issues. Keywords: environmental education, citizen participation, women, televised event, academy awards
INTRODUCTION The concept of sustainable development promotes social justice and gender equity and women do report stronger environmental concern and attitudes than men (Van Liere and Dunlap 1980, Davidson and Freudenberg 1996, Tindall et al., 2003). Agenda 21 (1992) has emphasized the need for women to be involved in setting the environmental sustainability agenda (Buckingham-Hatfield, 1999): (a) Women have particular environmental concerns and perspectives based on their social and biological roles. (b) As a group of people, women are disadvantaged and excluded from decision-making compared with men as a group. The World Summit on Sustainable Development (Johannesburg, 2002), recognize women as one of nine major civil groups, whose participation is required for effective implementation of the sustainable development agenda. Events are related to leisure, business, and tourism, target both residents and visitors and event management is been argued to adopt strategies to take into control the environmental impacts (Hall, 1992, King and Jago, 2003). In addition, mass media influence environmental behaviors, attitudes and perceptions of the public (Tsampoukou-Skanavis, 2004). So, a strong indication exists that environmentally themed, televised events may influence environmental perceptions of the viewers. The Oscars are an example of an entertainment, televised event that most of its viewers are women and recently adopted an environment-friendly telecast operation. This study will examine the

hypothesis of a big, televised event as Oscars, which is mostly watched by women to be a vehicle of enforcement of women’s role and participation in the environmental decision-making process. In this framework, the role of Environmental Education towards citizen participation, the relationship between women and environmentalism and the importance of the dissemination of environmental information through major, entertainment, televised events, like the Oscars, will be examined. ENVIRONMENTAL EDUCATION AND CITIZEN PARTICIPATION Environmental Education (EE) was developed in the decades of ’60s-’70s, during the evolution of the environmental movement and it was considered as one of the most effective measures for environmental problems. EE questioned the dominant anthropocentric system of values, focused on education of all citizens and it was aiming in fundamental changes in environmental attitudes, behaviors and values of citizens of all age groups. The 1977 Tbilisi Intergovernmental Conference on EE objectives (awareness, sensitivity, attitude, skills, and participation) serves as major guidance for working on building an environmentally effective human behavior. The basic principles of EE mandate that EE (Skanavis and Sakellari, 2005): (a) should be a life long process and accessible to people of all age groups and cultural backgrounds. It should be extended well beyond school systems covered by means of non-formal and informal educational procedures, (b) has to be interdisciplinary, employing concepts from natural, social, political sciences and economics, (c) should be as holistic as possible, emphasizing the interdependence of humans and nature, (d) should empower students with the necessary tools to critically analyse environmental issues and exercise the right to choose the best-case scenario, (e) should invest in the technological based instruction, which allows through simulations from computer based programs, the analysis of environmental conditions, prediction of side effects and understanding of the importance of our active participation in the environmental decision making process.
EE programs focus on developing programs, which will enable citizens to behave in environmentally desirable ways. All these educational attempts focus into promoting responsible citizenship behavior-arming citizens with the appropriate skills for critical thinking and with the ability to actively participate in the environmental decision-making processes. EE has mainly been established in the formal education; however, its importance has been recognized in the forms of non-formal and informal education. Environmental concern and the resulting environmentally responsible behavior are affected by a complex interaction of attitudes, beliefs and socio-demographic variables. In an effort to detect, which characteristics make citizens participate in the protection and restoration of the environment, several researchers have attempted to develop models and techniques for assessing responsible environmental behavior (Hines et al., 1986, Hungerford and Volk, 1990) and have shown how a behavioral manipulation of many variables can result in people’s participation in desirable environmental behaviors. Michaella Zint (2002) assessed three1 social psychology’s attitude-behavior theories’ ability to predict science education teachers’ intention to act on environmental issues (Zint, 2002). Theory of Planned Behaviour, formulated by Icec Ajzen in 1991, focusing on past environmental behavior, provided the best attitude-behaviour model for predicting science teachers’ intention to act. According to the Theory of Planned Behaviour, the human behaviour originates from the intention of the individual to behave in a certain way. As long as his intention to be associated with a certain behaviour is strong, so much more likely is to act this way (Ajzen, 1991). Modifying individuals’ intention to act brings behaviour change (Zint, 2002). According to 1 Theory of Reasoned Action (Fishbein and Ajzen 1975, Ajzen and Fishbein 1980, Fishbein 1980), Theory of Planned Behavior (Ajzen, 1985, 1991) and Theory of Trying (Bagozzi and Warshaw, 1990)

Sia (1984), Sivek (1989) and Marcinkowski (1989) there are five predictors of Responsible Environmental Behaviour: individual and group locus of control, knowledge of and skills in using action strategies and environmental sensitivity. Their findings were supported by Lierman (1996), Hsu (1997) and were included in ‘’Guidelines for Excellence” of Νational American Association of Environmental Education (ΝΑAΕΕ), (Marcinkowski, 1998). EE suggests that people can live in harmony with nature and act in a fair way with each other and that they can make decisions based on interest and care for the future generations. EE aims in a democratic society, where active, environmentally literate citizens participate in a responsible way (NAAEE, 1996). EE prompts citizens to realize the connection between the various policies, their way of life and that of future generations, and the importance of active participation in the political process constituting them catalysts for political change. As active participants, they can recognize, support, educate and raise local issues at national policy planning (Scriabine, 1996). Going back to the international conferences on EE, environmental participation is presented intensely: In 1975, the declaration of the conference on EE, organized in Belgrade, proclaimed that one of the EE objectives is:
Participation: EE helps individuals and social groups to develop a sense of responsibility towards the environment and understand the need for action for the resolution of environmental problems (UNESCO-UNEP, 1976).
In 1977, the Tbilisi Declaration noted that citizen participation continues to be the main objective of EE providing social groups and citizens with the possibility to participate actively at all levels towards the resolution of environmental problems (UNESCO, 1978). In 1987, in Moscow it was agreed that EE should simultaneously attempt to increase the awareness, transmit information, disseminate knowledge, develop customs and skills, promote values, and provide criteria and directives for decision-making and resolution of environmental problems (UNESCO-UNEP, 1987). In 1992, at Rio Conference it was formulated that “the environmental issues are better resolved with the participation of all interested citizens, in a relative level” and the critical role of formal and non formal education was highlighted for the effective public participation in the environmental decision-making (UNCED, 1992). In the World Summit of United Nations for the Sustainable Development, that was organized in Johannesburg in 2002 it was characteristically reported that sustainable development requires a long-term prospect and wide participation in policy planning, in the decision-making and in their application at all levels (UN, 2002). Therefore, citizen participation constitutes a fundamental goal of EE. Citizen participation is usually defined as the involvement of people, outside the official governmental mechanism, in the decision-making process process (Fiorino, 1996, Fulop, 1999, Siouti, 1998, Brohman, 1996, Osler, 1997) with any possible intervention in the processes of decision-making by the Administration, from juridical affairs up to letters of protest, mobilisations of organised groups or the direct action of citizens (Fiorino, 1996). The complexity of environmental problems has elected the process and the methods of citizen participation as important tools for the solution of environmental problems (Beierle, 1999, Monroe et al, 2000).

However, although science and available technologies for the solution of environmental problems have presented important progress, citizen participation in the decisions that concern environmental issues is limited (Fiorino, 1996).
According to Beierle (1998, 1999) the outcome of citizen participation is reported in the final main decisions that have been taken and evaluated based on how citizen’s participation has achieved the social goals, which surpass the immediate interests of the groups that are involved in the process of decision-making (Beirle, 1998, 1999, Beirle and Cayford, 1999, 2001, 2002, Davies, 1998). Social goals (Beirle, 1998, 1999) as education and information of public, incorporation of values of citizens in the process of decision-making, improvement of essential quality of decisions, strengthening confidence in the institutions, alleviation of conflicts and cost-effectiveness, can lead to the improvement of public programs of participation, support the evaluation of innovative methods, and promote the theoretical comprehension of citizen participation. The dissemination of information facilitates the collective knowledge thus; the local societies comprehend better controversial issues and are able to resolve the problems that they face (Comfort, 1999). When all the members of a local society are allocated the essential tools and skills so that they can collect the information that they need in order to work towards their preferred change, their role in the decision-making process is strengthened (Chopyak, 2001). One of the ways to promote citizen participation in environmental decision making process is to understand the gender differences that exist in environmentalism (Dietz, Kalof and Stern, 2002). WOMEN AND ENVIRONMENTALISM Past studies have consistently demonstrated a higher level of environmental concern among women (Blocker and Eckberg, 1989, Brody, 1984, McStay and Dunlap, 1983, Mohai, 1992, Ozanne et al., 1999, Stern et al., 1993, Stout-Weigand and Trent, 1983), particularly in terms of specific issues where safety is a concern and where issues are local, rather than global, in nature (Davidson and Freudenburg, 1996).
Numerous studies have examined the relationship between demographic variables and environmentally responsible behavior. Two recognized reviews of gender difference in environmental attitudes and behaviors conducted by Hines et al., (1986-87) and Van Liere and Dunlap, (1980) concluded that research on the relationship between these variables is meager and inconsistent. Zelezny et al., (2000) presented a review of literature on gender difference and environmentalism. This review of recent research, from 1988 to 1998, on gender differences in environmental attitudes and behaviors found that, contrary to past inconsistencies, a clearer picture has emerged: women report stronger environmental attitudes and behaviors than men. Explanations for gender differences in environmentalism were examined by Zelezny et al., (2000). It was found that compared to males, females had higher levels of socialization to be other oriented and socially responsible. In general, females were consistently more likely than males to be empathetic toward a conceptualized other and reported a significantly stronger ethic of care to take responsibility for ameliorating environmental problems (Zelezny and Bailey, 2006). Gilligan (1982) found that women frame problems and design solutions in a different way. Zelezny and Bailey (2006) contend that women, given their strong ethic of care and ecocentric values, may enlighten environmental problem solving that has been traditionally masculine in nature. In addition, because females are socialized to be more caring toward others and the environment, and more interdependent and collectivistic, they are more likely to be adept at teamwork (Zelezny and Bailey, 2006).

Gender differences in ‘‘political engagement’’— knowledge, interest, and perceived efficacy in politics — in conjunction with gender differences in access to resources may explain gender differences in political citizen participation (Schlozman et al., 1995, Verba et al., 1997). When women do participate, their participation may be motivated differently than men’s. Women may be more aware of their own impacts on the environment and consequently feel motivated by responsibility to help address issues resulting from this impact (Zelezny et al., 2000). Women’s concern for the environment may be a reflection of their intent to ‘‘protect’’ the public (Shapiro and Mahajan, 1986). The suggested motivations of ‘‘care’’ and ‘‘protection’’ are ideas echoed in many studies of gender and natural resource issues (Blocker and Eckberg, 1989, Brody, 1984, Kellert and Berry, 1987, Stern et al., 1993). Anthony et al., (2004) compared the motivations and preferences of men and women toward citizen participation in wildlife-related decisions and explored gender differences in motivations for participation, preferred process characteristics, and criteria used to evaluate process success. According to their findings, men’s participation was more often motivated by a request from a wildlife-related entity, while women placed more importance on processes having unbiased facilitation and the opportunity for open exchange of ideas and information with the agency (Anthony et al., 2004). ENVIRONMENTAL INFORMATION THROUGH TELEVISED EVENTS: THE GREEN OSCARS 2007 According to Getz (1997) events constitute one of the most exciting and fastest growing forms of leisure, business, and tourism-related phenomena. Goldblatt (2002) introduces events as planned culture, sport, political, and business occasions: from mega-events like Olympics and World fairs to community festivals; from programs of events at parks and attractions to visits by dignitaries and intergovernmental assembles; from small meetings and parties to huge conventions and competitions. The event organisers do not take into account the social and environmental impact in to consideration. It is argued that there is a clear need to adopt a holistic approach (Raj, 2003). The impacts of events can greatly affect the quality of life of the local residents. Therefore, it is been argued to adopt strategies to take into control the social and environmental impacts of festivals into analysis when carrying out economic impact of the each individual event. The event organisers only take into consideration the economic implications and ignore the resident perceptions, which provide important non-economic dimension for gauging how events benefit or impinge on the host community (Hall, 1992). The festivals have a number of impacts arose on the host city, ranging from cultural, economic, social and environmental. Festivals have both positive and negative impacts on their host cities, but emphasis is often focused on the economic analysis (Raj, 2003). Hall (1992) suggests that the ability of major events perceived to attract economic benefits of events often provide the official justification for the hosting events. Economic analysis of events provides one aspect of why events are held and the effects that they have on a region. However, while many of the economics impacts of events are quite tangible many of the social are not. Spectacles and special events offer an opportunity to target both residents and visitors in a complementary manner (King and Jago, 2003). A special event may be defined as a one-time or infrequently occurring event of limited duration that provides consumers with a leisure and social opportunity beyond their everyday experience (Jago and Shaw, 1998). The number of special events appears to have been increasing and continues to do so (Getz 1997, Getz and Wicks 1993, Janiskee 1994). Special events can be important in attracting tourists to the host city (Hede and Jago, 2005),

they also provide an important recreation activity for local citizens and are effective in drawing locals back into the city precinct (King and Jago, 2003). Popular televised spectacles generate social capital, bonding people together by offering them the chance of a common televised experience that can be used to generate conversation and ultimately longer-lasting relationships (Fleischer and Felsenstein, 2002). Conversation may involve environmental issues if the televised spectacles include dissemination of environmental information. Televised events offer a unique opportunity to broadcast social messages to the public. Mass media can influence personal behaviors, attitudes and perceptions, constitute the main source of environmental information and an educational tool of informal Environmental Education (Skanavis and Sakellari, 2007). Mass media influence the environmental perception and actions of the public (CEIA, 2000, Nitz, 2000) and raise the environmental awareness of the audience (Tsampoukou-Skanavis, 2004). Dissemination of environmental information through the mass media can lead to a social change with regards to the environmental awareness, attitude and participation skills of the audience (Skanavis and Sakellari, 2007). However, no significant research exist that correlates televised events, environmental issues and environmental education. In general, research in event management, special events and environmental education is limited. Oscar awards are an annual, major and famous televised event held in Los Angeles, California since 1929 and organized by Academy of Motion Picture Arts and Sciences. It is one-evening event, held in an enclosed theatre and not generally open to the public. While the event is conducted live in front of an invited audience, its main exposure is through the massive television coverage that it generates. 1n 1930, the Academy permitted radio broadcasting of the event. Television added a new dimension in 1953, enabling millions throughout the United States and Canada to watch the ceremony. Telecasting in color was begun in 1966, bringing home viewers the full sparkle and glamour of the event. Since 1969, the Oscar awards program has been telecast throughout the world, by the mid-1990s reaching audience in over 100 countries. Every year, hundreds of millions of movie funs glue themselves to their television sets to learn who will receive the highest honor in filmmaking. According to the Nielsen Company’s Guide to the Academy Awards (2007), US viewers who tune into the televised broadcast of the Oscars are more likely to be married and female, 35% of US Academy Award watchers typically watch national/network news, 83% of US Academy Award watchers are registered to vote and 76% always vote in presidential elections. The Natural Resources Defense Council (NRDC) partner with the producers of the 79th Annual Academy Awards to significantly reduce the impact the telecast and related events had on the environment, setting a high profile example for an estimated 40 million viewers at a time when global warming, soaring energy demand and threats to forests and other landscapes are the focus of rising global attention (NRDC, 2007). The effort included energy audit of Kodak Theatre, offset carbon emissions from pre-show, red-carpet event, Oscar telecast, and Governor's Ball, use of ecologically superior paper for telecast and non-telecast event materials, hybrid vehicle transportation provided for presenters and staff, recycling system instituted for event waste, reusable service materials and accessories, post-consumer tissue products, and biodegradable dishware, organic and environmentally-friendly food served at the Governor's Ball.

During one segment, actor Leonardo DiCaprio and former US Vice President Al Gore, whose film "An Inconvenient Truth" went on to win Best Documentary Feature, announced that 2007's ceremony was "green." The Oscars raised awareness of the environment through its website (www.oscars.com), where on “GoGreen” page numerous, everyday activities where listed in order to help the audience to save energy on road and at home, resources at home and work, to conserve water and to support organic and sustainable farming.
The Academy Award's first-ever greening initiative reached millions of viewers across the world with a message that cleaner, more sensible energy choices and a simple commitment to environmental stewardship. The event raised the specific issue of environmental costs and served as a vehicle for community information towards the environmental protection. After the Olympic Games of Sydney 2000 and Athens 2004, big, sport and televised events that incorporated environmental operations venues management and environmental briefing of the spectators, the Oscars 2007 are the next major, famous, entertainment, televised event introducing the audience in the environmental debate. The fact that most of the Oscars viewers are female, informed and involved in politics, may further suggest that this particular televised event may contribute to women’s participation in the environmental decision making process. Consequently, an evaluation of the impact of Green Oscars to the environmental attitudes, values and perceptions of female and male viewers is needed. CONCLUSION Problems of environmental decision-making are intrinsically complex and often involve multiple attributes, the relative importance of which needs to be determined. In order to approach issue resolution in an informed and responsible manner, the learner must be able to identify the ecological consequences related to the issues and their proposed solutions (Volk, 1993). Gender equity and women’s needs must be integrated in the environmental decision making process. Environmental education can constitute a dynamic means of stimulating environmental behavior. This study contributes to an understanding the significance of large scale, televised events as agents of environmental information in order to enforce women place in sustainable issues. Future research is important to look more closely at gender differences as they interact with other demographic factors as age and education level in order to measure the impact of environmentally themed, televised event on the environmental perceptions of the audience. The results of such research are essential towards the development of successful Environmental Education programs for women and promote their participation in environmental decision making process. REFERENCES Ajzen, I. (1991) ‘The Theory of Planned Behavior’ Organizational Behavior and Human Decision
Processes, 50, 179-211 Anthony, M. L., Knuth, B. A., & Lauber, T. B., (2004) ‘Gender and Citizen Participation in
Wildlife Management Decision Making’ Society and Natural Resources, 17, 395-411 Beierle, T.C., (1998). Public Participation in Environmental Decisions: An Evaluation Framework
Using Social Goals, RESOURCES FOR THE FUTURE, Discussion Paper, 99-106 Beirle, T.C., (1999) Evaluating Public Participation in Environmental Decisionmaking, Resources
For The Future Beierle, T.C. & Cayford, J.C. (1999) The Determinants of Successful Public Participation in
Environmental Decisionmaking, Resources For The Future Beierle, T.C. & Cayford, J.C., (2001) Evaluating Dispute Resolution as an Approach to Public
Participation, Resources For The Future

Beierle, T.C. & Cayford, J.C. (2002) Democracy in Practice: Public Participation in Environmental Decisions, RESOURCES FOR THE FUTURE
Blocker, T. J. & Eckberg, D. L. (1989) ‘Environmental issues as women’s issues: General concerns and local hazards’ Social Science Quarterly, 70(3), 586–593
Brohman, J. (1996) Rethinking the Theory and Practice of Development, Blackwell Publishers Brody, C. J. (1984) Sex differences in support for nuclear power, Social Forces, 63, 209–228. Buckingham-Hatfield, S. (1999) ‘Gendering Agenda 21: Women’s Involvement in Setting the
Environmental Agenda’ Journal of Environmental Policy & Planning, 1, 121–132 Centre of Environmental Information Studies (CEIA) - European Environmental Agency, (2000), A
NEW MODEL OF ENVIRONMENTAL COMMUNICATION FOR EUROPE FROM CONSUMPTION TO USE OF INFORMATION, Expert Corner Report, http://binary.eea.eu.int/e/envcom.pdf
Comfort L. K., (1999) Shared Risk: Complex Systems in Seismic Response, Pergamon, Amsterdam Chopyak J., (2001) ‘Citizen Participation and Democracy: Examples in Science and Technology’
National Civic Review, 90(4) Davidson, D. J. & Freudenburg W.R. (1996) ‘Gender and environmental risk concerns: A review
and analysis of available research’ Environment and Behavior, 28(3), 302–339. Davies, J. C. (1998), Public Participation in Environmental Decision-Making and the Federal
Advisory Committee Act, Resources For The Future Dietz, T., Kalof L., Stern P.C. (2004) ‘Gender, Values and Environmentalism, Social Science
Quarterly, 83(1), 354-364 Fiorino, D. J. (1996) ‘Environmental policy and the participation gap’ In: Lafferty W. M.,
Meadowcroft J., (Eds), Democracy and the Environment, Problems and Prospects, Edward Elgar, Cheltenham UK, Lyme, US
Fleischer A. & Felsenstein D., (2002) ‘Cost-Benefit Analysis Using Economic Surpluses: A Case Study of a Televised Event’ Journal of Cultural Economics, 26, 139–156,
Fulop, S. (2002) WHY DO WE WANT PUBLIC PARTICIPATION IN ENVIRONMENTAL DECISION-MAKING?, Fifth Guta Conference, Budapest http://www.osi.hu/infoprogram/commworkshop Presentations/PPCIKK.htm
Getz, D. (1997) Event Management and Event Tourism, New York, Cognizant Communications Corporation
Getz, D. & Wicks, B. (1993) ‘Editorial’ Festival Management & Event Tourism, 1 (1), 1– 3. Gilligan, C., (1982) In a different voice. Cambridge, MA: Harvard University Press Goldblatt, J. (2002) Special Events Best Practices in Modern Event Management, New York,
International Thompson Publishing Company Hall, C. (1992), Hallmark Tourist Events: Impacts, Management and Planning, Chichester: John
Wiley and Sond Ltd Hede, A. & Jago L. (2005) ‘Perceptions of the host destination as a result of attendance at a special
event: a post consumption analysis’ International Journal of Event Management Research, 1(1), 1-12
Hines, J., Hungerford, H. & Tomera, A., (1986/7) ‘Analysis and Synthesis of Research on Responsible Environmental Behavior: A Meta-Analysis’ The Journal of Environmental Education, 18(2), 1-8
Hungerford, H. & Volk, T. (1990) ‘Changing Learner Behavior through Environmental Education, Journal of Environmental Education, 21(3), 8-21
Jago, L. & Shaw, R.N. (1998) ‘Special events: a conceptual and differential framework’ Festival Management & Event Tourism, 5 (1/2), 21 – 32.
Janiskee, R. (1994) ‘Some macroscale growth trends in America’s community festival industry’ Festival Management and Event Tourism, 2 (1), 10 – 14.

Kellert, S. R. & Berry, J. K. (1987) ‘Attitudes, knowledge, and behaviors toward wildlife as affected by gender’ Wildlife Society Bulletin, 15, 363–371.
King, B.E.M. & Jago, L.K. (2003) ‘A tale of two cities: urban tourism development and major events in Australia’ Proceedings of TTRA European Conference, Glasgow, Scotland
Marcinkowski, T. (1998) ‘Predictors of Responsible Environmental Behavior: A Review of Three Dissertation Studies’ In: Essential Readings in Environmental Education, The Center for Instruction, Staff Development and Evaluation. The Center for Instruction, Staff Development and Evaluation
Marcinkowski, T. J. (1989) An analysis of correlates and predictors of responsible environmental behaviour, Unpublished doctoral dissertation, Southern Illinois University, Carbondale.
McStay, J. & Dunlap, R. (1983) ‘Male-female differences in concern for environmental quality, International Journal of Women’s Studies, 6, 291–301
Mohai, P. (1992) ‘Men, women, and the environment: An examination of the gender gap in environmental concern and activism’ Society National Resources, 5, 1–19.
Monroe, M. C., Day, B. A. & Grieser, M. (2000) ‘GreenCOM Weaves Four Strands’ Chapter 1. In: Day, B. A. and Monroe, C. M. (Eds), Environmental Education & Communication for a Sustainable World, GreenCom, http://www.usaid.gov/environment/greencom
ΝΑΑΕΕ, (1996) Environmental Education Materials: Guidelines for Excellence, Washington D.C.: North American Association for Environmental Education
Nitz, M. (2000) The Media as a Tool for Communication on the Environment and Sustainability, http://www.projekte.org/millenium/papers/paper7/index.html
NRDC, (2007) Natural Resources Defence Council “Greens” the Academy Awards, Press release (http://www.nrdc.org/media/2007/070225.asp) [8/3/2007]
Osler, A. (1997) The Contribution Of Community Action Programmes In The Fields Of Education, Training And Youth To The Development Of Citizenship With A European Dimension, Final Report to the European Commission, The University of Birmingham
Ozanne, L. K., Humphrey, C. R., & Smith, P. M., (1999) ‘Gender, environmentalism, and interest in forest certification: Mohai’s paradox revisited’ Society National Resources, 12, 613–622.
Raj, R., (2003) ‘The Impact of Festivals on Cultural Tourism’ Proceedings of the 2nd DeHaan Tourism Management Conference “Developing Cultural Tourism”, Nottingham, December 16th
Schlozman, K. L., Burns, N., Verba, S. & Donahue, J. (1995) ‘Gender and citizen participation: Is there a different voice?’ American Journal of Political Science, 39(2), 267–293.
Scriabine, R. (1996). Putting People into Policy: The Role of Environmental Education and Communication, GreenCom
Shapiro, R. Y. & Mahajan, H. (1986) ‘Gender differences in policy preferences: A summary of trends from the 1960s to the 1980s’ Public Opinion Quarterly, 50(1), 42–61.
Sia, A. P. (1984). An investigation of selected predictors of overt responsible environmental behaviour. Unpublished doctoral dissertation, Southern Illinois University, Carbondale
Siouti, G. (1988). Citizens participation in the environmental protection, (in greek), Athens: General Secretary of Youth
Sivek, D. J. (1987) An analysis of selected predictors of environmental behavior of three conservation organizations, Unpublished doctoral dissertation, Southern Illinois University, Carbondale.
Skanavis, C. & Sakellari, M. (2007) ‘Assessment of Environmental Intentions of Journalists’ Applied Environmental Education and Communication, Vol.6
Skanavis, C. & Sakellari, M. (2005) ‘Exploring the Need for Agricultural / Environmental Education in Greece’ International Journal of Environmental Studies, in press

Stern, P. C., Dietz, T. & Kalof, L. (1993) ‘Value orientations, gender, and environmental concern’ Environment and Behavior, 25(3), 322–348.
Stout-Weigand, N. & Trent, R. B., (1983) ‘Sex differences in attitudes toward new energy resource developments’ Rural Sociology, 48(4), 637–646.
Tindall, D.B., Davies, S. & Mauboules, C. (2003) ‘Activism and Conservation Behavior in an Environmental Movement: The Contradictory Efects of Gender’ Society and Natural Resources, 16, 909–932
Tsampoukou – Skanavis, C. (2004) Environment and Communication: The right to choose, Athens, Kalidoskopio, [in greek]
The Nielsen Company, (2007), The Nielsen Company’s Guide to the Academy Awards, News Release, 20/2/2007, New York
UN, (2002) World Summit on Sustainable Development, done at Johannesburg, South Africa UNCED, (1992) Agenda 21: Programme of Action for Sustainable Development. Rio Declaration
on Environment and Development. New York: United Nations UNESCO, (1978) Final Report Intergovernmental Conference on Environmental Education,
Organized by UNESCO in cooperation with UNEP, Tbilisi, USSR, 14-26 October 1977. Paris: UNESCO ED/MD/49
UNESCO-UNEP, (1976) ‘The Belgrade Charter: A Global Framework for Environmental Education’ Connect, 1, 1-2
UNESCO-UNEP, (1988) International strategy for action in the field of environmental education and training for the 1990s, International Congress on Environmental Education and Training, Moscow 1987, Publ. NAIROBI, Paris
Van Liere, K. D. & Dunlap, R. E. (1980) ‘A review of studies that measured environmental attitudes and behaviors’ Environment and Behavior, 11, 22-38
Verba, S., Burns N. & Schlozman, K. L., (1997) ‘Knowing and caring about politics: Gender and political engagement’ Journal of Politics, 29(4), 1051–1072.
Volk, T.L. (1993) ‘Integration and Curriculum Design’ In: Wilke J. R. (Ed.) Environmental Education Teacher Resource Handbook, Crowin Press Inc
Zelezny, L., & Bailey, M., (2006) ‘A call for women to lead a different environmental movement’ Organization and Environment, 19(1), 103-106.
Zelezny, L. C., Chua Poh-Pheng & Aldrich, C., (2000) ‘Elaborating on Gender Differences in Environmentalism’ Journal of Social Issues, 56(3), 443-457.
Zint, M. (2002) ‘Comparing Three Attitude-Behavior Theories for Predicting Science Teachers’ Intentions’ Journal of Research in Science Teaching, 39(9), 819-844

Fourth International Event Research Conference Re-evaluating the City/Town: Events as a Catalyst for Change
ACCESS: DEVELOPING A RESEARCH AGENDA FOR EDINBURGH FESTIVALS AND EVENTS
Jack Carlsen
Curtin University [email protected]
Jane Ali-Knight
Napier University, Scotland
Martin Robertson Napier University, Scotland
ABSTRACT Festivals and events have assumed a prominent place in the social and economic fabric of Edinburgh, to a point where it now enjoys a reputation as a leading festivals and event destination. In Edinburgh, as in other festival destinations, most of the research and evaluation effort has been concerned with ‘proving’ the economic benefits of individual events. The limitations of focussing on narrow economic outcomes are now widely recognised in terms of the comparability, reliability and utility of the estimates produced. Whilst the attention of stakeholders has been on economic benefits, the very important cultural, community and social benefits have been overlooked. Important issues such as engagement with the arts, community, cultural, social and stakeholder benefits and dis-benefits produced have yet to be researched in any systematic way. This paper develops a comprehensive research agenda for Edinburgh Festivals based on the published articles, existing strategies and documentation, and relevant extant knowledge in festivals and events research. The agenda will be of interest to the numerous festivals and events stakeholders in Edinburgh as well as other destinations that are seeking to understand the social and cultural as well the economic dimensions of festivals and events.
INTRODUCTION This paper introduces an agenda for researching Edinburgh festivals from an economic, social and cultural perspective. It argues that the research, management and monitoring of festivals needs to move beyond economic impacts in order to understand the complex and comprehensive set of benefits and dis-benefits associated with these festivals. To this end, the social and cultural benefits and dis-benefits that accrue to festival and event stakeholders in Edinburgh are investigated. Based on literature review and interviews with key stakeholders a comprehensive research agenda based on key issues of the nexus between Edinburgh festivals and the Arts, Culture, Community, Economy, Society and Stakeholders of Edinburgh ~ACCESS~ is developed and key research topics are proposed and validated. The paper begins a review of the relevant literature of Edinburgh’s festivals and events. These provide the cultural, economic, social, community, geographic, tourism and political context for the research agenda. Then the process of developing and validating a research agenda for Edinburgh festivals is described and ~ACCESS~ a research agenda for understanding the benefits of Edinburgh Festivals, is proposed and validated.

Review of the literature on festivals and events indicates that the economic impacts and evaluation research dominate the research efforts (Carlsen et al 2001, Carlsen 2004). However, the social and cultural dimensions specific to festivals have been less well researched and there has not been any concerted effort to develop an agreed research agenda that will guide researchers in understanding the role of festivals in the economy and society. This paper performs that important first step in the context of a pre-eminent festival location. LITERATURE REVIEW Getz (2005:4) claims that “…thought has been given to developing a research agenda for event studies and event management” and has presented a research agenda at the ACEM conference in 2000 Events Beyond 2000: Setting the Agenda. Subsequent to that a group of Australian researchers convened a focus group in which the future of event research and education was debated amongst an international group of events academics (Harris and Huyskens 2001). One of their findings was that there was consensus on the need to pay greater attention to the social, community, environmental and political impacts of events. There was also concern that research was not accessible to the practitioners on the events industry and that communication and uptake of research findings was limited. With the support of the Australian Co-operative Research Centre for Sustainable Tourism, the first steps toward developing an agreed events research agenda were undertaken in consultation with stakeholders, an approach also recommended by Getz (2005). In consultation with representatives from industry, government and universities with expertise in events a broad set of research priorities were identified in the areas of event management, marketing and operations. In the ensuing years since this agenda was developed there has been extensive research into many aspects of events and festivals in Australia. Much of this has retained a focus on evaluation of economic impacts (Carlsen 2004) although social impacts are increasingly investigated (Fredline, Deery and Jago 2006). The aim of this research is to gain a better understanding of the economic and social implications of events and thereby improve the management of these events in the future. Whilst elaboration of research methodology is beyond the scope of this paper, it is evident that case studies and evaluations of events have been published in increasing frequency in the literature. However, it appears that the some impacts and issues are given far more attention than others, so that a comprehensive understanding of all of the impacts of events in all of their forms (arts festivals, exhibitions, sporting and business events) and in different scales ranging from mega-events to local, community-based events is yet to be developed. In selecting Edinburgh as the case study and focus for developing a comprehensive research agenda, it is expected that a broad range of impacts and implications specific to festivals would be identified and agreed as being worthy of further research. The next section reviews existing research relevant to Edinburgh festivals and briefly describes the approach used to identify and refine the ACCESS research agenda. EDINBURGH FESTIVALS RESEARCH In the period immediately after World War II, festivals were used as an aid to reconstruction and economic regeneration (Harvie, 2003; Waterman, 1998). The Edinburgh International Festival (EIF) was founded in 1947 with the purpose of bolstering the sense of European identity by supporting the revival of the arts and culture (Harvie, 2003). In addition, the Edinburgh festivals have brought economic benefits both to Edinburgh and the rest of Scotland and have assisted with the transition from an economy strongly dependent on heavy industries to one increasingly based on services and tourism (Harvie, 2003). A 1990 study of the economic benefits of nine festivals in Edinburgh (EIF, Military Tattoo and the Fringe, Jazz, Film, Folk,

Science, Children’s and Book Festivals) estimated that they generated £72 million in direct expenditure and 3000 FTE jobs in Scotland £44 million in direct expenditure including £9 million in income and 1,300 equivalent full-time equivalent (FTE) jobs in Edinburgh and the Lothians (Scottish Tourist Board 1993). A study in 2004 estimated that the 10 Summer Festivals (EIF, Military Tattoo and the Jazz and Blues, Film, Fringe, Book, Mela, Cavalcade, International TV and International Games Festivals) generated £127 million of new expenditure and £31 million of income for the Edinburgh economy. (SQW 2005). Different indicators on measuring the social impacts of festivals have been recommended, such as participation, new audiences, urban regeneration, training and employment opportunities, the effect of the festival on the city’s environment, infrastructure and attractiveness, self-esteem and socialisation, the change effected by arts activity and arts in education (Edinburgh City Council, 2001). Kelly and Kelly (2000) also added the contribution made to stimulating and developing public awareness of important issues and changing people’s attitudes on political, ethical, religious or moral issues. Chacko and Shaffer (1993) have claimed that a festival must be evaluated by its success in fostering community development. Getz (1988) defined community development as ‘the enhancement of the host population’s way of life, economy and environment (p132)’. Festivals give communities the opportunity for public celebration. Community celebrations, often developed as arts, fringe and folk festivals, are representative of the many aspects of the social and cultural fabric of the community in which they are celebrated. Community celebration is a common denominator to all festivals (Arcodia and Whitford, 2002). For example, the Edinburgh Hogmanay and Mela festivals were established in order to celebrate local culture and customs. The Mela festival celebrates the traditions of the Asian community and other cultures in Edinburgh. The Edinburgh Hogmanay was established in order to provide a more structured approach to the traditional New Year celebrations. The celebratory atmosphere of many festivals, the promotion of professional and amateur artists, the promotion of educational and audience development programmes and the inclusion of free events all help to make festivals more accessible to people who might not otherwise consider attending a live arts event (Allen and Shaw, 2000). Festivals have strong place identification: a festival may help define a place. Successful festivals create a powerful sense of place, which is local, as the festival takes place in a locality or region, but which often makes an appeal to a global culture in order to attract both participants and audiences (Waterman, 1998). In addition, festivals can be a medium for the local culture to reach a global audience. For example, the Edinburgh International Festival (EIF) inclusion of Scottish drama and theatre as an integral part of its programming has created a platform for the articulation of Scottish culture and has elevated it to an international level (Harvie, 2003). Street art and the increasing cultural diversity of festivals are becoming more prominent and increasingly festivals provide opportunities for amateur artists (Allen and Shaw, 2000). The simultaneous participation of amateur and professional artists emphasises the local identity of a festival and gives local artists the opportunity to showcase their work to the public (Allen and Shaw, 2000; Harvie, 2003). In fact, the larger the festival the more likely it is to feature amateur artists as larger festivals have greater capacity to programme work by local groups, and promote the local culture. According to Harvie (2003) numerous Scottish theatre companies have been stimulated and sustained by the EIF and Fringe. In addition, EIF has contributed, albeit indirectly, to the development of other theatre events on Scotland and help establish a ‘festival culture’ in Edinburgh that spans different kinds of cultural expression and participation (Harvie, 2003). In this way, it can be argued that the

cultural impact of a festival can expand beyond the confines of its programme and the work it features, to artistic expression elsewhere. However, it is not uncommon to hear festivals being described as ‘elitist’ (Waterman, 1998) and by focusing on ‘high culture’ excluding large segments of the local population. In fact, it has been argued that holding the event may reflect the desire of small an elite to pursue its interests in the name of community development (Ritchie, 1984). Festivals negative cultural impacts include the import of foreign culture through the programming of foreign plays and/or theatre groups and artists. This could affect local theatre groups and productions, and possibly festival attendance, if the festival programme is not balanced in its inclusion of local and foreign culture. Unless, the festival is primarily targeted at foreign visitors, local culture and arts will feature just as prominently as foreign. The EIF has often been criticised of this but according to Harvie (2003) the festival has also been a platform for the presentation of Scottish production and theatre groups to the rest of the world. METHOD Based on the relevant literature and policy documents (ECC 2001, a broad set of research questions was developed. Key stakeholders were contacted to ensure that the research agenda is relevant to their needs. Research questions were subsequently refined after input from stakeholders, so that the final agenda meets the needs of stakeholders as well as conforming to the need for academic rigour and objectivity. Stakeholders included representatives from all major festivals, funding agencies and government. These stakeholders were sent a copy of the proposed research agenda prior to interview (see appendix A). In order to validate and refine the research agenda a range of Edinburgh Festival stakeholders were interviewed. For the purposes of incorporating their views of the research agenda, their responses and suggestions are summarised below. The responses are then used to refine the research agenda and make it more applicable and relevant to the research needs of stakeholders. Finally a set of questions that generalise the research issues and findings are presented. DEVELOPING THE ACCESS RESEARCH AGENDA Broadly, this agenda was labelled ACCESS and was aimed at addressing the following six aspects as they relate to Edinburgh Festivals:
• Arts – understand the benefits for the Arts community (in all forms) • Culture – understand the role of Festivals in creating, promoting and preserving
heritage and culture • Community – understand how Festivals meet the needs of the business and wider
community • Economy – understand the net economic benefits of Festivals • Society - understand the social benefits of Festivals • Stakeholders – understand the role of all stakeholders in Festivals
Initially, there was some concern amongst stakeholders that the ACCESS research agenda was duplicating an initiative by Edinburgh Festivals to strategise collectively on where and how to position Edinburgh Festivals out to the year 2015 as the world’s leading festivals (AEA Consulting 2006). This initiative was dubbed ‘Thundering Hooves’ in reference to the increasingly intense level of competition amongst festival destinations that are following the lead of Edinburgh and threatening to overtake its position as the pre-eminent festivals destination. These fears of duplication were allayed by explaining that ‘Thundering Hooves’ is very much a strategising, forward-looking exercise, while the proposed research agenda was reflective. In that way, the two exercises are complimentary, and address the fundamentally different questions of ‘how did we get here?’ and ‘where do we go from here?’ This research

agenda was developed during the Festivals and Events – Beyond Economic Impacts conference hosted by the Centre for Festival and Event Management, Napier University and sought to identify new research issues for discussion and refinement. There was also some concern from one stakeholder regarding the question of elitism and the EIF. During a conference held by Napier University in July 2005, where the proposed research agenda was presented, a discussion around the need for the EIF to program the best international talent that it could secure was conducted, and it was agreed that this type of programming, though apparently elitist, was necessary if the EIF was to maintain its position as the leading performing arts festival. As a consequence, two proposed research questions of ‘To what extent are Edinburgh Festivals elitist?’ and ‘Are Edinburgh Festival too focussed on high art?’ were changed to ‘How do Edinburgh’s festivals maintain their position as leaders in the performing, literary and visual arts?’ ARTS AND FESTIVALS RESEARCH This first dimension of the ACCESS research agenda addressed the benefits of festivals for the Arts community (in all forms). There is a need to define the scope of arts festivals as well as the role of Edinburgh as a hub for arts festivals. Should all art forms and all types of arts festivals be accommodated in Edinburgh? Obviously this will have implications for venue capacity, programming and performance quality. There is a suggestion that arts festivals need to consider audience preferences as well as the needs of performers and artists. Artistic provision also has implications for funding and further investment in festival infrastructure, so must be strategic and sustainable. However, new venues must be fully utilised in order to justify initial investment and provide a return on investment. This generates the need to develop new arts events based on visual art forms such as fashion. The timing of any new events is an issue due to capacity constraints in the peak tourism seasons (summer and winter), as is the risk of staging too many arts festivals and creating ‘festival fatigue’ in the arts and festival communities. The right mix of performing, visual and literary arts is important, as is the relationship between arts and major sporting events such as the Olympics and Commonwealth Games. There is a notion that more visual arts should be included in the EIF, which are mainly performance arts based because they have higher visibility and therefore accessibility for the local community. For example, the Cow Parade in Edinburgh (a charity event) created a sense of fun and creativity in Edinburgh over the summer of 2006, through a highly visual public art form (see http://edinburgh.cowparade.com/ accessed 12/9/2006) Arts festivals define Edinburgh so high quality is essential as is the need to preserve the uniqueness of the artistic offerings. The collective nature of arts communities can mitigate against the maintenance of USPs and competitive advantage, and festival organisation may be considered secondary compared to the artistic development itself. Juxtaposed against this arts ethos is the competition between arts festival organisers to attract the best artists, who may bear no affiliation to a particular festival or locality, even if that festival provided the showcase for take-off of their work. Hence there is a greater need for festival stakeholders to understand the arts and the needs of artists. Some form of support or subsidy of performers expenses (eg. accommodation in Edinburgh) may act as an incentive to create greater loyalty to Edinburgh Festivals and repeat performances if desired. There is a high degree of dependency in the relationship between the arts and festivals. Arts have the ability to define contemporary culture, but arts festivals are in a unique position to define direction and content of the art that reaches an audience. Clearly there is a need to further understand the nexus and needs of both arts and festival stakeholders in Edinburgh and the extent to which their aims and ideals converge.

These responses address the two proposed research questions of ‘To what extent are Edinburgh Festivals elitist?’ and ‘Are Edinburgh Festival too focussed on high art?’ which was changed to ‘How do Edinburgh’s festivals maintain their position as leaders in the performing, literary and visual arts?’ Underlying this question is the politics of festivals and the positioning of Edinburgh as a city of high art and culture. Reid (2006) found some level of criticism of the ‘elitist’ nature of Edinburgh’s image as a result of public funding for the hosting of the MTV Europe Music Awards in 2003 (actually held in Leith with a live open air broadcast and concert in Princes Street Gardens. Reid’s insights raise questions of conservative control over city imaging, social inclusion and exclusion and the future direction of festivals and events development in Edinburgh and the surrounding burghs. In light of these issues, the following general research questions are proposed: 1. How are the benefits of festivals for the arts (in all forms) distributed over space and time? 2. What is the appropriate mix of high art and populist programs and performances at festivals? 3. To what extent do the arts define city image and contemporary culture through festivals? CULTURE AND FESTIVALS RESEARCH This second dimension of ACCESS sought to understand the role of festivals in creating, promoting and preserving heritage and culture. There was some obvious overlap with the first agenda because arts were considered as defining in contemporary culture. The relative mix of local Scottish culture and other cultural content at festivals was considered important. Developing an appropriate audience for the cultural content of festival programs is also important, especially if the purpose is to promote and preserve local culture. Although, it was also considered that Edinburgh’s relationship with culture must be seen to be dynamic, live and current, not static. Prentice and Andersen (2003) have examined Edinburgh festivals in the context of cultural tourism and the successful transition of Edinburgh’s image from traditional rural landscape to an international tourism destination. The market for ‘consumption’ of Edinburgh festival experiences was categorised in three styles: consuming Edinburgh as a tourism/historic city; consuming Scottish performing arts; and consuming international performing arts. From the tourist’s perspective, all three styles of consumption may overlap, with the first being a non-place and non-festival specific form of consumption and the last two being specific to the program and venues for festival performances. Segmentation based on a sample of over 400 visitors to Edinburgh in 2003 indicated that imagery of traditional Scottish culture persists in the minds of visitors, but festival experiences provide for consumption of contemporary culture. The role of festivals and culture in transforming tourism imagery requires greater research according to Prentice and Andersen (2003), if it is to inform the modelling and marketing of tourism to Edinburgh. Further research questions arising are: 4. What is the role of festivals in creating, preserving and promoting cultural heritage? 5. What aspects of cultural heritage are most desirable from the hosts and visitors perspectives? 6. What is the relationship between cultural heritage, social cohesion and festivals? COMMUNITY AND FESTIVALS RESEARCH The aim of this third dimension of the agenda is to understand how festivals meet the needs of the business and wider community. Part of importance of festival’s role in building sense of community is in retaining local support as the local community has a vested interested in the success of the festival. However, the ‘community’ of Edinburgh is broad and involves local residents, businesses and the festival community itself. The issues is that the festival community may not be resident, and include performers, funding agencies and suppliers that all have an interest in the success of the festival and will benefit from same. The festival community can

extend to online and other media forms so that festival community networks may be continually expanding. Thus the scope of community and festival research presents particular problems with respect to definition and identification. Where community can be readily identified, benefits are readily identifiable. For example, Mela stands out as home grown community festival that celebrates the Asian cultures in Edinburgh. The role of festivals in community cohesion and development is considered important and the facilitation of this is considered to be the responsibility of the City Council. Community input into all aspects of festival development is another role of City Council. Carlsen and Taylor (2002) have demonstrated how community programs associated with sporting events can contribute to community development and cohesion, in the case of the Manchester 2002 Commonwealth Games. 7. Who comprises the festival community? 8. Who should be responsible for protecting the interests of the festival community? 9. What is the link between community spirit and participation in festivals? ECONOMY AND FESTIVALS RESEARCH This fourth dimension of the ACCESS research agenda aimed to understand the net economic benefits of Festivals. There is a general expectation that the entire economy of Edinburgh will benefit from successful festivals, although the quantification and distribution of these benefits is not well understood. Direct economic benefits to service sector are evident as the annual influx of visitors fill hotels, apartments, restaurants and performance venues, but the indirect and induced economic benefits depend on the structure and self-sufficiency of the Edinburgh economy. There is an opinion that the economic growth in Edinburgh since World War II has fostered self-sufficiency and ensured a local supply of resources, personnel and inputs. If this is the case, the economic benefits are not only retained but are also distributed across all sectors of the economy – primary, secondary and tertiary. These multiplier effects are of interest to all stakeholders, especially as they occur on a regular basis and have become an integral part of economic life in Edinburgh. Furthermore, when the links between a buoyant economy and cultural and societal benefits are identified, then a clearer understanding of the role of festivals in Edinburgh is developed. One clear link is the influx of specialists in development and delivery of festivals and events, enhancing their ‘cultural product’ and quality as well as bringing a diversity of skills and ideas to the city. However, there are dis-benefits associated with festivals and events as well that must be acknowledged and taken into account. Peak demand for accommodation for festivals has driven up rents and hotel room rates in Edinburgh to a point where it is inaccessible for many months of the year. Aligned to this is the congestion, over-crowding and price-inflation associated with peak demand, all of which have an economic and social cost attached. Likewise, there are environmental costs and benefits that need to be taken into account in any comprehensive assessment of the net benefits of festivals In summary, the validation of this component of the research agenda will involve researchers looking beyond the immediate, tangible, direct economic benefits of festivals to consider the intangible economic and social costs and benefits before arriving at any conclusions about the net benefits of festivals. Furthermore, the distribution of these benefits and costs must also be examined to ensure that they are spread over a wide cross-section of the economy and society. Further research questions arise, as follows: 10. What are the direct, indirect and induced economic costs and benefits of festivals? 11. How are the net economic benefits and dis-benefits of festivals distributed? 12. What are the intangible economic costs and benefits of festivals?

SOCIETY AND FESTIVALS RESEARCH Closely aligned to the economy, the social dimension of festivals in Edinburgh is seen to be equally important in the ACCESS research agenda. Here, questions of social benefits, inclusion and cohesion come to the fore. These are manifest in the form of civic pride, quality of life, outreach programs, education, celebration, altruism and volunteerism, all of which have been identified as being increasingly important to festival organisers, especially the Mela and Fringe Festivals. The notion that festivals contribute to the development of ‘social capital’ with respect to regeneration of urban areas through increased investment in the cultural and creative characteristics inherent in these areas is also of relevance. Indeed, funding agencies consider these social dimensions as being highly important when considering applications for financial support. There is also a boundary issue in this component of the research agenda as well, in that festivals via the media have a global reach so that images of social cohesion and regeneration may raise expectations in other parts of the world, in a sort of social ‘demonstration effect’. The scope of social benefits associated with festivals has yet to be defined in Edinburgh. A number of stakeholders have recognised that these benefits are notoriously difficult to identify and quantify, embedded as they are in the social milieu of a dynamic and growing city, country and region. Many social forces are at work so the isolation and attribution of festival-specific social benefits and dis-benefits is a complex task for researchers, but one that is necessary for making informed decisions on funding and support. Furthermore the programming of socially inclusive events is fraught with risk and a number of respondents raised the issue of potential mis-match between suburban audiences and world-class performances that can occur at festivals. To further complicate the issue, many social benefits that flow are intangible and to some degree serendipitous and are not only difficult to program, but also to measure and monitor in any meaningful way. Social benefits may not only vary from festival to festival, but between from program-specific elements within individual festivals, making any generalisation or extrapolation of social benefits a major challenge within the ACCESS research agenda. Further related research question are as follows: 13. What are the social costs and benefits of festivals? 14. How are the net social benefits and dis-benefits of festivals distributed? 15. What are the intangible social costs and benefits of festivals? STAKEHOLDERS AND FESTIVALS RESEARCH The proliferation and growth in festivals has led to a concomitant increase in the number and diversity of stakeholders in Edinburgh. This can be viewed as both a virtue and a burden for the festival community. Research into the roles, responsibilities and needs of all stakeholders is only a starting point in understanding their importance and the way in which they interact and function to ensure desirable outcomes from festivals. This final dimension of the ACCESS research agenda will involve investigation of the complex networks that have emerged historically in Edinburgh and the way in which communication, integration and understanding occurs within and between stakeholders. At an even more deeper level, the motivations and expectations of individual stakeholders needs to be identified and the degree to which these converge or diverge between the individual stakeholders in each festival and across festivals needs to be tested. When the scope of this research is extended beyond ‘direct’ stakeholders, to include audiences (both live and media) and the wider Scottish society the scale of the research task becomes even larger. According to stakeholders it is important to include all who have both an economic as well as a non-economic stake in the festivals in the research agenda. Indeed, the understanding of stakeholders, facilitation of improved communication and dissemination of information are seen as critical to the future success of Edinburgh festivals. Three final research questions follow: 16. Who are the festival stakeholders?

17. What are the motivations, expectations, roles and responsibilities of festival stakeholders? 18. What stakeholder networks exist for festivals? CONCLUSION It is evident from the literature that research needs to extend beyond economics to include the social benefits and dis-benefits of the festivals. The community benefits and dis-benefits of festivals are noted as forces that can shape local cultural production, community involvement and support. The educational and outreach programmes and the contribution of the festivals in fighting social exclusion are indicators of this importance and are now used as criteria in assessing the formation and funding of festivals. However, there appears to be a need for a comprehensive evaluation of festival benefits and dis-benefits in order to inform stakeholders as to the discrete and cumulative net benefits that accrue to Edinburgh. A review of the relevant literature indicates that our understanding of the broader economic, social and cultural benefits and dis-benefits of festivals is sound. However, knowledge of the specific benefits and dis-benefits, in the case of Edinburgh’s festivals is limited. This paper has argued that to develop this knowledge would lead to maximisation of net benefits in the short-term and socially and economically sustainable festivals in the long term. A proposed research agenda ~ACCESS~ is recommended and validated as one way of developing the Edinburgh festivals knowledge base and maximising the cultural, social and economic benefits so often cited in the literature, but rarely validated in practice. Six key research themes have been employed to frame ACCESS research agenda for Edinburgh festivals and the arts, culture, community, economy, society and stakeholder of Edinburgh. In order to provide direction not only for Edinburgh festival researchers, but for the wider festival and events research community, 18 research questions are proposed that individually and collectively address the major issues confronting event and festival practitioners. REFERENCES AEA Consulting (2006) Thundering Hooves Maintaining the Global Competitive Edge of
Edinburgh’s Festivals. Full Report May 2006. unpublished. Allen, K. and Shaw, P. (2000) Festivals Mean Business. The shape of Arts Festivals in the UK.
British Arts Festival Association Report. Arcodia, C and Whitford, M. (2002) Festival attendance and the development of social
capital, Tourism and Hospitality on the Edge, Proceedings of the 2002 CAUTHE Conference, Sydney, Conference CD-ROM.
Carlsen, J. (2004) The Economics and Evaluation of Festivals and Events. In Yeoman, I., M. Robertson, J. Ali-Knight, U. McMahon-Beattie and S. Drummond (Eds.) Festival and Event Management: An International Perspective. Elsevier Science: Oxford, pp 246-260.
Carlsen, J and A. Taylor (2003) Mega-Events and Urban Renewal: The Case of the Manchester 2002 Commonwealth Games, Event Management, 8 (1) pp 15-22.
Carlsen, J., Getz, D. and Soutar, G. (2001) Event Evaluation Research. Event Management, Vol. 6 (4) , pp 247-257.
Chacko, H. E. and Schaffer, J. D. (1993). The evolution of a festival: Creole Christmas in New Orleans. Tourism Management, 14 (6): 475-482.
ECC (2001) Festivals and the City. The Edinburgh Festivals Strategy 2001. Fredline, L., Deery, M. and L. Jago (2006) Host Community Perceptions of the Impact of
Events. A Comparison of different event themes in urban and regional communities. Sustainable Tourism CRC; Gold Coast.
Getz D (1998) “The Impacts of Mega Events on Tourism: Strategies and Research Issues for Destinations”, Council of Australian University Tourism and Hospitality Education (CAUTHE) Conference Proceedings, pp 417-439.

Getz, D (2005) Event Management & Event Tourism 2nd Edition. Cognizant Communication Corporation: New York.
Harris, R. and M. Huyskens (2001) Events Beyond 2000: Setting the Agenda – Focus Group Outcomes. Event Management, Vol. 6 (4), pp 271-272.
Harris, R., Jago, L., Allen, J. and M. Huyskens (2001) Towards and Australian Events Research Agenda: First Steps. Event Management, Vol. 6 (4), pp 213-221.
Harvie, J. (2003) Cultural effects of the Edinburgh International Festival: Elitism, Identities, Industries. Contemporary Theatre Review, 13 (4): 12-26.
Kelly, A. and Kelly, A. (2000) Impact and Values, Assessing the Arts and Creative Industries in the South West. Bristol: Bristol Cultural Development Partnership
Prentice, R. and Andersen, V. (2003) ‘Festival as Creative Destination’. Annals of Tourism Research 30 (1), pp7-30
Ritchie, J. (1984) Assessing the impact of hallmark events: conceptual and research issues. Journal of Travel Research, 23(1): 2-11.
Reid, S (2006) ‘The Politics of City Imaging: A case study of the MTV Music Awards Edinburgh 03’ Event Management 10, pp35-46.
Scottish Tourist Board (1993) Edinburgh Festivals Study: Visitor Survey and Economic Impact Assessment Summary Report, February 1992. Festival Management and Event Tourism, Vol. 1, pp 71-78.
SQW Ltd. (2005) Edinburgh Festival 2004-2005 Economic Impact Survey Stage 1 Results. unpublished.
Waterman, S. (1998) Carnivals for elites? The cultural politics of arts festivals, Progress in Human Geography, 22, (1): 54-74.

APPENDIX A ~ACCESS~ An agenda for Edinburgh Festivals Research For the Napier University Centre for Festivals and Event Management Professor Jack Carlsen, Visiting Professor, CFEM, Napier University Jane Ali-Knight, CFEM, Napier University Martin Robertson, CFEM, Napier University Introduction The following research agenda ~ACCESS~ has been developed by staff at the Centre for Festival and Event Management (CFEM) of Napier University. It is designed to support the maximisation of the net benefits of Edinburgh Festivals and Events for the stakeholders and the wider Scottish economy and society. ACCESS represents the output from the research program titled Festivals and Events: Realising their Potential (see appendix). In stage four of that program, validation by key stakeholders and strategy formulation for mobilising and implementing the research program has been proposed. Key festival stakeholders are asked to review the ACCESS research questions below and comment on their appropriateness and applicability. A key criteria for accepting (or validating) these questions is “Will ACCESS help us to maximise the net benefits (or minimise the dis-benefits) of Edinburgh Festivals for stakeholders and the wider Scottish community?” Validation Upon validation of these research approach and content, applications for funding and resourcing will be developed to support the ongoing research agenda of CFEM. Validation will involve three key questions:
(1) Is ACCESS asking the right research questions? (2) Is there anything else that should be included in ACCESS in relation to the benefits and
dis-benefits of Edinburgh Festivals? (3) Are there any other stakeholders that should be engaged in ACCESS?
The purpose of validation is to ensure that the research outcomes of ACCESS are timely and relevant for stakeholders. Validation will also provide justification for the research and support research funding applications, resourcing, staffing and student projects. Advantages for Stakeholders The CFEM view ACCESS as the flagship project for the next three years and will be seeking to resource it appropriately. Stakeholders may be asked to provide a letter of support endorsing the research agenda, and its aims, objectives and approach. Another advantage that ACCESS will provide stakeholders is academic rigour, depth and objectivity, ensuring that any research outcomes are highly useful and relevant to stakeholders and beneficial to the Edinburgh Festivals. What is ACCESS? ACCESS is the framework within which all benefits and dis-benefits of Edinburgh Festivals will be investigated.

ACCESS is: Arts – understand the benefits of Festivals for the Arts community (in all forms) Culture – understand the role of Festivals in creating, promoting and preserving heritage and culture Community – understand how Festivals meet the needs of the business and wider community Economy – understand the net economic benefits of Festivals Society - understand the social benefits of Festivals Stakeholders – understand the role of all stakeholders in Festivals Proposed ACCESS Research Questions: Arts and Festivals: • How do Edinburgh’s festivals maintain their position as leaders in the performing, literary and visual arts? • How do Festivals contribute to development of, and participation in, the arts? • How successful are the arts outreach programmes of Edinburgh’s Festivals? • Who are the main beneficiaries of Arts Festivals? • What is the relative mix of free and ticketed Arts Festivals? Culture and Festivals: • Does Edinburgh’s Festivals contribute to the creation, preservation and promotion of Scottish culture? • What is the contribution of cultural Festivals to health, education, stronger communities and national well-being? • What values are manifested in cultural Festivals? • What cultural criteria should be applied when publicly funding Festivals? • What is the appropriate programming mix of local and foreign culture? Community and Festivals: • Who comprises the Edinburgh Festivals community – hosts, guests and stakeholders? • What is the extent of host community support for Edinburgh Festivals? • How do Edinburgh Festivals support community development? • What are the benefits and dis-benefits for the host community • What is the nature of collective and individual community benefits? Economy of Festivals: • What are the direct economic benefits of Edinburgh’s Festivals? • What are the direct costs associated with staging Edinburgh’s Festivals? • What are the intangible benefits and costs associated with Edinburgh’s Festivals? • What are the net economic benefits of Edinburgh’s Festivals? • Who benefits economically from Edinburgh’s Festivals? • Who bears the costs of Edinburgh’s Festivals? Society and Festivals:

• What are the social benefits of Edinburgh’s Festivals? • How do Edinburgh’s Festivals contribute to social capital? • To what extent does Scottish society support Edinburgh’s Festivals? • How socially inclusive are Edinburgh’s Effs? • What is the potential of Edinburgh’s Festivals to address social problems? • How do Edinburgh’s Festivals improve the social life of Scotland? Stakeholders and Festivals: • What is the role of public stakeholders (ECC, SE, CC etc) in Edinburgh’s Festivals? • What is the role of private stakeholders (Sponsors, Partners, Promoters) in Edinburgh’s Festivals? • To what extent does the Scottish community have a stake in Edinburgh’s Festivals? • What are the respective needs of public and private stakeholders in Edinburgh’s Festivals? • How well do stakeholders networks function? • How do stakeholders contribute to the success of Edinburgh’s Festivals? Summary Our understanding of the broader economic, social and cultural benefits and dis-benefits of Festivals is sound, however knowledge of the specific benefits and dis-benefits (beyond economic benefits) of Edinburgh’s Festivals is limited. To develop this knowledge would lead to maximisation of net benefits in the short-term and socially and economically sustainable Festivals in the long term. Understanding ACCESS is key to developing the Edinburgh Festivals knowledge base, maximising net benefits and sustaining Edinburgh Festivals into the future. Questions and further information Contact details: • Jack Carlsen <[email protected]> • Jane Ali-Knight <[email protected]> • Martin Robertson <[email protected]>

Fourth International Event Research Conference Re-evaluating the City/Town: Events as a Catalyst for Change
ENVIRONMENTAL ACCREDITATION FOR EVENT MANAGEMENT
Charles Arcodia and Scott Cohen School of Tourism
The University of Queensland [email protected]
ABSTRACT Public concern for the environment has increased and as a result, the concept of sustainable development has become increasingly debated. While sustainability issues in tourism have been the subject of substantial research in recent years, academics have yet to focus on the environmental sustainability of the broad spectrum of events which are increasingly supporting tourism plans. Not only has the environmental sustainability of events not been thoroughly addressed in academic literature, but sustainable tourism accreditation schemes have generally omitted events from their scope. Green Globe 21, a global environmental accreditation scheme for travel and tourism, for example, suggests twenty-five different types of schemes to benchmark different sectors of the tourism industry ranging from cruise vessels to vineyards, but fails to directly address events. The purpose of this paper is to evaluate the adaptability of Green Globe’s environmental accreditation scheme to the event sector. First, both the concept of sustainable tourism and the negative environmental impacts of events are explored. Following this theoretical discussion, focus is given to Green Globe’s design and its benchmarking schemes for accrediting tourism operators. Green Globe’s most applicable benchmarking scheme is then applied to special events. The paper concludes that eight different indicators can be applied to special events. Six indicators are suitable for events in their current state while two others require adjustment, one minor and one major, in order to be applicable to the events.
INTRODUCTION In the last decade, public concern for the environment has increased dramatically. As a result, the concept of ‘sustainable development’ has become increasingly debated. Many industries now realise they must balance environmental and social impacts with economic objectives in order to ensure equity for future generations. The tourism industry has by no means been exclusive of this paradigm shift. The concept of ‘sustainable tourism’ has emerged in contemporary tourism thinking in an attempt to guide the industry along a ‘greener’ path. While sustainability issues in tourism have been the subject of substantial research in recent years (Liu, 2003), academics have yet to focus on the environmental sustainability of the broad spectrum of events which are increasingly supporting tourism plans. This is evidenced by the fact that notions such as ‘sustainability’ and ‘events’ are rarely being coupled together in debates which are not economic in basis.

An event can be defined as a one-time or infrequently occurring event which is outside the normal programs or activities of the organising body (Getz, 1997). Events ranging in size from the Olympics to a small cultural festival have obvious implications for tourism. But while the event sector is inextricably linked with tourism, it is however, an emerging force in its own right which deserves unique academic attention on all levels. The issue of the environmental sustainability of events is of particular importance due to its potentially large impacts on the environment. Not only has the environmental sustainability of events not been thoroughly addressed in academic literature, but sustainable tourism accreditation schemes have also omitted events from their scope. Green Globe 21, a global environmental accreditation scheme for travel and tourism, suggests twenty-five different types of schemes to benchmark different sectors of the tourism industry ranging from cruise vessels to vineyards, but fails to address events (Green Globe 21, 2003). Recent communication with Green Globe revealed that while the concept of applying their accreditation scheme to events has been considered, there are no current plans to act upon the idea (H Koch [Green Globe 21 Head Office] 2004, pers. comm., 5 May). The purpose of this paper is to evaluate the adaptability of Green Globe’s environmental accreditation scheme to the event sector. First, both the concept of sustainable tourism and the negative environmental impacts of events are explored. Following this theoretical discussion, focus is given to Green Globe’s design and its benchmarking schemes for accrediting tourism operators. Green Globe’s most applicable benchmarking scheme is then applied to special events. By systematically applying each benchmark indicator to general event characteristics, the suitability of the overall scheme to the event sector is assessed. Finally, recommendations are provided as to the necessary changes needed in order to establish a Green Globe benchmarking scheme for events. The breadth of the event sector is acknowledged and the different categories of events such as cultural, business, sporting and life-cycle, together with the myriad of event spaces both ongoing and occasional. It is difficult to provide sustainability benchmarks to a phenomenon which displays such diversity as each event and the venue it uses requires different consideration; nevertheless it is possible to discuss sustainability benchmarks which can be applied when appropriate. SUSTAINABLE TOURISM The idea of sustainable tourism has its roots in the more general concept of sustainable development (Garrod, 1998). The birth of sustainable development is commonly attributed to the Brundtland Commission Report in 1987 which defined the concept as ‘development that meets the needs of the present without compromising the ability of future generations to meet their own needs (WCED 1987: 43 cited in Liu, 2003: 460). Simply put, sustainable development meets the needs of today while protecting and enhancing opportunities for the future. However, it is important to note that sustainable development includes not only sustainable economic development, but also strives to minimise environmental and social impacts. In recent years, concern over the environmental consequences from the growth of tourism has been increasing. Thus, the tourism industry faces the problem of how to plan and regulate tourism in order to limit environmental damage (Hjalager, 1996). This challenge is widely recognised as one of the most important issues the tourism industry has ever faced (Garrod, 1998). Sustainable tourism has emerged as the driving force attempting to lead tourism to a more environmentally sound outcome. While many have argued the precise definition of sustainable tourism, for the purpose of this paper it is tourism that is developed and maintained in a manner so that it remains economically viable over time and does not undermine the physical and human environment that sustains and nurtures it (Ham, 2002; Liu, 2003).

If tourism is to become environmentally sustainable however, it is also necessary for its related sectors to also strive towards sustainability. After all, sustainability is a holistic concept which should be integrated through all aspects and sectors of an industry. The tourism industry and the events sector are of a cognate nature with complex linkages and mutual dependency. (Cooper, 1998). Events are generally viewed as an integral component of tourism development and are often used as catalyst for attracting visitors (Getz, 1989; McDonnell, 1999). Sustainable tourism strategies should then, extend their coverage and also consider the environmental impacts of events if it is to become holistic in nature. It is accepted that the issue of sustainability is usually considered in a macro context but events occur in a defined and narrow time span. While there are some similarities, it is necessary to acknowledge this difference in any discussion on the environmental impact of events. ENVIRONMENTAL IMPACTS OF EVENTS Events can have economic, political, social and environmental impacts on the host community. McDonnell (1999) warns event managers that while great emphasis is often placed on the economic impact of events in order to meet budget goals, it is important not to lose sight of the full range of impacts resulting from an event. Event managers must identify and predict these impacts so that the outcome of the event is beneficial for all parties involved, and the overall impact of the event is positive. Environmental impacts resulting from events can be both positive and negative. Positive impacts may include improved local infrastructure, construction of new facilities and urban transformation or renewal (Hall, 1992). For the purposes of this paper however, only the negative environmental impacts of events will be explored in-depth. The negative environmental impacts of events vary depending on the environment in which the event takes place. The impact on the immediate physical environment may be fairly contained if the event takes place in a purpose-built venue such as a stadium or entertainment centre. The impact may be much greater however, if the event is held in a public space not specifically designed for the event such as a park or a town square (McDonnell, 1999). In regards to the latter, events may take place in extremely delicate environments where great care should be taken to minimise impacts. There is a wide range of possible negative environmental impacts resulting from events. These include general “wear and tear” on the natural environment, destruction of heritage, traffic congestion, air and water pollution, creation of offensive noise, littering, sewage disposal issues, and overcrowding (Hall, 1992; McDonnell, 1999; Van Der Wagen, 2001). In order to mitigate these impacts, careful planning must be undertaken by event managers, but there is currently no framework available to event managers to help them self-regulate the negative environmental impacts of their event. Consequently, it is helpful to refer back to the tourism industry where environmental accreditation schemes such as Green Globe are providing the tools necessary to aid tourism operators in becoming more sustainable. GREEN GLOBE 21 FOR SUSTAINABLE TOURISM The tourism industry’s drive towards sustainable tourism is being aided by self-regulation. In order for tourism organisations to adopt self-regulatory sustainable practices however, three issues must be addressed. First, a tourism operation must have knowledge of the appropriate practices and technologies to adopt in a certain context. Second, the perception that some benefits will arise as a result of adopting these practices must exist. Finally, effective sanctions must exist to ensure that the appropriate level of environmental performance is being maintained (Griffin, 2002).

Industry accreditation schemes are a form of self-regulation which attempt to address all three of these issues. In the tourism industry, they are based on operators achieving set environmental performance standards, in return for which the operator gains the right to display an identifiable logo which demonstrates their commitment to the environment to both customers and other industry operators (Griffin, 2002). Participating operators are sanctioned by removal of the right to use the logo if the standards are not maintained (Green Globe 21, 2003). In the last decade, Green Globe has emerged as a global environmental accreditation scheme for sustainable tourism. Established in 1994 by the World Travel and Tourism Council, Green Globe’s aim is to implement the Agenda 21 principles defined at the 1992 Rio Earth Summit. In 1999, it became an independent company under the name ‘Green Globe 21’ as its nature shifted from being an environmental awareness program to a formal accreditation scheme (Griffin, 2002). Today, Green Globe describes itself as ‘the only global benchmarking program for travel and tourism designed to actively encourage the industry to make and benefit from worthwhile improvements in key environmental and social performance areas’ (Green Globe 21, 2004a: 3). Specifically, Green Globe’s benchmarking program for tourism operators encourages the industry to gain benefits from a number of areas (Green Globe 21, 2004b):
• Reduced greenhouse gas emissions • Energy efficiency, conservation and management • Air quality protection and noise control • Fresh water resource management • Wastewater management • Waste minimisation • Improved social and cultural relations • Land management • Ecosystem conservation and management
These areas are integrated into Green Globe’s benchmarking standard through a series of carefully chosen indicators designed to measure environmental performance (Green Globe 21, 2004a). Essentially, in order to be benchmarked, an operation annually supplies Green Globe with a measurement of the relevant indicators. Green Globe then produces an assessment which indicates the operation’s current standing. In order to be able to display the Green Globe logo, all indicator measures must be maintained above a ‘Baseline level’ which has been predetermined by Green Globe (Green Globe 21, 2004b). Green Globe has developed benchmarking indicators for twenty-five different tourism sectors. Suitable for both large and small travel and tourism companies, the sectors covered include areas such as accommodation, activities and attractions, airlines, bus companies, and marinas. Benchmarking indictors have also been developed for communities so that an entire destination may become accredited (Green Globe 21, 2003). With such a diverse range of sectors covered, it seems reasonable to consider extending the benchmarking indicators to encompass special events. A BENCHMARKING SCHEME FOR THE EVENT SECTOR Correspondence with Green Globe’s head office revealed that while plans do not exist for developing benchmarking indicators for special events, the existing indicators most applicable to special events are contained in the ‘Green Globe 21 Benchmarking Indicators for Activities and

Attractions’ (H Koch [Green Globe 21 Head Office] 2004, pers. comm., 5 May). Therefore, by applying each of the eight indicators from the ‘activities and attractions’ area to special events, it is possible to examine the suitability of a Green Globe accreditation scheme to the event sector. Green Globe’s benchmarking indicators for activities and attractions and their respective methods of measurement include (Green Globe 21, 2004a):
• Sustainability Policy – Policy in place • Energy Consumption – Energy consumed/ Customer • Potable Water Consumption – Water consumed/ Customer • Solid Waste Production – Volume of waste/ Customer • Social Commitment – Employees living within 20km/ Total employees • Resource Conservation (Paper) – Ecolabel paper purchased/ Total paper purchased • Cleaning Chemicals Used – Biodegradable chemicals used/ Total chemicals used • Vehicle Management – Vehicle services/ Vehicle services required
Each benchmarking indicator’s objective (Green Globe 21, 2004a) is now applied to events in order to examine its applicability. In cases where the relevant indicator is measured by production or consumption per customer, the appropriate substitution is production or consumption per event attendee. While some of the indicators are better suited to broader sustainability concerns, it is still quite possible, and useful, to apply the indicators to events that use existing infrastructure and established procedures. While assessing a particular event on its own merits, it is important to consider the portfolio of events that are organised at the same venue. Sustainability Policy Objective: Produce a clear and straightforward written policy that addresses key sustainability issues raised in the Green Globe 21 Standard. In the planning process of an event, it is important to establish the event’s aims and measurable objectives. These can be incorporated into an event proposal which should include the economic, environmental, and social impacts of the event (Van Der Wagen, 2001). During this stage, the event organiser should incorporate a sustainability policy detailing the management logistics required to control environmental and local social impacts from the event. Energy Consumption Objective: Minimise overall energy consumption. The staging of any event generally involves large numbers of people and to service this crowd energy consumption is unavoidable (McDonnell, 1999). Significant levels of energy are consumed by the associated infrastructure of an event as well as by those directly involved. However, the use of energy efficient design and materials in the construction of this infrastructure will help to minimise overall energy consumption. Additionally, the maximum use of renewable sources of energy where possible will lead to a more environmentally sustainable outcome. Potable Water Consumption Objective: Minimise consumption of potable water. Potable water resources can be consumed not only by drinking, but also through other activities such as the cleaning of surfaces, washing (both personal and laundry), watering gardens, and the use

of recreational facilities (Green Globe 21, 2004b). Events can work to minimise the consumption of potable water through water conservation and increased reuse and recycling (McDonnell, 1999). For instance, event attendees consume significant amounts of potable water while utilising toilet facilities. The implementation of sensor-activated sinks for washing hands and urinals which only flush on an automatically timed system can dramatically decrease water usage. It is important to note that this example may only be applicable in events which utilise permanent venues such as a showground or an entertainment centre. Solid Waste Production Objective: Reduce the amount of solid waste generated. Waste management is an important consideration for all event organisers as the amount of solid waste generated by an event can be dramatically reduced (Van Der Wagen, 2001). Event organisers can first look to reduce the quantity of materials consumed, then consider reusing, or if not possible, recycling waste products (Green Globe 21, 2004a). As an example, caterers for events can employ non-disposable cutlery and crockery or biodegradable containers (McDonnell, 1999). Additionally, event organisers can provide clearly marked bins to facilitate recycling (Van Der Wagen, 2001). Social Commitment Objective: Develop and maintain positive, productive and sustainable contributions to the local community. Green Globe assesses the social commitment of an operation by measuring the number of employees that have a primary address close to where the operation is based (Green Globe 21, 2004a). This can easily be incorporated into event planning by focusing human resource requirements within the local community. Encouraging local employment and involvement in events can help to improve community identity and well-being (Hall, 1992). While there are other social contributions that events can make to a local community, they are not within the scope of this paper because the Green Globe indicators focus only on community employment outcomes. Resource Conservation (Paper) Objective: Reduce consumption of natural resources and the impact on ecosystem biodiversity. Purchasing supplies of materials from sources using environmentally sound ingredients and processes can be a major contribution to resource conservation. Green Globe recommends the use of ecolabel paper combined with a strategy of internal reuse and recycling for all office products such as copy paper, brochures and registration forms (Green Globe 21, 2004a). While this is certainly applicable in special events, it is necessary to modify Green Globe’s recommendation to also include the transfer of information electronically where possible to conserve paper, and the use of ecolabel products in other areas such as toilet and catering facilities. Cleaning Chemicals Used Objective: Reduce non-biodegradable chemicals discharged into the environment. A reduction in the amount of chemicals used and an increase in the use of ecolabeled biodegradable products can help to reduce environmental contamination (Green Globe 21, 2004a). Event managers can substitute where practical non-toxic biodegradable substances in areas ranging from catering to general maintenance. Van Der Wagen (2001) advises that professional contractors are

available to event organisers to give advice on the correct disposal of toxic waste that could affect the environment. Vehicle Management Objective: Encourage operation of vehicles performing to maximum efficiency. Green Globe’s vehicle management indicator ensures regular vehicle maintenance as per the manufacturer’s schedule in order to control exhaust emissions (Green Globe 21, 2004b). This measurement is inclusive of all vehicles used in the operation but not of those used by customers to travel to the attraction or activity. In the case of events, it is recommended that this indicator be changed to include transport to the event for event attendees. Accessibility can be a major challenge in event planning but the traffic impact of visitors on the environment can be reduced by developing a system which encourages the use of public transport or shuttle buses in accessing the event (Hall, 1992). It needs to be recognised however, that regional areas are often the regions where governments try to promote events because of their potential economic and social benefits. Event attendees in regional areas however, cannot generally access the same level of public transport that can be accessed in metropolitan centres so the issue of transport and the vechicle management indicator can be problematic for some event sites. CONCLUSION While there are some omissions (such as the sustainable handling of food, provision of accommodation, resources other than paper), Green Globe 21 Benchmarking Indicators for Activities and Attractions are highly adaptable to the event sector. Of the eight indicators included in the standard, six are currently suitable to events in their present form while two require adjustment. The two indicators requiring adjustment are Resource Conservation (Paper) and Vehicle Management. While Resource Conservation (Paper) would benefit from only minor adjustments such as adding recommendations to substitute electronic transfers of information for paper and the extension of ecolabel paper use to include areas such as toilet facilities and catering operations, the Vehicle Management indicator requires a major overhaul. This indicator needs to be changed so that it measures the usage of public transport by event attendees in order to encourage more environmentally-friendly accessibility to events. By adopting these recommended changes to the benchmarking scheme for activities and attractions, Green Globe will be able to add a twenty-sixth benchmarking scheme to its repertoire. But more importantly, the event sector will have a useful accreditation scheme helping it to minimise the negative environmental impacts of events as they strive for more environmentally sustainable outcomes. As the umbrella of sustainability expands its coverage, each industry must reassess its environmental impacts and the tourism industry has been no exception. But while this industry’s practices have been thoroughly scrutinised, the event sector has received little environmental guidance despite its strong linkages to tourism and its large capacity for negatively impacting the environment. The successful application however, of Green Globe’s environmental accreditation scheme for sustainable tourism to events is certainly a beginning in developing sustainable practices for the event sector. REFERENCES Cooper, C., Fletcher, J., Gilbert D., Wanhill, S. (1998). Tourism: Principles and Practice (2 ed.).
New York: Longman Publishing.

Garrod, B., and Fyall, A. (1998). Beyond the rhetoric of sustainable tourism? Tourism Management, 19(3), 199-212.
Getz, D. (1989). Special events: Defining the product. Tourism Management, 10(2), 125-137. Getz, D. (1997). Event Management and Event Tourism. New York: Cognizant Communication
Corporation. Green Globe 21. (2003). Company Standard for Travel & Tourism. Retrieved 11/2/04, from
http://www.greenglobe21.com/Publications.aspx Green Globe 21. (2004a). Benchmarking Indicators for Activities: Sustainable Travel & Tourism
Innovations Pty Ltd. Green Globe 21. (2004b). Benchmarking Indicators for Attractions: Sustainable Travel & Tourism
Innovations Pty Ltd. Griffin, T., and DeLacey, T. (2002). Green Globe: sustainability accreditation for tourism. In R.
Harris T. Griffin and P. Williams (Ed.), Sustainable Tourism: A Global Perspective. Oxford: Butterworth-Heinemann.
Hall, C. M. (1992). Hallmark Tourist Events: Impacts, Management and Planning. London: Belhaven Press.
Ham, S. H., and Weiler, B. (2002). Interpretation as the centerpiece of sustainable wildlife tourism. In R. Harris T. Griffin and P. Williams (Ed.), Sustainable Tourism: A Global Perspective. Oxford: Butterworth-Heinemann.
Hjalager, A. (1996). Tourism and the Environment: The Innovation Connection. Journal of Sustainable Tourism, 4(4), 201-218.
Liu, Z. (2003). Sustainable Tourism Development: A Critique. Journal of Sustainable Tourism, 11(6), 459-475.
McDonnell, I., Allen, J., and O'Toole, W. (1999). Festival and Special Event Management. Brisbane: John Wiley & Sons.
Van Der Wagen, L. (2001). Event Management for Tourism, Cultural, Business, and Sporting Events. Melbourne: Hospitality Press.

Fourth International Event Research Conference Re-evaluating the City/Town: Events as a Catalyst for Change
DEVELOPING A PROFILE STRATEGY FOR FESTIVALS AND SUPER SCALE EVENTS
Chris Kemp The Faculty of Enterprise & Innovation
Buckinghamshire Chilterns University College, UK [email protected]
ABSTRACT The behavioural aspects relating to crowds at festivals and super-scale events have become the most important issue in the modern event environment. The creation of profiling tools and crowd assessment portfolios has enabled the compilation of audience profiles, which enables those organising events to be better prepared for future interface with anti-social crowd behaviour. Although crowd profiling has been in use for many years its recent application to the purpose of informing risk assessment has been revolutionary. However, some event organisers have identified that profiling may detract from the usefulness of their already highly tuned early warning systems and that cause and effect rely very much on what happens on the day of a live event. This paper offers a critical review of a series of data capture opportunities at European festivals and super-scale events. Following an outline of the methodology employed, a framework for critical analysis of the findings is established. The analysis generates a number of key issues and suggests an agenda for the development of a European-wide profiling website where those organising events can access information which may help them to create an overarching risk assessment and a management strategy to deal with any event. Keywords: Crowd profiling, music events, risk assessment, and managing super-scale events
INTRODUCTION For some the idea of standing in a field all day listening to loud music may signal the decline of contemporary society, but for millions of concert goers throughout the world it signifies one of the most important growth areas in recreation. The festival and super-scale event is a multi billion pound industry supported by a substantial socio-economic and environmental infrastructure. Not only does it enable individuals and groups to demonstrate their allegiance to artists, genres, sub cultures or specific events, it also creates a musical community which is one of the fastest growing communities in existence. The traditional view of community has recognised this entity as a normative ideal (Delanty: 2003) or, as Aristotle stated, the city (polis) itself could be identified as a community. Nisbett (1953) describes the emergence of totalitarian ideologies in his image of community. However, none of these interpretations of community adequately describe the type of community presented and discussed in this paper. In the context of this paper the word “community” relates to the fragmentation of the urban community and the re-positioning of the community as belonging to a more tenuous communication group. Music has been used in the context of radical protest, a search for the “alternative society”, or the development of social movements, which have been instrumental in the overthrow of many fascist or communist regimes and thus fit the criteria which identify community as communication. For example Habernass (1998) identifies the existence of ‘multiple communication communities’, as such this definition can be related to the multi levelled sub-culture and genre structure of contemporary music. Bauman (2001), however, identifies community as a promise for security where in actual fact he expresses that it only delivers “nostalgia and illusion”. The development of music communities and the coming together of

crowds to commune on single, multiple or extended occasions has some sympathy with such a notion where the crowd wish to see an artist, which they have seen or heard many times before, so that memories of past performances or places are evoked or that the illusion of an “alternative” world is created for a short period of time. Part of the beauty of the music community is to be able to live an “alternative” existence outside society for a prescribed period of time. The majority of those attending concerts would not be able to survive if the community met for more that a few days at a time as their behavioural patterns would not be tolerated in any community for long periods of time. Those people living permanently in alternative sub-cultures would survive but these groups of people are few and far between and have already built up communities in which to exist with their own norms and values, which perpetuate and are not brought in each time they visit an event. Coupled with the development of musical communities is the development of an illusionary idea that self-realisation can be enhanced by participation in collective recreational activities. This phenomenon can be observed at every mega music event (Melucci:1996). The transitory music community is constructed outside “normal” society and is quickly deconstructed when events finish only to be built again on the occasion of the next festival or event. Some parts of the framework still exist including the music and the individual’s taste for that kind of music and the sartorial factors may represent themselves in a modified way in everyday situations in society. However, other elements are still not accepted in the normal view of life. Such elements are related to Bakhtin (1998) who states that that there is a relationship to the ‘carnivalesque’ where during the carnival all non-carnival life is suspended, which enables the dissolution of inequality and so people of all ages, races and creeds can commune together in the musical community. There are, however, genres where this does not fit, for example hip hop where the community is focused on one race/colour and is almost exclusive to this community in certain areas. Carnival allows ‘the latent sides of human nature to reveal and express itself’ (ibid, 1998). Linked to this is the appropriateness of the behaviour practiced within the concert environment. There is a great deal of activity at concerts, which is not legitimated in what we class as “normal” behaviour in society. Dance rituals, sartoriality, crowd surfing, stage diving and others are part of the concert ritual and as such the ‘display of properly occasioned activity seems to be only one of the general forms or propriety, only one of the ways of fitting in’ (Goffman: 1963). It has been suggested by Goffman (1963) that ‘the behaviour of an individual while in a situation is guided by social values or norms concerning involvement’ It is clear from research that differing groups of those attending concerts have different priorities in the concert arena and as such the complexity of the concert community is increased. Investigating the nature of the audience at such events requires the development and employment of brief questionnaires administered by researchers. In such contexts the delivery of useful information is related to many of the macro and micro environmental factors which underpin the success or failure of these events. For example, climate changes, drugs, alcohol and other factors often militate against coherent responses which would add value to such mechanisms. However, the development of wide ranging, tested questionnaires gives a more focused delivery to the context in hand. The gaining of information from the audience members was crucial to this study and the way in which questions were asked and their context was important. METHODOLOGICAL DEVELOPMENT In any given concert environment the key issues in the profile of the crowd revolve around the interface between the physical, the social and the psychological. It is clear from the research, carried out by the Centre for Crowd and Safety Management at Buckinghamshire Chilterns

University College over the last five years, that all concert attendees in the light of past event disasters carry out a personal risk assessment. This assessment takes into account the topography of the site, the climate, and preparedness of the internal and external customers, the genre of music, the event environment and also the culture of the event. Having carried out a number of studies investigating audiences’ perceptions in the past to ascertain similar information it is apparent that the most important factor is that the questions are focused towards the experience of, and the environment within which, the questions are posed. In research of this type it is important to identify why profiling is being targeted and also what types of questions should be used. Both quantitative and qualitative questions are important as those questions, focused on a numeric response, are useful to ascertain a demographic profile whilst open questions, focused on social aspects are useful to obtain comparative data about perceptions of the event. However, the employment of a mixed methodology supporting both research paradigms is difficult to justify where resources are low and there is little or no rationale behind such a decision. Thus the proposed outcome of the process is important. The identification of the proposed outcome in the case of profiling is to identify pre, during and post activity perceptions of the safety of the crowd at the event. This focuses primarily on the physical aspects of the concert rather than the social or the psychological, although these are inextricably linked by the way in which they interrelate and although not a primary focus do impact on the purpose of the profiling. To enhance the way in which the profiling questionnaires were constucted, YOUROPE, the European Agency for Concert Promoters was enlisted to support the development. Two sessions within the Health and safety conference were utilised without the prior knowledge of the participants to extract complex and original objective viewpoints relating to the types of questions to be posed and the way in which the subjects broached and the audience/attendees targeted should have questions delivered to them. In total 2,500 questionnaires were administered by a team of 30 researchers. Since the questionnaires were researcher administered the rate of response is very high. However, it must be noted that although a convenience, and on many occasions opportunistic, method of sampling was utilised, the high response of participants offers a good representation of the population as a whole. REFLEXIVITY IN THE FIELD Owing to the nature of concerts and festival events it is virtually impossible to ask questions during the period of time in which the band are on stage. This is for three main reasons: the noise from the artist, the state of the audience and the focus of both internal and external customers whilst the artist is on the stage. Thus a decision has to be taken when to interview participants. Through trial and error, and over a series of thirty concerts, it is clear that the best time to interview participants is during the thirty minutes before the artist takes the stage. This time is chosen for two reasons. Firstly, the audience are captive and often bored, secondly because the audience, which you want to capture, is in situ. To carry out fieldwork after the artist leaves the stage is flawed for two reasons. Firstly because the audience are leaving the area to participate in other activities, and secondly, the audience are exhausted after the event and are less likely to give suitable answers to questions. It is also clear from past research that self administered questionnaires are more likely to have errors than those administered by the researcher as there is little possibility of focusing the person questioned if they have full use of the questionnaire unaided.

Clarity of purpose is essential in such an environment and a finite and small number of questions ascertaining maximum knowledge are crucial. Extraneous, ambiguous or double questions must be avoided. The best way to identify the questions is to create an outcome, look at the questions and see if they are likely to give you the outcome that you want. Pilot the questions on several occasions and then, where necessary, amend them. Once this has been done the questionnaire is ready to administer. It is clear that the environment and both the social and physical habitat in which the respondent exists during the event is very different from their usual habitat and therefore this issue must be addressed both by the way in which the questions are asked and by whom they are posed. QUESTIONNAIRE Key questions, which arise in the development of a profile process, centre firstly on demographics. For example age and sex are essential indicators in building up the activities of an audience. The age profile of an audience can instruct the ordering techniques for alcohol and soft drinks thus making such processes more effective and efficient. Information, relating to modes of transport and place of domicile, such as how long it took to get to an event or how they participants got there and where they live, are essential in building up patterns of attendance. What is the catchment area for the event and what is the ratio of public to private transport? These types of question are essential to the event manager in planning for further events with similar artists or spread of bands or demographics. The identification of more qualitative questions is linked to the outcome of the project taking place. For example identifying how safe the crowd feel in the arena may prompt questions related to how good they think the security of the event is (how they rate it) or how safe they feel at the front of stage when the event is taking place. Questionnaires requiring purely quantitative responses do not have a personal feel and focus more on numerical answers. From work with YOUROPE it is clear that the focus should be on qualitative approaches which enable attendees to give an answer which contains little more than just a judgement. However, in some cases such a judgement is valid and can be used to identify how many people felt such a response. For example, utilising a closed question with predetermined responses like how safe do you feel at the front of stage? The range of signifiers could be totally safe, safe, neither safe nor unsafe, not safe, very unsafe. Such a linkage of questions would focus on a generic safety feeling in a crowd even if it is not specific enough to ask why. In many cases such a question is enough to gain the desired information. The analysis of the questions does identify some key issues in relation to objectivity and subjectivity. For example, are the respondents responding objectively on some questions and not objectively on others owing to the state of euphoria and also due to the possibility of alcohol or drugs? Thus the issues go far beyond the normal respondent parameters. However, many respondents are less inhibited on such occasions and this aids the interviewer. The linkage of profiling to risk assessment is a key element in the staging of the safe concert. The more information, which can be fed into a data base in advance of a show, the more accurate the risk assessment development, can be. If profiling is done on the web in advance, the possibility of having to address issues, such as questioning and inputting data, at the time of the event is obviated as websites can be fitted with analysis equipment. However, when utilising issues such as health and safety this data cannot be pre-developed as the research has to be carried out in situ rather than in advance. Judgement cannot be passed since the event has not happened. After the event the memory of participants soon dulls and may be different under the absence of alcohol or drugs. Thus the only way to collect such data is to get on site information at the time of the concert.
Critical analysis of such questions is often difficult as the premise on which responses are given may be a whim and to read too much into a response may not be what is needed. It may be preferable to take a response at face value to get a ball park figure of the general thought which can give a direction of thought rather than a completely true response and thus only generic rather than specific issues can be broached. This situation also relates to the time frame in which such questions can be asked and as such to gain a recognised level of response it is often better to gain mass response to quick questions rather that slow responses to detailed questions which may not in the end either give you enough responses or indeed the type of answer required. CONTEXTUALISATION AND PILOT DEVELOPMENT UTILISED AT SIX PAN EUROPEAN CONCERTS PAN EUROPEAN FESTIVAL QUESTIONNAIRE ANALYSIS At each concert researched fieldwork was carried out to ascertain demographic evidence, possible cultural differences between events, preparation of the audience for such events, patterns of initial migration and expectations/perceptions of safety. This excerpt focuses on the total questionnaire bank to identify the overall perceptions of the audience across Europe in regards to the festivals and events researched. In the summer of 2005 a pilot study was carried out to ascertain whether it would be a useful exercise to question audiences about their perceptions of festivals and events across Europe. From the results of the pilot study the researchers identified that it would be useful to obtain further evidence to support some of the emerging developments identified in the results of the pilot study. The pilot study demonstrated that the main source of information through which respondents identified that an event was taking place was through the internet. However, from further research, undertaken during the summer of 2006, contrasting results were discovered. From those interviewed (2500) 30.8% utilised the internet to discover information about an event, whilst 25% utilised television and radio for their information. 13% found this information from newspapers and magazines whilst only 5% were informed by being on a mailing list. However, 56% found out by other means, usually word of mouth i.e. by talking to friends. From the aforementioned research it is difficult, without focusing on the individual events, to determine whether the use of the internet is a specific tool for certain genres, events (one offs or festivals) or whether it is utilised across the range of events studied. It is clear, however, that the internet is still one of the three main drivers for discovering festival and event information alongside word of mouth and television/radio. Nonetheless, these results are dependent on whether the attendee is a first time audience member or whether they have frequented concerts for a number of years. Further research regarding this important issue is required. Waiting times at events are a key element in the control of crowd development. Long queues are one of the five major issues (queuing, pricing, transport, climate and waiting between acts), which can cause unrest or a reduction of the total quality experience of a show. In the case of bar queuing, across the European events researched, 77% of those attending were served within a five minute envelope, 89% within a 20 minute envelope and only 1% had to wait over 30 minutes to be served. The ease of access to bars at all festivals and the number and way in which the bars are managed shows effective and efficient system development which enables the majority of attendees to be served quickly and efficiently. Nearly 60% of all attendees were able to access the festival or event within five minutes of arriving and 75% could gain access within 20 minutes. Just over 10% of attendees had to queue for over 30 minutes. When questioned, these proved to be attendees who had often queued overnight to be first into the event. From the aforementioned research it can be identified that

the majority of attendees are able to enter the festival or event within five to twenty minutes of the gates opening or within five to twenty minutes of their arrival at the site. Transport issues are always at the forefront of such event research as it is clear from pilot studies and other research that containing and delivering a good transport service is vital to the development of the total experience. Across Europe 46% of the attendees were able to park within five minutes of arriving at the venue or reach the venue from coach parks or train stations within this time. 63% were able to carry out this manoeuvre within 20 minutes and 22% took 30 minutes or more to either park or reach the destination on foot or by public transport. Although all festivals did have car parks, congestion on approach roads was one of the main reasons for extending the time of reaching the site. In the main the rail links were effective and efficient but often coach parking was difficult. From past research toilets are key factors in the development of the total experience. Not only is it their cleanliness and the ability to access soft, or any, toilet paper but the audience issues also revolve around the queuing systems employed and the wait for cubicles derived from this. Across Europe 68% of attendees could access a toilet within five minutes of beginning to queue and 85% were able to gain access within twenty minutes. Only 3.8% of people had to wait for over 30 minutes to access a toilet. Although the percentages of those able to access toilets within twenty minutes are high, it is still unacceptable that attendees at some events have to wait for over thirty minutes to go to the toilet. These results, however, are often moulded by other factors. For example was the festival sold out on all days? If not, the effect on queuing would be different on each day. We also need to determine whether there are other macro and micro environmental factors, such as female to male ratios, which might affect the queuing systems. The layout of events and the placing of toilets are also key issues in planning an event. From researchers’ observations it is evident that there is a tension in some toilet areas where massed crowds are gathered but often on the periphery of a site there are toilets where no waiting time is needed. This should be taken into consideration in planning and providing clear signage at the event. Gender relationships, as stated earlier, are important. For example, the male urinals found at Pinkpop comprise of a large trench with a corrugated iron fence to block off the view of other concert attendees. This meant low waiting times for males but was not suitable for most females. Findings of the research clearly indicate that the effectiveness and efficiency of festival and event sites, and the timeliness of operations, has an approximate efficiency rating of 75% across a 20 minute waiting time for the issues researched. However, overall such a rating is poor as a further 25% of attendees are not able to access key areas within the twenty minute efficiency envelope. The bar and toilet efficiency rating is higher than that for ingress and transport issues although this may differ between sexes. It is these two areas; ingress (entrance and exit) and transport, which are often external to the event and which cause the most efficiency problems. Planning and preparing for the staging of an event are extremely important. Ensuring that an attendee can gain full benefit from the experience is of paramount importance in achieving repeat visitation. In the pilot study it was clear that the issues identified had to be revisited with a modified questionnaire. By far the most important finding of this study is that of mobile phone frequency at events and festivals. 81% of all of those attending these events were carrying a mobile phone. It was also clear from further qualitative research that some couples carried one between them and thus the coverage of the event attendees by mobile phone would be near to 100% ceiling. 55% of attendees had some form of warm clothes and 53% brought a coat. 22% brought water to the event, 24% a hat, 18% sun cream and 9% a rug. In previous research, (2001/2002/2003/2004) where more family oriented events were researched, a high percentage of the audience brought

something to sit on. At these events, which are generally more youth orientated, the attendees tend not to sit on rugs or blankets but use the ground or paper/plastic bags when necessary. At most of these events the weather was sunny and warm and the lack of sun cream and hats was a disturbing factor. Although all of these items can be purchased at a festival or event site it is clear that the possibility of sunburn or sun stroke is not an issue which the crowd take seriously enough. Findings, however, indicate that most attendees realise that temperatures can fall drastically as the evening approaches and the identification of warm clothes or a coat are a necessary part of event and festival culture. Respondent perception of overall safety at the event is positive. 30% of respondents perceive that it is excellent and 57% that it is good. 12% identified that it is adequate and 1% that it is poor. Therefore, respondent perceptions of safety across Europe are fairly good with 87% of the attendees holding good or excellent perceptions of safety. However, with 12% of respondent perceiving that it is only adequate, further research is required to examine why the perception is at this level. This is a limitation of using closed questions where an open-ended question would have allowed respondent voices to be heard on this important issue. Those identifying the safety as poor may be those who are first time attendees, those who have inadvertently been involved in front of stage activity, or those who have been injured or had a bad experience in the past. The identification of an objective, rather than subjective, view of safety is difficult to assess and it is often an issue of timing or delivery which needs to be addressed when such questions are asked of attendees. It was also important to examine how the audience felt whilst at the front of the stage. Findings indicate that 34% of respondents felt ‘great’, 45% excited and 24% normal. The analysis reveals that 95.5% of the audience in front of the stage have a positive or indifferent feeling to the events taking place. 1.9% of the audience felt scared and 2.6% felt uncomfortable. From this research it is clear that the majority of those taking part feel fairly comfortable about the activities taking place and only a small percentage feel uncomfortable. However, in the case of this question, the small percentage equates to 81 persons, and this is a fairly high number. Further research will show if this number is at a specific concert or whether this is spread out across concerts in Europe. The audience perception of the security and crowd management at the event is another key issue in identifying the safety perceptions of the audience. Across Europe the perceptions of respondents are similar. 28% of respondents feel that the event is safe and well managed, 53% perceive that it is safe and friendly and 18% feel that it is safe but could get dangerous. Thus 98% of the audience perceive that the management of the event in relation to safety and crowd control is good. 1.2% perceives that the event is dangerous, or extremely, dangerous. Across Europe this makes up 21 persons at the events where research was conducted. From this it can be deduced that the way in which the crowd management at the events is operated is perceived to be safe by the vast majority of those attending events. However, it is difficult to say what this perception is based on. Does this perception of safety come from the way in which the event is managed or is it from the design or structure of the venue? The human and mechanical interaction is often a key element in the creation of a safe environment and more research needs to be carried out in this important area to obtain more in-depth results. It is equally important to find out from which factors the perception of danger arises. Is it from a breakdown in crowd management, crowd behaviour or design or structural failure? Attendees were also asked which elements may have given them cause for concern at events and festivals. By far the most serious factor was that of crushing, where 40% or those questioned perceived that crushing was the greatest cause for concern at an event. The next two factors which gave fairly equal cause for concern were ‘not being able to get out’ (23%) and ‘fighting’ (24%). Mass bodies (18%) and lateral movement (15%) also gave cause for concern.

However, crowd surfing (9%) did not appear to be a major cause for concern to respondents. 22% of those questioned had no cause for concern about any activity taking place in the arena. However, although other elements, such as criminal activity or climate, could have been considered in this investigation, it was felt by those conducting the research that the major issues affecting those in the front of stage area were taken into consideration. The research also aimed to ascertain why attendees tend to move towards the front of stage rather than finding a place of comfort from which to watch the artist. The following results give an insight into this phenomenon. 68% of attendees go to the front to be as near as possible to the artist. 36% move towards this area specifically to have fun. 19% move here to specifically be with their party of friends 14% to dance or ‘mosh’ and 13% to be with others who like the artist. It is clear from this that the reasons are purely social and that to be close to the artists, with those of a like mind, having fun with friends and being able to dance with others are key to the enjoyment of those attending. The roles of security and crowd management teams are crucial in the development of trust systems within an event or festival. Attendees were asked to respond to a question focussed on who they would turn to if they were in trouble. The answers to the question were fairly well divided. 58% identified that they would turn to the security or crowd managers for help and 61.5% to friends. Such a split shows an equal reliance on friends or crowd management. This summer (2006) it was considered essential to determine the pattern of attendance by concert goers. It is clear from the evidence that there is a fair spread of first time attendees to those who have attended over ten events. For 11.2% of the audience this was the first event they had attended, 35% of the audience had visited 1-5 festivals, 20.5% had visited between 6 and 10 festivals and 33.3% had visited over 10. Findings thus indicate that there is still an influx at the bottom end of the festival and event scale identifying new concert goers entering the concert chain. It also shows that there are increasing numbers of attendees at all levels continuing to support the process. Linked to this was a question about how many gigs audience members had been to. This shows that only 4% of the audience had never visited a gig before. This evidence identifies that attendees tend to go to a number of gigs first before embarking on a festival or superscale event. However, there are still 4% who bypass the gig to attend a mega event. 55% of the attendees are regular gig goers and have attended over 10 gigs in their lives. However, in the categories 1-5 and 6-10 attendances it is clear that more attendees have frequented festivals or large events than they have gigs in these areas. 21% of attendees thus frequent more gigs than festivals in the over 10 category but 10% less attendees frequent gigs than festivals in the 1-5 range and 5% less in the 6-10 range. This means that there is a correlation between frequent (over 10 gigs and festivals) gig and festival goers as these people tend to attend both a large number of gigs and festivals. However, in the less frequent gig and festival goers category there is a tendency to attend festivals rather than gigs. This could be attributed to a number of issues. Firstly, the cost of such events may be outside the spending capacity of the individual; bearing in mind the ages of these attendees. Secondly at a festival or superscale event there is the ability to see more than just one artist. There is also the correlation between a major festival or superscale event and major stars. Furthermore, there is a clear linkage to genre. These factors will be further explored in future research, which aim to investigate the genre of artists at festival and superscale events. Attendees at festivals and superscale events across Europe are fairly evenly representative of both sexes. From an age perspective those under 18 make up the lowest proportion with 16% of attendees, 26-30 year olds are next with 17.7%. Next are over 30s with 19.7% and then 22-25 year olds with 22.9% and the 19-21 age range with 23.9%. This demography will change with genre and cultural differences in legal and guidance elements from country to country across

Europe. The results will also depend upon how the event is made up, for example the way in which the programme is put together. As the genre of the events researched was mainly rock or indie the sex of the attendees was fairly constant at 55% male and 45% female. It is clear from the aforementioned research that the majority of the audiences across Europe are happy with the way that festivals and superscale events are managed in relation to security and event planning. They perceive that the front of stage area is well managed and that they would either call upon the crowd management company or a friend if they were in difficulty. The main cause for concern is crushing and not being able to get out. The attendees feel that fighting is unacceptable behaviour at events and should be filtered out. This is an important issue that should be taken into account by managers at festivals and superscale events. In relation to sourcing information about events, word of mouth is essential and continues to be the largest single way in which attendees find out about the event. However there is a rise in the use of the internet and websites across Europe. This has not risen this year as much as was first anticipated. Inside the event the queues for bar and toilet facilities do not seem to detract from the total quality of the experience although transport and ingress issues have caused some problems at events and festivals around Europe. Smoother transport planning and revisiting the ingress systems may pay dividends in such areas. As findings have evidenced, attendees continue to be fairly unprepared for events and it is clear that more regular attendees are better equipped for the event. The mobile phone is a cultural icon and essential to those attending for communication, photo opportunities and to keep in touch both internally and externally at the event. Management systems seem to be fairly well understood by the attendees. However, it seems that the imparting of information prior and during the event is still an issue. The use of a wide range of communication systems and the creation of a festival survival pack with sun cream, a hat and possibly condoms, amongst other items, would be very suitable to meet the needs of those attending concerts for the first time. Much of what is inferred here is similar to the findings of the pilot study although from further research it is clear that whilst focusing on a small number of concerts issues were identified, findings of research undertaken at a larger number of events shows that these change owing to various cultural and demographic factors. CONCLUDING POINTS In an environment or communit as volatile and unstable as the festival or superscale event, the compilation of a unique database combining both demographic and situational data would aid in the development of unified concert procedures across Europe and an intelligence source for those promoting on the festival and event circuit. The key pointers in the development of such a profiling database across Europe for Festivals and Events should focus on the way in which data are both captured and presented. It is clear that in the first instance, identical data for each event must be captured and thus a template set of questions should be created. From such a template other questions can be inserted universally at a later stage or specific questions can be inserted for others to view if more information is needed. Thus, a generic base is firstly created and then secondly a specific data base is added for those wishing to develop other issues. From research, undertaken in 2006 in Berlin (at Popkom), health and safety issues are mostly generic to Europe and these issues are found at all events. However, there are also a number of specific issues which revolve around culture and the event environment within which cultural changes have taken place. Thus the generic questions can be created in a matrix whilst the specifics are identified on another matrix for those interested. In this way a series of pages on the database can be set up for each of the further specifics which people wish to explore. This may include a wide range of aspects in the context of hospitality ordering, the utilisation of and the number of crowd management employees required to man an event and the identification of, the type and

the number of products needed to support the event (i.e. water, sun lotion and hats). Such a profiling system could be crucial to the safe delivery of an event. However, it is clear from the foregoing discussion that to rely solely on information from such a system would aid complacency in the development of risk assessment, analysis and management. Thus the profiling systems should be used as part of a wider strategy and not as the sole tool for providing information in the festival and superscale event environment in which cultural and antisocial behaviour are prevalent. It is therefore a key aspect of such profiling activities to create and develop an holistic view of this area in the context of risk assessment, analysis and management. REFERENCES Bakhtin, B. (1998) Carnival and the Carnivalesque’, Cultural Theory and Popular Culture: A
Reader, 2nd edition, edited by John Storey, Hemel Hempstead: Prentice Hall. Baumann, Z. (2001) Community: Seeking Safety in an Insecure World. Cambridge:Polity Press. Delanty, G. (2005) Community. London: Routledge. Goffman, E. (1963) Behaviour in Public Places: Notes on the Social Organisation of
Gatherings. New York:Free Press. Habernass, J. (1998) The Inclusion of the Other: Studies in Political Theory. Cambridge,
MA,:MIT Press. Melucci, A. (1996) Challenging Codes: Collective Action in the Information Age.
Cambridge:Cambridge University Press. Nisbet, R. (1953) The Quest for Community. Oxford:Oxford University Press.

Fourth International Event Research Conference Re-evaluating the City/Town: Events as a Catalyst for Change
EVENT MANAGEMENT EDUCATION: THE STUDENTS’ PERSPECTIVE
Olga Junek School of Hospitality, Tourism and Marketing
Victoria University [email protected]
Leonie Lockstone
School of Hospitality, Tourism and Marketing Victoria University
Linda Osti
School of Tourism and Hospitality Management Southern Cross University
ABSTRACT Events management courses at university level have gained in popularity and subsequent enrolments in the last decade, largely due to the phenomenal growth in the global events industry. The aim of the current research is to better understand the expectations, attitudes and perceptions that students have towards their event management courses. In undertaking the research, students at two universities were surveyed: Victoria University (VU) in Melbourne and Southern Cross University (SCU) Tweed Heads Campus. Questions were aimed at establishing student profile, motivational factors driving course choice and skills important for working in the events industry. The results indicate that when choosing a course in event management, students at both universities had clear ideas about course expectations and how their degrees could be instrumental in teaching skills and knowledge needed for working in the events industry. Most students surveyed already had a strong interest in events and associated industries, and those who did not found that the event management subjects they studied helped to pique their interest in the area. Communication and management skills were seen as the most important skills needed to work in the industry. Given the emerging nature of research on event management education, the findings offered by this paper on the motivations and perceptions of event management students regarding their future career sector of choice, should be considered tentative towards an agenda for future study.
INTRODUCTION Events management courses at University level have gained in popularity and subsequent enrolments in the last decade. This is largely due to the phenomenal growth in the global events industry (Allen et al. 2005; Mules 2004). Event management courses have become a popular choice for students who in the past may have enrolled in tourism and hospitality courses. Based on current demand, events management courses are now viewed as very desirable, with high expectations on the students’ part as to where these courses will take them in their future employment. At the same time there have been some doubts expressed about the reality of the industry being able to employ the ever growing number of event management graduates (Sims 2005). Anecdotal evidence

suggests that the students’ expectations are high and aimed at working for the high-profile, major and mega events. The aim of the current research is to better understand the expectations, attitudes and perceptions that students have towards their event management courses. Students at two very different campuses took part in this research. Those at Victoria University (VU) in Melbourne, live in a city renowned for many major and mega events, especially over the last two years. Events such as the 2006 Commonwealth Games, the Australian Open, the Australian Formula One Grand Prix and the 2007 FINA World Swimming Championship provide these students with living examples of major events and perhaps motivate them to enrol in event management courses. In contrast, students at Southern Cross University (SCU) Tweed Heads Campus are not exposed to similar major events but rather to a number of community based and smaller events such as the Wintersun Festival in Coolangatta-Tweed Heads, the East Coast Blues and Roots Festival in Byron Bay, and the Lismore Lantern Parade. Victoria University VU has been at the forefront of event management education and offers students a Bachelor of Business in Event Management, which can also be combined with one of a number of the other disciplinary areas such as tourism, hospitality, sports administration and music industry management. Both the straight and the combined courses have been attracting students domestically as well as from overseas and have shown a steady growth over the last 3 years (Victoria University Course Analysis 2006). Within these courses students study generic business subjects as well as six event management specialization subjects. In addition to their university subjects, students must also complete a component of Work Integrated Learning (WIL). This can take the form of Co-operative Education (Co-op), which is an industry placement in full-time paid employment for one year, or Business Integrated learning (BIL), which comprises 350 hours spent working in industry on either a paid or voluntary basis. Dependent upon their choice of course, students can take up to eight elective subjects. Southern Cross University Southern Cross University is Australia’s largest provider of Tourism and Hospitality courses by distance education. The Bachelor of Business in Convention and Event Tourism Management is offered by distance education and also at the Tweed Head Campus. In order to graduate, students are required to complete an industry Internship Program, 600 hours (20-24 weeks) of work experience in their final semester. The course structure combines business subjects with industry specific subjects including Project Management for Conventions and Events, Theming and Staging, Facility and Risk Management and Software Systems for Conventions and Events. RESEARCH OBJECTIVES The aim of the current research is to investigate student perceptions and attitudes towards the event management component of their degree. In particular, the research examines motivational factors driving course choice and the extent of knowledge students have about the events industry prior to commencing study. The skills students consider important for working in the industry was also assessed, as was the importance of WIL to course choice and motivation.

Whilst not an overriding objective, the research provided an opportunity to compare student perceptions and attitudes regarding the event management offerings of VU and SCU in order to ascertain if there were any significant differences. This feedback in relation to educational content and applied skills may ultimately be used in conjunction with relevant industry input to inform course decisions that enhance the value of the event management degrees these institutions offer. LITERATURE REVIEW Growth of the events industry, event education and training As the events industry has grown both in size and profile over the last decade (Allen et al. 2005; Shone and Parry 2004; Mules 2004; Harris 2004), so too has event management education and training (Harris and Jago 1999; Allen et al. 2005; Ruhanen 2006). As the number of events has grown, whether major, sports, community or business, the demand for training courses and professional staff has also increased. This has resulted in a large number of new Event Management courses, both in combination with other related courses such as hospitality and tourism, as well as those dedicated solely to the study of event management. So for example, in 2005 Southern Cross University was the first university to offer a Bachelor of Business in the Event Management area in the Brisbane and Gold Coast area. In 2007 both Griffith and University of Queensland offer courses and majors in Event Management. The delivery of these courses occurs both at TAFE (Vocational Education) and the higher education (university sector) level. Understandably much competition exists between universities as well as between the two sectors to attract students to their courses. Similar growth has also occurred in the UK, USA, New Zealand, Europe and increasingly in the last 5 years, in China and Korea (Hassanion and Dewhurst 2006). Faced with an increasing number of graduates applying for jobs, there has been some critical comment expressed by the industry. In particular, criticism has been aimed at the high expectations of graduates and the lack of knowledge and skills in some areas such as exhibitions and risk management (Grafton 2004). What has emerged as vital to event management courses and is supported both by educators and the industry, is the importance of experiential learning. This may be in the form of a co-operative year in industry (internship) or the planning and operation of real events in conjunction with industry as part of the course framework. Experiential learning is discussed in more detail in the following sections. Despite the growing importance and need for increased professionalism, research on event management education is still relatively scarce. Previous studies have included research on the development of event management specialization courses (Sims 2005; DeFranco et al. 2005; Hassanian and Dewhurst 2005) and the skills set and knowledge compatible with working in the industry (Perry et al. 1996; Harris and Griffin 1997, Royal and Jago 1998; Harris and Jago 1999). Getz (2000), in his discourse on event studies as an academic discipline, presents a critical analysis of events study programs at university level, discusses the development of this field of study and synthesises the literature related to this field. Getz also acknowledges and raises concerns about being able to develop courses which include all of the various components of event management and event studies. Experiential and work integrated learning Co-operative education has become more important both from the graduates’ viewpoint (Moscardo 2006; Ruhanen 2006) as well from the employer’s perspective (Leslie and Richardson 1999) as tourism, hospitality and event jobs have increased in numbers, recognition and profile over the last two decades. For graduates undertaking co-operative work or internship within the structure of their

course this represents a highly valued and regarded addition to their academic knowledge and skills and enhances their employability in a very competitive jobs market. A valuable link between the employer and the educational experience is forged (Williamson 2005) and this relationship offers advantages for both parties (Moscardo and Norris 2004). The literature points to the importance of student work experience in event management courses (Beaven and Wright 2006; Williamson 2005; Moscardo and Norris 2004) as well as in the related industries of tourism and hospitality. A two year longitudinal study into student perceptions of practical work in an Events Management course revealed positive feedback regarding the benefits of this applied learning experience (Daruwalla and Fallon 2005). Student expectations, perceptions and attitudes Research on event management students and their expectations and attitudes towards their course is limited, and focused on experiential learning and work placement (Williamson 2005; Solnet, Robinson and Barron 2006) and the academic aspects of event management courses, such as flexibility within the learning experience (Barron and Whitford 2004). In contrast, there has been more research from the employers’ perspective relating to their expectations of graduate skills (Beaven and Wright 2006) and the skills needed by industry in general (Beaulieu 2004). Similarly, in the related academic disciplines of tourism and hospitality, research has also focused on the work experience aspect (Barron 2005; Busby 2005) and on graduate skills from the industry and management perspective (Christou 2000). Research to date has not addressed the motivations of event management students, their perceptions of the industry and the perceived value of their course for future careers. METHODOLOGY Adopting a quantitative approach, data was collected using a self-complete questionnaire. The questions were designed mainly in closed response format, incorporating simple-dichotomy questions and attitude rating scales. There were, however, some open-ended questions included, enabling respondents the opportunity of, in their own words, elaborating upon certain issues. Included were questions aimed at establishing student profile, motivational factors driving course choice, skills important for working in the events industry and the importance of WIL to course motivation. Convenience sampling was used to source research participants. To ensure maximum reach, at VU students studying the event specialization subjects of Introduction to Events and Meetings, Conventions and Events were approached to participate. These subjects in particular were selected because, dependent upon whether their status is that of core or elective in relation to a students degree, the subjects are simultaneously studied on campus by first, second, third and fourth year students. At SCU, which offers both on campus and distance education, only on campus students were surveyed. The sample comprised first, second and third year students enrolled in Introduction to Convention and Event Tourism, Project Management for Convention, Events and Festivals, and Strategic Management. A total of 185 students completed the questionnaire (123 respondents from VU and 62 respondents from SCU). The scope of quantitative data analysis, as established by the instrument design, was by and large limited to providing a descriptive profile (frequencies and descriptives) in relation to the questionnaire items. Significance testing, however, was conducted to examine differences between certain respondent groups. It is acknowledged that a generic assumption of such testing is that

respondents are drawn from randomly sampled populations (Coakes, Steed and Dzidic 2006, p. 62). As such, in the current context, the tests of significance cannot be interpreted as inferential statistics in the true sense. It has, however, been reported that it is becoming increasingly common for social science journals to publish papers incorporating the results of significance testing based on non-probability samples (de Vaus 2002). Given this acceptance, and the emerging status of research relating to event management education, the findings of this testing may be viewed as exploratory and serve to provide direction for an ongoing agenda of research. RESULTS AND DISCUSSION Student study and work profile This section of the paper will provide a descriptive analysis of the students surveyed. Frequency analysis was conducted to gain a profile of the respondents’ characteristics in terms of their study status, prior work and volunteering experience and future work plans. The results of this analysis are outlined in Table 1.
Table 1 Student study and work profile
Descriptive profile VU %
VUN
SCU %
SCU N
Total %
Total N
Current study status Year of course 1st semester 42 52 58 36 48 88 2nd semester 8 9 7 4 7 13 2nd year 10 12 29 18 16 30 3rd year 19 23 5 3 14 26 4th year 17 21 1 1 12 22 5th year 3 4 2 4 Other 1 1 1 1 Total 100 122 100 62 100 184 Student status Full-time 92 112 98 61 94 173 Part-time 8 10 2 1 6 11 Total 100 122 100 62 100 184 Subject status Core 61 74 97 60 73 134 Elective 39 48 3 2 27 50 Total 100 122 100 62 100 184 Current work experience Prior to starting course, employed for 2+ years
Yes 13 16 23 14 16 30 No 87 107 77 48 84 155 Total 100 123 100 62 100 185 During course, work/ volunteer experience
Yes, worked 26 32 13 8 22 40 Yes, volunteered 21 26 34 21 25 47

Yes, both 7 9 18 11 11 20 No, neither 46 56 35 22 42 78 Total 100 123 100 62 100 185 Completed Work Integrated Learning (WIL/BIL)
Yes 18 22 8 5 15 27 No 82 98 92 56 85 154 Total 100 120 100 61 100 181 Future career plans Future industry - Hospitality Yes 19 23 13 8 17 31 No 81 99 87 54 83 153 Total 100 122 100 62 100 184 Future industry – Tourism Yes 17 21 27 17 21 38 No 83 101 73 45 79 146 Total 100 122 100 62 100 184 Future industry – Events Yes 62 75 89 55 71 130 No 38 47 11 7 29 54 Total 100 122 100 62 100 184 Future industry – Other Yes 30 37 10 6 23 43 No 70 85 90 56 77 141 Total 100 122 100 62 100 184 General demographics Gender Male 31 38 19 12 27 50 Female 69 84 81 50 73 134 Total 100 122 100 62 100 184 Age 18-20 years 45 54 69 42 53 96 21-23 years 41 50 18 11 34 61 24-25 years 9 11 7 4 8 15 26+ years 5 6 7 4 5 10 Total 100 121 100 61 100 182
Key findings of note from Table 1 were that the majority of respondents were undertaking their first year of study (55%) on a full-time basis (94%). The majority were undertaking the event management subjects sampled as a core unit of their degree (73%), however, this result varied between universities with 39% of VU respondents taking the subjects as an elective as compared to only 3% of SCU respondents. In terms of work experience, only 16% of total respondents had been employed prior to entering their course. Whilst undertaking their course, 58% of students had gained some experience in events, either working, volunteering or both. Despite VU’s extensive working integrated learning program, 46% of students indicated they possessed no job ready experience of events industry, in contrast to SCU’s students who indicated a higher rate of participation (only 35% of respondents

had not gained any professional experience whilst studying). A similar difference was also noted between the universities in the rate of volunteer participation. Results relating to the future career plans of these potential event industry employees further highlight differences between the two university respondent groups. As Table 1 outlines, the SCU respondents appeared to be more certain about their career aspirations with 89% of students indicating their wish to work in the events industry as compared to only 62% of VU respondents. VU students appeared more open to working in other industries (30% of respondents compared to only 10% for SCU). This may reflect the finding mentioned above that more VU students were undertaking the event management subjects sampled as an elective part of their degree. It should be noted, however, that the questionnaire design enabled respondents to select more than one option in relation to their future industry choice. Therefore, these results, to say the least, are only broadly indicative. Perceptions of necessary work skills for the events industry Students were asked to rank in order of importance various skills relating to the events industry. These skills included management, communication, time management, problem solving, team working, as well as commitment and the ability to handle stress. Table 2 outlines the most common response to each ranking point, with 1 representing the most important skill, and subsequent rankings indicating skills considered to be less important by respondents.
Table 2 Ranking of skills
VU % SCU % Total % Rank/Skill 1 Communication 37 Communication 36 Communication 37 Rank/Skill 2 Management 25 Management 32 Management 27 Rank/Skill 3 Communication &
Time management1818
Commitment 20 Communication 18
Rank/Skill 4 Team working 18 Problem solving 27 Problem solving & Team working
18 18
Rank/Skill 5 Problem solving 23 Problem solving 25 Problem solving 24 Rank/Skill 6 Commitment 22 Problem solving 23 Problem solving 22 Rank/Skill 7 Stress handling 32 Stress handling 42 Stress handling 36 Rank/Skill 8 Other skills 89 Other skills 84 Other skills 88
Students at both universities most commonly ranked communication and management as being the most important skill sets for working in the events industry. Problem solving was consistently ranked as being of mid range importance in regards to requisite skills. Across the board, stress handling tended to be perceived as being of lower importance. Course motivation In order to provide some insight into the factors driving course choice and motivation, students were asked to rate relevant items on a scale of importance (where 1= completely disagree and 6= completely agree). Table 3 outlines the results of this analysis.
Table 3 Course Motivation
Descriptive Course VU VU VU SCU SCU SCU Total Total Total

profile motivation N M SD N M SD N M SD Name of degree 118 3.58 1.59 62 4.00 1.44 180 3.72 1.55 Chose course
based on subjects offered
116 3.92 1.44 62 3.35 1.69 178 3.72 1.55
University has a good reputation
121 3.42 1.35 61 3.23 1.23 182 3.36 1.31
School has a good reputation
113 3.36 1.30 58 3.14 1.19 171 3.29 1.27
Campus location 119 3.01 1.79 60 4.00 1.82 179 3.34 1.86 Services offered
by university 119 3.18 1.32 60 3.20 1.51 179 3.19 1.38
The ENTER score for course
118 3.21 1.51 57 3.02 1.63 175 3.15 1.55
Want a job in the event/ tourism/ hospitality industry
120 4.45 1.60 61 4.79# 1.42 181 4.56 1.55
Obtain a Bachelor of Business
121 4.34 1.46 61 4.87# 1.26 182 4.52 1.42
Competitive fees 84 2.52 1.19 46 2.89 1.69 130 2.65 1.39 #Skewed result Based on the average scores, ‘want job in the event/tourism/hospitality’ (mean = 4.56) was the item rated most highly by respondents, indicating its relative importance in driving course choice. Next item in order of rating was ‘obtain a Bachelor of Business qualification’. SCU respondents assessed this item more highly than VU students; however, subsequent testing did not reveal this difference to be significant. In addition to rating a given reason for doing their course, students elaborated on course motivation in an open-ended question. Many students saw the degree and/or subject as enabling them to develop the skills and knowledge needed for running an event. Typical responses were:
“to learn about the industry and the skills I would need to work in it and having a degree to back it up” (female, 22, VU, Hospitality Management, elective);
“learn how to manage and co-ordinate events and expos for the company I currently work for” (male, 21, VU, Marketing, elective); and “Wanted to get specialised knowledge in the event industry” (Female, 21,SCU, Event Management).
Equally, many students also expect that by doing the degree they may be able to get a good position in the industry and/or acquire skills and knowledge to match their work experience: “to gain extra qualification and to improve my employment prospects”(male, 35, VU, Hospitalitÿ Management/Event Management, core unit); and “To further my diploma of Hospitality Management in particular events” (Female, 20, SCU, Event Management). Some students were very definite in which industry they wanted to work:

“to gain qualifications so I am able to work in my choice of industry i.e. music and events’ (female, 18, VU, Music Industry/Events, core unit) but others were not quite sure where they would finally work “to gain a degree in the field I am interested in and to enable me to get a better job in the future” (male, 21, VU, Tourism Management)”; and “better job prospects” (male 22, VU, Marketing/Real Estate, elective). In the case of Victoria University, a number of students also felt that doing a double degree gave them better opportunity for getting a job or if they were undecided in which industry to work: “double degree provides better basis- broader career opportunities” (female, 19, VU, Tourism/Event Management”; “I was undecided if I wanted to get into hospitality or events so doing both elements was appealing” (female, 18, VU, Hospitality/Event Management). The reputation and choice offerings of the university for events, hospitality and tourism degrees were seen as important by some students: “it was the only university that offered tourism/event management combined” (female, 18, VU, Tourism/Event Management); and “want to work in the events industry and only uni [that] offered events as a degree” (female, 22, VU, Tourism/Events Management). For a large number of students the reason for doing their degree was a strong interest in one of the areas they were studying “love to travel”, “passion for travel”, “because I love music and want to work in events” and for others the area was something they were generally interested in: “it seemed interesting and something which could lead to a degree” (female, 18, VU, Music Industry/Events Management) or knew they already liked doing “I enjoy meeting new people and at the same time enjoy organising events” (female, 21, VU, Hospitality/Events Management); and
“I have spent the last four years going to every possible festival that appeals to me, so [I] decided to study it” (female, 22, SCU, Event Management). From these in-depth insights, it appears that students choosing a degree and or subjects which include event management have a clear idea about their expectations for future job prospects or that at least they see the degree as being able to provide them with the necessary skills and knowledge to pursue jobs in their chosen field in the future. Additionally, a large number of students who choose to do a degree with an event management component have a strong interest in organizing events or in a related area such as music or travel. Further analysis Significance testing was conducted to examine differences between certain respondent groups. Table 4 outlines the outcomes of this testing.
Table 4 Significance testing
Test variable Respondent Groups M df t Course motivation – Location of campus University - VU 3.01 177 -3.48* University - SCU 4.00 Course – provides me with the necessary skills Completed WIL/BIL - 3.93 177 -2.80*

to work in the event industry Yes Completed WIL/BIL -
No 4.59
Course – provides me with useful contacts in the event industry
Completed WIL/BIL - Yes
3.23 175 -2.47*
Completed WIL/BIL - No
3.88
Course – provides me with only part of the skills required to work in the industry
Completed WIL/BIL - Yes
4.15 176 2.07*
Completed WIL/BIL - No
3.60
Course motivation – the university has a good reputation
Completed WIL/BIL - Yes
3.81 176 2.02*
Completed WIL/BIL - No
3.26
Course motivation – the school has a good reputation
Completed WIL/BIL - Yes
3.92 166 2.76*
Completed WIL/BIL - No
3.17
Course – provides me with the necessary skills to work in the event industry
Subject status - Core 4.60 180 2.09*
Subject status - Elective 4.20 Course – provides me with useful contacts in the event industry
Subject status - Core 3.97 177 3.448*
Subject status - Elective 3.27 Course - provides me with voluntary and job opportunities which will help me in finding an industry job
Subject status - Core 4.59 178 5.23***
Subject status - Elective 3.52 Course – provides me with the necessary skills to work in the event industry
Course year – 1st year 4.75 180 3.38*
Course year – Other years
4.18
Course – provides me with useful contacts in the event industry
Course year – 1st year 4.16 177 4.71***
Course year – Other years
3.32
Course – provides me with only part of the skills required to work in the industry
Course year – 1st year 3.48 179 -2.06*
Course year – Other years
3.88
Course motivation - services offered by university
Course year – 1st year 3.44 176 2.63*
Course year – Other years
2.90
*p<.05 ***p<.001

As noted previously in this paper, whilst not being an overriding objective, the research afforded the opportunity to compare student perceptions and attitudes regarding the event management offerings of VU and SCU. As has been highlighted, the universities are located in two very different settings and provide different opportunities for students to study event management and become involved with events. Despite these distinctions, a comparison of the two respondent groups (VU and SCU students) showed only limited significant differences. As Table 4 indicates, ‘location of campus’ was the only item whose mean score was significantly different across both groups. This motivation variable was rated more highly by SCU students than their VU counterparts. This finding is not surprising given the location of both campuses and the perceived attractiveness of the Gold Coast setting for SCU students as compared to the western metropolitan setting of the VU campuses surveyed. In itself, the lack of differences between universities is an interesting finding. The consistent response pattern across the two groups (VU and SCU students) does appear to indicate that event management students have similar attitudes towards event management education irrespective of specific contextual differences. Exposure to international events on the one hand (most students of students Victoria University reside in Melbourne, while most students at Southern Cross University reside in Northern New South Wales or the Gold Coast) and community events on the other, does not appear to alter students’ perceptions of and motivation towards enrolling into an undergraduate event management degree. Moving on from university based differences’ significance testing revealed several findings of interest relating to indicators of student status and progress. One such indicator was whether students had yet had the opportunity to complete the industry placement component of their course. In particular, those students who at the time of the survey had not yet completed WIL/BIL appeared to have higher expectations of their course in terms of it providing them with the skills and necessary contacts to work in the events industry. Perhaps as a worrying sign for the universities involved in the study, in contrast students who had completed the workplace component of their degrees, assessed them as only providing part of the skills necessary for a future career in events. Despite this finding, those students who had been out in industry appeared to have come back from this external experience with a more positive view of their university’s and School’s reputation. Students who had completed WIL/BIL rated these two variables more highly than those respondents who had not and this difference was significant. Similar findings were evidenced in relation to testing of group means using year of study as the comparative variable. First year students when compared to all other years assessed their degree more favourably in terms of it providing them with industry ready skills and contacts, whilst students more advanced into their degrees considered that they only partially prepared them for working in the events industry. This similarity of findings, despite the different comparative variables used, reflects upon the course structures of VU and SCU where students complete their industry placement from second year onwards. Subject status was another basis upon which testing was conducted. As Table 4 suggests, respondents undertaking core subjects, compulsory to their event management degrees, had higher expectations that their courses would provide them with skills, contacts and work/volunteer opportunities that would enhance their employment prospects in the events industry. This finding is not surprising given the greater vested interest these students have in the events management field (e.g. studying six dedicated event management subjects as opposed to opting to study one or two as electives). It is also reflective of the finding that 71% of respondents overall wished to pursue a career in the events industry (see Table 1).

CONCLUSION/ FURTHER RESEARCH IMPLICATIONS This paper has investigated the perceptions and attitudes of event management students towards their course of study. Specifically it has examined the motivational choice, the skill sets considered important for the industry and also the importance of WIL/BIL to the course. Furthermore, the research aimed to ascertain whether any significant differences existed in the attitudes and perceptions of students at two very different universities. The results show that on the basis of university, no differences exist in the attitudes and perceptions of students except in relation to the location of the campus, which was viewed more favourably by SCU respondents. When choosing a course in event management, the students at both universities had clear ideas about their expectations of the degrees and how these could be instrumental in teaching those skills and knowledge needed for the industry. Most students surveyed already had a strong interest in events and associated industries, and those who did not found that the event management subjects they studied helped to pique their interest in the area. Communication and management skills were seen as the most important skills needed to work in the industry. Students who had completed their WIL/BIL component had more realistic expectations of what skills needed for working in the industry; that their course could provide them with. Notwithstanding this finding, these students seemed to have a more positive view of their university’s reputation, in contrast, to those students who had not yet completed WIL and had higher expectations relating to course outcomes but had not yet had the opportunity to realise the full potential of their university’s brand name in the marketplace. Given the emerging nature of research on event management education, the findings offered by this paper on the motivations and perceptions of event management students regarding their future career sector of choice, should be considered tentative towards an agenda for future study. Methodologically, scope exists to replicate and enhance the current study by using random sampling to generalise findings to the wider population or employ a longitudinal design to examine key trends. There are sufficient gaps in current knowledge to expand the study to incorporate other Australian universities currently offering event management as an undergraduate or postgraduate degree or to examine cross-cultural differences by investigating education models and student populations from other countries. Continued research in the area will better assist universities and other event educators in building the capacity of their students, whose future role in the events industry should help aid its growth and continued recognition in society. REFERENCES Allen, J., W. O’Toole, I. McDonnell and R.Harris. (2005).Festival and Special Event Management.
3rd edition. John Wiley &Sons. Australia. Barron, P. and Whitford, M. (2004). ‘An evaluation of event management education: Student
reflections on flexible learning processes and procedures”. Journal of Teaching in Travel and Tourism, vol.4. No.2, 19-43
Beaulieu, A.M. and Love, C. (2004). “Characteristics of a meeting planner: attributes of an emerging profession”. Journal of Convention and Event Tourism. Vol. 6. No.4. 95-124.
Beaven, Z. and Wright, R. (2006). “Experience! Experience! Experience! Employer Attitudes to Arts and Event Management Graduates. International Journal of Event Management.Research. Vol.2. No.1.17-24
Burley, P. (2005) “Experiential Learning Produces Capable Event Management Graduates”. The Impact of Events- Event Management Research Conference Proceedings ed. Allen. J. Sydney, July 2005.

Busby, G. (2005) Work experience and industrial links. In D. Airey and J. Tribe (Eds.), An International Handbook of Tourism Education. London: Elsevier.
Christou, E. (2000). “Revisiting competencies for hospitality management: contemporary views of the stakeholders”. Journal of Tourism and Hospitality Education. Vol.14. No.1. 25-32.
Coakes, S.J., Steed, L. and Dzidic, P. (2006). SPSS 13.0 Analysis without Anguish. John Wiley & Sons. Australia.
Daruwalla, P. and Fallon, W. (2005). “Experiential Learning in Events Management Education: Developing Reflective Practitioners”. . The Impact of Events- Event Management Research Conference Proceedings ed. Allen. J. Sydney, July 2005.
DeFranco, A.L., Abbott, J.L and Ali, F. (2006) “Curriculum Development in International Convention and Conference Management at Meio University, Okinawa, Japan. Journal of Convention and Event Tourism”.Vol.7. No. 3/4 45-63.
de Vaus, D.A. (2002). Analyzing Social Science Data. Sage Publications, London. Getz, D. (2002). “Event Studies and Event Management: On Becoming an Academic Discipline” .
Journal of Hospitality and Tourism Management. Vol.9. no.1. Gillet, S. & Whitelaw, P. (2003). The Development of Reflective Hospitality Managers in
Proceedings of the Council of Australian University Tourism and Hospitality Education Conference (eds). Richard Braithwaite and Robyn Braithwaite, Southern Cross University, Lismore, Australia.
Grafton, J. (2004) Headline 9 September CX The News magazine for the Entertainment Industry http://svc035.wic011v.server-web.com/cxweb/article.asp?ID=464 [Viewed 21 April, 2007]. Harris, V. (2004). “Event Management: A New Profession ?”. Event Management. Vol.9. 103-109. Harris, R. and Griffin, T. (1997). Tourism Event Training Audit. Tourism New South Wales. Harris, R. and Jago, L.(1999). Event education and training in Australia: The current state of play”.
Australian Journal of Hospitality Management. Vol.6. No.1, 45-51. Hassanion, A. and Dewhurst, P. (2005). A Critical Analysis of the Design and implementation of an
Event and Venue Management Programme: A Case study of the University of Wolverhampton. The Impact of Events- Event Management Research Conference Proceedings ed. Allen. J. Sydney, July 2005.
Lashley, C. (1999) ‘On making silk purses: developing reflective practitioners in hospitality management education’ International Journal of Contemporary Hospitality Management.Vol.11. No 4. 180-1859.
Leslie, D. and Richardson, A (2000). “Tourism and co-operative education in UK undergraduate courses: are the benefits being realized?” Tourism Management.Vol 21.489-498.
Moscardo, G. (2006). “The Upside of Staying in the Classroom: Risk and Creativity in Classroom and Event Education”. Global Events Congress Proceedings, ed(s). Arcodia, C., Whitford, M. and Dickson, C. Brisbane , July 2006.
Moscardo, G. and Norris, A. (2004). “Bridging the Academic Practitioner Gap in Conference and Events Management: Running Events with students”.Journal of Convention and Event Tourism. Vol.6. No. 3. 47-62.
Mules, T. (2004). “Evolution in Event Management: The Gold Coast’s Wintersun Festival”. Event management. Vol.9. No.1/2. 95-102.
Perry, M. Foley, P. and Rumpf, P. (1996). “Events management: an emerging challenge in Australian higher education”. Festival management and event tourism. Vol. 4. No3/4. 85-93.
Royal, C.G and Jago, L.K.(1998). “Special Event Accreditation: The Practitioners’perspective “. Festival management and event tourism. Vol. 5. .231-230.

Ruhanen, L. (2006). “The Application of Experiential Learning Techniques to Event Management Education”. Global Events Congress Proceedings, ed(s). Arcodia, C., Whitford, M. and Dickson, C. Brisbane , September 2006.
Shone, A. and Parry, B. (2004). Successful Event Management: A Practical Handbook. Thomson, London.
Sims, W.J (2005). “Challenges in the Development of an Undergraduate Special Event Management Specialisation”. The Impact of Events- Event Management Research Conference Proceedings ed. Allen. J. Sydney, July 2005.
Solnet, D., Robinson, R. and Barron, P. (2006) “Innovations in Tourism Education Industry Partnerships: An analysis of event management student experiences” Proceedings of Global Events Congress, ed(s). Arcodia, C., Whitford, M. and Dickson, C. Brisbane , July 2006.
Victoria University Course Analysis (2006). Data Warehouse, FOBL 2006. Williamson, P. (2005). “Event Management Students’ Reflection on their Placement Year: An
examination of their ‘critical experiences”’. The Impact of Events- Event Management Research Conference Proceedings ed. Allen. J. Sydney, July 2005.

Fourth International Event Research Conference Re-evaluating the City/Town: Events as a Catalyst for Change
RETAINING LOYAL VISITORS IN ORGANISING A FESTIVAL; RELATIONSHIP BETWEEN SERVICE QUALITY OF FESTIVAL AND BEHAVIOURAL INTENTION
(THE CASE STUDY OF GWANG-JU KIMCHI FESTIVAL)
Soon Hwa Kang Department of Events Management
Kyonggi University, Korea [email protected]
Jung Hwan Kim
University of Technology, Sydney
ABSTRACT This paper provides an insight on how service quality of festival influences on behavioural intention such as intentions to revisit and recommend a local festival. The survey results of 273 respondents who visited the Gwang-Ju Kimchi Festival were analysed by using a factor analysis. Four factors shaping service quality of the festival were extracted through the analysis: local products and foods; advertising and information; event programs; and convenient facilities. The main findings were that the most significant factor for inducing visitors to revisit the festival is event programs whereas advertising and information influence on the most visitors’ intention to recommend the festival to the others.
Keywords: Gwang-Ju Kimchi Festival, Service Quality, Revisit Intention, Intent to Recommendation
INTRODUCTION The potential impacts of events are broadly divided into four aspects: (1) social and cultural; (2) physical and environmental; (3) political; and (4) tourism and economic (Allen et al, 2002). In this category, a festival, which can be seen as a special event, implies some particular functions in preservation of traditional culture, establishment of community identity and improvement of local economy (Getz, 1997). A successful festival managing its unique functional implications in a well-built system provides opportunities to preserve and inherit the culture and heritage of local areas (Lee, 2002; Davidson, 1995). Simultaneously, it facilitates and advertises the local economy so that a positive image of the hosting region can be created as well as the local economy can be stimulated effectively (Crompton et al, 2001; Jackson et al, 2005; Tyrrell & Johnston, 2001; Chhabra et al, 2003). For this reason, the role of local governments has gradually become important and has had a significant influence in organising festivals (Elliott, 1997). Likewise, the local governments in Korea hold local festivals competitively withthe purpose of revitalising and improving the local economy (Song, 2004). While such general interests in regard to a local festival have grown, on the other hand, some argue that it is just one-off expression of interests and, in addition, it has been proven by a trend that the rate of revisit in local festivals has significantly decreased (Oh, 1999b; Kim, 1999; Jung, 1998). Several reasons causing a decrease in the revisit rate were pointed out by Kim (2000) and Oh (1999a); inexperienced staff, poor program content, biased festival periods, lack of information, bad toilet condition, inconvenient public transport, etc. In brief, the common findings of the research can be clarified as a lack of service quality management in festivals. The local governments in Korea, however, intensively invest in advertising and one-off promotion rather than investing in the local products, festival programs and service quality management (Oh,

1999a; Kim, 2002). The decline of service quality in local festivals leads to a major reason for dissatisfaction amongst visitors and causes a decrease in the revisit rate (Mihn & Sohn, 2000; Park, 2004). Moreover, despite such tendencies, primary research applied the service measurement models, which were designed for evaluating the service quality of enterprise, into the festival research without adequate critiques. In order to suggest appropriate tools for critically analysing the festival performance in a research fitted to the subject, therefore, this research aims to gain an understanding of how service quality at festivals influences behavioural intentions such as intentions to revisit and recommend a festival. Based on the research data supported by the Ministry of Culture and Tourism, Korea (MCTK, 2006), the result of this paper is designed to contribute to the improvement of festival service quality and establishment of local festival-fitted strategies.
GWANG-JU KIMCHI FESTIVAL Gwang-Ju, which is located in the Southwest of Korea, has an area of 501.41 km² and a population of 1,408,106 (Gwang-Ju City’s Annual Report in Statistics, 2006). In Korea, this city has a strong reputation in the heritages of art, education, culture and tradition. In particular, Gwang-Ju has been named as the hometown of Kimchi, one of the best known Korean fermented foods as well as a rich source of dietary fibre, vitamin B and C, lactobacillus and minerals (Choi, 2002).
With the unique characteristics of the city, Kimchi Festival has been annually held in Gwang-Ju since 1994. It has been designed to foster the Kimchi industry as well as to commercialise it to both domestic and foreign tourists. This festival, as one of the eight well-known local festivals in Korea, has attempted to inform the unique culture in Gwang-Ju cuisines in order to improve the national image of Korea. With an overseas-oriented tactic focusing on integrating a triangle relationship between Korea, China and Japan, the festival has organised diverse local-oriented programs such as a traditional marriage ceremony and a reappearance of traditional culture of Korea for local residents in the educational purpose (The City Hall of Gwang-Ju, 2006).
Over the last decade, the Gwang-Ju Kimchi Festival has proactively emphasised the fact that Kimchi originates from Korea and its home town is Gwang-Ju. This campaign has been developed and established to have a continuous influence in the tourist market, not one-off event for only local residents. Many events that can be enjoyed under a theme of Kimchi have been held to attract tourists to this spot.
Figure 1 Number of visitors
Firgure 2 Effect on the local economy
0100,000200,000300,000400,000500,000600,000700,000800,000900,000
Year1994
19951996
19971998
19992000
20012002
20032004
Domestic residents Foreigners
0
2000
4000
6000
8000
10000
12000
14000
16000
Year 1994 1995 1996 1997 1998 1999 2000 2001 2002 2003 2004
Effect on the local economy ($,000 USD)
In the survey researching the effect of Gwang-Ju Kimchi Festival on the local economy and its movement between 1994 (1st) and 2005 (12th), it can be seen that the number of visitors has been gradually increasing, both domestic and foreign visitors and accordingly the economical

effects have rapidly grown from the 11th Gwang-Ju Kimchi Festival (The City Hall of Gwang-Ju, 2006; See Figure 1 & 2).
MEASURING SERVICE QUALITY WITHIN A FESTIVAL SETTING Simoni (2004) mentioned that “festivals are comprehended as being complex interfaces, polymorphous events where different meanings and experiences emerged, circulated and are appropriated by people in heterogeneous ways”. Then, what reliable factors should be utilised to gauge such a complex-functioned festival? Baker and Crompton (2000) note that the perceived quality of festival performance is a significant assessment factor because it is under the control of festival organisers while the level of satisfaction depends on the visitors who are not in control of management. In addition, Cronin et al (2000) insist that assessing the effect of service quality is directly related to customer’s behavioural intention.
In recent years, service quality has been measured on very subjective viewpoints since it is complexly related to diverse subjects such as science, sociology, psychology, economics, etc. Among many attempts to measure the quality of service on an unbiased basis, SERVQUAL, a popular measurement tool developed by Parasuraman, et al. (1988) emerged to measure the service quality of an enterprise based on the development procedure suggested by Churchill (1979). More specifically, they derived five aspects as determinants of measuring the service quality from service users; tangibles, reliability, assurance, responsiveness and sympathy (Parasuraman et al, 1988).
As the scope of analysis in the concept of service quality has expanded, however, a lot of arguments regarding the measurement methods have arisen. For instance, Cronin and Taylor (1992) had a doubt in the indiscreet use of SERVQUAL and argued that the quality of service should be conceptualised and assumed by only the behaviour of respondents because the service quality is an antecedent of consumer satisfaction, not purchase intention. With this suggestion, SERVPERF, which means that service quality can be measured by perception (performance-based measure), was developed as an alternative method (Cronin & Taylor, 1992). These streams in measuring service quality imply that independent measurement tools according to different types of industry have to be used to gauge the quality of service to be assessed on a fair and accurate base (Carman, 1990).
In overall movement within the area, Parasuraman (1988) initiated a basic format shaped by the five factors affecting quality of service. After that, other studies have just modified the measurement questions as maintaining the main frame consisting of the five aspects. In Table 1, previous research on the factors determining the quality of service are specifically summarised and compared with the 17 Measurement Standards set by the Ministry of Culture and Tourism, Korea (MCTK, 2006).
Table 1
Analysis on the Factors Affecting the Service Quality of Festival Organisation/Researcher Factors Determining the Quality of Service
The 17 Measurement Standards set by the
Ministry of Culture and Tourism, Korea (2006)
Quality of Products, Price of Products, Variety of Products, Variety of Foods, Price of Foods, Information Facility, Information Broacher, Pre-advertising, Familiarity of Staff, Ease of Access, Fun of Event, Variety of Event, Experience-Focused Program, Understanding of Culture, Rest Area, Public Toilet, Parking Convenience
Song (2004) Conformity, Ease of Access, Responsiveness, Security, Reliability
Swanson & Davis (2003) Accuracy, Parking Availability, Information, Interior, Exterior, Appearance of Staff, Quality of Foods, Cleanliness
Getz et al (2001) Ease of access, Cleanliness, Comfort, Foods and Beverages, Parking, Safety, Seating, Signs, Toilet, Familiarity of Staff,

Souvenir, Event Program
Crompton(1997)
Entertainment, Familiarity of Staff, Price and Quality of Foods, Program Content, Educational Program, Fun, Ease of Access, Safety and Cleanliness, Information Facility
Crompton & Love (1995)
Historical Building, Information Facility, Safety, Rest Facility, Performance Program, Broacher, Cleanliness, Quality of Foods and Drinks, Toilet, Botanic Garden, Information Map, Local Foods, Familiarity of Staff, Indoor Performance
Wicks & Fesenmaier (1993)
Quality-Oriented, Local Product, Convenience, Service, Entertainment
Parasuraman et al (1988)
Tangibles, Reliability, Assurance, Responsiveness and Sympathy
Through previous studies shown in Table 1, some selected variables that can be applied to every ordinary festival regardless of its nature were adapted as the fundamental elements in this research based on the 17 measurement factors developed by the MCTK (2006) to analyse satisfaction of visitors in festivals.
BEHAVIOURAL INTENTION AND VISITOR LOYALTY Behavioural Intention Behavioural intention is a significant factor evaluating the performance of quality because consumer behaviour can be forecasted by it (Katz, 1983; Zeithaml et al, 1996). In a theoretical viewpoint, Fishbein and Ajzen (1975) define that behavioural intention can be seen as a plan that should be accomplished for achieving certain goals whereas consumption behaviour is a realistic behaviour. With this definition, some different approaches to grasp the complex principles of behavioural intention have emerged in the academic world. Although the fixed theoretic notion of behavioural intention is not perfectly established, the extended Fishbein-Ajzen model laid the foundation stone in the area with a suggestion of a stable application frame to measure behavioural patterns and to prove that the concept of attitude and behaviour possesses a significant meaning as an explanatory variable to understand consumer behaviour (Ryan & Bonfield, 1975; Lutz, 1976; Lee & Green, 1991). Based on it, primary research has supported that there is a correlation between what consumers think on an object and behaviour patterns related the object (Bagozzi, 1981; Joseph & Tansuhaj, 1989; Baker & Crompton, 2000; Cronin et al, 2000). At this stage of theoretic development, therefore, it can be said that an understanding of behavioural intention could give a valuable insight in making stable instrumental scales for measuring and monitoring consumer behaviour and analysis tools that are relatively reliable for expecting the future behaviour of customers (White & Yu, 2005).
Visitor Loyalty The theory of destination loyalty has developed and discovered the link between intention and consumer behaviour and, especially, has demonstrated that repeat visitation and intention to return are indicators of place loyalty (Bandyopadhyay & Martell, 2007; Yoon & Uysal, 2005). In the relationship between visitor loyalty and behavioural intention, Konecnik and Gartner (2007) argued that behaviour is expressed as the future tourism decisions influenced by previous experiential familiarity with the destination. In fact, loyal visitors are one of the most important sources of income for many destinations (Alegre & Juaneda, 2006). This phenomenon can be explained by behaviour for visiting destination. For instance, people have some conception of the future, believe they have some control over their lives, and can think in probabilistic terms, so that their intentions work as the medium parameter between attitude and behaviour showing the subjective condition of a person (Tansuhaj, 1989; Bock et al, 2005; Warshaw & Davis, 2001). In this process of conceptualisation in relation to objects or destinations, the subjective possibility, in which belief and attitude can be behavioural, begins to boost the belief of an individual to attempt expressing a future-oriented behaviour like

intention to purchase or visit (Fishbein and Ajzen, 1975; Crompton and Baker, 2000). Hence, it can be interpreted that intention has a significant influence on behaviour for visiting destination in terms of loyalty.
METHODOLOGY Questionnaire Development The main structure of questions is fundamentally adapted from the 2006 Korean universal measurement plan in culture and tourism festivals. These measurement standards developed by MCTK contain some useful results of government-led research, which was carried out on the items of visitors’ satisfaction, expenditure, and scale in various festivals (MCTK, 2006). In addition, some measurement methods mentioned by previous studies were adapted for analysing general factors of a festival regardless of its own nature. Unlike SERVQUAL that examines and compares both expectation and performance, the questionnaire of this research focuses mainly on the side of performance based on the factors shaping service quality of a festival because of its proven effectiveness (Panton, 1999). More specifically, the basic logic applied for developing questionnaire is that service quality of a festival stems from the four factors extracted by previous research: local products and foods; advertising and information; event programs; and convenient facilities; and, in this chain of relationship, the service quality of festival significantly influences on behavioural intention to revisit and recommend the festival. The measurement of questions asked were carried out by Likert’s 7 point standards (1= Very negative, 7= Very positive) and the attributes used in the questionnaire were measured as satisfaction items. For example, intentions to revisit and recommend were estimated by the questions of ‘Do you plan to revisit this festival in the next year?’, and ‘Would you like to recommend this festival to others?’ on the Likert scale in order to analyse the behavioural intention after satisfaction. To analyse the demographical profile of respondents, five contents such as gender, age, education, occupation and place of residence were asked as well. Data Collection The targeted respondents of this research needed for an actual proof analysis were the festival visitors, particularly housewives. This convenience sampling including a selection of particular age groups was due to a traditional custom of Korea that generally housewives between twenties and fifties make Kimchi. Visitor surveys were conducted during the festival period and they were distributed at scheduled times, with each of 15 members assigned a particular area within which to pass out the forms to everyone in the area and to collect them when completed. The surveyors consisted of university students majoring in marketing and events who were instructed by a researcher to gain reliable and accurate data from randomly selected respondents. Out of approximately 300 distributed, 273 usable responses were selected as analysis data, representing a 91 % response rate. 27 excluded papers were mostly unrelated to the questions and had some critical omissions in the responses. Data Analysis The data analysis in this study was completed in three phases. Firstly, a frequency analysis was conducted to understand the general profile of samples. Secondly, an exploratory factor analysis was carried out using SPSS 10.0, to examine the underlying dimensions of service quality measurement. The 17 measurement items were directly adopted from the 2006 universal measurement methods published by MCTK because of its proven validity as a measurement tool. The study claims construct validity, and a Principal Components Analysis with an orthogonal rotation (varimax) was carried out to determine common factors. This was chosen to minimise a loss of information and to summarise many variables into their common factors effectively (Merenda, 1997). Finally, a multiple regression analysis was conducted to analyse the impact of festival service quality on the customers’ intention to revisit and recommend the festival. Specific standardised and unstandardised coefficients were calculated to verify the validity of the logic adopted in this research

RESULTS Profile of Respondents A total of 273 valid samples were randomly collected. In overall, Table 2 summarises the demographic information of visitors. Females (64.8%) were major respondents and the rest of responses were formed by a group of males (35.2%). This dominant result in a group of females was caused by the sampling frame mentioned in methodology and is reconfirmed by the occupation distribution (Students: 33.3%, Housewives: 27.8%, Professionals: 20.9%, and Salary-men: 9.5%). Respondents according to the different age groups were counted as follows: 100 (36.6%) between 20 and 29, 52 (19.0%) between 30 and 39, 50 (18.3%) between 40 and 49, 46 (6.8%) between 50 and 59, and 5 (1.8%) above 60. In the section of education, it was represented that 89 high school graduates (32.6%), 177 undergraduate degree holders (64.8%) and 7 postgraduate degree holders (2.6%) formed a total number of the visitors. These figures represent that young and educated visitors were a major group of customers in the festival.
Table 2
Demographical characteristic of the samples
Index Number of People
Percentage (%) Index Number
of People Percentage
(%)
Gender Male Female
96 177
35.2 64.8
Education
High School UndergraduatePostgraduate
89 177
7
32.6 64.8 2.6
Age
10~19 20~29 30~39 40~49 50~59 60<
20 100 52 50 46 5
7.3 36.6 19.0 18.3 6.8 1.8
Place of Residen
ce
Gwang-Ju Around
Gwang-Ju Other Places
225 20 28
82.4 7.3
10.3
Occupation
Festival-related Professional Salary-man
Self-employedHouseholder Farmer and
Fisher Student
9 57 26 10 76 4
91
3.3 20.9 9.5 3.7
27.8 1.5
33.3
82.4% of respondents were local residents of the Gwang-Ju City, and tourists from other areas (10.3%) and those live nearby Gwang-Ju (7.3%) were followed by in the place of residence section. This biased ratio was due to the survey method which calculated the Gwang-Ju visitors according to the unit of city, not the unit of district. In paradox, it can be said that the low participant rate of foreigners in this festival is a by-product of vigorous local festival participants.
Factor Analysis
Table 3 Results of factor analysis
Factor
Items Local Products &
Foods
Advertising &
Information
Event Programs
Convenient Facilities
Cronbach’s Alpha
Quality of Products .820 .847
Price of Products .814 .847 Variety of .718 .844

Products Variety of Foods .635 .849
Information Facilities .741 .847
Information Broachers .696 .850
Pre-advertising .680 .861 Familiarity of
Staff .537 .843
Fun of Event .802 .844 Variety of Event .793 .845
Experience Programs .525 .846
Rest Area .814 .848 Public Toilet .791 .852
Parking Convenience .690 .855
Eigen Value 3.143 2.439 2.302 2.003 R-square 18.485 14.345 13.540 11.780
Kaiser-Meyer-Olkin’s scale =.822 R-square = 58.150% Cronbach Alpha = .861
The factor loading matrix in relation to the questions on service quality of festival is indicated in Table 3. Four common factors, which have Eigen values over 1, were extracted and R-square explained by them was 58.150% of total distributions representing the factors are valid. As a result of factor analysis, the extracted common factors in relation to the service quality of festival were named as local products and foods, advertising and information, event programs and convenient facilities. Local products and foods, firstly, consisted of product quality, product price, variety of product, variety of foods, price of food (Eigen value= 3.143 and Distribution= 18.485%). The second factor, which is advertising and information, was formed by information facilities, information broachers, pre-advertisement, familiarity of staff and ease of access (Eigen value= 2.439 and Distribution= 14.345%). Event programs, as the third factor, were structured by 4 question types: fun of event, variety of event, experience programs and understanding of culture (Eigen value= 2.302 and distribution= 13.540%). Lastly, convenient facilities consisted of parking convenience, rest areas and public toilets (Eigen value= 2.003 and distribution= 11.780%). In this paper, Cronbach’s Alpha coefficient was used in order to verify the reliability of survey questions. The case using Cronbach’s Alpha coefficient usually attempts to verify the internal correspondence, which is a concept of reliability analysis. Generally, it can be seen that there is reliability where the coefficient, which is an analysis result from the calculation of the corresponding survey questions, is above 0.6 (Christmann & Aelst, 2006). Consequently, as shown in the table of this research, it is regarded that the measurement questions have intensive homogeneity and valid internal correspondence because the verification result on the survey questions outputted 0.861 of reliability alpha. Behavioural Intention to Revisit and Recommend According to the primary research, it has been shown that service quality of a festival affects to tourists in the revisit intention significantly. In the same context, likewise, the regression model on intention to revisit is statistically valid, and there is a correlation between independent and dependent variables with R-square of .480 (See Table 4). The betas of standardised coefficient that were used to analyse the influence of the four factors of service quality on the revisit intention were verified as follows: Event Programs (.357), Convenient Facilities (.353), Local Products and Foods (.345) and Advertising and Information (.329)

(See Table 4). This result implies that intention to revisit the festival increases as customer satisfaction with event programs increases. In terms of convenient facilities, products and foods and advertising and information, these affect intention to revisit in sequence.
Table 4
Multiple regression analysis on the effect of the festival service quality affecting revisit intention
Dependent Variables (Revisit Intention) Unstandardised
coefficient Standardised coefficient
Independent Variables
B Standard Error
Beta
t P
(Constant) 4.229 .036 116.095 .000*** Products and Foods .285 .036 .345 7.812 .000*** Ads & Information .272 .036 .329 7.444 .000***
Event Programs .294 .036 .357 8.061 .000*** Convenient Facilities .291 .036 .353 7.988 .000*** R²=.480 F=61.306 P=.000
* p<0.1, **p<0.05, ***p<0.01 In analysis result regarding behavioural intention to recommend the festival, as expected, the regression model is statistically valid as well, and there is a correlation between independent and dependent variables with R-square of .215 (See Table 5). The betas of standardised coefficient that were used to analyse the influence of the four factors of service quality on the recommendation intention were verified as follows: Advertising and Information (.340), Convenient Facilities (.207), Local Products and Foods (.187) and Event Programs (.148) (See Table 5). With this result, it has been proven that intention to recommend the festival increases as satisfaction with advertising and information increases. Convenient facilities, products and foods and event programs were followed by it in terms of influence on intention to recommend. The relative importance of advertising and information can be interpreted by a mechanism that as information gained through the festival increases more visitors can be motivated to recommend the destination confidently.
Table 5
Multiple regression analysis on the effect of the festival service quality affecting intention to recommend the festival
Dependent Variables (Recommendation Intention) Unstandardised
Coefficient Standardised Coefficient
Independent Variables
B Standard Error
beta
t P
(Constant) 4.827 .061 78.545 .000*** Products & Foods .212 .062 .187 3.451 .001*** Ads & Information .385 .062 .340 6.255 .000***
Event Programs .167 .062 .148 2.716 .007** Convenient
facilities .235 .062 .207 3.812 .000***
R²=.215 F=18.236 P=.000 * p<0.1, **p<0.05, ***p<0.01 DISCUSSION AND IMPLICATIONS A festival as a sort of event is a positive channel of the local development and harmony of local residents and has an effect of ceremonial entertainment. The social function of a festival provides the visitors with local lifestyle, tradition and customs that are interesting for them.

Such a characteristic of festival has been regarded as a business product as well as a unique service industry throughout the process of commercialisation.
Based on the results gained through the analysis of this paper, the implication that can be utilised in the practical field represents three aspects. First of all, the management of festival service quality must be developed strategically to make a continuously attractive festival for not only local residents, but visitors from a different cultural territory. As an analysis result, the most significant factor that has a strong correlation with intention to revisit Gwang-Ju Kimchi Festival was event programs. This implies that a local festival like Kimchi Festival, which is especially based on the local culture and tradition, should focus on how to professionally manage the event planning and programming in order to maintain competitiveness as a well-known festival. The second implication is derived from the section of convenient facilities. A serious problem that Gwang-Ju Kimchi Festival has faced so far has been caused by its geographical limits. As long as a festival is held in a metropolitan area like the Gwang-Ju City, the planning department of the festival is required to make certain of varied convenient facilities such as toilets, parking spaces, public telephones and benches to keep the place of festival in clean and order. Lastly, the factor of advertising and information has been shown to have a strong correlation with intention to recommend the festival. This represents that, in a food-focused festival, where housewives mostly take part in, pre-advertising, information by word-of-mouth and information staff can have a positive and important impact on the intent of visitors to recommend a festival to the others. Furthermore, the enhanced function in advertising would attract more visitors from various groups of people.
On the other hand, there are also some limitations in this research which has to be supplemented hereafter. Those are (1) only one festival in Gwang-Ju was selected as a research object and (2) survey respondents were limited to a group of domestic visitors while most foreign visitors were excluded. Hence, the limited sample selection of this research reflecting only the behavioural characteristics of domestic visitors should be reformed for generalising the research result in a better way. CONCLUSION The service quality of festival impacts significantly on the visitors’ behavioural intention in deciding which festival to go, so that it should be managed strategically. Despite this importance of service quality, previous studies concentrated mainly on old theories focusing on how to measure an enterprise’s service quality. To critically approach the essential effect of festival service quality, this paper has analysed the impact of service quality on intention to revisit and recommend a festival based on the supporting data provided by MCTK and previous research. This differentiated method was adopted by Carman (1990) who noted that independent measurement tools have to be used according to the different natures of each industry in order to estimate the quality of service precisely. Four factors forming the service quality of festival; local products and foods, advertising and information, event programs and convenient facilities have been extracted in the analysis result. In verification of validity, the impact of festival service quality on intention to revisit was analysed with the calculated standardised coefficient betas: event programs (.357); convenient facilities (.353); local products and foods (.345); and advertising and information (.329). Likewise, the standardised coefficient betas calculated for researching the influence of the festival quality service on intention to recommend were as follows: advertising and information (.340); convenient facilities (.207); local products and foods (.187); and event programs (.148).
The success of a festival depends on how visitors evaluate the festival. This research has verified that visitors would revisit and recommend the festival to the others when they think satisfaction on service quality of festival is fulfilled. Based on this result, planners or sponsors of diverse festivals are recommended to try to improve service quality in order to satisfy visitors effectively and efficiently. The simple reason for this is that visitor satisfaction has an

effect on potential future visitors. Looking to the long-term, the festival should aim to attract foreign visitors as well as local visitors, in order to keep the economy revitalised. In this way, a local festival would be able to improve its value to the economy by implementing a customer satisfaction strategy REFERENCES Alegre, J., & Juaneda, C. (2006). Destination Loyalty: Consumers’ Economic Behavior.
Annals of Tourism Research, 33(3), 684-704. Allen, J., O’Toole, W., McDonnell, I., & Harris, R. (2002). Festival and Special Event
Management. New Baskerville. Wiley. Bandyopadhyay, S., & Martell, M. (2007). Does Attitudinal loyalty influence behavioural
loyalty? A Theoretical and Empirical Study. Jounal of Retailing and Consumer Services, 2007, 14, 35-44.
Bagozzi, R. P. (1981). Causal Modeling: A General Method for Developing and Testing Theories in Consumer Research. Advances in Consumer Research, 1981, 8(1), 195-202.
Baker, D. A., & Crompton, J. L. (2000). Quality, Satisfaction and Behavioral Intentions. Annals of Tourism Research, 27(3), 785-804.
Berry, L. A., Parasuraman, V., Zeithaml., & Adsit, D. (1994). Improving Service Quality in America: Lesson Learned. The Academy of Management Executive, 8(2), 32.
Bock, G. W., Zmud, R. W., Kim, Y. G., & Lee, J. N. (2005). Behavioral Intention Formation in Knowledge Sharing: Examining the Roles of Extrinsic Motivators, Social-Psychological Forces and Organizational Climate. MIS Quarterly, 29, 87-111.
Carman, J. M. (1990). Consumer Perceptions of Service Quality: An Assessment of SERVQUAL Dimensions. Journal of Retailing, 66(1), 33-55.
Chhabra, D., Sills, E., & Cubbage, F. W. (2003). The Significance of Festivals to Rural Economies: Estimating the Economic Impacts of Scottish Highland Games in North Carolina. Journal of Travel Research 2003, 41, 421.
Choi, H. S. (2002). Lifestyle and Kimchi Culture in Korea. Korea. Hyo-il. Christmann, A., & Aelst, S. V. (2006). Robust estimation of Cronbach's alpha. Journal of
Multivariate Analysis, 97(7), 1660-1674. Churchill, Gilbert. A. (1979). A Paradigm for Developing Better Measures of Marketing
Constructs. Journal of Marketing Research, 16(1), 64-73. Crompton, J. L., & Childress, R. D. (1997). A Comparison of Alternative Direct and
Discrepancy Approaches to Measuring Quality of Performance at a Festival. Journal of Travel Research, 35(3), 42-45.
Crompton, J. L., & Love, L. L. (1995). The Predictive Validity of Alternative Approaches to Evaluating Quality of a Festival. Journal of Travel Research, 34(1), 11-24.
Crompton, J. L., Lee, S. H., & Shustera, T. J. (2001), Guide for Undertaking Economic Impact Studies: The Springfest Example. Journal of Travel Research, 40, 79- 87.
Cronin, J. J., Brady, M. K., & Hult, T. M. (2000). Assessing the Effects of Quality, Value, and Customer Satisfaction on Consumer Behavioral Intentions in Service Environments. Journal of Retailing Volume, 76(2), 193-218.
Cronin, J. J., & Taylor, S. A. (1992). Measuring Service Quality: A Reexamination and Extension. Journal of Marketing, 56(3), 55-69.
Davidson, R. (1995). Tourism. Essex : Longman Group. Elliott, J. (1997). Tourism: politics and public sector management. New York, Routledge. Fishbein, M. (1976). Extending the Extended Model: Some Comments. Advances in
Consumer Research, 3(1), 491-497. Fishbein, M., & Ajzen, I. (1975). Belif, Attitude, Intention, and Behavior: An Introduction to
Theory and Research. Reading. MA: Addison-Wesley. Getz, D. (1997). Event Management & Event Tourism. NWS. Cognizant Communication
Corporation. Getz, D., O’Neill, M., & Carlsen. (2001). Service Quality Evaluation at Events through
Service Mapping. Journal of Travel Research, 39, 380-390.
Gwang-Ju City’s Annual Report in Statistics. (2006). Gwang-Ju. The City Hall of Gwang-Ju. Jackson, J., Houghton, M., Russell, R., & Triandos, P. (2005). Innovations in Measuring
Economic Impacts of Regional Festivals: A Do-It-Yourself Kit. Journal of Travel Researc,; 43, 360-369.
Joseph, A. C., & Tansuhaj, P. S. (1989). Culture Bound Assumptions in Behavior Intention Models. Advances in Consumer Research, 16, 105-109.
Jung, G. H. (1998). Evaluation of Geum-San Ginseng Festival as a Culture and Tourism Festival: A Comparison Analysis of the Latest 3 Years. Tourism Studies, 22(3), 30-46.
Katz, J. (1983). The Role of Behavioral Intentions in the Prediction of Behavior. The Journal of Social Psychology, 125(2), 149-155.
Kim, C. S. (1999). Commercializing of traditional culture as a strategy to develop local economy. Korean Administration Collection of Learned Papers, 11(1), 209-231.
Kim, C. S (2000). A Research on the case study in the inducement of foreign visitors throughout local festivals: Ahn-Dong International Mask Festival as the Center. Academy of the Local Self-Government in Korea. Winter Academic Seminar. Reform and Self-Government, 53-67.
Kim, W. (2002). A Research on the Service Quality of Culture and Tourism-related Goods. Doctoral Dissertation. Graduate School of Gang-Won University.
Konecnik, M., & Gartner, W. C. (2007). Customer-Based Brand Equity for a Destination. Annals of Tourism Research, 34(2), 400-421.
Lee, C., & Green, R. T. (1991). Cross-Cultural Examination of the Fishbein Behavioral Intentions Model. Journal of International Business Studies, Second Quarter, 289-305.
Lutz, R. J., (1976). Conceptual and Operational Issues in the Extended Fishbein Model. Advances in Consumer Research, 3(1), 469-476.
Lee, K. M. (2002). Principles of Event. Korea, Beck-San Publication. Merenda, P. F. (1997). A guide to the proper use of factor analysis in the conduct and
reporting of research: pitfalls…. Measurement & Evaluation in Counseling & Development, 30(3), 156-164.
Ministry of Culture and Tourism, Korea. (2006). Annual Report: Measurement, Ministry of Culture and Tourism, Korea.
Mihn, B. H., & Sohn. D. H. (2000). Research on the development of service quality in local festivals. Hotel and Tourism Research, 4, 193-216.
Oh, S. H. (1999a). Reality of the local festival and its effects. Tourism Research, 22(3), 202-221
Oh, S. H. (1999b). Differences in the Association of Ideas on the Issue of Culture and Tourism Festival. Tourism Research, 23(1), 212-227.
Panton, D. R. (1999). A comparison of the effectiveness of two models in measuring customer satisfaction in the tourism industry, A thesis presented to the faculty of graduate studies of the university of Guelph.
Parasuraman, A., Zeithaml, V. A., & Berry, L. L. (1988). Communication and Control Processes in the Delivery of Service Quality, Journal of Marketing, 52(April), 35-48.
Park, G. S. (2004). The affect of the service quality of a local festival on the customer satisfaction- Industrial Economy Research. Korean Academy of Industrial Economy, 17(4).
Ryan, M. J., & Bonfield, E. H. (1975). The extended Fishbein Model: Additional Insights and Problems. Advances in Consumer Research, 2(1), 265-284.
Simoni, V. (2004). Journeys of Expression III: Tourism and Festivals as Transnational Practice. International Journal of Tourism Research, 6(5), 375-376.
Song, K. S. (2004). The performance evaluation on the local festival by the local governments: Korean Society and Administration Studies. Seoul Administration Academy, 14(4), 345-355.
Swanson, S. R., & Davis, J. C. (2003). The Relationship of Differential Loci with Perceived Quality and Behavioral Intentions. Journal of Services Marketing, 17(2), 202-219.

The City Hall of Gwang-Ju. (2006). Analysis on the visitors of the 12th Gwang-Ju Kimchi Festival. Gwang-Ju. The City Hall of Gwang-Ju.
Tyrrell, T. J., & Johnston, R. J. (2001). A Framework for Assessing Direct Economic Impacts of Tourist Events: Distinguishing Origins, Destinations, and Causes of Expenditures. Journal of Travel Research, 40, 94.
Warshaw, P. R., & Davis, F. D. (2001). The Accuracy of Behavioral Intention Versus Behavioral Expectation for Predicting Behavioral Goals. The Journal of Psychology, 119(6), 599-602.
White, C., & Yu, Y. T. (2005). Satisfaction emotions and consumer behavioral intentions. Journal of Services Marketing, 19(6), 411-420.
Wicks, B. E., & Fesenmajer, D. R. (1993). A Comparison of Visitor and Vendor Perceptions of Service Quality at a Special Event. Festival Management & Event Tourism, 1, 19-21.
Yoon, Y. S., & Uysal, M. (2005). An Examination of the Effects of Motivation and Satisfaction on Destination Loyalty: a Structural Model. Tourism Management, 26, 45-56
Zeithaml, V. A., Berry, L. L., & Parasuraman, A. (1996). The Behavioral Consequences of Service Quality. Journal of Marketing, 60(2), 31-46.

Fourth International Event Research Conference Re-evaluating the City/Town: Events as a Catalyst for Change
THE RURBAN INTERFACE ~ INVESTIGATING THE POTENCY OF NICHE SPORT EVENTS AS BRAND NARRATIVE FOR DESTINATIONS: CASE STUDY UCI
MOUNTAIN BIKE WORLD CUP, FORT WILLIAM, SCOTLAND
Martin Robertson & Phillip Darby Napier University Business School, UK
ABSTRACT This article investigates the significance of special and niche sport events in the predominantly rural highlands of Scotland, as a form of sport tourism and as essential components of place brand narrative necessary for development of the area in which they are hosted. The work refers to the centrality of major towns, both as hosts of rural regional events and as often unmanaged components of regional brand identity. Stemming from the work of Goulding (1998, 1999) the work follows an interpretivist methodological process, offering a grounded theoretical case study approach. Following a literature review, investigation is made of the way in which mountain bike race tourists construct their relation to both the event and the place. The nature of these findings and the initial construction of meanings can be seen to construct thematic conceptual patterns conduit to further case comparison and theory building. Key words: Urban-Rural Interface; Brand narrative; Mountain biking; Special events; Sustainability; Consumer Behaviour; Research Synthesis
INTRODUCTION Reflecting on a portfolio of research (applied and literature based) investigating the relation of event image with that of host destination image development, correlative research undertaken on a series of niche special sporting events in Scotland suggests to the authors that there is a great deal to support further analysis of the behavioural (stakeholder) relationships established by smaller (and ostensibly rural) sporting events. It is argued that it is this activity which would more successfully aid the building of brand identity. Building on the work of Cai (2002), Govers and Go (2003), Macarther (2003), Chalip and Costa (2005) and Hede and Jago (2005), the research undertaken here sought to explore the potency, i.e. the real and potential strength, of special niche sport events in the rural environment to extract from visitors an attitudinal construct apposite to, respectively, confirm: knowledge of and loyalty to the event; knowledge of and loyalty to the host town and host area; correlation of event and place to form tangible and resilient place identify associations, and, finally, the correlation of event types to destination attributes and identity. LITERATURE REVIEW Changing rural-urban relations in Europe Since the latter half of the 20th century onwards Europe, the need for agriculture and, by association, market towns has diminished and seen the future of rural areas based on agriculture change irrevocably. While traditional farming and food production roles have depleted and a good deal of the rural community has moved to an urban existence, so technological

development and the lowering of travels costs has encouraged the relocation of new business and residents from the urban to the rural (Courtney & Errington, 2003; Antrop, 2004). The meaning found in, and the usage sought, of the rural and urban environment by an increasingly mobile population with access to ever more technology, information and experience, is likely to have changed profoundly (McEldowney, 2002; Overbeek, 2002; Antrop, 2004). It is in this context that the relation between the UCI Mountain Bike World Cup race and Fort William, and the Lochaber region has been viewed. Background to Fort William and the UCI Mountain Bike World Cup Fort William is the main town in the region with a population of just over 11,000. It is in the third largest district of the Highlands of Scotland (Highland Council, 2006). It is also the largest town in the West Highlands of Scotland and is part of Lochaber, a distinct Highlands and Islands local enterprise area (Highlands and Islands Enterprise, 2007). Lochaber contains the highest mountain in the UK, Ben Nevis, and describes itself as the outdoor capital of the UK (Visit Fort William, 2007). Fort William has been a venue for the UCI Mountain Bike World Cup circuit since 2003. Event Scotland, Highland Council, SportScotland, VisitScotland and the local enterprise company, Lochaber Enterprise, invested £140,000 into the 2006 event. The main world cup races - inclusive of World Cup Cross Country races for men and women, respectively, and the World Cup Downhill races (again for men and women, respectively) - were held over the 26-28th May, with other events held over the two days previous to this. During the three main competition days there were 18,144 visitors in attendance, of whom 9961 were paying spectators, 3230 team riders and officials, and 1200 exhibitors [1]. The event has grown considerably since its inception in 2002 and the competitors following the UCI World Mountain Bike Circuit have, during each year of the circuit (inclusive of Belgium, Spain, Germany, Austria, Canada, Brazil, America and Italy), awarded Fort William as the best downhill and four-cross event of the series. In 2005 the organisers announced that the event was estimated to have created an additional economic impact to Fort William and surrounding Lochaber area of £881,000. Place imagery and Adventure Tourism In Scotland, Page, Steele & Connell (2006) identify that adventure tourism is used as part of the place imagery being managed and generated by the national tourism organisation, VisitScotland. In their analysis of photographic materials produced by the area tourist boards (that existed until 2005) and VisitScotland, Page et al conclude that the images projected were not coherent throughout all areas and that the failing assimilation of product and marketing communication meant adventure tourism was not used as strategically as it ought to have been. While positive that the restructuring of VisitScotland (replacing the area tourist boards with one national network) would alleviate this lack of coherence, Page et al (2006, p73) propose ‘a more integrated approach to marketing communications for the adventure tourism industry’ in which emerging forms of activity should be given greater standing amidst the current emphasis of extreme sports as the adventure tourism experience in Scotland. However concurrent and proceeding research materials tend not to have any conclusive evidence of how management of imagery does or does not ensure repeat destination visitation or destination loyalty. The disparate nature of academic and industry study on the matter has not appropriated one clear conceptual framework from which to stem this evaluation (Gallarza, Gil Saura & Calderón Garciá, 2002; Pike, 2002; Ryan & Cave, 2005). Brand identity and special events Brand identity is a significant element of destination branding and one which Cai (2002) describes as a missing link between models and studies focussing on the relationship between image formation and destination branding. It is suggested here, as Hankinson (2004a) states,

that the overriding perception of place brand as a perceptual entity (or as image(s)) actually limits function. The conclusion is that there is a clear gap between the importance of the use of image as a strategic destination management tool and the value of a given attempt to change the image of a destination when measured against the aims and outcomes of the development strategy from which it was based (i.e. the measurability of its effects.) Evidence suggests that the application of destination cobranding (Cai, 2002; Jago, Chalip et al., 2003), formed by what is described by Govers and Go (2003) as an understanding of narrative psychology, can be applied to a series of smaller sport events in a national context (in this case Scotland), and that such a series can aid the formation of a destination brand coherent with models of sustainable competitiveness. It is also suggested that such a series can be defined as ‘special events’, in much the same way Hede and Jago (2005, p4) argue that a series of theatre-events they studied in Melbourne could be characterised as special events due to their sharing of significant special elements, including their limited duration and the opportunity they offered the attendees to “escape the routines of their everyday lives”, so the layering of niche sport events in the rural destination can create the attributes of being special events. A further proposition is made that in Scotland the current development of sports events based tourism (and by application a great deal of event tourism per se) is adjudicated by pragmatic evaluations of event management organisations to monitor the success of events in terms of micro-economic multiplier analysis and normative social impact assessment. Whilst important in ensuring economic funding these can undermine the prospects of collegiate brand success in many non-urban destinations, i.e. these evaluations don’t give appropriate credence to – or greater strategic opportunity for – the strength of combined narrative or sense of place. Brand Equity, Narrative and Rurban Sport Events Gover and Go (2003) concluded that the disparate nature of responses to the proposed significance of image and an, as yet, unclear link between image, market segmentation and sport event loyalty, has been further muddied as a result of the growth and development of information technology. Information technology is transforming consumer perception and is, as Hughes (1999, p132) puts it, creating a market milieu in which ‘obsolescence has become a vital ingredient in the logic of consumer capitalism’ and in which innovation must be continual. The focus by Hankinson (2003) on the potential to create multiple and developing brand layers, sought through relationships with human personality traits (Aaker, 1997), can be seen as a vital response to this increasing fluidity of image and visitor perception. As with the avenue of marketing theory that sees this dynamic as one of brand personality, where identified human personality traits can be understood in respect of values ascribed to a given product, so it may be applied to destinations (Ekinici & Hosany, 2006). This is referred to as destination personality and can be seen within the models already evolved in urban planning and sustainable urban development (Berg, Borg and Meer, 1995; Tyler and Guerrier, 1998) where clear modes of stakeholder input and destination brand development can be extended. Importantly for this study, its theoretical application in a predominantly rural environment is most readily seen in the analysis of New Zealand destination brand development by Morgan, Pritchard and Piggott (2002) where, like Scotland, wilderness and purity are abiding strengths. Core to this is brand equity (Aaker, 1991) i.e. the brand assets connecting the place name to the service or experience (Dimanche, 2002) and to which destination personality is argued to have a key supporting function (Cai, 2002; Ekinci & Hosant, 2006). The recognition of brand equity in the building of the destination brand is vital for brand longevity and is a key concept in marketing theory developed from the 1950’s onwards (Cai, 2003). At the heart of this is the process and/or activation of ‘information nodes’ (Cai, p723). Grounded in theories of consumer cognition stemming from psychological theory (Chalip and Costa, 2005), these nodes are elements of memory and value engaged in determining the value of the event experience for any given recipient. For the sport event tourist, the strength of the commensurate association of the

event with the event host destination is related to the (hierarchically constructed) schema of associations or attributes s/he has for, respectively, the sport event and the destination. Chalip and Costa (2005, p221) elaborate upon this theory, giving premise for mutuality and positive schema association where the ‘the information is not highly discrepant with the schema’. Accordingly brand identity is proportionate to the links that connect these nodes. In the rural-urban context, the interactive creation of the links and nodes, are the core determinants of event-destination association success. Where the events are collaborative with existing schema, they give opportunity for determining the development of brand identity. Niche Sport Events: Community and Co-branding Community well-being and the perceived values by residents are also significant in the development of event brand identity (Derret, 2003). For non-tourist areas community involvement in the interpretation, generation and development of identity is vital and can aid the use of small events, i.e. non mega-events, as part of an overall strategy to generate tourism for areas which do not otherwise attract tourists (Macarthur, 2003). It is important that communities support local sports to stop them becoming, as Pennington-Gray and Holdnak suggest, inward looking events where ‘the spectator merely comes to attend the event and then leaves, resulting in little net gain’ (2002, p178). While small towns and rural areas are unlikely to have the funding or the political will to mediate rapid development of visitor attractions, cooperative branding in any given destination (or destinations), with community input, is likely to aid long-term success and aid the competitiveness of a destination in an increasingly competitive environment (Jago, L., Chalip, L., Brown, G., Mules, T. & Ali, S, 2003; Cai, 2002; Glover & Co, 2003, and Macarthur, 2003). Moreover, it can be seen as a response to the tendency for niche marketing of rural tourism to undermine collaboration between tourism and hospitality providers (Robert and Hall, 2004) by extinguishing potential rivalries and unifying service providers. This is important as adventure sport tourism requires a good deal of integrated planning to leverage the assets of rural destinations (Costa and Chalip, 2005). METHODOLOGY The founding area of examination was the significance of special and niche sport events in rural Scotland as a form of sports tourism and as essential component of place brand narrative. The response to this area of research has been to draw out a deeper understanding of the construction of the rural sport event tourist realities, helping to glean a schema of associations (Chalip & Costa, 2005) between the sport event and the place and has driven a systematic grounded theory method (Glaser & Strauss, 1967). This methodology gives opportunity for the correlation of research contexts and issues to synthesise and bring forward a broader formal theory (Weed, 2005a; Glaser & Strauss, 1967) with further prospect for application. Accordingly the process uses multiple sources of primary and secondary data as part of a case study analysis to allow the theory to be driven forwards rather than attempt to respond to hypothesis (Goulding, 1998 & 1999). With a view to a synthesis of information, this area of study has allowed a blended research methodology, which Creswell (2003, p12) describes as being able to incorporate "multiple methods, different worldviews, and different assumptions, as well as different forms of data collection and analysis”. While this multi-methodology approach is certainly gaining increasing support in the areas of social sciences in general and tourism in particular (Pansiri, 2005; Davies, 2003) it is certainly not without risk and potential accusations of superficiality (Jamal & Everett, 2004). The need to maintain rigour, quality and ensure work that does not breach research ethics (Lincoln, 1995; Goulding, 1998; Darke, Shanks & Broadbent, 1998; Voss, Tsikriktsis & Frohlich, 2002) has been foremost in the minds of the authors throughout the study. Accordingly, the emerging nature of the evidence has not deferred scientific reflection and systematic review. The inclusion of quantitative data analysis methodology alongside qualitative analysis confirms the value of data collation and research synthesis rather than positivist data determination.

The literature was addressed as the first case study (Strauss & Corbin, 1990). This analysis of theory and collected data notes developed an initial framework of rural niche sport tourist psychological associations. This has provided a theoretical sensitivity (O’Callaghan, 1996; Goulding, 1999; Weed, 2005b) to the research area brought forward. A case study analysis of the UCI 2006 Mountain Bike World Cup event, held at the Nevis Range, Fort William, in the Western Highlands of Scotland was undertaken to investigate the way in which non-competing mountain bike race tourists construct their relationship to both the event and the place. Other research methods have been used. These include consideration of the values and perceptions of competing team members from both the UK and overseas (using internet self administered questionnaires) and the other (using personal interviews) with non-event visitors. The second of these is not included the findings of this paper. To eradicate any confusion that may arise for the term case study, the separate research elements will be referred to as ‘stage’, i.e. analysis of literature is referred to as stage 1, i Stage 1: Emerging area of investigation The discussion of related literature brought out three core propositions. 1) The strength of a one-off or series of niche sports in the rural context in affecting the perception of the area, i.e. affects brand identity (sense of place), is proportionate to the schema of associations the sport visitor has of the sport event and the destination. 2) The schema is enhanced where more than one event has clear psychological association with other events. 3) The greater the knowledge of niche sports events in the area the greater the positive association of a series of such events to the needs of sustainable development of the area. Stage 2: Case Study - UCI 2006 Mountain Bike World Cup event (visitors) In order to obtain rich data sets in which the thoughts, feelings, intention and behaviour of the sport event visitor could be collected (Chen, 2004), an on-site survey was used. Data was collected within the race grounds between 27 and 28th May 2006 - the world cup series race days. Data collection began one hour after the start of the event and finished during the last race. While the data set for event visitors in this case is small (n=54) the extended nature of the interviews offered a depth of response which would aid comparison with the other data sets. The interviews lasted fifteen to twenty minutes in each case. The responses to the survey questionnaire were recorded by interviewers. The questionnaire had 5 core components. 1) general information about the sport event visitor. 2) more specific information about their visit to the event and attribute ratings for the surrounding area, utilising five point Likert scale questions. 3) the respondent to gauge their own relation to sport and sport events using attribute ratings involving semantic differentials (Chalip, Green and Hill, 2003; Hede, 2005). 4) Likert scales were used to measure both respondents’ association of different sport activities with attributes of place, and also measure the perceived significance of the UCI event in respect of sense of place. The third and fourth components used labelled and numerical descriptors as well as preliminary explanations from the interviewer to eradicate confusion (Fallon & Schofield, 2003). The final component measured the respondent’s knowledge of other sport events held in rural Scotland. The structure of the questionnaire utilised many of the techniques used by others measuring satisfaction levels, perception of quality, event involvement behaviour, and sport involvement behaviour (Chen, 2004; Hede & Jago, 2005; Johnston & Twynam, 2006) derived from the first case literature review. Stage 2: Findings The three areas of investigation proposed were considered by correlation of the respondents’ knowledge of the event against their responses to 13 questions that asked for the association of the town of Fort William with specific sports and to 7 questions concerning sense of place. The

ordinal nature of this data means that the Spearman rank correlation coefficient (rho) is applicable rather than the more usual Pearson linear correlation coefficient. This would give evidence of whether there is a significant correlation between event knowledge and the degree to which the town of Fort William is associated with a sport. A positive correlation means that people with more knowledge of events will believe more strongly that Fort William is associated with particular types of sport as compared to people who have less knowledge of such events. If there is a negative correlation, then those with more knowledge will believe that there is less association between Fort William and the particular type of sport. Knowledge of Scottish and Lochaber regional events has been calculated by adding together the results of responses to questions on individual events. For each event, in the questionnaire the respondent scored 1 if they had either heard of the event or were going to attend the next event and 2 if they had attended the last event. The maximum score for each event was 2. The mean Scottish event knowledge score was 7.3 out of a possible 40 with a standard deviation of 4.8. The mean Lochaber regional event knowledge score was 4 out of a possible 16 with a standard deviation of 2.1. This indicates relatively poor average knowledge of the events since, on average, less than 25% of both Scottish and Regional events are known to respondents. The questions on the association of Fort William with 13 sports are summarised in table 1. The questions asked the degree to which the respondent thought Fort William was associated with each sport. The Likert scale was converted into values of 1 to 5 to produce these statistics. The first section of the table gives summary statistics for the questions. The table indicates that mountain biking, skiing/snowboarding and mountaineering are all most highly associated with Fort William while rugby, athletics and football have the lowest associations. These results are in line with expectation of sports in that region. The right hand side of table 1. contains correlation coefficients of responses to the questions on the association of each sport with Fort William against that of the Scottish and Lochaber event knowledge scores. The table includes p-values and has been sorted by p-value. The most significant sports appear at the top of the table. Nine of the correlations have been highlighted where the significance of the correlation is less than 5%. These are weak correlations (rho < 0.5) but indicate a statistically significant correlation between respondents’ opinions of the association of Fort William with some sports and their knowledge of Scottish and Lochaber regional events. These findings give some support to the first proposition drawn from the literature. The results of table1. also indicate an unexpected dynamic. The strongest correlation is that of mountaineering with event knowledge (rho = 0.47) but the second strongest correlation involves golf (rho = 0.45) despite the fact that golf is not normally associated with the region. The Pearson correlation coefficient (r) between golf and knowledge of Scottish sports event was only 0.29. This difference is as a result of the non-linear association between the two measurements. Athletics also had a discrepancy of 0.1 between the measures of correlation.

Table 1 Summary statistics and correlations for 13 sports in the Fort William area
Summary Statistics
Event knowledge correlations Scottish Lochaber How strongly is Fort William
associated with Mean Std Dev Rank
Rho p-val Rho p-val N Mountaineering 3.6 1.7 3 0.47 0.00 0.34 0.01 54 Golf 1.7 1.1 10 0.45 0.00 0.33 0.01 54 Motorcycle trials 2.7 1.6 7 0.42 0.00 0.36 0.01 54 Orienteering 2.9 1.6 4 0.32 0.02 0.26 0.06 54 Athletics 1.4 0.8 12 0.29 0.03 0.27 0.05 54 Rugby 1.1 0.5 13 0.24 0.08 0.20 0.16 54 Football 1.4 0.9 11 0.24 0.08 0.20 0.16 54 Mountain Biking 4.6 1.1 1 0.24 0.08 0.12 0.40 54 Skiing/Snowboarding 4.1 1.5 2 0.22 0.11 0.18 0.19 54 Fishing 2.6 1.5 8 0.20 0.14 0.13 0.36 54 Canoeing 2.7 1.6 6 0.18 0.20 0.06 0.69 54 Fell running 2.8 1.6 5 0.13 0.35 0.09 0.50 54 Canyoning 2.0 1.3 9 0.11 0.43 -0.02 0.90 54
The relationships between the mountaineering and event knowledge scores are shown in figure 1 for both Scottish and Lochaber events knowledge. Both charts indicate that respondents with the highest knowledge of events have the strongest association between mountaineering and Fort William. Respondents with low knowledge of events may or may not associate mountaineering with Fort William. These scatter plots have been created for the responses concerning other sports. Figure 1 Scatter plots of respondent’s opinions of the association of Fort William with mountaineering against their knowledge of Scottish (left, rho = 0.47) and Lochaber (right, rho = 0.34) events. (Jitter has been added to the scores for display purposes only.) The second group of questions required the respondent to give the level of agreement with 7 statements concerning sense of space. The questions are summarised at the foot of table 2. Significant correlations indicate a strong relationship between the event and (a positive) sense of place. The summary statistics indicated highest agreement with the statement that the “UCI World Cup was a huge advantage to the Highlands” narrowly followed by “All year scenery and landscape give a distinct sense of place”. The statements that the respondents “Only come to Fort William if it hosts international events” and that “Lochaber area does not have enough for visitors outside Scotland” achieved the lowest levels of agreement. Accordingly there is evidence to suggest that the affinity with the area is not necessarily reliant on major international events either as a pull factor or as sole visitor activity. Responses to all 7 of these questions indicate that survey respondents were satisfied with the area. As a whole the responses indicate a positive association of a series of events with the needs of sustainable development.

The sense of place responses were also correlated to respondents’ knowledge of Scottish and Lochaber regional events. The results of this analysis are given in table 2. All but one correlation was negative. Only 1 correlation was found to be statistically significant at the 5% level. This was the agreement with the statement that “a series of sports events would threaten the area” correlation with the Lochaber event knowledge score (rho = -0.283). This negative correlation indicates that those with greater knowledge of Lochaber events think that the area is less likely to be threatened by a series of sports events. Again this is supportive of the third proposition and is reassuring for organisations wishing to expand the number of such events in the area. The smaller number of significant correlations indicates only weak evidence in respect of proposition 1 and 2. Further case data analysis needs to be executed in this area to more rigorously determine significance.
Table 2
Summary statistics and correlations for seven sense of place variables
Summary Statistics
Event knowledge correlations Scottish Lochaber Sense of Place Mean
Std Dev Rank Rho p-val Rho p-val N
1 A series threatens area 2.3 1.3 5 -0.21 0.13 -0.29 0.04 54 2 Not enough in Lochaber 1.9 1.1 6 -0.22 0.11 -0.25 0.07 52 3 Welcoming people 3.9 0.9 3 -0.15 0.29 -0.19 0.16 54 4 International events only 1.7 1.3 7 -0.13 0.37 -0.08 0.57 53 5 UCI advantage 4.4 0.9 1 -0.13 0.34 -0.05 0.71 54 6 Scenery 4.4 0.8 2 0.04 0.80 -0.04 0.78 53 7 UCI given reason to see 3.6 1.5 4 -0.04 0.79 -0.02 0.87 54 Key 1 A series of sports events would threaten the area 2 Lochaber area does not have enough for visitors outside Scotland 3 Welcome from local people is as good as or better than anywhere else outside Scotland 4 Would only come to Fort William if it hosts international events 5 UCI world cup is a huge advantage to Highlands 6 All year scenery and landscape give distinct sense of place 7 UCI world cup has given reason to see more of the area An overview of the results of the analysis shown in tables 1. and 2. is given in figure 2. These contain one point for each question. The left hand chart concerns the questions on sports while the right hand chart concerns the questions on sense of place. When considering questions about the association of Fort William with various sports three question clusters can be seen. The first cluster contains athletics, football and rugby, the second contains canoeing, canyoning, fell running and fishing and the third contains mountain biking and skiing/snowboarding. The grouping is particularly interesting since it does not include mountaineering. It could be the case that the affinity respondents had to mountain biking explains their distance from mountaineering. The proximity of mountain biking and skiing/snowboarding could be related to the gondola uplift available during the UCI event. As a significant architectural marker it is quite possible that it acts as a connection in the respondents’ minds. The chart of sense of space responses has been plotted on over similar axis range to that of the sports responses. None of the correlations indicated on the Y axis of the chart are significant. The correlation of “Not enough in Lochaber” with Scottish event knowledge score has a value of only -0.22. The mean agreement scores again give encouragement to the event organisers

and funding partners. The 3 responses on the far left of the chart are optimal if they are low while the 4 responses to the right are optimal if they are high. Figure 2. Overview of analysis in tables 1. & 2. Figure X2 Scatter plots of Fort William sports and sense of space question Left scatterplot: correlation of Scottish event knowledge against mean association with Fort William; Right scatterplot: correlation of Scottish event knowledge against agreement with sense of space questions The right hand side of figure 2 summarises the correlations between event knowledge and the respondent’s view of the sports. Both methods were investigated and there was agreement between the approaches. The largest disagreement was with the correlation of golf to the Scottish knowledge score. Unusually the Spearman correlation is greater with a value of 0.45 compared to only 0.29 using Pearson correlation. Stage 2: Summary and limitations of research This analysis showed significant but weak correlations of respondents’ views of the association of some sports with Fort William to their knowledge of Scottish and regional events. This evidence lends some weight to the first and second propositions arising from stage 1 (the literature review) and does go some way to showing causal link in each case. Nonetheless, further analysis in the other research methodologies employed may serve to confirm validity of this relationship more clearly. Greater weight is evidenced in relation to the third proposition, i.e. that sport event visitors that have greater knowledge of niche sports events in the area more clearly associate a series of such events to the needs of sustainable development of the area. For each of the propositions, however, further work needs to be carried out to fully analyse and synthesise the findings towards constructs that give further grounding for the theory (and it’s testing). Thus responses could be combined to reveal underlying variables that may show stronger correlations to event knowledge. It should also be noted that the sample contained respondents from different backgrounds, e.g. overseas visitors and visitors to Fort William who were incidental visitors to the sport event, and accordingly that event subsets of respondents may have different opinions to the average used in this analysis. Significantly our sample was taken predominantly from respondents with a specific interest, i.e. in world class mountain bike racing. It may not be possible to apply these results to the population at large. Further data from other interest groups is required to support this view. Similarly the measurement of event knowledge was imprecise and not validated. New ways of measuring event knowledge could be explored. This could include breaking the knowledge into several dimensions.

Stage 3: Case Study - UCI 2006 Mountain Bike World Cup event (competitors) A self completion survey – utilising the online survey tool Survey Monkey - was sent to a representative of all teams who took part in the World Cup event. The objective was to find general information about the composition of each team by age and origin profile as well as gain some insight into their visit experiences. Following discussion with the event management company the survey was only sent out to the larger teams (3 or more members). A questionnaire was sent to the team leader and responses were taken – with instruction - as a proxy for the team as a whole. 142 teams received the questionnaire with 51 (36%) useable responses returned. This represented 232 team members. The feedback on sense of space was gauged by the question, “Did the nature of the area enhance the overall experience.” Only yes or no answers were acceptable. Just 2 respondents (both from Southern England) answered no to the question giving 96% agreement. This affirmed the value of Fort William as a venue for this type of event. A test was carried out to see if there is a difference in the age composition of the teams that have a positive impression of the area and those who did not. The age profile of the groups is summarised in the table 3 below. Inspection of the table indicates that the teams who answered yes are younger than those who answered no. The statistical association of age group with opinion of the area was tested by collapsing the results into a 2x2 table using 2 age groups of 34 & under and 35 & over. The resulting chi-square statistic was 4.9 (p=0.027, df=1) and indicates that there is some evidence that the older teams did not think that the area enhanced their overall experience. This result should be treated with caution since the ratio of yes to no is above 10. However, the result was backed up by calculation of the average ages of teams. Those who believed that the area enhanced the experience had an average age of 31.6, while those that did not had an average age of 36.2.
Table 3 Cross tabulation of team members age group against the question on the nature of the
area.
Age group of team member 17 &
under 18 - 21
22-34
35-44
45-55
56 & over All
1 Yes 7 35 110 54 8 2 216 2No 0 0 7 8 1 0 16 All 7 35 117 62 9 2 232
1 Did the nature of the area enhance the overall experience? 2 The chi-square test is not applicable since many expected counts are less than 5. The study indicated that the nature of Fort William area enhanced the teams overall experience and that this was stronger for teams with younger members. Further case analysis based on a extension of age groups and area associations to assess significance of age/ perception from case 2 will be advantageous to the study. CONCLUSIONS The levels of significance found are not conclusive but within the limitations of research indicated the results have given a firm basis for further interpretive investigation of the proposed correlative relationship, i.e. the potency of the brand narrative, and a better understanding of how narrative psychology can be applied to a series of smaller sport events in a regional or national context (in this case Lochaber and Scotland respectively). A grounded theory approach was taken here and the phases of analytical research were defined to distil an order of data (which the other methods of research also perform). The sample approach taken

here is concerned with iterative assimilation of data. The findings of the analysis here are forwarded as part of that process. Case 3 reemphasised a number of emergent themes from Cases 1 and 2. As such, it is an important contribution towards the assimilation of more defined respondent cluster knowledge – and thus the open coding process which has evolved. Together, case 1, 2 and 3 indicate various correlations of emergent themes, i.e. nature, sense of place, sport knowledge, event knowledge, event experience and association with sport. Case 4 will look to enhance the theoretical framework with interviews (semi-closed questionnaire) and focus group participation (open questions) held with the 7 Stanes range of mountain bike centres in the Borders of Scotland [2]. IMPLICATIONS Page, Steel & Connell (2006, p72) state that the development of Scotland’s adventure tourism will, for the areas of Perthshire and Fort William in particular, encourage ‘place awareness among a more global adventure tourism audience’. The research here suggests that niche sport events are not, as yet, playing as important a part in that as they should. As a world championship event, the forthcoming World Championship event in Fort William (3-9 September, 2007) will be far bigger then any of the previous events. There is an opportunity for Fort William, Lochaber, the West Highlands and, ultimately, Scotland to develop mountain biking and mountain biking race events in combination with other niche sporting events and activities to play a more significant role in creating area loyalty. Moreover, at a time of increased environmental awareness, the research here shows that events such as the UCI races are seen as positive both in respect of their impact on their environment and as a motivational factor for seeing more of the Highlands of Scotland. Conversely, there is also potential for the event – and others like it – not to draw people beyond the sport experience itself and the – separate - Highlands scenic landscape construct understood by so many (Page et al., 2006; Prentice & Cano, 1998). So where the events are collaborative with, i.e. relate to, existing schemas, they do give opportunity for determining the development of brand identity. Given that 2007 sees Fort William holding the UCI World Championship at a time when the Highlands of Scotland are host to Highland 2007, a year of events ‘celebrating traditional and contemporary Highland Culture’ (www.highland2007.com) it will be interesting to see what cognition, if any, arises in the minds of exiting and potential market segments. Finally, this work is ongoing and is part of an extrapolation from the constructs formed to create greater understanding of the elements - the nodes, which can be seen as further aiding a strategic and schematic relationship between sport event tourist and sense of place in the rural-urban environment. The interprevist case study approach does allow the ‘research question to evolve and for constructs to be modified…’ and allow ‘...the theory to shift from theory building to theory testing’ (Voss et al, 2002, p201). The iterative approach is cumulative and appropriate to collation and expansion of what Weed (2006, 265) described as ‘undiscovered public knowledge’. Here, it is part of an overall evaluation of the opportunity of sport events to be part of the destination personality and, in respect of the special needs of rural development, to aid opportunities for cooperative branding in which the restriction of geographic names and static associations can be removed. This could provide what Cai (2002, p738) describes as ‘a rare opportunity to give the newly defined regional destination a unique name and to build a unique identity as a result’. REFERENCES Aaker, D.A. (1991) Managing brand equity: capitalising on the value of a brand name The Free
Press, New York

Aaker, J. L. (1997) Dimensions of brand personality Journal of Marketing Research 34, 347-356
Antrop, M. (2004) Rural-urban conflicts and opportunities in The new dimensions of the European landscape (R.H.G. Johgman, ed) The Netherlands: Springer, 83-91
Backman, K.F., Backman, S.J., Uysal, M. & Sunshine, K.M. (1995) Event tourism: an examination of motivations and activities Festival Management & Event Tourism 3, 15-24
Berg, J. van der., Borg, J van der., & Meer, J van der. (1995) Urban Tourism Aldershot: Avebury
Cai, L.A. (2002) Cooperative branding for rural destinations Annals of Tourism Research 29 (3), 720-742
Cano, V. & Prentice, R (1998) Opportunities for endearment to place through electronic ‘visiting’: WW homepages and the tourism promotion of Scotland. Tourism Management, 19 (1), 7-73
Carlsen, J, Getz, D. and Soutar, G. (2001) Event evaluation research Event Management 6, 247-257
Chalip, L. & Costa, C.A. (2005) Sport event tourism and the destination brand: towards a general theory in Sport in Society – culture, commerce, media, politics 8 (2), 218-237
Chen, P. (2004) Sport club: understanding fans’ loyalty Journal of Hospitality, Tourism and Leisure Science December (3), 1-21
Courtney, P. & Errington, A. (2003) Small towns as ‘subpoles’ in European Rural Development: policy, theory and methodology Contributed paper – Agricultural Economics Society Annual Conference, University of Plymouth 11-14 April
Costa, C. A. & Chalip, L. (2005) Adventure sport tourism in rural revitalisation – an ethnographic evaluation European Sport Management Quarterly 5 (3), 257-279
Creswell, J.W. (2003). Research design: Qualitative, quantitative, and mixed method approaches. (2nd ed.) Thousand Oaks: Sage
Darke, P., Shanks, G. & Broadbent, M. (1998) Successfully completing case study research: combining rigour, relevance and pragmatism Information Systems Journal 8, 273-289
Derret, R. (2003) Making sense of how festivals demonstrate a community’s sense of place Event Management 8, 49-58
Dimanche, F. (2002) The contribution of special events to destination brand equity. In K.W. Wober (Ed.) City Tourism 2002: Proceedings of European Cities Tourism’s International Conference, 73-80, Vienna: Springer
Dinić, M. & Cekić (2001) Tourist potentials of rural regions in the area of Niš Architecture and Civil Engineering 2 (3), 209-217
Ekinci, Y. & Hosany, S. (2006) Destination personality: an application of brand personality to tourism destinations Journal of Travel Research 45, 127-139
Esparcia, J. & Buciega, A. (eds) (2002) New rural-urban relationships in Europe: a comparative analysis Building Rurban Relations QLKT5-CT-2002-01696 University of Valencia (Spain)/European Commission Research Directorate General
Fallon, P. & Schofield, P. (2003) “Just trying to keep the customer satisfied”: a comparison of models used in the measurement of tourist satisfaction Journal of Quality Assurance in Hospitality &Tourism 4 (3/4), 77-96
Funk, D. & James, J. (2001) The psychological continuum model: a conceptual framework for understanding and individual’s psychological connection to sport, Sport Management Review 4, 119-150
Hankinson, G. (2004a) Relational network brands: Towards a conceptual model of place brands Journal of Vacation Marketing 10 (2), 109-121
Hankinson, G. (2004b) The brand images of tourism destinations: a study of the saliency of organic images, Journal of Product and Brand Management 13 (1) 6-14

Hede, A-M., Deery, M. & Jago, L.K. (2002) A conceptual models of satisfaction with special events: a destination branding context, Paper presented at 2002 CAUTHE conference Tourism and Hospitality on the Edge
Hede, A-M. & Jago, L. (2005) Perceptions of the host destination as a result of attendance at a special event: a post-consumption analysis International Journal of Event Management Research 1 (1), 1-12
Hede, A-M. (2005) Sports-events, tourism and destination marketing strategies: an Australian case study of Athens 2004 and its media telecast Journal of Sport Tourism 10 (3), 187-200
Highlands & Islands Enterprise (2006) www.hie.co.uk – Accessed 12/12/06 Hughes, H.1994 Current Issues: Tourism Multiplier studies: a more judicious approach Tourism
Management 15 (6), 403-06 Gallarza, M.G., Gil Saura, I. & Calderón Garciá, H. (2002) Destination Image – Towards a
Conceptual Framework Annals of Tourism Research 29 (1), 56-78 Gandhi-Arora, R. & Shaw, R.W. (2002) Visitor Loyalty in Sport Tourism: An Empirical
Investigation Current Issues in Tourism 5 (1), 45-53 Gibson, H. (1995) The Wide world of Sports Tourism Parks and Recreation, 108-114 Goulding, C. (1998) Grounded theory: the missing methodology on the interpretivist agenda.
Qualitative Market Research: An International Journal 1(1), 50-57 Goudling, C. (1999) Consumer research, interpretive paradigms and methodological
ambiguities European Journal of Marketing 33 (9/10), 857-873 Govers, R. & Go, F.M. (2003) Deconstructing Destination Image in the Information Age
Information Technology and Tourism 6, 13-29 Gratton, C. & Henry, I. (eds) (2001) Sport in the City: The role of sport in economic and social
regeneration London: Routledge Gratton, C., Dobson, N. and Shilli, S. (2000) The economic importance of major sports events:
a case-study of six events Managing Leisure 5, 17-28 Jago, L., Chalip, L., Brown, G., Mules, T. & Ali, S. (2003) Building events into destination
branding: insights from experts Event Management 8, 3-14 Jamal, T.B. & Everett, J (2004) Resisting rationalisation in the natural and academic life-world:
critical tourism research or hermeneutic charity? Current Issues in Tourism 7(1), 1-19 Johnson, L.W., Soutar, G.N. & Sweeney, J.C. (2000) Moderators of the brand image/perceived
product quality relationship Journal of Brand Management 7 (6), 425-433 Johnston, M. & Twynam, G. (2006) Sport event tourism and involvement behaviour of resident
and non-resident spectators. In M.Robertson (Ed.) Festival and events: beyond economic impacts, Volume 1. Sporting events and event tourism: impacts, plans and opportunities, Brighton: LSA publications, 77-94
Keller, K. L. (1993) Conceptualising, measuring and managing customer based brand equity Journal of Marketing 57, 1-22
Lincoln, Y. S. (1995) Emerging criteria for quality in qualitative and interpretative research Qualitative Inquiry 1(3), 275-289
McEldowney, M. (2005) The rural-urban interface: outskirts of European cities in Planning in Ireland and Beyond (M. McEldowney, M. Murray, B. Murtagh & K. Sterret, eds) Belfast: SEP, 319-332
Macarther, S. (2003) Can small events be used as part of a destination marketing strategy to generate tourism to a non-tourist centre? Journal of Hospitality and Tourism Management 10, 41-50
Morgan, N., Pritchard, A. & Piggott, R. (2002) New Zealand, 100% pure: the creation of a powerful niche destination brand Journal of Brand Management 9 (4/5), 335-354
Nam-Su, K. & Chalip, L, C. (2004). Tourism management: Why Travel to the FIFA World Cup? Effects of motives, background, interest, and constraints. Tourism Management 25, 695-707

O’Callaghan, J. (1996) Grounded theory: a potential methodology Counselling Psychology Review 11 (1), 23-28
Oliver, R.L. (1999) Whence consumer quality? Journal of Marketing 63, 33-44 Overbeek, G (2002) Building new relationships in rural areas under urban pressure in New
rural-urban relationships in Europe: a comparative analysis (J. Esparcia & A. Buciega, eds)
Page, S. J., Steele, W. & Connell, J. (2006) Analysing the promotion of adventure tourism: a case study of Scotland Journal of Sport & Tourism 11 (1), 51-76
Pansiri, J (2005) Pragmatism: a methodological approach to researching strategic alliances in tourism Tourism and Hospitality Planning and Development 2(3), 191-206
Penington-Gray, L. & Holdnak, A. (2002) Out of the stands and into the community: using sports events to promote a destination Event Management 7, 177-186
Pike, S. (2002) Destination Image – a review of 152 papers from 1973 to 2000 Tourism Management 23, 541-549
Richie, B. & Adair, D. (2002) Editorial: the growing recognition of sport tourism Current Issues in Tourism 5 (1), 1-6
Robertson, M. (2004) Sport and Leisure Narrative in Sport and Leisure Operations Management (I. Yeoman and U. McMahon-Beattie, eds) London: Thomson Learning, 16-27
Robert, L. & Hall, D. (2004) Consuming the countryside; marketing for ‘rural tourism’ Journal of Vacation Marketing 10 (3), 253-263
Ryan, C. & Cave, J. (2005) Structuring destination image: a qualitative approach Journal of Travel Research 44, 143-150
Steward, W.P. (2004) Visualising leisure Journal of Leisure Research 36 (4) Strauss, A. & Corbin, J. (1990). Basics of qualitative research: Grounded theory procedures and
techniques. London: Sage. Tyler, D. & Guerrier, Y. (1998) Conclusion: urban tourism – the politics and process of change,
in Managing tourism in cities – policy, process and practice (D. Tyler, Y. Guerrier, M. Robertson, eds) Chichester: John Wiley and Sons, 229-237
Voss, C., Tsikriktsis, N. & Frohlich, M. (2002) Case research in operations management International Journal of Operations and Production Management 22 (2), 195-219
Weed, M. (2005a) Research synthesis in sport management: dealing with “Chaos in the Brickyard” European Sport Management Quarterly 5 (1), 77-90
Weed, M. (2005b) “Meta Interpretation”: A method for the interpretive synthesis of qualitative research. Forum: Qualitative Social Research 6 (1), Art. 37 (http://www.qualitative-research.net/fqs accessed 20 January, 2007)
Weed, M (2006) Undiscovered public knowledge: the potential of research synthesis approaches in tourism research Current Issues in Tourism 9(3), 256-268
Xiang, R. & Petrick, J. (2006) A review of festival and event motivation studies Event Management 9, 239-245
International Mountain Bicycling Association (www.imba.com: accessed 22/12/06) Notes [1] Visitor statistics for the event from 2002 to 2006 were kindly forwarded by Rare
Management the event managers (www.raremanagement.co.uk). The authors of this article thank the staff at rare management for their support in allowing data to be collected during the event and for their participation in formative research discussion.
[2] The 7 Stanes is the name of a seven site mountain bike range in the South of Scotland. The
project is managed by Forestry Commission Scotland in partnership with a number of UK and European organisations and funding agencies. Further information is available at www.7stanes.gov.uk.

Fourth International Event Research Conference Re-evaluating the City/Town: Events as a Catalyst for Change
CELEBRATING A NATIONAL DAY: THE MEANING AND IMPACT OF AUSTRALIA DAY EVENTS
Margaret Deery
Sustainable Tourism CRC Centre for Hospitality and Tourism Research
Victoria University [email protected]
Leo Jago
Sustainable Tourism CRC Centre for Hospitality and Tourism Research
Victoria University
Liz Fredline Sustainable Tourism CRC
Griffith University
ABSTRACT National days are generally intended to kindle pride amongst citizens. However, the celebration of national days can be surrounded by controversy; equally, such a day can be met with apathy or antagonism. Australia Day is no different. Whilst this day has sparked a greater sense of community, issues such as the return on the funds spent on the numerous events staged around the nation, the reasons for the celebrations and the general levels of participation in Australia Day events require constant monitoring. This paper provides the findings from a study of the meaning of Australia Day, commissioned by the National Australia Day Council (NADC) and based on previous research findings from numerous studies into the social impacts of events. The study involved the conduct of focus groups and a national self-complete survey sent to 10,000 Australians, although only 840 completed questionnaires were returned. The findings suggest that Australia Day is, overall, viewed very positively by the respondents and the level of participation in the activities is quite high. More importantly, the study found that those who attended organized Australia Day events were more positively disposed towards the concepts of the national day and the celebration of the Australian way of life. Such findings support the focus of the National Australia Day Council in providing a variety of organized events that are spread to all parts of Australia. Keywords: national day, impacts, meaning.
INTRODUCTION In her edited book, Fuller (2004) examines the role of nation building and nationalism in a range of countries around the globe. She argues that there is a range of ways of bringing a nation together and suggests that:
“The days, then, bespeak the ways a country operates. How those holidays are experienced by the public, and how those nations are viewed by the wider world, become pivotal. National images, we learn, can help form attitudes and affect behaviours. National days encourage that image making.” (p.3)

Fox (2006: 220) adds to the discourse on national days by arguing that these holidays “provide a mass expression of national belonging”. Fox also notes that the celebrations often say little about the ‘bearers of the identity” – the ordinary citizens attending the events. His study, examining the variation in meaning and cohesion of Romanian and Hungarian students who participated (or did not participate) in the two most important national days, found that participation in the national day was somewhat passive. In the past, students in these countries were at the forefront of such national days, whereas now “it is sports, not holidays, dancing peasants or nationalistic politics that ignites the passions of the students in the public experience and expression of collective allegiances” (p.231). He argues that while these national days may provide some opportunity to be together, they do not engender nationalism in the long term. When examining the celebration of Empire Day in Britain between 1904 and 1958, English (2006) found that the day engendered a sense of civic pride as well as a sense of self-importance. This was particularly so in the smaller towns where it was found that Empire Day presented the opportunity to participate in a national event by way of successful celebratory activities. English suggests that day was used to revive the “paternalistic culture of hierarchy and deference” (p. 256). Overall, the day, albeit an ‘invented tradition’ tended to provide a sense of social cohesion that did not occur at other times. Interestingly, the celebrations of Empire Day after World War 11 were markedly different and there was a significant amount of opposition to the day. In particular, there were assaults on the British flag and other activities that illustrated a decline in imperial nationalism (Grosvenor, 1999). With regard to Australian nationalism and the meaning of being Australian, research by Phillips and Smith (2000) and White (2006a; 2006b) provide insights into these issues. Phillips and Smith (2000: 219), for example, found that there was ‘remarkable homogeneity’ in their findings on the meaning of being Australian, which they argue were consistent with the traditional understanding of the concept. They use the life-saver as the exemplar in that he (most likely) embodies the values of self-sacrifice, belonging to an ‘Australian’ organization and working in a traditional outdoors setting. The authors conclude that the meaning of being Australian in located in ‘personal experience and popular culture’ (p. 220) and that the concept of mateship is alive and well in modern Australia. Finally, work by White (2004; 2006b) on the celebrations of the Bicentenary of Australia, introduces the concept of national day celebrations closer to the focus of this paper, namely, Australia Day. White (2004) discusses the notion of national identity and sentiment arguing that sentiment for the nation ‘involves a sense of personal identification and empathy with an entity far beyond the individual” (p. 26). In her concluding comments, White contends that while some people saw the Bicentenary celebrations engendering greater unity over issues such as multiculturalism, national identity and Aboriginal inequality, others, such as expressed by the editorial in The Australian, January 26 2000, acknowledged that there was a long way to go with regard to the Aboriginal question. Specifically, White uses a quote from a commentary by Qantas stating “Australians generally fail to make efforts to understand why Aborigines are so alienated by our prosperous society” (quoted in White, 2004: 38). In her examination of the bicentenary and the Sydney Olympics (2006b), White pursues the relevance of indigenous issues in understanding Australian identity. She suggests that the Sydney Games offered an opportunity for indigenous inclusiveness and that the selection of Cathy Freeman to light the Olympic torch was symbolic of Australia’s recognition of the place of Aborigines in Australia’s identity. The issue of the influence of attendance at, and participation in, events has been studied from a number of angles. Fredline and Faulkner (2002), for example, found that participation in an event is likely to be highly interrelated with identification with the theme. Wood (2005), in her study examining the social and economic impacts of local authority events, found that

participation in the events increased the level of civic pride, although she also found that the change in attitude was not retained a month after the event. The challenge for any organisation wishing to change attitudes through events is how to maintain the changed or enhanced attitude. Other researchers such as Keogh (1990) and, more recently, Mason and Cheyne (2002) discuss the benefits and levels of attachment when participation in community activities is high. The questions to be examined in this paper then, are:
o What is the meaning of Australia Day to Australians? o Does attendance at an Australia Day event influence perceptions of national days such
as Australia Day? METHOD Phase 1: Focus Groups Data collection for the study was conducted in two phases. The first phase involved the use of focus groups to provide an in-depth understanding of the perceptions and meaning of Australia Day. A number of focus groups were conducted in Queensland and Victoria to explore the meaning and impact of Australia Day. Two groups in each state were conducted based on the following criteria:
• Focus Group One – participants were to be second (or more) generation Australian. That is, they were born in Australia and at least one parent was born in Australia.
• Focus Group Two – participants were to be born overseas and have migrated to Australia at least five years ago. It does not matter whether they are permanent residents or have taken up Australian citizenship.
The key questions asked in the focus groups were:
• What does Australia Day mean to you? • How do you normally celebrate Australia Day? • Have you attended an organised Australia Day celebration in recent years?
o If yes – what did you think of it? o If no – why not?
• Are you aware of there being an organised Australia Day event in your neighbourhood/community?
• Does this have any impact on you? Positive or negative? • What broader impacts do you think Australia Day celebrations have on the country as a
whole? Positive or negative? Key Themes The following themes, relating to the meaning and impact of Australia Day, emerged from the focus groups. Australia Day is:
1. A celebration of: a. Diversity b. Flora and fauna c. Traditional food d. ‘Aussieness’ e. Achievement f. Community g. Multiculturalism / welcoming new Australians
2. An opportunity to participate in Events that: a. are educational b. provide an understanding of being Australian

c. are good fun/competitive d. provide an opportunity to be with family and friends
3. A public holiday that brings people together 4. An inappropriate ‘celebration’ of the first landing and settlement due to the treatment
of indigenous Australians and should perhaps be moved to another day? 5. A holiday that has nothing to do with being Australian but merely a chance to relax.
The information obtained from these focus groups was then included in the design of the survey instrument for Phase 2 of the study. Phase 2: Quantitative Study The Australia Day questionnaire was developed based on previous research conducted by the Sustainable Tourism CRC on the social impacts of events, and was fine tuned following the focus groups conducted in Queensland and Victoria. The key elements of the questionnaire were:
• Awareness of Australia Day • Impacts of Australia Day on the community • Australia Day activities (both private and organised public events) • Meaning of Australia Day • Impediments to participating in Australia Day • Demographic information
Sampling A sample of 10,000 Australian residents was selected from the National Household Index maintained by Impact Lists. A stratified sampling procedure was used, with 500 households selected from each of the following 20 regions chosen to provide good national coverage:
• Sydney + 2 Local Government Areas in regional New South Wales • Melbourne + 2 Local Government Areas in regional Victoria • Brisbane + 2 Local Government Areas in regional Queensland • Adelaide + 2 Local Government Areas in regional South Australia • Perth + 2 Local Government Areas in regional Western Australia • Hobart + 1 Local Government Areas in regional Tasmania • Darwin + 1 Local Government Areas in regional Northern Territory • Canberra
Of the 10,000 survey packages sent out, approximately 700 were undeliverable because the householder was no longer at that address, and 813 were returned (seven of which were discarded due to missing data). This represents an effective response rate of just under 9%. While this is a disappointing result, it appears to be consistent with the response rates achieved in recent postal surveys. There is a noticeable trend toward declining response rates for all survey administration methods (postal, telephone and face to face), especially where the target population is general, as in this case. This may be attributable to the fact that people lead increasingly busy lives and there are many demands on their time. There also appears to be a growing scepticism amongst some sectors of the community regarding the motives of research which is likely to be driven by negative experiences with telemarketers. Although the relatively low response rate is disappointing, the final database represents a good geographic spread across the country, and within states, there is a good breakdown of urban and regional respondents.

RESULTS Demographic Profile of Respondents The demographic profile of respondents to the survey found that the sample consisted of slightly more females than males, and the age profile was slightly biased toward older people. This is consistent with the use of a sampling list. Such lists also tend to over-represent older people because they are more geographically stable, that is they move less frequently. Also, older people, particularly once retired, have more time and motivation to complete questionnaires. Over 97% of the respondents held Australian citizenship and just over 2% were either Aboriginal or Torres Strait Islanders. The sample contained a good spread of respondents from varying types of locations with almost 33% residing in capital cities, 23% in regional cities and 34% residing in country towns. The most common income group for the respondents was $52,000 - $77,999 (18%) Awareness of Australia Day The first question in the questionnaire asked respondents whether or not they were aware that the public holiday on 26th January was to celebrate Australia Day. Almost all of the respondents (99.6%) indicated that they were aware of the name of the public holiday. Following the question on awareness, was a question asking for the first words that come into mind when thinking about Australia Day. The comments were overwhelmingly positive and when coded, the results were positive (72%), negative (1%) and neutral (27%). Indicative of the positive comments were
“Proud to be an Australian” “Celebrating Australia becoming a nation” “Very privileged to live in this lucky country” “Relief, sunshine, freedom, happiness” “A day to remember things that have put us on the world map”
Neutral comments were typified by reference to the day being a holiday, or the end of the school holidays, while negative comments included the following:
“Invasion by British on indigenous Australians” “What a sad day!”
There were also comments about this being yet another holiday which appeared to be a negative because people would not be paid. The Meaning of Australia Day The next open-ended question asked respondents to “Describe what Australia Day means to you? “This section provides rich data in terms of understanding key concepts with regard to celebrating a national day. It is also interesting to obtain information in this format prior to the more structured options in Section D where the respondents were given prompts for answering the questions. In coding these responses, thirteen key themes emerged. Where multiple comments were provided by the same respondent, the first of the comments was taken as the key comment. Theme 1: Celebrating Australia and the Australian Way of Life This theme contained one of the largest number of responses and there was a range of meanings to being Australian. These included showcasing Australia to the rest of the world, being proud of the freedom and opportunities available, celebrating shared values and history and bringing the community together.
“Australia Day is the culmination of every person in Australia to hope for peace worldwide and dreams for fellow Australians. We should be united for Australia’s

future. We are so lucky to be living in such a wonderful country. We should be here for each other. Let us be a proud nation which makes for peace and order in the sight of other nations.”
Theme 2: A Time for Reflection This theme covered two main concepts – the opportunity to be able to reflect on who we are as Australians and also a time to reflect on our past and where we are going as a nation.
“A time to look back at our family and be grateful” “Reflecting on historical beginning, to admire our development in over 200 years. To consider changes to mistakes and to basically be grateful for life our lucky existence……”
The notion that Australia Day was a day for both quiet contemplation as well as celebration came through clearly. Theme 3: Acknowledging Australia’s heritage and the contribution of that people have made In this theme, the focus was on meeting with friends and family, catching up and taking time out to enjoy life.
“Being together as a family and enjoying the wonderful weather and probably having a bbq. Thinking and talking about how lucky we are to be Australian” “Gathering of the local people to celebrate and to honour others”
This theme captured the importance of actually engaging in an activity for the day by being with friends or taking part in a community activity.
“Sharing time with friends, feeling patriotic as we watch the flag raising ceremony, greeting new citizens at the Aust day ceremony socialising afterwards. Aust day is special because it is "ours"
Theme 4: The Lucky Country Many of the responses included the word ‘luck” or “lucky” and talked about Australia being the best place in which to live. Often, the notion of being “The Lucky Country” was linked to freedom, the beauty of the country, our way of life and to live in a country where there is little violence or terrorism.
“It is an opportunity to relax from working and enjoy a family day and gather with friends to appreciate how lucky we are to live in Australia. We celebrate that we are free and our children can believe they can try and be whatever they dream they can be.”
Theme 5: A Day off Work A number of respondents were either neutral in their perceptions of Australia Day in that they saw the day as merely a holiday and just another day off, or they were quite antagonistic about having a national day.
“Holiday. Generally hot weather. Breakfast in the park. Cricket” “Another holiday for the yobbos to get drunk and fight, but primarily for Australia to stand alone as a nation” “A day off without pay just like Christmas and Easter and every other public holiday, basically it sucks”
Quite a few comments were made with regard to the fact that this was a non-work, no pay, day and there was some resentment concerning this. Theme 6: Freedom The mention of freedom and being in a free country arose a large number of times.
“Freedom of choice, togetherness, acceptance, celebration of being Australian”

“Freedom, fortunate to be unique in our beliefs and characteristic ways. Proud as punch. Unique sense of humour, generosity, open-minded, Always willing to help others, community minded and any excuse for a party.”
It is interesting to note that the term ‘freedom’ is associated with being in Australia along with traditional Australian items such as meat pies and the Hills Hoist. It is as though freedom is a normal part of the Australian way of life. Theme 7: Unity There were differing views on whether Australia Day united the nation, although there were a substantial number of comments that related to the positive sharing of the day, values and the history of the country.
“It unites the whole community and gives it a shared and positive identity.” “Pride in our nation, celebrate shared values and history”
Theme 8: Diversity Words such as “diversity”, “multiculturalism”, “melting pot” and “cultures” were used to describe the cultural mix within Australia.
“The day we celebrate our heritage, lifestyle, freedom of speech, our diversity and oneness all at the same time. A day to be proud” “Celebration of a nation. Bringing together people of all countries to a melting pot and hopefully incorporating their cultures.”
Other comments, however, suggested that multiculturalism was not the appropriate way to deal with the diversity within Australia.
“Multiculturalism does not work, it divides people rather than unites them. People that come to this country need to accept the fact that this is their new home and they need to adjust and become Australian. I do not want to see flags of other countries or celebrations or symbols from other cultures on Australia day.”
Theme 9: Invasion Day A small number of respondents associated Australia Day with the displacement of the indigenous community. While some respondents did not necessarily agree with the sentiment of “Invasion Day” they acknowledged that it was a perception by many in the indigenous community
“Destruction of indigenous heritage. The Anglising of our native flora. Destruction of forests.” “….there is also a feeling of sadness that not all Australians can feel a part of Australia Day, especially Australians original inhabitants who view rightly view Australia Day as invasion day.” “Mixed emotions. Day to celebrate our Multicultural nation. Saddened that we invaded a country and have not respected the indigenous people. Imagine their thoughts on Australia day! Time to reflect.”
Theme 10: Anti-Nationalism/ Australia Day A small number of respondents were opposed to the concept of a national day as it can be associated with the rise of nationalism which was perceived as a negative concept.
“I’m ambivalent about it. Celebrating Australia achievements and unity is fine, but Nationalism is not. Also, while celebrating achievement, we should also pause to

recognise where we have gone wrong and in particular the impact of European settlement on Indigenous people.” “I have no great feelings of nationalism. To me it is just another public holiday”
In summary then, the comments in this qualitative section show very positive attitudes to Australia Day – it appeared to provide an opportunity to reflect on the “lucky country”, its diversity of people and its natural beauty. Often, however, respondents added cautionary notes, for example, the neglect of the indigenous community or those who were not sharing in the good fortunes of the country. Another section of respondents merely saw the day as a holiday or a day when they were not able to work and be paid. In Section D of the instrument, respondents were asked about the meaning of Australia Day in a closed ended format, that is, they were asked to rate the importance of 19 potential reasons for celebrating Australia Day on a 5 point scale ranging from “not at all important” (0) to “extremely important” (4). The results, which are summarised in Table 1, show that the most important reason overall was “To celebrate being Australian”, followed by celebrating the “Australian way of life”, and “our freedom”. The majority of respondents felt it was relatively less important to spend Australia Day “reflecting on past treatment of indigenous Australians” and “celebrating our sporting excellence”.
Table 1 Rating of Australia Day Meanings (0 is ‘not at all important’ and 4 is ‘extremely
important’) Item No. Meaning Mean
14 To celebrate being Australian 3.44 9 To celebrate the Australian way of life 3.25 3 To celebrate our freedom 3.23 18 To feel proud of what Australians have achieved 3.19 11 To celebrate living in the lucky country 3.13 15 To focus on the future of Australia 3.09 4 To celebrate our democracy 3.07 13 To reflect on the history of Australia 3.00 16 To celebrate people who have made a contribution to the country 2.99 2 To celebrate our independence 2.89 6 To celebrate our willingness to help others 2.82 17 To welcome new Australians 2.79 5 To celebrate our acceptance of others 2.78 12 To acknowledge the contribution of migrants to our nation 2.60 7 To celebrate being quiet achievers 2.46 1 To celebrate our cultural diversity 2.23 10 To celebrate reconciliation or the relationship between non-indigenous and indigenous
Australians 2.05
19 To celebrate our sporting excellence 1.92 8 To reflect on the past treatment of indigenous Australians 1.81
Behaviour on Australia Day The questionnaire asked respondents about the activities they undertook on Australia Day this year (2007). Table 2 shows that just over 27% attended an organised Australia Day event, and another 25% hosted their own private event with the aim of celebrating Australia Day. Therefore, more than half of this sample made an effort to spend the day celebrating Australia
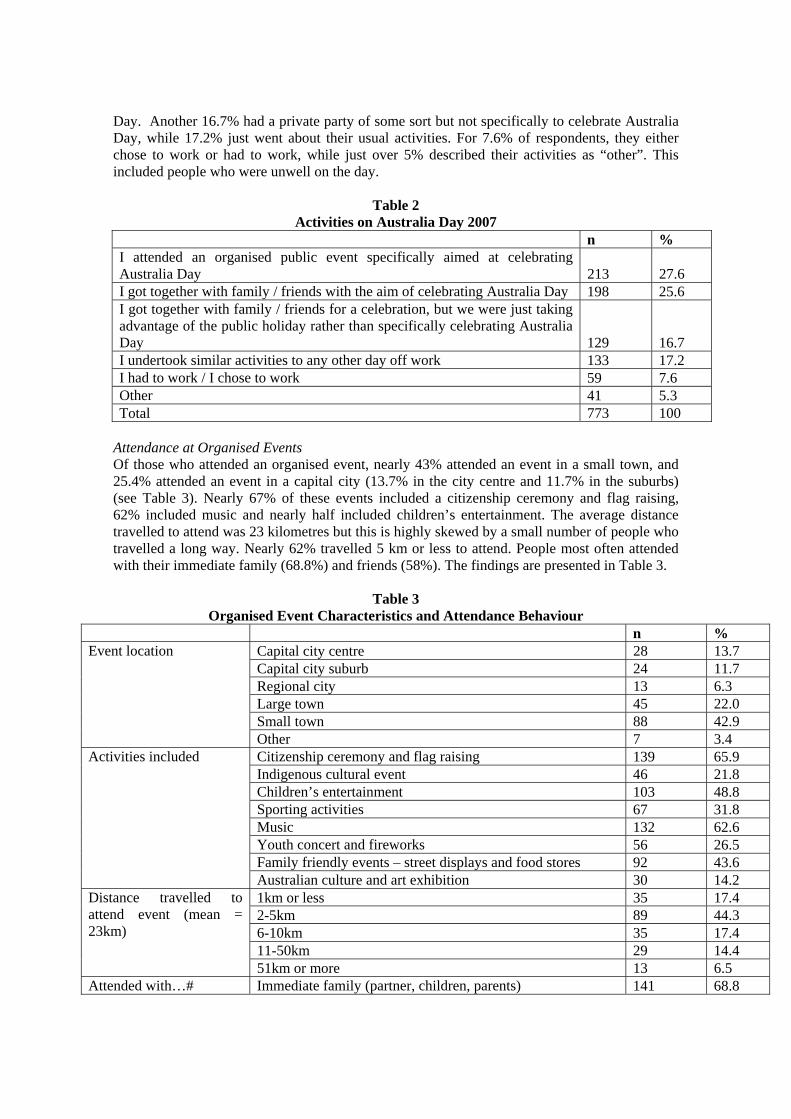
Day. Another 16.7% had a private party of some sort but not specifically to celebrate Australia Day, while 17.2% just went about their usual activities. For 7.6% of respondents, they either chose to work or had to work, while just over 5% described their activities as “other”. This included people who were unwell on the day.
Table 2 Activities on Australia Day 2007
n % I attended an organised public event specifically aimed at celebrating Australia Day 213 27.6 I got together with family / friends with the aim of celebrating Australia Day 198 25.6 I got together with family / friends for a celebration, but we were just taking advantage of the public holiday rather than specifically celebrating Australia Day 129 16.7 I undertook similar activities to any other day off work 133 17.2 I had to work / I chose to work 59 7.6 Other 41 5.3 Total 773 100
Attendance at Organised Events Of those who attended an organised event, nearly 43% attended an event in a small town, and 25.4% attended an event in a capital city (13.7% in the city centre and 11.7% in the suburbs) (see Table 3). Nearly 67% of these events included a citizenship ceremony and flag raising, 62% included music and nearly half included children’s entertainment. The average distance travelled to attend was 23 kilometres but this is highly skewed by a small number of people who travelled a long way. Nearly 62% travelled 5 km or less to attend. People most often attended with their immediate family (68.8%) and friends (58%). The findings are presented in Table 3.
Table 3 Organised Event Characteristics and Attendance Behaviour
n % Capital city centre 28 13.7 Capital city suburb 24 11.7 Regional city 13 6.3 Large town 45 22.0 Small town 88 42.9
Event location
Other 7 3.4 Citizenship ceremony and flag raising 139 65.9 Indigenous cultural event 46 21.8 Children’s entertainment 103 48.8 Sporting activities 67 31.8 Music 132 62.6 Youth concert and fireworks 56 26.5 Family friendly events – street displays and food stores 92 43.6
Activities included
Australian culture and art exhibition 30 14.2 1km or less 35 17.4 2-5km 89 44.3 6-10km 35 17.4 11-50km 29 14.4
Distance travelled to attend event (mean = 23km)
51km or more 13 6.5 Attended with…# Immediate family (partner, children, parents) 141 68.8

Extended family (aunts, uncles, cousins) 23 11.2 Friends 119 58.0
# adds to more than 100% because some respondents attended with people in more than one category Private Australia Day Events Of those who hosted or attended a private Australia Day event, the party consisted most commonly of friends (nearly 70%) and immediate family (64.2%) as seen in Table 4.
Table 4 Private Event Characteristics
n % Immediate family (partner, children, parents) 124 64.2 Extended family (aunts, uncles, cousins) 52 27.1
Celebrated with…#
Friends 134 69.8 The qualitative responses indicated a wide range of activities, mainly focussing around eating (barbeques) and drinking, playing or watching sport such as cricket or swimming The Relationship between Organised Events Attendance and Perceptions of Australia Day Analysis was undertaken to examine whether there were any statistically significant differences in perceptions of Australia Day between those who attended organised Australia Day activities and those who did not. Using independent means t-tests, statistically significant differences between those who attended organised events and those who did not were found for the following statements:
• To celebrate the Australian way of life • To celebrate our willingness to help others • To celebrate our acceptance of others • To celebrate our independence • To celebrate our freedom • To celebrate being quiet achievers • To celebrate our democracy • To celebrate our cultural diversity • To reflect on our past treatment of indigenous Australians
In each case, those respondents who attended an organised Australia Day event rated the statement more highly than those who did not attend an organised event. It was not possible in this study, however, to determine whether there was any causal relationship between attending an organised Australia Day event and having these more positive attitudes. That is, does attendance at these events influence attitudes or does having these attitudes prompt attendance at the events? Demographic Characteristics and Attendance at Organised Events Chi-Square analysis was undertaken to examine whether there were differences in the demographic profiles of those who attended organised events and those who did not. Statistically significant differences were found in relation to age, state of residence, and region of residence (capital city, regional city, country town or rural area). No statistically significant differences were found in relation to gender, Australian citizenship or social values. Those attending organised Australia Day events tended to be older, from Queensland, South Australia and Western Australia, and from a country town.
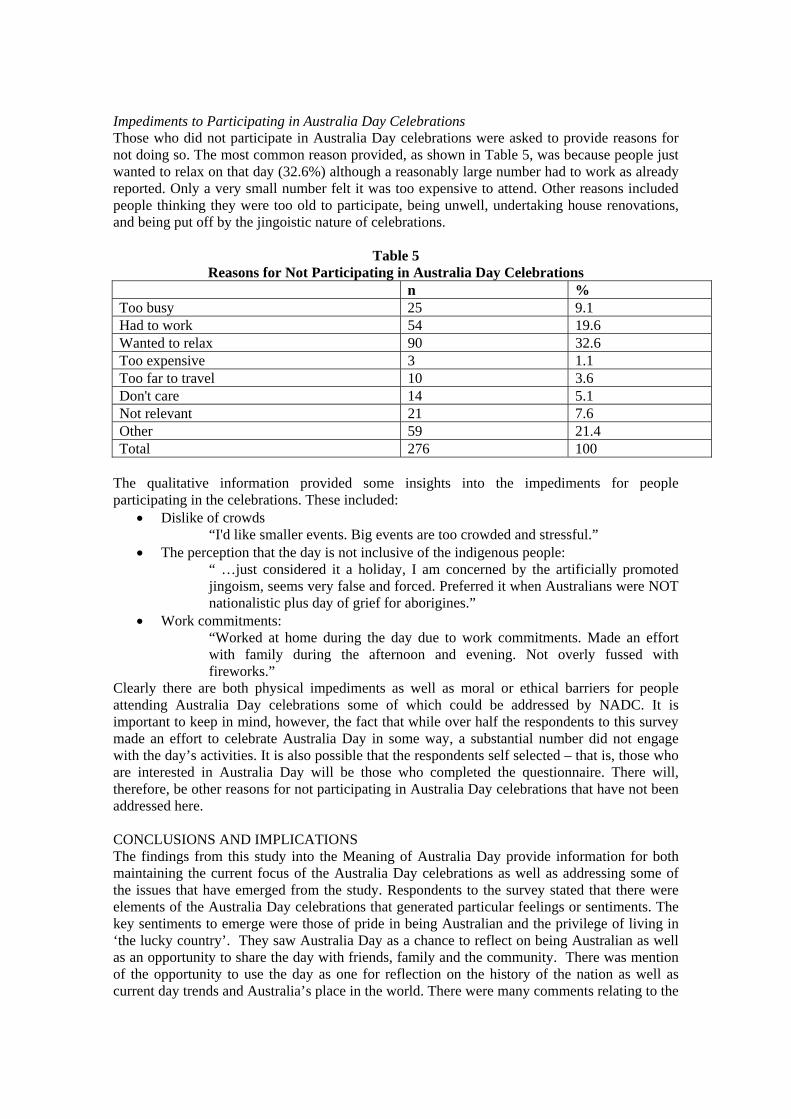
Impediments to Participating in Australia Day Celebrations Those who did not participate in Australia Day celebrations were asked to provide reasons for not doing so. The most common reason provided, as shown in Table 5, was because people just wanted to relax on that day (32.6%) although a reasonably large number had to work as already reported. Only a very small number felt it was too expensive to attend. Other reasons included people thinking they were too old to participate, being unwell, undertaking house renovations, and being put off by the jingoistic nature of celebrations.
Table 5 Reasons for Not Participating in Australia Day Celebrations
n % Too busy 25 9.1 Had to work 54 19.6 Wanted to relax 90 32.6 Too expensive 3 1.1 Too far to travel 10 3.6 Don't care 14 5.1 Not relevant 21 7.6 Other 59 21.4 Total 276 100
The qualitative information provided some insights into the impediments for people participating in the celebrations. These included:
• Dislike of crowds “I'd like smaller events. Big events are too crowded and stressful.”
• The perception that the day is not inclusive of the indigenous people: “ …just considered it a holiday, I am concerned by the artificially promoted jingoism, seems very false and forced. Preferred it when Australians were NOT nationalistic plus day of grief for aborigines.”
• Work commitments: “Worked at home during the day due to work commitments. Made an effort with family during the afternoon and evening. Not overly fussed with fireworks.”
Clearly there are both physical impediments as well as moral or ethical barriers for people attending Australia Day celebrations some of which could be addressed by NADC. It is important to keep in mind, however, the fact that while over half the respondents to this survey made an effort to celebrate Australia Day in some way, a substantial number did not engage with the day’s activities. It is also possible that the respondents self selected – that is, those who are interested in Australia Day will be those who completed the questionnaire. There will, therefore, be other reasons for not participating in Australia Day celebrations that have not been addressed here. CONCLUSIONS AND IMPLICATIONS The findings from this study into the Meaning of Australia Day provide information for both maintaining the current focus of the Australia Day celebrations as well as addressing some of the issues that have emerged from the study. Respondents to the survey stated that there were elements of the Australia Day celebrations that generated particular feelings or sentiments. The key sentiments to emerge were those of pride in being Australian and the privilege of living in ‘the lucky country’. They saw Australia Day as a chance to reflect on being Australian as well as an opportunity to share the day with friends, family and the community. There was mention of the opportunity to use the day as one for reflection on the history of the nation as well as current day trends and Australia’s place in the world. There were many comments relating to the

natural beauty of Australia as well as the freedom, resources and the people. Australia Day was seen as a day to affirm the Australian identity. What is useful to note from this study is the fact that those attending organised events had more positive attitudes towards the celebration of the nation although it could not be determined if this was a causal relationship. Such events bring people together and promote the Australian way of life. Specifically, the findings suggest that Australia Day is important in acknowledging the willingness of Australians to help each other, to accept each other, to celebrate our independence and our freedom. The findings support the focus by the National Australia Day Council on the events that now characterise the Australia Day celebrations. As White (2004: 37) concludes, in her chapter on the bicentennial celebrations of 1988,
“the contemplative piece [taken from The Age] suggested that the celebrations were not a waste of money as Australians had emerged more united than divided on issues such as multiculturalism, national identity, and Aboriginal inequality.”
So too, can the various celebrations of Australia Day be seen as a means of reinforcing Australian values and providing an important time for reflection and celebration of what it means to be Australian. REFERENCES English, J. (2006). Empire Day in Britain, 1904-1958, The Historical Journal, 49: 247-276 Fox, J. (2006). Consuming the nation: Holidays, sports, and the production of collective belong,
Ethnic and Racial Studies, 29 (2), 217-236. Fredline, E., & Faulkner, B. (2002). Residents' Reactions to the Staging of Major Motorsport
Events Within Their Communities: A Cluster Analysis. Event Management, 7(2), 103-114
Fuller, L. (2004) National Days/National Ways: Historical, Political and Religious Celebrations around the World, Praeger: London.
Grosvenor, I. (1999). ‘There’s no place like home’: education and the making of national identity, History of Education, 28 (3), 235-250.
Keogh, B. (1990). Public participation in community tourism planning. Annals of Tourism Research, 17, 449-465.
Mason P. and Cheyne J. (2000). Residents' attitudes to proposed tourism development, Annals of Tourism Research, 27, (2) 391-411
White, L. (2004) The Bicentenary of Australia: Celebration of a Nation, in L. Fuller (ed) National Days/National Ways: Historical, Political and Religious Celebrations around the World,
White, L. (2006a) ‘The Story of Australia: National Identity and the Sydney 2000 Olympic Games Opening Ceremony’ in Martin Robertson (ed.) Sporting Events and Event Tourism: Impacts, Plans and Opportunities, Leisure Studies Association, July, 121-136
White, L. (2006b) ‘From Australia’s 1988 Bicentenary to the Sydney 2000 Olympic Games: The Importance of Indigenous Issues for Event Organisers’, in Charles Arcodia, Michelle Whitford and Chantal Dickson (eds.) Global Events Congress Proceedings, University of Queensland, Brisbane, September 28-29, 370-379
Wood, E. (2005) Measuring the economic and social impacts of local authority events, International Journal of Public Sector Management, 18 (1), 37-53.

Fourth International Event Research Conference Re-evaluating the City/Town: Events as a Catalyst for Change
RESIDENTS’ PERCEPTIONS OF THE SOCIAL IMPACTS OF COMMUNITY FESTIVALS: A CLUSTER ANALYSIS
Katie Small
School of Leisure, Sport and Tourism University of Technology, Sydney
ABSTRACT This paper reports on the findings from a wider PhD study which examines residents' perceptions of the social impacts of community festivals. A survey of residents was undertaken in two communities, which each host a small community festival. Residents were clustered based on their demographic and behavioural characteristics, to identify distinct subgroups of the community who feel differently about a festival. This research examines the usefulness of demographic and behavioural segmentation of the host community rather than segmentation based on perceptions of impacts, where much previous research in the field has been conducted to date (Davis, Allen & Cosenza, 1988; Ryan & Montgomery, 1994; Madrigal, 1995; Fredline & Faulkner, 2000; Weaver & Lawton, 2001; Williams & Lawson, 2001). This research provides support for viewing communities as heterogeneous, identifying five distinct community subgroups: tolerators, economically connected, attendees, avoiders and volunteers. This research has implications for event organisers in understanding and targeting the needs and concerns of diverse community subgroups. Keywords: Community Festivals; Social Impacts, Residents’ Perceptions, Cluster Analysis
INTRODUCTION Residents’ perceptions studies are generally one of two types: ‘extrinsic’ or ‘intrinsic’ (Faulkner & Tideswell, 1997). Extrinsic studies are important in recognising the variables that affect residents’ perceptions of impacts at a community-wide level, suggesting that impacts will affect all members of the community in the same way (Fredline & Faulkner, 2000). Also useful, however, are intrinsic studies, which recognise that a host community is not homogenous, and which investigate a range of variables that help explain an individual’s perceptions of impacts (Fredline & Faulkner, 2000). As an extension of examining each individual’s perceptions of impacts, several studies go one step further and investigate whether social impacts are perceived differently by different subgroups within a community (Davis et al., 1988; Ryan & Montgomery, 1994; Madrigal, 1995; Fredline & Faulkner, 2000; Weaver & Lawton, 2001; Williams & Lawson, 2001; Fredline & Faulkner, 2002a). Such studies are typically carried out using cluster analysis techniques to identify distinct groups who hold similar perceptions or share common sets of views, which are distinguishable from the perceptions or views held by other identified groups (Kachigan, 1986; McDaniel & Gates, 2007). Cluster analysis studies segment a community into distinct groupings, explicitly recognising that respondents and their perceptions are not homogeneous. The value of such studies lies in the insight this provides for future planning and management, explicitly recognising the existence of specific subgroups within a community who may be impacted differently.

In both the wider tourism and events literatures, several studies have segmented a resident population based on their perceptions of impacts (Davis et al., 1988; Schroeder, 1992; Ryan & Montgomery, 1994; Madrigal, 1995; Fredline & Faulkner, 2000; Weaver & Lawton, 2001; Williams & Lawson, 2001; Fredline & Faulkner, 2002a; Ryan & Cooper, 2004). The clusters identified in these studies of residents' perceptions are listed in table 1 below. The first column identifies the authors of each study. In the second column, the focus of the study is identified as either a tourism or events study. The third column lists the identified clusters for each study. These results suggest that three- and five-cluster solutions are most common, and that similarities exist in the types of cluster identified. In particular, for each study, a most positive and most negative resident cluster have been identified. The most positive cluster is referred to as the ‘lovers’, ‘enthusiasts’, ‘supporters’, ‘protourism’ or ‘most positive’ cluster. These positive clusters exhibit strong positive perceptions and perceive very few negatives. They are also in support of future tourism development or the continued staging of an event. At the other extreme is the most negative cluster, referred to variably as the ‘haters’, ‘somewhat irritated’, ‘cynics’, ‘opponents’, ‘against tourism’ or ‘most negative’ cluster. These most negative clusters perceive very few positives, and hold strongly negative perceptions of impacts. These clusters tended to be against future development of tourism or the continuation of a specific event. An additional similarity between several of the studies is the identification of a neutral cluster, such as those labelled ‘in-betweeners’, ‘middle-of-the-roaders’, ‘taxpayers’ and ‘ambivalent’. In a smaller number of studies, some additional clusters were also identified. Of interest is the ‘realists’ cluster identified by Schroeder (1992), Madrigal (1995) and Fredline and Faulkner (2000). The realists hold both strong positive and strong negative perceptions of impacts. This cluster is also economically connected to, and employed in the tourism industry or by an event, which is interesting, as they have a strong recognition of negative impacts.
Table 1 Identified Clusters in Previous Residents’ Perceptions Studies
AUTHOR’S FOCUS OF STUDY IDENTIFIED CLUSTERS
Davis, Allen and Cosenza (1988) Tourism in Florida, USA.
Lovers; Love ‘em for a reason; Cautious romantics; In-betweeners; Haters
Schroeder (1992) Tourism in Flagstaff, Arizona, USA. Lovers; Realists; Haters
Ryan and Montgomery (1994) Tourism in Bakewell, UK. Enthusiasts; Middle-of-the-roaders;
Somewhat irritated
Madrigal (1995) Tourism in Sedona, USA and York, UK. Lovers; Realists; Haters
Fredline and Faulkner (2000)
The Gold Coast Indy, Queensland, Australia.
Lovers; Ambivalent supporters; Realists; Concerned for a reason; Haters
Weaver and Lawton (2001)
Tourism in Tamborine Mountain, Queensland, Australia.
Supporters; Neutrals; Opponents

Williams and Lawson (2001)
Tourism in ten New Zealand towns.
Lovers; Innocents; Taxpayers; Cynics
Fredline and Faulkner (2002a)
The Australian Formula One Grand Prix, Melbourne, and the Gold Coast Indy, Queensland, Australia.
Most positive; Moderately positive; Ambivalent; Moderately negative; Most negative
Ryan and Cooper (2004)
Tourism in Raglan, New Zealand.
Protourism; Neither for nor against tourism; Against tourism
Whilst much of the previous research into segmenting a resident population has used residents’ perceptions of impacts as a cluster base, more recent research has used other factors such as demographic and behavioural variables as a way to segment groups of residents (Inbakaran & Jackson, 2005a). A number of researchers support the use of demographic factors and behavioural characteristics as a clustering base, given the ease with which such segments are able to be identified and subsequently targeted (Mill & Morrison, 1998; Diaz-Martin, Iglesias, Vazquez & Ruiz, 2000; Inbakaran & Jackson, 2005a; Jackson & Inbakaran, 2006). Even where studies do not use demographics as their initial clustering base, most studies still examine the identified clusters on demographics, and undertake significance tests to determine the effect of demographic variables on differentiating between the clusters (Inbakaran & Jackson, 2005b). Inbakaran and Jackson (2005a) undertook a study of residents' perceptions of the impacts of tourism using a sample of residents from five tourist regions in Victoria, Australia. The study employed cluster analysis to identify key segments of the resident population, and used a combination of demographics and behavioural variables as the clustering base. Demographic variables included gender, age, education, lifecycle stage, proximity, length of residence, and ethnicity. The behavioural variables included an occupational connection to tourism, voluntary connection to tourism, and overall involvement in the tourism industry. Four clusters were identified based on these clustering variables and were labelled as ‘tourism industry connection’, ‘low tourism connection’, ‘neutral tourism development’, and ‘high tourism connection’. This research clusters residents on their demographic and behavioural characteristics in order to identify subgroups of the community who feel differently about a festival. In taking this approach, this research examines the usefulness of demographic and behavioural segmentation of the host community rather than segmentation based on perceptions of impacts, where much of the previous research in this field has been conducted to date (Davis et al., 1988; Ryan & Montgomery, 1994; Madrigal, 1995; Fredline & Faulkner, 2000; Weaver & Lawton, 2001; Williams & Lawson, 2001). METHODS Population and Sample This research employed a case study approach to examine the social impacts of community festivals using two Australian community based festivals in Western Australia (A) and Victoria (B). The festivals were chosen for their similarity in a number of characteristics including festival size, community size, number of visitors, duration, and theme. It was important that the festivals be comparable since it was the aim of this study to aggregate the responses in order to conduct the cluster analysis.

In each community, the population of interest was the local resident population. Residential households were targeted as a way of accessing individual residents. A self-administered questionnaire was mailed to local residents within each of the two communities being studied. 1,509 and 1,098 survey packets were distributed in community A and community B respectively. Within each survey packet there were two copies of the questionnaire and two reply paid envelopes. Two questionnaires were provided to allow for more than one person within each household to respond, where applicable. This measure was taken because of the relatively small numbers of people living in each of these two communities, in an effort to increase the response rate. A cross-sectional design was implemented, which gathered data from residents at one point in time following the staging of the festival. From a total of 3018 questionnaires (1509 survey packets) sent out in community A, and 2196 questionnaires (1098 survey packets) sent out in community B, 257 and 287 useable responses were received respectively. These figures represent response rates of approximately 8.5% in community A and 13% in community B. The total number of useable responses gained was 544. Instrumentation The questionnaire used in this research consists of five sections seeking both qualitative and quantitative responses designed to measure residents’ perceptions of the social impacts arising from community festivals. The questionnaire was constructed from components of several instruments. The Social Impact Perception (SIP) scale that features in section B of the questionnaire was developed in a previous study by the researcher (Small & Edwards, 2003). The other sections of the questionnaire were drawn from research in the field of event impact studies, in particular from work by Fredline (2000) and also previous research by the author (Small & Edwards, 2003). Section A asked a series of open-ended questions that sought to find out residents’ initial expectations and general perceptions regarding the social impacts of their festival. Section B asked respondents to give their opinions on 41 social impact statements using the SIP scale, which has been previously reported on (Small, Edwards & Sheridan, 2005; Small, 2006, 2007). Respondents were instructed to answer by giving their opinion on both impact occurrence (Yes, No, or Don’t Know) and the perceived level of impact on a five part directional scale ranging from negative five representing a ‘very large negative impact’, to positive five representing a ‘very large positive impact’, with zero as the midpoint representing “no impact”. Section C sought respondents’ views on a range of factors thought to affect residents’ perceptions of impacts, such as their level of involvement in tourism, their level of place attachment and level of identification with the theme of the festival. This section also accessed resident behaviours related to the festival, such as what they did on the weekend of the festival, whether they were working or volunteering during the weekend, and their feelings and levels of support for the festival. Section D asked for basic demographic and background information about the respondents. Typical demographics such as age, gender, country of residence, length of residence in region, education, employment, occupation and income were sought. Section E allowed respondents to make any additional comments about the festival and its perceived social impacts on the host community. Cluster analysis was performed on the variables in sections C and D, which served to cluster residents on their demographic and behavioural characteristics in order to identify subgroups of the community who feel differently about a festival. This is different to much of the previous research in the field that has tended to cluster residents based on their perceptions of impacts. Procedure - Cluster Analysis
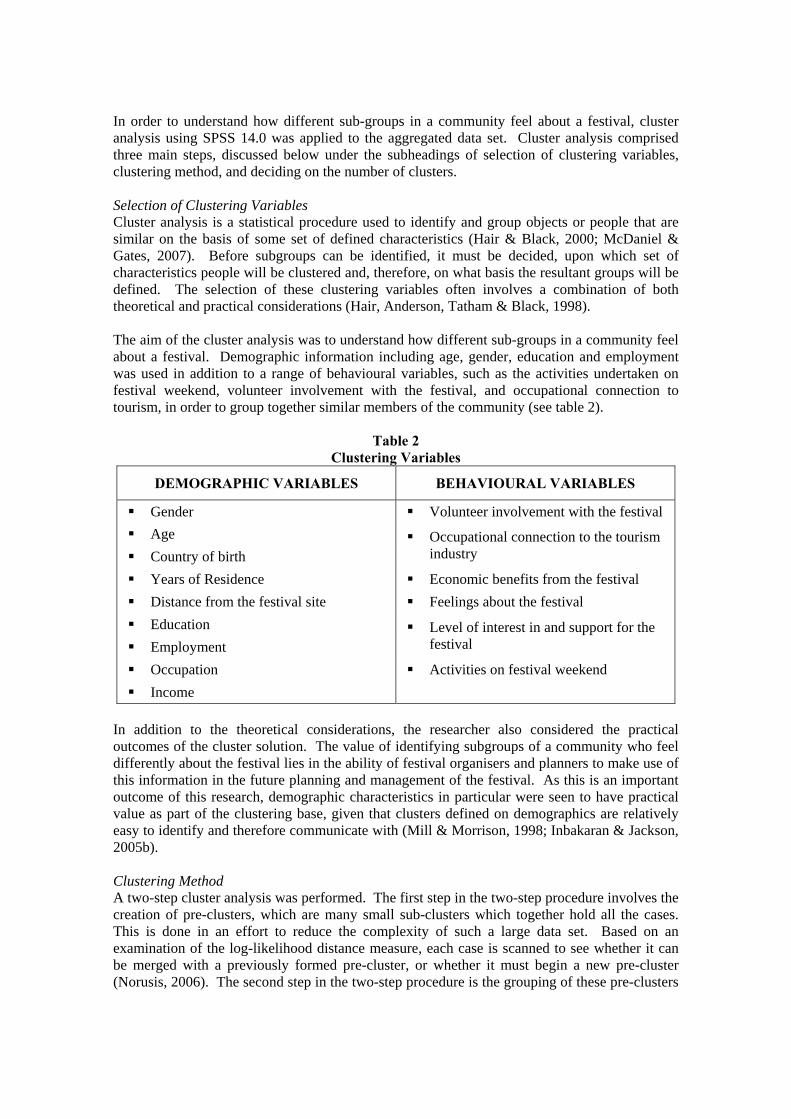
In order to understand how different sub-groups in a community feel about a festival, cluster analysis using SPSS 14.0 was applied to the aggregated data set. Cluster analysis comprised three main steps, discussed below under the subheadings of selection of clustering variables, clustering method, and deciding on the number of clusters. Selection of Clustering Variables Cluster analysis is a statistical procedure used to identify and group objects or people that are similar on the basis of some set of defined characteristics (Hair & Black, 2000; McDaniel & Gates, 2007). Before subgroups can be identified, it must be decided, upon which set of characteristics people will be clustered and, therefore, on what basis the resultant groups will be defined. The selection of these clustering variables often involves a combination of both theoretical and practical considerations (Hair, Anderson, Tatham & Black, 1998). The aim of the cluster analysis was to understand how different sub-groups in a community feel about a festival. Demographic information including age, gender, education and employment was used in addition to a range of behavioural variables, such as the activities undertaken on festival weekend, volunteer involvement with the festival, and occupational connection to tourism, in order to group together similar members of the community (see table 2).
Table 2 Clustering Variables
DEMOGRAPHIC VARIABLES BEHAVIOURAL VARIABLES
Gender Volunteer involvement with the festival Age Country of birth
Occupational connection to the tourism industry
Years of Residence Economic benefits from the festival Distance from the festival site Feelings about the festival Education Employment
Level of interest in and support for the festival
Occupation Activities on festival weekend Income
In addition to the theoretical considerations, the researcher also considered the practical outcomes of the cluster solution. The value of identifying subgroups of a community who feel differently about the festival lies in the ability of festival organisers and planners to make use of this information in the future planning and management of the festival. As this is an important outcome of this research, demographic characteristics in particular were seen to have practical value as part of the clustering base, given that clusters defined on demographics are relatively easy to identify and therefore communicate with (Mill & Morrison, 1998; Inbakaran & Jackson, 2005b). Clustering Method A two-step cluster analysis was performed. The first step in the two-step procedure involves the creation of pre-clusters, which are many small sub-clusters which together hold all the cases. This is done in an effort to reduce the complexity of such a large data set. Based on an examination of the log-likelihood distance measure, each case is scanned to see whether it can be merged with a previously formed pre-cluster, or whether it must begin a new pre-cluster (Norusis, 2006). The second step in the two-step procedure is the grouping of these pre-clusters

into the final desired number of clusters. This is done using an agglomerative hierarchical clustering method (Norusis, 2006; SPSS, 2006). “Forming clusters hierarchically lets you explore a range of solutions with different numbers of clusters” (Norusis, 2006, p. 381). The selection of the best number of clusters was done automatically by SPSS using the Bayesian Information Criterion (BIC). The best cluster solution is found at the point where the BIC is at its lowest value. This point represents the smallest change in distance between the two closest clusters in each hierarchical clustering stage (SPSS, 2006). Two-step cluster analysis was chosen because it works well with large data sets, can handle continuous and categorical variables and is able to automatically determine the number of clusters or examine a range of specified solutions (Norusis, 2006). Deciding on the Number of Clusters There are no set criteria or objective measures which determine the best cluster solution, but rather “the selection of the final cluster solution requires substantial researcher judgement” (Hair et al., 1998, p. 479). Several authors recommend that a range of cluster solutions be examined and compared prior to making a decision for the best number of clusters (Hair et al., 1998; Garson, 2004a; SPSS, 2006). Therefore, in this research, possible cluster solutions ranging from two clusters to five clusters were tested in order to determine the optimum cluster solution needed. Important in deciding on the best number of clusters, is the contribution that each variable makes to differentiating the clusters (Hair et al., 1998; Hair & Black, 2000; Norusis, 2006). A variable that does not differentiate between clusters will affect the quality and interpretability of the final result and should therefore be deleted from the analysis (Punj & Stewart, 1983). There were three variables which were initially included in the set of clustering variables but which were later deleted as they failed to significantly differentiate between the clusters. These were the three demographic variables of gender, country of birth and the distance a person lived from the festival site. Two-, three-, four- and five-cluster solutions were examined, with the five-cluster solution chosen as the most appropriate, given that it best differentiated the overall sample of respondents. This solution also gave acceptable cluster sizes, with the two largest clusters accounting for 25.8% each and the smallest accounting for 12.6%. Overall this cluster solution provided an understandable interpretation of five distinct subgroups within each community who felt differently about a festival. RESULTS Cluster analysis using a two-step method was undertaken on a range of demographic and behavioural variables, which identified five distinct subgroups within a community who differ in their feelings towards their festival: the ‘tolerators’, ‘economically connected’, ‘attendees’, ‘avoiders’ and ‘volunteers’. As 18% of the respondents (n=98) were eliminated from the cluster analysis due to missing values, the cluster analysis reflects 82% of respondents (n=446). The profiles below describe each cluster using the key clustering variables that differentiate that cluster from any other. Cluster 1, the ‘tolerators’, account for 25.8% of the sample. The tolerators are those members of a community who adopt an attitude of tolerance to a festival taking place in their community. The tolerators have a relatively low connection with the festival. Only a very small proportion of tolerators volunteered for the festival, only a small number worked in tourism, and no-one in this cluster undertook any paid work on the weekend of the festival. In fact, the largest percentage of this cluster didn’t even attend the festival. Regardless of this low connection with the festival, the tolerators are happy for it to take place in their community. This attitude can be

explained by examining the key demographic characteristics of the tolerators. They are the oldest cluster with 99.1% of its members aged over 55 years, and 83.5% of tolerators are retired. The tolerators represent the older members of a community, who although themselves are not necessarily interested in attending the festival, nor do they benefit economically from it, they do recognise that there are others in the community who enjoy and benefit from the festival, and are therefore willing to tolerate it taking place in their community. Cluster 2, the ‘economically connected’, account for 12.6% of the sample. The distinguishing feature which sets this cluster apart from the others is that its members are those who worked in tourism and who undertook paid work on the weekend of the festival. Whilst a significant proportion of this cluster also attended the festival, most of this cluster were working over the festival weekend. It was on the basis of these key characteristics that this cluster has been labelled as ‘economically connected’. Distinguishing demographic features of this cluster relate to employment, occupation and length of residence in the community. Almost half of this cluster are self employed and a sizeable proportion are employed in service industry occupations. Residents in this cluster represented the extremes of length of residence, with significant proportions new to the community, but also a sizeable group who had lived in the community for 41 years or more. Cluster 3, the ‘attendees’, account for 25.8% of the sample. This cluster is made up of those residents who attended the festival. Ninety-three percent of attendees show an interest in the theme and are happy that the festival takes place. The large majority of attendees love the festival and hope that it continues. However, outside of their attendance, this cluster has the lowest connection to tourism and the festival. The attendees consist of the smallest percentage of people who volunteer for the festival and the smallest percentage of people working in tourism. Also important in distinguishing this from other clusters are the demographic characteristics of the attendees. Demographically distinct from all other clusters, the attendees represent the youngest cluster, and that which earned the highest incomes. The majority of this cluster were in full-time employment, with a significant number of self-employed persons. Cluster 4, the ‘avoiders’, account for 17.5% of the sample. This cluster consists of residents who adopt an attitude of avoidance towards the festival. They do this by not attending the festival, staying away from town during the festival or leaving town for the weekend. Of all the clusters, the avoiders consist of the largest percentage of people who dislike the festival and would be happier if it didn’t continue, even though the majority of avoiders are interested in the theme. It is therefore the festival as a whole, rather than the theme itself, with which they are unhappy. The avoiders have a low volunteer and tourism employment connection to the festival. None of the avoiders undertook any paid work on the weekend of the festival, and therefore have no direct economic benefits to be gained. Key demographic characteristics which differentiate this cluster from the others are the occupation and annual household income of cluster members. The avoiders represent a mix of occupations including professional, managerial/administration, clerical and trade work. In terms of income, the avoiders were the cluster that was least likely to provide their level of income. Most people in this cluster preferred not to reveal their income, which may indicate that members of this cluster earned either quite low or quite high incomes. From those who did respond, the largest group earned less than $20,000 annually. The avoiders are made up of older residents of a community, the majority aged between 55-64 and 65-74. They are also, in large part, the long-term residents who have lived in their community for over 41 years. Cluster 5, the ‘volunteers’, account for 18.4% of the sample. Everyone in this cluster volunteered for the festival at some point either before, during or after the festival, with 91.6% having volunteer involvement during the festival weekend. The remainder of volunteers either attended the festival or were working. The majority of volunteers love the festival and hope that

it continues, while a smaller proportion tolerate the festival because of the wider benefits it brings to the community. No-one in this cluster disliked the festival or stayed away from the area, and everyone was happy for it to take place in their community. This cluster also showed a strong interest in the theme. Demographically, this cluster is distinct from the others in that it has the widest age range, with members ranging from 35-64. The volunteers cluster also has the highest level of TAFE education and a mix of full-time and part-time employment. DISCUSSION Given the level of subjectivity and researcher judgement in deciding on the number of clusters, it is particularly important that the final cluster solution be validated. In order to validate the five-cluster solution, separate cluster analyses were run on the community A and community B data sets. The same set of clustering variables was used in a two-step cluster analysis on each sample. It was found that a five-cluster solution was most appropriate in both communities. The profiles of the five clusters were very similar to those that were identified in the cluster analysis on the aggregated data set, which confirmed the acceptability of the aggregated approach. Although the resultant cluster profiles were very similar, the size of the clusters and the order in which they appeared differed slightly in each community. A chi-square test was therefore used to investigate whether this relationship between cluster membership and community is significant. That is, does cluster membership differ significantly with respect to the community in which respondents live? The results of the chi-square test reveal significant differences in cluster membership by community, as shown in table 3 below. Significant differences can be observed regarding the order in which the clusters appeared in each community. Community A has the greatest number of attendees (n = 65), followed closely by volunteers (n = 56). There are then equal numbers of economically connected and avoiders (n = 33), and the smallest number, tolerators (n = 29). Community B shows quite a different pattern, with the greatest number of tolerators (n = 86), followed by attendees (n = 50), avoiders (n = 45) and smaller numbers of volunteers (n = 26) and residents who are economically connected to the festival (n = 23).
Table 3 Cluster Membership by Community
Tolerators Economically
Connected Attendees Avoiders Volunteers Total
Community A 29 33 65 33 56 216
Community B 86 23 50 45 26 230
Total 115 56 115 78 82 446 χ² = 44.420, df = 4, p = .000 These results suggest that in Community A, more residents seem to be choosing to actively participate in the festival as either attendees or volunteers. The smallest number of residents in Community A are those who simply tolerate the festival taking place in their community. This is quite different to the pattern in Community B, in which the largest proportion of residents are those who simply tolerate the festival taking place in their community. Less people in Community B choose to be actively involved as attendees, and even less as volunteers for the festival. These findings suggest that the festival in Community A achieves greater rates of active community participation than does the festival held in Community B. Cluster Comparisons

Similarities can be drawn between the five clusters identified in this study and those proposed by Inbakaran and Jackson (2005a) in their study of residents' perceptions of the impacts of tourism in five tourist regions in Victoria, Australia. The economically connected cluster has similarities with Inbakaran and Jackson’s (2005a) ‘tourism industry connection’ cluster, which consists of those residents with the highest occupational connection to the tourism industry. The volunteers cluster is similar to the ‘high tourism connection’ cluster identified by Inbakaran and Jackson (2005a), which is made up of residents who exhibit the highest volunteer connection with the tourism industry. Similar to the tolerators cluster that has a relatively low connection with the festival, is Inbakaran and Jackson’s (2005a) ‘neutral tourism development’ cluster. This cluster has the lowest overall connection to tourism in either volunteer or occupational terms. Finally, the avoiders cluster is similar to Inbakaran and Jackson’s (2005a) ‘low tourism connection’ cluster. In the same way as the avoiders have a relatively low connection with the festival and are quite negative towards it, the ‘low tourism connection’ cluster also exhibits low volunteer and occupational connections to the tourism industry, in conjunction with negative attitudes. There exists no match between the attendees cluster identified in this research and any of Inbakaran and Jackson’s (2005a) four clusters. The attendees cluster is specifically related to people’s participation in a community festival, and therefore has no direct parallel in a study of residents' perceptions of tourism more generally. CONCLUSIONS AND IMPLICATIONS This research provides support for viewing communities as heterogeneous, identifying five distinct community subgroups: tolerators, economically connected, attendees, avoiders and volunteers. Each of these represents a subgroup of the population who expresses a particular feeling towards the festival, different from that expressed by any other subgroup. This research represents a move away from traditional cluster analysis studies which segment a resident population based on their perceptions of impacts. In doing so, this research contributes to the existing literature on community segmentation studies, by supporting the use of a combination of demographics and behavioural characteristics as the basis on which members of a host community can be segmented. Demographic characteristics are seen to have practical value as part of the clustering base, given that clusters defined on demographics are relatively easy to identify and therefore, towards whom targeted actions can be directed. Clusters that are defined on their perceptions of impacts are commonly profiled as a positive, negative or neutral cluster. This is not a profile from which these subgroups of the community can be easily identified. In comparison, by grouping clusters on demographics, the resultant clusters are profiled using more easily recognisable characteristics such as age and gender, allowing easier identification of these subgroups within the community. Therefore, the findings from this research not only advance theory in the events field, but have practical implications for event organisers in understanding and targeting the needs and concerns of diverse community subgroups. It is recommended that future segmentation studies in the events field adopt a similar clustering approach, using a combination of demographics and behavioural characteristics, in order to test whether similar clusters are identified in other communities and in relation to events of a different size and theme. Also, a longitudinal perspective would allow for changes in community subgroups to be charted over time. Would these subgroups themselves, or maybe their size, change over time, as successive festivals are held in the host community? A follow-up paper will present the findings of an examination of the perceptions held by each of the five clusters, regarding the social impacts of their festival. This research has been undertaken and has found that the five clusters do hold differing perceptions of social impacts.

REFERENCES Davis, D., Allen, J. & Cosenza, R. M. (1988). Segmenting local residents by their attitudes,
interests and opinions toward tourism. Journal of Travel Research, 27(2), 2-8. Diaz-Martin, A. M., Iglesias, V., Vazquez, R. & Ruiz, A. V. (2000). The use of quality
expectations to segment a service market. Journal of Services Marketing, 14(2), 132-146.
Fredline, E. & Faulkner, B. (2000). Host community reactions: a cluster analysis. Annals of Tourism Research, 27(3), 763-784.
Fredline, E. & Faulkner, B. (2002a). Residents' reactions to the staging of major motorsport events within their communities: a cluster analysis. Event Management, 7, 103-114.
Garson, D. (2004a). Syllabus for PA 765: quantitative research in public administration - cluster analysis. Retrieved September 22, 2006, from http://www2.chass.ncsu.edu/garson/PA765/cluster.htm
Hair, J. F., Anderson, R. E., Tatham, R. L. & Black, W. C. (1998). Multivariate data analysis (5th ed.). New Jersey: Prentice Hall.
Hair, J. F. & Black, W. C. (2000). Cluster analysis. In L. G. Grimm & P. R. Yarnold (Eds.), Reading and understanding more multivariate statistics (pp. 147-205). Washington, DC: American Psychological Association.
Inbakaran, R. & Jackson, M. (2005a). Marketing regional tourism: how better to target and address community attitudes to tourism. Journal of Vacation Marketing, 11(4), 323-339.
Inbakaran, R. & Jackson, M. (2005b). Understanding resort visitors through segmentation. Tourism and Hospitality Research, 6(1), 53-71.
Jackson, M. S. & Inbakaran, R. J. (2006). Evaluating residents' attitudes and intentions to act towards tourism development in regional Victoria, Australia. International Journal of Tourism Research, 8, 355-366.
Kachigan, S. K. (1986). Statistical analysis: an interdisciplinary introduction to univariate and multivariate methods. New York: Radius Press.
Madrigal, R. (1995). Residents' perceptions and the role of government. Annals of Tourism Research, 22(1), 86-102.
McDaniel, C. & Gates, R. (2007). Marketing research (7th ed.). USA: John Wiley and Sons. Mill, R. C. & Morrison, A. M. (1998). The tourism system: an introductory text (3rd ed.). Iowa,
USA: Kendall/Hunt Publishing Company. Norusis, M. J. (2006). SPSS statistics guides. Retrieved October 5, 2006, from
http://www.norusis.com/pdf/SPC_v13.pdf Punj, G. & Stewart, D. W. (1983). Cluster analysis in marketing research: review and
suggestions for application. Journal of Marketing Research, 20, 134-148. Ryan, C. & Cooper, C. (2004). Residents' perceptions of tourism development: the case of
Raglan, New Zealand. Tourism Review International, 8, 1-15. Ryan, C. & Montgomery, D. (1994). The attitudes of Bakewell residents to tourism and issues
in community responsive tourism. Tourism Management, 15(5), 358-369. Schroeder, T. (1992). Host community perceptions of tourism's impacts: a cluster analysis.
Visions in Leisure and Business, 10(4), 43-48. Small, K. (2006). Application of factor analysis in the development of the social impact
perception (SIP) scale. In G. B. O’Mahony & P. A. Whitelaw (Eds.), CAUTHE 2006 “to the city and beyond…”. Proceedings of the 16th Annual CAUTHE Conference (pp. 595-606). Melbourne: Victoria University.
Small, K. (2007). Social dimensions of community festivals: an application of factor analysis in the development of the Social Impact Perception (SIP) scale. Event Management, 11(1), (forthcoming).
Small, K. & Edwards, D. (2003). Evaluating the socio-cultural impacts of a festival on a host community: a case study of the Australian Festival of the Book. In T. Griffin & R. Harris (Eds.), Proceedings of the 9th Annual Conference of the Asia Pacific Tourism

Association (pp. 580-593). Sydney: School of Leisure, Sport and Tourism, University of Technology, Sydney.
Small, K., Edwards, D. & Sheridan, L. (2005). A flexible framework for evaluating the socio-cultural impacts of a small festival. International Journal of Event Management Research, 1(1), 66-77.
SPSS. (2006). SPSS: data analysis. Retrieved November 5, 2006, from http://www.spss.com/spss/data_analysis.htm
Weaver, D. B. & Lawton, L. J. (2001). Resident perceptions in the urban-rural fringe. Annals of Tourism Research, 28(2), 439-458.
Williams, J. & Lawson, R. (2001). Community issues and residents opinions of tourism. Annals of Tourism Research, 28(2), 269-290.

Fourth International Event Research Conference Re-evaluating the City/Town: Events as a Catalyst for Change
ANZAC DAY AT GALLIPOLI: THE EVENT, THE CONSUMER AND THE FUTURE
V. John Basarin Deakin University
John Hall Deakin Business School, Deakin University
ABSTRACT Anzac Day is a day of national significance in Australia as are its commemorations at Gallipoli. This study examines key factors relating to attendance at Gallipoli, including motivation, satisfaction, logistics, event characteristics, experiential components and demographics. This paper focuses on events surrounding Anzac Day commemorations at Gallipoli. The paper uses a case study approach to provide insights from research, of an observational nature as well as data collected in both qualitative and quantitative formats at Anzac Day commemorations at Gallipoli in 2007. It uses the framework developed by Getz (2000) and Chaplin and Costa (2000), to asses this event and provide insights and suggestions on how this event could be developed and improved upon, this framework includes reference to the type of event and program, physical setting, the purpose of the commemoration, the cultural significance, the political implications of the event, impact and performance evaluation of the event, the target markets for the event, the economic significance and educational significance. Due to the limited data available at this stage, the conclusions drawn are indicative only. Key Words: Anzac Day at Gallipoli, Event Management, Consumer Behaviour
INTRODUCTION There are two days are of national significance to Australians. Australia Day is celebrated on January 26 honouring the establishment of the first permanent European settlement on the continent. The second day of national significance is Anzac Day. Anzac Day, the 25th of April is a national day of commemoration in Australia (and also New Zealand). Anzac Day is not unlike other countries’ days of national significance, such as the French Bastille Day on July 14, or Independence Day in the United States, the annual celebration of nationhood held on the Fourth of July. These are days which symbolise emancipation, independence and the coming of a nation (Hede and Hall 2006). On Anzac Day, the 25th of April, many thousands of people travel to Gallipoli, Turkey, mostly Australians and New Zealanders but also increasingly Turks, to attend the Dawn Service at Anzac Cove. Anzac Day has been consistently used as a vehicle to promote various manifestations of Australian nationalism. Anzac Day can also be regarded as a day of homage characterised by solemn respectfulness. To others it is a time for celebration characterised by more frivolous activities such as parties and dance (Hede and Hall 2006).
The acronym Anzac stands for Australian and New Zealander Army Corps. In Australia, Anzac Day commemorates the loss of Australians at war and particularly of those on the Gallipoli Peninsula, or Anzac Cove, in Turkey, in 1915. While thousands of soldiers from many nations (for example, 21,200 British, 10,000 French, 8,700 Australians, 2,700 New Zealanders, 1,350 Indians and 87,000 Turkish), died on the Gallipoli Peninsula, however the importance of

Australia’s involvement is seen by many as integral in the development of Australia’s national identity as the following quotes highlight:
“Anzac Day now belongs to the past and during the war all energy was concentrated on the future but the influence of the Gallipoli Campaign upon the national life of Australia and New Zealand has been far too deep to fade… it was on the 25th of April 1915 that the consciousness of nationhood was born” (Bean 1924, p. 910, in Anon. 2005)
“Ninety Years today young Australians and New Zealanders landed on these shores…They could not have known they would leave such a lasting legacy of hope for the generations which followed.” [John Howard, Prime Minister of Australia, April 25 2005] There is a dearth of research that has been undertaken within the context of the business discipline on Anzac Day. The business discipline can offer new knowledge about Anzac Day using different frames of references to other disciplines, such as history, anthropology or political science, that have generally studied Anzac Day and related phenomena. Research on event management indicates that the integrity and the authenticity of events can be compromised when they grow in an accelerated manner. This is exemplified within the context of Anzac Day events. While the resurgence of interest in attending Anzac Day events is heartening for many, it is creating a raft of problems with regard to event management, such as crowd safety and control, site management and event logistics. These issues are compounded as Anzac Day events are confronted with the challenges of accommodating changes in perceptions of how the day’s events should be managed, and changes in the demographic and psychographic profile of Australians. This study advances knowledge of Anzac Day events as it utilises marketing, consumer behaviour and tourism theories and event management models to contribute to a more holistic understanding of the role of Anzac Day commemorative services at Gallipoli for Australians. With a greater understanding of factors relating to attendance and satisfaction those that are planning Anzac Day commemorative events can more insightfully consider the impact of the experience of consumption on Australians, and those involved in the provision of tourism and hospitality can best meet the needs of attendees. This is particularly relevant in light of the fact that Anzac Day now exists in a multicultural and diverse society, and that it is approaching its centenary in 2015. METHODS The paper uses a case study approach to provide insights from research, of an observational nature as well as data collected in both qualitative and quantitative formats at Anzac Day commemorations at Gallipoli in 2007. The framework adapted from Getz (2000) and Chaplin & Costa (2000) includes reference to the type of event and program, physical setting, the purpose of the commemoration, the cultural significance, the political implications of the event, impact and performance evaluation of the event, the target markets for the event, the economic significance and educational significance. These were incorporated in to the surveys prepared for delivery to Australian visitors going to and returning from Anzac Cove for the dawn ceremony. DISCUSSION If attendance numbers are a measure of success, this service would be considered to be most successful. However the Dawn Service at Anzac Cove has fuelled a continuing national debate about the future of the Dawn Service at Anzac Cove; stakeholders, such as politicians, social commentators, historians, the Returned Services League (RSL) and the War Widows, have voiced their varying opinions on this issue. In Australia the composition of nationalities has

become more diverse, acculturation processes that affect the way in which immigrants perceive their ethnic identities, relinquish some aspects of their previous culture in exchange for new cultural paradigms in their host country needs to be considered with regard to the future meaning of Anzac day. Since the 1950’s, tour groups have been organised to travel to Turkey to commemorate Anzac Day. In 2005 a record crowd of around 20,000 people travelled to Turkey to attend the important 90th Dawn Service at Anzac Cove. In 2007, the numbers were estimated to be around 10,000 many more than expected by the authorities. While many attendees of the Dawn Services at Anzac Cove appear to be focused on the solemnity of the day other groups of attendees are emerging. The ‘backpacker’ set making its way through Europe, including New Zealanders on their ‘Overseas Experience’, or OE as it is colloquially known, have began to feature strongly in the crowds at the services, in the images and the reports of the services. This set of attendees seem to contrast with the more traditional groups of attendees that have attended the services in Gallipoli in the past, members of the Armed Forces, RSL or parliamentary dignitaries, for example. While the younger attendees at the services in Turkey appear to be initially focused on celebration, rather than commemoration, reports in the newspapers and other anecdotal evidence, including the author’s observations at four dawn ceremonies indicate that, on the day, they are subsumed by the solemnity of the day. CONCLUSIONS AND IMPLICATIONS The limited survey results, qualitative insights and observation available at the time of writing of this paper preclude conclusive outcomes at this stage. However, even with the exploratory nature of the study a number of valuable insights have been obtained:
1. With respect to event management, the participants were generally happy with the facilities provided at Gallipoli, including toilet amenities, the amount of queuing required for facilities, rubbish collection/ management, availability of food & drinks, crowd control, access to the site and security.
2. With respect to travel arrangements, there were a large percentage of unsatisfied attendees; in particular lengthy waiting for a bus from the Lone Pine Cemetery scored high levels of dissatisfaction.
3. The Anzac Cove ceremony and in particular the Lone Pine ceremony were marked as excellent events by the participants.
4. The coldness of the night was of a particular concern to attendees who were probably not fully informed about the weather and the discomfort it could cause.
5. The participants agreed that the ceremonies should be solemn occasions but entertainment whilst awaiting the ceremony was seen as desirable. The expectation for the entertainment would include Australian traditional and Turkish music.
REFERENCES Chaplin, I and Costa, C.M.M. (2000), Milestone or Millstone? Commemorating the Portuguese
Handover of Macau - Implications for Event Management, Events Beyond 2000: Setting the Agenda, Proceedings of Conference on Event Evaluation, Research and Education, Sydney, July 2000.
Getz, D. (2000), Defining the Field of Event Management. Event Management, An International Journal, p. 1-3

Hede A.M. and Hall E. J. (2006), Evoking nationalism through tourism and consumer emotion: an exploratory study of a visit to the Gallipoli Peninsula for the commemoration of Anzac Day. Paper presented at the AM2006 Academy of Marketing Conference, London.
ACKNOWLEDGMENTS The authors wish to thank the following for their assistance with this project. The authors gratefully acknowledge the survey form distribution and collection support provided in Turkey by Messrs Usta, Cenk and many travel guides of Fez Travel, Mr Basak of Turkland and last but not the least, Mr Yuksel of Hatko for providing support for duplication, handling and freight of survey forms.


![A. Refereed SCI Journal Papers (corresponding author*) list-CWLuo.pdf · A. Refereed SCI Journal Papers (corresponding author*) [2016] 1. Phuoc Huu Le, Chih Wei Luo, Sheng-Rui Jian*,](https://static.fdocuments.net/doc/165x107/60a2f3e06e21795b144354d4/a-refereed-sci-journal-papers-corresponding-author-list-cwluopdf-a-refereed.jpg)
