Reduction in paediatric burn admissions over 25 - Injury Prevention
6
Injury Prevention 1997; 3: 104 -109 Reduction in paediatric burn admissions over 25 years, 1970-94 C Streeton, T Nolan Abstract Objective-To describe trends in burn admissions to a large paediatric burn centre, between 1970 and 1994. Methods-Hospital records of the Royal Children's Hospital burns unit were au- dited for the years 1970-94 (n=4992), statewide hospital admissions identified from the Victorian Inpatient Minimum Database for the period, 1987-94 (n=3353), and Victorian burn deaths ascertained from the Australian Bureau of Statistics (n=163), 1970-94. Results-Between 1970 and 1994 there was a 66% reduction in the annual number of burn admissions to the Royal Children's Hospital, a similar reduction across the state, from 52.4 (95% confidence interval (CI): 48 to 57)/100 000 in 1987 to 34.5 (95% CI:31 to 38)/100 000 in 1994 (p < 0.05), and over a 40% fall in the mortality rate. Reductions occurred for all types of burns: scalds 60%; flame burns 55%; and contact burns 70%, but at -differing time periods corresponding to the introduction of product legislation, education programs, or changes in heat- ing practices. There was no decline in beverage related scalds. The proportion of children admitted with severe burns in- creased over the 25 year period, probably reflecting changes in referral practice, while the average length of hospital stay steadily declined, independent of burn type or burn severity. Conclusions-We believe these reductions reflect the effects of mandatory changes in sleepwear standards and regulations, modifications in heating practices, legis- lated improvements in the safety of house- hold products, and to a lesser extent the effect of burn education prevention cam- paigns in the media, especially those directed towards hot water burn injuries among younger children. (Injury Prevention 1997; 3: 104 - 109) Keywords: bum injury; trends. Burn injuries are an important cause of paediatric morbidity. In a study conducted by Nolan and Penny (1992), burns represented approximately 5% of emergency department injury presentations in children aged 0- 14 years in Victoria. During the same period, the hospital admission rate for burns and scalds was 165/100 000 children aged 0- 14 years.' Evidence from studies in North America and Asia indicate that the burn rates in children have fallen steadily over the past decade.2 3 Although the general epidemiologic patterns of burn injuries among children are known, large scale studies of burn trends have not been conducted. In Victoria, substantial lifestyle, environ- mental, and regulatory health care changes are factors that may have had an effect on childhood burns. These include changes in indoor heating devices, the introduction of clothing regulations and standards, and more recently the introduction of smoke detectors. These factors have not been evaluated, nor have the trends in Victorian hospital burn admissions been previously documented. The aim of this study was to provide a review of the epidemiology of burn injuries that result in hospitalisation to the Royal Children's Hospi- tal in Victorian children aged 0 to 14 between 1970 through to 1994. Subjects and methods Detailed hospital records of primary burn admissions to the Royal Children's Hospital burns unit were audited for the years 1970 through to 1994. Patients included in the study (n=4992) were aged 0- 14 years. Information about patient age and sex; severity of burn (anatomic site, per cent of total body surface area (TBSA) burned, skin grafting and out- come); length of hospitalisation; management of the burn injury, circumstances of the incident, including date and place of occur- rence; type of injury (see Appendix 1) (scald, flame, contact, electrical, chemical, radiation, friction, or flash burns); and ignition sources (for example hot beverages, house fire, match, etc) were collected from the medical records where possible. In the literature, three different categories are used to define severe burns: those in which more than 10% of TBSA is affected; the anatomic site affected (for example head, neck, face); and the burn depth (that is superficial, partial, or full thickness).4 The latter was not available. Burn categories as defined in the Interna- tional Classification of Diseases (ICD-9) were coded for comparative purposes.5 To reduce the amount of variability, where appropriate we analysed the data in three year average periods. The criteria for hospitalisation of a burns patient to the Royal Children's Hospital burns unit have remained little unchanged during the 25 year period (E Julian Keogh, personal communication).6 We analysed statewide burn hospital admis- sions of children aged 0- 14 years identified from the Victorian Inpatient Minimum Data- base (VIMD) for the period, 1987-94 (n=3353). The VIMD is a statewide hospital morbidity data collection (ICD-9-DM).5 See Clinical Epidemio- logy and Bio- statistics, Royal Children's Hospital and University of Melbourne, Depart- ment of Health and Community Services, Victoria, Australia C Streeton Clinical Epidemio- logy and Biostatistics Unit, Royal Children's Hospital and University of Melbourne, Depart- ment of Paediatrics, Melbourne, Victoria, Australia T Nolan Correspondence to: Professor T Nolan, Clinical Epidemiology and Biostatistics Unit, Royal Children's Hospital, Parkville, Victoria 3052, Australia. 104 on 24 November 2018 by guest. Protected by copyright. http://injuryprevention.bmj.com/ Inj Prev: first published as 10.1136/ip.3.2.104 on 1 June 1997. Downloaded from
Transcript of Reduction in paediatric burn admissions over 25 - Injury Prevention

Injury Prevention 1997; 3: 104-109
Reduction in paediatric burn admissions over 25years, 1970-94
C Streeton, T Nolan
AbstractObjective-To describe trends in burnadmissions to a large paediatric burncentre, between 1970 and 1994.
Methods-Hospital records of the RoyalChildren's Hospital burns unit were au-dited for the years 1970-94 (n=4992),statewide hospital admissions identifiedfrom the Victorian Inpatient MinimumDatabase for the period, 1987-94 (n=3353),and Victorian burn deaths ascertainedfrom the Australian Bureau of Statistics(n=163), 1970-94.
Results-Between 1970 and 1994 there wasa 66% reduction in the annual number ofburn admissions to the Royal Children'sHospital, a similar reduction across thestate, from 52.4 (95% confidence interval(CI): 48 to 57)/100 000 in 1987 to 34.5(95% CI:31 to 38)/100 000 in 1994(p < 0.05), and over a 40% fall in themortality rate. Reductions occurred forall types ofburns: scalds 60%; flame burns55%; and contact burns 70%, but at-differing time periods corresponding tothe introduction of product legislation,education programs, or changes in heat-ing practices. There was no decline inbeverage related scalds. The proportion ofchildren admitted with severe burns in-creased over the 25 year period, probablyreflecting changes in referral practice,while the average length of hospital staysteadily declined, independent of burntype or burn severity.Conclusions-We believe these reductionsreflect the effects ofmandatory changes insleepwear standards and regulations,modifications in heating practices, legis-lated improvements in the safety ofhouse-hold products, and to a lesser extent theeffect of burn education prevention cam-paigns in the media, especially thosedirected towards hot water burn injuriesamong younger children.(Injury Prevention 1997; 3: 104 - 109)
Keywords: bum injury; trends.
Burn injuries are an important cause ofpaediatric morbidity. In a study conducted byNolan and Penny (1992), burns representedapproximately 5% of emergency departmentinjury presentations in children aged 0- 14years in Victoria. During the same period, thehospital admission rate for burns and scaldswas 165/100 000 children aged 0- 14 years.'
Evidence from studies in North Americaand Asia indicate that the burn rates inchildren have fallen steadily over the past
decade.2 3 Although the general epidemiologicpatterns of burn injuries among children areknown, large scale studies of burn trends havenot been conducted.
In Victoria, substantial lifestyle, environ-mental, and regulatory health care changesare factors that may have had an effect onchildhood burns. These include changes inindoor heating devices, the introduction ofclothing regulations and standards, and morerecently the introduction of smoke detectors.These factors have not been evaluated, norhave the trends in Victorian hospital burnadmissions been previously documented. Theaim of this study was to provide a review of theepidemiology of burn injuries that result inhospitalisation to the Royal Children's Hospi-tal in Victorian children aged 0 to 14 between1970 through to 1994.
Subjects and methodsDetailed hospital records of primary burnadmissions to the Royal Children's Hospitalburns unit were audited for the years 1970through to 1994. Patients included in the study(n=4992) were aged 0- 14 years. Informationabout patient age and sex; severity of burn(anatomic site, per cent of total body surfacearea (TBSA) burned, skin grafting and out-come); length of hospitalisation; managementof the burn injury, circumstances of theincident, including date and place of occur-rence; type of injury (see Appendix 1) (scald,flame, contact, electrical, chemical, radiation,friction, or flash burns); and ignition sources(for example hot beverages, house fire, match,etc) were collected from the medical recordswhere possible.
In the literature, three different categoriesare used to define severe burns: those in whichmore than 10% of TBSA is affected; theanatomic site affected (for example head, neck,face); and the burn depth (that is superficial,partial, or full thickness).4 The latter was notavailable.Burn categories as defined in the Interna-
tional Classification of Diseases (ICD-9) werecoded for comparative purposes.5 To reducethe amount of variability, where appropriate weanalysed the data in three year average periods.The criteria for hospitalisation of a burns
patient to the Royal Children's Hospital burnsunit have remained little unchanged during the25 year period (E Julian Keogh, personalcommunication).6We analysed statewide burn hospital admis-
sions of children aged 0- 14 years identifiedfrom the Victorian Inpatient Minimum Data-base (VIMD) for the period, 1987-94(n=3353). The VIMD is a statewide hospitalmorbidity data collection (ICD-9-DM).5 See
Clinical Epidemio-logy and Bio-statistics, RoyalChildren's Hospitaland University ofMelbourne, Depart-ment of Health andCommunityServices, Victoria,AustraliaC Streeton
Clinical Epidemio-logy and BiostatisticsUnit, RoyalChildren's Hospitaland University ofMelbourne, Depart-ment of Paediatrics,Melbourne, Victoria,AustraliaT Nolan
Correspondence to:Professor T Nolan,Clinical Epidemiology andBiostatistics Unit, RoyalChildren's Hospital,Parkville, Victoria 3052,Australia.
104
on 24 Novem
ber 2018 by guest. Protected by copyright.
http://injuryprevention.bmj.com
/Inj P
rev: first published as 10.1136/ip.3.2.104 on 1 June 1997. Dow
nloaded from
Reduction in paediatric burn admissions over 25 years, 1970-94
Appendix 2 for ICD-9 CM codes used in thestudy.We also analysed statewide burn mortality
figures of children aged 0- 14 years (n= 163).Case numbers of deaths due to fire and flame(E890-E899) and by hot substances (E924) forVictoria (by state of registration), were ob-tained from the Australian Bureau of Statistics(ABS) for the period, 1970-94.
Victorian population figures were also ob-tained from the ABS by sex and age from 1971to 1994 and used to calculate both age specifichospitalisation rates for the years 1987 to 1994and age specific mortality rates for the years1970-94.7-
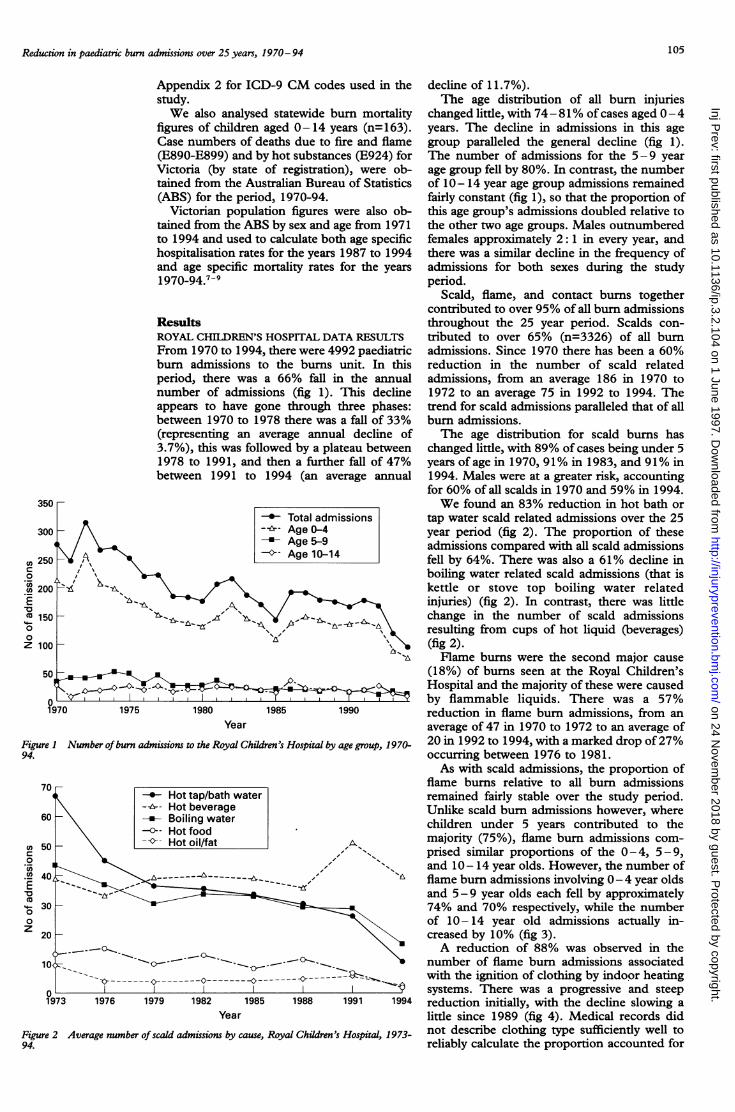
ResultsROYAL CHILDREN'S HOSPITAL DATA RESULTSFrom 1970 to 1994, there were 4992 paediatricbum admissions to the burns unit. In thisperiod, there was a 66% fall in the annualnumber of admissions (fig 1). This declineappears to have gone through three phases:between 1970 to 1978 there was a fall of 33%(representing an average annual decline of3.7%), this was followed by a plateau between1978 to 1991, and then a further fall of 47%between 1991 to 1994 (an average annual
1970 1975 1980 1985 1990Year
Figure I Number of burn admissions to the Royal Children's Hospital by age group, 1970-94.
o
0
Co
00
z
decline of 11.7%).The age distribution of all burn injuries
changed little, with 74- 81% of cases aged 0- 4years. The decline in admissions in this agegroup paralleled the general decline (fig 1).The number of admissions for the 5-9 yearage group fell by 80%. In contrast, the numberof 10- 14 year age group admissions remainedfairly constant (fig 1), so that the proportion ofthis age group's admissions doubled relative tothe other two age groups. Males outnumberedfemales approximately 2: 1 in every year, andthere was a similar decline in the frequency ofadmissions for both sexes during the studyperiod.
Scald, flame, and contact burns togethercontributed to over 95% of all burn admissionsthroughout the 25 year period. Scalds con-tributed to over 65% (n=3326) of all burnadmissions. Since 1970 there has been a 60%reduction in the number of scald relatedadmissions, from an average 186 in 1970 to1972 to an average 75 in 1992 to 1994. Thetrend for scald admissions paralleled that of allburn admissions.The age distribution for scald burns has
changed little, with 89% of cases being under 5years of age in 1970, 91% in 1983, and 91% in1994. Males were at a greater risk, accountingfor 60% of all scalds in 1970 and 59% in 1994.We found an 83% reduction in hot bath or
tap water scald related admissions over the 25year period (fig 2). The proportion of theseadmissions compared with all scald admissionsfell by 64%. There was also a 61% decline inboiling water related scald admissions (that iskettle or stove top boiling water relatedinjuries) (fig 2). In contrast, there was littlechange in the number of scald admissionsresulting from cups of hot liquid (beverages)(fig 2).Flame burns were the second major cause
(18%) of burns seen at the Royal Children'sHospital and the majority of these were causedby flammable liquids. There was a 57%reduction in flame burn admissions, from anaverage of 47 in 1970 to 1972 to an average of20 in 1992 to 1994, with a marked drop of27%occurring between 1976 to 1981.As with scald admissions, the proportion of
flame burns relative to all burn admissionsremained fairly stable over the study period.Unlike scald burn admissions however, wherechildren under 5 years contributed to themajority (75%), flame burn admissions com-prised similar proportions of the 0-4, 5-9,and 10 - 14 year olds. However, the number offlame burn admissions involving 0- 4 year oldsand 5-9 year olds each fell by approximately74% and 70% respectively, while the numberof 10- 14 year old admissions actually in-creased by 10% (fig 3).A reduction of 88% was observed in the
number of flame burn admissions associatedwith the ignition of clothing by indoor heatingsystems. There was a progressive and steepreduction initially, with the decline slowing alittle since 1989 (fig 4). Medical records didnot describe clothing type sufficiently well toreliably calculate the proportion accounted for
350
Xn Z;u0
oT 200EX 15000Z 100l
0P
Year
Figure 2 Average number of scald admissions by cause, Royal Children's Hospital, 1973-94.
105
on 24 Novem
ber 2018 by guest. Protected by copyright.
http://injuryprevention.bmj.com
/Inj P
rev: first published as 10.1136/ip.3.2.104 on 1 June 1997. Dow
nloaded from

Streeton, Nolan
by sleepwear. House fires contributed only 4%of flame burn admissions in 1973-5, 10% in1988-90, and 5% in 1993-4.
Year
Figure 3 Average number offlame burn admissions to the Royal Children's Hospital by agegroup, 1970-94.
Indoor open flame/fire heating systemSmall flame source, for example matchFlammable liquidsOpen outdoor fireOpen flame of stove or barbeque
As with the substantial reductions in scaldand flame burn admissions, there was also aconsiderable reduction in contact burn admis-sions. These fell by 70%, from an average of 30admissions in 1970-2, to an average of nineadmissions in 1993-4. There was a progressivereduction since 1970, with 50% occurringbetween 1970 to 1978.The major source of contact burns were
electric bar radiators or glass fronted heaters.In 1970, there were 17 bar radiator or heaterassociated contact bum admissions. In 1994there were only two, a fall of 88%. Throughoutthe 25 year period, the 0-4 year age groupwere most at risk of a contact burn admission,whether male or female.
Radiation, chemical, friction, and flashburns contributed only 5% of all admissions.It is notable that there were only 23 burninjuries resulting from firecrackers, all of whichoccurred before 1982, the year all fireworkavailability to the public was banned.
Despite all these encouraging trends, theproportion of children admitted with severeburns has increased over the 25 year period. In1970, 25% of burn admissions to the RoyalChildren's Hospital had 10% or more TBSAburned compared with 45% in 1994. Anato-mical site was also used as a marker of severity:in 1970, the head, face, and/or neck wereinvolved in at least 20% of all burn hospitalisa-tions, increasing to 26% in 1994. Flame burnswere the major contributor to the rise in theproportion ofsevere burn and accounted for 25(93%) of the 27 deaths during the studyperiod.
While the proportion of burned childrenadmitted with severe burns has increased, theaverage length of hospital stay has steadilydeclined from an average 16 days in the early1970s to an average of seven days in the mid-1990s, independent of burn type or severity.
VIMD RESULTS74-8 1979-83 1984-8 1989-91 1992-4 Between 1987 and 1994, 3353 children aged
Year were identified from the VIMD as being
4 Average number ofignited clothingflame burn admissions to the Royal Children's hospitalised with a scald, flame, contact, orWa by source of ignition, 1974-94. chemical burn injury in Victoria. There was a
substantial reduction (31%) in the number ofburn admissions across the state (average
Doo- annual decline of 3.8%) (fig 5). Boys under 550 _ ~*years had the highest incidence of burn
DOadmissions. There was an excess of boys inevery age group.
50 The average burn admission rate for theA--- RCH admissions eight year period dropped by 33% (p <0.05)
(table 1) during which time the Royal Chil-50 - dren's Hospital admitted a fairly constant 35%Do . share of all burn hospitalisations (fig 5). The50 admission rate was three times greater for
children aged 0 - 4 but decreased (30%)Do - ~~~~t parallel with the total, constituting almost50 80% of the toal group hospitalised (n=2570).
I A similar trend was observed at the Royal1987 1988 1989 1990 1991 1992 1993 1994 Children's Hospital. Of particular interest was
Year the drop of nearly 52% in the 5-9 year ageS Victrian State bur admissions (VIC), children aged 0-14 _years, relateid t group (p<0.05) (table 1). There was noidmitted to the Royal Children's Hospital (RCIV, 1987-94. (Note different scale of significant change in the incidence of burnste compared with fig 1.) for the older age group despite a small drop in
25
cn
0Cocncn
.Eo
00z
CoCA0._4
._LECo00z
FigureHospit
Figurethose aordinal
106
5C
4E
4Cmr_ 3E0(O 3C
.LaE 2Em
0" 2C0z 1 E
1 c
E
on 24 Novem
ber 2018 by guest. Protected by copyright.
http://injuryprevention.bmj.com
/Inj P
rev: first published as 10.1136/ip.3.2.104 on 1 June 1997. Dow
nloaded from
Reduction in paediatric burn admissions over 25 years, 1970- 94
- 14.0
12.0tn
4- 10.0'a)
%O. 8.0Z0
.0
0
6.0
c 4.04)cmco 2.0
(D
<0.0I
_
_-
_
_
_
_
---_-
I____I
1970-4 1975-9 1980-4 1985-9 1990-4
1.0
0:9w.09 I.^0.7 t c
0.6 =i
0.5 Q~o
0.4 =O
0.3: °
0.2 O'
0 a)CuL
0.1 Q
<
Year
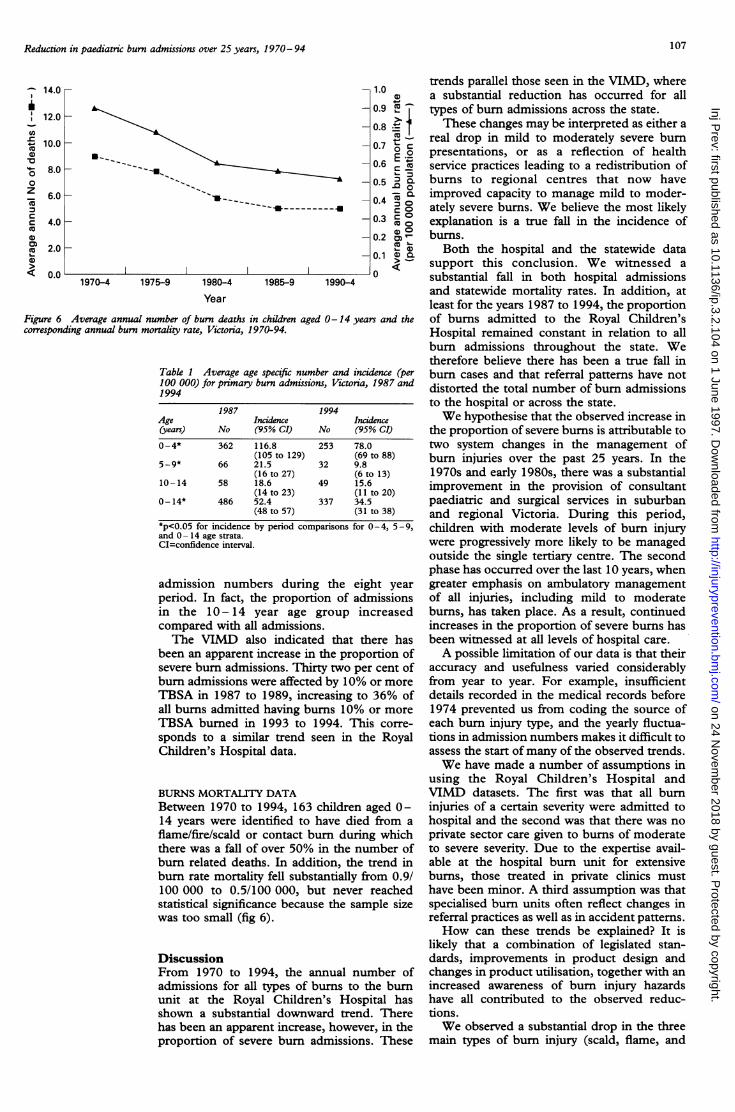
Figure 6 Average annual number of burn deaths in children aged 0-14 years and thecorresponding annual burn mortality rate, Victoria, 1970-94.
Table 1 Average age specific number and incidence (per100 000) for primary burn admissions, Victoria, 1987 and1994
1987 1994Age Incidence Incidence(years) No (95% CI) No (95% CI)
0-4* 362 116.8 253 78.0(105 to 129) (69 to 88)
5-9* 66 21.5 32 9.8(16 to 27) (6 to 13)
10-14 58 18.6 49 15.6(14 to 23) (11 to 20)
0- 14* 486 52.4 337 34.5(48 to 57) (31 to 38)
*p<0.05 for incidence by period comparisons for 0-4, 5-9,and 0- 14 age strata.CI=confidence interval.
admission numbers during the eight yearperiod. In fact, the proportion of admissionsin the 10- 14 year age group increasedcompared with all admissions.The VIMD also indicated that there has
been an apparent increase in the proportion ofsevere burn admissions. Thirty two per cent ofburn admissions were affected by 10% or moreTBSA in 1987 to 1989, increasing to 36% ofall burns admitted having bums 10% or moreTBSA burned in 1993 to 1994. This corre-sponds to a similar trend seen in the RoyalChildren's Hospital data.
BURNS MORTALITY DATABetween 1970 to 1994, 163 children aged 0-14 years were identified to have died from aflame/fire/scald or contact burn during whichthere was a fall of over 50% in the number ofburn related deaths. In addition, the trend inburn rate mortality fell substantially from 0.9/100 000 to 0.5/100 000, but never reachedstatistical significance because the sample sizewas too small (fig 6).
DiscussionFrom 1970 to 1994, the annual number ofadmissions for all types of burns to the burnunit at the Royal Children's Hospital hasshown a substantial downward trend. Therehas been an apparent increase, however, in theproportion of severe burn admissions. These
trends parallel those seen in the VIMD, wherea substantial reduction has occurred for alltypes of burn admissions across the state.These changes may be interpreted as either a
real drop in mild to moderately severe burnpresentations, or as a reflection of healthservice practices leading to a redistribution ofburns to regional centres that now haveimproved capacity to manage mild to moder-ately severe burns. We believe the most likelyexplanation is a true fall in the incidence ofburns.
Both the hospital and the statewide datasupport this conclusion. We witnessed asubstantial fall in both hospital admissionsand statewide mortality rates. In addition, atleast for the years 1987 to 1994, the proportionof burns admitted to the Royal Children'sHospital remained constant in relation to allburn admissions throughout the state. Wetherefore believe there has been a true fall inburn cases and that referral patterns have notdistorted the total number of burn admissionsto the hospital or across the state.We hypothesise that the observed increase in
the proportion of severe burns is attributable totwo system changes in the management ofburn injuries over the past 25 years. In the1970s and early 1980s, there was a substantialimprovement in the provision of consultantpaediatric and surgical services in suburbanand regional Victoria. During this period,children with moderate levels of burn injurywere progressively more likely to be managedoutside the single tertiary centre. The secondphase has occurred over the last 10 years, whengreater emphasis on ambulatory managementof all injuries, including mild to moderateburns, has taken place. As a result, continuedincreases in the proportion of severe bums hasbeen witnessed at all levels of hospital care.A possible limitation of our data is that their
accuracy and usefulness varied considerablyfrom year to year. For example, insufficientdetails recorded in the medical records before1974 prevented us from coding the source ofeach burn injury type, and the yearly fluctua-tions in admission numbers makes it difficult toassess the start ofmany of the observed trends.We have made a number of assumptions in
using the Royal Children's Hospital andVIMD datasets. The first was that all burninjuries of a certain severity were admitted tohospital and the second was that there was noprivate sector care given to burns of moderateto severe severity. Due to the expertise avail-able at the hospital burn unit for extensiveburns, those treated in private clinics musthave been minor. A third assumption was thatspecialised burn units often reflect changes inreferral practices as well as in accident patterns.How can these trends be explained? It is
likely that a combination of legislated stan-dards, improvements in product design andchanges in product utilisation, together with anincreased awareness of burn injury hazardshave all contributed to the observed reduc-tions.We observed a substantial drop in the three
main types of bum injury (scald, flame, and
107
on 24 Novem
ber 2018 by guest. Protected by copyright.
http://injuryprevention.bmj.com
/Inj P
rev: first published as 10.1136/ip.3.2.104 on 1 June 1997. Dow
nloaded from
Streeton, Nolan
Table 2 Key interventions and product safety standards (1970- 94)
Key intervention or introduced fire safety standard
Flammability safety standards for children's nightwearSafe design practice for children's nightclothes,AS-CL3
Care labelling standard of clothingChildren's nightclothes having reduced fire hazard,AS 1249-1983
Care labelling standard of clothing, AS 1989-1984
Product safety Banning of firecrackersBanning of fireworks
Domestic heatingsystems
Tap water
Household safety
Approval and test specifications for electric room heaters,AS-C103
Introduction of central heatingConventional 'single room heating' phased out and
superseded by central heatingInternational oil crisis: severely limited the availability of
kerosene and increased the cost of oil1990s economic recession forced builders to offer
central heating as a standard heating source
Production of thermostatic tempering valveChildproof bath hot water tap shieldsManual of authorisation procedures for plumbing and
drainage products, includes the requirement ofthermostatic tempering valve installation
The Australian and New Zealand Burn Associationrecommendation of hot water heaters be set at 55°C
Introduction of the Australian National PlumbingCode AS3500: maximum allowable delivery temperatureof hot water to sanitary fittings not exceed 50°C and43°C
Care labelling standard of household textiles, furnishings,upholstered furniture, bedding, piece goods and yarn,AS 1957-1976
Portable fire extinguishers safety standardsDomestic smoke detectors: legislation now enforced
for mandatory installation in all new homes as part ofthe Victorian Building Code Practices
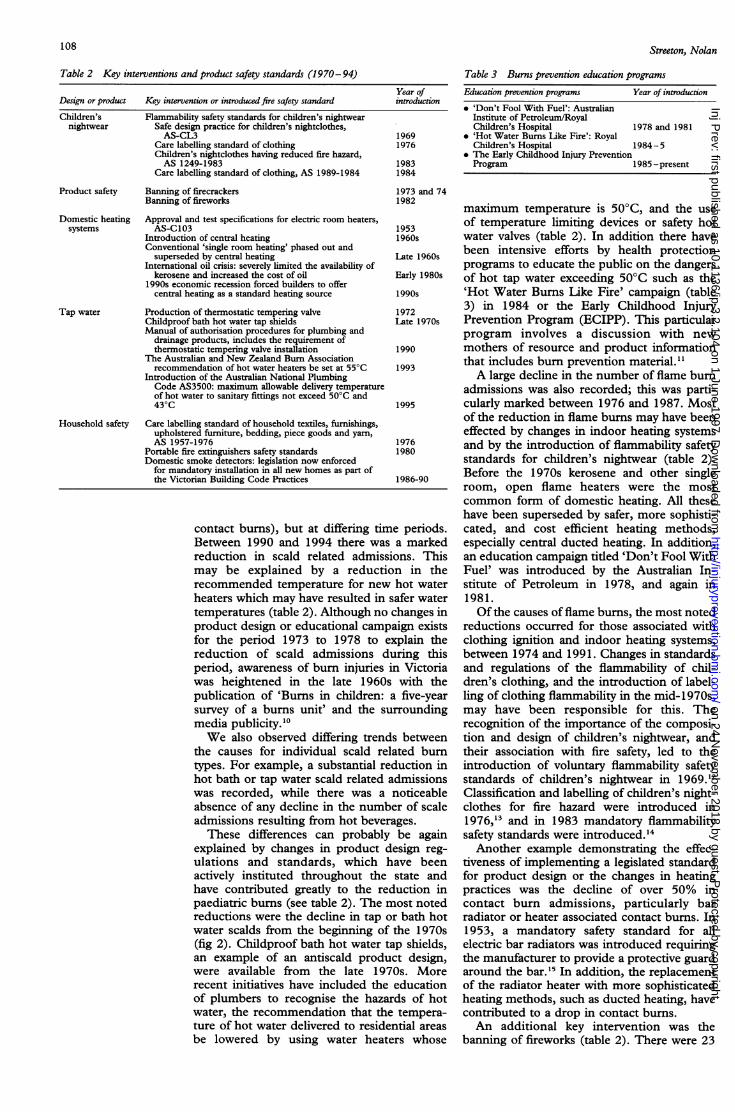
contact burns), but at differing timBetween 1990 and 1994 there was
reduction in scald related admissimay be explained by a reducticrecommended temperature for newheaters which may have resulted in ;
temperatures (table 2). Although noproduct design or educational campfor the period 1973 to 1978 to e
reduction of scald admissions diperiod, awareness of burn injuries iwas heightened in the late 1 960spublication of 'Burns in children:survey of a burns unit' and the sumedia publicity."1We also observed differing trend
the causes for individual scald reltypes. For example, a substantial re
hot bath or tap water scald related a
was recorded, while there was a
absence of any decline in the numbadmissions resulting from hot beverThese differences can probably
explained by changes in product dulations and standards, which k
actively instituted throughout thehave contributed greatly to the rec
paediatric burns (see table 2). The nreductions were the decline in tap c
water scalds from the beginning of(fig 2). Childproof bath hot water t:an example of an antiscald produwere available from the late 197recent initiatives have included theof plumbers to recognise the hazaiwater, the recommendation that theture of hot water delivered to residebe lowered by using water heatt
Year ofintroduction
19691976
19831984
Table 3 Burns prevention education programsEducation prevention programs Year of introduction
* 'Don't Fool With Fuel': AustralianInstitute of Petroleum/RoyalChildren's Hospital 1978 and 1981
* 'Hot Water Bums Like Fire': RoyalChildren's Hospital 1984-5
* The Early Childhood Injury PreventionProgram 1985 -present
1973 and 741982
maximum temperature is 50°C, and the use
1953 of temperature limiting devices or safety hot1960s water valves (table 2). In addition there haveLate 1960s been intensive efforts by health protection
programs to educate the public on the dangersEarly 1980s of hot tap water exceeding 50°C such as the1990s 'Hot Water Burns Like Fire' campaign (table1972 3) in 1984 or the Early Childhood InjuryLate 1970s Prevention Program (ECIPP). This particular
program involves a discussion with new
1990 mothers of resource and product information1993 that includes burn prevention material."
A large decline in the number of flame burnadmissions was also recorded; this was parti-
1995 cularly marked between 1976 and 1987. Mostof the reduction in flame burns may have beeneffected by changes in indoor heating systems
1976and by the introduction of flammability safety
1980
standards for children's nightwear (table 2).1986-90 Before the 1970s kerosene and other single
room, open flame heaters were the mostcommon form of domestic heating. All thesehave been superseded by safer, more sophisti-
le periods. cated, and cost efficient heating methods,a marked especially central ducted heating. In addition,
ions. This an education campaign titled 'Don't Fool Withon in the Fuel' was introduced by the Australian In-hot water stitute of Petroleum in 1978, and again in
safer water 1981.changes in Ofthe causes of flame burns, the most notedoaign exists reductions occurred for those associated withxplain the clothing ignition and indoor heating systems,uring this between 1974 and 1991. Changes in standardsin Victoria and regulations of the flammability of chil-with the dren's clothing, and the introduction of label-
a five-year ling of clothing flammability in the mid-1970s,irrounding may have been responsible for this. The
recognition of the importance of the composi-Is between tion and design of children's nightwear, andlated burn their association with fire safety, led to theduction in introduction of voluntary flammability safetyadmissions standards of children's nightwear in 1969.12noticeable Classification and labelling of children's night-er of scale clothes for fire hazard were introduced inages. 1976,'3 and in 1983 mandatory flammabilitybe again safety standards were introduced.'4
lesign reg- Another example demonstrating the effec-iave been tiveness of implementing a legislated standardstate and for product design or the changes in heatingduction in practices was the decline of over 50% innost noted contact burn admissions, particularly barir bath hot radiator or heater associated contact burns. Inthe 1970s 1953, a mandatory safety standard for allap shields, electric bar radiators was introduced requiringict design, the manufacturer to provide a protective guard7Os. More around the bar.'5 In addition, the replacementeducation of the radiator heater with more sophisticatedrds of hot heating methods, such as ducted heating, havetempera- contributed to a drop in contact burns.
ntial areas An additional key intervention was theers whose banning of fireworks (table 2). There were 23
108
Design or product
Children'snightwear
on 24 Novem
ber 2018 by guest. Protected by copyright.
http://injuryprevention.bmj.com
/Inj P
rev: first published as 10.1136/ip.3.2.104 on 1 June 1997. Dow
nloaded from

Reduction in paediatric burn admissions over 25 years, 1970-94
firecracker related burn admissions between1970 to 1981. Burn injuries from firecrackersdisappeared following their prohibition in1982.A reduction in house fire related burns was
also noted. Factors that may have contributedto this include: the introduction of standardsregarding the flammability of fabric for house-hold textiles in 1976&6 (and legislated in 1990),the move away from open flame heatingsystems, and the improvement in the electricalwiring of housing. In 1986, changes in theVictorian Building Codes required that all newhomes have smoke detectors installed.
ConclusionIn summary, we have witmessed a substantialdecline in burn admissions and an appreciablefall for burns of specific causes. These trendsare most likely to be attributable to mandatorychanges in sleepwear standards and regula-tions, modifications in heating practices, to-gether with changes in household productsafety design. It may also reflect to a lesserextent the success of specific intensive publicburn education prevention campaigns, espe-cially those directed towards hot water andflame burns among younger children. Never-theless, scalds, especially from hot beverages,and flame burns remain the most importantcauses of burn injuries.
We gratefully acknowledge E Julian Keogh, Director, BurnsCentre, Royal Children's Hospital, who generously allowed usto assess the Burns Centre's medical records and provided uswith much helpful advice. We thank Ebony Hankinson, BeaGieinsa, and Janice Grothe for their assistance in preparing thedata. We also thank Tim O'Brien (Brivis Pty Ltd) for supplyinginformation regarding the history of central heating develop-ment in Australia.
1 Nolan T, Penny M. Epidemiology of non-intentional injuriesin an Australian urban region: results from injurysurveillance. J Paediatr Child Health 1992; 28: 27 - 35.
2 Ngim RCK. Epidemiology of burns in Singapore children-an 11 year study of 2288 patients. Ann Acad Med 1992;21: 667-71.
3 Snelling CFT, Germann ET. Trends in hospital care ofburns in Canada. J Trauma 1992; 33: 258-65.
4 van Rijn OJL, Bouter LM, Meertens RM. The aetiology ofburns in developed countries: review of the literature.Burns 1989; 15: 217.
5 World Health Organisation. International dassification ofdiseases, 9th revision, dinical modification, (ICD-9-CM).Vol 1: diseases tabular list. Ann Arbor, Michigan: EdwardBrothers Inc, 1991.
6 Keogh EJ, Judson RJ, Masterton JP. Protocolfor the triage andearly management of patients with burn injury in Victoia.Parkville, Victoria: Victorian Medical Postgraduate Foun-dation, 1994.
7 Australian Bureau of Statistics. Estimated age distribution ofthepopulations ofAustralia, States and Territories, June 1971 -June 1976. Canberra: Commonwealth Government Prin-ter, 1971. (Catalogue No. 3201.0.)
8 Australian Bureau of Statistics. Projections of the population ofthe States and Territories of Australia 1978 to 2011.
Canberra: Commonwealth Government Printer, 1979.(Catalogue No. 3214.0.)
9 Australian Bureau of Statistics. Projections ofthe populations ofAustralia States and Territories 1989 to 2031. Canberra:Commonwealth Government Printer, 1990. (CatalogueNo. 3222.0.)
10 Biggs JSG, Clarke AM. Burns in children: a five-year surveyof a burns unit. Med 7Aust 1964; i: 787-92.
11 Horton-James L. Taking on injury-the Early ChildhoodInjury Prevention Program. Australian Journal of EarlyChildhood 1992; 17(3): 30-3.
12 Standards Association of Australia. Safe design practice forchildren's nightclothes, AS-CL3. Australian StandardsHouse, 80 Arthur Street, North Sydney: StandardsAssociation of Australia, 1969.
13 Standards Association ofAustralia. Classification and labellingofchildren's nightclothes forfire hazard, AS 1989. AustralianStandards House, 80 Arthur Street, North Sydney:Standards Association of Australia, 1976.
14 Standards Association of Australia. Children's nightclotheshaving reducedfire hazard, AS 1249. Australian StandardsHouse, 80 Arthur Street, North Sydney: StandardsAssociation of Australia, 1983.
15 Standards Association of Australia. Approval and testspecifications for electric room heaters, AS-C103. AustralianStandards House, 80 Arthur Street, North Sydney:Standards Association of Australia, 1953.
16 Standards Association of Australia. Care labelling of clothing,household textiles, furnishings, upholstered furniture, bedding,piece goods and yarns, AS 1957. Australian StandardsHouse, 80 Arthur Street, North Sydney: StandardsAssociation of Australia, 1976.
Appendix 1 Definitions used for each of thedifferent burn types
BURN TYPE DEFINITIONS USED IN STUDY
Scald
Flame
Contact
Electrical
Chemical
Radiation
Flash
Friction
Burn sustained from hot liquids such ashot water and steam, hot fats, oils, andfoodsBurn sustained from direct contact withan open flame or fireBurn sustained from direct contact witha hot objectBurn sustained from direct contact withan electrical contact. May occur as aresult of an electrical malfunction orshort circuit. Burns caused by contactwith an electrical heating element, forexample a bar radiator, are not classifiedas 'electrical' bums but as 'contact' bumsBum sustained from direct contact withchemicalsBurn sustained from exposure toradiation: solar energy, infraredradiation, or electromagnetic ionisingradiationBum sustained from exposure to theenergy produced by explosive materialBum sustained from the rapid movementof a surface against the skin
Appendix 2
ICD-9 E codes (extemal cause of injury), used for thisstudy were E890.0-899.9, E924.0, E924.8, andE924.9.5 The coded group of E923, E925, and E926(accidents caused by explosive material, electric current,and exposure to radiation) were not included since notall injuries coded in these categories are burns.5 Alsoexcluded were radiation and electrical bums.
109
on 24 Novem
ber 2018 by guest. Protected by copyright.
http://injuryprevention.bmj.com
/Inj P
rev: first published as 10.1136/ip.3.2.104 on 1 June 1997. Dow
nloaded from