Reducing Non-urgent Utilization Of The Emergency ...
230
University of Central Florida University of Central Florida STARS STARS Electronic Theses and Dissertations, 2004-2019 2005 Reducing Non-urgent Utilization Of The Emergency Department Reducing Non-urgent Utilization Of The Emergency Department By Self-pay Patients: Analysis Of The Impact Of A Community- By Self-pay Patients: Analysis Of The Impact Of A Community- wide Provider Network wide Provider Network Karen Karen van Caulil University of Central Florida Part of the Public Affairs, Public Policy and Public Administration Commons Find similar works at: https://stars.library.ucf.edu/etd University of Central Florida Libraries http://library.ucf.edu This Doctoral Dissertation (Open Access) is brought to you for free and open access by STARS. It has been accepted for inclusion in Electronic Theses and Dissertations, 2004-2019 by an authorized administrator of STARS. For more information, please contact [email protected]. STARS Citation STARS Citation van Caulil, Karen Karen, "Reducing Non-urgent Utilization Of The Emergency Department By Self-pay Patients: Analysis Of The Impact Of A Community-wide Provider Network" (2005). Electronic Theses and Dissertations, 2004-2019. 408. https://stars.library.ucf.edu/etd/408
Transcript of Reducing Non-urgent Utilization Of The Emergency ...
University of Central Florida University of Central Florida
STARS STARS
Electronic Theses and Dissertations, 2004-2019
2005
Reducing Non-urgent Utilization Of The Emergency Department Reducing Non-urgent Utilization Of The Emergency Department
By Self-pay Patients: Analysis Of The Impact Of A Community-By Self-pay Patients: Analysis Of The Impact Of A Community-
wide Provider Network wide Provider Network
Karen Karen van Caulil University of Central Florida
Part of the Public Affairs, Public Policy and Public Administration Commons
Find similar works at: https://stars.library.ucf.edu/etd
University of Central Florida Libraries http://library.ucf.edu
This Doctoral Dissertation (Open Access) is brought to you for free and open access by STARS. It has been accepted
for inclusion in Electronic Theses and Dissertations, 2004-2019 by an authorized administrator of STARS. For more
information, please contact [email protected].
STARS Citation STARS Citation van Caulil, Karen Karen, "Reducing Non-urgent Utilization Of The Emergency Department By Self-pay Patients: Analysis Of The Impact Of A Community-wide Provider Network" (2005). Electronic Theses and Dissertations, 2004-2019. 408. https://stars.library.ucf.edu/etd/408

REDUCING NON-URGENT UTILIZATION OF THE EMERGENCY DEPARTMENT BY SELF-PAY PATIENTS: ANALYSIS OF THE IMPACT OF A COMMUNITY-WIDE
PROVIDER NETWORK
by
KAREN VAN CAULIL B.S. Duke University, 1984
M.S.P.H. University of North Carolina at Chapel Hill, 1988
A dissertation submitted in partial fulfillment of the requirements for the degree of Doctor of Philosophy from the Public Affairs Program
in the College of Health and Public Affairs at the University of Central Florida
Orlando, FL
Spring Term 2005
Major Professor: Aaron Liberman

© 2005 Karen van Caulil
ii

ABSTRACT
The purpose of this study was to determine whether a coordinated and
comprehensive system of care for the uninsured changed the behavior of the uninsured
by decreasing non-urgent utilization of the emergency departments within a large, urban
county. The literature on emergency department trends and interventions designed to
decrease “inappropriate” or non-urgent use of the emergency departments was
reviewed and links to relevant theoretical concepts were identified. Utilization data from
six emergency departments and six federally qualified health centers were evaluated.
Secondary data over a three-year time period were abstracted from patient and
organizational records at the hospitals and federally qualified health centers.
The utilization data from the emergency departments and health centers were
compared. The analysis revealed a significant change in the number of non-urgent
visits by self-pay patients at the emergency departments when the health centers
expanded. A 32.2 percent decrease in utilization of the emergency departments by self-
pay patients was found.
Non-parametric tests demonstrated significant differences in the population seen
at the emergency departments and the clinics over the three-year study period.
Regression analysis demonstrated a statistically significant decrease in non-urgent,
self-pay visits at the emergency departments as a result of the increase in self-pay visits
at the federally qualified health centers.
iii

Further analysis includes forecasting the impact of future federally qualified
health centers on emergency department utilization. Recommendations for future
research include evaluation of the increased numbers of non-urgent transports from the
local emergency medical system by self-pay patients as well as the design of a pilot
study to look at the effectiveness of transporting these patients to the federally qualified
health centers for care instead of to the local emergency departments.
iv
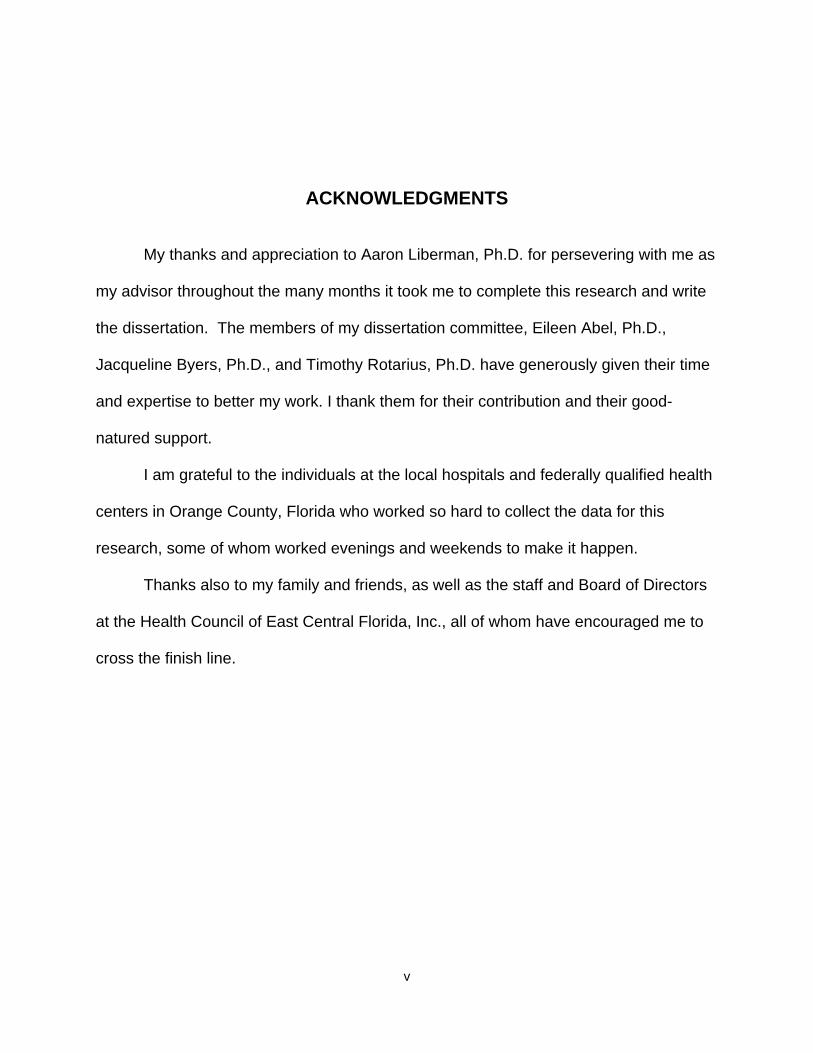
ACKNOWLEDGMENTS
My thanks and appreciation to Aaron Liberman, Ph.D. for persevering with me as
my advisor throughout the many months it took me to complete this research and write
the dissertation. The members of my dissertation committee, Eileen Abel, Ph.D.,
Jacqueline Byers, Ph.D., and Timothy Rotarius, Ph.D. have generously given their time
and expertise to better my work. I thank them for their contribution and their good-
natured support.
I am grateful to the individuals at the local hospitals and federally qualified health
centers in Orange County, Florida who worked so hard to collect the data for this
research, some of whom worked evenings and weekends to make it happen.
Thanks also to my family and friends, as well as the staff and Board of Directors
at the Health Council of East Central Florida, Inc., all of whom have encouraged me to
cross the finish line.
v

TABLE OF CONTENTS
LIST OF FIGURES.......................................................................................................... x
LIST OF TABLES............................................................................................................xi
LIST OF ACRONYMS/ABBREVIATIONS ......................................................................xii
CHAPTER I: INTRODUCTION........................................................................................ 1
The Role of the Emergency Department as a Safety Net Provider ............................. 7
The Significance of the Problem ............................................................................... 12
The Increase in Number of Emergency Department Visits ....................................... 14
The Statement of the Problem .................................................................................. 20
CHAPTER II: LITERATURE REVIEW........................................................................... 23
Number of Non-Urgent Visits to Emergency Departments........................................ 23
Comparison of Costs ................................................................................................ 25
Summary of Descriptive Studies ............................................................................... 27
Reasons for Using the Emergency Department for Non-Urgent Purposes........... 28
Who Uses the Emergency Department for Non-Urgent Purposes?...................... 29
Summary of Empirical Studies .................................................................................. 31
Education Interventions ........................................................................................ 32
Gatekeeping Interventions.................................................................................... 33
Improvement of Access to Outpatient Care .......................................................... 34
Case Management and Reverse Referral Interventions ....................................... 34
Other Triage Interventions .................................................................................... 37
vi

Interventions Focused on Children ....................................................................... 38
CHAPTER III: THEORETICAL FRAMEWORK ............................................................. 40
Theoretical Models.................................................................................................... 41
Systems Theory and Systems Thinking................................................................ 41
Community Level Change Theory ........................................................................ 43
Diffusion of Innovation Theory .............................................................................. 44
Health Behavior Change Theories........................................................................ 46
The Theory of Planned Behavior/Theory of Reasoned Action.............................. 46
Health Belief Model............................................................................................... 47
Integrated Model................................................................................................... 48
Hypotheses............................................................................................................... 50
CHAPTER IV: METHODOLOGY .................................................................................. 58
Overview................................................................................................................... 58
Research Design ...................................................................................................... 59
Setting .................................................................................................................. 60
Facility Selection................................................................................................... 61
Subject Selection.................................................................................................. 62
Operational Definitions ......................................................................................... 62
Measurement Instruments .................................................................................... 63
Procedure ................................................................................................................. 68
Data Analysis ............................................................................................................ 70
vii

Timetable .................................................................................................................. 73
Summary................................................................................................................... 74
CHAPTER V: RESULTS ............................................................................................... 75
Demographics........................................................................................................... 82
Hypothesis Testing Results....................................................................................... 97
Hypothesis 1......................................................................................................... 97
Hypothesis 2....................................................................................................... 125
Hypothesis 3....................................................................................................... 128
Hypothesis 4....................................................................................................... 128
Hypothesis 5....................................................................................................... 129
Hypothesis 6....................................................................................................... 130
Walk-out Rate ......................................................................................................... 131
Charge Analysis...................................................................................................... 135
Feedback Questionnaire......................................................................................... 139
CHAPTER VI: DISCUSSION ...................................................................................... 141
Hypotheses............................................................................................................. 142
Hypothesis 1....................................................................................................... 144
Hypothesis 2....................................................................................................... 148
Hypothesis 3....................................................................................................... 148
Hypothesis 4....................................................................................................... 149
Hypothesis 5 and Hypothesis 6 .......................................................................... 149
viii

Additional Primary Care Access Network Board Feedback .................................... 151
Limitations and Future Research ............................................................................ 152
Implications for Local Health Planning .................................................................... 154
APPENDIX A: REQUIRED DATA ELEMENTS ........................................................... 159
APPENDIX B: AUTHORIZATION TO COLLECT DATA.............................................. 161
APPENDIX C: INSTRUMENT 1 .................................................................................. 163
APPENDIX D: INSTRUMENT 2 .................................................................................. 180
APPENDIX E: FEEDBACK QUESTIONNAIRE........................................................... 202
APPENDIX F: IRB APPROVAL................................................................................... 204
LIST OF REFERENCES ............................................................................................. 207
ix

LIST OF FIGURES
Figure 1. Increase in Uninsured ...................................................................................... 5
Figure 2. Decrease in Number of Emergency Departments.......................................... 13
Figure 3. Increased Use of Emergency Departments.................................................... 15
Figure 4. Decrease in Orange County Emergency Department Visits .......................... 17
Figure 5. Emergency Department Utilization by Hospital ............................................. 19
Figure 6. Adapted Health Behavior Model..................................................................... 49
Figure 7. Path Diagram of Research Question.............................................................. 57
Figure 8. Uninsured by Zip Code ................................................................................. 79
Figure 9. Emergency Department Visits, 2001-2003..................................................... 98
Figure 10. Self-Pay Emergency Department Visits, 2001-2003 .................................... 99
Figure 11. Non-Urgent, Self-Pay Emergency Department Visits, 2001-2003.............. 100
Figure 12. Clinic Self-Pay Visits, 2001-2003 ............................................................... 103
Figure 13. Clinic and Emergency Department Visit Comparison................................ 106
Figure 14. Decrease in Emergency Department Visits by Zip Code ........................... 108
Figure 15. Time Series Plot........................................................................................ 113
Figure 16. Clinic and Emergency Department Visits Compared ................................ 114
Figure 17. Best-fit Line ............................................................................................... 115
x
LIST OF TABLES
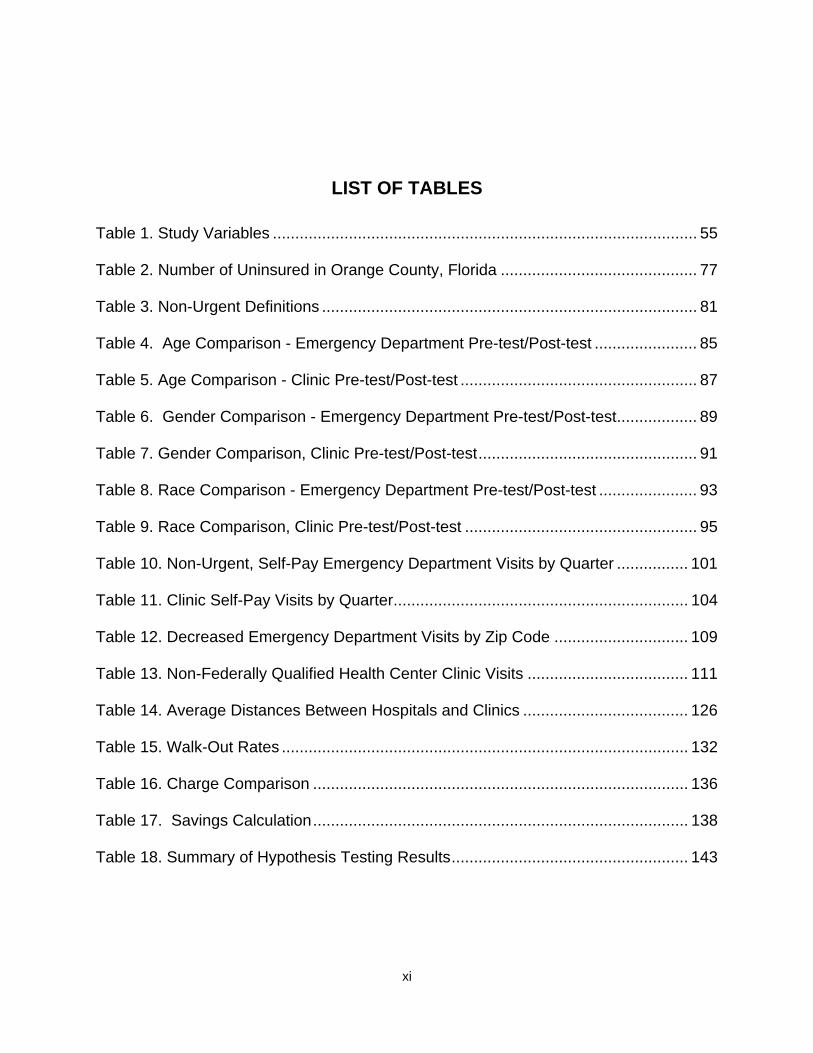
Table 1. Study Variables ............................................................................................... 55
Table 2. Number of Uninsured in Orange County, Florida ............................................ 77
Table 3. Non-Urgent Definitions .................................................................................... 81
Table 4. Age Comparison - Emergency Department Pre-test/Post-test ....................... 85
Table 5. Age Comparison - Clinic Pre-test/Post-test ..................................................... 87
Table 6. Gender Comparison - Emergency Department Pre-test/Post-test.................. 89
Table 7. Gender Comparison, Clinic Pre-test/Post-test................................................. 91
Table 8. Race Comparison - Emergency Department Pre-test/Post-test ...................... 93
Table 9. Race Comparison, Clinic Pre-test/Post-test .................................................... 95
Table 10. Non-Urgent, Self-Pay Emergency Department Visits by Quarter ................ 101
Table 11. Clinic Self-Pay Visits by Quarter.................................................................. 104
Table 12. Decreased Emergency Department Visits by Zip Code .............................. 109
Table 13. Non-Federally Qualified Health Center Clinic Visits .................................... 111
Table 14. Average Distances Between Hospitals and Clinics ..................................... 126
Table 15. Walk-Out Rates ........................................................................................... 132
Table 16. Charge Comparison .................................................................................... 136
Table 17. Savings Calculation.................................................................................... 138
Table 18. Summary of Hypothesis Testing Results..................................................... 143
xi
LIST OF ACRONYMS/ABBREVIATIONS
EMTALA Emergency Medical Treatment and Active Labor Act
ED Emergency Department
EMS Emergency Medical Services
FHIS Florida Health Insurance Study
FQHC Federally Qualified Health Center
HCAP Healthy Community Access Program
HIPAA Health Insurance Portability and Accountability Act of 1996
IOM Institute of Medicine
NHAMCS National Hospital Ambulatory Medical Care Survey
PCAN Primary Care Access Network
xii

CHAPTER I: INTRODUCTION
In 2000, the Institute of Medicine (IOM) released a report describing the health
care safety net in the United States as “intact but endangered” (Asplin, 2001; Lewin &
Altman, 2000). The IOM report emphasized the unstable financial situation of
institutions that provide care to Medicaid, the uninsured, and other vulnerable patients,
as well as the “patchwork” nature of the safety net system. The IOM’s definition of the
safety net is “those providers that organize and deliver a significant level of health care
and other health-related services to uninsured, Medicaid and other vulnerable patients”
(Lewin & Altman, 2000). Baxter and Mechanic (1997) charged that the nation’s safety
net system is not comprehensive or well organized.
The IOM identified core safety net providers as providers that “by legal mandate
or explicitly adopted mission offer access to services to patients regardless of their
ability to pay” and those providers where “a substantial share of their patient mix is
uninsured, Medicaid, and other vulnerable patients” (Lewin & Altman, 2000).
Populations served by safety net providers typically lack health insurance
coverage, but also include those covered by Medicaid, or those who are low-income
individuals with limited private insurance, i.e. the “underinsured” (Blumberg & Liska,
1
1996; Bradbury, Golec & Steen, 2001; Cunningham, Clancy, Cohen & Wilets, 1995;
Steinbrook, 1996).
Core providers within the safety net include community health centers, migrant
health centers, health care for the homeless programs, school-based health centers,
and other health centers and clinics. However, a substantial amount of safety net care
is provided in hospital emergency departments, which as a condition of participation in
the federal Medicaid program, are required to provide medical screening exams and
stabilizing treatment to all patients, regardless of their ability to pay (Cetta, Asplin, Fields
& Yeh, 2000).
Nationwide, the number of uninsured during 2001 and 2002 is estimated to have
been 74.7 million people under the age of 65, which equates to almost one in three
Americans, according to the report, "Going Without Health Insurance: Nearly One in
Three Non-Elderly Americans" (Robert Wood Johnson Foundation, 2003). The same
report indicated that 4.6 million Floridians were uninsured at some point in time between
2001 and 2002. During the first half of 2002, over 46 million Americans were uninsured
(Medical Expenditure Panel Survey, 2003), 16.4 percent of the total population. In the
South census region, 22.1 percent of the total population was uninsured, the highest
rate in the nation.
The Centers for Disease Control, in conjunction with the State Health
Departments, has completed a county-level Behavioral Risk Factor Surveillance Survey
(Florida Department of Health, 2003). In Orange County, Florida, 512 adults were
2

randomly selected and interviewed. This state-based telephone surveillance system
was conducted from September 2002 through January 2003 and was designed to
collect data on individual risk behaviors and preventive health practices related to the
leading causes of morbidity and mortality in the United States.
One of the questions on the Behavioral Risk Factor Surveillance survey posed to
the respondents aged 18 and older was whether the individual had any health care
coverage (public or private) during the past twelve months. The percentage of adult
respondents in Orange County, Florida in 2002 who did not have health coverage in the
previous year was 21.8 percent, higher than the State average of 18 percent uninsured
(Florida Department of Health, 2003). This rate is an increase of over 3 percent during
a two-year period (Florida Department of Health, 2003; Studnicki, 2002).
These estimates of the uninsured only address the lack of health coverage for
adults. The recently updated Florida Health Insurance Study 2004 (FHIS) provides the
most current estimate of the percent of uninsured in Orange County, Florida and
includes data on the rate of uninsurance for children as well as adults under the age of
65 years old (Duncan, Porter, Garvan & Hall, 2004). The study was initially conducted
in 1999. The FHIS researchers evaluated the length of time individuals were uninsured
and found that over half of the uninsured in Orange County, Florida had been without
coverage for two or more years.
3

The FHIS finds that the percentage of uninsured aged 0-64 years of age in the
State has risen from 16.8 percent in 1999 to 19.2 percent in 2004 and in Orange County,
Florida, from 15.2 percent in 1999 to 18.7 percent in 2004 as illustrated in Figure 1
(Duncan et al., 2004).
4

15.2%
18.7%16.7%
19.2%
0.0%
5.0%
10.0%
15.0%
20.0%
25.0%
1999 2004
Per
cent
Uni
nsur
ed
Orange County Florida
Source: Duncan, Porter, Garvan & Hall, 2004.
Figure 1. Increase in Uninsured
5

Based on the estimated 2004 population of Orange County at 1,013,937
residents, this percentage equates to an estimated 189,606 uninsured individuals under
the age of 65 years of age (U.S. Census Bureau, 2004), at least half of whom have
been uninsured two or more years. The number of uninsured is expected to continue to
increase as private health insurance costs continue to rise and coverage becomes less
affordable (Custer & Ketsche, 1999).
Despite having some level of health coverage, individuals eligible for Medicaid
also rely on safety net providers for care and are largely considered to be
“underinsured” due to program coverage limits. “Underinsured” refers to individuals
who have some type of health insurance, but not enough to cover all their health care
costs (Robert Wood Johnson, 2004). Medicaid is a federal-state program that provides
funding for vulnerable populations, including pregnant women, children, the disabled
and low-income elderly. Florida’s Medicaid program, currently being reformed, covers
more than two million Florida residents and costs in excess of $14 billion a year
(Agency for Health Care Administration, 2005).
In 2002, 14.4 percent of Orange County’s population was enrolled in Medicaid
and another 5.7 percent in a Medicaid Health Maintenance Organization (Health
Council of East Central Florida, 2003). The percentage of Medicaid enrollees equates
to another 180,000 individuals who are considered to be “underinsured.” As such, it is
6

estimated that over a third of the population in Orange County, Florida may need to rely
on safety net providers for care.
There is concern that the proposed changes in Medicaid in the State of Florida
will cause thousands of additional individuals to lose their Medicaid coverage (American
Medical News, 2005). The expected growth in the number of uninsured and
underinsured as well as the persistence of uninsured status underscores the need for a
system of care for those without health coverage.
The Role of the Emergency Department as a Safety Net Provider
In 1986, the Emergency Medical Treatment and Active Labor Act (EMTALA) was
enacted, primarily in response to concerns that some emergency departments were
turning away indigent and uninsured patients who came seeking treatment (Carpenter,
2001; Steinbrook, 1996). Some of these patients were being sent out or transferred to
other hospital emergency departments before the patient’s condition was stabilized and
before an accepting physician was found. This practice was commonly referred to as
“patient dumping,” and such behavior became illegal under EMTALA regulations
(Carpenter, 2001).
Since the passage of EMTALA, all emergency departments have been mandated
to complete a medical screening examination of any patient seeking medical treatment,
whether or not the patient has the ability to pay or provides evidence of medical
coverage and further, and whether the patient’s presenting condition is emergent or
7

non-urgent (Dohan, 2002; Malone, 1995). The result has been a nationwide increase
in the utilization of emergency departments, especially as it pertains to use of the
emergency department (ED) for non-urgent purposes (Cetta et al., 2000; Grumbach,
Keane & Bindman, 1993; Kellerman, 2002; Pane, Farner & Salness, 1991; Rask,
Williams, McNagny, Parker & Baker, 1998; Shesser, Kirsch, Smith, Hirsch, 1991;
Wanerman, 2002). New EMTALA regulations were put into effect in November 2003,
serving primarily to clarify when hospitals must treat patients and when those
obligations end (Centers for Medicare and Medicaid Services, 2004). To the best of
this researcher’s knowledge, the impact of these changes on ED utilization has yet to be
published in the academic literature.
Much of this growth in emergency department visits has been attributed to the
uninsured and those covered by Medicaid (Steinbrook, 1996). In the 2004 FHIS, it was
found that 20.5 percent of the uninsured surveyed in Orange County, Florida identified
the hospital ED as their usual source of care (Duncan et al., 2004). This compares to
only 4.1 percent of the insured population in Orange County.
In 1992, the United States Senate Committee on Finance commissioned the
General Accounting Office to do a national study of emergency departments. The study
concluded that the problem of overcrowding was predominantly caused by patients
seeking care for non-urgent problems (U.S. General Accounting Office, 1993). The ED
has become the usual source of care for many of the nation’s uninsured (Asplin, 2001;
Richardson & Hwang, 2001; Weinick & Burstin, 2001). A large portion of the population
8
is unable or unwilling to access community-based primary care services and has turned
to the emergency department when non-urgent care is needed. The health-seeking
behavior of substituting ED services for community-based primary care has been well
documented throughout the nation (Bradbury et al., 2001; Cetta et al., 2000; Doobinin,
Heidt-Davis, Gross & Isaacman, 2003; Koziol-McLain, Price, Weiss, Quinn & Honigman,
2000; Young & Sklar, 1995).
A significant percentage of patients in the emergency department would be more
appropriately treated in primary care settings because of the high cost of care in the ED
and the lack of continuity of care (Billings, Parikh, & Mijanovich, 2000; Cooke &
Finneran, 1994; Cunningham et al., 1995; Grossman, Rich & Johnson, 1998). The
American College of Emergency Physicians (ACEP) challenges this assertion by stating
that emergency departments can be more efficient in diagnosing certain medical
conditions than physicians’ offices or community health clinics because they have ready
access to radiology, laboratory and other diagnostic services (American College of
Emergency Physicians, 2004).
Despite ACEP’s assertion that treating patients for non-urgent purposes in the
emergency department is appropriate, use of the emergency department for non-urgent
conditions has been widely referred to as a sentinel event signaling systemic
deficiencies with the primary care system in a community (Billings et al., 2000; Cetta et
al., 2000; Clancy & Eisenberg, 1997; Commonwealth Fund, 2000; Grossman et al.,
1998). High rates of non-urgent utilization indicate a lack of access to primary care
9

which can be attributed to a shortage of providers or the presence of barriers preventing
patients from accessing care. These barriers include but are not limited to
transportation, language, lack of knowledge of available services, limited evening and
weekend hours, and financial barriers (Young & Sklar, 1995; Young, Wagner, Kellerman,
Ellis & Bouley, 1996).
Young and colleagues (1996) found that patients who chose to use the ED for
non-urgent care were more likely to report non-financial barriers to care, including the
inability to access evening services or take time off from work to seek care. Another
reason included an inability to obtain an appointment in a primary care setting in a
timely manner.
This lack of adequate access to primary care causes many people, especially
those without health insurance, to wait longer than they should to seek needed care. In
the 2004 FHIS, it was found that 37.1 percent of uninsured Orange County respondents
reported delaying or not obtaining needed medical care within the past year. This
compares favorably to the State average of 42 percent of the uninsured delaying
needed medical care. However, only 14 percent of Orange County’s insured
respondents reported the same delay in obtaining care (Duncan et al., 2004).
A lack of health insurance results in increased use of the emergency department
and an increased likelihood of being hospitalized for chronic conditions that would likely
be manageable with access to appropriate primary care (Blumberg & Liska, 1996).
Studies have shown that the lack of a regular source of care is a barrier to accessing
10

the health system (Aday & Anderson, 1975; American College of Physicians – American
Society of Internal Medicine, 2000: Hayward, Bernard, Freeman & Corey, 1991).
Delaying medical care increases the cost of care as well as the severity of illness or
injury for the patient (American College of Physicians – American Society of Internal
Medicine, 2000: Baker, Stevens, & Brook, 1994; Blumberg & Liska, 1996; Burstin,
Swartz, O’Neil, Orav & Brennan, 1999; Davis & Schoen, 1977).
The federal government recognizes that increased access to care for the
uninsured is necessary to contain costs and improve the community’s health status. In
fiscal year 2002, President Bush initiated a five-year expansion of community health
centers. For fiscal year 2004, $1.62 billion was appropriated to the development and
expansion of Federally Qualified Health Centers (FQHC’s) and nearly $104 million was
appropriated to the Healthy Community Access Program (Health Resources and
Services Administration, 2004). FQHC’s are community health centers that receive
federal funding to care for the uninsured. FQHC’s charge patients for care on a sliding
fee scale basis based on income level. President Bush’s recently released fiscal year
2005 budget proposal includes funding to create 1,200 new and expanded FQHC’s
across the nation, estimated to provide care to an incremental 6.1 million Americans by
2006 (White House, 2005).
In recent years, the Healthy Community Access Program (HCAP) has funded
communities developing innovative systems of care for the uninsured in medically
underserved areas. Orange County, Florida now has eight FQHC’s with more
11
expansion locations being considered. Orange County, through the Primary Care
Access Network (PCAN), has been funded since 2001 as an HCAP community. These
federal grants have been utilized to decrease the uninsured’s non-urgent utilization of
the local emergency departments by increasing access to care and decreasing barriers
to care (Primary Care Access Network, 2001).
The Significance of the Problem
Hospitals have been faced with largely unfunded mandates including EMTALA
compliance and the need to play a leading role in developing bioterrorism response
capabilities for the community (Scharoun, van Caulil & Liberman, 2002; Wanerman,
2002). These pressures of compliance and obligation have caused some providers to
leave the market (American College of Emergency Physicians, 2004).
Many emergency departments have closed in the United States due primarily to
financial pressures and staggering financial losses (American College of Emergency
Physicians, 2000). Over one thousand emergency departments closed from 1988 to
1998 in the United States (American Hospital Association, 2004). The number of
emergency departments nationwide continued to decrease from 4,270 in 1997 to 4,037
in 2002 as demonstrated in Figure 2 (American College of Emergency Physicians,
2004).
12

Source: American College of Emergency Physicians, 2004
Figure 2. Decrease in Number of Emergency Departments
13
This trend has also been experienced locally. In Orange County, Florida, one
emergency department closed in 1999 (Primary Care Access Network, 2001). Seven
emergency departments now remain open in the county.
The Increase in Number of Emergency Department Visits
Despite the decline in number of emergency departments, the number of ED
visits nationwide increased 19.19 percent between 1992 and 2002 (American Hospital
Association, 2004). The latest national data on the use of hospital emergency
departments show that there were 114,207,460 visits in 2002 among the 4,037 acute
general hospitals with active emergency departments that are operating throughout the
United States as demonstrated in Figure 3 (American College of Emergency Physicians,
2004).
14

Source: American College of Emergency Physicians, 2004.
Figure 3. Increased Use of Emergency Departments
15

As mentioned above, health services research has shown that people without
health insurance are less likely to receive healthcare in a timely manner and
subsequently seek care in the ED when treatment of the illness or condition can no
longer be postponed (Bradbury et al., 2001). The greater propensity on the part of the
uninsured to use the ED reflects both health status and access issues. As such,
Orange County, Florida’s core safety net providers joined together in 2001 to strengthen
the system of care in response to the increasing numbers of uninsured, underinsured
and Medicaid enrollees and increased use of the local emergency departments for
primary care or “non-urgent” care needs (Primary Care Access Network, 2001).
This collaborative is called the Primary Care Access Network (PCAN). The
collaborative has instituted the concept of a medical home, or usual source of care, for
the uninsured and underinsured residents of the county. While emergency departments
across the nation continue to experience increases in utilization of emergency
departments, overall, PCAN hospitals reported a decline in numbers of emergency
department visits from 2001 through 2003 as demonstrated in Figure 4 (Health Council
of East Central Florida, 2005). The time period associated with this decline coincides
with the health system changes in the county since the PCAN effort was formed and
became operational.
16
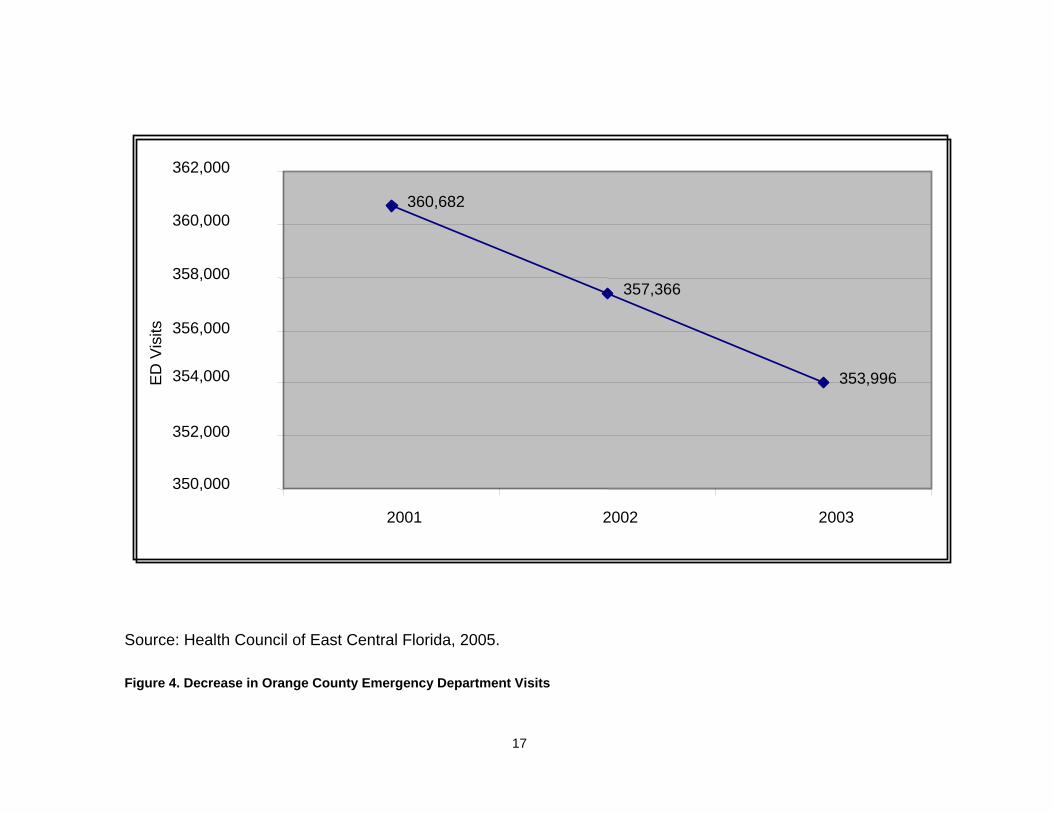
360,682
357,366
353,996
350,000
352,000
354,000
356,000
358,000
360,000
362,000
2001 2002 2003
ED
Vis
its
Source: Health Council of East Central Florida, 2005.
Figure 4. Decrease in Orange County Emergency Department Visits
17

However, not all emergency departments in the county reported a decline in
overall use during this time period as shown in Figure 5 (Health Council of East Central
Florida, 2005). Members of PCAN desired to determine what factors might be affecting
the change for some hospitals and not for others including how many of these visits
were for non-urgent purposes and also by the uninsured.
18

ED
Vis
its
Source: Health Council of East Central Florida, 2005.
Figure 5. Emergency Department Utilization by Hospital
19

The overall decrease in utilization provided an impetus to study the entire system
of care and to attempt to determine the impact the primary care clinics have had on
non-urgent ED utilization by the uninsured. Additionally, there is heightened interest
locally in determining what factors impact change in the utilization of the safety net
system.
The Statement of the Problem
At a time when resources are limited and health care trends continue to increase
the stressors on the system, the community’s use of the emergency department for non-
urgent medical problems is largely considered to be a poor use of resources due to the
high costs and charges associated with these visits. Non-urgent use of the emergency
department is considered to be medically inappropriate because the care given often
lacks continuity and/or coordination.
Communities throughout the country have worked to reduce the overcrowding in
their emergency departments by attempting to educate and redirect patients who need
non-urgent care to select primary care settings. The studies that have been conducted
to evaluate the impact of these efforts are few in number and have been limited in
scope and measure, most studying only a single hospital and one primary care center
or the behavior of a limited subset of population or an isolated initiative. To the best of
the knowledge and investigation of this researcher, no studies have been published to
20
date that evaluate the impact of a total system of care for the uninsured on ED
utilization by the uninsured.
The PCAN effort in Orange County, Florida provides an opportunity to evaluate
whether a comprehensive and coordinated strategy involving seven hospital emergency
departments and fourteen primary care sites, including several FQHC’s, has been
successful in redirecting the uninsured seeking care from the emergency departments
to the primary care centers.
PCAN was created to reduce “inappropriate” utilization of the local emergency
departments by the uninsured for primary care purposes (Primary Care Access Network,
2001). PCAN is comprised of twenty member organizations that represent all the safety
net providers of care for the uninsured and underinsured in Orange County, Florida, as
well has the local health planning agency, a local health foundation, and a business
healthcare coalition.
New community health centers and evening clinics were developed through this
effort in areas of the county with the highest rates of uninsurance and ED utilization.
Hours of operation were expanded at some clinics in response to expressed needs of
the target population. Additionally, enhanced case management services were put in
place to coordinate care within the system.
This research study examines the impact of this community-based system of
care for the uninsured to determine if there has been a significant difference in use of
the emergency departments by the uninsured in Orange County for non-urgent care
21

from 2001 through 2003 as a result of the PCAN efforts. The study looked at ways to
measure whether the population of uninsured individuals who utilized the ED for non-
urgent care has shifted to the primary care centers for non-urgent care needs.
Additionally, assessment was completed on the importance of number of hours of
operation for the clinics and location. The results of this research could have important
implications for community health planning, both locally and nationally.
22

CHAPTER II: LITERATURE REVIEW
There is an abundance of literature on the problems and pressures faced by the
nation’s emergency departments, including the problem of non-urgent utilization of the
emergency department. Several descriptive studies have provided information
regarding the size and scope of the problem as well as information about reasons for
the problem. After a comprehensive review of the literature, it appears evident that
innovative and targeted interventions may alleviate the problem by changing the
behavior of the patients that now use the emergency department for non-urgent
purposes (Derlet, Kinser, Ray, Hamilton & McKenzie, 1995: Franco, Mitchell & Buzon,
1997; Grossman et al., 1998; Jordan, Adamo & Ehrman, 2000; Piehl, Clemens & Joines,
2000; Young, D’Angelo & Davis, 2001). However, there is a limited body of empirical
research on the impact related to the outcome of such interventions.
Number of Non-Urgent Visits to Emergency Departments
Emergency departments are designed to take care of urgent and emergent
health care problems, yet most visits to emergency departments are for non-urgent
purposes. An extensive review of the literature indicates that fewer than half of the
visits to emergency departments are for actual emergencies (Haugh, 2001; MacLean,
Bayley, Cole, Bernardo, Lenaghan & Manton, 1999; Health Care Strategic Management,
23

2002; Mitchell & Remmel, 1992; Rotarius, Trujillo, Unruh, Fottler, Liberman, Morrison,
Ross & Cortelyou, 2002; Sarver, Cydulka & Baker, 2002; Stussman, 1997; Walls,
Rhodes & Kennedy, 2000). In Orange County, Florida, only 18.41 percent of ED visits
resulted in a hospital admission in 2003 (Health Council of East Central Florida, 2005).
Mitchell and Remmel (1992) looked at utilization patterns in twenty-five Florida
emergency departments and found that in some counties up to 85 percent of the visits
were for non-urgent conditions and averaged approximately sixty percent of all visits.
In a more recent study in Central Florida, 80 percent of the visits to the emergency
departments were for non-urgent or semi-urgent care (Rotarius et al., 2002). The
National Hospital Ambulatory Medical Care Survey (NHAMCS): 2001 Emergency
Department Study indicated that only 9.1 percent of visits were non-urgent; however, an
additional 16.3 percent were considered to be semi-urgent (McCaig & Burt, 2003).
The large differences in these results can be attributed to the definition of non-
urgent care used in the collection of the data. In the NHAMCS Study, the determination
of urgency was based upon the immediacy with which the patient needed to be seen.
This decision was made by the triage department before the patient was seen (McCaig
& Burt, 2003). In the previously cited studies, the determination of urgency was
determined retrospectively, based upon diagnosis and treatment codes and/or resource
utilization or costs of care delivered. In the most cited empirical study on non-urgent
utilization of the ED, retrospective determination of urgency was used (Cunningham et
al., 1995).
24

Comparison of Costs
The review of the literature indicates that emergency departments charge
approximately three times the rate for a primary care visit (Baker & Baker, 1994; Phelps,
Nagel, Taylor, Klein & Kimmel, 2000; Rotarius et al., 2002; Williams, 1996). This
difference in charges between hospitals and community care settings may account for
legal actions such as those led by Richard Scruggs who has charged that hospitals are
overcharging the uninsured for care (Appleby, 2005).
Baker and Baker (1994) used data from the 1987 National Medical Expenditures
Study to estimate prices for a set of likely non-urgent conditions seen in the emergency
department and estimated costs for similar cases seen in outpatient clinics and/or
physician offices and found that the average ED charge was $144 and the projected
non-ED charge was $50. The charge to receive care for a non-urgent condition in the
ED in the year 2000 was estimated at $170. Care for the same condition by a family
physician would have cost the patient $55 (Phelps et al., 2000), a considerable cost
savings over the cost of care in an emergency department.
In the previously cited Central Florida study of emergency departments, it was
determined that charges for a non-urgent visit averaged $306 in the year 2000 with the
hospitals only collecting $125 per non-urgent visit (Rotarius et al., 2002). This study
also estimated that the average charge for a primary care visit was $55.
25
Only one study was found that attempted to measure the costs associated with
providing non-urgent care in the ED. Williams (1996) analyzed data from six
emergency departments in Michigan. The patients were classified into different groups
based on severity and urgency of their conditions. Regression models were used to
compute measures of direct cost, total cost, and marginal cost per patient. Williams
found that the marginal cost of a non-urgent visit was only $24 and concluded that
redirecting non-urgent visits to the primary care setting would not yield great savings as
had been largely believed. Despite Williams’ contention that treating non-urgent care in
the ED may not be financially ruinous for the hospital, there are still significant concerns
with the appropriateness of treating non-urgent cases in the ED such as the potential for
over-testing and over-treatment, which increase health care spending.
There are other costs associated with using the ED for non-urgent purposes that
are not captured in a comparison of the cost of an emergency visit to a primary care
visit in the community. These include the benefits of receiving services from a usual
source of care. Usual source of care refers to the place where patients go for illness
treatment as well as preventive services (Wall et al, 2002). Having a usual source of
care or a “medical home” refers to a continuing relationship with a physician or other
healthcare provider. This is referred to as “continuity of care” (Christakis, 2003).
Continuity of care has been shown to have a variety of benefits including
increased patient adherence to medical regimens, improved outcomes, decreased
hospital and emergency utilization as well as decreased cost (Ansell, Schiff, Goldberg,
26

Furumoto-Dawson, Dick & Peterson, 2002; Becker, Drachman & Kirscht, 1972; Billings
& Teicholz, 1990; Christakis, Mell, Koepsell, Zimmerman & Connell, 2001; Gill &
Mainous, 1998; Mainous & Gill, 1998; Raddish, Horn & Sharkey, 1999; Shear, Gipe &
Mattheis, 1983; Wasson, Sauvigne & Mogielnicki, 1984; Weiss & Blustein, 1996). A
regular provider is aware of past medical history, drug allergies, and patient treatment
preferences (Nutting, Goodwin, Flocke, Zyzanski & Stange, 2003). Studies of the
benefits of continuity of care have indicated greater efficiency in diagnosing and treating
problems (Raddish et al., 1999).
Educating and re-directing patients from the use of the ED as a regular source of
care to a primary care provider has documented benefits. These benefits include
improved quality of care in a more cost effective setting. Further, redirecting non-urgent
cases to a primary care setting would result in increased capacity of the emergency
system of care to address the urgent health care needs of the community.
Summary of Descriptive Studies
There is considerable detail on the frequency of use of the emergency
department for non-urgent purposes, the characteristics of the population using the ED
in this manner as well as their self-reported reasons for doing so. Although some
studies have shown that insured patients are using the ED at a higher rate than the
uninsured, proportionately, the uninsured are more apt to consider the ED their usual
source of care.
27

Reasons for Using the Emergency Department for Non-Urgent Purposes
Researchers have found that a substantial number of patients with non-urgent
needs identify the reason they presented at the emergency department as an emergent
or urgent need (Gill & Riley, 1996; Health Council of East Central Florida, 2002: Lucas
& Sanford, 1998). Gill & Riley (1996) conducted a small-scale study in an urban ED and
determined that 82 percent of the patients who were identified as non-urgent felt that
their conditions were urgent. The Health Council of East Central Florida (2002) found
that nearly half of the patients in their study who were identified as non-urgent patients
thought that their conditions required emergency care. Lucas and Sanford (1998) found
that 58 percent of patients who had repeat visits to the ED were of the opinion that their
medical needs were urgent, as well. A much larger study of 56 emergency
departments and over 6,000 patients looked at patient perceptions of the immediacy of
their health care needs and found that 45 percent of the non-urgently classified patients
thought that their conditions were emergent (Young et al., 1996).
Another local study of ED utilization in four Orlando area hospitals was
conducted by a University of Central Florida Health Care Finance Class in 2002 (Florida
College of Emergency Physicians, 2002). Patients using the ED for non-urgent
purposes were asked to complete a questionnaire about the reasons for their visit. The
majority of patients felt that their conditions were serious and could not wait to contact
their physician or other community-based primary care provider.
28

Other studies have found very different results; patients knew that their
conditions were not emergent, yet came to the ED for care anyway. Doobinin and
colleagues (2003) surveyed parents who brought their children to the ED for non-urgent
care and found that 62.8 percent came to the emergency department for its
convenience rather than for reasons of urgency.
Billings et al (2000) surveyed 669 ED patients in New York City to determine their
reasons for coming to the ED for care. A small percentage, 14 percent, indicated that
they perceived the condition was of an urgent or emergent nature. Over one-third (34.1
percent) of the respondents indicated that the came to the emergency department for
convenience purposes or that the ED was their preferred source of care. Nearly 10
percent indicated that they were uninsured and could not seek care elsewhere.
Patient education efforts that provide information to the community about what
conditions require emergency care as well as information about alternate sources of
care may divert patients to more appropriate settings for care (Billings et al, 2000;
Doobinin et al, 2003; Lucas & Sanford, 1998).
Who Uses the Emergency Department for Non-Urgent Purposes?
Researchers have studied why people use the ED for non-urgent conditions and
have looked closely at the demographics of the population that uses the emergency
department for non-urgent care as well as their financial status (Afilalo, Marinovich,
Afilalo, Coaccone, Leger, Unger & Giguere, 2004; Fronstin, 2000; MacLean et al., 1999;
29

Walls et al., 2000). Young, uninsured males have been identified as the most frequent
users of the ED (Okuyemi & Frey, 2001). Afilalo and colleagues (2004) did not find that
gender, race, education level, marital status or employment status differed in non-urgent
patients when compared to urgent patients. They did find that non-urgent patients
were significantly younger and less likely to be living alone. Okuyemi and Frey (2001)
found that past history of frequent ED use was a strong predictor of future frequent ED
use.
Children are also frequently treated in hospital emergency departments for
conditions and treatments that are non-urgent. Cunningham et al (1995) found that very
young children were more likely to use the emergency department for non-urgent care,
which the researcher concluded was likely related to the inability on the part of the
parents to make contact with the family physician after hours.
Phelps et al (2000) point out that more than 20 million children in the United
States seek medical care in the ED. Researchers estimate that more than half of
pediatric ED visits are non-urgent (Phelps et al., 2000; Guttman, Nelson & Zimmerman,
2001). Efforts to educate parents about the importance of preventive care and having a
primary care provider have been undertaken to attempt to decrease these visits
(Grossman et al., 1998).
Researchers found that a lack of a medical home was an independent correlate
for presenting to the ED for a non-urgent condition when controlling for age, gender,
marital status, health status, and co-morbid disease (Peterson, Burstin, O’Neil, Orav &
30

Brennan, 1998). Peterson and colleagues found that race, lack of insurance, and
education were not associated with non-urgent use of the ED.
Community-wide strategies to increase affordable access to care and educate
the public about the importance of primary and preventive care would provide a viable
alternative to the population finding themselves using the ED as their regular source of
care. More research is needed to identify successful strategies for redirecting the
uninsured to medical homes.
Summary of Empirical Studies
This review found few research studies that evaluate the impact of interventions
geared to redirecting patients from the emergency departments for non-urgent purposes.
These efforts include education efforts, case management, increased access to primary
care, and direct referrals to alternative sources.
The gap in research in this area is surprising to this researcher due to the high
level of awareness of the problem and the considerable level of effort that has been
expended in attempting to solve the problem. Nationwide, there are 158 communities
funded annually through the Healthy Community Access Program to develop and refine
integrated systems of care for the uninsured and underinsured (Bureau of Primary
Health Care, 2004). To date, none of these initiatives, which began in the late 1990’s,
have published research in peer-reviewed journals on the impact their initiatives have
made on the health utilization of their target populations. This lack of research appears
31

to be confirmed by the release of the Federal budget for 2005. The Healthy Community
Access Program has been removed from President Bush’s budget due to a lack of
evidence of success (White House, 2005).
The interventions that have been studied and have had results published are
small in scale or cover a relatively short study period. Most studies are limited to a
single population or the impact of an intervention on a single provider. One study,
conducted in a county in North Carolina, evaluated the impact of a system of care, the
Carolina Access Program, a Medicaid initiative, before and after implementation (Piehl
et al., 2000). No other system-wide studies were identified and none for the uninsured.
Education Interventions
An experimental study of Medicaid children seeking care in a hospital in Ohio
compared emergency department utilization of patients whose parents received no
intervention to those in two intervention groups. The intervention groups received
education about appropriate emergency department use or received case management
services (Grossman et al., 1998). The 135 families in the minimal intervention group
received education about the importance of a regular source of care. The 180 families
in the case management intervention group received education as well as assistance on
making an appointment with a primary care provider and an offer to provide ongoing
assistance for a three-month period of time. The 613 families in the comparison group
32

did not receive education or referral assistance because they presented to the ED at
times when the caseworker was not available to meet with them.
Decreases of 11 percent and 15 percent fewer non-urgent visits for the education
and case management intervention groups respectively occurred in the first six months
following the intervention. The researchers continued to evaluate the ongoing impact of
the interventions and found no significant difference in non-urgent visits between the
intervention and comparison groups over the next 18-month period. The study’s
conclusions indicated the need for ongoing education and case management support
for the target population.
Gatekeeping Interventions
Gatekeeping refers to a health professional who is responsible for overseeing
and coordinating all the medical needs of a patient. The intent of gatekeeping is to
reduce unnecessary utilization of the health care system to control costs. Originally
pioneered in the Arizona Medicaid Waiver Program, gatekeeping has found success in
reducing health utilization and costs (Jordan et al., 2000).
The Medicaid program in Kentucky instituted a system whereby a gatekeeper
physician had to be contacted and preauthorization of ED use was required for
reimbursement. A two-month long prospective study was conducted using an historical
control group. The program experienced a thirty-three percent (33 percent) decrease in
non-urgent visits by children enrolled in the program after the gatekeeping function
33
became operational (Franco et al., 1997). Overall ED usage in the two month period
dropped from 10 percent of the clinic registrants prior to the gatekeeping requirement to
8 percent.
Improvement of Access to Outpatient Care
Piehl and colleagues (2000) evaluated whether the increased availability of
primary physicians and the use of a telephone triage system decreased non-urgent
emergency visits for the children in a new Medicaid managed care program by
comparing ED visits before and after the program was implemented. They found a
significant decrease in ED use by the study population, both for overall ED use and also
for non-urgent use. No similar decrease was seen in the control group, which was a
non-Medicaid insured group of patients.
This study is significant in that it reviewed in depth a system-wide change and its
impact on a county’s Medicaid population. However, the study design did not permit the
researchers to determine whether the expanded access to care or the institution of the
triage system had caused the decrease in emergency department utilization.
Case Management and Reverse Referral Interventions
Case management is defined as the assignment of a healthcare provider to
assist a patient in assessing health and social service systems and to assure that all
required services are obtained (Case Management Society of America, 1995). The
34

Case Management Society of America defines case management as a collaborative
process that assesses, plans, implements, coordinates, monitors, and evaluates the
options and services required to meet an individual’s health needs using communication
and available resources to promote quality, cost-effective outcomes.
Case management techniques in assisting frequent or inappropriate users of ED
services have found some success. As described above, the case control study that
evaluated ED-based case management services for families found that the group
receiving the case management intervention had a 14.5 percent reduction in non-urgent
ED visits as compared with those individuals comprising the control group (Grossman et
al., 1998).
The inability to identify a personal physician has been identified as the most
pervasive influence on inappropriate emergency department visit rates (Buesching,
Jablonoski, Vesta, Dilts, Runge, Lund & Porter, 1985). As such, many hospitals
throughout the country provide direct referrals and appointments with primary care
providers for follow up care, an aspect of case management.
Some hospitals have looked at reverse referrals by triaging patients with non-
emergent conditions outside of the emergency department. These studies risk violation
of EMTALA regulations which prohibit such transfers. In studies where referrals to
primary care centers were made, only about one-quarter to one-third of the patients
actually followed up with their care at the referred site (Straus, Orr & Charney, 1982;
O’Brien, Shapiro, Woolard, O’Sullivan & Stein, 1996; McCarthy, Hirshon, Ruggles,
35

Docimo, Welinsky & Bessman, 2002). Chan and colleagues studied patients who were
referred and obtained care at the centers. Their research found that increased use of
the primary care centers did not decrease future use of the emergency department for
non-urgent care (Chan, Galaif, Kushi, Bernstein, Fagelson & Drozd, 1985).
Derlet and colleagues’ five-year prospective study evaluated the safety of
sending patients to off-site clinics as an alternative to treating them in the emergency
department. Eighteen percent of the patients were referred elsewhere for treatment.
The study results indicated that these patients did not experience adverse outcomes as
a result of the referral (Derlet et al., 1995).
McCarthy and colleagues (2002) asked whether providing reverse referral to a
community health center for the uninsured that used the ED for non-urgent care
resulted in decreased future utilization of the emergency department for non-urgent care
by the uninsured. The study population prior to the intervention was used as an
historical control. In this study, it was determined that there was no significant
difference in utilization of the ED by the study population before and after a referral was
made. Hospital case managers had made follow-up appointments for the uninsured in
community health centers and educated the patients regarding the importance of
obtaining primary and preventive care. Only about one-fifth of the patients went to the
community health centers for care, many citing that their medical problem had been
treated and no further care was needed. The patients who kept their follow-up
36
appointment in the community health center were predominantly older women with
chronic problems.
Other Triage Interventions
A popular option in many communities for attempting to decrease inappropriate
utilization of the ED has been to open a “fast-track” urgent care center in close proximity
to the ED (Simon, McLario, Daily, Lanese, Castillo & Wright, 1996; Simon, Ledbetter &
Wright, 1997; Hampers, Cha, Gutglass, Binns & Krug, 1999; Counselman, Graffeo &
Hill, 2000). The urgent care centers have shorter wait times to receive care and have
medical outcomes and satisfaction levels that are equivalent to those seen in the
traditional emergency department. Counselman, Graffeo & Hill (2000) found that the
urgent care centers were not normally open during the day and concluded that they did
not offer improved primary care access.
Hampers et al (1999) had similar findings with some of the fast-track programs
only being open one 8-hour shift per day. These studies conclude that while the fast-
track, urgent centers divert non-urgent cases out of the emergency department
temporarily, the programs do not offer a regular source of primary or preventive care to
patients.
A case control study was conducted to evaluate whether emergency medical
technicians could decrease ED use by patients with non-urgent conditions who use the
911 system. This was done by identifying and triaging patients to alternate treatment
sites (Schaefer, Rea, Ploide, Peiguss, Goldberg & Murray, 2002). A historical control
37

group was used. The intervention group (n=1,016) received 15 percent less emergency
department care than the control group, which was considered to be a significant
decrease in care.
The researchers concluded that based on physician review of the cases sent to
other sites as well as patient interviews, the alternate care program was safe and
satisfactory. Other researchers have evaluated programs of this nature and have
cautioned that limiting patients’ access to emergency care without the aid of a valid and
reliable standard for what constitutes an inappropriate emergency department visit
could create harmful barriers and restrictions to receiving care (O’Brien et al., 1996;
Lowe & Bindman, 1997; Velianoff, 2002).
Interventions Focused on Children
As described in the previous chapter, children frequent the ED for non-urgent
conditions. The implementation of a school-based health center was evaluated for its
impact on ED use (Young et al., 2001). A retrospective analysis of data over a two-year
period of time indicated that visits decreased significantly during the year when the
school-based health center was providing preventive and primary care services to the
children.
Brousseau, Danserau, Linakis, Leddy & Vivier (2002) studied the ED utilization of
children enrolled in Medicaid and found that despite the assignment of a primary care
38

provider, there was no significant association between the receipt of preventive services
and ED utilization when compared to children unassigned to a provider.
The inconsistent and limited results in the studies discussed in this review of the
literature have resulted in a lack of formal evidence as to how to solve the problem of
non-urgent visits to the ED. Barriers to accessing primary care services continue to
exist whether they are system barriers or individual to each patient. Communities are
continuing to devise system-wide strategies to solve the problem of inappropriate use of
the ED for primary care purposes.
39

CHAPTER III: THEORETICAL FRAMEWORK
Interventions developed to redirect the uninsured away from using the
emergency department for non-urgent care purposes are expecting the target
population to change their current behavior to a more desired behavior. The more
desired behavior is to access a more appropriate, more cost effective level of care for
non-urgent purposes, such as a community health center or clinic. Theories and
models of health behavior change and systems theory form the framework for predicting
the success of health interventions.
There are a number of significant theories and models that support the idea that
health behavior can be changed to improve a system of care. These theories and
models are primarily based in systems theory and thinking, the macro-theory, and
health behavior change theory, a related micro-theory. The underlying theoretical
model for evaluating the success of a system of care on redirecting uninsured patients
from the ED to primary care clinics requires a strong linkage of health behavior change
theory to systems theory. Reinforcing the relationship between these theories
highlights the many interrelated components that must be considered in effecting this
type of systemic change.
Systems theory explains changes in communities to effect a community’s actions
for improving health status and the health system. Systems thinking is a related tool for
40

specifying possible courses of action, together with an assessment of associated risks,
constraints and resources (Lewin, 1951). Health behavior change theories focus on the
individuals within that system and how to bring them to a more desired behavior. The
integration of these theories results in a framework that has the system taking in
information about what those outside of the system need and require in order effecting
the requisite change, and then making necessary adjustments in the system to ensure
that barriers to making the change are eliminated.
Theoretical Models
A description of applicable theoretical models are addressed and incorporated
into an adapted health behavior model:
Systems Theory and Systems Thinking
Systems theory or “cybernetics” was proposed in the 1940’s by a biologist,
Ludwig von Bertalanffy and later modified by Ross Ashby in the 1950’s (Ashby, 1966;
von Bertalanffy, 1968: von Bertalanffy, 1969). Systems theory has been incorporated
into many fields and applied to research, manufacturing and management (Boulding,
1985). Systems theory poses that systems are open to and interact with their
environment. In the mid-1980’s, the term “learning organization” was applied to this
process (Jarvis, Holford & Griffin, 1998). Learning results in changes in knowledge,
beliefs and behaviors and enhances the organization’s capacity for innovation and
41

growth (Gadotti, 1996). Jarvis and colleagues theorized that it is important for a
learning organization to have subsystems in place to capture and share learning. If
such a structure is in place, the learning organization learns continuously to transform
and improve itself.
The evolution of social systems involves a learning process by which society
gains knowledge on how to produce increasingly more complex and improved
organizations (Boulding, 1985). Argyris developed the concept of a learning loop where
the organization also adapts its aims, norms and principles, based upon the learning
and adapting that occurs (Jarvis et al, 1998).
The system can continually evolve if it is open to learning from its environment
(von Bertalanffy, 1968). Systems theory has been applied to engineering, computing,
ecology, management, sociology and health and is also referred to as organizational
change theory (Ashby, 1966; Boulding, 1985). Systems thinking applies systems
principles to aid a decision-maker with problems of identifying, reconstructing,
optimizing and controlling a system which taking into account multiple objectives,
constraints and resources (Ashby, 1966).
Broad systems theory appears to have all the components required to provide a
theoretical framework for evaluating whether a health behavior change has occurred to
improve a system of care. However, the subclasses of systems theories applied to
health behavior change appear to have set aside the important link that the system
must change to ensure that all barriers to making the change have been removed. For
42

without the removal of these barriers, the change may never be fully actualized. A
comprehensive analysis of the forces of change wherein the variables that favor the
change are strengthened and the variables that prevent the change are minimized or
eliminated was developed by Lewin (1951). Force field analysis recognizes that the
desired change cannot be accomplished if the barriers are stronger than the proponents
for the change.
Community Level Change Theory
Community level models are ecological in nature and are the foundation for
pursuing goals of improved health for individuals, groups, institutions and communities.
Community level change theory is a subclass of systems theory and is the framework
for understanding how social systems function and change, and how communities and
organizations can be activated (Gadotti, 1996).
Paulo Freire developed a framework for executing social or system change. His
framework is referred to as community level change theory. His theory is based upon
constant communication between the providers and the consumers. This dialogue
engages the providers and consumers and leads to social commitment, which in turn
leads to action. The process is cyclical in that once action has been taken; the
providers and consumers reflect on its success or failure and continue the dialogue
(Bentley, 2004).
Knowledge is a requirement of this model. Knowledge can come in the form of
education about the services available or data and information about the scope of the
43

problems. Another requirement is that the participants must approve of the process and
the intended change and feel that it is an important change to make in behavior or
practice. This acceptance of the need for the change is critical for the process to move
forward (Gadotti, 1996).
The process of social change can only continue its forward motion if the
participants intend to make the change and put that intention into practice. Continued
support of the change requires advocacy on the part of participants in the process to
convince others to make the change, as well (Bentley, 2004).
Freire recognizes that environmental or system level forces can help or hinder
the change from being executed. He does not however incorporate these factors into
the model as a critical element in realizing that change, he only represents them as
being a force that impacts whether the change will be made (Bentley, 2004; Gadotti,
1996).
Diffusion of Innovation Theory
Diffusion of Innovation theory is grounded in health education although it came
out of the field of agricultural extension (Zaltman, 1973). The main questions that are
addressed with this theory are:
• How do ideas spread among a group of people over time?
• How can we speed up this process? (Rogers, 1995)
44

A community can only make a change or innovation when each individual or a
significant number of individuals makes that change. This theory demonstrates five
stages through which an individual passes before a change or innovation can be made.
These stages are:
• Awareness
• Knowledge and interest
• Decision
• Trial
• Adoption (Rogers, 1995).
Individuals pass through these stages at differing rates, dependent upon their
individual knowledge, awareness and propensity for making change. The diffusion and
change process is often gradual and depends upon a number of key factors including
the characteristics of the innovation itself, the social system within which the innovation
is introduced, the available channels of communication and the change agents who help
spread the idea (Zaltman, 1973).
As in the community level of change model, this model does not incorporate the
requirement that the environment or the system be positioned so that the individual can
make the change without experiencing a barrier once he or she has decided to make
the change.
45

Health Behavior Change Theories
It is important to use behavior change theories and models in designing health
interventions (Gustafson, Cats-Baril, & Alemi, 1992). These theories are used to
analyze public health problems and their impact. The theories guide development of
appropriate interventions by explaining the dynamics of behavior, the processed for
changing the behavior and the effects of external influences on the behavior.
The purpose of health behavior change theories is to explain, predict and
understand motivations for behavior change and to identify how and where to target
strategies for changing behavior (Norman, Abraham & Conner, 2000). This group of
theories assumes that human beings are rational and make systematic use of
information available to them and consider the implications of their actions before they
decide to engage or not engage in certain behaviors (Cameron & Leventhal, 2003).
The Theory of Planned Behavior/Theory of Reasoned Action
The development of the theory of planned behavior/theory of reasoned action
originated in the field of social psychology by Icek Ajzen and Martin Fishbein (Cameron
& Leventhal, 2003). In the 1970’s they collaborated on development of a theory that
would predict how attitudes influence behavior. Their theory, the theory of reasoned
action, looked at behavioral intentions as the main predictor of behavior. Ajzen realized
this theory did not adequately address individuals’ feelings of empowerment and their
46

control of their behaviors. Ajzen added the concept of perceived behavioral control to
performing a given behavior (Rutter & Quine, 2002).
The individual may have total control when there are no constraints of any type to
adopting a new behavior. Control factors include both internal and external factors.
Internal factors include skills, abilities, information, emotions such as stress, etc.
External factors include situation or environmental factors (Glanz, Rimer, & Lewis,
2002). As discussed above, the theory identifies these factors as potential barriers, but
does not incorporate minimization or elimination of them into the model.
Health Belief Model
The health belief model was developed to explain and predict preventive health
behavior (Rutter & Quine, 2002). The model looks heavily at an individual’s motivation
for modifying health behavior. The individual must perceive that without the change in
behavior, he or she is highly susceptible to an adverse condition. The individual must
perceive that the condition is serious in nature. The individual must them perceive that
taking action to avoid the condition will work (Glanz et al., 2002). As in previously
described theories, the health belief model does recognize that barriers to taking action
will prevent the change in behavior. However, as in the other models, it does not
incorporate the need for reducing and elimination of barriers as necessary for modifying
behavior.
47
Integrated Model
When tested, these theories have had limited success in correlating predicted
behavior to actual behavior. These models have incorporated perceived barriers to
care; however, these theories do not fully take into account the presence of actual
barriers that would greatly impact the individual’s ability to change behavior. The
models are incomplete in not actively addressing the barriers to change for the
individual. The model presented in Figure 6 is an adapted health behavior model that
connects directly to system level input. In this model individual and system factors must
equalize before a change to appropriate use of the health care system can be made.
48

Adapted from Weinick, R.M. & Billings, J. (2003) Model of Optimal Health.
Figure 6. Adapted Health Behavior Model
49

In developing research questions and hypotheses, the proposed research project
requires the augmented model of health behavior change presented above that directly
factors in the internal and external resources available to the individual to allow and
support a change in behavior. This augmented model provides the theoretical
framework for evaluating the success of PCAN and the variables that have been
identified as important components that support the change in use of the ED for non-
urgent care to community health centers.
Hypotheses
The over-arching research question for this study is grounded in the adapted
health behavior framework that fully integrates health behavior change with systems
theory. The system being studied has incorporated operational changes in response
to feedback from individuals, providers, and policymakers. Feedback through the
system’s committee structure over the past three years has included a need for more
clinics in areas where there are greater numbers of uninsured, a need for face to face
case management to educate ED patients who could be redirected to primary care
centers, extended hours of operation in the clinics during evenings and weekends, and
appointment slots at the clinics designated for ED follow up care. Changes in the
system have been incorporated over three years, from 2001-2003.
The objective of this study is to determine the impact of the PCAN system
changes on the non-urgent utilization of the emergency departments of the county. The
study’s dependent variable is non-urgent ED visits by self-pay patients, which is
50

compared to self-pay visits at the clinics, the independent variable, to determine
whether a health behavior change has occurred. The independent variables also
include systemic factors and changes that may or may not have impacted the
dependent variable.
The primary research question to be answered is whether the PCAN system
significantly changed the non-urgent utilization of the local emergency departments by
the uninsured.
There are several hypotheses to be tested in the proposed study:
Hypothesis 1:
Ho1 There is no relationship between the number of self-pay visits at the primary care
clinics and the number of self-pay, non-urgent visits at the ED.
Ha1 There is a significant inverse relationship between the number of self-pay visits at
the primary care clinics and the number of self-pay, non-urgent visits at the ED.
The dependent variable is non-urgent visits at the ED by self-pay patients. The
independent variable is self-pay visits at the primary care clinics.
Hypothesis 2:
Ho2 There is no relationship between the distance of a primary care clinic to an ED
and the number of self-pay, non-urgent ED visits.
Ha2 There is a significant direct relationship between the distance of a primary care
clinic to an ED and the number of non-urgent ED visits by self-pay patients.
51

The dependent variable is non-urgent visits to the emergency department by self-
pay patients. The independent variable is the number of miles between each
emergency department and the nearest primary care clinic.
Hypothesis 3:
Ho3 There is no relationship between the number of hours the primary care clinics are
open and the number of self-pay, non-urgent emergency department visits.
Ha3 There is a significant inverse relationship between the number of hours primary
care clinics are open and the number of self-pay, non-urgent emergency
department visits.
The dependent variable is non-urgent visits to the emergency department by self-
pay patients. The independent variable is the number of hours the primary care clinics
are open.
Hypothesis 4:
Ho4 There is no relationship between the number of appointment slots held open for
ED follow-up and the number of self-pay, non-urgent visits to the emergency
department.
Ha4 There is a significant inverse relationship between the number of appointment
slots held open for emergency department follow-up and the number of self-pay,
non-urgent visits to the emergency department.
52
The dependent variable is non-urgent visits to the emergency department by self-
pay patients. The independent variable is the number of appointment slots in the
primary care clinics held open for emergency follow-up.
Hypothesis 5:
Ho5 There is no difference in the number of non-urgent emergency department visits
by self-pay patients whether a case manager is present or absent in the
emergency department.
Ha5 There is a significant difference in the number of non-urgent emergency
department visits by self-pay patients when a case manager is present in the
emergency department.
The dependent variable is non-urgent visits at the emergency department by self-
pay patients. The independent variables are the presence or absence of a case
manager in the emergency department.
Hypothesis 6:
Ho6 There is no difference in the number of non-urgent emergency department visits
by self-pay patients whether the case managers provide direct referrals or not to
a primary care clinic and the number of self-pay, non-urgent emergency
department visits.
Ha6 There is a significant difference in the number of non-urgent emergency
department visits by self-pay patients if the case managers provide direct
53

referrals on behalf of the non-urgent patients to a primary care clinic for follow-up
care.
The dependent variable is non-urgent visits at the emergency department by self-
pay patients. The independent variable is the presence or absence of case managers
providing direct referrals at the primary care clinics.
Table 1 lists the study variables, including the dependent variable, the
independent variables, and the control variables. There is only a single dependent
variable in this study, the number of non-urgent, self-pay ED visits.
54
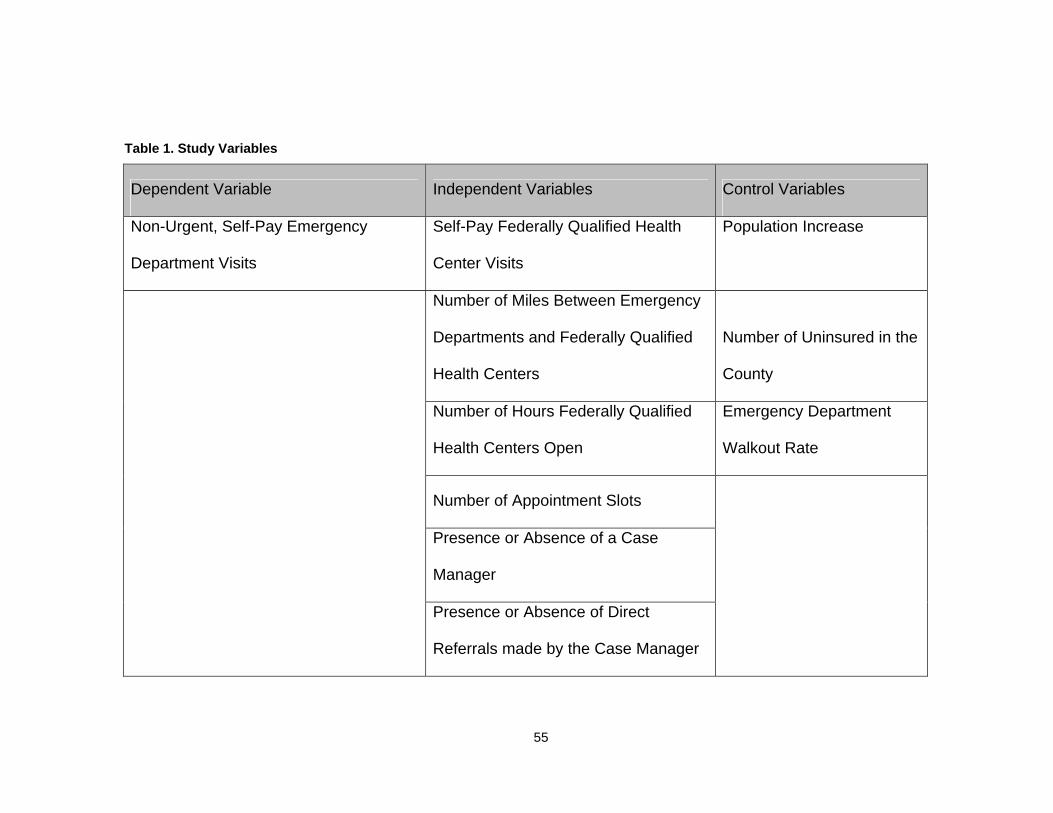
Table 1. Study Variables
Dependent Variable Independent Variables Control Variables
Non-Urgent, Self-Pay Emergency
Department Visits
Self-Pay Federally Qualified Health
Center Visits
Population Increase
Number of Miles Between Emergency
Departments and Federally Qualified
Health Centers
Number of Uninsured in the
County
Number of Hours Federally Qualified
Health Centers Open
Emergency Department
Walkout Rate
Number of Appointment Slots
Presence or Absence of a Case
Manager
Presence or Absence of Direct
Referrals made by the Case Manager
55

Figure 7 presents a diagram which illustrates the relationship of the independent
variables on the dependent variable. The system of care including the location of the
clinics, the days and hours of operation, the capacity of the system and the presence or
absence of case management are proposed to impact the use of the emergency
department by the uninsured for non-urgent purposes. This diagram recognizes that
the control variables could explain a portion of the variance measured in the number of
non-urgent, self-pay emergency department visits and could become an alternate
explanation for any variance in the data over the three-year study period.
56
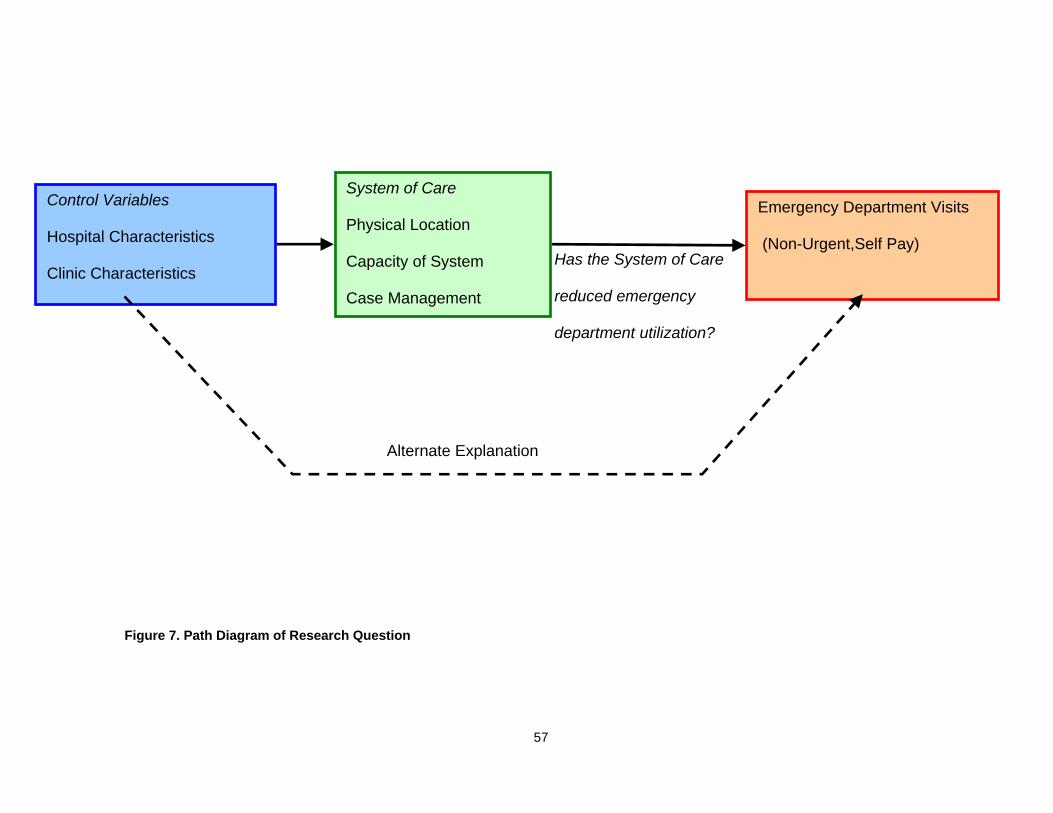
Has the System of Care
reduced emergency
department utilization?
Control Variables
Hospital Characteristics
Clinic Characteristics
System of Care
Physical Location
Capacity of System
Case Management
Emergency Department Visits
(Non-Urgent,Self Pay)
Alternate Explanation
Figure 7. Path Diagram of Research Question
57

CHAPTER IV: METHODOLOGY
Overview
This chapter outlines the design of the study as well as the measures used, the
data collection procedures, and the statistical analysis techniques. The study represents
a comprehensive assessment of a system of care in a large, metropolitan county.
Because of its scope, the study is unlike any known previous study conducted to assess
the impact of an intervention intended to reduce non-urgent utilization of the emergency
department by the uninsured. Thirty-six consecutive months of archival data were
requested by the researcher from all seven hospital emergency departments in the
county and all primary care sites for the uninsured in the county, as well. Although all
organizations cooperated fully with data collection, the researcher was unable to utilize
all data provided. This matter is discussed further in the Results and Discussion
sections of this dissertation.
The time period for the study was longer than most studies on this topic identified
in the literature review, covering a three-year span from when the primary care clinics
were being expanded and developed. At that time, the providers began working
together more collaboratively toward a common goal of decreasing emergency
department utilization by the uninsured for non-urgent care. The system of care to be
evaluated is the Primary Care Access Network (PCAN), mentioned in previous chapters.
The over-arching goal of the Primary Care Access Network’s activities has been to
58

reduce the uninsured’s utilization of the emergency departments within the county for
non-urgent purposes (Primary Care Access Network, 2001).
Research Design
The research project is structured as a formative program evaluation of a health
care system. In a formative program evaluation, the results and impact of a program
are assessed and information is fed back into the system for improvement (Wan, 1995).
PCAN members have expressed interest in receiving an assessment of the system’s
performance to determine if program objectives have been met.
The design is quasi-experimental utilizing a non-equivalent groups design. A
time-series study was conducted using ED and clinic utilization and demographic data
before and after the opening of new primary care clinics during the three-year period.
The study analyzed changes in the patterns of non-urgent utilization of the emergency
departments and self-pay clinic visits over time.
The time series design allowed for expression of the long-term trend in a
regression format, to provide a way of testing explanations for the trend, such as case
management and distance between a clinic and an emergency department. The model
will allow forecasting of future emergency department and clinic utilization.
The self-pay (uninsured) population of the emergency departments and primary
care clinics in the county covering a period of three years were compared to evaluate
whether any shifts in level of non-urgent care in the emergency departments were
assumed by the primary care clinics. The time-series design was selected as a means
59
of evaluating the impact of the primary care clinics before and after new clinics opened
because the PCAN is a “full-coverage” program designed to reach virtually all of the
county’s uninsured population.
Time series analysis is a powerful statistical procedure used to analyze historical
information, build models, and predict trends (SPSS, 2002). Time-series design is the
primary research design for evaluation of new and ongoing programs (Singleton &
Straits, 1999).
The time series design enabled the researcher to build a model to emulate the
historical trends in order to forecast the impact of future events, specifically the opening
of new primary care clinics in previously underserved area of the county within the
coming year.
Setting
In this study, “emergency departments” refers to the hospital emergency
departments within the three hospital systems in Orange County, Florida. “Primary care
clinic” refers to the community health centers, evening clinics for the working poor, an
evening clinic at one of the hospitals, the health care center for the homeless clinic, and
the county medical clinic. All primary care clinics are physically located within Orange
County, Florida. FQHC specifically refers to the subset of primary care clinics
commonly referred to as community health centers or federally qualified health centers.
60

Facility Selection
The emergency departments and primary care clinics which were selected for
this study were all safety net providers within Orange County’s PCAN system during
calendar years 2001, 2002, and 2003. The data required to answer the research
questions were obtained from the following member organizations of PCAN:
• Orlando Regional Healthcare
• Florida Hospital
• Health Central
• Community Health Centers, Inc. (comprised of four FQHC sites)
• Central Florida Family Health Centers, Inc. (comprised of two FQHC sites)
• Shepherd’s Hope, Inc.
• Health Care Center for the Homeless, Inc.
• Orange County Medical Clinic
• Community Evening Clinic (Florida Hospital).
The researcher shared with each of the PCAN organizations a list of the data
elements required to conduct the study (see Appendix A). Each organization was
asked to consider all internal compliance requirements of their independent
organizations and alert the researcher if additional approvals would be required. All of
the organizations granted written permission to the researcher to collect the data. No
61

additional approvals were identified as required or necessary by any of the participating
organizations. A copy of this permission form is included as part of Appendix B.
Subject Selection
Retrospective data were collected from the hospitals for all non-urgent, self-pay
patients treated in the emergency departments in the three-year study period. Similarly,
retrospective data were collected from the primary care clinics for all self-pay patients.
The researcher selected a time-series design to allow for a reflexive control to serve as
a comparison between the target population before and after the primary care clinics
were expanded (Rossi, Freeman & Lipsey, 1999). All patient identifiers were stripped
from the data fields to protect patient confidentiality.
Operational Definitions
Non-Urgent Care: This study looks primarily at non-urgent levels of care in one
county’s emergency departments. Grossman et al (1998) described urgent emergency
care as extended or comprehensive service in the ED with a presenting problem of high
severity and non-urgent emergency care as minimal, brief or limited service with a
presenting problem of limited to moderate severity. As described earlier, no uniform
working definition of non-urgent care has been developed which incorporates diagnosis
codes or amount of resources used by the patients during the encounter. A definition
of “non-urgent care” was provided to the researcher by each of the ED sites
participating in the study. The researcher compared the definitions and the methods
62

that the hospitals use to describe non-urgent care to report similarities and differences
between the organizations.
Emergency Department Visit/Clinic Visit: The researcher proposes to ascertain
the relationship between the number of visits to emergency departments and clinics in
Orange County, Florida by the uninsured population. An “emergency department visit”
is a one time patient encounter in a hospital emergency room. A “clinic visit” is a one
time patient encounter in a community health center or health clinic for medical or dental
purposes.
Uninsured/Self-pay: The study is particularly focused on clinic and ED utilization
by the uninsured population of Orange County. The term “uninsured” is used
interchangeably with “self-pay” and refers to the absence of third party health insurance
coverage of any kind, including Medicare or Medicaid. In the Lewin Group’s analysis of
the American Hospital Association Emergency Department and Hospital Capacity
Survey, data on “self-pay” ED visits is used as a proxy for determining the financial
impact of the uninsured on the nation’s emergency departments (Lewin Group, 2002).
Measurement Instruments
Secondary Data Collection Instruments: Two tabulation forms were developed
for use in this study. To enhance content validity, the data elements in the tabulation
forms were based on key variables found in health services research on non-urgent
utilization of emergency departments. Additionally, the tabulation forms were reviewed
by representatives from the three hospital systems and the primary care clinic contacts.
63
Hospital Data Tabulation Form: A fourteen-item tabulation form (“Instrument 1”)
has been developed to compile data from ED archival records (see Appendix C).
Demographic information includes data describing the ED visits in total and for the non-
urgent, self-pay patients, the staffing in the ED and the average cost of an ED visit. No
patient identifying information was to be recorded in order to preserve subject
anonymity and ensure compliance with the Health Insurance Portability and
Accountability Act of 1996 (HIPAA).
As part of Instrument 1, the emergency departments provided information about
whether a case manager was on staff to work with uninsured patients and what hours
the case management staff members were available. As discussed in the literature
review, several communities have added staff to work with the uninsured and/or the
non-urgent patients that come to the emergency departments to schedule follow-up
visits in alternate settings in order to decrease return visits. The presence or absence
of a case manager at the emergency departments was identified as a component of the
statistical analysis to ascertain whether the hospitals with case managers experienced a
significant difference in non-urgent visits than those hospitals that did not have case
managers.
If there was a dedicated case manager on staff, the emergency departments also
included in Instrument 1, information about the number of hours and days a week that
the case manager worked in the emergency department. The review of the literature
revealed that individuals often come to the ED for non-urgent purposes during evening
and weekend hours so as not to miss work or school. The presence of case managers
in these “off hours” often facilitates the ability to redirect and educate patients to use
64

primary care clinics. The level of case manager staffing was also identified as a
component of the analysis to determine whether a relationship exists between the level
of effort and any reduction in non-urgent utilization of the emergency departments over
the study period.
The emergency departments reported in Instrument 1 the job duties of the case
manager. The instrument included questions about whether instructions are given to
uninsured patients to return to the ED for follow-up care and if so, in what instances
those instructions are given. Similarly, the emergency departments also provided
information as to whether the emergency departments gave instructions to the
uninsured patients to obtain follow-up care at local primary care centers and if they did,
whether a direct referral or appointment was made or whether information was provided
so that the patient might schedule follow-up on their own. This information was also
factored into the analysis to determine whether the extent of the interaction with the
uninsured has a significant impact on the number of ED visits.
The emergency departments used Instrument 1 to record the number of self-pay
ED visits by month for calendar year 2001, calendar year 2002, and calendar year 2003.
This data included all levels of severity of care delivered to self-pay patients during this
time period so as to determine what percentage of total self-pay visits were non-urgent
in nature.
As described in the literature review, there is no uniform system for identifying
non-urgent care. The emergency departments were asked to identify the method of
determining a non-urgent level of care.
65

The emergency departments provided the number of self-pay, non-urgent visits
by month for every zip code in Orange County, as well as categories for “all other
counties in Florida”, “all other states”, and “out of the country.” The number of visits in
the zip code areas was analyzed to determine whether there was any differentiation in
impact of the primary care clinics within the county.
Gender, age, race and ethnicity information was also provided using Instrument 1
for the non-urgent, self-pay population. The age categories were reported as follows:
less than 5 years of age; 6-14 years of age; 15-24 years of age; 25-44 years of age; 45-
64 years of age; and greater than 64 years of age. Race/ethnicity information was
requested by the following categories: White Non-Hispanic; White Hispanic; Black Non-
Hispanic; Black Hispanic; Asian/Pacific Islander; American Indian/Eskimo/Aleutian; and
other. This information was used to profile the populations in the emergency
departments and clinics to determine whether there were any significant shifts in the
patient profile during the study period.
The emergency departments also provided the walkout rate for each month of
the study period. “Walkout rate” refers to the percentage of ED patients who check in to
the ED for treatment but do not stay to see a physician. These data were used as
control variables to ensure that the rate of non-urgent visits did not drop because
individuals with non-urgent conditions left without being seen by a physician.
Finally, for Instrument 1, the average charge for a non-urgent visit at the hospital
was provided. This information was used to conduct a financial analysis comparing the
charge of non-urgent care in the ED with the charge of primary care visits in the clinics.
A copy of this instrument is included in Appendix C.
66

Primary Care Clinic Data Tabulation Form: A second instrument was developed
to facilitate collection of the primary care clinic utilization data (see Appendix D). The
information reported by the primary care sites was compared to the non-urgent self-pay
visits in the ED. The instrument is composed of twelve questions and requests
utilization, demographic and cost information. No patient identifying information was to
be included, for the same reason stated above.
The primary care clinics provided the date that the clinic opened. This
information is essential to the time-series design of the study in order to compare the
utilization data from the emergency departments and the clinics before and after the
clinics opened.
The clinics also provided the days and the hours of operation. This information
was used to determine whether there is a significant relationship between the number of
hours the clinics are open and the number of ED visits.
The clinics also provided information about whether they hold appointments in
their schedule for ED follow-up and how many slots. The clinics are also asked to
identify for which hospitals this arrangement is in place. This information was used to
determine whether there was a significant relationship between the number of
appointments blocked for ED follow-up and the number of ED visits. The clinics
identified the percentage of patients that keep their follow-up appointments.
The clinics reported the number of self-pay visits from January 2001 through
June 2003 by month. This information was reported using the same format for patient
origin as in Instrument 1.
67
Finally, the clinics provided the average charge for a primary care visit. This
information was used to develop the financial impact of providing primary care in the
clinics rather than the emergency departments.
Feedback Questionnaire: The PCAN Board of Directors meets monthly to
discuss strategic and operational issues. The researcher presented the findings of the
study at the January 2005 Board meeting and asked the Board members in attendance
to respond to a short questionnaire about the planning implications of the study (see
Appendix E).
The Board of Directors is comprised of 20 member organizations. The short
questionnaire requested anonymous responses to questions about whether the data
presented were consistent with expectations, whether the information presented in the
study will be used in future planning for each organization, and whether the study
should be conducted on a regular basis as part of the PCAN program evaluation. The
responses to the questionnaire have been shared with the PCAN Board and
incorporated into Chapter V of this dissertation. The key points of the discussion held
during the presentation are presented in Chapter VI of this dissertation.
Procedure
Prior to conducting this study, application and subsequent approval by the
University Institutional Review Board (IRB) was secured in July 2004. Following
approval from the University’s IRB, these instruments were pilot tested. No changes to
68

the forms were made. If changes had been made to the instrument(s), a subsequent
addendum would have been filed with the IRB.
In order to increase inter-organizational reliability, Instruments 1 and 2 were
presented to the PCAN Data, Research and Evaluation committee members, following
approval from the University’s IRB to proceed with data collection. The researcher
described the procedure for completing the forms to the committee members. Prior to
implementing the full study, a pilot study was conducted. Staff from one hospital and
one clinic completed the secondary data collection forms. Additional explanation was
needed to receive accurate data from the hospital respondent. The hospital system had
provided the two emergency departments’ data in one combined file. The FQHC data
were received in the correct format. Subsequently, the researcher emphasized to the
other hospitals that data were needed by hospital and not by system. The researcher
determined that the data provided by the hospital and the clinic met the requirements of
the study and no adjustments to the forms were needed.
Demographic data were abstracted from clinic and hospital medical records for
calendar years 2001, 2002, and 2003 including age, race and ethnicity, and zip code of
origin and reported in Instruments 1 and 2. All patient identifiers were stripped from the
data abstracts sent to the researcher by the hospitals and clinics to ensure compliance
with the requirements of HIPAA.
Visit and demographic data from the primary care clinics were verified with
reports and grant applications submitted to the federal office of the Bureau of Primary
Health Care in Health Resources and Services Administration as well as reports
submitted to Orange County Government, Division of Health and Family Services.
69

Visit and demographic data from the hospital emergency departments were
verified to the extent possible with quarterly utilization reports submitted to the Health
Council of East Central Florida as part of a the hospital’s reporting requirement to the
State of Florida’s Agency for Health Care Administration as well as cost reports sent
directly to the Agency from the hospitals. The data from one hospital followed a very
different pattern from the other six hospitals from the above-mentioned reports and the
researcher noted that difference for discussion with the PCAN Board of Directors.
Data Analysis
A time series model was developed using SPSS 12.0 Base software to follow the
progression of the PCAN project over its first three years on a month by month basis.
This model was constructed to ensure that the timing of when the primary care clinics
became operational was appropriately factored into the analysis. The model allows
analysis of the ED data before all the primary care clinics were expanded in order to
project ED utilization without the expansion of the primary care clinics. This projection
of ED visits was compared with the actual trend of ED visits.
Using the data collected from the emergency departments and the primary care
clinics, the relationship was tested by building a regression model as well as by utilizing
various statistical techniques including Analysis of Variance (ANOVA) to examine
whether a causal relationship exists between ED visits and primary care clinic visits.
Factors which could impact the ability to establish a significant relationship
between the behavior of uninsured patients in the county and their use of the clinics and
70

the emergency departments were incorporated into the model. For example, the
increased growth in population in the county could impact the researcher’s ability to
evaluate utilization of the emergency departments. Increases in population are
correlated with increases in ED utilization (Reeder, Locascio, Tucker, Czaplijski, Benson
& Meggs, 2002). The estimated population of Orange County in 2001, 2002 and 2003
were entered into the regression model as a control variable. These estimates come
from the Bureau population estimates which can be obtained from the Census website
(U.S. Census Bureau, 2004).
Similarly, the regression model accounted for the increased growth in the number
of uninsured in Orange County. The local estimates of the uninsured in 2001, 2002 and
2003 discussed previously were factored into the statistical analysis.
As the number of individuals using the ED increases from year to year, it is also
important to factor in walkout rates in the emergency departments month to month.
Oftentimes a patient will leave the ED before being seen for care because the wait has
been too long or they have started to feel better (Baker, Stevens & Brook, 1991;
Bindman, Grumbach, Keane, Rauch & Luce, 1991; Fernandes, Price & Christensen,
1997). The researcher assumed that non-urgent patients may be deterred from staying
at the emergency departments if the wait time is lengthy and it could be for this reason
that the emergency departments experienced a change in volume of non-urgent ED
visits and not because of the availability of expanded primary care clinics in the
community. This assumption is based on the survey of the literature, which revealed
that individuals using the ED for non-urgent purposes often do so because they do not
71
want to wait to see a physician in an office or clinic (Baker et al., 1991; Bindman et al;
1991; Fernandes et al., 1997).
The emergency departments calculate the walkout rate on a continuous basis
and reported this information by month for this study. Controlling for this variable
improves the ability to determine how emergency department volumes and clinic
volumes are related.
Additionally, a map was generated showing the location of the clinics against the
rate of uninsured population in each zip code to determine whether the clinics have
been located close to areas of need. Another map was generated to show the percent
change in non-urgent ED visits by zip code area from the beginning of the study period
to the end of the study period against the location of the clinics.
The distance in miles between the emergency departments and the nearest
primary care clinic were compared with the non-urgent visit data to ascertain whether
there was a critical distance relationship between any shifts in use of the emergency
departments to the clinics.
Statistical analysis was conducted to determine whether or not the observed ED
utilization is sufficiently different from the projection to justify a conclusion that the
primary care clinics exerted an effect. The descriptive demographic data for the ED
and clinic patients were also compared to determine whether any significant changes in
mix of ED patients were correlated to any changes in the clinic patients and vice versa.
The hospital participants in the study were asked to provide a definition or
methodology for identifying non-urgent care. A presentation of the varying definitions
72

may provide an opportunity for PCAN to standardize the definition between
organizations and improve the ability to compare data in the future.
The financial data received from the emergency departments and primary care
clinics in the county enabled the development of a simple financial analysis to be
undertaken comparing the charge for non-urgent care in the emergency department to
care in the primary care setting. This data were requested in the event that a significant
relationship is established that supports the suggestion that the primary care clinics are
now providing care to the patients that were formerly seen in the emergency
departments for non-urgent purposes.
After the data were analyzed and the financial analysis was completed, an
overview of the results of the study was presented to the PCAN Board of Directors. All
PCAN Board meetings are taped which allowed the comments and questions to be
transcribed and incorporated into the Discussion section of this document. The
researcher asked the Board members to complete the short questionnaire concerning
the planning implications of the study results.
Timetable
The researcher received approval from the University’s Institutional Review
Board in July 2004. A copy of the approval letter is included in Appendix F. Pilot data
were collected in August through September 2004 with full data collection and analysis
completed in January 2005.
73

Summary
The purpose of this study is to determine whether a coordinated and
comprehensive system of primary care clinics for the uninsured has significantly
impacted non-urgent utilization of the emergency departments by the uninsured, the
primary goal of the initiative. Thirty-six consecutive months of utilization data were
collected from the emergency departments and primary care clinics in Orange County,
Florida and analyzed using regression and non-parametric techniques. The study
attempts to incorporate each organization’s unique strategies for increasing access to
care for the uninsured in the primary care setting into the model, including dedicated
case management staff and extended hours of operation in the primary care clinics.
The model can be used for future evaluation of the effort as well as forecasting the
impact of additional clinics in the system.
74

CHAPTER V: RESULTS
This chapter provides the results of the statistical analysis related to the study
hypotheses. In addition, information is presented describing and comparing the
demographic characteristics of the emergency department non-urgent, self-pay and
clinic self-pay populations.
Data were received from the seven hospitals and fourteen primary care clinics in
Orange County, Florida for calendar years 2001, 2002 and 2003. Data received from
six emergency departments were analyzed for this study. One of the hospitals was
unable to provide correctly coded data in the requested format for the full three year
period. This hospital corrected coding problems in the summer of 2002 related to
assigning level of severity to ED patients, but unfortunately could not provide accurate
data for the first eighteen months of the study period at the time of request. As such,
this hospital’s data are not used in this project. A follow up study incorporating their
data set will be conducted once the retrospective, manually tabulated data for this time
period are received.
Data received from all six of the FQHC’s that were in operation for the study
period were analyzed for this study. The non-FQHC clinics were not all able to provide
zip code level data and some were not able to provide the visit data by month or by
demographic category as they had agreed and intended. These clinics include the
faith-based evening clinics, the community based evening clinic, the government free
clinic and health center for the homeless. Annual visit data were available for all of
75

these clinics. As such, the data received from the non-FQHC clinics are used in a
descriptive manner and not in the statistical analysis.
The resulting data set is comprised of six hospital emergency departments and
six FQHC’s covering all zip code areas in Orange County. This data set and analysis
remain a strong, representative sample of the full PCAN system of care with 66,141
non-urgent, self-pay visits at the six hospitals for the three year study period and
164,051 self-pay visits at the FQHC’s.
It was important at the outset of the analysis to ascertain the number of
uninsured individuals in Orange County, Florida at the beginning of the study period and
at the end of the study period. Concern was expressed early in the development of this
study that any impact of the PCAN effort on ED utilization might be masked by the
growing number of uninsured in the area. As such, the number of uninsured was
established for use as a control variable in the study.
As described in Chapter I of this dissertation, there are several methodologies for
estimating the number of uninsured. The researcher chose to use the most recent FHIS
results, which were released late in 2004, to make that estimation.
The FHIS estimates of the uninsured from 1999 and 2004 were used to
determine the number of uninsured in Orange County for the study time period. The
difference in percentage between 2004 and 1999 was evenly spread from year to year,
which came to an increase of 0.7 percent each year. Table 1 shows the calculation of
these estimates. This information is provided to show that during the study period of
January 1, 2001 through December 31, 2003, there was an increase of over 30,000
uninsured individuals in Orange County, Florida.
76

Table 2. Number of Uninsured in Orange County, Florida
Percent Uninsured Estimated Population Estimated Number of Uninsured
1999 15.2% 817,206 124,215
2000 15.9% 902,318 143,469
2001 16.6% 926,499 153,799
2002 17.3% 944,499 163,398
2003 18.0% 964,865 173,676
2004 18.7% 1,013,937 189,606
Source: Duncan et al, 2004.
77

The 2004 FHIS estimates have yet to be released at a zip code level. The 1999
zip level estimates were analyzed to ascertain any difference in distribution of the
uninsured within Orange County. Figure 8 depicts the distribution of the uninsured in
Orange County by zip code level. The shading in white indicates areas where no
estimate was calculated for that zip code in 1999. The darker the green shading, the
higher the percent of uninsured in that zip code area. The colored dots on the map
indicate the locations of the FQHC’s.
78
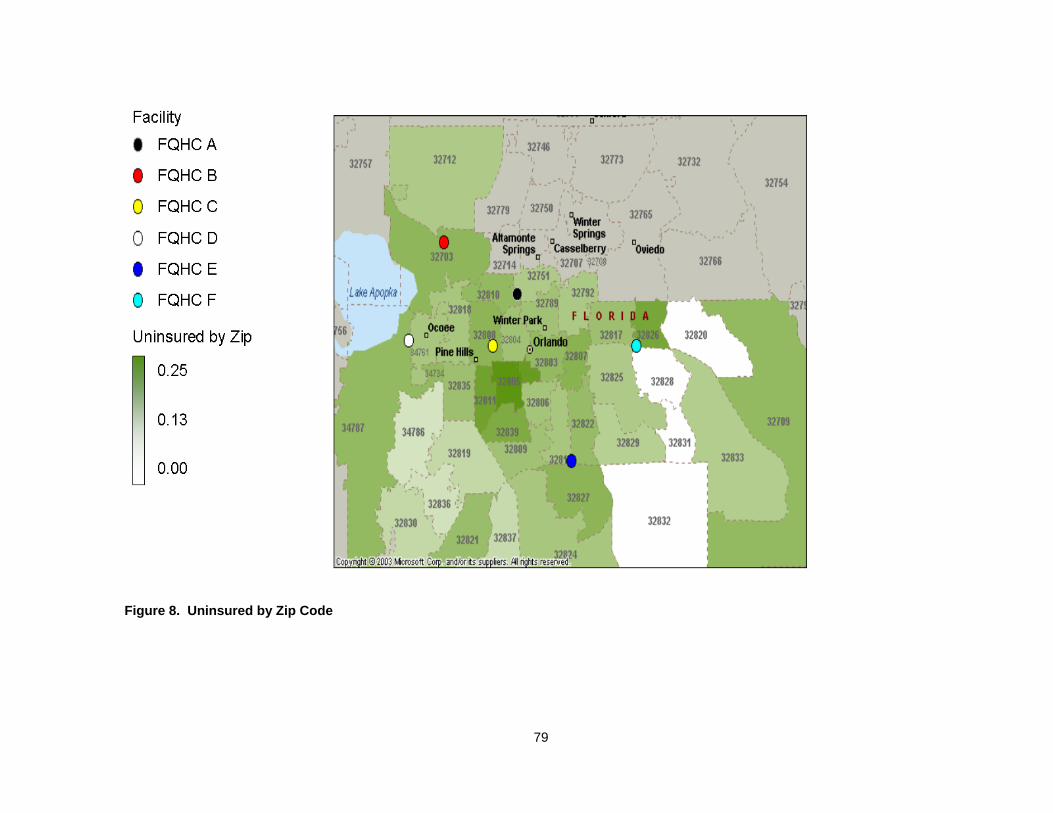
Figure 8. Uninsured by Zip Code
79

As described in Chapter 1, there is no universal definition of non-urgent care,
which weakens the comparison from hospital to hospital and system to system. It was
important to analyze the difference between the definitions used by the study hospitals
to ascertain whether the data provided by each hospital would be comparable.
As requested, the three hospital systems in the study provided their
organizations’ working definition of “non-urgent” care. The definitions are presented in
Table 2. Within each hospital system, the unique hospitals used the same definition of
non-urgent care. For example, Hospital System 1 has two hospital emergency
departments in Orange County and both use the definition noted in Table 2.
The process of identifying non-urgent patients is a two step process for both
Hospital System 1 and Hospital System 2. Upon presenting to the ED, the triage nurses
assign a level of severity to the patients. After care is delivered, the financial office
finalizes the level of urgency in the patient record by looking at the resources utilized to
care for that patient. If the charges for the procedures undertaken during the visit
exceed a certain level, the level of urgency is then elevated. The researcher did not
request that each hospital provide the financial limit associated with non-urgent care in
the ED.
Hospital System #3’s procedure for identifying level of severity occurs within the
nursing function. First, the triage nurse assigns a level of severity and then the treating
nurse adjusts the level of severity, if necessary. The financial staff does not calculate
urgency in a third step.
80

Table 3. Non-Urgent Definitions
Hospital System 1
Definition: Level I – non-urgent – presenting problems are usually self-limited or minor. Level II – presenting problems are usually low to moderate severity.
Determination Made By: Nursing – assigns acuity level Financial Planning codes urgency based on procedures performed.
Hospital System 2 Level I and Level II – “conditions presenting as an illness or injury requiring intervention. Usually associated with mild to moderate distress or discomfort.”
Same as above.
Hospital System 3 “Any illness/injury, usually self-limiting in nature where an indefinite delay in treatment will not result in the deterioration of the patient’s condition.”
Triage Nurse – then treating nurse verifies level of severity.
81

The working definitions of non-urgent care are very similar from hospital system
to hospital system. The process for finalizing the assignment of level of severity is also
similar in two of three hospital systems. These two similar systems include the six
hospital emergency departments whose data are analyzed in this study. This similarity
between the systems strengthens the analysis undertaken, as the data collected are
defined in much the same manner. However, future evaluation of non-urgent care
statistics between the hospital systems should consider comparison of the financial
limits associated with non-urgent care in the ED.
Demographics
Demographic data were collected to develop a profile of the population before
PCAN created a coordinated system of care and a profile of the population once the
system of care became well established.
There were 66,141 self-pay, non-urgent visits at the six hospitals and 164,051
self-pay visits at the FQHC’s. Gender, age, and race/ethnicity were reported for each of
these visits. The age was reported within a range: 0-5 years of age; 6-14 years of age;
15-24 years of age; 25-44 years of age; 45-64 years of age; and 65 years of age and
older. Race and ethnicity was requested in seven categories: White/Non-Hispanic,
White/Hispanic, Black/Non-Hispanic, Black Hispanic, Asian/Pacific Islander, American
Indian/Eskimo/Aleutian Islander and Other. The pilot hospital system and clinic
82

appropriately provided the data in these categories; however, the remaining hospitals
and clinics reported the data in only five categories, as follows: White/Non-Hispanic,
Black/Non-Hispanic, Hispanic, Asian/Pacific Islander and Other. The categories from
the pilot data were able to be combined to reduce from the seven requested categories
to the five categories. Gender was reported as male or female.
The analysis compares the demographics of the first quarter of the study period
(January 2001, February 2001, and March 2001) at the ED’s and FQHC’s to the
demographics of the last quarter of the study period (October 2003, November 2003,
and December 2003). In the first quarter of 2001, PCAN was established. Little
coordination was in place between and among providers prior to that time. Through the
remainder of 2001, the partners strengthened the collaboration. PCAN doubled the
number of clinics by the beginning of 2002. PCAN members continued to develop the
collaborative through the subcommittee structure in 2002 and 2003. For the
demographic analysis, the first quarter of 2001 population is referred to as the pre-test
sample and the last quarter 2003 population is referred to as the post-test sample.
The pre-test and post-test samples were compared to determine whether there
was a significant difference in the population at the emergency departments and the
clinics at the beginning of the study period and the end of the study period. As
described in Chapter II, certain subpopulations tend to utilize the emergency
departments for non-urgent care at a higher rate than others. The analysis was
conducted to determine whether the behavior of these subpopulations had significantly
changed with the inception of the PCAN effort. The characteristics analyzed included
age, gender, and race/ethnicity.
83

Age comparison: The frequency of age range for the non-urgent, self-pay ED
visits for all six hospitals for the pre-test and post-test populations is depicted in Table 3.
The most frequently occurring age category was 25-44 years of age, followed by 15-24
years of age in both the pre-test and post-test populations.
The population in the ED post-test had proportionately fewer children (0-14 years
of age) and adults aged 25-44 years of age, leaving an increased presence of 15-24
year olds, 45-64 year olds and elderly (65+ years of age).
84

Table 4. Age Comparison - Emergency Department Pre-test/Post-test
0-5
years
6-14
years
15-24
years
25-44
years
45-64
years
65+
years Total
Pre-test
1,060 visits
(16.5%)
567 visits
(8.8%)
1,483 visits
(23.1%)
2,574 visits
(40.0%)
668 visits
(10.4%)
70 visits
(1.1%) 6,422 visits
Post-test
673 visits
(15.5%)
352 visits
(8.1%)
1,070 visits
(24.6%)
1,724 visits
(39.6%)
508 visits
(11.7%)
29 visits
(0.7%) 4,356 visits
Total 1,733 visits 919 visits 2,553 visits 4,298 visits 1,176 visits 99 visits 10,778 visits
85

Chi-square calculations were performed using the frequencies shown in Table 3
to determine whether the ED population was significantly different in age composition
from the beginning of the study period (the first quarter of 2001) to the end of the study
period (the last quarter of 2003). A significant difference between the pre-test and post-
test population suggests a change in the population using the emergency department
for non-urgent care.
The results of the Chi-square analysis are:
• Degrees of freedom: 5
• Chi-square = 14.91
• p is less than or equal to 0.05.
Thus, the difference in distribution of age in the above comparison of the pre-test
and post-test populations in the ED is statistically significant.
The frequency of age range for the FQHC visits for the pre-test and post-test
populations is depicted in Table 4. The most frequently occurring age category was
45-64 years of age, followed by the 25-44 year age category.
The population in the FQHC’s post-test had proportionately fewer very young
children (aged 0-5 years) and 25-44 year olds. The post-test population in the FQHC’s
had proportionately higher 6-14 year olds, 15-24 year olds, 45-64 year olds and elderly
(aged 65+)
86

Table 5. Age Comparison - Clinic Pre-test/Post-test
0-5
years
6-14
years
15-24
years
25-44
years 45-64 years 65+ years Total
Pre-test
960 visits
(10.7%)
571 visits
(6.4%)
595 visits
(6.6%)
3,035 visits
(33.8%)
3,108 visits
(34.6%)
709 visits
(0.8%) 8,978 visits
Post-
test
1,677 visits
(10.1%)
1,188 visits
(11.4%)
1,731 visits
(10.5%)
5,054 visits
(30.5%)
6,418 visits
(38.7%)
498 visits
(3.0%) 16,566 visits
Total 2,637 visits 1,759 visits 2,326 visits 8,089 visits 9,526 visits 1,207 visits 25,544 visits
87

Chi-square calculations were performed using the frequencies shown in Table 4
to determine whether the FQHC population was significantly different in age
composition from the beginning of the study to the end of the study.
The results of the Chi-square analysis are:
• Degrees of freedom: 5
• Chi-square = 442.09
• p is less than or equal to 0.001.
Thus, the difference in distribution of age in the above comparison of the pre-test
and post-test population is statistically significant.
The frequency of gender for the ED visits for the pre-test and post-test
populations is depicted in Table 5. The most frequently occurring gender category was
males in both the pre-test and post-test populations.
The pre-test population in the ED was predominately male at over 56 percent).
The post-test population in the ED is reflective of the mix of the general population, at
nearly 50 percent for both men and women.
88

Table 6. Gender Comparison - Emergency Department Pre-test/Post-test
Males Females Total
Pre-test
3,956 visits
(56.4%)
3,061 visits
(43.6%) 7,017 visits
Post-test
2,103 visits
(51.0%)
2,023 visits
(49.0%) 4,126 visits
Total 6,059 visits 5,084 visits 11,143 visits
89

Chi-square calculations were performed using the frequencies shown in Table 5
to determine whether the ED population was significantly different in gender
composition from the start of the study period to the end of the study period.
The results of the analysis are:
• Degrees of freedom: 1
• Chi-square = 30.63
• p is less than or equal to 0.001.
Thus, the difference in distribution of gender in the above comparison is
statistically significant.
The frequency of age range for the FQHC visits for the pre-test and post-test
populations is depicted in Table 6. The most frequently occurring gender category was
females in both the pre-test and post-test populations.
The post-test FQHC sample shows a proportional increase in men and a
decrease in women.
90

Table 7. Gender Comparison, Clinic Pre-test/Post-test
Males Females Total
Pre-test
2,279 visits
(26.7%)
6,266 visits
(73.3%) 8,545 visits
Post-test
5,214 visits
(30.7%)
11,760 visits
(69.3%) 16,974 visits
Total 7,493 visits 18,026 visits 25,519 visits
91

Chi-square calculations were performed using the frequencies shown in Table 6
to determine whether the FQHC population was significantly different in gender
composition from the start of the study to the end of the study period.
The results of the analysis are:
• Degrees of freedom: 1
• Chi-square: 44.88
• p is less than or equal to 0.001.
Thus, the difference in distribution of gender in the above comparison is
statistically significant.
The frequency of race/ethnicity distribution for the ED visits for the pre-test and
post-test populations in depicted in Table 7. The most frequently occurring
race/ethnicity category was the White, Non-Hispanic population in both the pre-test and
post-test populations.
The ED post-test population experienced a slight drop in percentage of White,
non-Hispanic, Black, non-Hispanic, and Asian population from the pre-test population.
92

Table 8. Race Comparison - Emergency Department Pre-test/Post-test
White,
Non-Hispanic
Black,
Non-Hispanic Hispanic Asian Other Total
Pre-test
2,880 visits
(44.9%)
1,716 visits
(26.7%)
1,545 visits
(24.1%)
58 visits
(0.9%) 223 (3.5%) 6,422 visits
Post-test
1,859 visits
(42.7%)
1,124 visits
(25.8%)
1,158 visits
(26.6%)
28 visits
(0.6%) 186 (4.3%) 4,355 visits
Total 4,739 visits 2,840 visits 2,703 visits 86 visits 409 10,777 visits
93

Chi-square calculations were performed using the frequencies shown in Table 7
to determine whether the ED population was significantly different in race/ethnicity
composition from the start of the study period to the end of the study period.
The results of the analysis are:
• Degrees of freedom: 4
• Chi-square = 16.77
• p is less than or equal to 0.01.
Thus, the difference in distribution of race/ethnicity in the above pre-test and
post-test comparison is statistically significant.
The frequency of race/ethnicity distribution for the FQHC visits for the pre-test
and post-test populations in depicted in Table 8. The most frequently occurring
race/ethnicity category was the Hispanic population in both the pre-test and post-test
populations.
The FQHC post-test population experienced large changes in all race and
ethnicity categories with the largest change being an increase from 41.9% to 52.57% in
Hispanic patients from 2001 to 2003.
94

Table 9. Race Comparison, Clinic Pre-test/Post-test
White, Non-Hispanic Black, Non-Hispanic Hispanic Asian Other Total
Pre-test
2,119 visits
(24.1%)
2,296 visits
(26.1%)
3,683 visits
(41.9%)
70 visits
(0.8%)
614 visits
(7.0%) 8,782 visits
Post-test
2,941 visits
(17.8%)
3,232 visits
(19.6%)
8,666 visits
(52.6%)
446 visits
(2.7%)
1,200 visits
(0.7%) 16,485 visits
Total 5,060 visits 5,528 visits 12,349 visits 516 visits 1,814 visits 25,267 visits
95

Chi-square calculations were performed using the frequencies shown in Table 8
to determine whether the FQHC population was significantly different in race/ethnicity
composition from the start of the study period to the end of the study period.
The results of the analysis are:
• Degrees of freedom: 4
• Chi-square = 460.44
• p is less than or equal to 0.001.
Thus, the difference in distribution of race/ethnicity in the above comparison is
statistically significant.
96
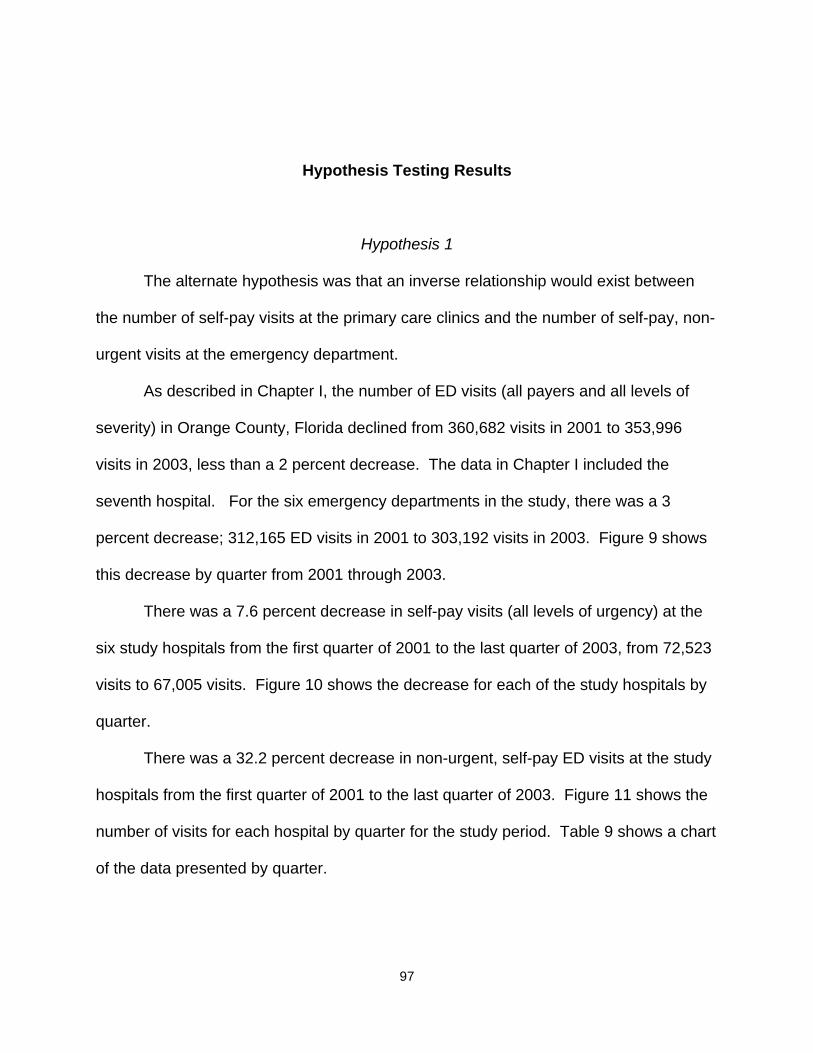
Hypothesis Testing Results
Hypothesis 1
The alternate hypothesis was that an inverse relationship would exist between
the number of self-pay visits at the primary care clinics and the number of self-pay, non-
urgent visits at the emergency department.
As described in Chapter I, the number of ED visits (all payers and all levels of
severity) in Orange County, Florida declined from 360,682 visits in 2001 to 353,996
visits in 2003, less than a 2 percent decrease. The data in Chapter I included the
seventh hospital. For the six emergency departments in the study, there was a 3
percent decrease; 312,165 ED visits in 2001 to 303,192 visits in 2003. Figure 9 shows
this decrease by quarter from 2001 through 2003.
There was a 7.6 percent decrease in self-pay visits (all levels of urgency) at the
six study hospitals from the first quarter of 2001 to the last quarter of 2003, from 72,523
visits to 67,005 visits. Figure 10 shows the decrease for each of the study hospitals by
quarter.
There was a 32.2 percent decrease in non-urgent, self-pay ED visits at the study
hospitals from the first quarter of 2001 to the last quarter of 2003. Figure 11 shows the
number of visits for each hospital by quarter for the study period. Table 9 shows a chart
of the data presented by quarter.
97
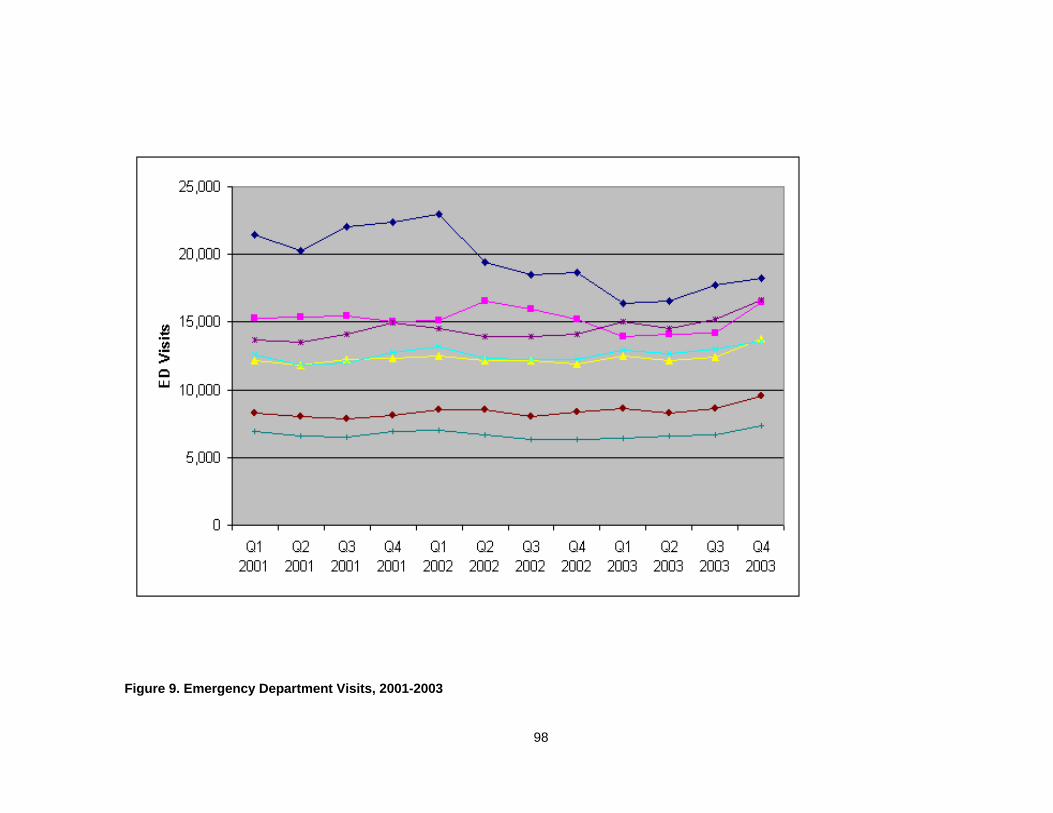
Figure 9. Emergency Department Visits, 2001-2003
98

Figure 10. Self-Pay Emergency Department Visits, 2001-2003
99
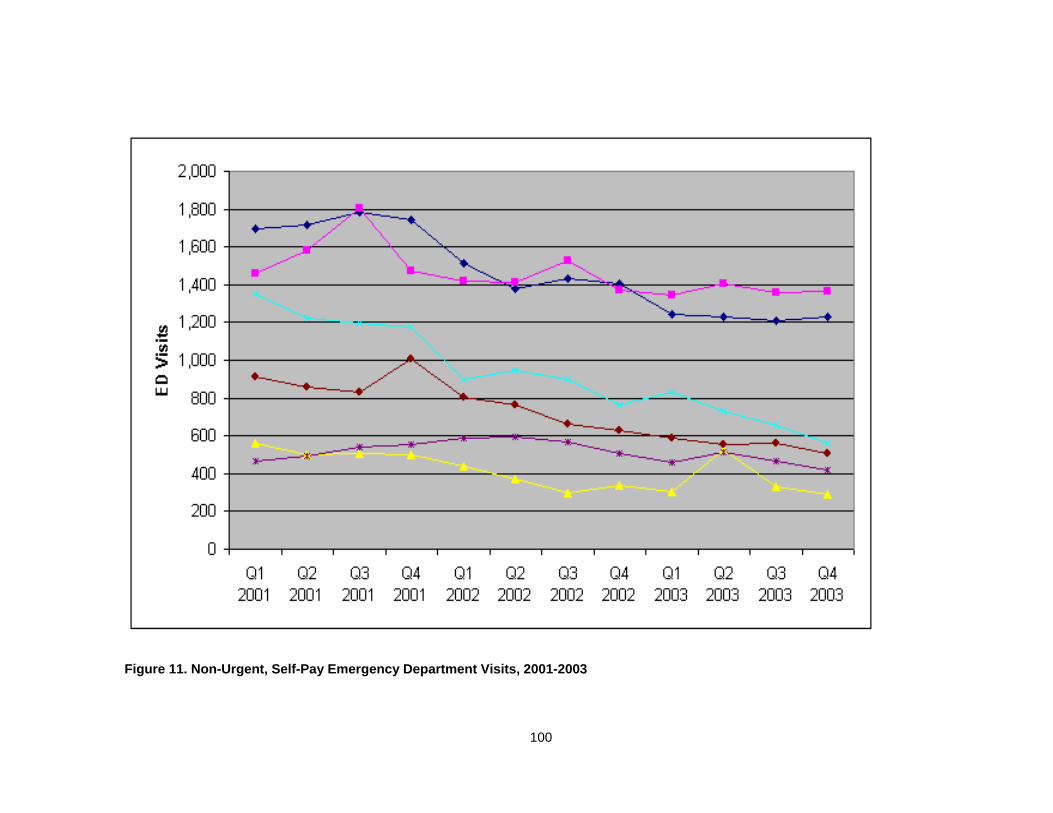
Figure 11. Non-Urgent, Self-Pay Emergency Department Visits, 2001-2003
100

Table 10. Non-Urgent, Self-Pay Emergency Department Visits by Quarter
Q1
2001
Q2
2001
Q3
2001
Q4
2001
Q1
2002
Q2
2002
Q3
2002
Q4
2002
Q1
2003
Q2
2003
Q3
2003
Q4
2003
HOSP A 1,462 1,578 1,802 1,471 1,421 1,410 1,529 1,370 1,345 1,403 1,355 1,365
HOSP B 1,696 1,717 1,785 1,745 1,513 1,381 1,435 1405 1,243 1,229 1,212 1,232
HOSP C 560 502 506 500 441 370 299 338 306 530 331 292
HOSP D 912 855 831 1,004 805 764 663 627 585 557 560 506
HOSP E 1,351 1,224 1,195 1,176 897 945 901 766 829 733 655 559
HOSP F 469 496 538 554 589 592 567 505 460 511 465 416
6,450 6,372 6,657 6,450 5,666 5,462 5,394 5,011 4,768 4,963 4,578 4,370
101

The hospitals report the number and percentage of patients admitted to the
hospital from the ED for use by the local health planning agency as well as the State of
Florida in conducting needs assessments for facility planning and Certificate of Need
determinations. These data were retrieved for comparison to the data collected in this
study. The percentage of ED patients admitted to the hospital increased from 15.9
percent in the first quarter of 2001 to 18.4 percent in 2003 in the six emergency
departments in this study (Health Council of East Central Florida, 2005).. This increase
represents a higher level of severity being treated in the emergency departments at the
end of the study period (Health Council of East Central Florida, 2005).
The data from the clinics were then analyzed to determine whether there was a
related increase in utilization by self-pay patients from 2001 through 2003. The clinics
treat patients with and without health coverage, both private and public.
During the study period, three new FQHC’s opened in Orange County, Florida.
The number of self-pay visits at the FQHC’s in Orange County increased from 8,885
visits in the first quarter of 2001 to 16,974 in the last quarter of 2003. Figure 12 depicts
that increase in FQHC’s visits over the study period. The self-pay quarterly utilization of
the FQHC’s is shown in Table 10.
102

Figure 12. Clinic Self-Pay Visits, 2001-2003
103

Table 11. Clinic Self-Pay Visits by Quarter
Q1
2001
Q2
2001
Q3
2001
Q4
2001
Q1
2002
Q2
2002
Q3
2002
Q4
2002
Q1
2003
Q2
2003
Q3
2003
Q4
2003
FQHC A 0 0 32 294 577 843 839 1,028 1,056 1,133 1,269 1,387
FQHC B 2,143 2,467 1,878 1,785 1,770 2,039 2,066 2,088 2,252 2,384 2,220 2,235
FQHC C 2,248 2,437 1,926 2,234 2,445 2,524 2,930 3,085 3,995 4135 4,142 4,337
FQHC D 4,494 4,404 4,170 3,936 4,483 4,476 4,495 4,670 5,030 5,321 4,999 4,809
FQHC E 0 0 0 0 2,705 3,079 3,413 2,733 2,822 3,259 3,423 2,360
FQHC F 0 0 0 1,490 1,340 1,389 1,688 1,605 1,852 1,729 1,808 1,846
8,885 9,308 8,006 9,739 13,320 14,350 15,431 15,209 17,007 17,961 17,861 16,974
104

Figure 13 shows the quarterly utilization of the FQHC’s and ED’s over the study
period. The range of values on this graph must be noted when considering the trend
line comparison. This graph depicts the non-urgent, self-pay trend in the six emergency
departments combined and the self-pay visits at the six FQHC’s combined. The
expansion of the FQHC’s occurred in the last quarter of 2001 and early in 2002. Three
new FQHC’s opened in that time period.
105

Figure 13. Clinic and Emergency Department Visit Comparison
106

The map in Figure 14 shows the percentage decrease in non-urgent, self-pay
visits in the six emergency departments from the first quarter of 2001 to the last quarter
of 2003. If a zip code area had fewer than ten visits in a quarter, it was eliminated from
the analysis. These zip code areas are largely commercial zones with few residents.
The darkest shading indicates that largest decrease in non-urgent, self-pay visits at the
six study hospitals.
The actual decrease in percentage of non-urgent, self-pay visits for all six study
hospitals for each zip code area is shown in Table 11. The smallest decrease was
16% and the largest was 86%.
107

Figure 14. Decrease in Emergency Department Visits by Zip Code
108

Table 12. Decreased Emergency Department Visits by Zip Code
Zip Decrease 32703 50% 32709 67% 32712 35% 32751 56% 32789 25% 32792 26% 32798 43% 32801 NA 32803 49% 32804 29% 32805 48% 32806 49% 32807 48% 32808 47% 32809 16% 32810 26% 32811 22% 32812 48% 32817 30% 32818 25% 32819 33% 32820 50% 32821 33% 32822 86% 32824 39% 32825 54% 32826 43% 32827 75% 32828 47% 32829 48% 32831 NA 32832 NA 32833 54% 32835 27% 32836 29% 32837 21% 32839 24% 34761 34% 34734 NA 34786 NA 34787 50%
109

The non-FQHC clinics in the PCAN collaborative also provide care to the
uninsured in Orange County. The Community After-Hours Clinic, which opened in May
2003, was able to provide data on a monthly basis, by zip code, race, ethnicity and age.
The Health Care Center for the Homeless (HCCH) provided care only to the homeless
through 2001, but in 2002 under an arrangement with Orange County Government, took
over provision of primary care for housed individuals in select downtown zip code areas.
HCCH could not retrieve detailed data for this study due to a change in their computer
system in 2003. Orange County Medical Clinic provided primary care to adults at 125
percent of the federal poverty level in Orange County until 2002 when the County
transitioned care of these patients to HCCH and the FQHC’s. Shepherd’s Hope Health
Centers is an all volunteer, faith-based organization providing care in evening clinics to
the uninsured at 150 percent of the federal poverty level. For the years of data
requested, Shepherd’s Hope did not collect zip code, race, ethnicity, age, or gender
data. In 2004, Shepherd’s Hope began to collect and report utilization data on a
monthly basis. During the study period, Shepherd’s Hope opened two new centers.
The data from these clinics are provided in Table 12 and includes patients from Orange
County and neighboring counties.
110

Table 13. Non-Federally Qualified Health Center Clinic Visits
Clinic 2001 2002 2003
Community After Hours Clinic 0 0 1772
Health Care Center for the Homeless 12,989 24,336 26,155
Orange County Medical Clinic 27,508 10,707 1,708
Shepherd's Hope Health Centers 6459 7258 8057
48,957 39,69544,303
111

Despite an increase in number of sites, the non-FQHC clinics provided fewer
visits over the study time period. Over the study period, the non-FQHC sites evolved
within the PCAN system as critical points of entry, with subsequent referral of the
patients without a usual source of care to the FQHC’s as medical homes.
The information gathered from the hospitals and the clinics was entered into a
regression model in a time series format. A scatter plot of the non-urgent, self-pay ED
visits and self-pay FQHC visits for all six of the study hospitals over the 36 month study
period is presented in Figure 15.
The data from the clinics and the hospitals were plotted together with the clinic
utilization as the independent variable and the ED utilization as the dependent variable
to ascertain the direction of the relationship. Figure 16 depicts the relationship of these
two variables.
A best fit line was calculated and is depicted in Figure 17.
112

0
1000
2000
3000
4000
5000
6000
7000
Oct- 00
Apr- 01
Nov-01
May-02
Dec-02
Jun-03
Jan-04
Aug-04
ED Visits
Clinic Visits
Figure 15. Time Series Plot
113

1000
1200
1400
1600
1800
2000
2200
2400
2600
0 1000 2000 3000 4000 5000 6000 7000
FQHC Visits
Non-
Urge
nt, S
elf-P
ay E
D V
isits
Figure 16. Clinic and Emergency Department Visits Compared
114

1200
1400
1600
1800
2000
2200
2400
2000 3000 4000 5000 6000 7000Total Clinic Visits
ObservedLinear
Total ED Visits
Figure 17. Best-fit Line
115

An analysis of variance (ANOVA) was conducted on the mean number of non-
urgent, self-pay visits at the six emergency departments and the self-pay visits at the six
FQHC’s. The relationship was found to be statistically significant at the p < .001 level.
F= 92.355. R squared = .731.
The regression equation for the relationship is: y = -.194x +2723.643
y = non-urgent, self-pay ED visits
x = self-pay FQHC visits
Further analysis was conducted to determine whether there was a relationship
between individual emergency departments and clinics. The results of the hospital-to-
clinic ANOVA are as follows:
For Hospital A:
The relationship between the Hospital A’s non-urgent, self-pay visits and the
self-pay visits at FQHC A was found to be statistically significant at the p <.01 level.
F=11.224; R squared = .248. Although the relationship was found to be statistically
significant, the proportion of variation that is explained by this model is only 24.8 percent.
The relationship between Hospital A’s non-urgent, self-pay visits and the self-
pay visits at FQHC B was not found to be statistically significant. p > .05; F = 3.842; R
squared = .102.
116

The relationship between Hospital A’s non-urgent, self-pay visits and the self-
pay visits at FQHC C was not found to be statistically significant. p > .05; F = .245; R
squared = .007.
The relationship between Hospital A’s non-urgent, self-pay visits and the self-
pay visits at FQHC D was found to be statistically significant at the p <.01 level. F =
10.101; R squared = .229. Although the relationship was found to be statistically
significant, the proportion of variation that is explained by this model is only 22.9 percent.
The relationship between Hospital A’s non-urgent, self-pay visits and the self-
pay visits at FQHC E was found to be statistically significant at the p < .01 level. F =
10.509; R squared = .214. Although the relationship was found to be statistically
significant, the proportion of variation that is explained by this model is only 21.4 percent.
The relationship between Hospital A’s non-urgent, self-pay visits and the self-
pay visits at FQHC F was found to be statistically significant at the p < .001 level. F =
15.045; R squared = .286. Although the relationship was found to be statistically
significant, the proportion of variation that is explained by this model is only 28.6 percent.
For Hospital B:
117

The relationship between Hospital B’s non-urgent, self-pay visits and the self-
pay visits at FQHC A was found to be statistically significant at the p < .001 level. F =
72.577; R squared = .681. The proportion of variation that is explained by this model is
68.1 percent.
The relationship between Hospital B’s non-urgent, self-pay visits and the self-
pay visits at FQHC B was found to be statistically significant at the p < .05 level. F =
6.074; R squared = .152. Although the relationship was found to be statistically
significant, the proportion of variation that is explained by this model is only 15.2 percent.
The relationship between Hospital B’s non-urgent, self pay visits and the self-
pay visits at FQHC C was not found to be statistically significant. p > .05; F = .408; .R
squared = .012.
The relationship between Hospital B’s non-urgent, self-pay visits and the self-
pay visits at FQHC D was found to be statistically significant at the p < .001 level. F =
40.214; R squared = .542
The relationship between Hospital B’s non-urgent, self-pay visits and the self-
pay visits at FQHC E was found to be statistically significant at the p < .001 level. F =
48.320; R squared = .587. The proportion of variation that is explained by this model is
58.7 percent.
118

The relationship between Hospital B’s non-urgent, self-pay visits and the self-
pay visits at FQHC F was found to be statistically significant at the p < .001 level. F =
38.429; R squared = .531. The proportion of variation that is explained by this model is
53.1 percent.
For Hospital C:
The relationship between Hospital C’s non-urgent, self-pay visits and the self-
pay visits at FQHC A was found to be statistically significant at the p < .001 level. F =
29.602; R squared = .465. The proportion of variation that is explained by this model is
46.5 percent.
The relationship between Hospital C’s non-urgent, self-pay visits and the self-
pay visits at FQHC B was not found to be statistically significant. p > .05; F = 1.319; R
squared = .037.
The relationship between Hospital C’s non-urgent, self-pay visits and the self-
pay visits at FQHC C was not found to be statistically significant. p > .05; F = .013; R-
squared = 0.
The relationship between Hospital C’s non-urgent, self-pay visits and the self-
pay visits at FQHC D was found to be statistically significant at the p < .01 level. F =
119

12.465; R-squared = .268. Although the relationship was found to be statistically
significant, the proportion of variation that is explained by this model is only 26.8 percent.
The relationship between Hospital C’s non-urgent, self-pay visits and the self-
pay visits at FQHC E was found to be statistically significant at the p < .001 level. F =
23.459; R-squared = .408. Although the relationship was found to be statistically
significant, the proportion of variation that is explained by this model is only 40.8 percent.
The relationship between Hospital C’s non-urgent, self-pay visits and the self-
pay visits at FQHC F was found to be statistically significant at the p < .001 level. F =
25.332; R-squared = .427. Although the relationship was found to be statistically
significant, the proportion of variation that is explained by this model is only 42.7 percent.
For Hospital D:
The relationship between Hospital D’s non-urgent, self-pay visits and the self-
pay visits at FQHC A was found to be statistically significant at the p < .001 level. F =
62.926; F-squared = .649. The proportion of variation that is explained by this model is
64.9 percent.
120

The relationship between Hospital D’s non-urgent, self-pay visits and the self-
pay visits at FQHC B was found to be statistically significant at the p < .001 level. F =
15.214; R-squared = .309. Although the relationship was found to be statistically
significant, the proportion of variation that is explained by this model is only 30.9 percent.
The relationship between Hospital D’s non-urgent, self-pay visits and the self-
pay visits at FQHC C was not found to be statistically significant. p > .05; F = 2.676. R-
squared = .073.
The relationship between Hospital D’s non-urgent, self-pay visits and the self-
pay visits at FQHC D was found to be statistically significant at the p < .001 level. F =
59.455; R-squared = .636. The proportion of variation that is explained by this model is
63.6 percent.
The relationship between Hospital D’s non-urgent, self-pay visits and the self-
pay visits at FQHC E was found to be statistically significant the p < .001 level. F =
31.795; R-squared = .483. Although the relationship was found to be statistically
significant, the proportion of variation that is explained by this model is only 48.3 percent.
The relationship between Hospital D’s non-urgent, self-pay visits and the self-
pay visits at FQHC F was found to be statistically significant at the p <.001 level. F =
121

21.590; R-squared = .388. Although the relationship was found to be statistically
significant, the proportion of variation that is explained by this model is only 38.8 percent.
For Hospital E:
The relationship between Hospital E’s non-urgent, self-pay visits and the self-
pay visits at FQHC A was found to be statistically significant at the p < .001 level. F =
148.957; R-squared = .814. The proportion of variation that is explained by this model
is 81.4 percent.
The relationship between Hospital E’s non-urgent, self-pay visits and the self-
pay visits at FQHC B was found to be statistically significant at the p < .01 level. F =
8.414; R-squared = .198. Although the relationship was found to be statistically
significant, the proportion of variation that is explained by this model is only 19.8 percent.
The relationship between Hospital E’s non-urgent, self-pay visits and the self-
pay visits at FQHC C was not found to be statistically significant. p > .05; F = .386; R-
squared = .011.
122

The relationship between Hospital E’s non-urgent, self-pay visits and the self-
pay visits at FQHC D was found to be statistically significant at the p < .001 level. F =
50.004; R-squared = .595. The proportion of variation that is explained by this model is
59.5 percent.
The relationship between Hospital E’s non-urgent, self-pay visits and the self-
pay visits at FQHC E was found to be statistically significant at the p < .001 level. F =
52.073; R-squared = .605. The proportion of variation that is explained by this model is
60.5 percent.
The relationship between Hospital E’s non-urgent, self-pay visits and the self-
pay visits at FQHC F was found to be statistically significant at the p < .001 level. F =
61.482; R-squared = .644. The proportion of variation that is explained by this model is
64.4 percent.
For Hospital F:
The relationship between Hospital F’s non-urgent, self-pay visits and the self-
pay visits at FQHC A was not found to be statistically significant. p > .05; F = 2.167; R-
squared = 0.60.
123

The relationship between Hospital F’s non-urgent, self-pay visits and the self-
pay visits at FQHC B was not found to be statistically significant. p > .05; F = .702; R-
squared = .020.
The relationship between Hospital F’s non-urgent, self-pay visits and the self-
pay visits at FQHC C was not found to be statistically significant. p > .05; F = 2.019; F-
squared = .056.
The relationship between Hospital F’s non-urgent, self-pay visits and the self-
pay visits at FQHC D was found to be statistically significant at the p < .01 level. F =
8.536; R-squared = .201. Although the relationship was found to be statistically
significant, the proportion of variation that is explained by this model is only 20.1 percent.
The relationship between Hospital F’s non-urgent, self-pay visits and the self-
pay visits at FQHC E was not found to be statistically significant. p > .05; F = .031; R-
squared = .001.
The relationship between Hospital F’s non-urgent, self-pay visits and the self-
pay visits at FQHC F was not found to be statistically significant. p > .05; F = .067; R-
squared = .002.
124

Hypothesis 2
The alternate hypothesis posed was that there would be a direct relationship
between the distance of a primary care clinic to an emergency department and the
number of non-urgent emergency department visits by self-pay patients at the
emergency departments. Table 13 shows the calculation of the distance from each
emergency department to each federally qualified health center.
The address of each hospital and each clinic was entered into MapQuest, a web-
based tool, and a distance was calculated. The average distance was then utilized in
the analysis.
125

Table 14. Average Distances Between Hospitals and Clinics
HOSP A HOSP B HOSP C HOSP D HOSP E HOSP F AVERAGE
FQHC A 17.17 7.92 4.64 9.79 14.01 5.41 9.82
FQHC B 21.57 15.15 12.39 0.91 20.46 16.29 14.46
FQHC C 12.58 5.80 4.18 11.70 11.10 8.22 8.93
FQHC D 16.75 14.70 17.53 11.11 20.00 21.68 16.96
FQHC E 15.36 9.04 12.84 23.18 6.13 10.47 12.84
FQHC F 23.16 14.06 11.98 28.20 8.10 11.97 16.25
AVERAGE 17.77 11.11 10.59 14.15 13.30 12.34
126
Hospital C was closest on average at 10.59 miles to all six FQHC’s and had a
48 percent drop in non-urgent, self-pay ED visits during the study period.
Hospital B was ranked second in average distance from all six FQHC’s at 11.11
miles and had a 27 percent drop in non-urgent, self-pay ED visits during the study
period.
Hospital F was ranked third in average distance from the six FQHC’s at 12.34
miles and had an 11 percent drop in non-urgent, self-pay ED visits during the study
period.
Hospital E was ranked fourth in average distance from the six FQHC’s at 13.30
miles and had a 59 percent drop in non-urgent, self-pay ED visits during the study
period.
Hospital D was ranked fifth in average distance from the six FQHC’s at 14.15
miles and had a 45 percent drop in non-urgent, self-pay ED visits during the study
period.
Hospital E was ranked sixth in average distance from the six FQHC’s at 17.77
miles with a .07 percent drop in non-urgent, self-pay ED visits during the study period.
Correlation analysis using Pearson’s Product Moment was conducted comparing
the mileage between each hospital to each FQHC to the percent decrease in non-
urgent, self-pay ED visits during the study period to ascertain whether there was a
relationship between the variables. The analysis indicated that there was no relationship
between the number of miles and the decreased percentage of visits, as p > .05
127
Hypothesis 3
The alternate hypothesis was that there would be an inverse relationship
between the number of hours primary care clinics are open and the number of self-pay,
non-urgent ED visits. Four of the FQHC’s are open 45 hours a week and two are open
44 hours a week with no change in total hours during the study period.
The correlation analysis was conducted comparing the total hours open for each
clinic to the percent drop in non-urgent, self-pay ED visits and no statistically significant
relationship between the hours the clinics are open and the number of non-urgent, self-
pay visits.
Pearson’s product moment correlation was conducted and the results indicated
that there was no relationship between the number of hours and the decreased
percentage of visits as p > .05.
Hypothesis 4
The alternate hypothesis tested was that there would be an inverse relationship
between the number of appointment slots held open for emergency department follow-
up and the number of self-pay, non-urgent visits to the emergency department.
Four of the six FQHC’s do not hold appointment slots, but noted that all patients
including those from the emergency department that require immediate attention are
worked in within the same day or the next day. It was further noted that the FQHC
made an organizational decision that appointment slots are not held because of the high
“no-show” rate. Two of the FQHC’s hold eight slots open each day and in fact,
128

indicated that only 30 percent of the patients referred from the local emergency
departments for follow up actually keep their appointments.
The researcher chose not to analyze the difference between the FQHC providers
to attempt to support or reject this hypothesis because the format of the question did not
address working in patients who needed to be seen quickly. Future studies will modify
the independent variable to include this activity.
Hypothesis 5
The alternate hypothesis tested was that there would a difference in the number
of non-urgent ED visits by self-pay patients when a case manager is present in the ED.
Two of the hospitals had case managers physically located in the emergency
departments working with uninsured patients for some portion of the study period.
These dedicated case managers only worked eight hours a day second shift during the
week. The hospitals could only provide estimated start and stop dates for when the ED
case manager was in place.
All six of the hospitals indicated that they have case managers within the hospital
who make referrals for community follow up if the patients are not admitted to the
hospital following their visit to the emergency department. All six hospitals indicated
that PCAN referrals are made by these case managers who are available 24 hours a
day, 7 days a week at all six of the hospitals. The hospitals could not provide the exact
date that the PCAN referrals started.
129
Without specific data on how many and which months during the study period the
case managers were making PCAN referrals, no further analysis was able to be
conducted to ascertain the significance of the presence of case managers or their job
duties. Should this information become available retroactively, it could be incorporated
into a follow up study.
Hypothesis 6
The alternate hypothesis posed was that there would be a difference in the
number of non-urgent ED visits by self-pay patients if the case managers provide direct
referrals on behalf of the non-urgent patients to a primary care clinic for follow-up care.
The six hospitals all indicated that direct referrals were made to the primary care
clinics for patients needing follow up. The hospitals could not provide the exact date
that the direct referrals to PCAN clinics started, as indicated above, so that a
comparison could be made before and after the referrals were made.
No analysis could be conducted to support or reject this hypothesis because of
incomplete data from the hospitals.
130

Walk-out Rate
An alternate explanation for the decrease in non-urgent, self-pay emergency
department visits at the six hospitals could have been a large increase in the walk-out
rate at the local hospitals. The term “walk-out rate” refers to the percentage of patients
that check in to the emergency department for care but do not stay for treatment. The
assumption could be made that less urgent patients would not wait a long time to be
seen and would leave before receiving medical attention. As such, it was important to
calculate the walk-out rate for each study hospital during the study period. All six
hospitals provided the monthly average walk-out rate, which are displayed in Table 14.
131

Table 15. Walk-Out Rates
HOSP A Month 2001 2002 2003 Jan 1.64% 5.16% 3.69% Feb 1.06% 7.13% 5.66% Mar 1.53% 2.91% 4.81% Apr 1.20% 7.98% 4.13% May 1.30% 2.83% 3.98% Jun 1.60% 2.23% 2.49% Jul 1.63% 3.96% 2.95% Aug 1.96% 2.95% 3.29% Sep 0.99% 3.06% 3.23% Oct 1.67% 2.40% 3.27% Nov 1.52% 1.62% 3.78% Dec 1.64% 2.73% 6.95% Avg: 1% 4% 4% HOSP B Month 2001 2002 2003 Jan 9.26% 16.74% 11.79% Feb 8.93% 13.98% 14.51% Mar 8.99% 11.73% 14.88% Apr 10.28% 18.84% 10.09% May 7.96% 8.24% 9.86% Jun 7.01% 10.21% 9.69% Jul 12.58% 10.90% 8.73% Aug 14.45% 8.76% 9.05% Sep 10.58% 14.03% 8.61% Oct 11.60% 10.16% 8.56% Nov 12.99% 8.65% 10.93% Dec 11.62% 10.71% 16.62% Avg: 11% 12% 11%
132

HOSP C Month 2001 2002 2003 Jan 9.7% 10.7% 5.1% Feb 10.7% 11.5% 7.1% Mar 9.2% 10.6% 5.2% Apr 9.6% 13.0% 7.2% May 8.9% 10.2% 6.4% Jun 6.4% 8.0% 3.1% Jul 9.4% 11.3% 4.6% Aug 9.0% 9.5% 5.1% Sep 8.1% 9.5% 6.9% Oct 6.6% 5.7% 6.1% Nov 5.9% 4.5% 5.8% Dec 5.1% 4.4% 9.4% Avg : 8.2% 9.1% 6.0% HOSP D Month 2001 2002 2003 Jan 4.8% 7.6% 4.1% Feb 4.1% 4.5% 6.0% Mar 3.7% 4.4% 4.1% Apr 4.4% 4.7% 3.7% May 3.3% 5.8% 3.3% Jun 3.3% 2.1% 2.3% Jul 3.4% 3.9% 3.2% Aug 2.9% 3.6% 2.7% Sep 2.7% 3.2% 4.7% Oct 4.3% 4.4% 4.1% Nov 3.1% 3.8% 3.3% Dec 2.8% 4.0% 5.7% Avg : 3.6% 4.3% 3.9%
133

HOSP E Month 2001 2002 2003 Jan 10.0% 15.9% 8.0% Feb 9.1% 19.7% 5.5% Mar 9.0% 10.6% 4.3% Apr 10.3% 12.1% 3.5% May 11.5% 8.8% 4.9% Jun 8.4% 6.6% 4.7% Jul 10.4% 12.8% 6.8% Aug 9.3% 10.3% 4.5% Sep 7.9% 10.3% 8.3% Oct 7.3% 8.6% 5.9% Nov 8.9% 7.5% 8.1% Dec 9.1% 9.3% 12.1% Avg: 9.3% 11.0% 6.4% HOSP F Month 2001 2002 2003 Jan 3.7% 6.0% 3.0% Feb 4.7% 5.2% 3.2% Mar 5.6% 3.8% 2.5% Apr 3.6% 4.5% 2.6% May 3.7% 2.3% 3.0% Jun 2.4% 2.7% 3.2% Jul 2.8% 3.6% 2.0% Aug 3.3% 2.0% 3.3% Sep 3.1% 2.7% 3.2% Oct 3.2% 2.4% 3.5% Nov 3.5% 2.5% 2.7% Dec 1.9% 2.1% 4.8% Avg : 3.5% 3.3% 3.1%
134

Of the six hospitals, only two hospitals experienced increases in the walk-out rate
during the study period. Hospital A increased from a one percent rate to a four percent
rate and Hospital D went from a 3.6 percent walk-out rate to a 3.9 percent walk-out rate.
The walk-out rate from 2001 to 2003 for all six hospitals went from 6.1 percent down to
5.7 percent. The walk-out rate is therefore not an alternate explanation for the decrease
in non-urgent, self-pay ED utilization in Orange County from 2001 through 2003.
Charge Analysis
The FQHC’s provided the average charge for a primary care visit during the
study time period. The hospitals provided the average charge for a non-urgent ED visit
during the study time period. Locally, the results are consistent with what was learned
in the review of the literature and presented in Chapter II of this dissertation. A primary
care visit charge is approximately one-third the charge for a non-urgent ED visit. The
average charges are shown in Table 15.
135

Table 16. Charge Comparison
Hospital 1 $ 307.00 Hospital 2 307.00 Hospital 3 307.00 Hospital 4 307.00 Hospital 5 254.00 Hospital 6 254.00 Average Charge $ 289.33 Clinic A $ 95.00 Clinic B 95.00 Clinic C 95.00 Clinic D 95.00 Clinic E 93.90 Clinic F 93.90 Average Charge $ 94.63
136

From the first quarter of 2001 to the last quarter of 2003, there was a decrease of
2,080 non-urgent, self-pay visits to the ED by self-pay patients which appears to be
correlated with the increased self-pay visits in the FQHC’s. When you apply the
average charge for the ED visit to this number (2, 080) and the average charge for the
clinic visit to this number, the difference is $404,976 as calculated in Table 16. The
quarterly estimated savings can be extended to an annual estimate of $1,619,904
savings in ED charges by redirecting patients from the emergency departments to the
clinics. Further analysis of the financial impact of the Primary Care Access Network
should consider analysis of hospital and FQHC costs to delivering this care.
137

Table 17. Savings Calculation
Quarterly Number of Non-Urgent, Self-Pay ED Visits x Average Charge = Quarterly Charges for Self-Pay ED Visits
2080 ED visits X $289.33 = $601,806.40
Quarterly Number of Self-Pay Clinic Visits x Average Charges = Quarterly Charges for Primary Care Visits
2080 Clinic visits X $94.63 = $196,830.40
Quarterly Charges for Self-Pay ED Visits – Quarterly Charges for Primary Care Visits = Quarterly “Savings”
$601,806.40 - $196,830.40 = $404,976
138
This reduction in use of the emergency department by self-pay patients improves
the collection rate at the local hospitals. Self-pay patients account for the majority of
uncompensated care at local hospitals. As described in an Issue Brief issued by Florida
Hospital in March 2002, self-pay patients “incur the highest uncompensated care
charges and represent the lowest collections of all payer categories” (Florida Hospital,
2002). This analysis was conducted as part of the uncompensated care study
referenced in the literature review (Rotarius et al, 2002).
Feedback Questionnaire
The findings of this study were presented to the Primary Care Access Network
Board in January 2005 as part of their regular monthly meeting schedule. The data
and analysis presented included the seventh hospital that was subsequently removed
from the analysis upon consultation with the dissertation chair and doctoral program
director. Once the representative from “Hospital G” reviewed the data presented at the
PCAN meeting, the realization was made that a coding error had not been corrected
from January 2001 through June 2002 and the data that had been collected for the
study were corrupt.
Discussion about the findings that was presented took place during the
presentation and after. Questions were taken throughout the presentation. Discussion
was held about future research opportunities. The feedback received from the
discussion has been incorporated into Chapter VI.
139

Representatives of seventeen of the twenty member organizations of the Primary
Care Access Network were present at the meeting and all completed the brief
questionnaire that was distributed following the presentation. Although approximately
thirty individuals were in attendance at the meeting, only one representative per
organization was asked to complete the anonymous survey and return it to the
researcher at the end of the meeting.
Twelve of the seventeen respondents (70.5 percent) indicated that the study
results were very consistent with their expectations prior to the presentation. The five
remaining respondents (29.5 percent) indicated that the study results were consistent
with their expectations prior to the presentation. No one indicated that the study results
were not what they expected.
All seventeen respondents indicated that the data gathered in the study would be
useful for their organization’s planning as it pertained to ongoing involvement in the
PCAN. Additionally, all seventeen respondents felt that the data gathered in this study
should continue to be gathered and monitored as part of the program evaluation of the
Primary Care Access Network.
140

CHAPTER VI: DISCUSSION
This dissertation proposed to determine whether the Primary Care Access
Network system has redirected the uninsured residents of Orange County from
choosing the emergency department for their non-urgent care needs to obtaining care
at the federally qualified health centers in the community. The review of the literature
revealed a lack of empirical research on systems of care developed for the uninsured
and their impact in achieving their goals.
The theoretical framework identifies a health behavior model of care that
provides constant feedback within a health system to increase accessibility to patients
so that health behavior can be changed to a more desired state. The methods chapter
described how the research in this study was designed and conducted in order to
evaluate the PCAN system’s effectiveness in reducing non-urgent utilization of the
emergency departments by self-pay patients.
This final chapter of the dissertation explores the findings elaborated in the
previous chapter as well as presents feedback from the PCAN Board of Directors as to
these findings. The study’s limitations are presented and discussed. Future analysis
and future research opportunities are also discussed. The implications of the study’s
findings on local, regional and national health planning are explored.
141

Hypotheses
Table 17 summarizes the hypotheses-testing results of this study. Alternate
Hypothesis A represents the main research question in this study, which was to
evaluate the impact of the system of care on non-urgent utilization of the ED by self-pay
patients and determine whether the uninsured of Orange County had changed their
health-seeking behavior of using the ED for primary care purposes. The five remaining
alternate hypotheses tested specific aspects of the system of care.
142

Table 18. Summary of Hypothesis Testing Results
Alternate Hypotheses Significant? Comments Ha1 – Inverse relationship between ED non-urgent and FQHC self pay visits
Yes Individual hospital to individual clinic ANOVA results not as significant as total system analysis
Ha2 – Direct relationship between distance of FQHC’s to ED’s and ED non-urgent visits
No Alternate hypothesis could have been to evaluate impact of locating FQHC’s in zip areas with highest concentration of uninsured rather than FQHC proximity to emergency departments
Ha3 – Inverse relationship between hours of operation and non-urgent ED visits
No All six FQHC’s open either 44 or 45 hours a week.
Ha4 – Inverse relationship between number of held slots and non-urgent ED visits
No Two of six FQHC’s hold slots open and four work patients in. Format of question needs to be revised to reflect option of working ED follow up patients into schedule
Ha5 – Difference in non-urgent ED visits based on presence or absence of case manager
No All EDs had case managers in place to assist self-pay patients with referral to FQHC’s during the study period. System change occurred during study period, as family health navigators replaced ED case managers during study period.
Ha6 – Difference in non-urgent ED visits based on case manager duties
No Limited analysis conducted. Same comment as alternate Hypothesis #5.
143
Hypothesis 1
A statistically significant relationship was found between the decreasing
utilization of the emergency departments in Orange County by self-pay patients for non-
urgent purposes and increasing utilization by self-pay patients of the federally qualified
health centers in the community.
Data reported in this study by the hospitals and the clinics were not provided at
an individual patient level nor were the data linked from age to race/ethnicity to gender
because of HIPAA constraints. Because of these constraints, this study could not
include evaluation of the behavior of individuals to see whether individuals actually
changed their behavior from the utilizing the emergency departments to utilizing the
FQHC’s. The proxy for that analysis was to evaluate each of the demographic
categories of data from the emergency departments and the clinics to see whether there
was a change in who was utilizing services. The Chi-square analysis of age,
race/ethnicity and gender in the hospitals and clinics resulted in the demonstration of
statistically different populations in the emergency departments and the clinics from the
start of the study period to the end of the study period.
The most dramatic change in emergency department utilization was found in the
decrease in the proportion of men using the emergency department for non-urgent
purposes from 56.37 percent to 50.96 percent. As discussed in the literature review,
men have been found to use the emergency department for “inappropriate” or primary
care purposes at a rate higher than women. In the FQHC’s the most dramatic change
was the increase in the Hispanic population, from 41.9 percent to 52.57 percent. Two
144

of the three new clinics that opened during the study period were constructed in areas
of the county where the Hispanic population was growing quickly (Primary Care Access
Network, 2001).
The decreased non-urgent use of the emergency departments by self-pay
patients of 32.2 percent over the study period occurred during a time of increasing rates
of uninsurance in the county following the national events of September 11, 2001. The
local area, a service economy based on tourism, was heavily impacted and over 30,000
individuals became uninsured during the course of the study period either through a
loss of job or a loss of health coverage (Duncan et al, 2004).
At a zip code level, it appears that the areas of the county that have experienced
the most dramatic impact in reduced use of the emergency departments are the areas
nearest the FQHC’s. A new hypothesis could be added to this research project
inquiring as to the level of association of the location of the FQHC’s to the zip code
areas where the most uninsured lived.
The hospital-to-clinic statistical analysis does not show as strong a result as the
total hospital-to-total clinic analysis as evidenced by the lack of statistical significance
for many of the tested relationships and the low “R-squared” results:
• For Hospital A, there was a statistically significant relationship with FQHC
A, FQHC D, FQHC E and FQHC F.
• For Hospital B, there was a statistically significant relationship with FQHC
A, FQHC B, FQHC D and FQHC E.
• Hospital C demonstrated a statistically significant relationship to FQHC A,
FQHC D, FQHC E, and FQHC F.
145

• Hospital D demonstrated a statistically significant relationship to FQHC A,
FQHC B, FQHC D, FQHC E, and FQHC F.
• Hospital E demonstrated a statistically significant relationship to FQHC A,
FQHC B, FQHC D, FQHC E and FQHC F.
• Hospital F demonstrated a statistically significant relationship to FQHC D
only.
Hospital F’s non-urgent, self-pay ED visits were only statistically correlated to
one FQHC. Hospital F had the smallest decrease in non-urgent, self-pay visits. The
other hospitals were correlated to four or five FQHC’s and experienced more dramatic
decreases in utilization.
FQHC C was the only clinic that did not exert a statistically significant relationship
with any of the six hospitals. As seen in the map in the previous chapter, this FQHC is
located in an area that did not have high rates of decline in use of the ED by self-pay
patients for non-urgent purposes.
Although the regression analysis did result in a statistically significant relationship
between the two variables for many of the hospital-to-clinic tests, the low R-squared for
these analyses indicate that much of the variability in ED utilization was not explained
by FQHC utilization.
The hospital-to-clinic ANOVA results were not as compelling as the system
ANOVA results, which serves to strengthen the position that the total system of care
must be considered and assessed in evaluating the impact of such a broad goal as
reducing emergency department utilization within a county.
146

During discussion of the findings of the study with the PCAN Board, a question
was asked about the 1000 visit drop in the last quarter of 2003 at FQHC E and how it
impacted the study results. The researcher indicated that there were sufficient numbers
of visits that a statistically significant result was found, but that an increase in 1000 visits
would have strengthened the relationship in that quarter and tightened the line of best fit
in the regression analysis.
Apparently, FQHC E lost one of two pediatricians in the last quarter of 2003,
which accounted for the decrease in volume at that time. A new physician was not in
place until early in 2004. The group discussed the need to provide 2004 data to the
researcher, not only for FQHC E, but for all FQHC’s and hospitals to ascertain the
current impact of PCAN on the emergency departments.
The theoretical model suggested that the system must be able to provide
convenient, alternate sites for care for the uninsured and must be able to convince the
individuals that a change of behavior is a better alternative. The findings of this study
indicate that the system of care may have reduced non-urgent use of the emergency
departments by self-pay patients by increasing the capacity of the FQHC system in the
county. The population using the emergency departments at the end of the study is
significantly different from that at the beginning of the study period. This statistically
significant difference can be interpreted to mean that individuals have changed their
behavior and now perceive that the FQHC’s offer a more desirable type of care than the
ED’s had previously provided. Thus, the theoretical model is supported.
147

Hypothesis 2
A statistically significant result was not found between the distance of the
hospitals to the clinics and the actual decrease in non-urgent, self-pay emergency
department visits. This hypothesis could be re-written to ask whether the location of
the clinics in the areas of high uninsured rates reduces the use of the ED significantly by
this population.
Additionally, referrals to the closest clinic to the hospital may not have been in
the best interest of the patient. The patient’s home or work site might be located closer
to another clinic. Future research should incorporate a variable to account for this
possibility.
Discussion with the PCAN Board about the distances to the clinics from the
hospitals included mention of the importance of bus routes in close proximity to the
FQHC’s rather than a concern that the clinics be located close the hospitals. The
suggestion was made that future maps showing the location of the clinics include major
bus lines and stops.
Hypothesis 3
The number of hours the clinics were open only varied by one hour in two of the
six clinics, which was not enough of a difference to show an impact. In future studies,
consideration should be given to when the clinics are open and how many of the hours
are in the evening and during the weekend. Inclusion of the non-FQHC clinics in future
studies will provide more variety to the study, since the Community After Hours Clinic is
open in the evening and the Shepherd’s Hope Health Centers are all open at night, as
148

well. Analysis of this evening clinic data may result in a demonstrated impact in
increased use of the FQHC’s and decreased use of the emergency departments.
Hypothesis 4
Holding appointment slots open for direct referral to the FQHC from the
emergency department was not perceived by four of the six FQHC’s as an efficient way
to operate the clinics due to high “no-show” rates for the visits. The other two FQHC’s
had a 70 percent “no-show” rate for their appointments held following referral from the
emergency departments.
Working patients in as a high priority is the operations model that works for four
of the six clinics and was not a study variable. Future research of the Primary Care
Access Network collaborative should evaluate the reasons why patients do not keep
their appointments in the FQHC’s. This analysis may reveal information about patient
behavior and needs that could be used to improve the service delivery system.
Hypothesis 5 and Hypothesis 6
The two hypotheses were closely related and are combined in this Discussion.
Neither the presence or absence of a case manager in the emergency department nor
whether a case manager provides direct referrals to the FQHC’s were proven to be
statistically significant in this study because of the lack of specific data provided to the
researcher by all the hospitals. The discussion with the Primary Care Access Network
149
Board provided the researcher with new insight to the information that had been
provided and opened the opportunity for a new study.
The researcher learned during the discussion that a new PCAN program called
the “family health navigators” funded by the local foundation on the PCAN Board was
put into place in 2003 to replace the program of staffing the emergency departments
with case managers dedicated to working with the uninsured. The family health
navigator program was expected to be a more cost-effective way to follow up with the
uninsured receiving care in the emergency departments. The researcher was aware of
the family health navigator program but did not know that their function replaced the
dedicated case managers.
The family health navigators, who are multi-lingual, visit each emergency
department in the county each week and receive a list of the uninsured who have visited
the emergency department in the past week. The family health navigators then follow
up with each of the patients to see if they need assistance “navigating” the health
system and finding a medical home, i.e. one of the PCAN clinics. The impact of the
family health navigators on the patient’s future use of the emergency department or on
their use of the FQHC’s has not been undertaken and represents a unique opportunity
to quantify the impact of the PCAN collaborative in changing actual patient behavior.
Feedback from the emergency department case managers and the FQHC’s had
been received by PCAN leadership and resulted in a change in program that may
redirect patients more effectively into medical homes.
150
Additional Primary Care Access Network Board Feedback
When the PCAN Board discussed the findings, it was decided that collecting and
analyzing these data on an ongoing basis should be an important component of their
ongoing evaluation process. The results of the study confirmed their “suspicions,” yet it
had been known that empirical evidence was necessary to demonstrate success and to
move forward with targeted, data-driven decision making. There is immediate interest
in analyzing the 2004 data for the impact of the newest clinics in downtown Orlando and
in Zellwood, a rural area of the county. Additionally, it was suggested that extending
the analysis to 2004 may reveal that the more established FQHC’s have reached
capacity.
The group also discussed the importance of sharing the results of the study with
local commissioners and legislators, as well as foundations and state and federal
agencies. The group felt that the results of this study validate the important role of the
FQHC’s in caring for the uninsured. The group also indicated interest in a similar study
for all payer classes, with particular interest in the Medicaid population.
Several PCAN Board members expressed concern about proposed Medicaid
reform in the State of Florida and how it will impact the demand for services at the
FQHC’s. The details of the reform are yet unknown; however, it is expected that
additional capacity will be needed in the system of care for the uninsured and
underinsured.
151

Following the presentation, the findings of this research were requested by the
county government officials overseeing PCAN for use in evaluating the best location of
the next expansion clinic.
Limitations and Future Research
The study was limited somewhat by the need to eliminate the seventh hospital
from the analysis. The researcher was unable to assess the total system, as planned,
but has committed to incorporating the data from the seventh hospital into the analysis
as soon as it is received.
Several of the data elements reported on Instruments 1 and 2 were dependent
upon the recollection or research ability or interest of the person recording the data.
The inability to provide the month that case management services were put in place or
the date when direct referrals to PCAN were made limited the researcher’s ability to
create a multiple regression model. The researcher discussed this limitation with the
PCAN Board and the participating hospitals and clinics indicated a high level of support
to conduct this research on an ongoing basis and provide the data necessary to build
the model for predicting future utilization of existing and planned clinics.
The study was also limited in its ability to conduct in-depth analysis of the ED’s
and FQHC’s at a zip code level. The individual cell sizes were often blank or too small.
Regression analysis could not be conducted at the micro-level due to many missing
values in the data set, weakening the model. The addition of data from the seventh
152
hospital to the sample would likely enhance the ability to conduct this analysis by
increasing sample size in each zip code area.
This study made every attempt to identify other local interventions which may
have impacted ED utilization by the uninsured. None were identified for the uninsured
population. However, should PCAN desire to evaluate its impact on Medicaid utilization
of the emergency departments, such programs as the Agency for Health Care
Administration’s and Pfizer’s “Florida: A Healthy State” disease management program
will also have to be considered. This project which began in July 2001 provides disease
management to MediPass beneficiaries in Central Florida with the following conditions:
congestive heart failure, diabetes, hypertension and asthma. An outcome of the project
is to reduce hospital and ED utilization of these patients (Medical Scientists, 2003).
PCAN Board members made several suggestions for follow-up studies. The first
suggestion is to conduct the analysis following submission of corrected data from the
hospital with coding errors. The hospital in question has agreed to manually review
their records for the eighteen month period of time and create a new data set.
Expansion of the analysis to include Medicaid patients was also identified as an
important research opportunity.
Additionally, the newly appointed emergency medical services (EMS)
representative on the PCAN Board expressed interest in expanding this study to include
EMS providers. Local EMS has experienced an increase in self-pay transports for the
same time period as this study as well as an increase in non-urgent 911 calls. Based
on current local and state protocols, the non-urgent calls through 911 must be
transported to an ED. It has been suggested that a pilot study be designed to evaluate
153
the impact of an intervention that allows EMS to transport non-urgent patients to a
primary care site for care. The idea for such a pilot study will be presented to the local
EMS agencies at their April 2005 meeting.
As mentioned above, a study of the family health navigators and the impact their
work has on ED utilization is a critical evaluative component for PCAN as well. Similarly,
an evaluation of the “no-shows” in the FQHC held appointment slots would be an
important study to undertake. The information that would be gathered from these
studies would reveal information about patient behavior that could be provided to PCAN
leadership to make organizational changes that would further improve access to the
system of care.
Upon reflection of the results of this study, it is missing a critical component as do
most organizationally-based studies. Success in changing the health behavior of
patients from one state to a more desired state may or may not result in improved
health outcomes for these patients. Incorporating measures of improved health into the
system’s program evaluation would be extremely challenging for the researcher but
would enhance the adapted health behavior model presented in this dissertation.
Implications for Local Health Planning
The study results suggest that the PCAN system of care has reduced
“inappropriate” utilization of the ED’s by the uninsured by increasing the capacity of the
FQHC system. As per the theoretical model, if a community can be sensitive to the
belief systems of patients and create a system of care that addresses their needs, more
154

effective and cost efficient services can be obtained. Post-EMTALA, for those without a
usual source of care or who could afford these services, the emergency department has
provided an attractive option. No one is turned away, no proof of income is required
and often no payment is requested at the time services are delivered. The PCAN
system of care provided comprehensive, convenient ongoing medical care at an
affordable cost to the uninsured which presented an alternative to using the ED for
primary care purposes. It can be inferred from this research that PCAN’s new model of
care was perceived as a better alternative to the ED for the uninsured’s primary care
needs.
The findings from this study were presented to the Orange County Board of
Commissioners as an update on PCAN. Brevard, Seminole and Osceola county
agencies, hospitals and committees have requested presentations of the findings, as
well. These counties, all part of the same local health planning region, continue to
experience increased use of the emergency departments by the uninsured and are
considering establishment of “PCAN-like” efforts, especially now, as there appears to be
some empirical evidence that a coordinated and comprehensive system of care for the
uninsured is working.
Collection of the data for this project was challenging. Individual organizations
conduct internal program evaluation of their departments, services, and programs but
do not typically participate in evaluation of their efforts as part of a collaborative with a
broad, overarching goal. In the large organizations, the importance of the project was
often lost on the individual who was charged with reporting the data. Once results were
shared with the organizations at the PCAN Board meeting, a renewed commitment to
155

work together to evaluate PCAN activities occurred. Previous evaluative efforts were
qualitative in nature and focused on the perceptions of the PCAN members on the
collaborative’s ability to work together. The combination of the quantitative and
qualitative data on PCAN’s success provides important feedback to the collaborative for
future planning and organizational development.
PCAN has been funded for three years by the Healthy Community Access
Program (HCAP), a federal grant in the Bureau of Primary Health Care in Health
Services and Resources Administration. HCAP has been eliminated from President
Bush’s budget and it has been implied that the White House staff evaluated the success
of HCAP and found that the program did not improve access to care (White House,
2005). HCAP did not execute a national program evaluation to measure its success
and individual grantees, like PCAN, may not have completed a comprehensive
assessment of their efforts in the short time of the program.
The President’s budget does add considerable funding for expansion of the
federally qualified health centers. Within Orange County, the combination of funding
from HCAP with the expansion funding for FQHC’s has resulted in development of a
coordinated system of care. Expansion funding is being pursued and the study findings
will be used in the grant application.
The termination of HCAP funding nationally presents a challenge to
organizations throughout the nation such as PCAN to continue to develop their
networks of care for the uninsured. A strong evaluation component within these
collaborative efforts will allow the feedback necessary to provide programs and services
that are accessible. The data collected for such evaluations are also useful in
156

developing strong grant applications and convincing local, state and federal officials that
funding is needed to continue good outcomes.
As community health planning becomes more dependent upon community
partners coming together to solve the most difficult health care problems, it becomes
more complex to evaluate programs and services that are the result of a collaborative
effort. Data collection techniques and definitions differ from organization to
organization. Fiscal years may start and stop at different points in the year. Sharing
data between organizations has become more difficult and of greater concern to
community partners following the enactment of HIPAA regulations.
The timing of this study challenged the participating organizations to put aside
concerns that HIPAA rules might be violated and work together to provide data that
would be useful to their own organizations as well as to the collaborative and the
community. A data warehouse project had been delayed because of HIPAA
compliance concerns, but is now being revisited as a result of the data collected in this
project that will now be reported on an ongoing basis.
Often it is said, that research in the community setting is “messy.” It cannot be
disputed that such research is complicated by politics, competition, and a focus on
business operations rather than on an academic pursuit of knowledge. However, as
funding for health services continues to dwindle, it becomes more important to the
community to learn how to conduct sound health services research. It is also important
for researchers to learn how to work interactively with the community to collect data and
conduct high quality, meaningful studies.
157

Community-based health services research can provide important information to
the community for health planning. It is the researcher’s hope that the effort undertaken
to complete this project has expanded the opportunity for enhanced health services
research in the local community and region.
158

APPENDIX A: REQUIRED DATA ELEMENTS
159

REQUIRED DATA ELEMENTS FOR PRIMARY CARE ACCESS NETWORK
EMERGENCY DEPARTMENT (ED) AND CLINIC VISIT STUDY For Hospital Respondents:
• Presence or absence of case management in the emergency department
• Case Management coverage schedule
• Case Management job responsibilities
• Number of self pay visits in the ED from January 2001 – December 2003, month
by month
• Number of non-urgent visits in the ED from January 2001-December 2003,
month by month, by zip code, gender, age, race/ethnicity
• Method of determining “non-urgent visit”
• Walk out rate in the ED by month
• Average charge for non-urgent visit in the ED
For Clinic Respondents:
• Date clinic opened
• Days and hours of operation
• Information on emergency department follow up appointments
• Percentage of patients who keep follow up appointments
• Number of self pay visits from January 2001-December 2003, month by month,
by zip code, by gender, age, race/ethnicity
• Average charge for primary care visit
160

APPENDIX B: AUTHORIZATION TO COLLECT DATA
161

Authorization to Collect Data for the
Primary Care Access Network Comprehensive Emergency Department Study
Karen van Caulil, a doctoral candidate at the University of Central Florida, has permission to collect data from my organization for her dissertation research. Ms. van Caulil has submitted to us the data elements to be collected and my organization is ready, willing and able to participate in this important research effort. All HIPAA related concerns have been addressed and the proposed research project will be compliant with current laws pertaining to patient confidentiality. _____________________________________________________________________ Name (Signature) ____________________________ Title ____________________________________________ Organization Name _______________________________ Date Please fax completed form to Karen van Caulil at (407) 671-5474. Thank you.
162

APPENDIX C: INSTRUMENT 1
163

PRIMARY CARE ACCESS NETWORK EMERGENCY DEPARTMENT AND CLINIC VISIT STUDY
INSTRUMENT 1 HOSPITAL EMERGENCY DEPARTMENT STATISTICS
Thank you for agreeing to participate in a study to determine the level of impact Primary Care Access Network clinics have had on the non-urgent visits to Orange County’s emergency departments. The following data is requested of your organization by November 1, 2003. Please contact Karen van Caulil at (407) 671-2005, ext. 215 if you have any questions or concerns. Karen is conducting this study as a requirement for the completion of her doctoral studies at the University of Central Florida. She will present this information to the Primary Care Access Network upon completion. Name of Hospital:_________________________________________________ Date of Completion of Form:__________________________________________ Question 1: Does your emergency department have on staff a case manager dedicated to working with uninsured/self pay patients? ( ) Yes ( ) No Question 2: If yes to Question 1, please indicate what hours and days of the week a dedicated case manager is scheduled. Please check all that apply: Hours ( ) 24 hours a day ( ) 15-23 hours a day ( ) 9-14 hours a day ( ) 0-8 hours a day Days ( ) 7 days a week ( ) 6 days a week ( ) 5 days a week ( ) 4 days a week ( ) 3 days a week ( ) 2 days a week ( ) 1 day a week Question 3: Are instructions given to self pay/uninsured patients to return to the emergency department for follow up care? ( ) Yes ( ) No
164

Question 4: If yes, in what instances are these instructions given? Check all that apply: ( ) Suture removal ( ) Ear infection re-check ( ) Dressing change ( ) Other – please list __________________________________ Question 5: Are instructions given to self pay/uninsured patients to obtain follow up care at local primary care centers? ( ) Yes ( ) No Question 6: If yes to Question 4, please check one below: ( ) A direct referral/appointment is made for the patient by a member of the ED staff with a local primary care center. ( ) Information is given to the patient so that he or she can make the appointment. ( ) Other: please describe_____________________________________________________
165

Question 7: Please record the number of self pay (i.e. uninsured) emergency department visits by month for calendar year 2001, calendar year 2002, and January-June 2003. This data should include all levels of severity of care delivered to self pay patients during this time period. MONTH NUMBER OF SELF PAY VISITS
January 2001 February 2001 March 2001 April 2001 May 2001 June 2001 July 2001 August 2001 September 2001 October 2001 November 2001 December 2001 January 2002 February 2002 March 2002 April 2002 May 2002 June 2002 July 2002 August 2002 September 2002 October 2002 November 2002 December 2002 January 2003 February 2003 March 2003 April 2003 May 2003 June 2003
166

Question 8: Please report the number of self pay (i.e uninsured) NON-URGENT emergency department visits by month for calendar year 2001, calendar year 2002, and January-June 2003. Please provide your organization’s definition (or method) of determining “non-urgent” visit below or as an attachment to this form. MONTH NUMBER OF NON-URGENT VISITS
January 2001 February 2001 March 2001 April 2001 May 2001 June 2001 July 2001 August 2001 September 2001 October 2001 November 2001 December 2001 January 2002 February 2002 March 2002 April 2002 May 2002 June 2002 July 2002 August 2002 September 2002 October 2002 November 2002 December 2002 January 2003 February 2003 March 2003 April 2003 May 2003 June 2003
Question 9: For the non-urgent visits reported in Question (B) above, please report the number of visits per zip code area for each month. The tables include all zip codes in Orange County, plus lines for all other counties in Florida, all other states, out of the country, and a category to include visits where no patient origin information is provided. There are 5 separate tables provided to respond to this question: (1) Jan 2001-Jun 2001; (2) Jul 2001-Dec 2001; (3) Jan 2002-Jun 2002; (4) Jul 2002-Dec 2002; (5) Jan 2003-Jun 2003.
167

NOTE: Responding to this question will allow the researcher to pinpoint the impact of each individual primary care clinic on emergency department utilization and map the level of non-urgent care activity in each zip code. Thank you in advance for taking the time to provide this information in detail. ZIP CODE JAN 2001 FEB 2001 MAR 2001 APR 2001 MAY 2001 JUN 2001 32703 32704 32709 32710 32712 32751 32768 32777 32789 32790 32792 32793 32794 32798 32801 32802 32803 32804 32805 32806 32807 32808 32809 32810 32811 32812 32814 32816 32817 32818 32819 32820 32821 32822 32824 32825 32826 32827 32828 32829 32830 32831 32832 32833 32834 32835 32836 32837 32839 32853 32854 32855
168

32856 32857 32858 32859 32860 32861 32862 32867 32868 32869 32872 32877 32878 32885 32886 32887 32890 32891 32893 32896 32897 32898 34734 34740 34760 34761 34777 34778 34786 34787 Other FL Other State Out of US None given
ZIP CODE JUL 2001 AUG 2001 SEP 2001 OCT 2001 NOV 2001 DEC 2001 32703 32704 32709 32710 32712 32751 32768 32777 32789 32790 32792 32793 32794 32798 32801 32802 32803 32804 32805 32806
169

32807 32808 32809 32810 32811 32812 32814 32816 32817 32818 32819 32820 32821 32822 32824 32825 32826 32827 32828 32829 32830 32831 32832 32833 32834 32835 32836 32837 32839 32853 32854 32855 32856 32857 32858 32859 32860 32861 32862 32867 32868 32869 32872 32877 32878 32885 32886 32887 32890 32891 32893 32896 32897 32898 34734 34740 34760
170

34761 34777 34778 34786 34787 Other FL Other State Out of US None given
ZIP CODE Jan 2002 Feb 2002 Mar 2002 Apr 2002 May 002 Jun 2002 32703 32704 32709 32710 32712 32751 32768 32777 32789 32790 32792 32793 32794 32798 32801 32802 32803 32804 32805 32806 32807 32808 32809 32810 32811 32812 32814 32816 32817 32818 32819 32820 32821 32822 32824 32825 32826 32827 32828 32829 32830 32831 32832 32833 32834
171

32835 32836 32837 32839 32853 32854 32855 32856 32857 32858 32859 32860 32861 32862 32867 32868 32869 32872 32877 32878 32885 32886 32887 32890 32891 32893 32896 32897 32898 34734 34740 34760 34761 34777 34778 34786 34787 Other FL Other State Out of US None given
ZIP CODE JUL 2002 AUG 2002 SEP 2002 OCT 2002 NOV 2002 DEC 2002 32703 32704 32709 32710 32712 32751 32768 32777 32789 32790 32792 32793 32794
172

32798 32801 32802 32803 32804 32805 32806 32807 32808 32809 32810 32811 32812 32814 32816 32817 32818 32819 32820 32821 32822 32824 32825 32826 32827 32828 32829 32830 32831 32832 32833 32834 32835 32836 32837 32839 32853 32854 32855 32856 32857 32858 32859 32860 32861 32862 32867 32868 32869 32872 32877 32878 32885 32886 32887 32890 32891
173

32893 32896 32897 32898 34734 34740 34760 34761 34777 34778 34786 34787 Other FL Other State Out of US None given
ZIP CODE JAN 2003 FEB 2003 MAR 2003 APR 2003 MAY 2003 JUN 2003 32703 32704 32709 32710 32712 32751 32768 32777 32789 32790 32792 32793 32794 32798 32801 32802 32803 32804 32805 32806 32807 32808 32809 32810 32811 32812 32814 32816 32817 32818 32819 32820 32821 32822 32824 32825 32826 32827
174

32828 32829 32830 32831 32832 32833 32834 32835 32836 32837 32839 32853 32854 32855 32856 32857 32858 32859 32860 32861 32862 32867 32868 32869 32872 32877 32878 32885 32886 32887 32890 32891 32893 32896 32897 32898 34734 34740 34760 34761 34777 34778 34786 34787 Other FL Other State Out of US None given
175

Question 10: Please provide the number of non-urgent visits by males and the number of non-urgent visits by females for each month. MONTH # NONURG VISITS BY MALES # NONURG VISITS BY FEMALES January 2001 February 2001 March 2001 April 2001 May 2001 June 2001 July 2001 August 2001 September 2001 October 2001 November 2001 December 2001 January 2002 February 2002 March 2002 April 2002 May 2002 June 2002 July 2002 August 2002 September 2002 October 2002 November 2002 December 2002 January 2003 February 2003 March 2003 April 2003 May 2003 June 2003
176

Question 11: Please provide the number of non-urgent visits by age category for each month. MONTH <5 years 6-14 15-24 25-44 45-64 >65 Jan 2001 Feb 2001 Mar 2001 Apr 2001 May 2001 Jun 2001 Jul 2001 Aug 2001 Sep 2001 Oct 2001 Nov 2001 Dec 2001 Jan 2002 Feb 2002 Mar 2002 Apr 2002 May 2002 Jun 2002 Jul 2002 Aug 2002 Sep 2002 Oct 2002 Nov 2002 Dec 2002 Jan 2003 Feb 2003 Mar 2003 Apr 2003 May 2003 Jun 2003
177

Question 12: Please provide race/ethnicity information for the non-urgent visits for each month. MONTH
White/ Non-Hispanic
White/ Hispanic
Black/ Non- Hispanic
Black/ Hispanic
Asian/ Pacific Islander
Amer Indian/ Eskimo/ Aleut
Other
Jan 2001 Feb 2001 Mar 2001 Apr 2001 May 2001 Jun 2001 Jul 2001 Aug 2001 Sep 2001 Oct 2001 Nov 2001 Dec 2001 Jan 2002 Feb 2002 Mar 2002 Apr 2002 May 2002 Jun 2002 Jul 2002 Aug 2002 Sep 2002 Oct 2002 Nov 2002 Dec 2002 Jan 2003 Feb 2003 Mar 2003 Apr 2003 May 2003 Jun 2003
178

Question 13: Please provide the walkout rate (the number of individuals who sign in to the emergency department but do not stay to see a physician/provider divided by the total number of individuals who sign in to the emergency department) in your emergency department for each month. Please also provide the average wait time in minutes from check-in to the time seen by a physician/provider for each month. Month Walkout Rate Average Wait Time (minutes) January 2001 February 2001 March 2001 April 2001 May 2001 June 2001 July 2001 August 2001 September 2001 October 2001 November 2001 December 2001 January 2002 February 2002 March 2002 April 2002 May 2002 June 2002 July 2002 August 2002 September 2002 October 2002 November 2002 December 2002 January 2003 February 2003 March 2003 April 2003 May 2003 June 2003 Question 14: Please provide the average charge for a non-urgent visit at your facility. This information will be used to compare a non-urgent emergency department visit to a visit at a primary care clinic. $_____________
179

APPENDIX D: INSTRUMENT 2
180

PRIMARY CARE ACCESS NETWORK EMERGENCY DEPARTMENT AND CLINIC VISIT STUDY
INSTRUMENT 2 PRIMARY CARE ACCESS NETWORK CLINIC STATISTICS
Thank you for agreeing to participate in a study to determine the level of impact Primary Care Access Network clinics have had on the nonurgent visits to Orange County’s emergency departments. The following data is requested of your organization for each separate clinic site in Orange County by ________. Please contact Karen van Caulil at (407) 671-2005, ext. 215 if you have any questions or concerns. Karen is conducting this study as a requirement for the completion of her doctoral studies at the University of Central Florida. She will present this information to the Primary Care Access Network (PCAN) upon completion.
Name of PCAN-affiliated clinic:_________________________________________ Date of Completion of Form:__________________________________________ Question 1: What was the date that this clinic opened? ____________ Question 2: What are your days and hours of operation? ______________ HOURS OF OPERATION (please list) Sunday: ______________________ Monday: ______________________ Tuesday: ______________________ Wednesday: ______________________ Thursday: ______________________ Friday: ______________________ Saturday: ______________________ Question 3: Does your clinic block appointments for emergency department follow up? ( ) Yes ( ) No
181
Question 4: If yes to Question 2, how many appointment slots per day? ____________ Question 5: If yes to Question 2, for which hospitals? Question 6: If yes to Question 2, what percentage of patients keep these emergency department follow up appointments? ___________
182
Question 7: Please record the number of self pay (i.e. uninsured) clinic visits by month for calendar year 2001, calendar year 2002, and January-June 2003. MONTH NUMBER OF SELF PAY VISITS
January 2001 February 2001 March 2001 April 2001 May 2001 June 2001 July 2001 August 2001 September 2001 October 2001 November 2001 December 2001 January 2002 February 2002 March 2002 April 2002 May 2002 June 2002 July 2002 August 2002 September 2002 October 2002 November 2002 December 2002 January 2003 February 2003 March 2003 April 2003 May 2003 June 2003 July 2003 August 2003 September 2003 October 2003 November 2003 December 2003
183

Question 8: For the self pay visits reported in Question 5 above, please report the number of visits per zip code area for each month. The tables include all zip codes in Orange County, plus lines for all other counties in Florida, all other states, out of the country, and a category to include visits where no patient origin information is provided. There are 6 tables provided to respond to this question: (1) Jan 2001-Jun 2001; (2) Jul 2001-Dec 2001; (3) Jan 2002-Jun 2002; (4) Jul 2002-Dec 2002; (5) Jan 2003-Jun 2003; Jul 2003- Dec 2003. NOTE: Responding to this question will allow the researcher to pinpoint the impact of each individual primary care clinic on emergency department utilization and create maps showing the changes in use of the emergency departments and clinics by zip code. Thank you in advance for taking the time to provide this information in detail. ZIP CODE
JAN 2001
FEB 2001
MAR 2001
APR 2001
MAY 2001
JUN 2001
32703 32704 32709 32710 32712 32751 32768 32777 32789 32790 32792 32793 32794 32798 32801 32802 32803 32804 32805 32806 32807 32808 32809 32810 32811 32812 32814 32816 32817 32818 32819 32820
184

32821 32822 32824 32825 32826 32827 32828 32829 32830 32831 32832 32833 32834 32835 32836 32837 32839 32853 32854 32855 32856 32857 32858 32859 32860 32861 32862 32867 32868 32869 32872 32877 32878 32885 32886 32887 32890 32891 32893 32896 32897 32898 34734
185

34740 34760 34761 34777 34778 34786 34787 Other FL Other State
Out of US
None given
ZIP CODE
JUL 2001 AUG 2001
SEP 2001
OCT 2001
NOV 2001
DEC 2001
32703 32704 32709 32710 32712 32751 32768 32777 32789 32790 32792 32793 32794 32798 32801 32802 32803 32804 32805 32806 32807 32808 32809 32810 32811 32812
186

32814 32816 32817 32818 32819 32820 32821 32822 32824 32825 32826 32827 32828 32829 32830 32831 32832 32833 32834 32835 32836 32837 32839 32853 32854 32855 32856 32857 32858 32859 32860 32861 32862 32867 32868 32869 32872 32877 32878 32885 32886 32887 32890
187

32891 32893 32896 32897 32898 34734 34740 34760 34761 34777 34778 34786 34787 Other FL Other State
Out of US
None given
ZIP CODE
Jan 2002 Feb 2002 Mar 2002 Apr 2002 May 2002
Jun 2002
32703 32704 32709 32710 32712 32751 32768 32777 32789 32790 32792 32793 32794 32798 32801 32802 32803 32804 32805 32806
188

32807 32808 32809 32810 32811 32812 32814 32816 32817 32818 32819 32820 32821 32822 32824 32825 32826 32827 32828 32829 32830 32831 32832 32833 32834 32835 32836 32837 32839 32853 32854 32855 32856 32857 32858 32859 32860 32861 32862 32867 32868 32869 32872
189

32877 32878 32885 32886 32887 32890 32891 32893 32896 32897 32898 34734 34740 34760 34761 34777 34778 34786 34787 Other FL Other State
Out of US
None given
190

ZIP CODE
JUL 2002 AUG 2002
SEP 2002
OCT 2002
NOV 2002
DEC 2002
32703 32704 32709 32710 32712 32751 32768 32777 32789 32790 32792 32793 32794 32798 32801 32802 32803 32804 32805 32806 32807 32808 32809 32810 32811 32812 32814 32816 32817 32818 32819 32820 32821 32822 32824 32825 32826 32827 32828 32829 32830
191

32831 32832 32833 32834 32835 32836 32837 32839 32853 32854 32855 32856 32857 32858 32859 32860 32861 32862 32867 32868 32869 32872 32877 32878 32885 32886 32887 32890 32891 32893 32896 32897 32898 34734 34740 34760 34761 34777 34778 34786 34787 Other FL Other
192

State Out of US
None given
ZIP CODE
JAN 2003
FEB 2003
MAR 2003
APR 2003
MAY 2003
JUN 2003
32703 32704 32709 32710 32712 32751 32768 32777 32789 32790 32792 32793 32794 32798 32801 32802 32803 32804 32805 32806 32807 32808 32809 32810 32811 32812 32814 32816 32817 32818 32819 32820 32821 32822 32824
193

32825 32826 32827 32828 32829 32830 32831 32832 32833 32834 32835 32836 32837 32839 32853 32854 32855 32856 32857 32858 32859 32860 32861 32862 32867 32868 32869 32872 32877 32878 32885 32886 32887 32890 32891 32893 32896 32897 32898 34734 34740 34760 34761
194

34777 34778 34786 34787 Other FL Other State
Out of US
None given
ZIP CODE
JUL 2003 AUG 2003
SEP 2003
OCT 2003
NOV 2003
DEC 2003
32703 32704 32709 32710 32712 32751 32768 32777 32789 32790 32792 32793 32794 32798 32801 32802 32803 32804 32805 32806 32807 32808 32809 32810 32811 32812 32814 32816 32817
195

32818 32819 32820 32821 32822 32824 32825 32826 32827 32828 32829 32830 32831 32832 32833 32834 32835 32836 32837 32839 32853 32854 32855 32856 32857 32858 32859 32860 32861 32862 32867 32868 32869 32872 32877 32878 32885 32886 32887 32890 32891 32893 32896
196

32897 32898 34734 34740 34760 34761 34777 34778 34786 34787 Other FL Other State
Out of US
None given
197
Question 9: Please provide the number of self pay visits by males and the number of self pay visits by females for each month. MONTH # SELF PAY VISITS BY
MALES # SELF PAY VISITS BY FEMALES
January 2001 February 2001 March 2001 April 2001 May 2001 June 2001 July 2001 August 2001 September 2001 October 2001 November 2001 December 2001 January 2002 February 2002 March 2002 April 2002 May 2002 June 2002 July 2002 August 2002 September 2002 October 2002 November 2002 December 2002 January 2003 February 2003 March 2003 April 2003 May 2003 June 2003 July 2003 August 2003 September 2003 October 2003 November 2003 December 2003
198

Question 10: Please provide the number of self pay visits by age category for each month. MONTH <5 years 6-14 15-24 25-44 45-64 >65 Jan 2001 Feb 2001 Mar 2001 Apr 2001 May 2001 Jun 2001 Jul 2001 Aug 2001 Sep 2001 Oct 2001 Nov 2001 Dec 2001 Jan 2002 Feb 2002 Mar 2002 Apr 2002 May 2002 Jun 2002 Jul 2002 Aug 2002 Sep 2002 Oct 2002 Nov 2002 Dec 2002 Jan 2003 Feb 2003 Mar 2003 Apr 2003 May 2003 Jun 2003 Jul 2003 Aug 2003 Sep 2003 Oct 2003 Nov 2003 Dec 2003
199

Question 11: Please provide race/ethnicity information for the self pay visits for each month. MONTH
White/ Non-Hispanic
White/ Hispanic
Black/ Non- Hispanic
Black/ Hispanic
Asian/ Pacific Islander
Amer Indian/ Eskimo/ Aleut
Other
Jan 2001 Feb 2001 Mar 2001 Apr 2001 May 2001 Jun 2001 Jul 2001 Aug 2001 Sep 2001 Oct 2001 Nov 2001 Dec 2001 Jan 2002 Feb 2002 Mar 2002 Apr 2002 May 2002 Jun 2002 Jul 2002 Aug 2002 Sep 2002 Oct 2002 Nov 2002 Dec 2002 Jan 2003 Feb 2003 Mar 2003 Apr 2003 May 2003 Jun 2003 Jul 2003 Aug 2003 Sep 2003 Oct 2003 Nov 2003 Dec 2003
200

Question 12: Please provide the average charge for a primary care visit at your facility. This information will be used to compare the cost of a primary care visit to a non-urgent visit to the emergency department. $___________
201

APPENDIX E: FEEDBACK QUESTIONNAIRE
202

PRIMARY CARE ACCESS NETWORK FOLLOW-UP QUESTIONS TO
EMERGENCY DEPARTMENT/CLINIC STUDY PRESENTATION
How consistent are the study results with your expectations prior to the presentation? (Check one) ( ) Very consistent ( ) Consistent ( ) Neither consistent nor inconsistent ( ) Inconsistent ( ) Very inconsistent How useful will the data gathered in this study be for your organization’s planning as it pertains to ongoing involvement in the Primary Care Access Network? ( ) Useful ( ) Neither useful or not useful ( ) Not useful Please identify your level of agreement with the following statement: The data gathered in this study should continue to be gathered and monitored as part of the program evaluation of the Primary Care Access Network. ( ) Agree strongly ( ) Agree somewhat ( ) Neither agree nor disagree ( ) Disagree somewhat ( ) Disagree strongly
203

APPENDIX F: IRB APPROVAL
204

205
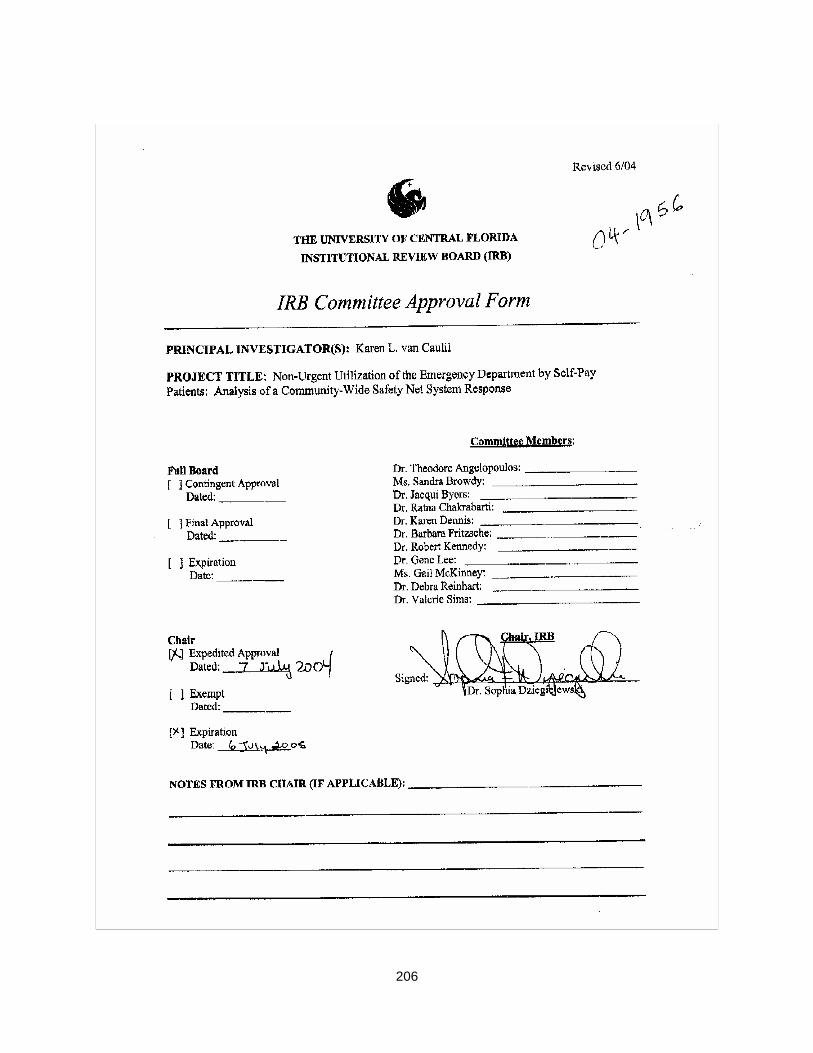
206
LIST OF REFERENCES
Aday, L.A., Anderson, R. (1975). Access to Medical Care. Ann Arbor, MI: Health
Administration Press. Afilalo, J., Marinovich, A., Afilalo, M., Colacone, A., Leger, R., Under, B., & Giguere, C.
(2004). Non-urgent emergency department patient characteristics and barriers to primary care. Academic emergency medicine, 11(12), 1302-1310.
Agency for Health Care Administration. (2005). Governor Bush announces plan to
transfer Medicaid. Retrieved January 12, 2005 on the World Wide Web: www.empoweredcare.com
American College of Emergency Physicians. (2000). Defending America’s Safety Net.
1998-1999 safety net workgroup report. Dallas, TX: ACEP Press. American College of Emergency Physicians. (2004). Emergency Medicine Statistical
Profile. Retrieved March 12, 2004 on the World Wide Web: www.acep.org American College of Physicians – American Society of Internal Medicine (2000). No
health insurance? It’s enough to make you sick. Philadelphia, PA: American College of Physicians.
American Hospital Association. (2004). Hospital Statistics. Chicago, IL: Health Forum. American Medical News. (2005). Medicaid revamps spark access worried. Retrieved
January 31, 2005 on the World Wide Web: www.ama-assn.org Ansell, D., Schiff, R., Goldberg, D., Furumoto-Dawson, A., Dick, S., & Peterson, C.
(2002). Primary care access decreases non-urgent hospital visits for indigent diabetics. Journal of health care for the poor and underserved, 13(2), 171-183.
Appleby, J. (2005). Barrage of lawsuits huge wake-up call for non-profit hospitals.
Retrieved March 1, 2005 on the World Wide Web: www.nonprofithealthcare.com Ashby, W.R. (1966). An introduction to cybernetics. New York: John Wiley & Sons. Asplin, B.R. (2001). Tying a knot in the unraveling health care safety net. Academic
emergency medicine, 8(11), 1075-1079. Baker, D.W., Stevens, C.D., & Brook, R.H. (1991). Patients who leave a public hospital
emergency department without being seen by a physician. Causes and
207

consequences. The journal of the American Medical Association, 266(8), 1085-1090.
Baker, D.W., Stevens, C.D., & Brook, R.H. (1994). Regular source of ambulatory care
and medical care utilization by patients presenting to a public hospital emergency department. The journal of the American Medical Association, 271(24), 1909-1912.
Baker, L.C., & Baker, L.S. (1994). Excess cost of emergency department visits for non-
urgent care. Health affairs, 13(5), 162-171. Baxter, R. & Mechanic, R.E. (1997). The status of local health care safety nets. Health
affairs, 16(4), 7-23. Becker, M.H., Drachman, R.H., Kirscht, J.P. (1972). Predicting mothers’ compliance
with pediatric medical regimes. Journal of pediatrics, 81(4), 843-854. Bentley, L. (2004). Paulo Freire. Retrieved February 13, 2004 on the World Wide Web:
www.unomaha.com Billings, J., Parikh, N., & Mijanovich, T. (2000). Emergency department use in New York
City: a substitute for primary care? (Issue Brief No. 433). New York: Commonwealth Fund.
Billings, J., Parikh, N., & Mijanovich, T. (2000). Emergency department use in New
York City: a survey of Bronx patients. Issue Brief No. 435. New York: Commonwealth Fund.
Billings. J. & Teicholz, N. (1990). Data Watch. Uninsured patients in District of
Columbia hospitals. Health affairs, 9(4), 158-165. Bindman, A.B., Grumbach, K., Keane, D., Rauch, L., & Luce, J.M. (1991).
Consequences of queuing for care at a public hospital emergency department. The journal of the American Medical Association, 266(8), 1091-1096.
Blumberg, L.J., & Liska, D.W. (1996). The uninsured in the United States: a status
report. Washington, D.C.: The Urban Institute. Boulding, K.E.(1985). The world as a total system. Beverly Hills, CA: Sage
Publications. Bradbury, R.C., Golec, J.H., & Steen, P.M. (2001). Comparing uninsured and privately
insured hospital patients: admission severity, health outcomes and resource use. Health services management research, 14(3), 203-210.
208
Brousseau, D.C., Danserau, L.M., Linakis, J.G., Leddy, T., & Vivier, P.M. (2002). Pediatric emergency department utilization within a statewide Medicaid managed care system. Academic emergency medicine, 9(4), 296-299.
Buesching, D.P., Jablonowski, A., Vesta, E., Dilts, W., Runge, C., Lund, J., & Porter, R.
(1985). Inappropriate emergency department visits. Annals of emergency medicine, 14(7), 672-676.
Bureau of Primary Health Care (2004). Community Access Program. Retrieved March
1, 2004 on the World Wide Web at http://bphc.hrsa.gov/cap Burstin, H.R., Swartz, K., O’Neil, A.C., Orav, E.J., Brennan, T.A. (1999). The effect of
change in health insurance on access to care. Inquiry, 35(4), 389-397. Cameron, L.D. & Leventhal, H. (Eds.) (2003). The self-regulation of health and illness
behaviour. London: Rutledge. Carpenter, D. (2001). Our overburdened ERs. Hospitals and health networks, 75(3),
44-47. Case Management Society of America. (1995). Standards of practice for case
management. Little Rock, Arkansas. Centers for Medicare and Medicaid Services. (2004). Emergency medical treatment
and labor act (EMTALA) resource. Retrieved April 12, 2004 on the World Wide Web at www.cms.hhs.gov/providers/emtala
Cetta, MG, Asplin, B.R., Fields, W.W., & Yeh, C.S. (2000). Emergency medicine and
the debate over the uninsured: a report from the task force on health and the uninsured. Annals of emergency medicine, 36(3), 242-246.
Chan, L.S., Galaif, M.A., Kushi, C.L., Bernstein, S., Fagelson, H.J., & Drozd, P.J. (1985).
Referrals from hospital emergency departments to primary care centers for non-urgent care. Journal of ambulatory care management, 8(1), 57-69.
Christakis, D.A. (2003). Continuity of care: process or outcome? Annals of family
medicine, 1(3), 131-133. Christakis, D.A., Mell, L., Koepsell, T.D., Zimmerman, F.J. & Connell, F.A. (2001).
Association of lower continuity of care with greater risk of emergency department use and hospitalization in children. Pediatrics, 107(3), 524-529.
Clancy, C.M., & Eisenberg, J.M. (1997). Emergency medicine in population-based
systems of care. Annals of emergency medicine, 30(6), 800-803.
209

Commonwealth Fund. (2000). Emergency department use in New York City. Briefing Note. Retrieved May 12, 2003 on the World Wide Web: www.cmwf.org/programs/newyork/billings_emergency_bn_433.asp
Cooke, J., & Finneran, K. (1994). A clearing in the crowd: innovations in emergency
services. Paper Series. New York: United Hospital Fund of New York. Counselman, F.L., Graffeo, C.A., & Hill, J.T. (2000). Patient satisfaction with physician
assistants in an emergency department fast track. American journal of emergency medicine, 18(6), 661-665.
Cunningham, P.J., Clancy, C.M., Cohen, J.W., & Wilets, M. (1995). The use of hospital
emergency departments for non-urgent health problems: a national perspective. Medical care research and review, 52(4), 453-474.
Custer, W. & Ketsche, P. (1999). Health insurance coverage and the uninsured: 1990-
1998. Washington, DC: Health Insurance Association of America. Davis, K. & Schoen, C. (1977). Health and the war on poverty: a ten-year appraisal.
Washington, DC: The Brooking Institute. Derlet, R.W., Kinser, D., Ray, L., Hamilton, B., & McKenzie, J. (1995). Prospective
identification and triage of non-emergency patients out of an emergency department: a 5-year study. Annals of emergency medicine, 25(2), 215-223.
Dohan, D. (2002). Managing indigent care: a case study of a safety-net emergency
department. Health services research, 37(2), 361-376. Doobinin, K.A., Heidt-Davis, P.E., Gross, T.K., & Isaacman, D.J. (2003). Non-urgent
pediatric emergency department visits: care-seeking behavior and parental knowledge of insurance. Pediatric emergency care, 19(1), 10-14.
Duncan, R.P., C.K. Porter, C.W. Garvan and A.G. Hall. (2004). The Florida Health
Insurance Study 2004. The University of Florida Department of Health Services Research, Management and Policy under contract to the Agency for Health Care Administration, Tallahassee, FL. Retrieved January 3, 2005 on the World Wide Web at http://www.fdhc.state.fl.us/
Fernandes, C.M., Price, A., & Christensen, J.M. (1997). Does reduced length of stay
decrease the number of emergency department patients who leave without seeing a physician? The journal of emergency medicine, 15(3), 397-399.
Florida College of Emergency Physicians. (2002). A study of emergency department
utilization in four Orlando area hospitals. University of Central Florida.
210

Department of Health Professions. Health Care Finance Class. November 15, 2002.
Florida Department of Health (2003). Behavioral Risk Factor Surveillance Survey.
Retrieved August 1, 2003 on the World Wide Web: http://www.doh.state.fl.us/disease_ctrl/epi/BRFSS_Reports Florida Hospital. (2002). Florida Hospital posts $17 million in uncompensated care in
January, while UCF study urges strong action on indigent health care. Orlando, FL: Health Issues Brief.
Franco, S.M., Mitchell, C.K., & Buzon, R.M. (1997). Primary care physician access and
gate-keeping: a key to reducing emergency department use. Clinical pediatrics, 36(2), 63-68.
Fronstin, P. (2000). Sources of health insurance and characteristics of the uninsured:
analysis of the March 1999 Current Population Survey. EBRI Issue Brief No. 217. Washington, DC: Employee Benefit Research Institute.
Gadotti, M. (1996). Reading Paulo Freire. New York: SUNY Press. Gill, J.M., & Mainous, A.G. (1998). The role of provider continuity in preventing
hospitalizations. Archives of family medicine, (4)7, 352-357. Gill, J.M., & Riley, A.W. (1996). Non-urgent use of the hospital emergency departments:
urgency from the patient’s perspective. Journal of family practice, 42(5), 491-496. Glanz., K., Rimer, B., & Lewis, F. (Eds.). (2002). Health behavior and health education.
San Francisco: Jossey-Bass. Grossman, L.K., Rich, L.N., & Johnson, C. (1998). Decreasing non-urgent emergency
department utilization by Medicaid children. Pediatrics, 102(1), 20-24. Grumbach, K., Keane, D., & Bindman, A. (1993). Primary care and public emergency
department overcrowding. American journal of public health, 83(3), 372-378. Gustafson, D.H., Cats-Baril, W.L., & Alemi, F. (1992). Systems to support health policy
analysis: theory, models and uses. Ann Arbor, MI: Health Administration Press. Guttman, N., Nelson, M.S., & Zimmerman, D.R. (2001). When the visit to the
emergency department is medically non-urgent: provider ideologies and patient advice. Qualitative health research, 11(2), 161-178.
211

Hampers, L.C., Cha, S., Gutglass, D.J., Binns, H.J., & Krug, S.E. (1999). Fast track and the pediatric emergency department: resource utilization and patient outcomes. Academic emergency medicine, 6(11), 1153-1159.
Haugh, R. (2001). Chaos in your ED? Look on the bright side. Hospitals and health
networks, 75(8), 16. Hayward, R.A., Bernard, A.M., Freeman, H.E., & Corey, C.R. (1991). Regular source of
ambulatory care and access to health services. American journal of public health, 81 (4), 434-438.
Health Care Strategic Management. (2002). Most visits to ED unnecessary (statistical
notes). Health Care Strategic Management, 20(9), 4. Health Council of East Central Florida. (2002). Primary Care Access Study. Retrieved
July 23, 2003 on the World Wide Web: www.hcecf.org. Health Council of East Central Florida. (2003). Healthy people in healthy communities.
Regional Health Plan 2003-2006. Orlando, FL. Health Council of East Central Florida. (2005). Hospital data reports. Retrieved January
29, 2005 on the World Wide Web: www.hcecf.org Health Resources and Services Administration (2004). Budget and appropriations.
Retrieved March 1, 2004 on the World Wide Web: www.hrsa.gov/budget.htm Jarvis, P., Holford, C., Griffin, C. (1998). The theory and practice of learning. London:
Kogan-Page. Jordan, J., Adamo, A., & Ehrman, T. (2000). Innovations in Section 1115
demonstrations. Health care financing review, 22(2), 49-59. Kellerman, A., (2002). Coverage matters: insurance and health care. Annals of
emergency medicine, 40(6), 644-647. Koziol-McLain, J., Price, D.W., Weiss, B., Quinn, A.A., & Honigman, B. (2000). Seeking
care for non-urgent medical conditions in the emergency department: through the eyes of the patient. Journal of emergency nursing, 26(6), 554-563.
Lewin Group. (2002). Emergency department overload: a growing crisis. Washington,
DC: American Hospital Association. Lewin, K. (1951). Field theory in social science. Chicago: University of Chicago Press,
212

Lewin, M.E., Altman, S., eds. (2000). American’s health care safety net: intact but endangered. Institute of Medicine Report. Washington, DC: National Academy Press.
Lowe, R.A., & Bindman, A.B. (1997). Judging who needs emergency department care:
a prerequisite for policy-making. American journal of emergency medicine, 15(2), 133-6.
Lucas, R.H. & Sanford, S.M. (1998). An analysis of frequent users of emergency care
at an urban university hospital. Annals of emergency medicine, 32(5), 563-568. MacLean, S.L., Bayley, E.W., Cole, F.L., Bernardo, L., Lenaghan, P., & Manton, A.
(1999). The LUNAR project: A description of the population of individuals who seek health care at emergency departments. Journal of emergency nursing, 25(4), 269-282.
Mainous, A.G. & Gill, J.M. (1998). The importance of continuity of care in the likelihood
of future hospitalizations: is site of care equivalent to a primary clinician? American journal of public health, 88(10), 1539-1541.
Malone, R.E. (1995). Heavy users of emergency services: social construction of a
policy problem. Social science and medicine, 40(4), 469-477. McCaig, L., Burt, C. (2003). National hospital ambulatory medical care Survey: 2000
emergency department summary. (Advance Data No. 335). Atlanta, GA: Centers for Disease Control.
McCarthy, M.L., Hirshon, J.M., Ruggles, R.L., Docimo, A.B., Welinsky, M., & Bessman,
E.S. (2002). Referral of medically uninsured emergency department patients to primary care. Academic emergency medicine, 9(6), 639-641.
Medical Expenditure Panel Survey. (2003). MEPS household compendia of tables.
Rockville, MD: Agency for Healthcare research and quality. Medical Scientists, Inc. (2003). AHCA/PHS reconciliation report. Report of the
reconciliation methodology and preliminary analysis of first year results. June 25, 2003. Tallahassee, FL.
Mitchell, T.A., & Remmel, R.J. (1992). Level of uncompensated care delivered by
emergency physicians in Florida. Annals of emergency medicine, 21(10), 1208-1214.
Norman, P., Abraham, C., & Conner, M. (Eds.) (2000). Understanding and changing
health behaviour. Amsterdam: Harwood Academic Publishers.
213

Nutting, P.A., Goodwin, M.A., Flocke, S.A., Zyzanski, S.J. & Stange, K.C. (2003). Continuity of primary care: to whom does it matter and when? Annals of family medicine, 1(3), 149-155.
O’Brien, G.M., Shapiro, M.J., Woolard, R.W., O’Sullivan, P.S., & Stein, M.D. (1996).
“Inappropriate” emergency department use: a comparison of three methodologies for identification. Academic emergency medicine, 3(3), 252-257.
Okuyemi, K.S., & Frey, B. (2001). Describing and predicting frequent users of an
emergency department. Journal of the association for academic minority physicians, 12 (1-2), 119-123.
Pane, G.A., Farner, M.C., Salness, K.A. (1991). Health care access problems of
medically indigent emergency department walk-in patients. Annals of emergency medicine, 20(7), 730-733.
Peterson, L.A., Burstin, H.R., O’Neil, A.C., Orav, E.J., & Brennan, T.A. (1998). Non-
urgent emergency department visits. Medical care, 36(8), 1249-1255. Phelps, K., Nagel, R., Taylor, C., Klein, W., Kimmel, S. (2000). Factors associated with
emergency department utilization for non-urgent pediatric problems. Archives of family medicine, 9(10), 1086-1092.
Piehl, M.D., Clemens, C.J., & Joines, J.D., (2000). “Narrowing the gap”: decreasing
emergency department use by children enrolled in the Medicaid program. Archives of pediatrics and adolescent medicine, 154(8), 791-795.
Primary Care Access Network. (2001). Health resources and services administration
community access project. [grant applications]. Orange County, Florida. Raddish, M. Horn, S.D., & Sharkey, P.D. (1999). Continuity of care: is it cost effective?
American journal of managed care, 5(6), 727-734. Rask, K., Williams, M., McNagny, S., Parker, R., & Baker, D. (1998). Ambulatory health
care use by patients in a public hospital emergency department. Journal of general internal medicine, 13(9), 614-620.
Reeder, T., Locascio, E., Tucker, J., Czaplijski, T., Benson, N., & Meggs, W. (2002).
Emergency department utilization: the effect of changing demographics from 1992 to 2000. American journal of emergency medicine, 20(7), 583-587.
Richardson, L.D., & Hwang, U. (2001). America’s health care safety net: intact or
unraveling? Academic emergency medicine, 8(11), 1056-1063.
214
Robert Wood Johnson Foundation. (2003). Nearly 1 out of 3 non-elderly Americans were uninsured for all or part of 2002-2003. Covering the Uninsured Week. Retrieved March 15, 2003 on the World Wide Web at www.coveringtheuninsuredweek.org.
Robert Wood Johnson Foundation (2004). Covering the uninsured: glossary. Retrieved
October 11, 2004 on the World Wide Web at www.coveringtheuninsured.org/glossary
Roger, E. (1995). Diffusion of innovation. New York: Free Press. Rossi, P.H., Freeman, H.E., & Lipsey, M.W. (1999). Evaluation: a systematic approach.
6th ed. Thousand Oaks, CO: Sage Publication. Rotarius, T., Trujillo, A., Unruh, L., Fottler, M.D., Liberman, A., Morrison, S.D., Ross, D.,
& Cortelyou, K. (2002). Uncompensated care and emergency department utilization: a local study having national implications. Health care manager, 21(1), 1-38.
Rutter, D. & Quine, L. (Eds.) (2002). Changing health behaviour. Philadelphia: Open
University Press. Sarver, J.H., Cydulka, R.K., & Baker, D.W. (2002). Usual source of care and non-urgent
emergency department use. Academic emergency medicine, 9(9), 916-923. Schaefer, R.A., Rea, T.D., Ploide, M., Peiguss, K., Goldberg, P., & Murray, J.A. (2002).
An emergency medical services program of alternate destination of patient care. Prehospital emergency care, 6(3), 309-314.
Scharoun, K., van Caulil, K. & Liberman, A. (2002). Bioterrorism vs. health security –
crafting a plan of preparedness. Health care manager, 21(1), 74-92. Shear, C.L., Gipe, B.T., Mattheis, J.K. (1983). Provider continuity and quality of medical
care: a retrospective analysis of prenatal and perinatal outcome. Medical care, 21(12), 1204-1210.
Shesser, R., Kirsch, T., Smith, J., Hirsch, R. (1991). An analysis of emergency
department use by patients with minor illness. Annals of emergency medicine, 20(7), 743-748.
Simon, H.K., Ledbetter, D.A., & Wright, J. (1997). Societal savings by “fast tracking”
patients in an urban pediatric emergency department. American Journal of Emergency Medicine, 15(6), 551-554.
215

Simon, H.K., McLario, D., Daily, R., Lanese, C., Castillo, J., & Wright, J. (1996). “Fast tracking” patients in an urban pediatric emergency department. American journal of emergency medicine, 14(3), 242-244.
Singleton, R., & Straits, B. (1999). Approaches to social research. New York: Oxford
University Press. SPSS. (2002). Time series analysis and forecasting. Chicago, IL: PSS, Inc. Steinbrook, R. (1996). The role of the emergency department. New England journal of
medicine, 334 (10), 657-658. Straus, J.H., Orr, S.T., & Charney, E. (1983). Referrals from an emergency room to
primary care practices at an urban hospital. American journal of public health, 73(1), 57-61.
Studnicki, J. (2002). Estimates of the number and health care expenditures of the
uninsured in Orange County, Florida. The University of South Florida: The Center for Health Outcomes Research.
Stussman, B.J. (1997). National hospital ambulatory medical care survey: 1995
emergency department survey. Advance data from vital and health statistics (no. 285). Hyattsville, MD: National Center for Health Statistics.
U.S. Census Bureau. (2004). Population estimates. Retrieved on the World Wide Web
July 29, 2004: www.census.gov U.S. General Accounting Office. (1993). Emergency departments: unevenly affected by
growth and change in patient use. Retrieved on the World Wide Web July 8, 2003: www.gao.gov
Velianoff, G. (2002). Overcrowding and diversion in the emergency department.
Nursing clinics of North America, 37(1), 59-66. von Bertalanffy, L. (1968). Organismic psychology and systems theory. Worcester, MA:
Clark University. von Bertalanffy, L. (1969). General systems theory: a critical review. In J. Litterer (ed.)
Organizations, Vol. 2. New York: John Wiley and Sons. Walls, C.A., Rhodes, K.V., & Kennedy, J.J. (2002). The emergency department as usual
source of medical care: estimates from the 1998 National Health Survey. Academic emergency medicine, 9(11), 1140-1145.
216
Wan, T.T.H. (1995). Analysis and evaluation of health care systems: an integrated approach to managerial decision making. Baltimore, MD: Health Professions Press.
Wanerman, R. (2002). The EMTALA paradox. Annals of emergency medicine, 40(5),
464-469. Wasson, J.H., Sauvigne, A.E., Mogielnicki, P. (1984). Continuity of outpatient medical
care in elderly men: a randomized trial. Journal of the American Medical Association, 252(17), 2413-2417.
Weinick, R. & Billings, J. (2003). Tools for monitoring the safety net. Rockville, MD:
Agency for Healthcare Research and Quality. Weinick, R., Billings, J., & Burstin, H. (2002). What is the role of primary care in
emergency department overcrowding? Council of Health Care Economics and Policy. Waltham, MA: Brandeis University.
Weinick, R., & Burstin, H. (2001). Monitoring the safety net: data challenges for
emergency departments. Academic emergency medicine, 8(11), 1019-1021. Weiss, L.J. & Blustein, J. (1996). Faithful patients: the effect of long-term physician-
patient relationships on the costs and use of health care by older Americans. American journal of public health, 86(12), 1742-1747.
White House. (2005). President Bush’s FY 2005 budget. Retrieved February 8, 2005 on
the World Wide Web: www.whitehouse.gov Williams, R.M. (1996). The cost of visits to emergency departments. The New England
journal of medicine, 334(10), 642-646. Young, G.P., & Sklar, D. (1995). Health care reform and emergency medicine. Annals
of emergency medicine, 25(5), 666-674. Young, G.P., Wagner, M.B., Kellerman, A.L., Ellis, J., & Bouley, D. (1996). Ambulatory
visits to hospital emergency departments: patterns and reasons for use. The journal of the American Medical Association, 276(6), 460-465.
Young, T.L., D’Angelo, S., & Davis, J. (2001). Impact of a school-based health center
on emergency department use by elementary school students. The journal of school health, 71(5), 196-198.
Zaltman, G., Duncan, R. & Holbek, J. (1973). Innovations and Organizations. New York: John Wiley & Sons.
217