RED | the new green 1 CHP: One of the answers (but not the question) Presentation to Efficient...
23
RED | the new green www.recycled-energy.com 1 CHP: One of the answers (but not the question) Presentation to Efficient Enterprises: Powering American Industry Sean Casten, President & CEO Recycled Energy Development, LLC June 23, 2009 US Capitol Building, Room HC-7
-
Upload
darrell-hardy -
Category
Documents
-
view
215 -
download
1
Transcript of RED | the new green 1 CHP: One of the answers (but not the question) Presentation to Efficient...

RED | the new greenwww.recycled-energy.com
1
CHP: One of the answers (but not the question)
Presentation to Efficient Enterprises: Powering American Industry
Sean Casten,President & CEORecycled Energy Development, LLC
June 23, 2009US Capitol Building, Room HC-7

RED | the new greenwww.recycled-energy.com
2
Asking the right questions

RED | the new greenwww.recycled-energy.com
3
Things you think are true aren’t.
In other words: Unexpected, transformative changes can quickly reduce our CO2 emissions and grow our economy… so long as we don’t constrain our future with our present conventional wisdom.

RED | the new greenwww.recycled-energy.com
4
Transformative changes in our fossil energy use are inevitable.

RED | the new greenwww.recycled-energy.com
5
Transformative shifts in our fossil fuel use are inevitable.

RED | the new greenwww.recycled-energy.com
6
Things you think are true aren’t.

RED | the new greenwww.recycled-energy.com
7
Potential pace of electric sector reform: 20% of US fleet built in just 10 years!
US Installed Generation Capacity, by Fuel Type
0
50
100
150
200
250
300
350
400
450
1975 1985 1995 2005
Installed GW
Natural Gas
Nuclear
Coal
Source: US DOE, Energy Information Administration (www.doe.eia.gov)
1992 Energy Policy Act opens competitive markets
FERC Order 888 mandates non-discriminatory transmission access
Final FERC rehearing of 888

RED | the new greenwww.recycled-energy.com
8
New England’s FCM success is even more dramatic.
Source: ISO-NE; website and personal correspondence.
• Typical NE power peak = 19,000 – 24,000 MW
• All time peak = 28,160 MW (8/6/06)
• ISO-NE’s forward capacity market closed their first capacity auction on 3/1/07; they have now completed two forward capacity auctions (FCAs)
• FCM allowed demand resources (including, but not limited to CHP and other behind-the-meter generation) to bid into markets and compete with new-build generation to meet system supply needs.
• As of their most recent auction (FCA#2), they have 2,936 MW of demand resources that have been brought forward under this program.
• Met over 10% of the system peak in under 3 years without building a single power plant.

RED | the new greenwww.recycled-energy.com
9
Things you think are true aren’t.

RED | the new greenwww.recycled-energy.com
10
CO2 reduction is not constrained by technology nor economics.1. Non-renewable CO2 release comes from the combustion of (previously sequestered) fossil carbon fuels.
• Uniquely among pollutants, the thing which causes the pollution costs money; ergo, reducing CO2 pollution saves money.
• If done with greater efficiency, this cost reduction need not be coupled to a reduction in standard of living.
2. Current regulations generally do not encourage energy efficiency, and in some cases discourage it.
• Clean Air Act has the right intent, but is methodologically flawed; efficiency doesn’t count as a pollution control strategy!
• Ditto for modern utility regulation, which keeps the power flowing, but does not allow utilities to use cost-control to maximize profits.
3. Most US energy capital stock is old; to the degree it was optimized, it was for yesterday’s energy prices.

RED | the new greenwww.recycled-energy.com
11
The costs of current policy, and potential for CHP.
US Electric Industry Fuel-Conversion Efficiency
0%
10%20%
30%
40%50%
60%70%
80%
90%100%
1880 1890 1900 1910 1920 1930 1940 1950 1960 1970 1980 1990
Energy waste = Economic / Environmental
opportunity

RED | the new greenwww.recycled-energy.com
12
RED | the new green www.recycled-energy.com
Homer Simpson’s plant wastes lots of energy.

RED | the new greenwww.recycled-energy.com
13
RED | the new green www.recycled-energy.com
So do ours.

RED | the new greenwww.recycled-energy.com
14
RED | the new green www.recycled-energy.com
Energy flows in the US electric sector.

RED | the new greenwww.recycled-energy.com
15
RED | the new green www.recycled-energy.com
Energy flows in a fueled CHP plant (“topping cycle cogen”)

RED | the new greenwww.recycled-energy.com
16
RED | the new green www.recycled-energy.com
Energy flows in an energy recycling plant (“bottoming cycle cogen”)

RED | the new greenwww.recycled-energy.com
17
CHP’s local nature gives it an innate capital cost advantage.
US Average Capex ($/kW installed)US Average Capex ($/kW installed)
Central Central ApproachApproach
Local Local GenerationGeneration
$1,000 - $3,500
$1,200 - $4,000
$1,400
$140
1.44
1.07
GenerationGeneration T&DT&D Line Loss & Line Loss & RedundancyRedundancy
Total $ per Total $ per new kW loadnew kW load
$1,430 - $4,430
$3,460 - $7,000

RED | the new greenwww.recycled-energy.com
18
Supporting data from FERC
Cost of new delivered electricity
-1
0
1
2
3
4
5
6
7
8
9
10
11
12
13
14
15
Nuclear plant Coal plant Large combined-cycle gas plant
Large wind farm Combined-cycleindustrial cogen
Building-scalecogen
Recovered-heatindustrial cogen
End-use efficiency
2007 US¢ per delivered kWh
Credit forrecovered andreused heat
Fuel minus heatcredit
Transmission andDistribution
Firming andintegration
Operation andMaintenance
Capital
MIT (2003)
Keystone (June 2007)
2007–08 industry estimates, Moody's estimate of $7500/kWe: 25 ¢/kWh
Courtesy Jon Wellinghoff

RED | the new greenwww.recycled-energy.com
19
Total potential for additional US CHP is massive and transformative.

RED | the new greenwww.recycled-energy.com
20
Achieving this level of CHP has already been done by many of our trading partners.
Percent of Total Power Generation from CHP, By Country
0
10
20
30
40
50
DenmarkFinland
Latvia Russia
Netherlands
JapanIndia
CanadaChina EU 25
USABelgium
UK
France
Source: Energy & Environmental Analysis

RED | the new greenwww.recycled-energy.com
21
What CHP looks like: steel manufacturer in Gary, IN.
• 95 MW of power recovered from the exhaust of 268 coke ovens.• Saves host ~$40 million/year with no marginal fuel combustion or CO2 release.
• Generates more clean power in 1 year than all the world’s grid-connected solar panels (with less CO2/MWh!)
Courtesy Primary Energy
RED | the new greenwww.recycled-energy.com
22
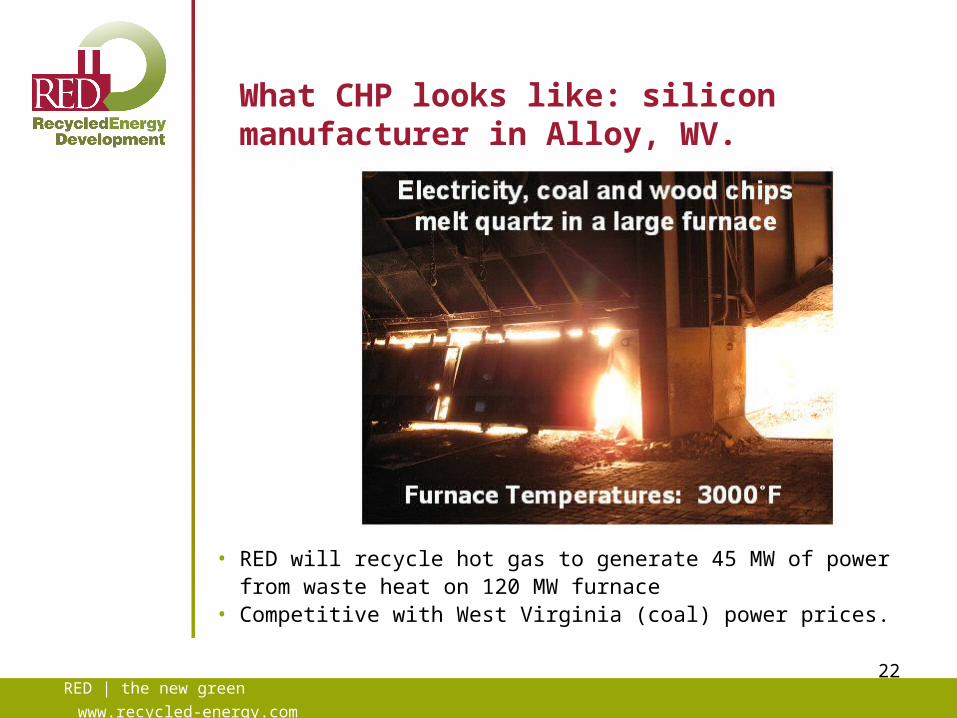
What CHP looks like: silicon manufacturer in Alloy, WV.
• RED will recycle hot gas to generate 45 MW of power from waste heat on 120 MW furnace
• Competitive with West Virginia (coal) power prices.

RED | the new greenwww.recycled-energy.com
23
Ask the right questions• What regulatory barriers exist to energy efficiency (in all its flavors), and how can we remove them?
• Lesson from FERC 888 / FCM: unleashing a flood of private sector investment need not require tearing down an entire dam – we simply need to remove the critical bricks, and let the blocked resource do the rest of the work for us.
• How do we reward the goal, instead of the path?
• More incentives for CHP / solar / wind / nuclear / clean coal are not the answer; experience teaches that approach will cause massive unintended consequences.
• We have enough time to change course – barely.