Recovery and Resolution Plans: Dealing with financial distress

Recovery plans Assumptions and triggers

PrefaceThis is an update to The Pensions Regulator’s analysis of recovery plans which focuses on the technical assumptions, underlying funding targets and statistics relating to the regulator’s triggers. It is produced in accordance with the UK Code for Official Statistics, which came into effect in January 2009.
This report covers recovery plans received up to 31 August 2010 by the regulator from defined benefit (DB) Pension Protection Fund (PPF)-eligible schemes which were in deficit at their valuation. It therefore includes those Tranche 3 schemes that were excluded from the regulator’s 2009 scheme funding publication due to the timing of publication as well as Tranche 41 plans which, by definition, have valuation dates between 22 September 2008 and 21 September 2009. This latest tranche represents largely, but not entirely, Tranche 1 in the first triennial cycle of valuations under Part 3 of the Pensions Act 2004. For some Tranche 4 schemes, this is their first recovery plan under the regime, having been in surplus in the last valuation cycle.
The report is different to previous editions of the scheme funding publication in that it is being released in 2 parts. As a result of an observed increase in the existence of enhanced security in the form of contingent assets, the funding element of recovery plans will be examined in greater detail than before. A supplementary report on scheme funding is therefore to follow.
2 Recovery plans Assumptions and triggers
1 This report does not cover all Tranche 4 plans however, as due dates for Tranche 4 extend up to December 2010. Early results are published so as to be accessible to trustees and advisers at peak valuation periods.

Recovery plans Assumptions and triggers 3
The report draws primarily on information in recovery plans, the accompanying valuation summaries, and to a lesser extent, annual scheme returns submitted to the regulator. Underlying data is sourced from plans as they were upon receipt by the regulator, that is, prior to any revisions based on engagement with the regulator after the regulatory process. It is presented in this form so trustees and advisers are able to see where their decisions lie in relation to other schemes and how these proposals fare against the regulator’s triggers.
The following chapters cover:
• data demographics
• discount rate assumptions
• mortality assumptions
• trigger statistics.
An explanatory note outlines data assumptions and conventions employed in the report (see Explanatory note A1 in Appendix A on page 37 and 38).
Past editions of the scheme funding publication provide further background on both the funding and clearance regimes, while details on the characteristics and risk profiles of all DB schemes in the PPF-eligible universe can be found in The Purple Book 2010. These publications can be downloaded from the regulator’s website2.
It is worth noting that the majority of schemes analysed in respect of Tranche 4 underwent valuations in the period: 1 December 2008 to 6 April 2009 inclusive. This represents a period of acute funding stress; the aggregate funding balance of schemes on a s179 basis reported a record deficit in March 2009. Adverse market conditions also influenced scheme funding on the technical provisions basis and consequently had an impact on triggering, as will be shown in this report and the one to follow.
2 http://www.thepensionsregulator.gov.uk/doc-library/research-analysis.aspx
Preface

4 Recovery plans Assumptions and triggers
ContentsExecutive summary page 5
Section 1: The recovery plan universe page 7
Section 2: Discount rates page 15
Section 3: Mortality page 22
Section 4: Triggers page 29
Appendix page 36
Glossary page 45

Recovery plans Assumptions and triggers 5
Executive summaryIn the year to 21 September 2009, the end of the Tranche 4 valuation period, the UK economy was characterised by historic market lows. The poor performance of equity markets had an adverse effect on scheme funding. This was exacerbated by lower than average yields on long-dated gilts, often referenced by schemes in setting discount rates for scheme specific valuations.
The extent of this volatility in scheme funding is illustrated by the movement in the aggregate balance (on a s179 basis) of the PPF 7800 index. An aggregate deficit of £192bn was estimated at the end of March 2009, compared with an aggregate surplus of £20bn 1 year earlier. According to these estimates, 84% of PPF-eligible schemes were in deficit at March 20093.
Around 83% of Tranche 4 schemes in this analysis have Part 3 valuation dates that lie between 1 December 2008 and 6 April 2009 inclusive. This is largely due to the fact that triennial valuations often take place at financial year-ends in December and March. The experience of Tranche 4 schemes is therefore different from other tranches, due to the valuation period being at a time when economic circumstances were unprecedented. For 70% of Tranche 4 schemes analysed in this report, this is their second recovery plan under the scheme funding regime but for nearly 30%, this is the first such recovery plan because they had been in surplus in the previous valuation period.
In light of market conditions during this period, more schemes have used the flexibility to back-end load deficit contributions; a practice which may reflect the expectation that funding positions would improve in the future from the valuation period under consideration.
Some schemes took account of post-valuation experience, strong employer covenants, and the existence of contingent assets in the setting of the discount rate assumption in accordance with the regulator’s published guidance Effective valuation date around 31 March 20094. From Tranche 3 to 4, the average nominal discount rate assumption underlying technical provisions fell from 5.69% to 5.36%. The average nominal outperformance (difference between discount rates and UK gilt yields) assumed in Tranche 4 is slightly higher than that assumed in earlier tranches, increasing by 0.16 percentage points to 1.22%.
continued over...
3 http://www.pensionprotectionfund.org.uk/Pages/PPF7800Index.aspx 4 http://www.thepensionsregulator.gov.uk/guidance/ guidance-scheme-funding-faqs.aspx#s1770

6 Recovery plans Assumptions and triggers
Executive summary
‘S1’ series base tables5, a medium cohort allowance for future improvements and a 1% underpin were the most commonly used mortality assumptions. In contrast, for the majority of Tranche 1 schemes, the ‘92’ series tables formed the base mortality assumption; the medium cohort was the most common adjustment for improvements; and no underpin was assumed.
Because the features of recovery plans hinge on funding targets, a higher proportion of Tranche 4 schemes have triggered regulatory scrutiny on each of the 4 trigger points than have done so in previous tranches. The number of schemes triggering rose from 70 % in Tranche 1 to 81% in Tranche 4.
continued...
Key trends
•
On the 2 most common valuation dates (31 December 2008 and 31 March 2009) 20 year (annualised) giltyields were 3.85% and 4.04% respectively. The nominal average (unweighted) single effectivediscount rate fell 0.33 percentage points to 5.36% in Tranche 4 while the average nominal (unweighted)outperformance over the above gilt yields increased by 0.16 percentage points to 1.22%.
•
Average (unweighted) recovery plan lengths increased by 1 year to 9.4 years from Tranche 3 to Tranche4. This continued a trend seen before when there was a corresponding increase from Tranche 2 toTranche 3 of 1.1 years.
•
The most commonly used mortality assumptions in Tranche 4 included the ‘S1 series’, a medium cohortallowance for future improvements, and a 1% underpin. 47% of Tranche 4 schemes used the ‘S1’series for base mortality assumptions compared to 5% of Tranche 3 schemes. This was expected as afinal version of these tables became available in October 2008. 59% of Tranche 4 schemes used amedium cohort assumption while 90% of schemes applied an underpin to improvements. The latterrepresents an increase over the 62% of schemes using underpins in Tranche 3. Of schemes usingunderpins, 29% used underpins above 1%. In Tranche 4, the assumed average (unweighted) expectationof life for a 45 and 65-year-old male was 89.1 and 87.1 respectively.
•
The proportion of Tranche 4 schemes triggering overall is greater than that of previous tranches. 81% of schemes in Tranche 4 triggered compared to 62% of schemes in Tranche 3.
•
A greater proportion of Tranche 4 schemes triggered, on each of the 4 triggers, than the proportion ofschemes triggering in each of the previous tranches.
•
The greatest increases in triggering over the last tranche were observed in respect of the technicalprovisions and the investment return assumption. 60% of Tranche 4 schemes triggered on technicalprovisions; 39% triggered on investment return; 14 % of schemes triggered on back-end loading; and27% triggered on recovery plan length.
•
There has been a decrease in the number of clearances approved in the financial year 2009-2010compared to 2008-2009 (reflecting a decrease in applications) but an increase in the number andcomplexity of open cases.
5 ‘S1’ tables are mortality tables released by the Continuous Mortality Investigation (CMI) of the UK Actuarial Profession in October 2008 based on the 2000-2006 experience of members of self-administered pension schemes.

Section 1: The recovery plan universe
Recovery plans Assumptions and triggers 7
Key facts
• 1,006 of the 1,476 Tranche 4 schemes received up to the end of August 2010, are submitting their second recovery plans since the start of the scheme specific funding regime.
• Over one quarter of Tranche 4 schemes have 1,000 or more members.
• Half of Tranche 4 schemes have technical provisions at or above £20m; a higher proportion than that observed for earlier tranches.
• Tranche 4 comprises a higher proportion (23%) of schemes with pensioner technical provisions of or in excess of 50% of total technical provisions compared to previous tranches.
• 54% of Tranche 4 schemes are in insolvency bands 1 and 2 (As defined in The Purple Book 2010).
continued over...

Recovery plans Assumptions and triggers8
Section 1: The recovery plan universe
1.1 Schemes in deficit
By 31 August 2010, the regulator had received 1,476 recovery plans with Tranche 4 valuations dates (see Table 1.1 on page 11). As schemes have up to 15 months after the valuation date to submit a plan, Tranche 4 plans have due dates that fall between December 2009 and December 2010 (see Figure A1 – the Recovery plan calendar – in Appendix A on page 37).
A recovery plan includes an estimate of a scheme’s deficit based on its technical provisions, that is, an estimate of the assets needed at the valuation date to make provision for benefits already accrued under the scheme. The accompanying schedule of contributions indicates the timing and level of employer payments over the life of the plan.
Asset-backed funding structures underlie some recovery plans. In addition to recovery plans, schemes may be in possession of additional security in the form of contingent assets. These may include, but are not limited to, guarantees, security over assets, letters of credit, and escrow accounts. The number of such assets considered in the calculation of the PPF risk-based levy, amount to 720 in all PPF-eligible schemes for the 2010-2011 levy year.
Schemes also benefit from one-off cash contributions from employers. Evidence from the Office for National Statistics (ONS) on special contributions to schemes by employers6, shows that such payments amounted to £4bn in the fourth quarter of 2009; the highest amount since the first quarter of 2006. This was followed by another £4bn in the first quarter of 2010.
At the end of March 2009 (mid-way through Tranche 4 valuations), the number of schemes in deficit on a s179 basis amounted to 84% of the then PPF-eligible universe. Figure 1.1a below illustrates the number of schemes in deficit and surplus on a s179 basis over a 10 year period. It also shows movements in the value of the FTSE 100 index over this period. The highest number of schemes in deficit over the period March 2003 to March 2010 coincides with the lowest level for the index.
Figure 1.1a Number of PPF-eligible schemes in deficit and surplus
Mar 2003 Mar 2004 Mar 2005 Mar 2006 Mar 2007 Mar 2008 Mar 2009 Mar 2010
7,000
Num
ber
of
sche
mes
in d
efici
t/su
rplu
s(P
PF
bas
is)
and
val
ue o
f FT
SE 1
00 in
dex
6,000
5,000
4,000
3,000
2,000
1,000
0
Schemes in deficit
Schemes in surplus
FTSE 100
Source: FTSE Group and the Pension Protection Fund
6 Investment by insurance companies, pension funds and trusts (ONS)
Recovery plans Assumptions and triggers 9
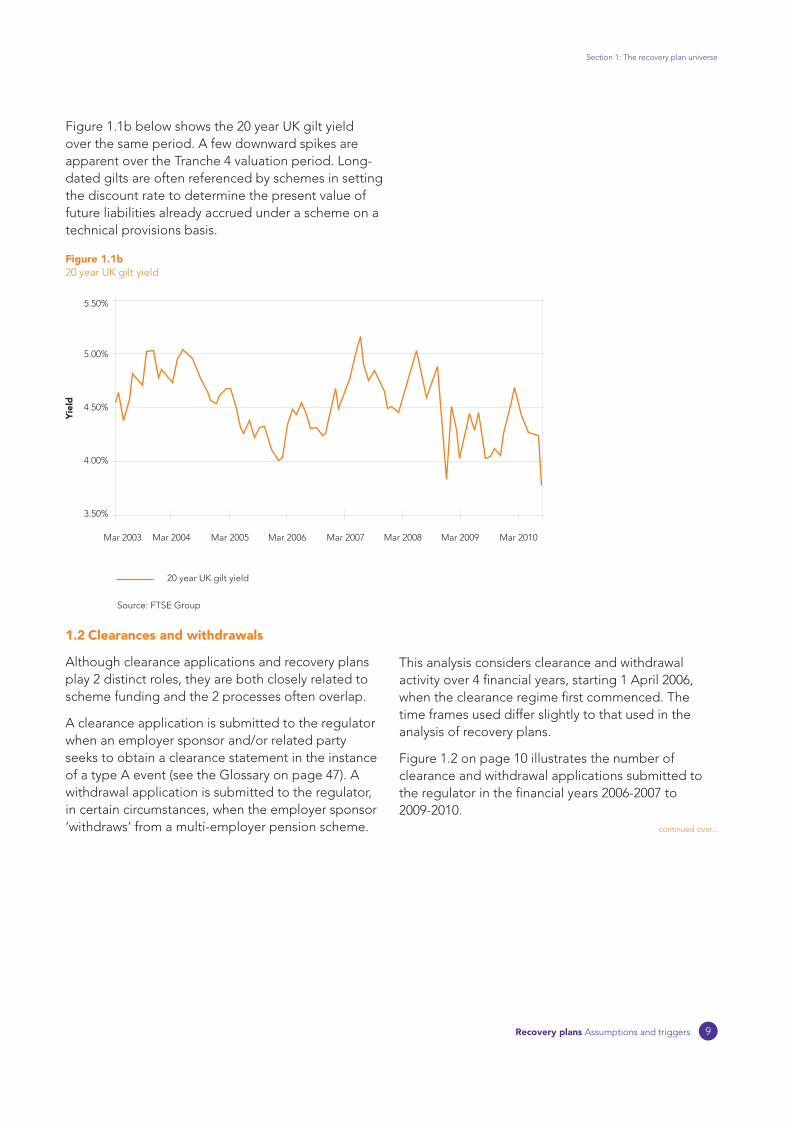
Figure 1.1b below shows the 20 year UK gilt yield over the same period. A few downward spikes are apparent over the Tranche 4 valuation period. Long-dated gilts are often referenced by schemes in setting the discount rate to determine the present value of future liabilities already accrued under a scheme on a technical provisions basis.
Section 1: The recovery plan universe
5.50%
5.00%
4.50%
4.00%
3.50%
Mar 2003 Mar 2004 Mar 2005 Mar 2006 Mar 2007 Mar 2008 Mar 2009 Mar 2010
ield
Y
20 year UK gilt yield
Source: FTSE Group
Figure 1.1b 20 year UK gilt yield
1.2 Clearances and withdrawals
Although clearance applications and recovery plans play 2 distinct roles, they are both closely related to scheme funding and the 2 processes often overlap.
A clearance application is submitted to the regulator when an employer sponsor and/or related party seeks to obtain a clearance statement in the instance of a type A event (see the Glossary on page 47). A withdrawal application is submitted to the regulator, in certain circumstances, when the employer sponsor ‘withdraws’ from a multi-employer pension scheme.
This analysis considers clearance and withdrawal activity over 4 financial years, starting 1 April 2006, when the clearance regime first commenced. The time frames used differ slightly to that used in the analysis of recovery plans.
Figure 1.2 on page 10 illustrates the number of clearance and withdrawal applications submitted to the regulator in the financial years 2006-2007 to 2009-2010.
continued over...

10 Recovery plans Assumptions and triggers
Section 1: The recovery plan universe
Figure 1.2 Clearance and withdrawal activity
250
200
Num
ber
of
case
s
150
100
50
0
2006-2007
Financial year
2007-2008 2008-2009 2009-2010
Clearance
Withdrawal
Withdrawal/Clearance
There has been a year-on-year reduction in the number of clearance and withdrawal applications since 2006-2007. The decrease in the number of applications has not been uniform across the different transaction types and there have been notable shifts in the nature of clearance application transaction types. The decrease in the level of clearance activity reflects 2 factors. Firstly, all schemes have now entered into the recovery plan cycle and activities that would previously have been addressed through clearances are now being dealt with within recovery plans. Secondly, there has been a decrease in the level of business activity, particularly mergers and acquisitions, over the period.
continued...
In terms of the outcomes of these activities, there has been a year-on-year decrease in the number of clearances approved (reflecting the decrease in applications) and an increase in the number of open cases. The increase in open cases is consistent with the observation made in the scheme funding 2009 publication that, while the number of clearance applications is falling, the level of complexity for clearances has risen.

Recovery plans Assumptions and triggers 11
Section 1: The recovery plan universe
1.3 Demographics
Table 1.1 below shows the number of recovery plans included in this analysis per tranche. The number includes Tranche 4 recovery plans received up to 31 August 2010 alone. 1,006 Tranche 4 plans (received up to 31 August 2010) are in respect of schemes that submitted Tranche 1 recovery plans.
Table 1.1Summary of recovery plan activity
Tranche* Number of plans analysed
Cycle 1 1 1,928
2 1,818
3 1,767
Cycle 2
4
1,476 (includes 1,006 schemes from Tranche 1)
* For the purposes of this publication, a plan’s tranche is based on the effective date of valuation
The following figures include a breakdown of tranches by various scheme characteristics which include:
• size (measured by number of members and technical provisions)
• maturity (measured by the proportion of pensioner technical provisions to the total) and
• insolvency group (as defined in The Purple Book 2010).
Figure 1.3 below shows the distribution of schemes according to membership size in each tranche. The largest group in Tranche 4 comprises schemes in the 100 to 499 member range. Around a third of schemes in each tranche have between 100 and 499 members.
Compared to previous tranches, Tranche 4 has a higher proportion of schemes with 500 members or more. As would be expected, the size profile by membership of schemes in Tranche 4 most resembles that of Tranche 1. This may be explained by that fact that the majority of schemes in Tranche 4 are also in Tranche 1.
continued over...
100%
90%
80%
70%
60%
50%
40%
30%
Pro
po
rtio
n o
f sc
hem
es
20%
10%
0%
Tranche 1
Cycle 1 Cycle 2
Figure 1.3 Distribution of schemes by number of members
Tranche 2 Tranche 3 Tranche 4
7.5%
14.7%
12.3%
35.3%
30.2%
8.0%
13.3%
10.0%
36.5%
32.1%
6.0%
13.8%
12.6%
35.6%
32.0%
9.6%
16.7%
13.6%
33.1%
27.0%
5,000 + members
1,000 to 4,999 members
500 to 999 members
100 to 499 members
< 100 members

12 Recovery plans Assumptions and triggers
Section 1: The recovery plan universe
continued...
Figure 1.4 below shows the distribution of schemes by size of technical provisions within each tranche. Tranche 4 has a higher proportion of schemes above £20m than other tranches. In Tranches 1, 2 and 3, the £5m to less than £20m range contains the largest proportion of schemes. The largest group of technical provisions for Tranche 4 however, is £20m to less than £100m. The size of a scheme’s technical provisions will be influenced by underlying technical assumptions; prevailing bond yields at valuation; the nature of employee benefits; and number of members in the scheme (among other things). 50% of Tranche 4 schemes have technical provisions of £20m or higher, compared to 42%, 38%, and 43% of schemes in Tranches 1, 2 and 3 respectively.
100%
90%
80%
70%
60%
50%
40%
30%
Pro
po
rtio
n o
f sc
hem
es
20%
10%
0%
Tranche 1
Cycle 1 Cycle 2
Figure 1.4 Distribution of schemes by size of technical provisions
Tranche 2 Tranche 3 Tranche 4
7.1%8.0%
26.7%
29.9%
28.3%
7.3%7.3%
23.3%
32.2%
30.0%
6.7%8.8%
27.4%
32.1%
24.9%
10.5%
11.1%
28.2%
27.9%
22.3%
£300m +
£100m to less than £300m
£20m to less than £100m
£5m to less than £20m
< £5m

Recovery plans Assumptions and triggers 13
Figure 1.5 below shows the distribution of schemes by maturity in each tranche, where maturity is measured as the proportion of pensioner technical provisions within total technical provisions. In addition to being larger by size and technical provisions, Tranche 4 has a higher proportion (65%) of schemes with 25% and above pensioner technical provisions, compared to previous tranches including Tranche 1. The largest group in Tranches 3 and 4 are schemes with 25% to less than 50% pensioner technical provisions, while in Tranches 1 and 2 the largest group includes schemes with less than 25% pensioner technical provisions. The rate of scheme closures in recent years may explain the change in the maturity profile of schemes in general, but particularly with regards to the difference observed between Tranches 1 and 4.
Section 1: The recovery plan universe
100%
90%
80%
70%
60%
50%
40%
30%
Pro
po
rtio
n o
f sc
hem
es
20%
10%
0%
Tranche 1
Cycle 1 Cycle 2
Figure 1.5 Distribution of schemes by maturity (% pensioner technical provisions)
Tranche 2 Tranche 3 Tranche 4
1.5%
13.3%
38.5%
46.7%
1.9%
13.3%
38.5%
46.4%
1.6%
15.5%
43.9%
39.0%
2.2%
20.4%
41.9%
35.5%
75% to 100%
50% to less than 75%
25% to less than 50%
< 25%

Recovery plans Assumptions and triggers14
continued...
Figure 1.6 below shows the distribution of schemes in each tranche according to insolvency groupings, as defined in The Purple Book 2010 where groups 1 to 10 denote lower to higher insolvency probabilities respectively. This figure shows a different distribution overall to that in last year’s edition because of a change to the underlying mapping of Dun & Bradstreet (D&B) failure scores to insolvency probabilities (see Explanatory note in Appendix A1 on pages 45 to 47). Tranche 4 constitutes a higher proportion of schemes in groups 1 and 2 compared to previous tranches.
Section 1: The recovery plan universe
100%
90%
80%
70%
60%
50%
40%
30%
Pro
po
rtio
n o
f sc
hem
es
20%
10%
0%
Tranche 1
Cycle 1 Cycle 2
Figure 1.6 Distribution of schemes by insolvency group (as defined in The Purple Book 2010)
Tranche 2 Tranche 3 Tranche 4
8.5%
40.3%
51.2%
10.5%
46.3%
43.1%
10.5%
48.1%
41.4%
11.8%
34.2%
54.0%
Insolvency groups 9 and 10
Insolvency groups 3 to 8
Insolvency groups 1 and 2

15Recovery plans Assumptions and triggers
Section 2: Discount ratesKey facts
• UK gilt yields reached lower levels in Tranche 4 than at any point since the start of the scheme funding regime. On 31 December 2008 and 31 March 2009 (the 2 most common valuation dates) the 20 year (annualised) gilt yields were 3.85% and 4.04% respectively.
• The average nominal single effective discount rate (SEDR) for Tranche 4 is lower relative to that of Tranches 2 and 3. The fall in average discount rates reflects the decline in UK gilt yields, particularly in late December 2008 and March 2009 when the majority of schemes carried out their valuations.
• The average SEDR spread over UK 20 year gilt yields increased from 1.06% to 1.22%, ie the rate of decline in average discount rates did not fully match the rate of decline in UK gilt yields. The increase in spread can be interpreted as reflecting an increased outperformance assumption for other assets relative to UK gilts yields measured at the date of the initial scheme evaluations.
• Schemes in the lowest insolvency risk groups continue to have the highest average discount rates.
continued over...

Recovery plans Assumptions and triggers16
2.1 The discount rate
The discount rate is the most significant determinant of a scheme’s technical provisions. It is a compound rate of interest that is used to calculate the present value of future liabilities accrued under the scheme. It is taken to be a value related to the ‘risk free rate’, for which a proxy of UK government bond yields (gilts) is used here. The spread between the risk free rate and the discount rate is typically assumed to be based on:
• the time horizon of liabilities
• the potential for additional investment return and
• a prudence adjustment, based on the employer’s covenant.
Trustees choose discount rates on the advice of scheme actuaries and agree them with employers. The regulator’s guidance allows for some outperformance provided that the employer covenant is considered strong enough to support the scheme should expected returns not materialise.
Section 2: Discount rates
2.2 Discount rates and investment return assumptions
Two approaches are used by pension schemes in respect of the discount rate assumption: a ‘single investment return approach’ (single rates approach) and ‘different investment returns approach’ (different rates approach). The former assumes that returns on pre-retirement investments are the same as that of post-retirement investments, while the latter usually assumes that the pre-retirement investment returns are higher than post-retirement investment returns. For the purposes of comparison, in instances where a different rates approach has been adopted, the regulator has constructed a ‘single effective discount rate’ (SEDR): a composite rate based on pre-retirement and post-retirement rates that takes into account scheme maturities.
Table 2.1 on page 17 provides a summary of the discount rate data received (split by tranche) and categorised by nominal and real discount rates.

Recovery plans Assumptions and triggers 17
Section 2: Discount rates
Table 2.1Discount rate comparisons
Unweighted average (%) Weighted avearge (%)
Tranche T1 T2 T3 T4 T1 T2 T3 T4
Nominal discount rate Pre and post- retirement ratesa
5.01 5.34 5.65 5.30 5.03 5.38 5.62 5.40
bPre-retirement rate 6.11 6.30 6.47 6.14 6.24 6.40 6.58 6.25b Post-retirement rate 4.62 4.93 5.08 4.75 4.66 5.04 5.18 4.91
SEDRc 5.31 5.56 5.71 5.38 5.31 5.59% 5.76 5.46
SEDR (all schemes)d 5.22 5.50 5.69 5.36 5.20 5.50 5.73 5.44
Outperformance(all schemes)e
0.95 0.84 1.06 1.22 0.97 0.82 1.07 1.40
Real discount ratePre and post- retirement ratesa
2.03 2.15 2.10 2.18 1.97 2.22 2.15 2.19
b Pre-retirement rate 3.10 3.05 2.89 3.02 3.26 3.18 2.99 3.20b Post-retirement rate 1.65 1.72 1.54 1.67 1.73 1.86 1.64 1.89
SEDRc 2.34 2.35 2.17 2.29 2.38 2.41 2.23 2.44 SEDR (all schemes)d 2.24 2.29 2.15 2.26 2.22 2.32 2.21 2.35
Outperformance (all schemes)f
0.93 0.84 1.14 1.16 0.94 0.86 1.23 1.29
a Single rates approachb Different rates approachc Composite of pre-retirement and post-retirement rates for the different rates approachd Combined single and different rates approache SEDR spread over 20 year UK gilt yieldf Real SEDR spread over > 5 year index-linked UK gilt yield
Source: Calculations are based on data from The Pensions Regulator and the FTSE Group
For both weighted7 and unweighted averages, the average nominal SEDR for Tranche 4 has fallen relative to Tranches 2 and 3 but is marginally higher than in Tranche 1. Despite the fall in the average SEDR, the level of nominal outperformance in Tranche 4 has risen relative to previous tranches. This is because the lowering of investment return assumptions is less than the fall in UK gilt yields, which was particularly pronounced in the months of December 2008 and March 2009 when the majority of Tranche 4 schemes undertook their valuations. It should, however, be noted that in accordance with the regulator’s published guidance Effective valuation date around 31 March 2009, some schemes in Tranche 4 took account of post-valuation experience, strong employer covenants, and contingent assets in the setting of the discount rate assumption8.
7 Where data is weighted, the weighting is based on the level of technical provision.8 http://www.thepensionsregulator.gov.uk/guidance/ guidance-scheme-funding-faqs.aspx#s1770

Recovery plans Assumptions and triggers18
continued...
Figure 2.1 below presents the distribution9 of the nominal SEDR by tranche. The graph suggests that, while the mean and median discount rate levels have fallen in Tranche 4, the range of the distribution has widened.
Section 2: Discount rates
6.5%
6.0%
No
min
al S
ED
R
5.5%
5.0%
4.5%
4.0%
1 2 3 4
Tranche
Figure 2.1 Distribution of the nominal single effective discount rate (SEDR)
Source: The Pensions Regulator
Figure 2.2 below illustrates the distribution of the nominal SEDR spread over 20 year UK gilt yields. The graph shows that outperformance is greater for Tranche 4 than for previous tranches and the distribution of the spread has widened in Tranche 4.
Figure 2.2 Distribution of nominal outperformance
2.5%
No
min
al o
utp
erfo
rman
ce 2.0%
1.5%
1.0%
0.5%
0.0%
1 2 3 4
Tranche
Source: Calculations are based on data from The Pensions Regulator and the FTSE Group
9 The box plot depicts the 5th, 25th, 50th, 75th, and 95th percentiles of the distribution.

Recovery plans Assumptions and triggers 19
Section 2: Discount rates
Figure 2.3 illustrates the median single effective discount rates against 20 year UK gilt and 15+ year AA-rated corporate bond yields. Over the period of Tranche 4 (22 September 2008 to 21 September 2009) annualised UK 20 year gilt yields fell by 0.68 percentage points from 4.81% to 4.13%. On 31 December 2008 and 31 March 2009 (the 2 most common valuation dates) 20 year UK gilt yields were 3.85% and 4.04% respectively. Figure 2.3 below indicates that median discount rates broadly track UK gilt yields.
Figure 2.3 Monthly median effective single discount rates, UK gilt yields and corporate bond yields
15+ year AA-rated corporate bond yield
20 year UK gilt yield
Median SEDR
10Source: The Pensions Regulator, the FTSE Group and Markit iBoxx
Sep 2005 Mar 2006 Sep 2006 Mar 2007 Sep 2007 Mar 2008 Sep 2008 Mar 2009
7.7%
7.1%
6.5%
5.9%
5.3%
4.7%
4.1%
3.5%
10 A registered trademark of Markit Indices Limited, Markit Group.

Recovery plans Assumptions and triggers20
Section 2: Discount rates
continued...
Figure 2.4 below shows the spread between the median nominal SEDR and the 15+ year AA corporate bond yield, and the spread between the median nominal SEDR and the 20 year UK gilt yield. The chart confirms that the spread between the median nominal effective discount rate and 20 year UK gilt yields, which had been relatively stable during Tranche 3, rose in the 6 months of Tranche 4.
While showing some volatility, the spread between the median SEDR and 15+ year AA corporate bond yield has fallen significantly since Tranche 1.
Figure 2.4 Discount rate spreads
2.0%
1.5%
1.0%
0.5%
0.0%
-0.5%
-1.0%
-1.5%
-2.0%
ence
)fe
r(%
dif
ead
Sp
r
Spread (SEDR, 15+ year AA-rated corporate bond yield)
Spread (20 year UK gilt yield, SEDR)
Sep 2005 Mar 2006 Sep 2006 Mar 2007 Sep 2007 Mar 2008 Sep 2008 Mar 2009
11Source: Calculations are based on data from The Pensions Regulator, the FTSE Group and Markit iBoxx
11 A registered trademark of Markit Indices Limited, Markit Group.

Recovery plans Assumptions and triggers 21
Table 2.2 below reports the median nominal SEDR by tranche and scheme characteristics. Some key observations include:
• For all tranches, schemes with 100 or more members have higher discount rates than schemes with fewer than 100 members. However, among schemes with 100 or more members there is no clear relationship between scheme size and discount rates.
• For Tranches 1 to 3 there is no clear relationship between scheme size, as measured by technical provision and discount rates. Among schemes in Tranche 4, higher technical provisions are broadly associated with higher discount rates.
Section 2: Discount rates
• For all tranches, there is no clear relationship between scheme maturity and discount rates. However, within each tranche, those schemes with the highest proportion of pensioner technical provisions (75% to 100%) have lower discount rates than those with the lowest proportion of pensioner technical provisions (less than 25%).
• Schemes in the highest risk groups have the lowest discount rates.
Table 2.2Nominal SEDR by scheme characteristics
Unweighted average (%)
Tranche T1 T2 T3 T4
All data 5.22 5.50 5.69 5.36
Schemes (number of members)< 100 members 100 to 499 members 500 to 999 members 1,000 to 4,999 members 5,000 + members
5.10 5.30 5.27 5.25 5.17
5.36 5.59 5.63 5.52 5.45
5.52 5.78 5.79 5.76 5.67
5.185.375.415.495.50
Size of technical provisions< £5m £5m to less than £20m £20m to less than £100m £100m to less than £300m £300m +
5.07 5.34 5.27 5.21 5.10
5.34 5.57 5.59 5.49 5.49
5.52 5.74 5.78 5.75 5.70
5.175.38 5.405.485.45
Maturity (% pensioner technical provisions)< 25% 25% to less than 50% 50% to less than 75% 75% to 100%
5.20 5.29 5.14 4.72
5.43 5.58 5.52 5.18
5.62 5.80 5.62 5.26
5.285.45 5.344.96
Insolvency group (as defined in The Purple Book 2010)Insolvency groups 1 and 2 Insolvency groups 3 to 8 Insolvency groups 9 and 10
5.24 5.21 5.13
5.53 5.48 5.41
5.78 5.67 5.58
5.435.31 5.18
Source: The Pensions Regulator
For breakdowns of the real discount rate, the nominal outperformance, and the real outperformance by the above scheme characteristics see Tables B1 to B3 in Appendix B on pages 39 to 41.

Recovery plans Assumptions and triggers22
Section 3: MortalityKey facts
• Nearly half (47%) of Tranche 4 schemes used the relatively new ‘S1’ base mortality tables; 59% assumed a medium cohort projection for future improvements; and 90% applied an underpin to this projection. In comparison, 97% of Tranche 1 schemes used ‘92’ series base tables; 57% a medium cohort assumption; and a 1% underpin.
• Average (unweighted) life expectancies increased between Tranches 3 and 4 with the average life expectancy of a male non-pensioner currently aged 45 rising from 88.7 to 89.1 years, and that of a male pensioner currently aged 65 rising from 87.0 to 87.1 years. As would be expected, the increased adoption of underpins in Tranche 4 over Tranche 3 resulted in greater increase in the average age assumed for age 45 than for age 65.
• Changes in mortality assumptions from Tranche 1 to Tranche 4 translate to an increase in 1.4 years to the average (unweighted) assumed life expectancy of a male pensioner currently aged 65. The corresponding increase in average age for a male non-pensioner currently aged 45 is 2.4 years.
continued over...

Recovery plans Assumptions and triggers 23
3.1 Mortality
Mortality (like the discount rate) is an important assumption in the calculation of technical provisions. The sensitivity of technical provisions to changes in mortality is such that an additional year of life adds approximately 3% to a scheme’s liabilities.
There are 2 components to the mortality assumption:
• base mortality rates reflecting current and recent experience and
• assumed rates of future improvement.
The requirement for a prudent approach to setting these assumptions is highlighted in the regulator’s guidance on mortality12.
This chapter looks at the assumptions adopted by schemes in determining the life expectancies of members, and the actual assumed life expectancies. Figures relating to the assumptions are based on male pensioners currently aged 65. This analysis excludes Tranche 3 schemes received after 31 July 200913.
Section 3: Mortality
12 http://www.thepensionsregulator.gov.uk/guidance/ guidance-mortality-assumptions.aspx13 Most of the data received after this date has been submitted to the regulator using the latest version of the valuation summary in which schemes have provided actual life expectancies (rather than just the underlying assumptions). The exclusion of Tranche 3 schemes received after 31 July 2009 avoids extensive data processing for a relatively small proportion of schemes.14 ‘S1’ series base mortality tables are based on 2000-2006 experience collected from UK self-administered pension schemes.
3.2 Baseline assumptions
In October 2008 the Actuarial Profession’s Continuous Mortality Investigation (CMI) released a final version of the ‘S1’ series14 base mortality tables. In contrast to the ‘92’ and ‘00’ tables, the ‘S1’ tables are based on pension scheme experience as opposed to insurance company data, and indicate lower life expectancies for self-administered pension scheme pensioners when compared to insurance company pensioners. This is not to say that ‘S1’ tables necessarily translate into a weaker overall assumption of the expectation of life, because tables may be employed with varying adjustments (loadings) which may improve or weaken them. However, Tranche 4 schemes using the ‘S1’ tables adopted a weaker approach overall, in that they present a lower average assumed life expectancy compared to schemes using the ‘00’ series. (See Table C1 in Appendix C on page 43).
Figure 3.1 below shows the type of standard base table adopted. It tracks a shift from the dominance of ‘92’ tables in Tranche 1 to the ‘00’ tables in Tranche 3, and the shift from the use of the ‘00’ tables to ‘S1’ tables in Tranche 4. 47% of Tranche 4 schemes used ‘S1’ tables compared to 5% in Tranche 3.
Figure 3.2 below illustrates the extent to which schemes have made use of loadings to adjust baseline assumptions for scheme specific factors. The most commonly used loadings are age adjustments and adjustments to q(x) (ie the mortality rates).
Tranche 1
Tranche 2
Tranche 3
Tranche 4
0% 10% 20% 30% 40% 50% 60% 70% 80% 90% 100%
73%
5%
Figure 3.1Base mortality tables
92 series
00 series
S1 series
Other
2%1%
1%
3%
Proportion of pension schemes
1%
97%
26%
41% 53%
37% 47%13%
Tranche 1
Tranche 2
Tranche 3
Tranche 4
Figure 3.2Loadings applied to base tables for scheme specific factors
0% 10% 20% 30% 40% 50% 60% 70% 80% 90% 100%
No loading
Rating by age
Percentage adjustment to q(x)
Proportion of pension schemes
24% 8%70%
60% 15%25%
24%50% 26%
21% 27%51%

Recovery plans Assumptions and triggers24
continued...
The proportion of schemes using some form of loadings has remained relatively unchanged from Tranches 3 to 4, but there has been a shift from age ratings to q(x) adjustments.
Table 3.1 below shows a breakdown of the adjustments to q(x) applied to standard base tables for Tranche 4 only. The data relates only to the 27% of schemes in Figure 3.2 that applied an adjustment to the base mortality rates.
Section 3: Mortality
Table 3.1Adjustments to base mortality tables (Tranche 4 only)
Base table
Rating 92 series 00 series S1 series Other
Below 75% 75% to under 85% 85% to under 95% 95% to under 105% 105% to under 115% 115% to under 125% Over 125%
0.5% 0.0% 0.0% 88.3% 2.1% 3.2% 5.9%
0.0% 2.6% 2.8% 70.9% 11.3% 7.4% 5.0%
0.2% 3.5% 7.8% 76.5% 8.6% 2.9% 0.6%
0.0%0.0%
11.6%88.4%0.0%0.0%0.0%
Percentage of Tranche 4 schemes 12.9% 36.9% 47.2% 3.0%
Table 3.1 above lists column percentages.
So for example, 5% of schemes using the ‘00’ tables adjusted these tables by over 125%. Higher percentage adjustments to these tables yield relatively higher mortality rates.
77% of Tranche 4 schemes using the ‘S1’ tables adjusted them by a percentage between 95 and 105 or higher, compared to 71 % of schemes using the ‘00’ base tables, and 88% of schemes using the ‘92’ series.

Recovery plans Assumptions and triggers 25
Section 3: Mortality
3.3 Future improvements
By Tranche 3, the use of ‘calendar year’ as opposed to ‘year of birth’ as an approach for deriving rates of future improvement was in decline. In the 2009 analysis, 97% of Tranche 3 schemes used the latter. The proportion of Tranche 4 schemes using the year of birth approach is 99%. The remaining 1% of schemes employing a calendar approach corresponds to the 1% of schemes using a ‘92’ base adjustment in Table 3.2 below.
As with Tranche 3, all schemes in Tranche 4 made an adjustment to the base tables for post-valuation date mortality improvements. The medium cohort also continues to be the most commonly assumed adjustment with 59% of Tranche 4 schemes making use of it. This has declined from 63% in Tranche 3, while the proportion of schemes employing the long cohort assumption has increased by 6 percentage points to 38%15. For pre-valuation date adjustments most schemes used the medium cohort.
Table 3.2 below lists the assumptions applied to base tables to adjust for mortality improvements for current male pensioners aged 65.
Table 3.2Adjustment for base mortality table from valuation date
Tranche 1 Tranche 2 Tranche 3 Tranche 4
None 11% 2% 0% 0%
92 base adjustment Short cohort Medium cohort Long cohort CMI 2009 Other
23% 8%
57% 1% 0% 0%
11% 3%
69% 13% 0% 2%
3% 1%
63% 32% 0% 2%
1% 0% 59%38%1%1%
Use of an underpin to improvementsa 1% 23% 62% 90%
a Normally in combination with other items
continued over...
15 The long cohort anticipates greater improvements than the short and medium cohort adjustments, which assume a rapid decline in future rates of morality improvement after 2010 and 2020 respectively.
The biggest change in these adjustments over the last tranche is the increased adoption of an underpin. 90% of Tranche 4 schemes used some form of underpin compared to 1% in Tranche 1 and 62% in Tranche 3.
In addition to that seen in Table 3.2 below, the following observations can be made:
• 37% of schemes using ‘S1’ tables adopted a long cohort assumption compared with 42% of schemes using the ‘00’ tables (see Table C1 in Appendix C on page 43)
• The difference in average (unweighted) life expectancies assumed by schemes adopting the medium and long cohorts (albeit with varying combinations of tables and adjustments across schemes) is 1.11 years for male non-pensioners currently aged 65. The difference for male non pensioners currently aged 45 is 1.07 (see Table C1 in Appendix C on page 43)
• A higher proportion of schemes with less than 100 members assumed a long cohort projection than other member size groups (see Table C1 in Appendix C on page 43)

Recovery plans Assumptions and triggers26
continued...
Figure 3.3 below shows the proportion of schemes adopting various sizes of underpin for Tranche 4 schemes only.
Section 3: Mortality
Figure 3.3Size of underpin breakdown for Tranche 4 schemes only
None
1% or less
Greater than 1% to less than 1.5%
1.5% or greater
Other
Tranche 4
0% 10% 20% 30% 40% 50% 60% 70% 80% 90% 100%
64% 9%10% 17% 1%
Almost two thirds of Tranche 4 schemes using an underpin employed one of size 1% or lower.
Table 3.3 below shows an extended breakdown of the size of underpins used with various projection periods (Tranche 4 only).
Table 3.3Size of underpin adopted in combination with various projections (Tranche 4 only)
Underpin (% p.a.) 92 base Short Medium Long CMI 2009 adjustment cohort cohort cohort
None 100.0% 100.0% 7.9% 11.6% 0.0%Under 0.75% 0.0% 0.0% 1.1% 2.2% 0.0% 0.75% to under 1.25% 0.0% 0.0% 61.2% 67.2% 78.6% 1.25% to under 1.75% 0.0% 0.0% 29.4% 18.7% 21.4%Over 1.75% 0.0% 0.0% 0.5% 0.4% 0.0%
Percentage of Tranche 4 schemes 1.0% 0.0% 59.0% 38.0% 1.0%
Table 3.3 above lists column percentages.
61% of schemes assuming a medium cohort projection used an underpin between 0.75% to1.25% while 67% of schemes with a long cohort projection applied an underpin of the same size.

3.4 Life expectancy
Figures 3.4a and 3.4b below convert the mortality assumptions of Tranches 1, 2 and 3 into life expectancy projections for a male pensioner currently aged 65 and male future pensioner currently aged 45. The average assumed life expectancies for Tranche 4 were provided directly by schemes. The graphs below illustrate the overall impact of assumptions adoptedover the 4 tranches.
27Recovery plans Assumptions and triggers
Figure 3.4a Distribution of life expectancies for current male pensioners aged 65
95
93
Co
hort
exp
ecte
d a
ge
of
dea
th 91
89
87
85
83
81
79
77
0 10 20 30 40 50 60 70 80 90 100
Percentiles
Tranche 1: current pensioners
Tranche 2: current pensioners
Tranche 3: current pensioners
Tranche 4: current pensioners
Figure 3.4b Distribution of life expectancies at 65 for future male pensioners currently aged 45
95
93
Co
hort
exp
ecte
d a
ge
of
dea
th 91
89
87
85
83
81
79
77
0 10 20 30 40 50 60 70 80 90 100
Percentiles
Tranche 1: current pensioners
Tranche 2: current pensioners
Tranche 3: current pensioners
Tranche 4: current pensioners
Section 3: Mortality

Recovery plans Assumptions and triggers28
continued...
The figures indicate that the increase from Tranche 3 to Tranche 4 of assumed life expectancies for a male pensioner currently aged 65 are marginal compared to increases observed for a male non-pensioner currently aged 45. Life expectancies for the latter are generally higher in Tranche 4 schemes over Tranche 3 schemes, up to about the 80th percentile.
The impact of the increased use and size of underpins over the tranches is apparent in the trend towards larger differences in life expectancies from Tranches 1 to 4 (see Figure C1 in Appendix C on page 42). The difference in average (unweighted) assumed life expectancies for non-pensioners currently aged 45 and pensioners currently aged 65 is 1.3 years for schemes using no underpin compared to 2.8 years for schemes using an underpin of size 1.5% (see Table C1 in Appendix C on page 43).
Table 3.4 below summarises, by percentiles, the average assumed expected ages at death in each tranche. Like Figures 3.4a and 3.4b on page 27, it shows how the combinations of baseline assumptions, adjustments, and allowances for future improvements translate into expected ages.
Table 3.4 also shows that the impact of increased use of underpins on life expectancies for Tranche 4 schemes is less for male pensioners currently aged 65 than their 45 year old counterparts. While this is to be expected, it appears that the increased use of underpins has been somewhat counteracted by the move towards S1 tables.
Section 3: Mortality
Table 3.4Descriptive statistics for expected age at death
Current age is 65 Current age is 45
Tranche T1 T2 T3 T4 T1 T2 T3 T4
Descriptive statistics
5th percentile 83.5 84.0 85.0 85.0 84.0 84.8 85.9 86.8
Median 86.0 86.9 87.0 87.1 86.9 88.0 88.6 89.2
95th percentile 87.0 88.6 89.1 89.0 88.5 90.7 91.7 91.5
Unweighted average 85.7 86.5 87.0 87.1 86.7 87.9 88.7 89.1
Weighted average 85.3 86.1 86.4 87.0 86.6 87.7 88.3 89.5
The difference between average (unweighted) expectation of life for 45 and 65 year olds in Tranche 4 is 2 years. This is the greatest difference between these ages among the tranches. Again, this is not surprising given that Tranche 4 schemes have made the greatest use of underpins and all else being equal, the greater the size of underpin, the higher the difference in ages.
3.5 Second valuations
Mortality assumptions for plans based on second valuations (ie Tranche 4 schemes which are in Tranche 1) will have changed along the trends shown in the tables and figures above. The average (unweighted) increase in assumed life expectancies of a current pensioner male aged 65 since the first (Tranche 1) valuation is 1.4 years.
The changes in the life expectancies assumed from first to second valuations are higher for a relatively small segment of mature schemes (see Table C2 in Appendix C on page 44). The same holds true for a relatively small segment of large schemes.

Recovery plans Assumptions and triggers 29
Section 4: TriggersKey facts
•
The trends in recovery plans reflect the worsening of economic conditions just after the Tranche 3valuation period. Plans have a longer duration on average and a higher proportion have triggered on all triggers.
•
The average (unweighted) length of a Tranche 4 recovery plan was 9.4 years, one year longer than theaverage length of Tranche 3 plans.
•
The proportion of schemes triggering was 70%, 52%, 62%, and 81% forTranches 1, 2, 3, and 4 respectively.
•
The increase in triggering observed in Tranche 4 schemes is greater for the investment return andtechnical provisions trigger points with 39% and 60% of valuations triggering on each respectively. 27% of Tranche 4 schemes triggered on plan lengths and 14% on back-end loading.
continued over...

4.1 Triggers
The regulator’s triggers, while not targets, determine whether recovery plans or technical provisions will prompt a more detailed review. The regulator may still, however, further examine schemes which do not trigger in some instances. The 4 primary triggers include:
• A trigger for technical provisions. This is set at a point between the value of FRS17 liabilities and s179 liabilities; the precise point being scheme specific and dependant on both scheme maturity and employer covenant.
• 3 triggers which relate to the recovery plan. One is where the duration of the plan exceeds 10 years; the second where a plan is excessively back-end loaded; and the third where the investment return over the life of the plan appears to be inappropriate.
Triggers statistics presented in this section report on plans as they were when initially submitted to the regulator.
Figure 4.1 below shows a breakdown of the trigger status of recovery plans submitted across the 4 tranches. The statuses are mutually exclusive categories and include: plans triggered on technical provisions only; plans triggered on both technical provisions and the recovery plan; plans triggered on the recovery plan only; and plans not triggered at all.
100%
90%
80%
70%
60%
50%
40%
30%
20%
10%
0%
Pro
po
rtio
n o
f sc
hem
es
Tranche 1
Cycle 1 Cycle 2
Tranche 2 Tranche 3 Tranche 4
Figure 4.1 Proportion of recovery plans triggered (mutually exclusive and unweighted figures)
30.1%
19.0%
24.6%
26.3%
47.7%
17.3%
12.8%
22.2%
38.1%
26.0%
18.2%
17.7%
19.4%
20.3%
38.3%
22.0%
Did not trigger
Triggered on the recovery plan only
Triggered on both technical provisions and the recovery plan
Triggered on technical provisions only
30 Recovery plans Assumptions and triggers
Section 4: Triggers

Recovery plans Assumptions and triggers 31
Section 4: Triggers
As anticipated in the 2009 report, the proportion of recovery plans triggering is higher for Tranche 4 than for previous tranches. The proportion of schemes triggering only on the recovery plan has decreased while the proportion triggered only on the technical provisions has increased by 4 percentage points. The proportion triggering on both technical provisions and recovery plan has increased by 20 percentage points over Tranche 3.
The increase in triggering on investment return (ie the overall asset return over the duration of the plan) is influenced by the use of post-valuation experience by some schemes in setting the discount rate (in accordance with the regulator’s published guidance Effective valuation date around 31 March 2009).
The increase in schemes triggering on the technical provisions is partly as a result of a decrease in the level of s179 liabilities that funding targets cover due to low gilt yields over the Tranche 4 valuation period. Falling bond yields over this period would also have led to an overall increase in accounting liabilities, and higher s179 and accounting liabilities would have had the effect of raising the threshold for the technical provisions trigger.
Figure 4.2 below shows the proportion of valuations that triggered on technical provisions and the other 3 recovery plan triggers. Unlike Figure 4.1, the categories are not mutually exclusive. For example, if a recovery plan triggered on all 4 triggers, in Figure 5.1 this plan would be included in the category ‘triggered on both technical provisions and the recovery plan’, whereas in Figure 4.2 it would be included in all the 4 trigger categories.
Some key observations from Figure 4.2 include:
• The proportion of schemes triggering on technical provisions, while relatively unchanged from Tranches 2 to 3, increases from Tranches 3 to 4.
• Triggering on investment return has nearly doubled in Tranche 4 relative to Tranche 1.
• While back-end loading has increased over Tranches 2 to 4, the same proportion of Tranche 1 and 4 schemes triggered on back-end loading.
• Triggering on recovery plan length has increased tranche-on-tranche since Tranche 2.
100%
eco
very
pla
ns
90%
80%
70%
60%
50%
40%
30%
20%
Pro
po
rtio
n o
f r
10%
0%
Back-end loading
Trigger
Figure 4.2 Proportion of plans triggered on technical provisions, investment return, recovery plan length and back-end loading
Recovery plan length Investment return Technical provisions
Tranche 1
Tranche 2
Tranche 3
Tranche 4
14% 12% 14%9%19%
27%21%13%
20%
39%
23%12%
51%60%
35% 36%

32 Recovery plans Assumptions and triggers
continued...
4.2 Additional factors influencing triggers
Certain scheme and employer-related characteristics can indicate whether schemes are more or less likely to trigger.
Table 4.1 below shows how the percentage of schemes which triggered on the 4 triggers varies by characteristics within tranches, and also how percentages vary across tranches.
Table 4.1Triggering by scheme characteristics
Section 4: Triggers
Technical provisions (%) Recovery plan (%) Investment return (%) Back-end loading (%)
Tranche T1 T2 T3 T4 T1 T2 T3 T4 T1 T2 T3 T4 T1 T2 T3 T4
All data 51 35 36 60 19 13 21 27 20 12 23 39 14 9 12 14
Size (number of members)
< 100 44.3 37.9 35.6 55.8 19.9 13.0 17.4 20.6 15.3 8.2 15.6 28.1 13.7 7.5 10.1 11.8
100 to less than 500 54.7 35.5 39.5 63.3 19.7 14.2 24.7 29.9 19.9 13.9 25.6 36.9 12.8 9.8 11.5 14.8
500 to less than 1,000 53.4 37.9 39.0 62.7 19.7 13.7 18.4 26.9 20.6 11.0 26.0 41.8 16.0 15.4 16.6 19.4
1,000 to less than 5,000 51.9 28.9 31.1 62.2 17.3 11.2 22.5 30.9 24.0 13.6 26.6 45.9 15.5 9.1 12.7 14.2
5,000 + 53.8 27.4 21.0 56.3 14.5 10.3 18.1 33.1 24.8 23.3 24.8 57.0 12.4 8.2 21.0 14.8
Size of technical provisions
< £5m 48.3 38.1 41.9 63.2 19.2 10.1 14.4 17.3 11.2 9.2 13.4 23.7 14.0 7.4 11.6 11.2
£5m to less than £20m 55.6 37.7 37.7 60.4 16.8 14.6 21.7 25.4 20.9 13.0 24.5 36.9 13.4 9.2 10.2 13.3
£20m to less than £100m 50.7 34.0 34.9 60.6 41.2 28.0 42.2 53.7 23.8 14.2 25.8 40.6 14.6 12.5 13.4 18.0
£100m to less than £300m 49.4 25.0 29.7 60.4 7.8 5.8 13.9 19.5 22.7 13.6 25.2 51.2 12.3 9.1 15.5 13.4
£300m + 47.7 24.2 17.6 52.9 14.5 11.0 21.9 39.4 28.5 17.4 30.3 56.1 14.6 9.1 17.6 16.1
Maturity (% pensioner technical provisions)
< 25% 51.4 36.7 39.1 62.0 19.3 10.8 19.1 20.6 7.0 4.0 6.9 16.8 15.5 9.4 12.1 12.2
25% to less than 50% 51.5 33.0 35.4 61.0 18.9 15.2 22.7 32.2 28.8 15.3 29.4 45.5 13.1 9.6 13.6 16.3
50% to less than 75% 47.8 34.9 30.8 55.8 19.6 15.8 21.6 30.2 36.9 29.9 40.7 61.5 11.0 8.7 11.0 15.3
75% to 100% 60.7 38.2 32.1 60.6 14.3 5.9 10.7 21.2 25.0 41.2 46.4 48.5 10.7 11.8 3.6 9.1
Insolvency group (as defined in The Purple Book 2010)
Groups 1 and 2 47.9 27.0 27.6 59.0 16.5 10.5 18.1 25.6 20.2 13.2 22.1 42.4 14.4 9.5 12.0 12.9
Groups 3 to 8 53.6 35.5 35.3 58.0 20.3 12.4 22.4 33.5 19.6 12.4 23.6 34.9 13.4 9.5 13.2 16.5
Groups 9 and 10 56.3 56.1 52.8 57.1 30.6 20.6 31.7 30.2 16.3 12.2 18.0 37.3 13.1 9.4 14.3 19.0

Recovery plans Assumptions and triggers 33
Section 4: Triggers
Table 4.1 indicates several general features including:
• For Tranches 1, 3, and 4, schemes with the highest maturity were least likely to trigger on back-end loading compared to the other maturity groups.
• For Tranches 1, 2 and 3 schemes with the highest level of maturity were least likely to trigger on recovery plan length. For these 3 tranches, the lower the insolvency risk the less likely schemes were to trigger on plan length.
• While the relationship between size (by number of members) and triggering is unclear, a lower proportion of schemes with fewer than 100 members triggered on investment return compared to other member size groups over the 4 tranches. Likewise, a lower proportion of schemes with less than £5m in technical provisions triggered on investment return compared to other groups. By maturity, a lower proportion of schemes with 0% to 25% maturity failed this trigger.
• Although this is not the case for Tranche 4, the higher the insolvency risk, the more likely a scheme is to trigger on technical provisions for Tranches 1 to 3.
4.3 Lengths
Table 4.2 below shows average (unweighted) and median recovery plan lengths across tranches. The average plan duration increases by 1 year in Tranche 4 to 9.4 years, while the weighted average increases by 4.7 years to 13.7 years. The average length is greater than the median length in Tranche 4 due to the presence of outliers.
Table 4.2Average recovery plan lengths in years
Tranche T1 T2 T3 T4
Unweighted average plan length 7.8 7.3 8.4 9.4
Median 8.8 7.7 8.7 9.2

Recovery plans Assumptions and triggers34
continued...
4.3 Lengths continued
Figure 4.3 below shows the distribution16 of recovery plan lengths for each tranche. The upper and lower limits of the interquartile range (25th and 75th percentiles) for Tranches 1, 2 and 3 are around 5 and 10 years respectively. Across these 3 tranches, the mean lies below the 50th percentile (median) although it has progressively moved towards the median. The Tranche 4 distribution by contrast, has a positive skew, highlighting the fact that the distribution in this tranche is being influenced by outliers. While the 10 year trigger point is still a common length for recovery plans, the Tranche 4 upper quartile is higher than 10 years in this tranche. It is worth noting at this point that these distributions represent plans submitted to the regulator and before any revisions are made.
Section 4: Triggers
Figure 4.3 Distribution of recovery plan lengths
Num
ber
of
year
s
20
18
16
14
12
10
8
6
4
2
0
1 2 3 4
Tranche
4.4 Second valuations
Figure 4.4a below compares the number of schemes triggering on recovery plan length in Tranches 1 and 4, for the 1,006 schemes presenting second valuations only. Of those schemes, 182 triggered on plan length in the first cycle Tranche 1 valuations compared to 299 in the second cycle Tranche 4 valuations.
Figure 4.4a Schemes triggering on the recovery plan length in:
• Tranche 1 only (left hand segment)• Tranche 4 only (right hand segment) and• Tranches 1 and 4 (central segment) for schemes presenting second valuations only.
67 115 184
Tranche 1 only
Tranches 1 and 4
Tranche 4 only
Figure 4.4b below compares the number of schemes triggering on technical provisions in Tranches 1 and 4, for schemes presenting second valuations only. 612 (just over 60%) of schemes triggered on technical provisions in Tranche 4 compared to 527 (just over 50%) of Tranche 1 schemes.
Figure 4.4b Schemes triggering on technical provisions in:
• Tranche 1 only (left hand segment)• Tranche 4 only (right hand segment) and• Tranches 1 and 4 (central segment) for schemes presenting second valuations only.
128 399 213
Tranche 1 only
Tranches 1 and 4
Tranche 4 only
16 The box plot depicts the 5th, 25th, 50th, 75th, and 95th percentiles of the distribution.

Recovery plans Assumptions and triggers 35
Section 4: Triggers
4.4 Second valuations continued
Figure 4.5 below shows the difference in recovery periods between Tranches 1 and 4 valuations (for schemes with Tranche 1 and 4 valuations only). The Tranche 1 period (horizontal axis) is based on the remaining duration of plans at revaluation in the second cycle. For 87% of these schemes, the second plan length is longer than the first at revaluation.
Figure 4.5 Differences between the lengths of Tranche 1 plans at revaluationand Tranche 4 plans (for schemes presenting both Tranche 1 and Tranche 4 plans)
10
5
ence 0
fer
Dif -5
-10
-15
-5 0 5 10 15
Length of Tranche 1 plan (minus years completed)

Recovery plans Assumptions and triggers36
Appendix

Recovery plans Assumptions and triggers 37
Appendix
Appendix AFigure A1 Recovery plan calendar
Sep Mar Sep Mar Sep Mar Sep Mar Sep Mar Sep2005 2006 2006 2007 2007 2008 2008 2009 2009 2010 2010
Tranche 1 Tranche 4 Tranche 5Tranche 2 Tranche 3
Tranche 1 Tranche 2 Tranche 3
Effective valuation dates
Recovery plan Tranche 4due dates
Mar Sep2011 2011
Tranche 6
Tranche 5
A1 Data assumptions
Conventions• For each triennial cycle, data is grouped into tranches of 3 covering valuation dates within the cycle. In this report, a scheme’s tranche is based solely on the effective date of valuation; that is, the Part 3 valuation date. This date could in theory differ to the date the valuation should have fallen due.
• ‘T1’ is sometimes used to denote Tranche 1; ‘T2’, Tranche 2, and so on.
• The second triennial valuation cycle starts with Tranche 4. (See Figure A1, the Recovery plan calendar above).
• SEDR is used to denote the single effective discount rate.
• Insolvency groups 1 to 10 (as defined in The Purple Book 2010) are based on insolvency probabilities which correspond to D&B failure scores. The mapping of failure scores to insolvency probabilities underlying this analysis is that used by the PPF for the purposes of the 2011-201217 levy. This mapping is the third of 3 versions and reflects an updated methodology from the second (ie that used for the previous levy year). The 2009 scheme funding publication used the first version and as such, increases in the distribution of schemes in Figure 1.6 to its equivalent in the 2009 publication should not be interpreted as reflecting a shift from the second to third mapping.
• This report uses ‘second valuations’ to refer to recovery plans in the second cycle of scheme valuations where schemes also filed recovery plans in the first cycle. In this publication this refers to Tranche 4 schemes which had Tranche 1 plans. At the end of August 2010, the regulator had received 1,006 of these.
• Clearance statistics are analysed by the financial year as opposed to tranche.
• Averages quoted are unweighted unless otherwise specified.
continued over...
17 http://www.pensionprotectionfund.org.uk/DocumentLibrary/ Documents/1112_draft_determination_appendix_api.pdf

Recovery plans Assumptions and triggers38
Appendix
A1 Data assumptions continued
Data coverage• The analysis covers plans received by the regulator up to 31 August 2010. Past experience has shown data received up to end of July to be representative of the current tranche.
• With the exception of the mortality analysis (see note immediately below) this analysis includes Tranche 3 plans received by regulator after 31 July 2009.
• Most of the data received after this date has been submitted to the regulator using the latest version of the valuation summary in which schemes have provided actual life expectancies (where they hadn’t previously). The exclusion of Tranche 3 schemes received after 31 July 2009 for the mortality analysis avoids extensive data processing for a relatively small proportion of schemes.
• The majority of Tranche 4 plans are second valuations under the scheme funding regime. However Tranches 1 and 4 do not constitute a perfect cohort, as some Tranche 4 plans are of schemes that were in surplus in the first valuation cycle.
• The mortality assumptions of current and future pensioners are identical in the majority of cases, and some of the main trends presented are based on current male pensioners aged 65 only (unless stated otherwise).
• Base data may vary in different sections as a result of data validation and cleaning.
• The data counts all memberships in schemes with a right to a pension. As some people may have a number of pension entitlements spread over a number of schemes, they may be included more than once in the total memberships under consideration.
Methodology• Weighted averages are weighted by technical provisions.
• Owing to the scheme specific nature of the data, individual data points cannot be presented in some instances. As such, scatter plots and box plots reflect data up to 95th percentiles.
• Figure totals may reflect rounding
• To facilitate comparative analysis of funding, a small number of s179 liability totals in Tranche 4 have been adjusted to an estimate at the Part 3 date.
• Maturity is measured as the proportion of pensioner technical provisions within total technical provisions.
• The whiskers of box plots presented in this report start and end at the 5th and 95th percentiles respectively. The edges of boxes represent the 25th and 75th percentiles while notches represent the 50th. The mean is represented by a symbol.
continued over...

Recovery plans Assumptions and triggers 39
Appendix
Appendix BTable B1Real SEDR by scheme characteristics
Unweighted average (%)
Tranche T1 T2 T3 T4
All data 2.24 2.29 2.15 2.2
Size (number of members)< 100 100 to 499 500 to 999 1,000 to 4,999 5,000 +
2.08 2.34 2.31 2.29 2.26
2.10 2.37 2.46 2.37 2.31
1.96 2.24 2.25 2.24 2.13
2.122.28 2.302.362.37
Size of technical provisions< £5m £5m to less than £20m £20m to less than £100m £100m to less than £300m £300m +
2.05 2.37 2.31 2.25 2.18
2.09 2.36 2.41 2.33 2.33
1.95 2.21 2.24 2.23 2.14
2.122.29 2.292.362.30
Maturity (% pensioner technical provisions)< 25% 25% to less than 50% 50% to less than 75% 75% to 100%
2.20 2.33 2.18 1.72
2.21 2.39 2.30 1.98
2.08 2.26 2.07 1.70
2.172.34 2.291.97
Insolvency group (as defined in The Purple Book 2010)Insolvency groups 1 and 2 Insolvency groups 3 to 8 Insolvency groups 9 and 10
2.28 2.23 2.12
2.34 2.26 2.21
2.23 2.12 2.05
2.332.23 2.08
Source: The Pensions Regulator continued over...

Appendix
Appendix B continued...
Table B2Outperformance of nominal SEDR against 20 year gilts by scheme characteristics
Unweighted average (%)
Tranche T1 T2 T3 T4
All data 0.95 0.84 1.06 1.22
Size (number of members)< 100 100 to 499 500 to 999 1,000 to 4,999 5,000 +
0.82 1.03 1.00 0.99 0.92
0.70 0.93 0.95 0.87 0.82
0.88 1.14 1.16 1.15 1.04
1.031.22 1.311.361.41
Size of technical provisions< £5m £5m to less than £20m £20m to less than £100m £100m to less than £300m £300m +
0.78 1.06 1.00 0.96 0.85
0.69 0.92 0.93 0.84 0.82
0.87 1.10 1.14 1.14 1.08
0.991.24 1.271.391.36
Maturity (% pensioner technical provisions)< 25% 25% to less than 50% 50% to less than 75% 75% to 100%
0.92 1.02 0.89 0.46
0.78 0.93 0.84 0.54
0.99 1.16 0.99 0.66
1.131.31 1.230.92
Insolvency group (as defined in The Purple Book 2010)Insolvency groups 1 and 2 Insolvency groups 3 to 8 Insolvency groups 9 and 10
0.97 0.95 0.84
0.89 0.81 0.77
1.14 1.04 0.94
1.301.17 1.04
Source: Calculations are based on data from The Pensions Regulator and the FTSE Group
Recovery plans Assumptions and triggers40

Table B3Outperformance of real SEDR against >5 year index-linked gilts by scheme characteristics
Appendix
Recovery plans Assumptions and triggers 41
Unweighted average (%)
Tranche T1 T2 T3 T4
All data 0.93 0.84 1.14 1.16
Size (number of members)< 100 100 to 499 500 to 999 1,000 to 4,999 5,000 +
0.77 1.02 1.00 0.99 0.96
0.65 0.92 0.99 0.92 0.88
0.94 1.23 1.26 1.24 1.13
1.011.19 1.211.251.30
Size of technical provisions< £5m £5m to less than £20m £20m to less than £100m £100m to less than £300m £300m +
0.73 1.06 1.01 0.96 0.88
0.64 0.91 0.95 0.89 0.86
0.94 1.19 1.24 1.23 1.16
1.001.20 1.201.271.23
Maturity (% pensioner technical provisions)< 25% 25% to less than 50% 50% to less than 75% 75% to 100%
0.89 1.02 0.89 0.43
0.76 0.94 0.84 0.54
1.06 1.25 1.07 0.69
1.071.24 1.190.89
Insolvency group (as defined in The Purple Book 2010)Insolvency groups 1 and 2 Insolvency groups 3 to 8 Insolvency groups 9 and 10
0.97 0.93 0.80
0.90 0.80 0.77
1.23 1.11 1.04
1.241.13 0.96
Source: Calculations are based on data from The Pensions Regulator and the FTSE Group

Appendix
Appendix CFigure C1 Distribution of the differences of life expectancies for future pensioners aged 45 and current pensioners aged 65
Tranche 1: current pensioners
Tranche 2: current pensioners
Tranche 3: current pensioners
Tranche 4: current pensioners
8
(in y
ears
) 6
4
2
ence
0
fer
Ag
e d
if -2
-4
-6
0 10 20 30 40 50 60 70 80 90 100
Percentiles
42 Recovery plans Assumptions and triggers

Appendix
Appendix C continued...
Table C1Life expectancies by scheme characteristics, base tables, projections and underpins assumed (Tranche 4 only)
Recovery plans Assumptions and triggers 43
Unweighted average life expectancy (males)
Proportion of schemes
Proportion using the
long cohortprojection
Weighted average life expectancy (males)
Difference Age 65 Age 45 Age 65 Age 45 Difference
Maturity (% pensioner technical < 25% 25% to less than 50% 50% to less than 75% 75% to 100%
provisions) 2.0 2.1 2.2 2.2
87.2 86.9 87.0 87.5
89.3 89.0 89.1 89.7
36% 42% 20% 2%
45% 33% 33% 45%
87.1 87.5 86.6 87.8
89.3 90.1 88.9 89.5
2.22.62.31.6
Technical provisions < £5m £5m to less than £20m £20m to less than £100m £100m to less than £300m £300m +
2.0 2.1 2.1 2.1 2.2
87.3 87.2 86.9 86.9 86.8
89.2 89.2 89.0 89.0 89.1
22% 28% 28% 11% 10%
51% 41% 33% 29% 25%
87.2 87.1 86.9 86.9 87.1
89.2 89.2 89.0 89.0 89.5
2.02.12.22.12.5
Size (members) < 100 100 to 499 500 to 999 1,000 to 4,999 5,000 +
2.0 2.1 2.1 2.1 2.2
87.4 87.2 86.7 86.7 86.7
89.4 89.3 88.8 88.8 89.0
27% 33% 14% 17% 10%
49% 41% 29% 28% 25%
87.8 87.5 86.8 86.9 87.1
89.7 89.6 89.0 89.0 89.5
2.02.22.22.12.5
Base table 92 00 S1 Other
1.7 2.1 2.1 1.9
86.9 87.6 86.7 87.5
88.7 89.7 88.8 89.3
13% 37% 48% 2%
23% 42% 37% 81%
86.5 87.6 87.1 86.7
88.5 89.8 89.6 89.3
2.02.22.62.6
Future improvements LC MC
2.1 2.1
87.7 86.6
89.8 88.7
39% 61%
87.6 87.0
89.9 89.3
2.42.3
Underpin 0 0.5 0.75 0.8 1 1.2 1.25 1.3 1.4 1.5 1.75 2
1.3 1.5 1.7 1.6 2.0 2.2 2.4 0.4 2.9 2.8 3.4 4.1
87.0 87.0 86.5 86.5 86.9 87.5 87.3 85.4 88.1 87.4 88.2 88.2
88.2 88.5 88.2 88.1 88.9 89.7 89.7 85.8 90.9 90.2 91.7 92.4
10% 1% 1% 0%
61% 0% 7% 0% 2%
17% 0% 0%
43% 57% 56% 0%
41% 25% 57% 0% 0%
21% 50% 20%
87.1 86.4 86.2 86.9 86.5 88.3 87.4 85.4 87.7 87.8 88.0 87.6
88.4 87.9 87.8 88.6 88.5 90.4 89.7 85.8 90.7 90.6 91.2 91.0
1.21.51.61.72.02.12.30.43.02.83.23.4

Appendix
Table C2Change in life expectancies (measured in years) from first to second valuations
Size (number of members)
Change in assumed age
Proportion of schemes (%)
0 to 99 100 to 499 500 to 999 1,000 to 4,999 5,000 +
1.5 1.4 1.4 1.2 1.7
24.235.315.016.78.8
Maturity (% pensioner technical provisions)
< 25% 25% to less than 50% 50% to less than 75% 75% to 100%
1.4 1.4 1.4 1.9
32.744.320.82.1
Recovery plans Assumptions and triggers44
Appendix C continued...

Appendix
Recovery plans Assumptions and triggers 45
continued over...
Glossary
Definitions
Actuarial valuationA comparison by the actuary of the value placed on scheme assets with the technical provisions and an assessment of any future contribution requirement. Calculation of the technical provisions is usually based on full member-by-member data.
Actuary or Scheme actuaryThe named actuary appointed or authorised by the trustees of a defined benefit (DB) occupational pension scheme to carry out specific functions and duties set out in pensions legislation.
Calendar yearProjection approach that uses death rates in a particular calendar year as a proxy for the rates expected to be experienced. See also ‘Year of birth’.
Cohort effect Common allowances for the cohort effect Assumes that those born in certain generations have • Short cohort more marked reductions in mortality year-on-year than the The assumed period is until 2010.generations born before or after. The assumed period of • Medium cohort future years over which the cohort effect gradually evaporates can vary.
The assumed period is until 2020.• Long cohort The assumed period is until 2040.
Contingent assetsContingent assets are assets (of various types) to which schemes would be entitled to on the occurrence of one or more specified future events such as an employer insolvency or the failure to achieve a specified funding level. Contingent assets may be provided by any party, typically the sponsoring employer, another group company or a third party, such as a bank.
Defined benefit (DB)Benefits are worked out using a formula that is usually related to the members’ pensionable earnings and/or length of service. These schemes are also referred to as ‘final salary’ or ‘salary related’ pension schemes.
Different rates approachThe practice of using separate discount rates with respect to pre-retirement and post-retirement benefits in the valuation of liabilities. See also ‘Single rates approach’.
Discount rateA discount rate is a rate of compound interest which is used to calculate the present value of a sum due at a later time. This action discounts the sum due to its value today. It inherently assumes that the present value is invested and has to earn the chosen discount rate to achieve the sum due at the later time.
Often separate rates are chosen for the pre-retirement and post-retirement periods. The post-retirement rate is used to discount the pension payments of current pensioners back to the valuation date. It is also used to discount the expected pensions of active and deferred members back to their assumed retirement date, and then the pre-retirement discount rate is used to discount these retirement date liabilities of active and deferred members back to the valuation date.
Where a single discount rate is used, scheme maturity might affect the rates chosen by particular schemes. Immature schemes (with the majority of members being active or deferred) may seek higher returns from higher risk investments such as equities. Mature schemes (with the majority of members being pensioners) may be more likely to invest in bonds or gilts with lower expected returns but less risk. The discount rate may be set to reflect these behaviour patterns. See also ‘Single rates approach’, ‘Different rates approach’, ‘Effective single rate’.

Appendix
Glossary continued...
46 Recovery plans Assumptions and triggers
Definitions
Effective date An actuarial valuation or an actuarial report considers the funding of a scheme as at a particular date, known as the effective date. The effective date will be earlier than the date on which calculations are done. The effective date of a scheme’s first Part 3 valuation cannot be before 22 September 2005.
LongevityHow long scheme beneficiaries are expected to live. Longevity usually refers to the future expected lifetime derived from any particular set of mortality rates.
Part 3 valuation or Scheme funding valuationAn actuarial valuation meeting the requirements of Part 3 of the Pensions Act 2004 concerning the funding of defined benefits, which apply to any actuarial valuation received by trustees on or after 30 December 2005, that is based on an effective date of 22 September 2005 or later.
Pension Protection Fund (PPF)A corporate body established under the Pensions Act 2004. The PPF was set up to provide compensation to members of eligible DB pension schemes, when there is a qualifying insolvency event in relation to the employer, and where there are insufficient assets in the pension scheme to cover the Pension Protection Fund level of compensation.
Pension protection levyThis is the annual amount that a pension scheme is charged by the Pension Protection Fund. It is composed of a scheme-based levy and a risk-based levy.
Recovery plan Under the statutory funding objective, where there is a shortfall at the effective date of the actuarial valuation, the trustees must aim to achieve full funding in relation to the technical provisions. The plan to address this shortfall is known as a recovery plan.
Recovery plan lengthThe recovery plan length is the time that it will take for a scheme to recover any shortfall at the effective date of the actuarial valuation, so that by the end of the recovery plan, it will be fully funded in relation to the technical provisions.
Section 179 liabilities (s179) This refers to a valuation of Pension Protection Fund (PPF) compensation benefits under section 179 of the Pensions Act 2004 for PPF levy purposes. This measure is designed to be a close approximation to the liability measure that would be used to decide whether the PPF would need to take on the scheme were the employer to become insolvent. In contrast to technical provisions, the assumptions to be used in a s179 valuation are prescribed by the PPF and are standard across all schemes. They are designed such that s179 is close to the cost of securing the valued benefits with an insurance company at the valuation date.
Section 179 (s179) valuationTo calculate the risk-based pension protection levy, the PPF Board must take account of scheme underfunding. To obtain a consistent basis for determining underfunding, schemes must complete a PPF valuation (section 179) which will be based on the level of assets and liabilities for the scheme. The liabilities will be based on the scheme benefits taking into account key features of the levels of compensation paid by the Board of the PPF, as set out in Schedule 7 of the Pensions Act.
continued over...

Appendix
Glossary continued...
Recovery plans Assumptions and triggers 47
Definitions
Single effective discount rate (SEDR)A single composite rate computed by The Pensions Regulator and made up of constituents of the different rates approach, allowing approximately for the maturity of schemes. The regulator also uses this approach to normalise bases where the discount rate varies year-on-year.
Single rates approachThe use of a single discount rate in the valuation of pre-retirement and post-retirement liabilities. See also ‘Different rates’ approach.
Technical provisions The Technical provisions are an estimate, made on actuarial principles, of the assets needed at any particular time to make provision for benefits already considered accrued under the scheme – in other words, what is required for the scheme to meet the statutory funding objective at a given date. These include pensions in payment (including those payable to survivors of former members) and benefits accrued by other members which will become payable in the future.
The Pensions RegulatorThe UK regulator of work-based pension schemes, an executive non-departmental public body established under the Pensions Act 2004.
Type A eventAn event that is materially detrimental to the ability of a scheme to meet its pension liabilities, as well as some events that are directly detrimental to members’ benefits. For some examples of potential type A events, refer to paragraphs 56 and 65 in our clearance guidance found at: http://www.thepensionsregulator.gov.uk/guidance/guidance-clearance.aspx
Type A events can be categorised as either employer-related or scheme-related. An employer-related event will only be considered to be a type A event if there is a deficit on the relevant basis as described in the clearance guidance.
UnderpinAn adjustment to mortality tables which subjects the improvement rate to a minimum value.
Valuation summaryA form to be completed when a recovery plan and schedule of contributions have been agreed by the trustees and the employer, following an actuarial valuation.
Year of birthAllows for anticipated future improvements in mortality for each individual as it tracks each member through their lifetime. This is the theoretically correct methodology as it allows for the anticipated future improvements on an age-by-age basis. See also ‘Calendar year’.

How to contact us
Napier HouseTrafalgar PlaceBrightonBN1 4DW
T 0870 606 3636F 0870 241 1144E [email protected]
www.thepensionsregulator.gov.ukwww.trusteetoolkit.com
Recovery plans Assumptions and triggers © The Pensions Regulator December 2010
You can reproduce the text in this publication as long as you quote The Pensions Regulator’s name
and title of the publication. Please contact us if you have any questions about this publication. We can
produce it in Braille, in large print or on audio tape. We can also produce it in other languages.