Recent Shore Ice Ride-up and Pile-up Observations Part I … · · 2000-09-28b Recent Shore Ice...
50
b Recent Shore Ice Ride-up and Pile-up Observations Part I Beaufort Sea Coast, Alaska by Austin Kovacs
Transcript of Recent Shore Ice Ride-up and Pile-up Observations Part I … · · 2000-09-28b Recent Shore Ice...
b
Recent Shore Ice Ride-up and Pile-up Observations
Part I
Beaufort Sea Coast, Alaska
by
Austin Kovacs

,,t”
Introduction
Sea ice acting on arctic coasts modifies the shore, producing unique
beach morphology. A number of the morphological features produced are
depicted in Figure 1. In addition, sea ice thrusting up onto the shore can
produce gouges, furrows and striations, and when ie melts it can leave
potholes or pitted beach topography. Sea ice as an erosive agent is not
well documented, but it is how-n that both fine-grained material and
boulders have been removed from the shore zone by drifting sea ice (Fig. 2
and 3). However, sea ice thrusting against the land can move offshore
sediment and boulder Iandward, and in this way it helps to restore beach
material displaced by wave erosion. In addition, ice-push ridges and
barricades help protect the shore from wave attack and run-up onto the
land.
shore
rence
The topographic landforms created when sea ice advances onto the
are signatures which “provide information on the frequency of occur-
and magnitude of the forces at play, and maximum transgression beyond
the water’s edge.
Sea ice pile-up (Fig. 4) and ride-up (Fig. 5) on arctic and subarctic
shores are frequent and predictable events. These phenomena have pulver-
ized boats, destroyed piers and wharfs and on occasion crushed houses along
with their unlucky inhabitants. Stefansson (1969) stated: “’houses which
stand one or two hundred yards from the beach are in danger’* of ice ride-
up. These events cause concern today about the safety of facilities
located along these shores and on manmade islands out at sea. Questions
arise as to the frequency and severity of these events.
A survey of shore ice pile-up and ride-up along the coast of Norton
Sound and the Alaska coasts of the , Bering, Chukchi and Beaufort Seas in
1

,?’
the” winters of 1979-80, 1980-81 and 1981-82 revealed many locations where
significant (greater than 5 m) onshore ice movement had occurred, both
recent and old. This paper, Part I, discusses observations and current
findings related to onshore sea ice incursions along the Alaskan Beaufort
Sea coast. It is an extension of previous reports by Kovacs and Sodhi
(1980); Kovacs, Sodhi and Cox (1982); and Kovacs and Kovacs (1982) on sea .
ice encroachment on arctic and subarctic shores which includes field.
observations and theoretical analyses. Parts”II and III of this series
will present information on shore ice pile-up and ride-up on the Chukchi
Sea coast and on the Bering Sea - Norton Sound coasts of Alaska,
respectively.
Winter 1979-80 Observations
The 1979-80 winter observations along the Beaufort Sea coast were made
from Pt. Barrow to Barter Island. Records were made of ice ride-ups which
extended 5 or more meters in from the sea. Lesser ice thrusts were con-
sidered too frequent and of limited significance.
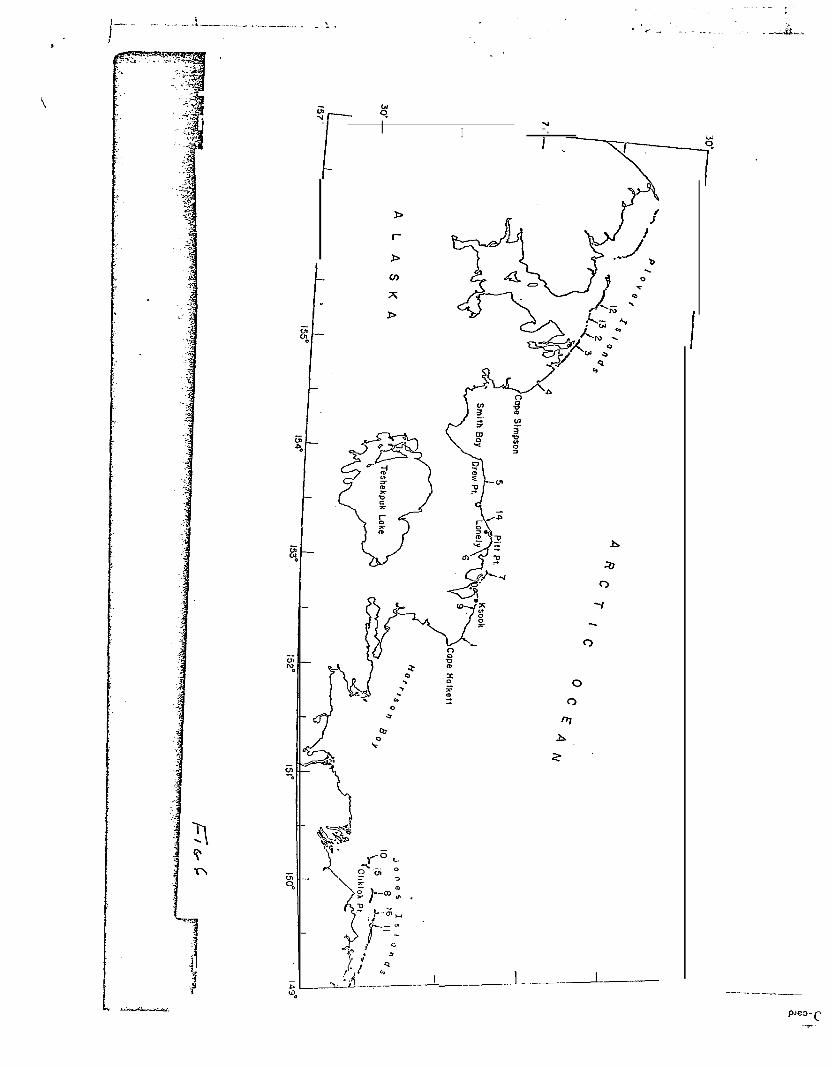
In November 1979 an ice pile-up was observed west of Cape Halkett
(position 1 in Figure 6), which extended nearly 300 m along the coast. The
ice blocks were 25 cm thick, and were piled up to 3 1/2 m high on top of
the 2-m-high coastal
30 m inland from the.
base of this bluff.
shoreline (6 to 10
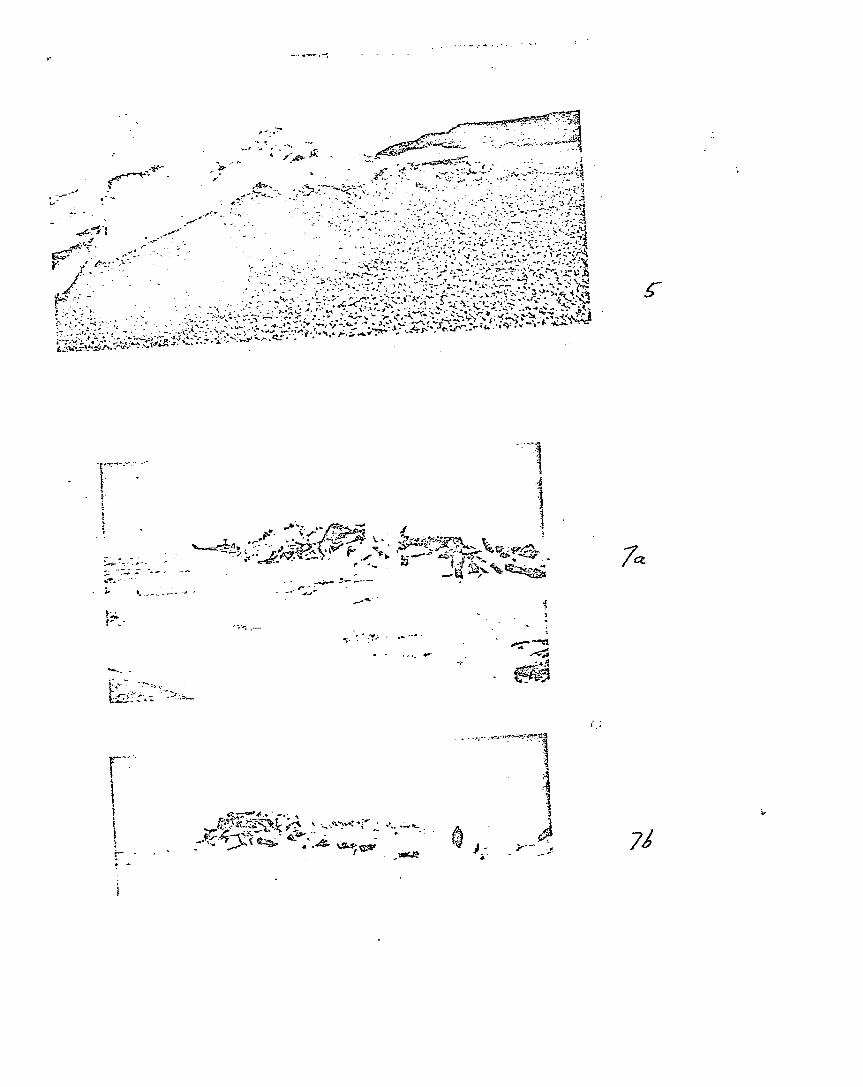
In April 1980
and 13 m inland on
Figure 6).
bluff (Fig. 7). In places, the ice Mocks were up to
edge of the bluff. In summer, the sea extends to the
Shallow water exists offshore. Rapid erosion of the
m/yr) gives rise to very turbid offshore water.
sea ice ride-up was measured 8 m inland on IgaMk Island
Kulgurak Island (positions 2 and 3, respectively, in
2
West of Cape Simpson (position 4 in Figure 6) 40-cm-thick sea ice had
thrust inland 16 m, and east of Pt. McLeod at position 5 it was found on
top of the 3-m-high bluffs and up to 20 m inland. At positions 6 and 7,
ice extended 5 to 10 m inland.
Spy Island (position 8 in Figure 6) was overridden by fall ice of
unknown thickness. The ice override distance could not be determined
because of drift snow but was in excess of 80 m. During the summer, Jim.
Helmericks (personal discussion) noted that island material had been pushed
up into piles and the island cut down in places so that storm wave &n-over
occurred. This action was reported to have cut the island into four
sections.
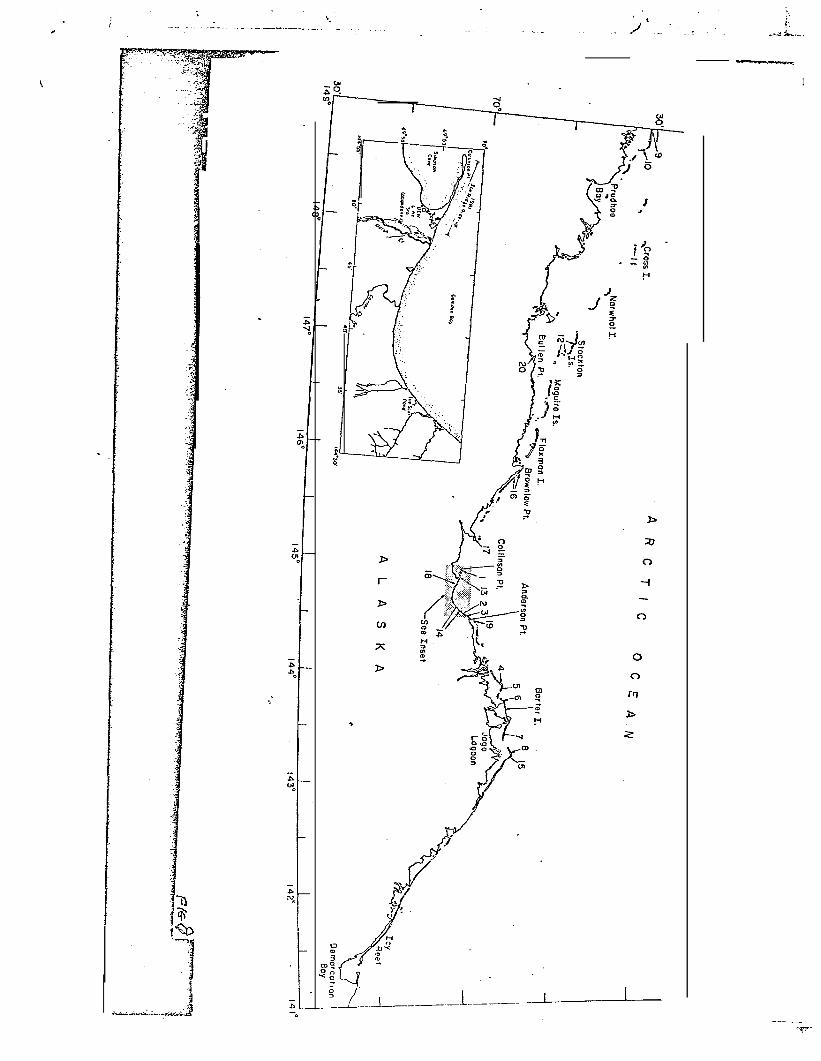
At position 1 in Figure 8, l/2-m ice overrode the 1 l/2-m-high
Collinson Pt. spit for a distance of 50 m. At positions 2 and 3 ice 1.1 m
thick had ridden up the 2-m-high beach and moved 5 to 20 m inland. Long
sections of the coast at positions 4, 5 and 6 had ice pile-up on the
beach. At position 4, ice 1/2 m thick had thrust inland up to 60 m on the
island (see Fig. 9). At positions 7 and 8 ice 1/2 m thick piled up to 5 m
high and moved over 10 m inland on the barrier island.
Winter 1980-81 and Summer 1981 Observations
The Beaufort Sea coast from Pt. Barrow to the U.S.-Canadian border was*
overflown in April 1981. As in April 1980, sea ice was again observed on
Kulgurak Island (position 3 in Figure 2). This year the ice had piled up
or thrust inland 7-8 m.
At Point Drew (see Figure 6) 30-cm-thick sea ice had invaded nearly
the entire spit which is over 1 lau long. Ice pile-ups up to 3 m high
●❛✎✎
existed
spit at
along most of the spit, and complete ice override of 75 m of the
the west end had occurred. In August, even though most of the
beach on the seaward side of the spit had been modified by storm wave run-
up, much ice-thrust beach topography still existed. The spit was found to
consist for the most part of peat and fine-grained silt. The ice pushed
this material into piles up to 1.5 m high. Sea ice and driftwood were
found incorporated into the debris of the larger piles (Fig. 10). In some
locations, large slabs of peat material about 25 cm thick had been dis-
placed and stacked layer upon layer (Fig. 11). This section of the coast-
line is receding at a rate of 6 to 10 m per year (Lewellen, 1977; Hartz,
1978). Therefore, summer storm waves and coastal currents rapidly modify
the coastline and in so doing remove ice ride-up scars from the land.
On 26 June, at about 1030, sea ice up to 1/2 m thick moved in upon the
beach along a broad section of the coast near the Lonely DEW Line Station
(Fig. 6). People who observed the event stated that the ice piling lasted
less than 10 minutes and reached a height of 4 m (Fig. 12). In late
August we found that the ice ride-up had dozed up beach
for a distance of 30 m from the water’s edge along more
shore. The longest inland ice advance as determined by
was 59 m. Ho ice remained exposed on the beach but ice
gravel consistently
than 500 m of the
ice gouge length
was found under
several of the ice-push gravel piles (Fig. 13).
Along the beach at Lonely DEW Line Station, several old ice scars not
detected on previous reconnaissance flights were discovered (Fig. 14). The
ice-push tundra berm furthest from the sea was 85 m inland. The berms were
impregnated with driftwood, which was incorporated into the soil during ice
dozing (Fig. 15).

(*‘
Aerial photos of this coastline taken in 1945, before development had
occurred, show that these features were in existence then. A better
quality 1949 aerial photo of these features is shown in Figure 16. Our
aerial photo assessment of shoreline retreat in the immediate area of the
ice
ice
How
scars is about 1/2 m per year. Therefore, in 1945 the furthest-inland.
scar we measured in 1981 must have been around 100 m from the ocean..
far inland the ice-push features were right after the ice ride-up event
occurred is, of course, unknown.
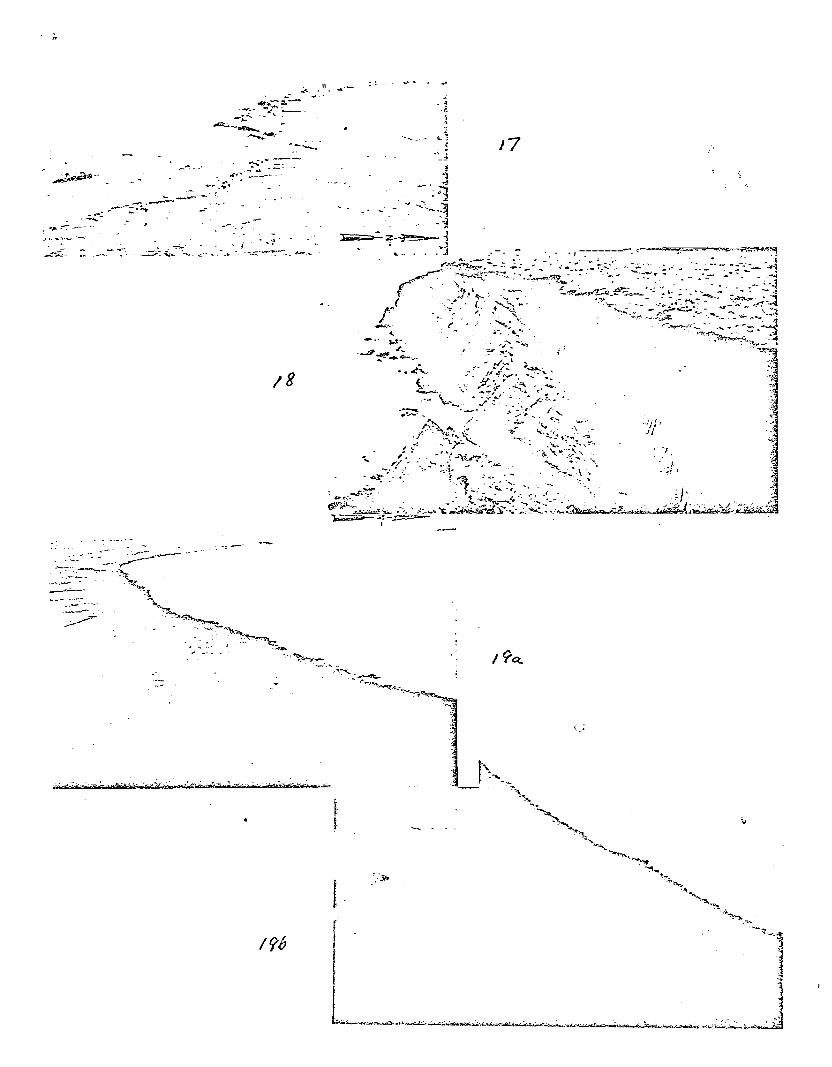
In May at Ksook, the site of a turn-of-the-century trading post shown
in Figure 6, the shore ice pile-up and ride-up formations shown in Figure
17 were observed. The higher ice pile-ups, extending westward away from
the house in Figure 17 , were situated on a low-lying coast. These ice
piles were up to 5 m high and 20 m inland from the sea. Fingers of sea ice
extended inland up to 35 m. The ice pile-up directly north of the hut “in
Figure 17 was 1 m higher than the 2-m-high bluff (Fig. 18) on which the ice
came to rest.
Aerial views taken in August 1981 of the ice-pushed tundra relief and
coastline are shown in Figure 19. These views show that the previous
winter’s shore ice ride-up displaced and scarred a significant area of the
shoreline. Ground views of the ice-pushed relief are shown in Figure 20.
We found the coastline west of the hut where the ice moved inland to be
composed of peat. Large slabs of this material up to 0.25 m thick were
found to have been peeled loose and displaced inland by the ice (Fig. 20).
A profile of one of the ice-pushed peat piles and the shoreline relief
is presented in Figure 21. This pile reached an elevation of 2.4 m, or

.. —. ———-—. .—.. . . . .- —_.. —..
,’* ‘
about 1.6 m above the undisturbed terrain. Other ice-push features were
either higher or further inland (up to 29 m). The seabed off shore was
shallow and composed of stiff peat and silt. The shallow slope of Che
seabed, 3.8°, is probably the result of the high rate of coastline erosion
in this area. Indeed, this coast is retreating faster than any other area
on the entire Alaskan Arctic Ocean. Typical annual retreat is reported to
be 10 to 25 m per year, depemding on summer storms and specific shoreline
-site (Lewellen, 1977; Hartz, 1978). .This retreat can be illustrated in the
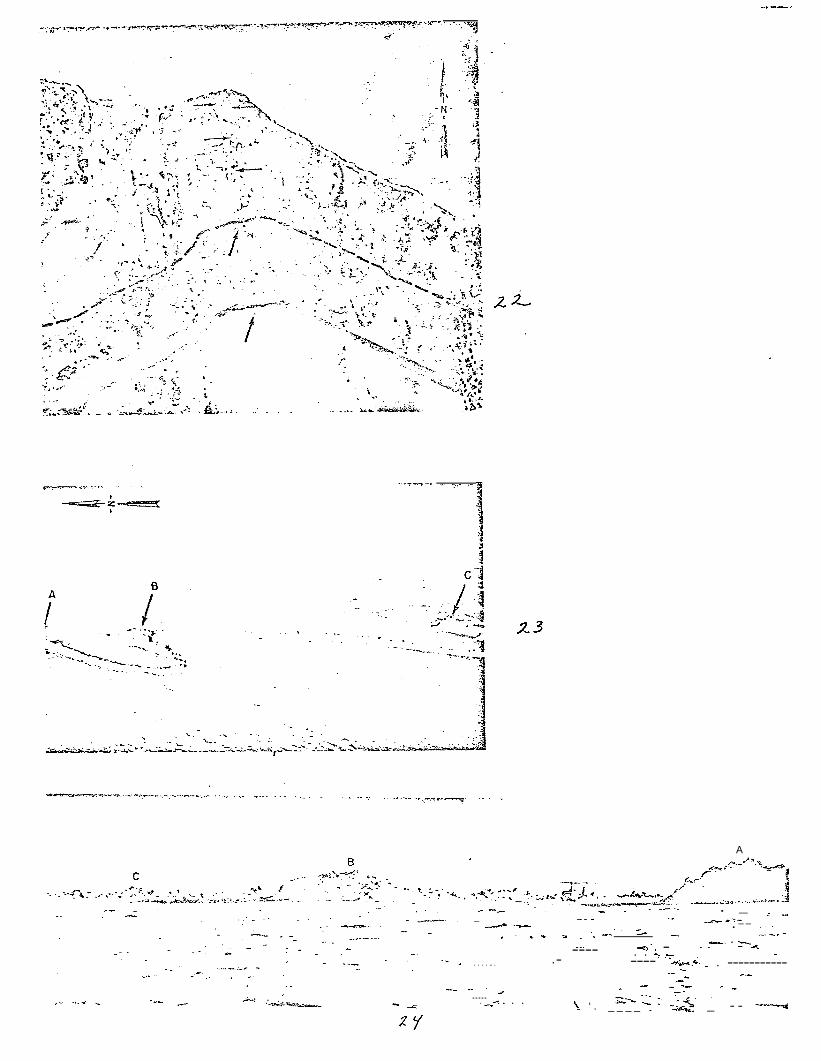
1949 photo shown in Figure 22. The arrows point to five structures. Those
north of the dashed line, which represents the shoreline location obtained
from the September 1981 aerial photo inlaid at the bottom of Figure 22, are
now gone. Since 1949, some 410 m of coastline has eroded north of the
remaining house. This represents an average of 12.8 m of erosion per
year. The last remaining K.sook structure was 19 m from the bluff in late
1981 and will probably be destroyed within two summer open water seasons if
annual shoreline retreat continues to average over 10 m per year.
East of Ksook, at position 9 in Figure 2, fall ice was observed piled
1 to 3 m high along some 150 m of the 2-m-high coastal
extended 5 to 15 m inland.
On the north side of Thetis Island and Spy Island
bluff . .The ice
(positions 8 and 10
respectively in Figure 2) fall ice less than 1/2 m thick was piled up to 3
m high and 12 m inland.
Along the north side of Pingok Island (position 11 in Figure 6) fall
ice was observed piled 3 to 4 m high and 30 m inland on the coastal bluff,
which is 3 1/2 to 4 m above sea level. This ice extended some 1 km along
the coastline.
6
.*’
Two- to four-meter-high pile-ups were also noted along most of the
western end of Long Island (position 9 in Figure 8).
It is worth noting that in mid-March off the eastern end of Long
Island a broad area of ice moved from the northeast to within 100 m of the
shore. The ice was 1.55 m thick. Significant rafting and riding occurred,
as shown in Figure 23. Ice movement stations on either side of this area#
recorded little or no ice movement at the time, but a station some distance
“’upstream’ s experienced movement in excess of its recording capacity. We
measured one finger raft between ridges A and B which was 155 m long and
three grounded ridges over 8 m high (Fig. 24). In short, 1.55-m ice came
close to riding up onto Long Island.
In late October, 15- to 20-cm-Chick ice moved from the west 30 m onto
No Name Island (position 11 in Figure 6). It completely overrode a steep-
sloped 1 l/2-m-high gravel berm placed there by construction crews and
moved inland 20 to 30 m.
Ice of similar thickness was driven 10-15 m up onto the north side of
several islands at position 12 in Figure 8. On one of these islands the
ice was estimated to have moved at a relatively slow rate of 0.6 to 1.5 m
per hour (Vaudrey and Potter, 1981).
Along the beach east’of Collinson Pt. (from positions I to 13 in
Figure 8) most of the shore was covered with
up to 4 m high. In late August, we- measured
.30-cm-thick ice debris piled
one area where 510 m of beach
was continuously scarred by ice ride-up. These scars extended inland up to
30 m from the water’s edge (Fig. 25). Ice-pushed gravel piles up to 1 m
high, but typically less than 1/2 m high, were observed (Fig. 26).
7
(**
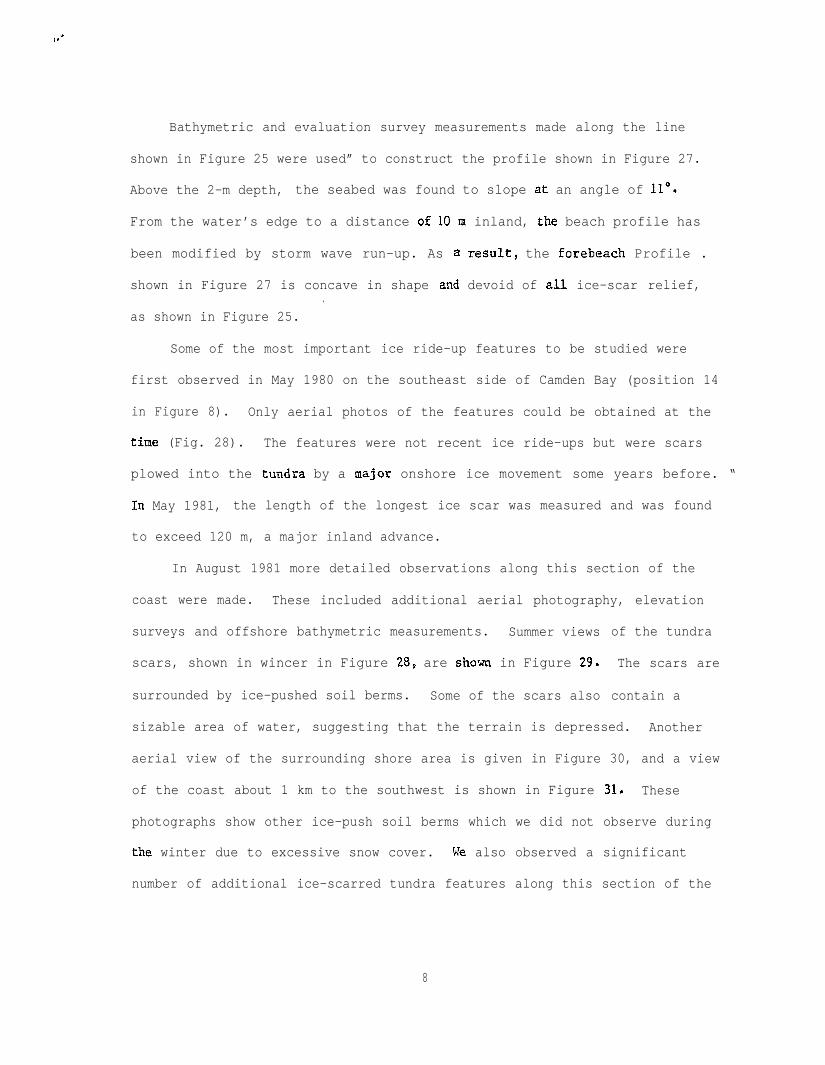
Bathymetric and evaluation survey measurements made along the line
shown in Figure 25 were used” to construct the profile shown in Figure 27.
Above the 2-m depth, the seabed was found to slope at an angle of 11O.
From the water’s edge to a distance of 10 m inland, the beach profile has
been modified by storm wave run-up. As a results the forebeach Profile .
shown in Figure 27 is concave in shape and devoid of all ice-scar relief,.
as shown in Figure 25.
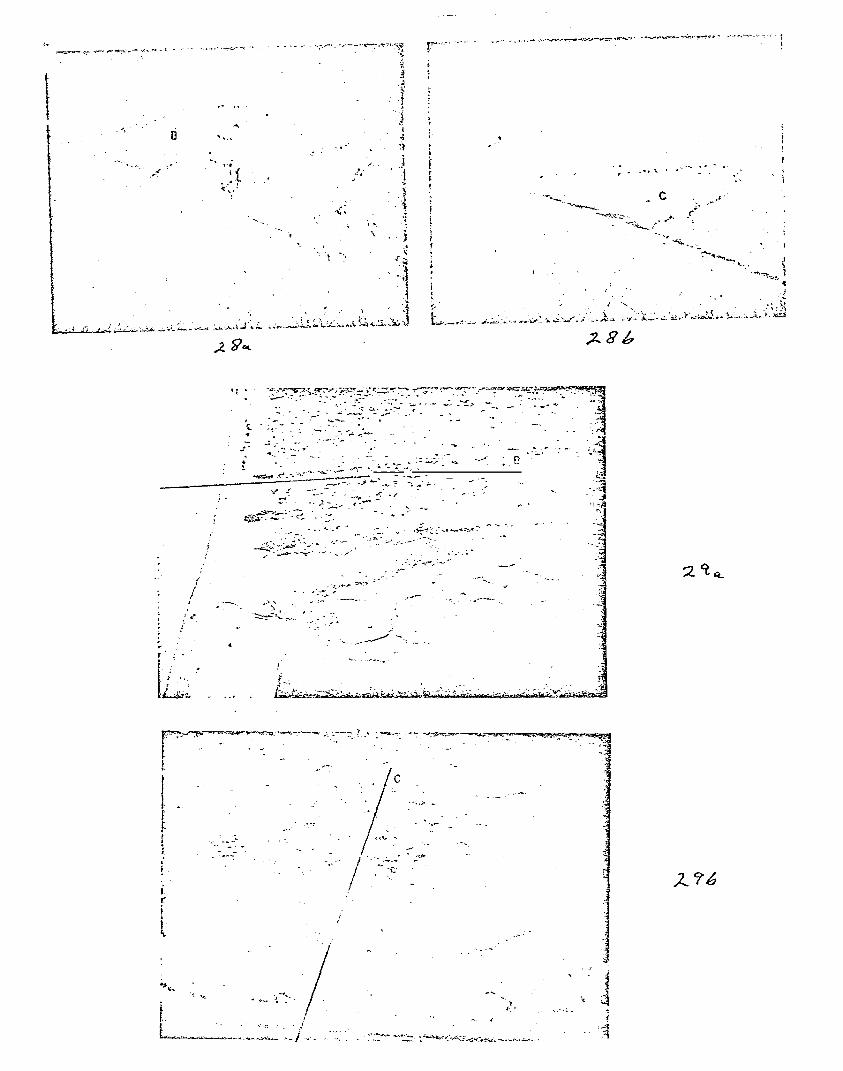
Some of the most important ice ride-up features to be studied were
first observed in May 1980 on the southeast side of Camden Bay (position 14
in Figure 8). Only aerial photos of the features could be obtained at the
time (Fig. 28). The features were not recent ice ride-ups but were scars
plowed into the tundia by a major onshore ice movement some years before. “
In May 1981, the length of the longest ice scar was measured and was found
to exceed 120 m, a major inland advance.
In August 1981 more detailed observations along this section of the
coast were made. These included additional aerial photography, elevation
surveys and offshore bathymetric measurements. Summer views
scars, shown in wincer in Figure 28, are shown in Figure 29.
surrounded by ice-pushed soil berms. Some of the scars also
of the tundra
The scars are
contain a
sizable area of water, suggesting that the terrain is depressed. Another
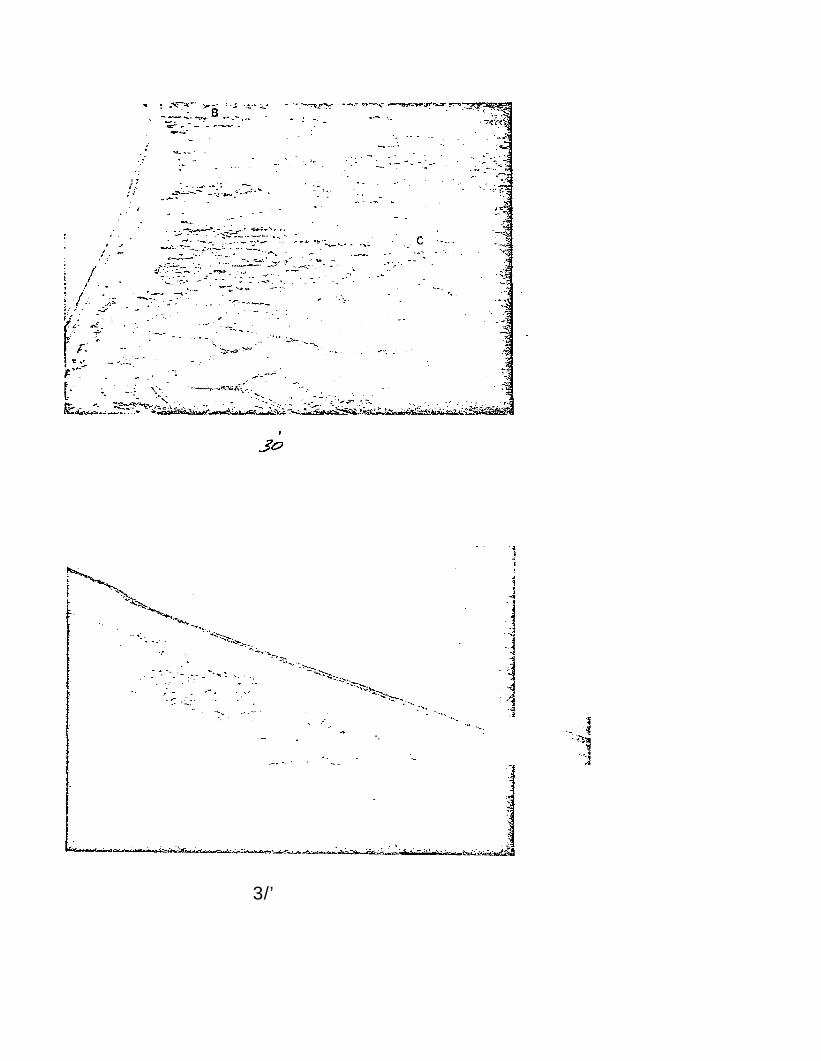
aerial view of the surrounding shore area is given in Figure 30, and a view
of the coast about 1 km to the southwest is shown in Figure 31. These
photographs show other ice-push soil berms which we did not observe during
the winter due to excessive snow cover. We also observed a significant
number of additional ice-scarred tundra features along this section of the
8

coast which were not apparent during the winter due to snow cover. These
scars indicate that a major onshore ice movement occurred at some time in
the past, and that this event left intermittent ice scars in the tundra
along a large section of the coast. In addition, we observed numerous
recent ice-push gravel piles which extended up to 20 m inland from the
water’s edge (Fig. 31). These features indicate that onshore ice movement
is a frequent event along this coastline.
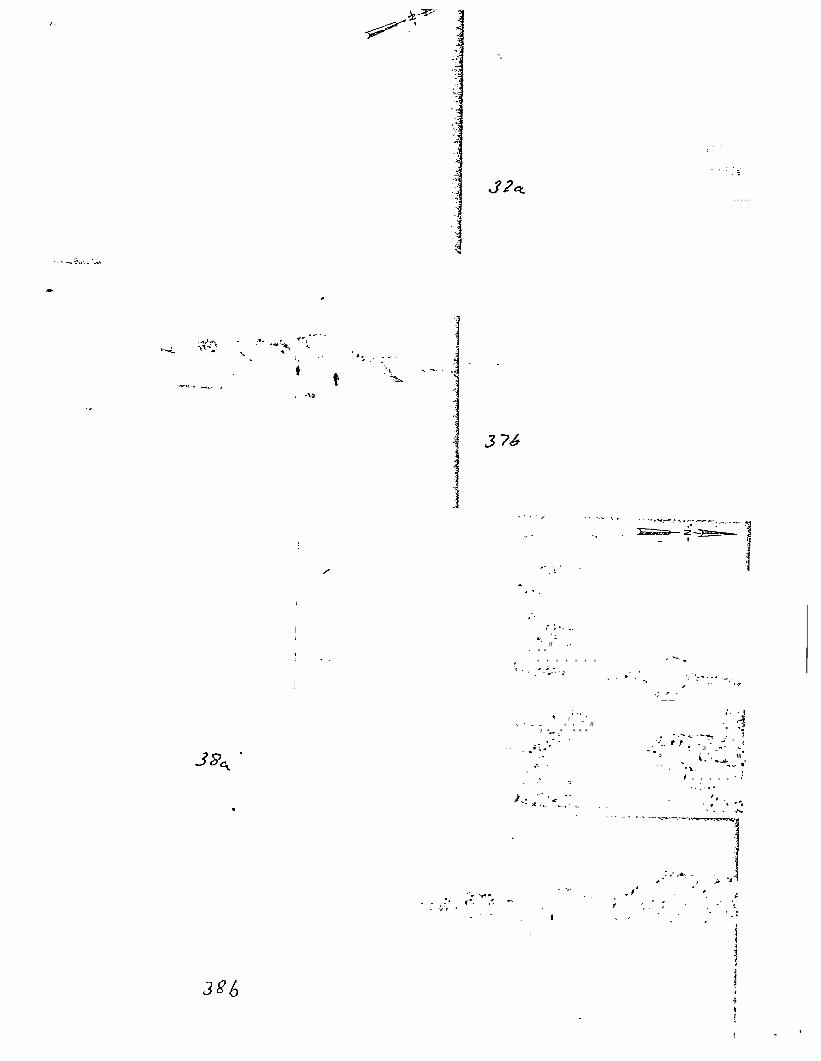
Panoramic views of the tundra scar shown in Figures 29a and b are
shown in Figures 32a and b respectively. These views show a beach composed
of surprisingly coarse gravel, much driftwood debris, and ice-push tundra
berms over 1.5 m high. }fost of the driftwood was carried on shore by high
water storm events. However, we also found wood deeply embedded in the
ice-push tundra berms, indicating that it
during ice plowing. The back of the berm
is shown in Figure 33. Note the apparent
berm from the two sides.
was incorporated into the berm
behind the person in Figure 32b
difference in elevation of the
Am elevation survey was made along the lines shown in Figure 29. An
elevation survey was also made
berm beyond the B profile line
determined by taking soundings
of the undisturbed tundra
drawn in Figure 29a. The
from an inflatable raft.
just north of the
seabed relief was
The survey results
are shown in Figure 34. The seabed near the beach is shown to slope at an
angle of 8° to a depth of 2 m. Beyond this depth, the seabed has a very
shallow slope. The steeper slope near shore above the 2-m depth may be
controlled in part by ice-push, which transfers gravel up onto the beach.
The natural or non-ice-scarred tundra surface (profile A) is shown to have

,’
an elevation which is more than twice that of the ice-scarred terrain along .
profile B. It should be noted that profile B does not represent the deep-
est area of this ice-scarred feature. The deeper area was up to 1/2 m
below the pond water level, an area we did not attempt to profile.
Ice plowing clearly resulted in the displacement of surface material.
This in turn exposed the underlying material , which allowed solar radiation
to thaw the ground ice. Differential subsidence in the scarred area then
occurred. A striking feature of the ice-scarred terrain was that all sur-
faces
old .
edge.
were covered by vegetation, indicating that these scars are quite
The longest ice scar was found to extend 130 m in from the water’s
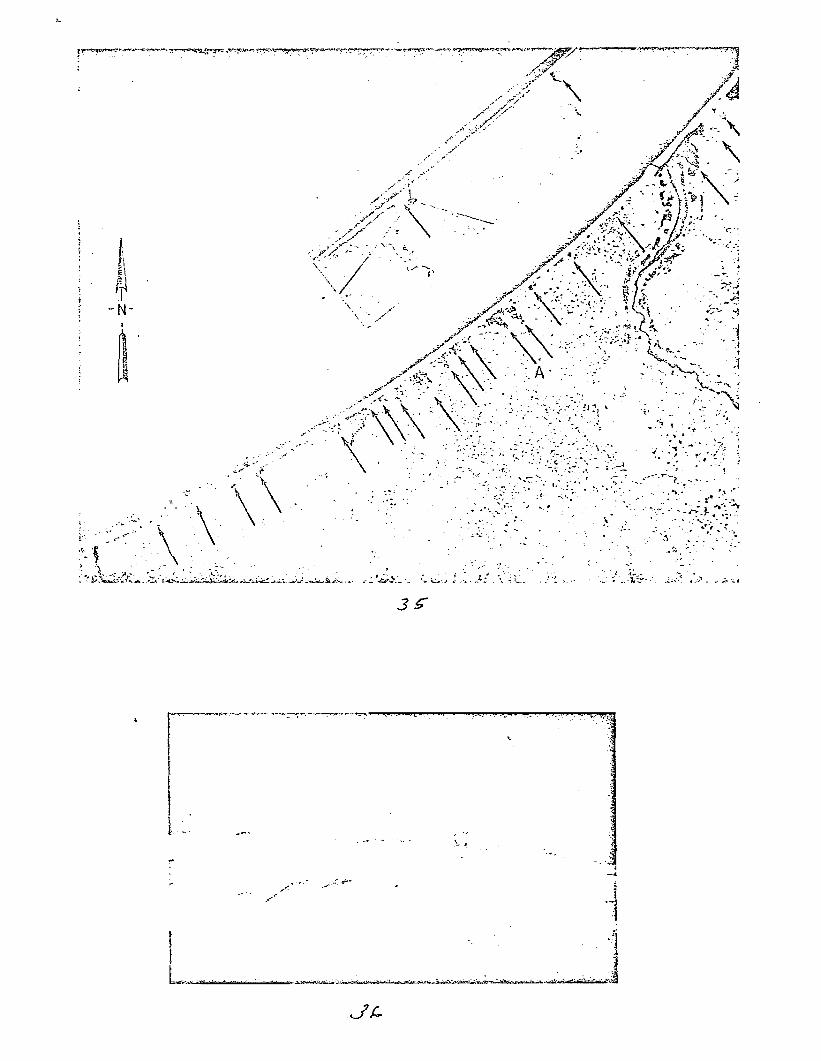
The ages of these ice-scarred features are unknown. A July 1950 view
of the coastline (Fig. 35) shows the features existed at that time, and ice
ride-up had intermittently scarred the tundra along a 2.9-km section of the3
coast. A 194~ image of this coastline revealed the same scars. The
features are therefore over 35 years old. We estimate from 1950 and 1981ty
aerial photos that the shoreline is receding at 0.35 m per year, or = ~ m
since 194~. The ice-push berms we measured were therefore farther from the3
water in 194~ than they are today.
It is interesting to speculate whether these scars were formed at the
time of the 2 July 1914 Camden Bay ice ride-up event described by F.
Johansen in his daily log. “First some ice was screwed up close to the
beach here and there; then came an immense and continuous pressing of the
ice from far offshore onto the beach. Like the movement of a glacier the
whole body of sea ice moved eastward; without regard for shallow water the
1 0

coastal ice was pressed up on the beach and during this slow but continuous
movementi the ice ploughed down into the sand where this was the beach
material. (h the coast of tundra-bluffs the ice first shoved away the
boulder gravel wall in front, tearing it up, going over it and raising
often immense boulders and driftwood trunks on its ‘back’ after which it “
ploughed into the tundra-bluffs and overlapped these. The movement of the.
ice lasted for almost an hour. Some parts of the higher tundra-bluffs had
their seaward side covered by the coastal ice stretching to the upper
margin of these and immense blocks of ice, boulders or tree trunks from the
beach were raised and pushed still further in
of a report by O’Neill (1924), several photos
ride-up with ice-pushed tundra soil, boulders
on the tundra.’” At the end
appear which show an ice
and driftwood before it.
This event apparently occurred in Camden Bay in 1914 when Johansen reported
his observations. If the tundra ice scars were formed at this time and the
shoreline erosion averaged 0.35 m per year, then the ice-pushed tundra
berms would have
in 1914.
The pond at
been about 23 m further inland or some 150 m from the sea
arrow A in Figure 35 is in the ice scar shown in Figure
2 9 a . It is interesting that this feature appears on maps as a pond (Anon.,
1976). This inay be the only pond ever shown on a map which was formed as a
result of an ice ride-up. We have named this feature Ice Scar Pond in
Figure 8.
Continuing along the coast in April 1981, we observed fall ice ride-
ups to 20 m inland at numerous
east side of Camden Bay and at
locations between positions 14 and 3 on the
positions 7 and 15 east of Barter Island
11

,+
(Fig. 8). No significant onshore ice movements were noted from position 15
on to the U.S.-Canadian border. However, in early September we overflew
the Icy Reef barrier islands northwest of Demarcation Bay and noted that
the islands had many ice-push gravel ridges and were highly gouged and
pitted over their entire surface (Fig. 36), indicating that sea ice
frequently invades these islands.
Winter 1981-82 Observations ,
In early April 1982 Che
border was again overflown.
and on Sanigaruak and Igalik
coastline from Pt. Barrow to the U.S.-Canadian
On an island just southeast of Martin Island
Islands large shore ice pile-ups existed (see
positions 12, 13 and 2 respectively in Figure 6). An aerial and ground
view of the ice pile-ups at positions 12 and 2 are shown in Figures 37 and
38 respectively. We made numerous measurements
the 0.55-m-thick ice blocks in the ridges. The
45° and avot-ged 37”. This angle may represent
friction of the sea ice rubble. Offshore water
of the angles of repose of
angles varied from 30° to
the angle of internal
depth measurements were
also made and these indicated a relatively shallow seabed slope of 3°. The
highest ridges we measured at positions 12 and 2 were 11.4 m and 11.9 m,
respectively. Portions of the shore ice pile-ups extended up-to 25 m
inland.
West
thick ice
This
of Lonely at position 14 in Figure 6, a small quantity of l/2-m-
had ridden up onto the edge of the 2-m-high coastal bluff.
year again we observed l/2-m-Ehick fall ice piled Up on the 2-m-
high bluff at Ksook. The ice piled up to 3 m high on the bluff and moved
up to 6 m inland (Fig. 39).
..—. . . . . . .._.
,’
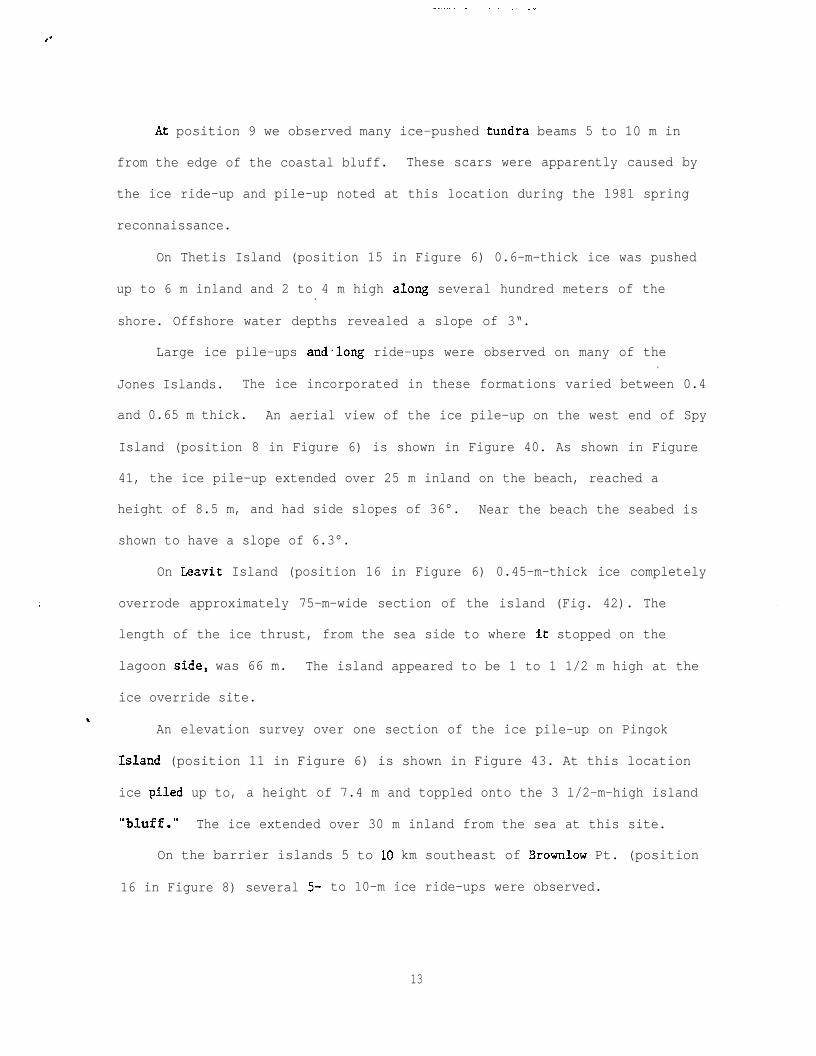
At position 9 we observed many ice-pushed Eundra beams 5 to 10 m in
from the edge of the coastal bluff. These scars were apparently caused by
the ice ride-up and pile-up noted at this location during the 1981 spring
reconnaissance.
On Thetis Island (position 15 in Figure 6) 0.6-m-thick ice was pushed
up to 6 m inland and 2 to 4 m high along several hundred meters of the.
shore. Offshore water depths revealed a slope of 3“.
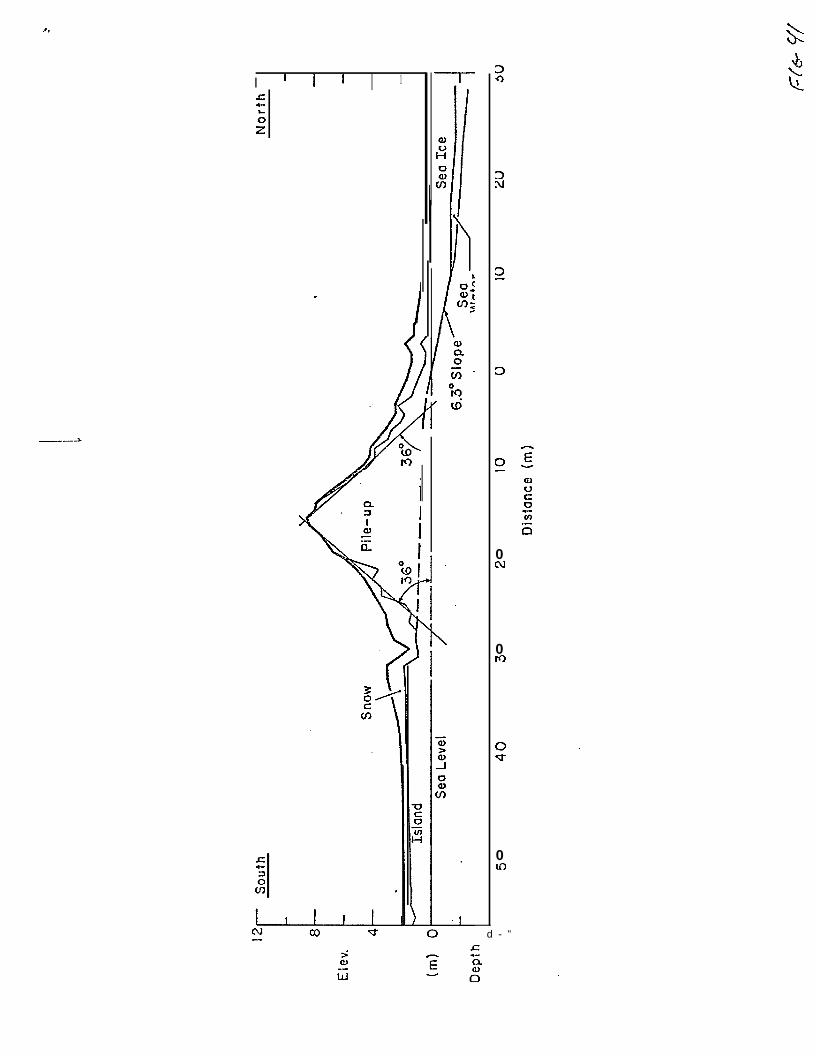
Large ice pile-ups and”long ride-ups were observed on many of the.
Jones Islands. The ice incorporated in these formations varied between 0.4
and 0.65 m thick. An aerial view of the ice pile-up on the west end of Spy
Island (position 8 in Figure 6) is shown in Figure 40. As shown in Figure
41, the ice pile-up extended over 25 m inland on the beach, reached a
height of 8.5 m, and had side slopes of 36°. Near the beach the seabed is
shown to have a slope of 6.3°.
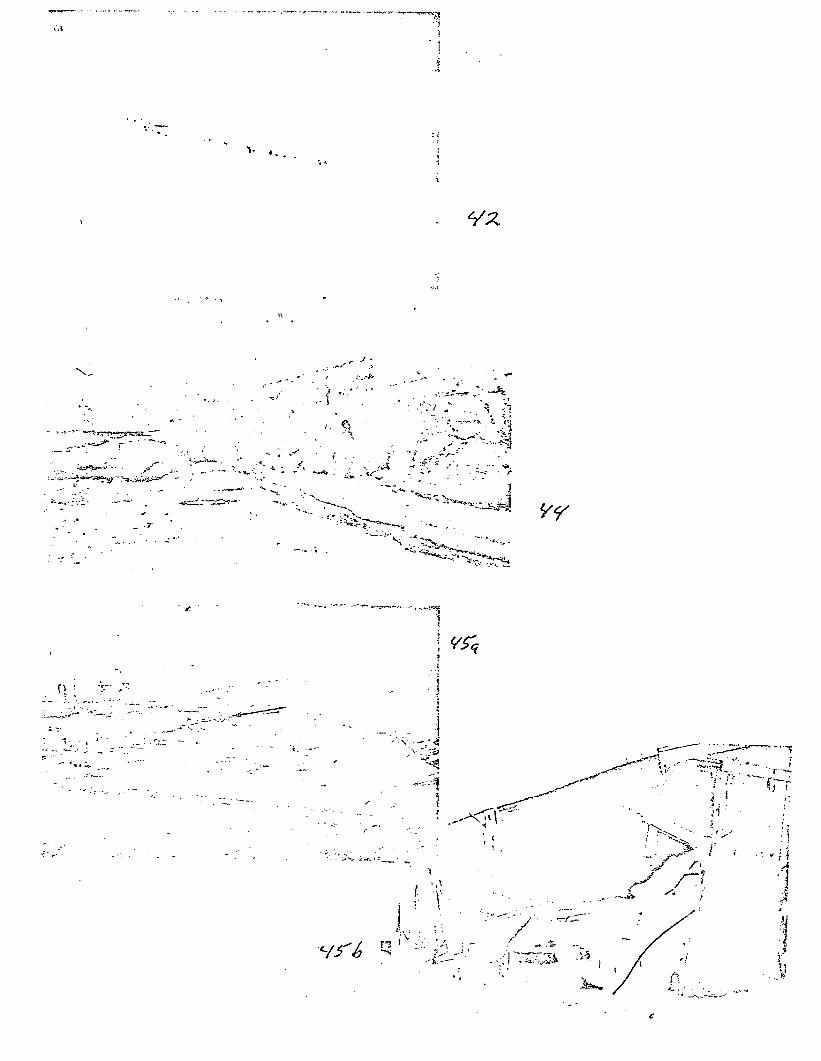
On Leavit Island (position 16 in Figure 6) 0.45-m-thick ice completely
overrode approximately 75-m-wide section of the island (Fig. 42). The
length of the ice thrust, from the sea side to where it stopped on the
lagoon side$ was 66 m. The island appeared to be 1 to 1 1/2 m high at the
ice override site.
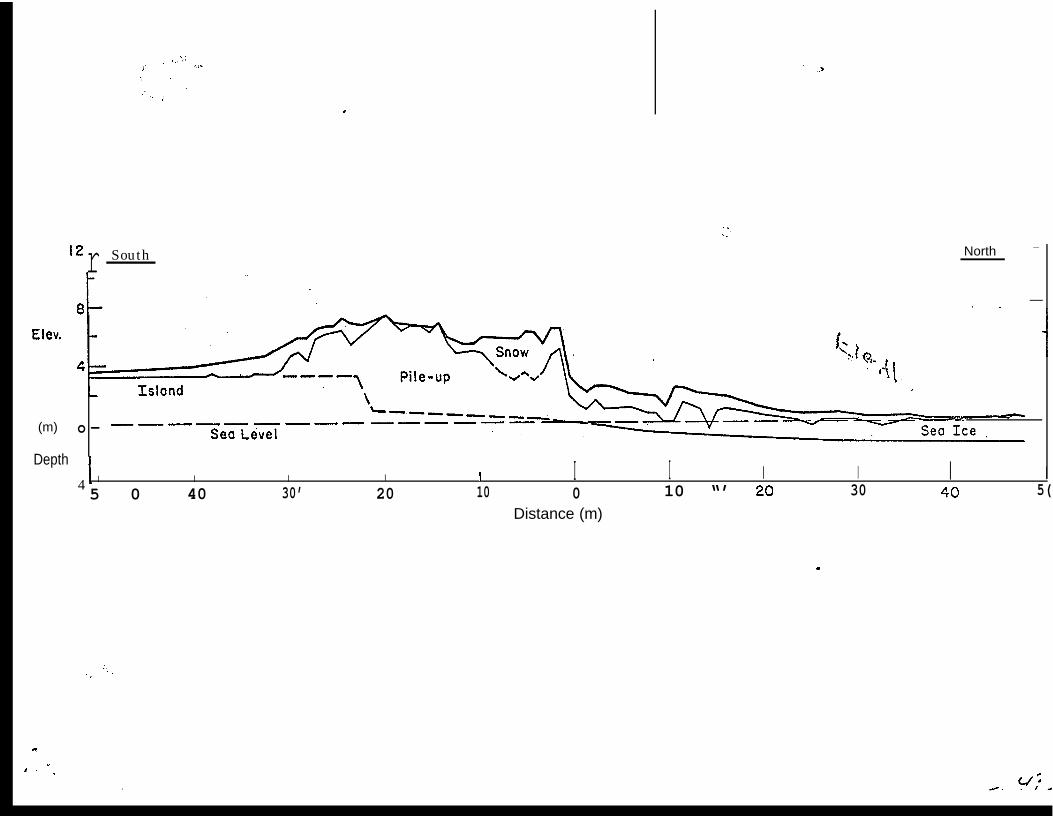
*An elevation survey over one section of the ice pile-up on Pingok
Island (position 11 in Figure 6) is shown in Figure 43. At this location
ice piled up to, a height of 7.4 m and toppled onto the 3 l/2-m-high island
‘“bluff.” The ice extended over 30 m inland from the sea at this site.
On the barrier islands 5 to 10 km southeast of Brownlow Pt. (position
16 in Figure 8) several 5- to 10-m ice ride-ups were observed.
13

. .
On Konganevik Pt. (positiori 17 in Figure 8) an old ice scar was
observed on the tundra. This feature was estimated to end 6 m from the
sea.
At position 18 in Figure 8, a 26-m-long old ice scar was measured.
The scar ended several meters up the side of the steep coastal bluff.
On the barrier island at position 19 in Figure 8, dirt-laden ice was
observed pushed in piles tip to 6 m high and up to 7 m inland on the shore.
The dirt was carried ashore by ice which had gouged up offshore sediment.
Ice scars extending 5 to 10 m inland were noted at position 4 in
Figure 8. These features are probably related to the ice pile-ups observed
on this island in the spring of 1980.
Again, we observed no significant onshore ice movement between Barter
Island and Clarence Lagoon about 10 km inside the Canadian border. Never-
theless, a Stefansson photo shows that thick spring ice can be thrust
ashore along this coastline (Fig. 44).
Information on ice pile-up and ride-up was also obtained from discuss-
ions with several natives in Kaktovik, Barter Island. Archie Brewer and
Tommy O. Gorden mentioned that in the spring of 1953 or ’54 ice piled
against the steep (700-f-) bluff at Barter Island. Some ice blocks were
pushed onto the edge of the bluff, which they estimated was 7 m above the
sea.
Alfred Linn, Sr. mentioned that in October or September 1964 ice was
.
pushed inland on the spit leading to the Barter Island airstrip. The ice
rode up the beach and over the road, stopping within a few meters of the
telephone poles located along the south side of the spit. In 1982 che
distance from the sea to the poles was measured to be = 75 m. The ice

,+
ride-up may therefore have thrust inland some 70 m during the 1964 event.
Gorden also mentioned that he had lived in the area of Demarcation Bay
many years ago and on a number of occasions had seen ice pile-ups over 20 m
high on Icy Reef, the barrier islands which extend northwest of Demarcation
Bay. In our two spring reconnaissances along this coast we observed no .
significant ice pile-ups or ride-ups. Two years of observation is clearly
not sufficient to document’ the recurrence interval or severi~y of such
events.
It was also of interest to hear from several Kaktovik villagers that
they believed sea ice conditions today are not as “severe” as existed say
20 years ago. We have heard similar views from natives living in the
Norton Sound area.
At the abandoned Bullen Point DEW Line Station, on the mainland south-
west of the Maguire Islands (position 20 in Figure 8), we inspected a
garage which had been damaged by shore ice ride-up and pile-up. During the
1973-74 winter, Walter Audi of Kaktovik, Barter Island (pers. comm.),
observed ice that had moved inland and piled up on top of the 4 to 5 m-high
garage roof. The 30-m-thick ice, which moved from the west-northwest,
caved in and entered portions of the steel-framed building shown in Figure
45. We found
tion of about
occurred in a.
this building to be located 25 m from the water at an eleva-
5-6 m. The interesting aspect of this event is that it
relatively sheltered location which is not
barrier islands but also protected in part by the 13ullen
Niel (Spar!cy) Bogert provided information on an ice
reached 6 m high on the Prudhoe Bay west dock causeway.
only inside the
Point spit.
pile-up which
The event occurred
15

in July 1979. The ice blocks in the pile-up were over 1 m thick. Some
sections of the causeway were also overridden. The ice was reported to be
easily removed from the surface by bulldozers.
Old Ice Ride-Up Features
Most of the old ice-push tundra scars on the east side of Camden Bay.
were clearly visible during our winter reconnaissance flights. Other ice.
scar features were difficult to detect or were not observed because of
drift snow obscuration. This led to an analysis of in-house summer aerial.
photography of the Cape Simpson to Cape Halkett coastline to determine if
old shore ice ride-up scars could be observed. While this analysis was
limited by the airphoto coverage available, numerous sites were observed
where sea ice thrust features existed over 5 m from the sea.
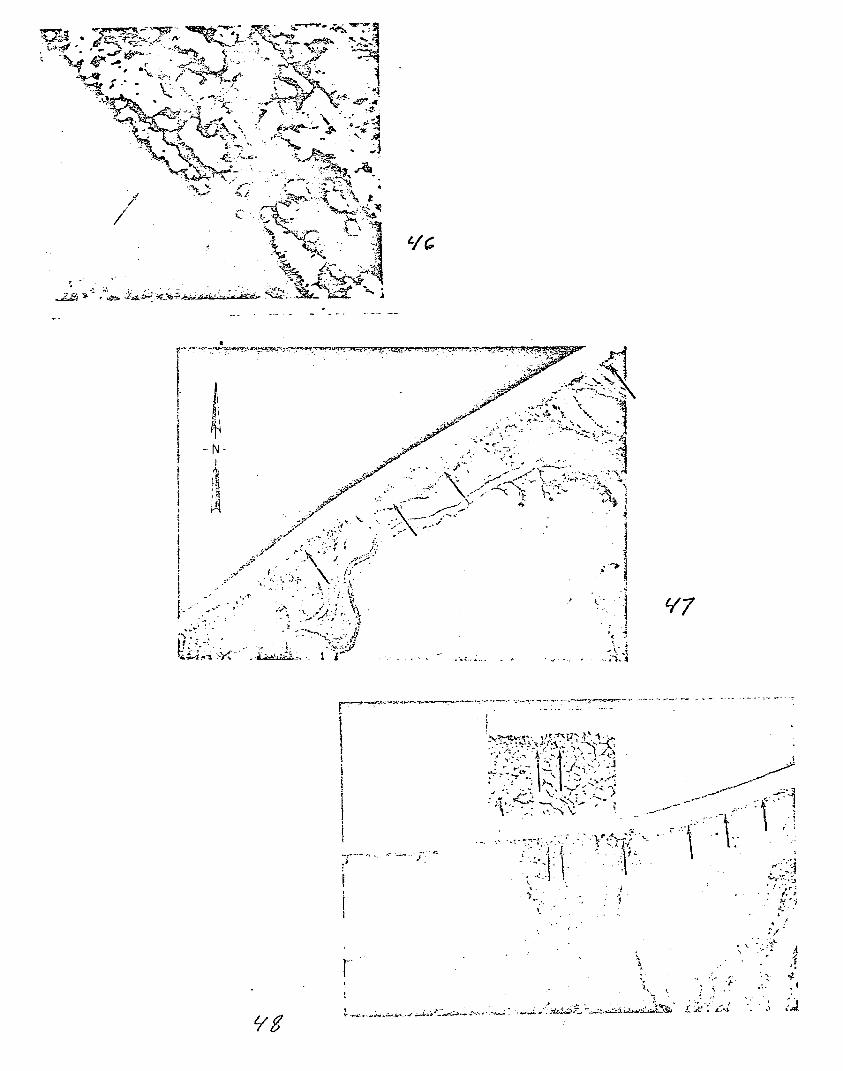
In a 1949 photo of the coast northwest of Cape Simpson, near position
4 in Figure 6, a 200-m-wide ice ride-up scar existed (Fig. 46). The
farthest inland portion of the ice thrust scar was 60 m.
Other 1949 aerial
between Point Drew and
imagery revealed the following for the coastline
Cape Halkett shown in Figure 6. West of Lonely at
position 14 a l-km-long section of the beach and back
ride-up scars. Most extended over 50 m from the sea,
100 m inland (Fig. 47)..
shore contained ice
but some were nearly
Along the coast at Pitt Pt. several old ice scars existed that extend-
ed from the beach up onto the tundra bluff (see insert in Fig. 48). The
longest scar extended some 70 m inland from the sea. Along the low-lying
beach to the east of these scars many ice thrlist beach striations existed
which terminated up to 100 m inland at an ice-pushed gravel ridge (Fig.
48) .
16

Several kilometers further east .was
the sea’ up on a tundra bluff.
Four kilouieters west of Ksook was a
another scar which ended 60 m from
l-km-long section of coast where
continuous ice ride-up striation scars existed. This ice thrust feature
extended up to 65 m inland from the sea but was more typically 30 to 40 m
inland (Fig.
Coastal
features but
49) .
.erosion since 1949 has removed most of these ice thrust
newer ones can be observed on recent aerial imagery. For
example, in a 1978 aerial photo of Pitt point, ice-pushed gravel ridges can
be observed which extended along much of the coast. These features, shown
in Figure 50, are typically 45 to 50 m in from the sea, but on occasion
extend 10 to 20 m further inland.
Discussion
The data assembled in this report and by Kovacs and Sodhi (1980) and
Harper and Owens (1981) show that sea ice along the shores of the Beaufort
Sea has thrust inland significant distances, both over gentle, sloping
terrain and up onto steep coastal bluffs. We have shown that shore ice
ride-up is a destructive phenomenon in that it can push aside and doze up
beach and tundra material as well as damage coastal facilities. Shore ice
ride-ups and pile-ups to 20 m inland from the
frequent events along the Beaufort Sea coast.
are not very frequent, and 100-m penetrations
sea appear to be relatively
Inland ice thrusts of 50 m
are relatively infrequent but
do occur. However, the data base on shore ice ride-up and pile-up remains
inadequate for drawing conclusions on the frequexicy or severity of these
events for specific coastal sites. In short, these phenomena occur under
17

poorly defined and unpredictable conditions along most of the Beaufort Sea
coast. The data suggest that shore ice ride-up and pile-up is more fre-
quent west of Narwhal Island. However, this may be due to the fact that
fewer aerial photo$ and reconnaissance missions have been flown to the east
of Narwhal Island.
The findings of this brief study are that ice ride-up leaves scars and .
soil berms on the coast which can remain visible for many decades. Old ice.
scars and ice-push soil berms revealed inland ice movements over 130 m
long. Some of these features were found to be over 30 years old, as
revealed by aerial photography. Many other ice features were found to
have been removed ok modified by coastal erosion and storm wave processes.
In the few years of this study , we have observed ice override of Point
Drew spit and Spy and Leavit Islands and (%llinson Point and reported on an
override of the Prudhoe Bay west dock causway. Previously ice override of
several small islands southeast of Narwhal Island and of Janet”te and
Tapkaluk Islands was reported (Kovacs and Sodhi, 1980). These events are
significant, but more important is the fact that they and many of the ice
ride-ups reported in this study extended over 50 m inland, both on Iowlying
and steep sloping terrain. The 50-m and longer ice ride-ups take on
special importance when one considers that many of the exploratory manmade
islands being built off the Arctic coast today are on the order of 100 m in
diameter. It is clear that in the design of these islands, ice ride-up
defense must be considered. This has not been overlooked by industry which
is actively evaluating the problem in terms of island elevation, beach
slope configuration, onshore and offshore defensive structures, and ice
weakening concepts. HOW effective these efforts will be, however, remains
to be determined under long-term field evaluation.
t

,.
To better understand the potential hazard of shore ice ride-up and
pile-up to coastal development, we need to know the frequency, magnitude
and inland.limits reached by these events. Further reconnaissance flights
coupled with on-site observations and surveys are vital to achieving this
understanding.
19

Acknowledgments
This study was funded in part by the U.S. Bureau of Land Management
through the National Oceanographic and Atmospheric Administrationfs Alaska
Outer Continental Shelf Environmental
Resources.
The author wishes to acknowledge
Richard J. tiberts, Cynthia A. Royal,.
Denberg, the help of Robert Frost who
old aerial photography, the sustained
Assessment Program and by Gulf Canada
the field assistance of Roy Dehart,
Betty A. Kovacs md Garry Van
provided information on and copies of
interest in the report topic and
support of Dr. Brian D. Wright and the helpful review comments of Walter
B. Tucker.
20
References
Alestalo, J. and J. l%likid (1979) Forms created by thermal movement of lakeice in Finland in winter 1972-73, Fennia, 157: 2, p. 51-92.
Anon (1976) Camden Bay and approaches, U.S. Department of Commerce,National Oceanic and Atmospheric Administration, Map no. 16044.
Harper, J.R. and E.H. Owens (1981) Analysis of ice override potential alongthe Beaufort Sea” coast of Alaska, 6th Int. Conf. on Port and Ocean “Engineering under Arctic Conditions, Laval University, Quebec, Canada,Vol. 11 and 111. ,
Hartz, R.W. (1978) Erosional hazards map of the arctic coast of theNational Petroleum Reserve - Alaska, U.S. Geological Survey Open-FileReport 78-406.
Kovacs, A. and B.A. Kovacs (1982) Some recent shore ice pile-up and ride-upobservations along the Alaska arctic coast, USACRREL Technical Note(unpublished).
Kovacs, A. and D.S. Sodhi (1980) Shore ice pile-up and ride-up: Field- observations, theoretical analyses, Cold Regions Science and
Technology, Vol. 2.
Kovacs, A., D.S. Sodhi and G.F.N. Cox (1982) Sea ice environment aroundFairway Rock, Bering Strait, Alaska, U.S. Army Cold Regions Researchand Engineering Laboratory, CRREL Report.
Lewellen, R. (1977) A study of Beaufort Sea coastal erosion, northernAlaska, NOAA/BLM Environmental Assessment of the Alaska ContinentalShelf, Annual Reports of Principal Investigators for the year endingMarch 1977, Vol. XV, Transport.
O’Neill, J.J. (1924) Report of the Canadian Arctic Expedition 1913-1918,Vol. XI Geology and Geography, ‘Part A. The Geology of the ArcticCoast of Canada West of Kirt Peninsula, Southern Party 1913-16, (Ed.)F.A. Acland, Ottawa, Canada.
Stefansson, V. (1969) The friendly Arctic, The Story of Five Years in PolarRegions, Greenwood Press~ N.Y.
Vaudrey, K.D. and R.E. Potter (1981) Ice defense for natural barrierislands during freeze-ups 6th Int. Conf. on Port and Ocean Engineeringunder Arctic Conditions, Laval University, Quebec, Canada, Vol. I.

Illustrations
Figure 1. Ice thrust shore morphology (modified from A1.estalo and H21ikid,1979) .
Figure 2. Thick accu&lations of mud on sea ice, Brownlow Point, Alaska.
Figure 3. Rocks found on small multi-year ice floe = 30 km northeast ofCross Island, Alaska. Believed source is rock slide off steep mountainslopes, Yelverton Bay, Ellesmere Island, Canada.
Figure 4. Eleven-meter-high spring shore ice pile-up (StefanssonCollection, Baker Library, Dartmouth College).
Figure 5. Spring ice ride-up on gravel beach (Stefansson collection,Baker Library, Dartmouth College).
Figure 6. Western Alaska Beaufort Sea coast area map.
Figure 7. Shore ice pile-up west of Cape Halkett. Note the very dirty iceblocks which indicate ice found in very turbid water.
Figure 8. Eastern Alaska Beaufort Sea coast area map.
Figure 9. Ice pile-up and ride-up on the west side of Arey Island west ofBarter Island. Arrow points to ice thrust features.
Figure 10. Ice-pushed silt and peat pile. White area in front of observeris sea ice. Arrow points to driftwood incorporated in the pile.
Figure 11. Slabs of peat displaced by Ice ride-up.
Figure 12. Ice pile-up on beach near Lonely DEW Line Station. Note ice-pushed gravel. (Photo courtesy F. Crory.)
Figure 13. Ice-push gravel ridge and pothole beach relief remaining aftershore ice pile-up melted away.
Figure 14. Arrows mark old ice-scarred tundra relief near Lonely DEW ILneStation.
Figure 15. Ice-pushed tundra berms in upper and lower photos are of thefeatures marked by the bottom and middle arrow respectively in Figure 14.
Figure 16. Aerial photo of ice-pushed tundra scars shown in Figure 14.The arrows parallel to the coast give limits of other ice-scarred terrainnot easily detected in 1981 due to shoreline road construction and currentmodification processes.
Figur”e 17. Shore ice pile-up at ?@ook.
22
Figure 18. View of 2-meter high coastal bluff showing 0.25-m-thick tundramat and underlying massive ice and ice-rich silt. The latter is easilyundercut and eroded by the seawater.
Figure 19. Ice-pushed peat piles oh the coast near Ksook. Note thegeneral size and stacking configuration of the displaced peat slabs. Arrowin upper photo “indicates pile shown in lower photo.
Figure 20. Ice-pushed peat on coast west of Ksook.behind helicopter and the coastal bluff in the upper
Figure 21. Offshore and -beach profile across one ofnear Ksook.
Note the ‘Ksook houseleft of photo a. “
the ice-pushed piles
Figure 22. Aerial view of the coast at Ksook in 1949 with insert at bottomshowing the coast outline in 1981. Near vertical arrows point to samehouse.
Figure 23. Rafted sea ice off Long Island.
Figure 24. Surface view of ridges shown in Figure 23.
Figure 25. Ice-push beach morphology along coast east of Collinson Point.
Figure 26. Ice-push beach striations and gravel piles along the shore eastof Collinson Point.
Figure 27. Seabed-beach profile along line drawn in Figure 25.
Figure 28. Typical winter view of ice-scarred tundra relief.
Figure 29. Summer view of ice-scarred tundra features shown in Figure 28.
Figure 30. Aerial view of ice-scarred coast.
Figure 31. Old ice-pushed tundra berms and ice-pushed gravel piles on thebeach which were the result of the previous winter ice ride-up.
Figure 32. Beach views of ice-scarred tundra. Views a and b show interiorof features B and C respectively in Figure 29.
Figure 33. Ice-pushed tundra berm behind person in Figure 32b as seen fromlandward side.
.
Figure 34. Seabed-beach-tundra profiles.
Figure 35. Ice-scarred tundra features along southeast side of CamdenBay. Insert is 1947 imagery showing the northern continuation of the coastbeyond the arrow-in the upper right-hand corner of the larger photo.Arrows point to many of thepoints to the terrain shown
major ice scars. The arrow at-the-bottom leftin Figure 31.
23

Figure 36. Typical ice-scarred relief observed on Icy Reef.
Figure 37. Ice pile-up on small island southeast of Martin Island.
Figure 38. Ice pile-up on Igalik Island.
Figure 39. Aerial and ground views of ice pile-up at Ksook in 1982.
Figure 40. Ice pile-up along entire length of Spy Island.
Figure 41. Cross section of Spy Island ice pile-up.
Figure 42. Ice override-on Leavit Island.
Figure 43. Cross section of Pingok Island ice pile-up.
Figure 44. Ice ride-up on the beach at Clarence Lagoon (StefanssonCollection, Baker Library, Dartmouth College).
Figure 45. Bullen Point DEW Line Station. Arrow points to garage damagedby ice and also indicates the direction of onshore ice movement.
Figure 46. Ice ride-up scar on coast northwest of Cape’
Figure 47. Ice ride-up scars on coasc west of Lonely.
Simpson.
Figure 48. Ice ride-up scars on tundra bluff (insert and two arrows onleft) and ice-push gravel piles on low–lying coast (three arrows on right).
Figure 49. Arrows point to coastline highly scarred by ice ride-up.
Figure 50. Recent ice-push gravel ridge formations along Pitt Point.
24

—
.
—
——DE P,OSITI.ON EKU>IUN
3
-1
in
xIdJCL
5u
ti
.a‘ile, Mound 2Ridge$or Hummock
.
Aontel or Slob. . .. ”,... b., .,.; . .
[cc-push Terrace c
.,.
Boulder Rampart or Barricade and Pavementd
1\ ice-smoothed povemcntI\
t
*-1 ~
furrow of ice-push boulder -
\#~4 .“--. ‘\
- - - - ‘o ==4?::,. , Jho’’ow. ‘yzsh ‘“”’”: , ~. . . . . . . 1.. - . ice I1.=-.
F o l d .trough of ice-push slob
. .
&.l . . ..’L.o. , , ice ‘v . =
Buckle f
!,, ,-, ;
-... _ _ _ _ _ _
Fold Series 9
v
Wedge h
‘xx .“ . ~
.. .,..; . . . . . . . . . . . . .\\\ ‘.\ - . . . trough of ice-push slob
< . . . . . . ,/‘ . ’ . _ straoe‘.- .—. . . .. . . . . . .- - - - - - - #?::;”:--T;-. *-- ,—
--_-_—_..=-= _ _ _ ” “’l Ice I ———.-- l.-— .. —-—-~..__
— thrust direction I ~~~~~~~~~-_-_.Lz--”- I -‘- - bed ‘“rf”ce -
,rb41aal surface ltnol surtoceJ .-__..


,.
~w .
--k,... . . ’
—— .—,. ~ — -- . ...-.__ ___ . ..__-— . .. ____ ._ . ______ _
L_k”. :
.
. .
.-. =s---
5- 5..
,.,, -. *.
.
.
. .3
F=- “ “ --- f:..’ .+. 1
3
\!’> . .
z-J ~. I -J
I -. , .,
____-L—.—~—--- ___ -.
pxx)-~-.
.:-. . . . . . . . . . . . . . . . “-’# -,m-. .< - - - -
-.
---->F . . . . . . .
?-~f--- , --’-- ,---- ..-:-d> .
7.
.-%. .
.- .-. .
. . .. w
r. . . ..i!
.“.
,“
“;
i.
744
.
\
.
...
1

,
- -.. ,-.., .
.— -.. .-. . . . . . ._---- ---
. . . . .-.. . . -- . . . . - . . -. . . . ----
.

. . . . . =+-. . .. . ---
V-”-=--”’”---—=—--”--’-”” ‘ ‘ - - - - - - ‘. . .< - ..>m; c ... ,., .,. > ,.:. . .
>.. ”.
.-,. --- -
i.- .. . . . . . . . . . . . . . . . . . . . . ..-’&”4.~
,.. . .. --.—- ------ .-~s-. ~m --.-Y%yT=”-7-. -- . . . ..-.
.-.:!
d-.. .. . .~. ..-.: - -:. > ..; .:d=.-.:.: .-- ,”.., ..—- . . . . .
“.. .. . . . .. . .. . . . *,- “~
-e+
. . /
,, ,.
.. .
., .;.
. .

● ✎ ✌
2.
-.-< . . .. . \ . .
[;---.- —w.,,. .
.- w . . ...’>.. . . . .~’., ;; “,-” -“”’<-
a ..- ---f
. .‘k .,, =&r.
\;. ~-: -
“’/’ ‘-’,. ‘“k” 1 ‘\. -
.. ..“:
. +.-.\,
.<.%y~ “; ..- .-.
. ..-..” .-- --~ 1,.—--- 8. .. .,.
!.”- “%. ... . :2 k& .:% ,, -
-_ ._.
i-.) ‘>
. . .-=L. .

-Y-- . ..x. w<— - ..- . . . .,.+’ ‘“-- --- ““--------i
.. . . . :..
.<.-----
.’
I.,:, ...
-.!
. . . .—.--=J .
/6-
/J---
;- . . . . . - . . ... . . . . ,. . . ,-
====— +=-.
? “- Af’-’-. . . . ,,. =“.. -! , “- +~ \
. ..
-. :-- --:4..<. .“. .7— —
. .
.,
j.i--...-*;-:. .. .. . . . .4--$. . 5
17 ,,”.
7j
..,.
-2 +&===—— 4.“ -J
-., . . . — s--- —i=A .-. .-. . .,------- ..-.’>— -. .,- ,.
‘i‘-”
.—
I

●
✎✌
~! “- “ ’- ‘ “:~~;+y?~ :::$~:,d~.k. . . ..+ ./a.
e..P--” .
,-d~.-=- - > .. .. . . . .- . . . . -.
., “-.’. ,. ...” . .. . . .. . . . -,, ;..,, . . . . “.:.. ‘.. -’-’ .. . .
.. . -.
.
. :.
a.~oa “
---T---
i1I
iII1II
.+_
mii
-=..-.-.—-.—. .—.
. ..7-.- . . .A. =,.. ,q
!1Y
23
A
---—--—
.-,.-- “- _,,- .-= . --
. _J. ..s. . . . . -----A. _ :- -—-=-.-— ..-
—-.-, ----- >.- 4. .--- -=a’. ----- . . -+ .=.
.-. . . . .. . ---- -f@-=;-. - . -----------.- - --------.- . . —.. -. = --- --- -
-S&- , ‘--
. . ... .+.4 - ---- _
. . .
-.&#-*-_-- - - -
. _z-.- . . %-- \ :-. ,.- 4. ‘1 ‘ . _ _ _ _ - -L,:,~ _ - - “’”---+
Zy

,.
‘y\-
-..
-# ,.:
.>.. -.
.-
. .
.
.26
I I I
IIII1II11
II
IIII1Ii
I
I
;.
in.-0
27
t. . . ---- ‘“- -..- ,- .“% . . . . . .;. .
--, . . . . . .. . 3.= ...’-- ...~”.”” ---;,
- +-.. -- . . . . - .L- ~--.: - 2 .’. . . . %?4
,,. . ------ .- . .. . . . . .
-,--
.“.j.,.4
* ; y-b -- ,.< .:..-. -- ..,_.=.. -. .. . ,. q-..\– f--IH..~- 9
8. . 7- --- . . . . .
-—<%. ~,---- ..: -. . : ..- - --- .. . .+
e. . . . ‘. -— .-G. .-
,., ., . --- ~-=
I.. . . . . - -=. ---
-~ -..-a-. -. ‘ ‘-:?j.-. . -----------
t
1..
3/’

,.,. .
.
\‘,
. .
. . -.
.-
i
j,,’
,,.$
{‘“l,,Ji-

‘.
Elev.
(m)
Depth
E Iev.
(m)
Depth
Elev.
(m)
Depth
5
0
5
. . “-” -’e”~’’--” ’w
!..’ .,’
.
West E a s t
1 I I I I I I I I I I 1 I I 1 I I I
10° SlopeNatural Tundra PROFILE A
Sea Level_—— ——— ..— —— ———— ———. ——. — ——. — ———— ———— ———— ———— ———— ———. -.
I I I I I I I I
5 I I 1 I I I I i I I I i I I I I I Ig
10” Slope#
Tundra Berm
o “——— ———— —— ———— ———— ———— .—— — .—— — ———— -.—— ———— ———— ———— —
5 1 1 I I I 1 I 1 I I 1 1 I I I I 1 I.
5 I I I I I I I I I I I I I I 1 1
8,1~Slope Disturbed Tundra ~
Ice-pushed
o – ———. ——. — ——— ——— ——— ——— ——— —-— ——— .—— ——— —.— ——. IurultaBefm. –
5~ 1 I I 1 I I I I I I 1 . 1 I I I I I I
40 20 0 2 0 4 0 60 ao . 100, 120 1 4 0
Distance (m) . .
,-+~-, ..>; .- ..-.
. . . . .----.“. -”
. .
\ .)’
-. +. . .
“.- ,
r. —,..~-.-e.- -.--:—7.,-...—=-.—.——
1
. . . ..-.-’... -..
N
.-a
J
j
.-
.JL
,, .
.. _&.. .-
.
. . . ...+=.* - ~.. . -:
--.: ~~=. \ --’*% .. :.-’
. t
*---... ,
. .I--
.
----
-.
,“.
J24L
. .
. . . . .. . . ..b .-
.- .,.
3$/J
/
#
I1
‘j..
i
. .
,-. ..:-
.“--w -,.’ ‘.4 .?. .
.“’>, . . . -
. . .
. . . . ..3
. . . . .
-- .,,- $* .,,---- ..-
====-- pz&---
.,. .,. :-. -. .*. - . .. ..”
. . . . . . .# ,k -
“!. ,. .,.-. ‘, . . . . ., ,... . . . .. . . . , i. --.,,..: ’-- ---
:,. .*. . . . .’. -,. . ...”e.
-... .
,.. “,.. -”’.. .2
.
. .’ .,
.;’ j.. ..-+.? ~.< i,“--. ?, <
-.> :-- .,,“. -t<.4 “.. . . ‘.3, -. 9
4 . . . . . - ~. . . . . .

J-,
. .
. . . .. --i
L+!=+---- - - . . . -.’. -— ----
.i
3 f%
*
,.“’je.
..;
‘%9
.?.
I I i I I 1z4-L
z
.
3xl
.
u)vc0z.-(3
0N
0m
0In
d - ”
“... .. . .j“ y
,, ..,,,.
... .’,
Elev.
(m)
Depth
12r South North —
—,.
o —---—’—— -.—
——— . .——. .——— .—— ~
Seo Lcivel
4 I I I I I I I I I I5 0 40 30’ 20 10 0 10 “’ 20 30 40 5(
.’,.,, .
Distance (m)
.
..!.
u;
. . . ~- —. . ...-
\. ~ -.. .. .
>
‘: -.-., .
. . “ ..
. . . . .J? --, --- --.-- z-.r. m.-,..... . ----3
“~
#-.. . ---- --- -------
‘-(s
-., . .,-%,, “.,”