Recent Enrollment Trends in Degree-Granting - ERIC · TITLE Recent Enrollment Trends in...
67
TITLE Recent Enrollment Trends in Degree-Granting Institutions in New York State. Perspectives for Planning. INSTITUTION New York State Education Dept., Albany. Office of Postsecondary Research, Information Systems, and Institutional Aid. PUB DATE Sep 76 NOTE 93p. AVAILABLE FROM state Education Department, Office of Postsecondary Research, information systems and Institutional Aid, 99 Washington Avenue, Albany, New York 12230 EDRS PRICE MF-$0.83 HC-$4.67 Plus Postage. DESCRIPTORS Community Colleges; Enrollment Rate; *Enrollment Trends; *Higher Education; High School Graduates; *Post Secondary Education; Residential Patterns; School Statistics; State Colleges; *State Surveys; State Universities; *Statistical Data; *Student Enrollment; Technical Institutes IDENTIFIERS *New York ABSTRACT Data presented were made available through the cooperative efforts of the State Education Department and the responding institutions, the principal data source being the_ computerized Postsecondary information System's DATACORE. This document demonstrates some of the system's capabilities in_displaying basic enrollment data. Three approaches are used here to display data, each provid1414,4,a,different perspective on enrollment patterns and trend's. Someof the general findings are as follows: total state enrollment reached an all-time high in 1975 of nearly one million students; both full-time and part-time undergraduate enrollments increased, but part-time enrollment grew more rapidly; full-time graduate enrollment increased slightly, while part-time enrollment decreased slightly; the State University and private sector enrollments increased at about the same rate, while City University enrollments decreased; private and state community colleges experienced substantial increase in both full-time and part-time undergraduate enrollments; private engineering technical colleges grew substantially in enrollments; and the proportion of New_York - State high school graduates going on to postsecondary education in the state has remained stable over the first half of this decade- The report also provides detailed data on individual institutions. (Author/LBH) Documents acqufred by ERIC include many inform0 unpublished materials not available from other sources. ERIC makes every effort to obtain the best copy available. Nevertheless, items of marginal reproducibility are often encountered and this affects the quality of the microfiche and hardcopy reproductions ERIC makes available via the ERIC Document Reproduction Service (EDRS). EDRS is not responsible for the qugity of the original document. Reproductions supplied by EDRS are the best that can be made from the original.
Transcript of Recent Enrollment Trends in Degree-Granting - ERIC · TITLE Recent Enrollment Trends in...
TITLE Recent Enrollment Trends in Degree-GrantingInstitutions in New York State. Perspectives forPlanning.
INSTITUTION New York State Education Dept., Albany. Office ofPostsecondary Research, Information Systems, andInstitutional Aid.
PUB DATE Sep 76NOTE 93p.AVAILABLE FROM state Education Department, Office of Postsecondary
Research, information systems and Institutional Aid,99 Washington Avenue, Albany, New York 12230
EDRS PRICE MF-$0.83 HC-$4.67 Plus Postage.DESCRIPTORS Community Colleges; Enrollment Rate; *Enrollment
Trends; *Higher Education; High School Graduates;*Post Secondary Education; Residential Patterns;School Statistics; State Colleges; *State Surveys;State Universities; *Statistical Data; *StudentEnrollment; Technical Institutes
IDENTIFIERS *New York
ABSTRACTData presented were made available through the
cooperative efforts of the State Education Department and theresponding institutions, the principal data source being the_computerized Postsecondary information System's DATACORE. Thisdocument demonstrates some of the system's capabilities in_displayingbasic enrollment data. Three approaches are used here to displaydata, each provid1414,4,a,different perspective on enrollment patternsand trend's. Someof the general findings are as follows: total stateenrollment reached an all-time high in 1975 of nearly one millionstudents; both full-time and part-time undergraduate enrollmentsincreased, but part-time enrollment grew more rapidly; full-timegraduate enrollment increased slightly, while part-time enrollmentdecreased slightly; the State University and private sectorenrollments increased at about the same rate, while City Universityenrollments decreased; private and state community collegesexperienced substantial increase in both full-time and part-timeundergraduate enrollments; private engineering technical collegesgrew substantially in enrollments; and the proportion of New_York
- State high school graduates going on to postsecondary education inthe state has remained stable over the first half of this decade- Thereport also provides detailed data on individual institutions.(Author/LBH)
Documents acqufred by ERIC include many inform0 unpublished materials not available from other sources. ERIC makes everyeffort to obtain the best copy available. Nevertheless, items of marginal reproducibility are often encountered and this affects thequality of the microfiche and hardcopy reproductions ERIC makes available via the ERIC Document Reproduction Service (EDRS).EDRS is not responsible for the qugity of the original document. Reproductions supplied by EDRS are the best that can be made fromthe original.
Recent Enrolhneht Trend
In Degree-Grantim InstitutionsIn New York State
a
rl ry !.1.5
'ocv
et, 00 e99gCG
ow-lomolz
<-0 20 c
,ECARUCh
-0NT_ CERAM Ics
SUM, Col
C6a6 BROOK1-1 5 UNY I ki:,
MAN u.
C01004 . 4 A" t:...LI
ari DOVIt'lV EVERS
-,22
11,AUtriEtt-2 5 .I4c5
2 iMiS.3 A 9 .2ezP
°: 6-'4 .31u...iu.
LEtitatAMEENS
I 6 .88,
I .111 Ci-PKOt3 .93
-In -76
THE UNIVERSITY oF THR STATE OF NEW YORK
THE STATE EDUCATION DEPARTMENTINI:WAANINEXON AVENUE
"--:-ALBAN';',- NEW YORK 12230
OFFIeE OF FDSTSEDONDARY,RESEARdH,INFORMATION SYSTEMStAND'INSTITUTIONAL AID
47/4-50113
RECENT ENROLLMENT TRENDo
IN DEGREEGRANTING INSTITUTIONS
IN NEW YORK oTATE
Perspectives for Planning
September 1976
The University of the State of New YorkTHE STATE EDUCATION DEPARTMENT
Office of Postsecondary Research, Information Systems, and Institutional Aid
Albany, New York 12230
3

TIE UNIVERSITY OF THE STATE OF NEW YORK
Regento of The Univornity (with y---s
1981 Theodore H. Black A.B. Li D. U. D. D. , D. C. L. , L. H. D.
Chancellor Sat de Point
1987 Carl H. Pfornheimer, J ., A.B., M.B.A., D.C.S., H.H.D.Vicu Chancellor.. . . . ....... ........ .. . . Purchase
1978 Alexander J. fillqn, Jr. LL.D., Litt.D. .... ....A Troy
1981 Joseph C. Indelicato, M.D., L.H.D. . . .... .. Brooklyn
1986 Kenneth B. Clark, A.B. Ph.D., LL.D. , L.H.D., D.Sc. Hastingson Hudson
1983 Harold E. Newcomb, B.A. ........ . . ............ ....... .4mOR! Oweg&-
1988 Willard A. Cenrich, LL.B., L.H.D., LL.D Buffalo
1982 Emlyn I. Griffith, A.B., J.D. ........040memAQA.A.A . 9.0.. ....... Rome
1977 Genevieve S. Klein, B.S., M.A. Bayside
1981 William Jovanovich, A.B., LL.D., Litt.D., L.H.D. . . . .. . BriarcliffManOr
1983 Mary Alice Kendall, B.S. .4.1.00.00.066.0#0. . WO . W±OP.41_04. ... Irondequoit
1984 Jorge L. Batista, B.A., J.D. .. odomd. . ..... A .0.4.0A.A.f. Bronx
1982 Louis E. Yavner, LL.B. . . ........ ............ .. New York
1979 Laura B. Chodos, B.A. M.A. .. .. . ......... Clifton Park
1980 Martin C. Barell, B.A., I.A. LL.B. .. Great Neck
President of The University and Commissioner of EducationEwald B. Nyquist
Executive Deputy Commissioner of EducationGordon M. Ambach
Deputy CoMmissioner for Higher and Professional EducationT. Edward Hollander
Coordinator, Office of Postsecondary Research, Information Systems,and Insti utional Aid
Paul Wing
4

This report lau/ches _ series of analytical report be
prepar .d by the Office of Postsecondary Research, Information Systems, and
Institutional Aid. Based on data collected by the New York State Education
Department, this first report examines higher education enrollment patterns
in New York State. It has two purposes: to present and analyze enrollment
data from a number of different perspectives, and to encourage institutions
to examine their own relative positions by using these data and perspectives.
Data presented in this report were made available through the
cooperative efforts of the Education Department and the respondi-- insti
tutions. The principal data source ts the New York State Higher Education
Data System HEDS), specifically the key data eleMents included in the
"Postsecondary Information Systems DATACORE," being developed by the Office
kof Postsecondary Research, Information Systems, and Institutional Aid.
The computerized DATACORE sy.tem will make it possible to provide the
Department and others with timely information about postsecondary education
in the State. This document demonstrates some of the system s capabilities
in displaying basic enrollment data. As DATACORE i- expanded and refined,
it will provide similar capabilities in other areas as well.
These data, and perspectives for their application, provide a
framework for institutions in discerning trends of significance and in
developing plans for the future. The data the appendixes can be
used by individual institutions to assess in more detail their relative
positions within the overall postsecondary system of the State. Insti
tutional selfassessment will become more import-t, as the number of high
school graduates declines and as competition for students becomes more intense.
140i=3:D .tilu=un ana vavia A. waters had the primary responsibility
for pleparing the report. Thanks are also due to Mark P. RileY and
Margaret R. Norton for the suppo- they provided.
Paul WingCoordinator, Office of PostsecondaryResearch, Information Systems andInstitutional Aid

CONIENTS
FOREWORD
LIST OF TABLES
LIST OF FIGURES AND MAPS
INTRODUCTION
GENERAL PERSPECTIVES
MARKET SHARE
RESIDENCE AND MIGRATION
SYNOPSIS
APPENDIX A - SELECTED INSTITUTIONAL CHARACTERISTICS
APPENTIX B - SPECIFIC INSTITUTIONAL DATA
-v-
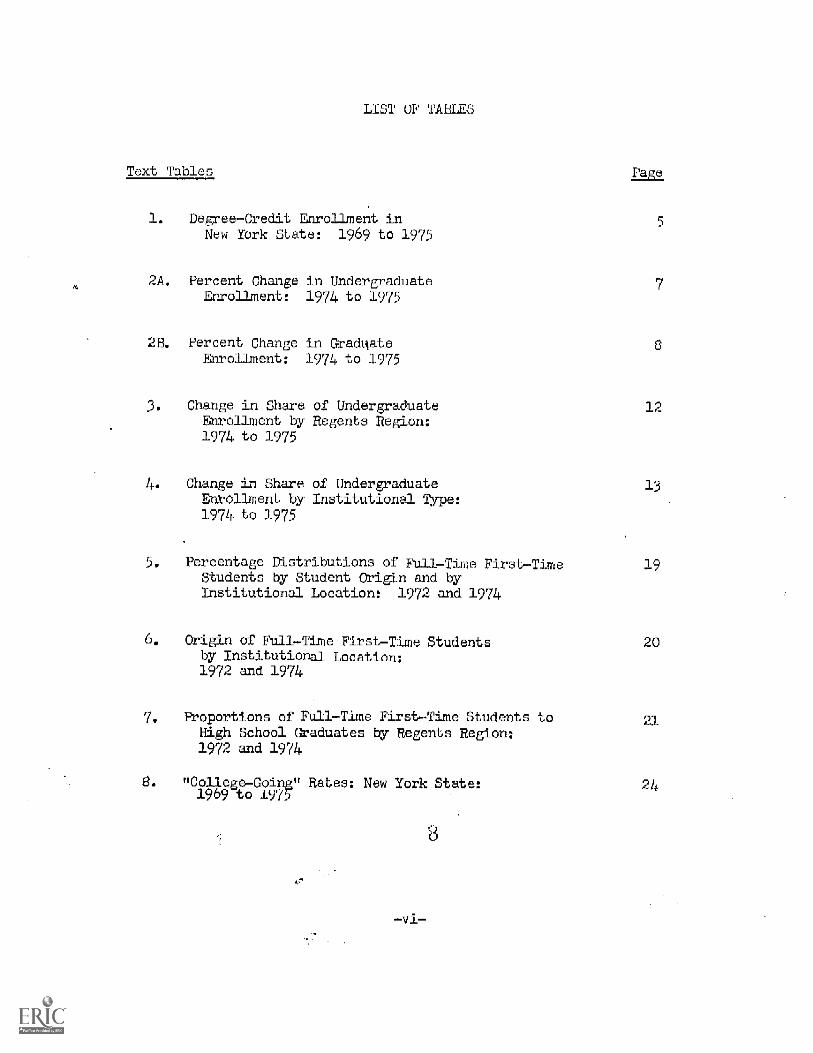
LIST OF TABLES
Text Tables
Degree-Credit Enrollment inNew York State: 1969 to 1975
2A. Percent Change in UndergraduateEnrollment: 1974 to 1975
2B. Percent Change in GraduateEnrollment: 1974 to 1975
Change in Share of UndergraduateEnrollment by Regents Region:1974 to 1975
4. Change in Share of UndergraduateEnrollment by institutional Type:1974 to 1975
PaRP
12
13
Percentage DiAributions of Full-Tim. FirstTjrne 19Students by Student Origin and byinstitutional Location: 1972 and 1974
6. igin of Full-Time First-Time Studentsby Institutional Location:1972 and 1974
Proportions of Full-Time First-Time Students toHigh School Graduates by Regents Region:1972 and 1974
"Co ego-Col19 9 to 197
a New York State:
-vi-
20
21
24

LIST OF TABLES continued)
A2221-211LL21RE
A-1. Ins_itutional Typology
A-2. Geographical Divisions
A-3. Insti u ional Characteristics
B-1. Percent Change in UndergraduateEnrollment: 1974 to 1975(by Institution)
5-2. -Percent Change in GraduateEnrollment: 1974 to 1975(by Institution)
Figure 1. De
LIST OF FIGURES AND MAPS
--e-Credit Enrollment inYork State: 1969 to 1975
Map A. Regents Regions for PostsecondaryEducation
Map B. FMB Regions (Economic,Development Board -New York State Planning and Development
Regions)
Postsecondary education in New York State is expe iencing increased
financial pressures related to the fiscal circumstances of both the State
and Nation. Competition among postsecondary institutions for students is
also increasing, as the number of high school graduates b = to decl ne.
Within this context of competition for both resources and students,
enroliMent statistics are probably the best indicators of institutional
performance. This report illustrates the basic historical enrollment
data as indicators of growth or contraction.
Three aggregations of enrollment data are shown: state ide,
regional, and sector/institutional type. Combinations of these levels of
aggregate data also have utility. In addition, institutionlevel character
istics and data are provided as a means for further analysis by individual
institutions in evaluating their ow_
significant for their own purposes
postsecondary education community.
The report is organized as
situations, according to what is
and positions within the State's
follows: the first section, General
Perspectilaes, offers a broad view of enrollments for the first half of the
decade, which provides a general backdrop for viewing future directions.
The second gection, Market Share, applies a business concept to postsecondary
enrollments for regions and different types of institutions. The third
section, Residence and Migration, analyzes the dynamics of student flow
among regions and types of institutions. The final section is a synopsis of
the entire report. Pertinent data are provided at the end of each section.
In addition, two appendixes provide explanations of selected institutional
characteristics and present specific enrollment data for individual
institutions.10
1

T = totr numtier of students attending degree-granting institutions
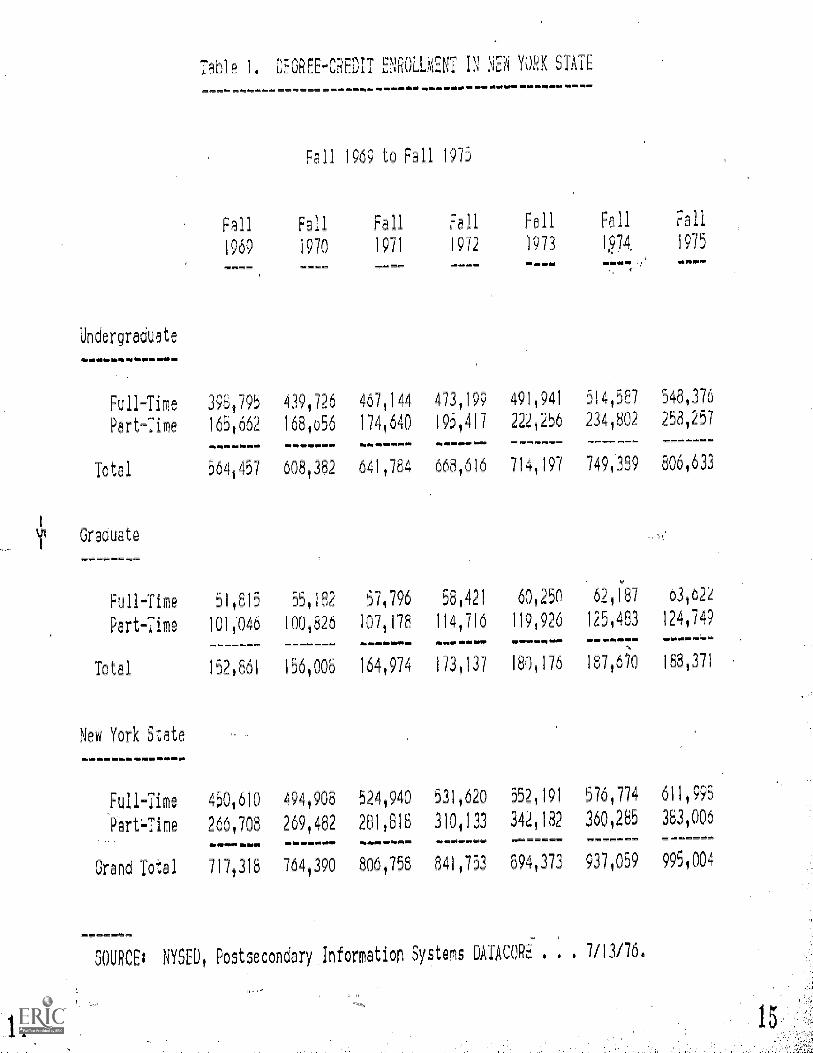
in New Yor( State rePci d almost one million in fall 1975. This represents
an all-time high in enrollment and an increase of oval- 275,000 (39 percent)
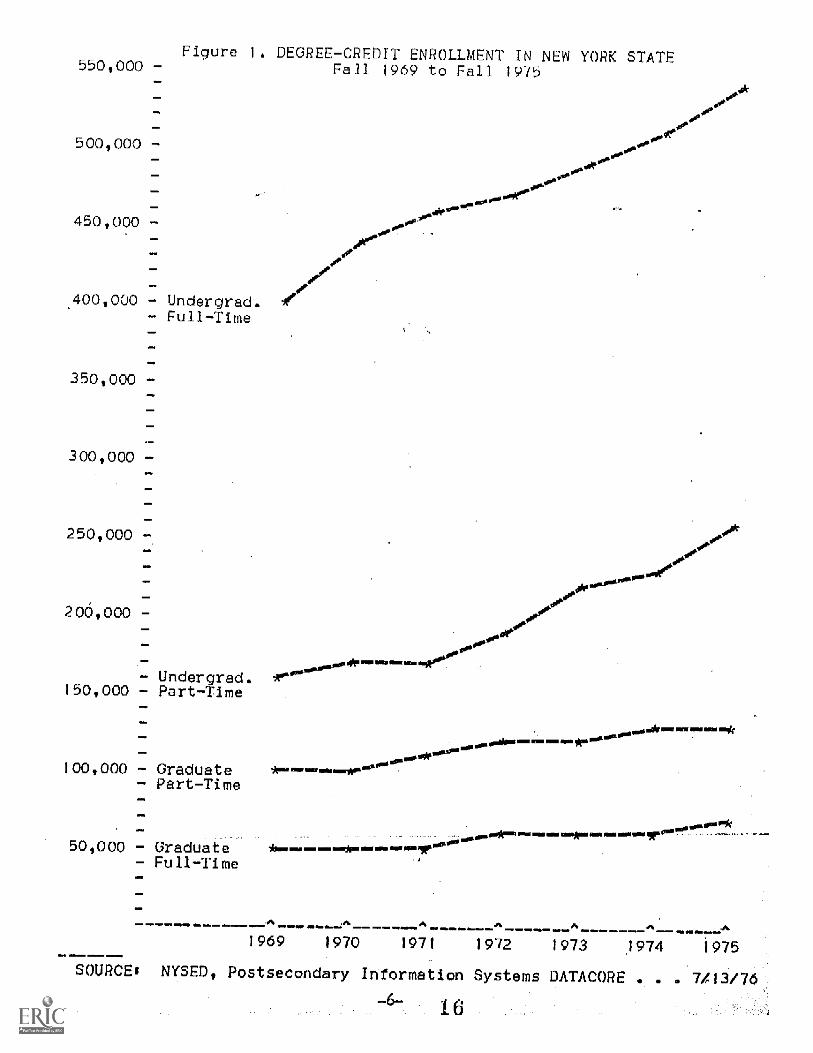
since fall 1969. As shriml in 1 enrollment has ex anded at all levels
of postsecondary education. *:al-time undergraduate enrollment grew from
just under 4001000 students in 1969 to over 548,000 ln 1975, an increase
of almost 38 percent. During the same period, ful14.1m graduate and
first-pro essional enrolime t increased by more than 11,000 (23 percent ) to
more than 63,000.
Figure 1 illustrates the relative growth in both full-time and
part-time undergraduate and graduate enrollments for each year between 1969
and 1975. Most significant is the greater proportion e increaQe in part-time
undergraduate over full-time undergraduate enrollment -- 56 versus 38 percent.
A more detailed look at enrollments for 1974 and 1975 is provided
in tables 2A (undergraduate) and 28 (graduate), which show enrollments by
ector and type of institution.* At the undergraduate level, part-time
enrollment has grown more rapidly than full-time enrollment -- an average
rate of increase of 10 versus 6.6 percent. This pattern is reflected in each
of the three sectors State University, City University, and private). In
contrast full-time graduate enrollment increased statewide, while part-time
enrollment actually decreased. The State University and private sectors
reflect this pattern, whereas the City University showed a decline in both
full-time and part-time graduate enrollment.
*The institutional typology used for this report is shown in appendix A,
table A-1.
-2--
I I
part-time enrollment noted ror tne btate university e oitunuiu LUJ.W6tr,0
private enginecring-teehnical college , and private 2-year colleges; the
State University statutory colleges, university colleges, and agricultural-
technical colleges gained in part-time enrollments. The State University
health sciences centers increased in full-time enrollment and declined in
part-time enrollment. Undergraduate decreases occurred for the City
University community colleges in full-time enrollment and the seminaries
in part-time enrollment.
Overall, the private 2-year colleges led in undergraduate
enrollment growth. However, this is partially bali_ced by the fact that,
for 1975, these institutions enrolled only three percent of the full-time
two percent of the part-time undergraduates in the State; Next in rate of
growth were the private engineering-technical colleges, with substantial
increases in both full-time and part-time enrollment
Graduate increases in both full-time and part-time enrollments are
noted for the State University specialized colleges and private colleges; the
private engineering-technical colleges gained in full-time enrollments and
the State University health sciences centers and seminaries gained in part-time
enrollments. The State University specialized colleges gained in full-time
enrollment, whereas the private specialized colleges declined; the State
University health sciences centers gained in part-time enrollment, whereas
the private health sciences centers declined. Graduate decreases occurred
for the City University senior colleges, with relatively high proportionate
losses in both the full-time and part-time categories.
and

Overall, the fulltime graduate enrollment growth of the private
engineeringtechnical colleges and the total enrollment decline of the
City University are the most apparent trends to be noted.
It is emphasized that the undergraduate enrollment growth shown
in figure 1 and tables 1 and 2A reflects an increase in the number of high
school graduates, rather than an increase in the preference of people f
college. Figures from the Department's Basic Educational Data System show
a relatively constb.nt proportion of New York State high school graduates
going on to postsecondary education in the State during the first half of
the seventies. Since the number of high school graduates began to decline
in 1976, and will decline substantially over the next 15 years, institutions
cannot depend on the former trend to sustain their enrollments.*
The New York State Education Department will release revised enrollmentprojections as part of the Regents 176 _Statewide Flan for the_Develo ent ofPostsecondarr Chapter 2, "Higher Education Enrollment in the1980's: Declining _ectations" will provide both enrollment projections andinterpretations.
%,ft
Table 1. DEGREE-CREDIT ENROLUENT IN NE/i YORK STATE
...
Fall 1969 to Fall 1975
Fall Fall Fall Fall Fell Fall
1969 1970 1971 1972 1973 174WM EntM
Undergraduate
%if fei8 3MMEWf
Full-Time 398,795 439,726 467,144 473,199
Part-1ime 165,662 166056 1741640 1951417
Tctal 564,457 608,3,2 641,764 668,616
Graouate
Fu11-Time 51,815 55,182 57,796 58,421
Part-Time 104046 100,826 107,178 114,716
Total 152,861 1561008 164 974 173,137
New York State
Fu1l-T1me 450,610 494,908 5241940 531 620
PArt-Time 266,706 2691462 281,816 310 133
Grand Total 717,318 7641390 806 758 6411753
1975
491,941 514,5E7 548,376
222,256 234,802 2581257
emeeea. =GUMP..
714,197 749,389 806,633
60,250 62,187 03,622
119,926 125,4E3 124 749
180,176 187,6:10 183 371
5521191 5761774 611- 998
3421162 3601285 383,00o
694,373 9371059 9951004
SOURCE: NYSE° P: t econdary Information Systems DATACORE . 7 13/76.
550,000 -./g
500,000 -
450,000 -
ure 1. DEGREE-CREDIT ENROLLMENT IN NEW YORK STATEFall 1969 to Fail 1975
400,000 - Undergrad.- Full-Time
350,000 -
300,000 -
250,000 -
200,000 -
Undergrad.150,000 - Part-Time
100,000 - GraduaPart-T me
50,000 - Oradua e- Full-T me
=T=
gip Elm um MIN
ILInt MN MEI NM IMF
wow wei weiN
w.T.1
soN
Mjs WM PIMwoo ouvpia
..,11411111 MAI
oto-oair.
gw4
EMI NIMP. 1i
A A A A A;ffi.wommo1969 1970 1971 1972 1973 1974
ffm 016 a.k
1975
SOURCEI NYSED, Postsecondary Informatlon Systems DATAC RE . 7/13/76-
-6- 16

Table 2A. PERCENT CHANGE IN UNDERGRADUATE ENROLLMENT: 1974 TO 1975
Sector/Type Fall
1974
The State University of New York
University Centers 35,733
University,Colleges 59,087
Health Sciences Centers 2,181
Specialized Colleges 2,468
Statutory Colleges 5,024
Agricultural-Technical 20,716
Community Colleges 72,557
Total SUNY 197,766
The City Univers ty of New York
Senior Colleges 87,220
Community Colleges 43,938
Total CUNY 131,158
Private College
Multiversities
Universities
College Complexes
Colleges
Engineering-Technical
Specialized Colleges
Mealth Sciences Centers
Seminaries
2-Year Colleges
and Universities
32,994
31,351
48,919
28,402
261010
2,484
1 618
523
13,362
Total Private 185,663
Total New York State 514,587
ull-Tim
Fall Percent
1975 Change
Fall
1974
38,622 8 08 6 896
62,809 6.30 9,351
2,451 12.38 230
2,627 6.044 232
51125- 2.01 40
21,097 1.84 7 282
83,061 14.48 63,238
215,792 9 11 87,269
87,550 0.38 49,382
42,655 2.92- 40,428
130 205 0.73- 89-810
321954 0.12- 6,562
32 747 4.45 8,755
50 776 3.80 14,307
30,903 8.81 13035
32,056 23.24 91199
2,593 4.39 1,985
1,742 7.66 17
483 7.65- 419
18,125 35.65 3,344
202,379 9 00 57,723
548,376 6 57 234,802
---Part-Time
Fall Percent
1975 ChangeGif AM GlINI!
6-792 1.51-
10,707 14.50
215 6.52-
245 5.60
546 1,270.00
8,332 14.42
73,554 16.31
aletwam pg*.
100,393 15.04
50,964 3-20
42,712 5.65
93,676 4.30
7,034 7 19
9,621 9.89
14,638 2.31
14,819 12.82
10,743 16.78
21143 7.96
6 64.71-
238 43.20-
4,946 47.91
R.OVONWM
64,188 11 20
258,257 9.99
SOURCE: MED Postsecondary Information Systems DATACORE . 7 15/76.
17

Table 28. PERCENT CHANGE IN GRADUATE ENROLLMENT: 1974 TO 1975
Sector/Type Fall 'Fall Percent Fall
1974 1975 Change 1974
The State University of New York
University Centers 7,399 7,967, 7.68 10,020
University Colleges 21015 2,168 7.59 14,776
Health'Sciences Centers 3,181 3,452 8,52 478
Specialized Colleges 305 369 20.98 333
Statutory Colleges 1,690 11712 1.30 10
mmmi,ms
Total SUNY 14,590 151668 7.39 251617
The City UniversIty of New York
Graduate School
Senior Colleges
2,129
3,484
woe wFIRm.
Total CUNY 5,613
1,974 7.28- 869
2,541 27.07- 251506
4,515 19,56- 261375
Private Colleges and Universities
MultiVersities 22,396 221778 1.71 21 946
Universities 61508 71015 7.79 25,689
College CompleXes 1,992 2,243 12,60 11,948
Colleges 155 190 22,58 3,062
Engineering-Technical 11937 2,398 23.80 4,837
Specialized Colleges 51019 41514 10.06- 5,231
Health Sciences Centers 21320 2,587 11151 268
Seminaries 1,657 11714 3.44 510
Total Private
.......
41,984 43,439 3,47' 73,491
Total New York State 62187 631622 2.31 1251483
SOURCE: NYSED, Postsecondary Intoration Systems DATACORE 0
Fall Percent
1975 Change
10,602 5.81
14,146 4.26-
625 30.75
381 14.41
7 30.00-
25,761 0.56
897 3.22
21,525 15,61-
224422 14,99-
210871 0 34-
271369 6.54
12031 2.37
3,494 14011
4,963 2060
5,760 10011
204 23088-
674 32.16,
76,566 4.18
, 124,749 0.58-
7/15/76.
ARIET SHARE
The concept of market share may, with discretion, be useful for
observing trends in postsecondary education. If applied to enrollment
shifts between the public and private sectors, for example,it might describe
some of the competition for students. It could also be applied to specific
types of institutions, such as law schools, to illustrate how well each is
attracting students.
While competition for students will, for specific institutions, be
translated into competition with a relatively small set of competitors, it
is not an objective of this report to heighten tensions that may exist in
this regard. To minimize such a possibility, this section deals with
fairly large groups of institutions, with responsibility left to the
reader to determine implications for individual institutions.
Two sets of market share statistics are presented. Table 3 shows
the share of statewide undergraduate enrollment by geographic region and
table 4 shows the share by type of institution. Both tables provide
percentage share statistics for 1974 and 1975, as well as the change over
the one-year period.
Regional Comparisons
When institutions of all sizes, types, and sectors are aggregated
as shown in table 3, New York City realized the greatest decline in
regional share of both full-time and part-time enrollments. Although some
of the decline in the City University enrollments were picked up by private
institutions in the New York City region, it was not large enough to prevent
a net decline for the region. Whether the gains of both full-time and
-9-
parttime students in the Mid-Hudson and Long Island Regions are indicative
of some migration of New York City students cannot be determined from these
data.
Other regional share declines include full-time enrollment in the
Central Region and part-time enrollment in the Genesee Valley and Northern
Regions. Only if these declines were to continue would they begin to
assume significance. The same may be said for the increasing share of
part-time students in the Northeast Region.
..2ecsonsTable 4 presents market share trend data between 1974 and 1975
for the major types of institutions. The institutional type shares are
percentage distributions of each year's undergraduate enrollment 100 x
institutional type nrollment total enrollment). The changes expressed
are the arithmetic differences in percentages of each institutional type's
share between 1974 and 1975-
The most significant change is the decline in the City University
of both full-time and part-time enrollments in both the senior and community
colleges. Despite the decline in the City Univ sity's share of full-time
undergraduate enrollments, the percentage change in actual enrollment
declined less than one percent between 1974 and 1975 (table 2A). The market
share approach accentuates the decline because of the over six percent
increase in total full-time undergraduate enrollment in the State.
Other changes worth noting are the percentage increase in share of
full-time enrollments at the private-engineering colleges, the percentage
increase in share of part-time enrollments at the State University,
especially its community colleges, and the percentage decrease in share of
part-time enrollments at the City University, especially its senior colleges.
22-10-
The State Education Department is studying the application of
these market shar- concepts to the Statets postsecondary education system
and will be pre.enting more indepth analyses as they are completed. In
the meantime, institutions interested in assessing their own individual
performance in the "marketplace can use the data provided in the appendixes
to develop institution institution market share statistics. These
statistics may help institutions to identify problem situations and provide
insights on how to attract students more effective
=-117

Table 3. CHANGE IN SHARE OF UNDERGRADUATE ENR_LLMENT
BY REGENTS REGION
--All
Regents
figures are percentages--
Full-Time Part TimeRegion 1974 1975 11;--nge* 1974 1975 Chance*
.serff. ffa...7ffra
I - Nestern 10.63 10.65 0.0J 6.82 6.97 0.15
II - Genesee Valley 7.41 7.48 0.07 6.98 6.48 -0.50
-III - Central 13.79 13.62 -0.16 5.53 5.78 0.25
IV - Northern 2.53 2.54 0.01 0.57 0.51 -0.07
V - Northeast ,9.06 9.29 0.22 7.25 8.26 1.01
. VI - Mid-Hudson 7.75 6.33 0.57 1_0.02 10.12 0.10
VII - New Y.ork City 37.25 35.61 '-1 64 50.06 48 06 -2.00
VIII - Long Island 11.57 12.47 -0.90 12.77 13.83 1.07
100.00* 100.00* 100.00 100.00*
*Calculations may not appear exact due to individual rounding.
SOURCE: MEDI Postsecondary Informa ion Systems . . 7/22/76.
2 4
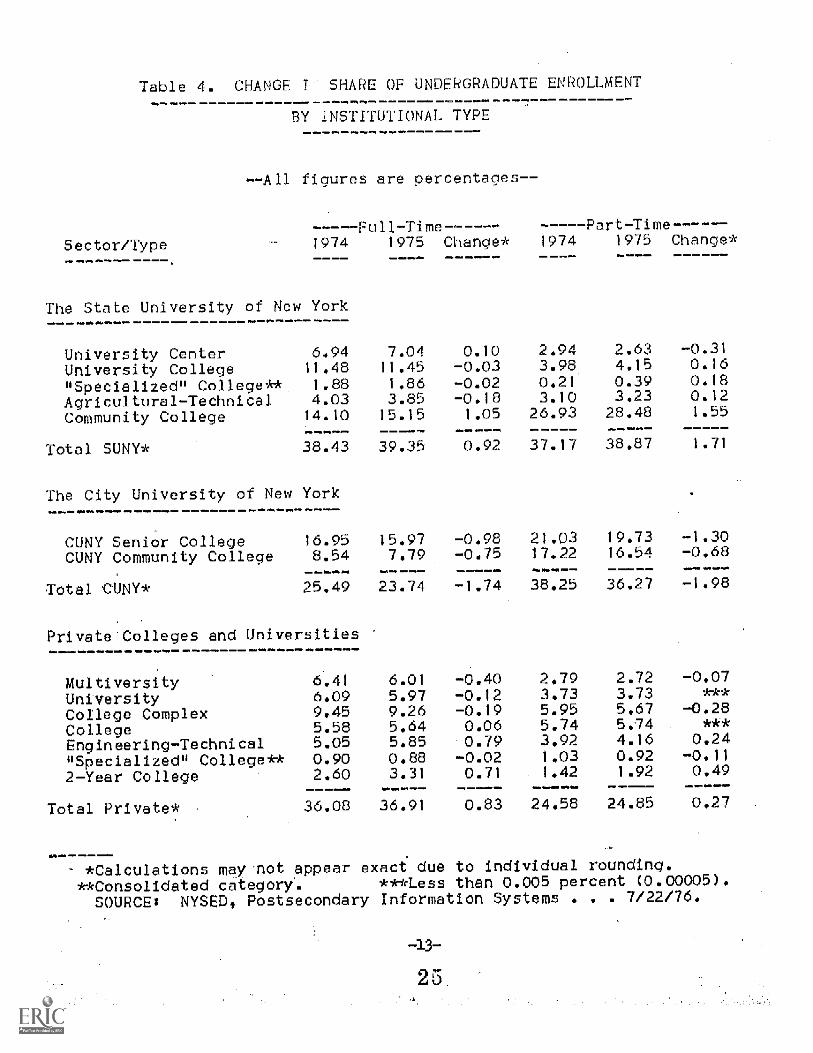
Table 4. CHANGE I SHARE OF UNDERGRADUATE ENROLLMENT55555 . .5_5_ ga_555_aa55555a55aa55
$ ector/Typea 55 55 5555
BY INSTITUTIONAL TYPE
--All figures are pereentanes--
--Full Part-Time------1974 1975 Change* 1974 1975 Change*
The State University cf New York55555555a55555555555555555555a5a
5555 55 5 5 5555 5 55
University Center 6.94 7.04 0.10 2.94 2.63 -0.31
University College 11.48 11.45 -0.03 3.98 4.15 0.16
"Specialized" College7- 1.88 1.86 -0.02 0.21 0.39 0.18
Agricultural-Technical 4.03 3.85 -0.18 3.10 3.23 0.12
Community College 14.10 15.15 1.05 26.93 28.48 1.55
Total SONY* 38.43 39.35 0.92 37.17 38.87 1.71
The City University of New York
'CUNY Senior College 16.95 15.97 -0.98 21.03 19.73 -1.30
CUNY Community College 8.54 7.79 -0.75 17.22 16.54 -0.68
Total CUNY* 25.49 23.74 -1.74 38.25 36.27 -1.98
Private-Colleges and Universities
MultiversityUntversityCollege ComplexCollegeEngineering-Technical"Specialized" College**2-Year College
6.416.099.455.585.050.902.60
55555Total Private* 36.08
5555555
6.015.979.265.645.850.883.31
36.91
-0.40-0.12-0.190.060.79-0.020.71
0.83
2.793.735.955.743.921.031.42
24.58
2.723.735.675.744.160.921.92
5 555524.85
-0.07***
-0.28leink0.24
-0.110.49
0.27
*Calculations may 'not appear exact due to individual round ng.
**Consolidated category. ***Less than 0.005 percent (0.00005).SOURCE: NYSED, Postsecondary InformaAon Systems . . 7/22/76.
-13-
2 5

RESIDENCE AND MIGRATION
Another approach to assessing institutional performance in
attracting students is examination of the residence and migration of full-time
first-time students. In this report, the term "residence" refers to the
New York State region of home residence of specified students, and
"migration" refers to the movement of students from their home regions to
the regions where their institutions are located. These migration patterns
provide additional.insights about the student markets being served by
institutions.
Available data reflect movements of students within the State and
immigration of out-of-State and foreign students. For a more complete sti
of student migration, it would be desirable to have supplementary information
oh the cost of attendance, geographic origin of past enrollment, transfers
and attrition, and program choices; however, these basic data allow a nurriber
of preliminary analyses.
Regional Comparisons
Table 5 presents data on the origin and destination of first-time*
undergraduates for 1972 and 1974. Linear correlations of 0.99 for student
origin and institutIonal location indicate little structural change between
the two years. Slight variations in regional changes can be seen, however.
Origin and destination data for fall 1974 show that two regions in
the State -- New York City and Western (Buffalo) provide the greatest
"regional service" with S4.8 and 82.0 percent of all enrollees coming from
the home region. Generally, the more urbanized the area, the higher the
percentage of residents attending institutions in the area. Regional enrollment
This section refers o to full-time first-time students.
26

data are shown below:
REGENTS REGION
(in descending orderof 1974 percentages )
REGIONAL E00LUENT
(percentage of enrollmentfrom same region)
Fall_197g Fall 1974
New York C'ty 86.6% 84.8%
Western 80.2 82.0
Northeast 70.9 69.4
Central 66.5 65.0
Long Island 63.3 62.9
North _n 61.7 61.9
Genesee Valley 61.9 60.2
Mid-Hudson 58.9 54.1
EIGHT-REGION AVERAGE 68.e% 67.5%
Table 6 displays the regional figures for origin and destination
in both 1972 and 1974 for full-time first-time undergraduate students.
Institutions mgy wish to derive particular statistics for their Own regions,
as related to their specific concerns. For example, figures in the
following paragraph are derived from table 6.
While only 15.2 percent of New York City resident students migrated,
this represents 19 5 percent (7099) of all of the 36 357 students who migrated
from their home region to other regions. A combined total pf almost two-thirds
(92,838) of these migrating students came f om the Long Island, New York City,
and Mid-Hudson regions, with 36.3 percent of the migration taking place among
the three regions themselves. Individually, the Mid-Hudson and Long Island
Regions appear,to be 1-- in "regional service." However, if the three.-region
metropolitan area is aggregated, 83.1 percent of the total area enrollment came
27-15-
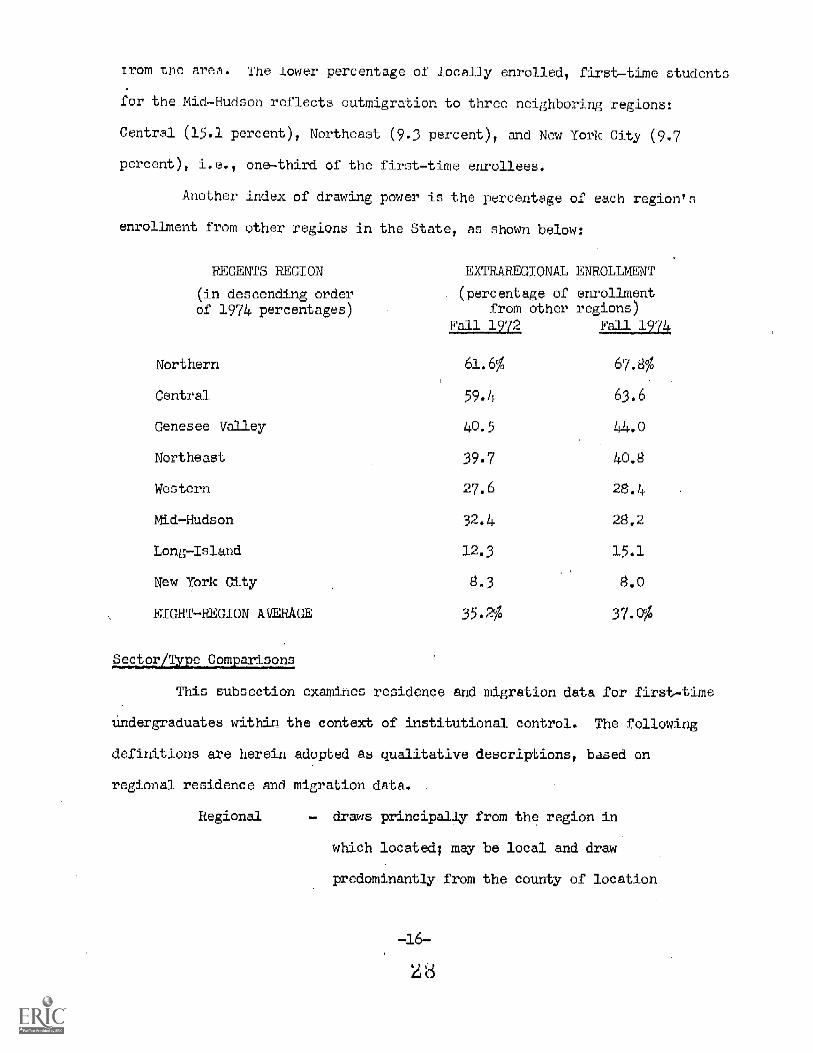
Irom tne area. The lower percentage of locally enrolled, first-time stud nts
for the Mid-Hudson reflect- outmigr_ ion to three neighboring regions:
Central (15.1 percent) Northeast (9.3 percent) d New York City (9.7
percent i.e. ono-third of the first-time e -ollees.
Another index of drawing power is the percentage of each region's
enrollment from other regions in the State, as shown below:
REGENTS REGION
in descending orderof 1974 percentages)
EXTRkREGIONAI ENROLL:MEM
(percentage of enrollmentfrom other regions)
Fall_1972. Fak 1974
Northern 61.6% 67.8%
Central 59.4 63.6
Genesee Valley 40.5 4)1.0
Northeast 39.7 40.8
Western 27.6 28.4
Mid-Hudson 32.4 28.2
Long-Island 12.3 15.1
New York City 8.3 8.0
EIGHT-REGION AVERAGE 35.2% 37. 0%
Sector/ pe Comparisons
This subsection examines residence and migration data for first- ime
undergraduates within the context of institutional control. The following
definitions are herein adopted as qualitative descriptions, based on
regional residence and migration data.
Regional draws principally from the region in
which located; may be local and draw
predominantly from the county of location
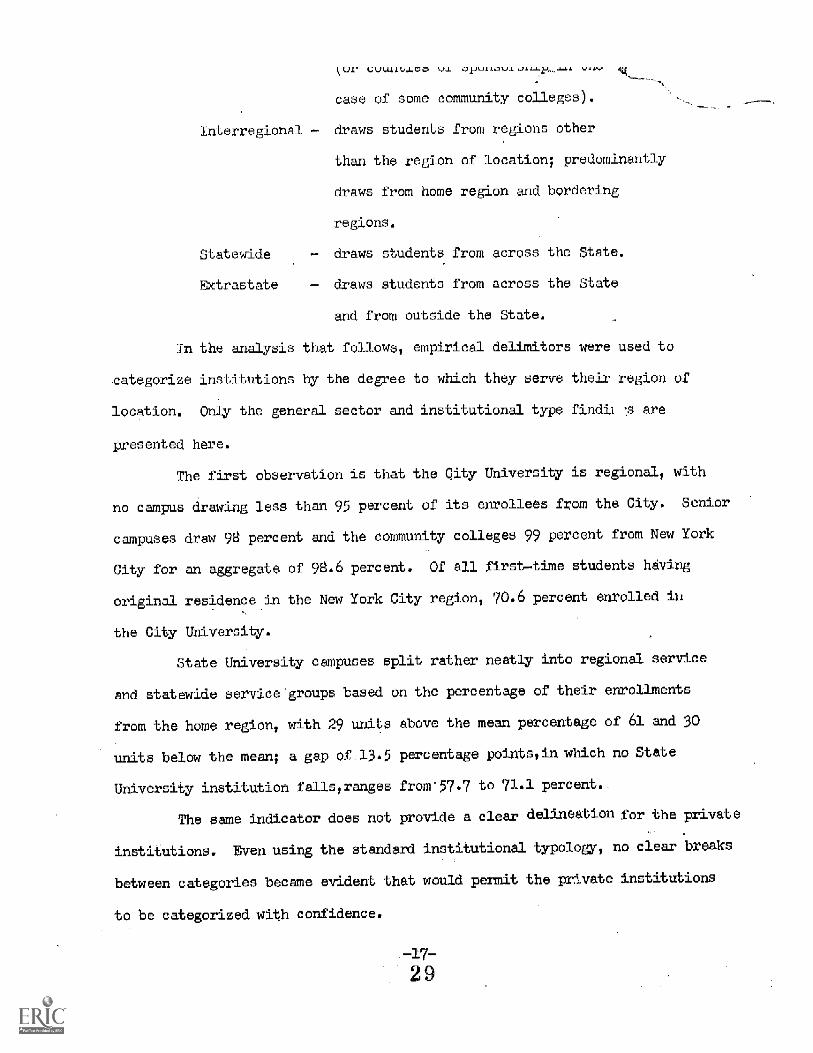
(-A_AA4.41,U0 kJL
.
case of some community colleges).
Interre nal draws students from regions other
than the region of location; predominantly
draws from home region and bordering
regions.
draws students from across the State.
Extrastate draws students from across the State
and from outside the State.
In the analysis that follows, empirical delimitors were used to
categorize institutions by the degree to which they serve their region of
location. Only the general sector and institutional type findil -s are
presented here.
The first observation is that the City University is regional, with
no campus drawing less than 95 percent of its enrollees from the City. Senior
campuses draw 98 percent and the community colleges 99 percent from New York
City for an aggregate of 98.6 percent. Of all firsttime students hiving
original residence in the New York City region, 70.6 percent enrolled in
the City University.
State University campuses split rather neatly into regional service
and statewide service groups based on the percentage of their enrollments
Statewide
from the home region, with 29 units
units below the mean;
above the me _ p- centage of 61 and 30
a gap of 13.5 percentage pointspin which no State
University institution falls,ranges
The san
institutions.
between catego_
e indicator does not
from=57.7 to 71.1 percent._
provide a clear delineation for the private
Even using the standard institutional typology, no clear breaks
es became evident that would permit the prtvate institutions
to be categorized with confidence.
172 9

several observations r (Dd- to be made. Some institution'b are local by choice
by policy. The rIty University is undo stood to be a "local" institution
drawing from the (' population. The community college -- whether those
the State or C rnversties -- also tend to be local as a matter of,
policy; they provde the local serv.ic that was tho original purpose for
their development. Institutions drawing heavily on a local area m4y face
spedial problems the number of high school graduates declines. Table 7
displays data showing the 1972 and 1974 proportions of fi- t-time students
from a region to high school graduates from tbe same region.
3 0

,
31
Fall 1972 and Fall 1974
Region -----Student Origin----- -Institutional Location-
1972 1974 Change 1972 1974 Change
.1.11.6K+.1 1.1mg mwFMPRP4 Max MMW10MW
I - iliestern 10.42 10023 0419- 11.55 1171: 0.16
II - Genesee Valley 6198 7.00 0.02 7426 7,53 0 7
III 4 Central 7,25 7.01 0425-* 1190 1.49 0.60*
IV Northern 1,66 1.56 0.10- 2'67 2099 0,32
V Northeast 8,76 6.60 0018- 10.32 10.07 0425.
VI'- Nid4dson 9465 10010 0424* 8052 7061 0,924
VII - New York City 36020 35.62 0458- 34.16 32 5 1031-
VIII - Long Island 16.86 19,69 1404* 13063 14475 1012
W.mW1ftWb
Total 100,00 100.00* 100,00* 100.00
*Calculation does not appear exact due to individual roundin
NOTE0-A1l figures are percentages4
SOURCE: NYSE, Postsecondary Information Systems DATACORE 0 7/2P/76#
32
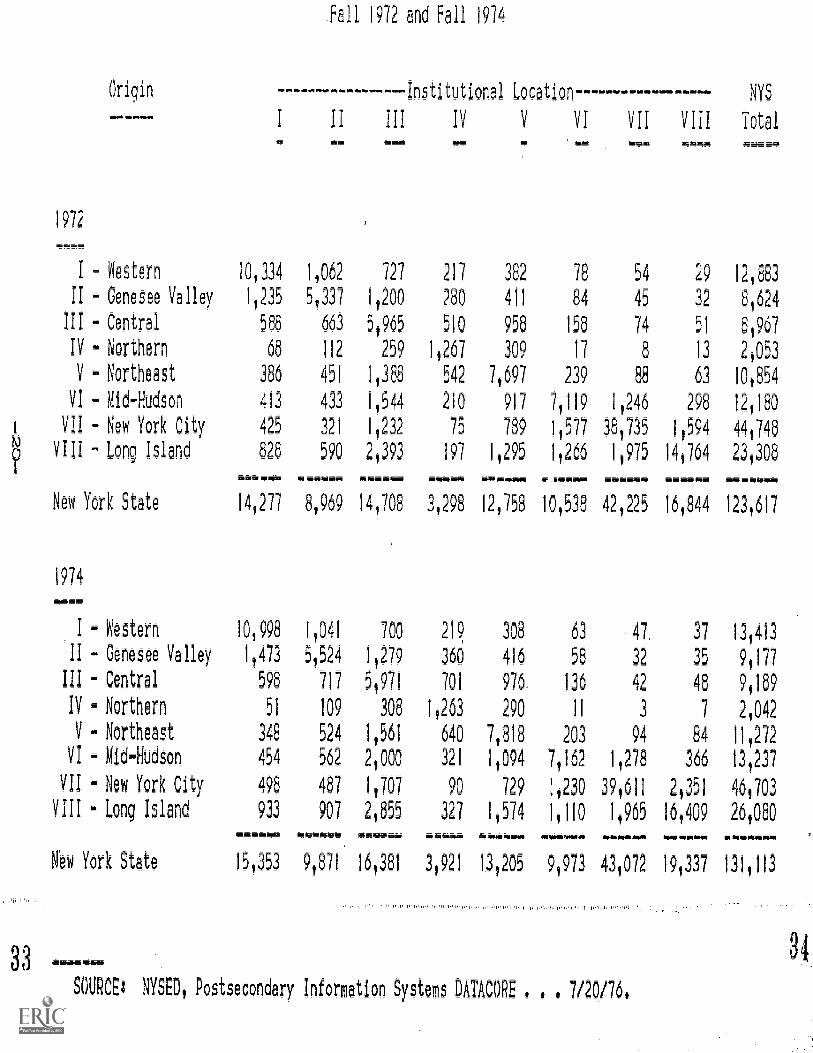
Origin
ommEmemosima
1972
I - Nestern
II - Genesee Valley
III - Central
IV - Northern
V - Northeast
VI - kid-Hudson
VII - New York City
VIII - Long Island
New York State
1974
.mfaftPA
I - Western
II - Oenesee Valley
III - Central
IV - Northern
V - Northeast
VI - Mid-Hudson
VII - New York City
VIII k Long Island
New York State
Fall 1972 and Fall 1974
10.334
11235
588
68
386
413
425
826
.11111TE*.i.
----Institutional Location------------------ NY5
II III IV V VI VII VIII Totalftsraii
11062 727
5,337 1,200
663 50965
112 259
451 1,36
433 1,544
321 1,232
590 2,393
WWYJOi_.
KOI!1
217
280
510
1,267
542
210
75
197
mwrawft
382
411
958
309
7,697
917
789
11295
141277 8,969 14,708 3,296 121756
101998
1,473
598
51
348
454
498
933
1,041
5,524
717
109
524
562
487
907
UUUUU
700
11279
5,971
308
1,561
2,000
11707
21855
219
360
701
1,263
640
321
90
327
aft&
306
416
976-
290
7,818
1,094
729
1,574
Nam
,76 54
84 45
158 74
17 8
239 88
71119 11246
11577 38,735
11266 11975
W.MitMWM [email protected]
mama.=
29
32
51
13
63
298
11594
14,764
Te
12,883
81624
8,967
21053
101854
12,180
44,746
231308
ftftftiim
101538 42,225 161844 1231617
63 47. 37
58 32 35
136 42 48
H 3 7
203 94 84
7,162 1,278 366
!1230 391611 2,351
11110 1,965 161409
mWkpm ftftftMft.M
13,413
9,177
9,189
2,042
11,272
13,237
461703
26,080
WW*** WftiAO4ftm*
151353 9,871 161381 30921 131205 90973 431072 19 337 1311113
33 ....-
SOURCE: NYSE), Postsecondary Information Systems DATACORE . 7/20/76.
Regents
Region
4ft
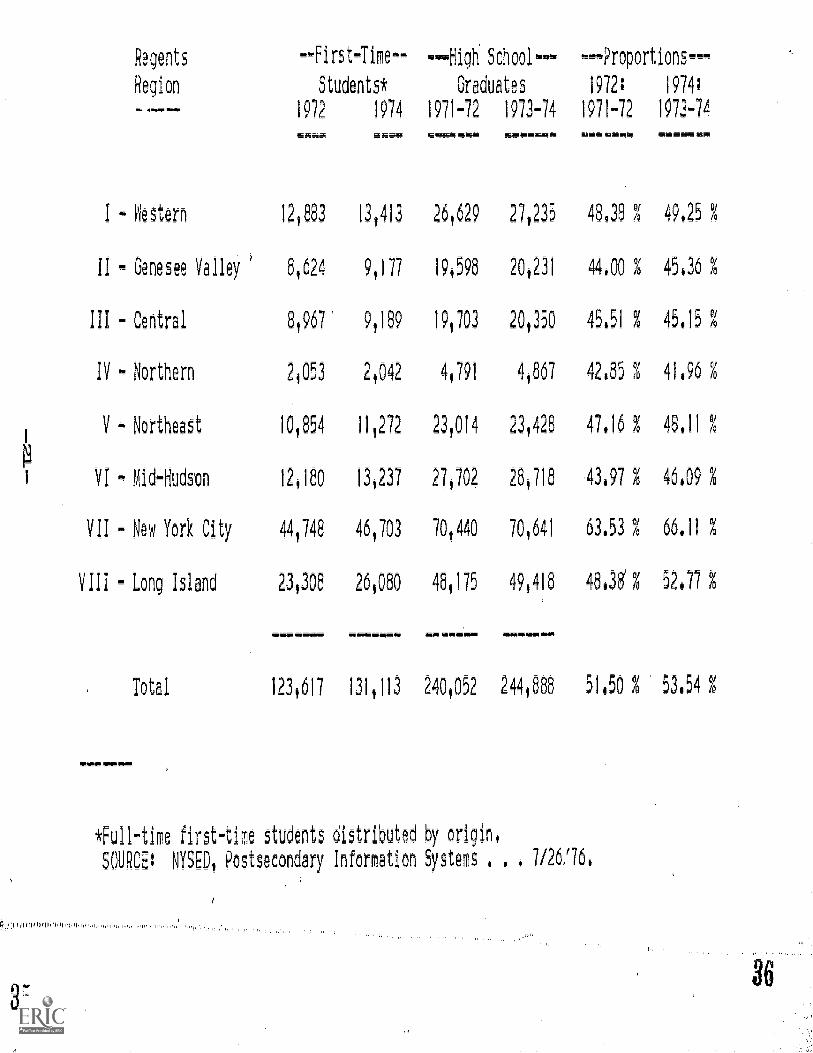
--First-Time-- ---High School--- --Proportions-
Students* Graduates 1972: 1974:
1972 1974 1971-72 1973-74 1971-72 1073-74
1 - kestern 12,883
11 - Genesee Valley 6,624
III Central 8,967
IV - Northern 2,053
V - Northeast 10,854
VI - Mid-Hudson 120180
VII - New York City 44,748
VIII - Long Island 23,308
Total
WF5i.!IFM
13,413
9,177
9,189
2,042
11,272
13,237
46 703
26,080
.01
26,629
19,598
19,703
4,791
23,014
27,702
70,440
48,175
27,235
20,231
20,350
4,867
73 426
26,718
70,641
49,418
- WAR
... Imrpla*WMW
48.38 % 49.25 %
44,00 %
45.51 %
42.85 %
47.16 %
43.97 %
3.53 %
48.3g %
45.36 %
45.15 %
41.96 %
48.11 %
46.09 %
66.11 %
52.77 %
123,617 131,113 240,052 244,888 51.50 1 53.54 1
*Full-time first-time students distributed by origin,
SOURCE: NYSED, Postsecondary Information Systems . 7/26/76
36

in recent years. Three approaches are used to display data, each providing
a different perspecti-e on enrollment patterns and trends.
Some of the general findin
-
re as follows:
Total State enrollment reached an all-time high in 1975
of nearly one million students.
Both full-time and part-time undergraduate enrollments
increased, but part-time enrollment grew more rapid
Full-time graduate enrollment increased slightly,
while part-time enrollment decreased slightly.
The State University and private sector enrollments
increased at about the same rate, while City University
enrollments decreased.
The Mid-Hudson Region increased its percentage of the State's
full-time undergraduates, while the percentage for the New
York City Region declined
The Genesee Valley Region increased its percentage of
the State's part-time undergraduates, while the percentage
for New York City Region declined.
The State University and private sectors increased their
percentages of the State's full-time and part-time under-
graduates, while the percentages for the City University
declined.
The New York City Region had the highest percentage of
regional enrollment, while the Northern Region had the
highest percentage of extraregional enrollment
3 7
in both full-time and part-time undergraduate enrollments.
The City UniversiLy community colleges experienced
decreases in full-time undergraduate enrollment and
the City University ,,enior colleges in both full-time
and parb-time graduate enrollments.
The private engineering-technical colleges grew
substantially in full-time and part-time undergraduate
and in full-time graduate enrollments.
The pr portion of New York State nigh school graduates
going on to postsecondary education in the State has
remained stable over the first half of this decade.
(See table 8.)
In addition to these general findings, the report provides detailed
data on individual institutions in the appendixes. These can be used by
individual institutions for institutional self-assessment and planning,
to analyze their own circumstances more carefully.
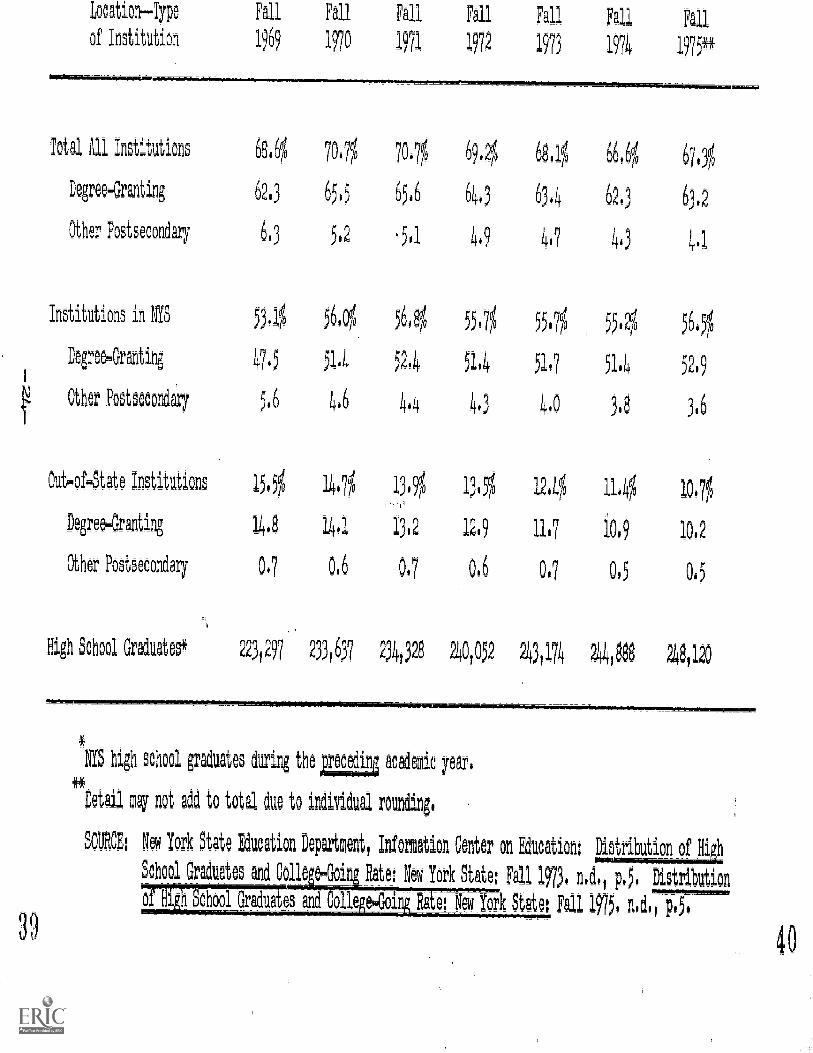
LocatioiIype
of Institution
FaLl Fall Fall Fall Fall Fall Fall
1969 1970 1971 1972 1973 1974 1975*4
Total All institutions 684 7007 70.7 69.4 68.10 6640 67.35
Degree-Granting 62.3 65.5 65.6 64.3 63,4 62.3 63.2
Other Postsecondary 6.3 5.2 501 4,9 4.7 4.3 4,1
Institutions in NYS 534 56.0Y0. 5600 55 7 55.75 551k0 564
Degree.Granting47.5 5144 52.4 51.4 5147 51.4 52.9
0-,her Postsecondary 5.6 406 4.4 4.3 4.0 3.8 3.6
Out-of-State Institutions 154 14.7f0 1, 0 13.55 12.4 11.41 1175
Degree-Granting 14.8 14.1 13.2 12.9 11.7 10.9 10,2
Other Postsecondary 0.7 0.6 0.7 0.6 0.7 0.5 0.5
High School Graduates* 223,297 233,637 2 4, 28 40,052 243,174 244,888 248,120
*
NYS high school graduates during the aeLt- academic year;
**. . ..
Detail may not add to total due to individual rounding.,
SOJECE: Ned York State Education Department, Information Center on Education: 11i2,
School Graduate8 and Oolle!e-Goi-i Rate: New York State: Fall 1973. Mil p.50 Dist.ribution
0.=fiool.Raduates and oliioir .01kYork Ste* Fall 1975. nid.1
39
APPENDIX A
Selected Ins itution Ch a eristioe
4 1
25
SELECTED INSTITUTIONAL CHARACTERISTICS
The information system used by OPRISIA* includes a number of
standard "institutional characteristics" -- items intended to provide
relatively stable descriptors of each institution. Such desc iptors
facilitate not only data retrieval, but also dataPresentation and
The five basic institutional characteristics used in this report
are presented, by individual institution, in table A-3. All institutions
reporting data in year from 1969 to the present are included; this
includes several schools' that are currently nonoperational.
Each of the five selected institutional characteristics is
described as follows:
pe of Institution: Table A-1 lists the complete institutional typology.
The category "PublicSpecial" was created to allow classification of the
U.S. Military Academy at West Point, the U.S. Merchant Marine Academy at
Kings Point, and the Regents External Degree Program. The categories
under the State University of New York (SUNY) and The City University of
New York (CUNY) are those developed by the respective public university
eystems. The categories under the private institutions were developed by
the New York State Education Department: unique academic characteristics
identified the five types coded 2050 through 2090;"expenditures were then
used to delimit the four types 2010 through 2040.**
*Office of Postsecondary Research, Information §ystems, and Institutional
Aid; 14;w York St3te Education Bepartment.**
Office of Planning in Higher Education. Higher Education PlanningSta4etiee,c_1969: Volume V. OPeratienal Finances. Albany: New York StateEdiication Department, January 1970, p.1.
2642

Regents Region: Map A delineatesthe eight "Regents Region8 for
Postsecondary Education," each with a number and name (e.g., I-Western
Region ); refer also to table A-2.
EDB Region: Map B delineates the 13 "State Planning and Development
Regions" of the New York State Economic Development Board EDB), each
with a number and name (e.g., 1-Southern Tier West); refer also to
table A-2.
County: Maps A and B delineate the 62 "Counties of New York ate;"
refer also to table A-2.
Name of Institution: The institutional name is a 20-char
abbreviation of its entry in the Institutional Directory.
Office of Postsecondary Research, Information Systems, and
Institutional Aid. Institutional Direct° : Postsecondary Edupation
in New York StAte. Albany: New York State Education Department,
March 1976.
4 3-27-
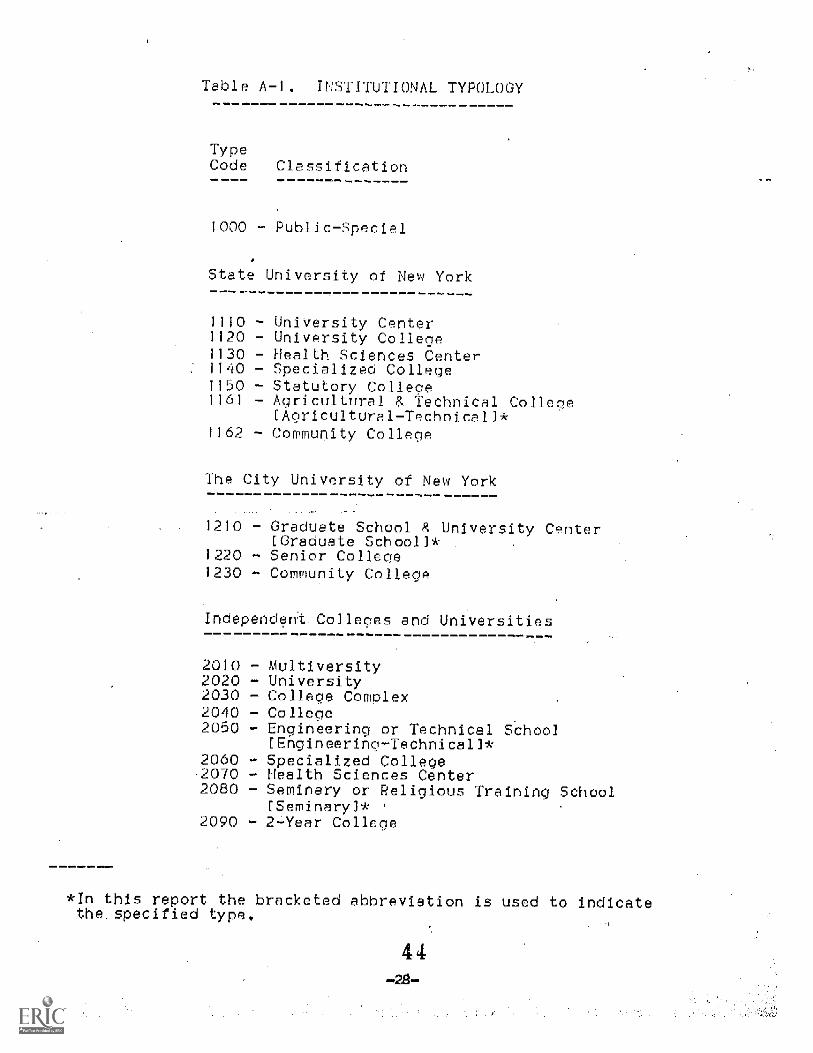
Table A-1. INSTITUTI)NAL TYFULQOY
TypeCode Classification
1000 Public-Sp cial
State University of New York
1110 - University Center1120 - University College1130 - Health Sciences Center1140 - Specialized College1150 - Statutory Collece1161 - Agricultural & Technical Colleqe
CAoricultural-Technical)*1162 - Community College
The City University of New York
1210 - Graduate School & Universi y CenterCGraduate School)*
1220 - Senior College1230 - Community College
Independent Colleces and Universities---2010 - Multiversity2020 - University2030 - College Complex2040 - College2050 - Engineering or Technical School
CEngineerino-Technicall*2060 - Specialized College-2070 - Health Sciences Center2080 - Seminary or Religious Training School
iSeminaryl*2090 - 2Year College
In this report the bracketed abbreviation is used to indicatethe, specified type.
4 4
C
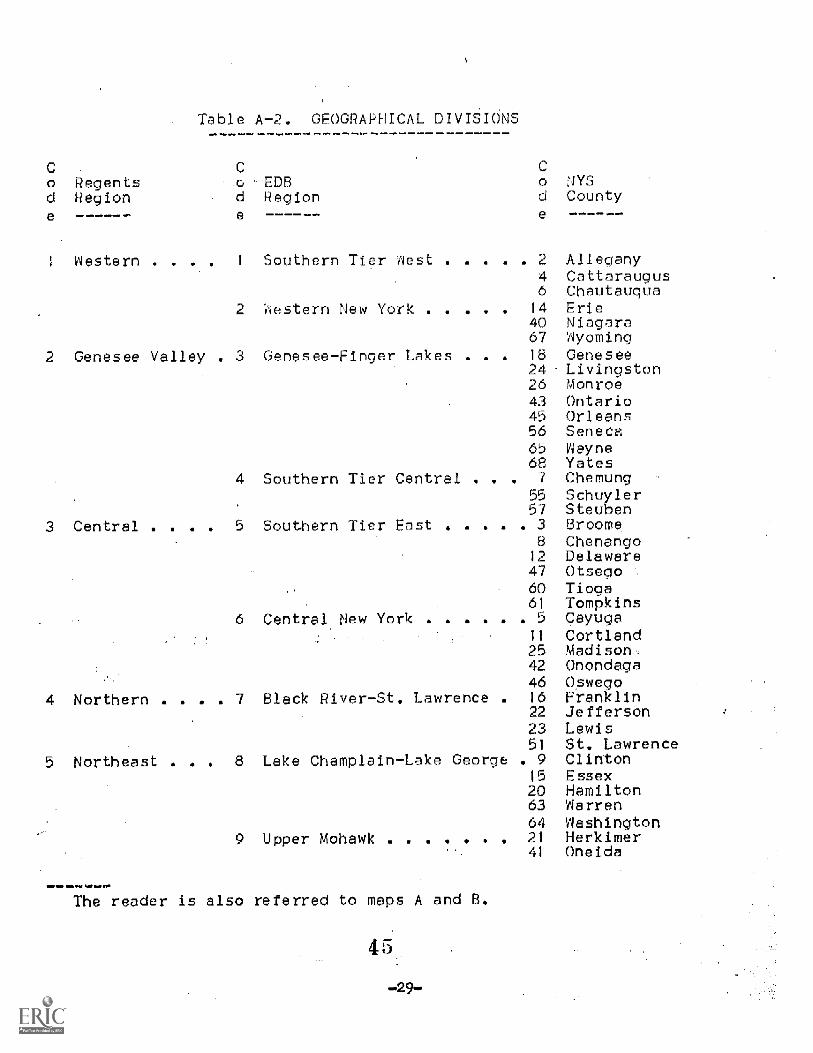
Table A-2 GEOGRAPHICAL DIVISIONS
o Regents EDB o NYSd Region d Region d County
_ern . 1 Southern Tier Aest 2 Alleaany4 Cattaraugus6 Chautauqua
=tern New York 14 Erie40 Niagara67 Ayoming
2 Genesee Valley . 3 GeneseeFinger Lakes . 18 Genesee24 Livingston26 Monroe43 Ontario45 Orleans56 Seneca65 Nayne68 Yates
4 Southern Tier Central . 7 Chemung55 Schuyler57 Steuben
Cen Southern Tier East Broome8 Chenango12 Delaware47 Otseao60 Tioga61 Tompkins
6 Central New Yo . . 5 Cayuga11 Cortland25 Madison_42 Onondaga46 Oswego
4 Northern . Black Rive St. Lawrence . 16 Franklin22 Jefferson23 Lewis51 St. Lawrence
5 Northeast . 8 Lake Ch plainLake George . 9 Clinton15 Essex20 Hamilton63 Warren64 Washington
9 Upper oha k . 21 Herkimer41 Oneida
The reader is 9150 referred to m_ps A and B.
4 5
C
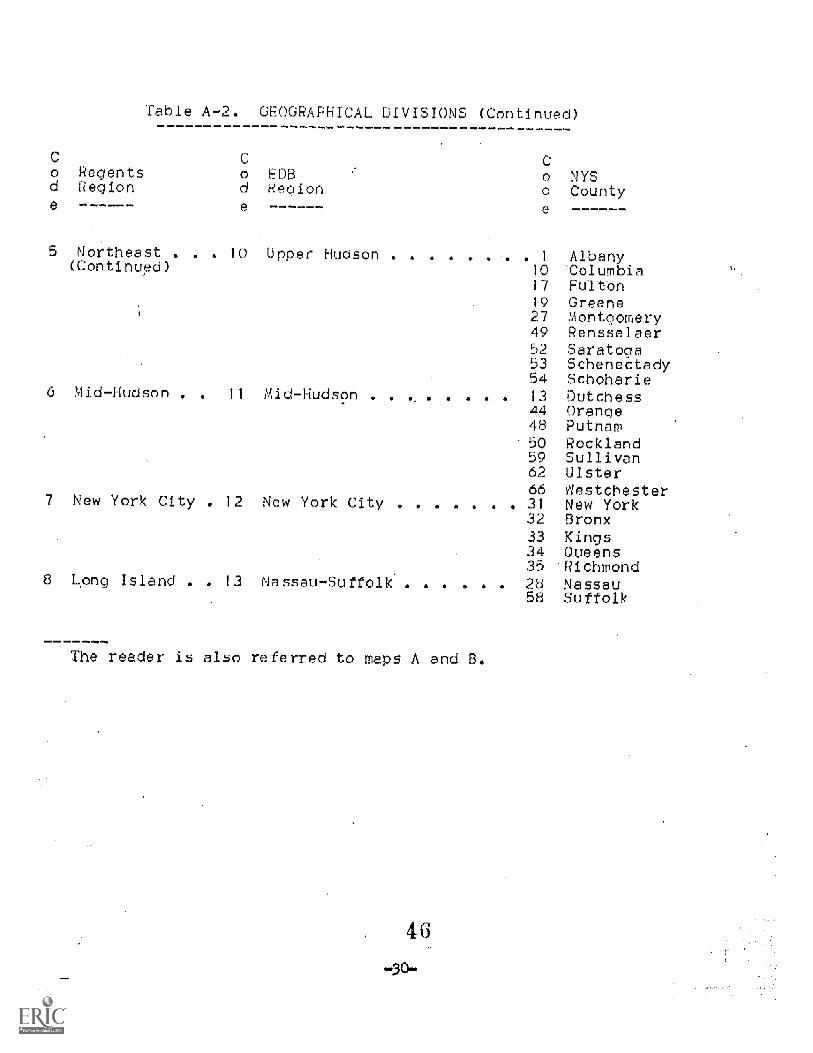
Table A-2. GEOGRAPHICAL DIVISI (Continued)
C. Co Regents o EDB o NYSd Region d Region a Countye---- e e
5 Northeast . . 10 Upper Hudson . . . 1 Albany(Continued) 10 'Columbia
17 FultOn19 Greene27 Montgomery49 Rensselaer52 Saratoga53 Schenectady54 Schoharie
6 iidHudson . . 11 Mid-Hudson . 13 Dutchess44 Orange48 Putnam50 Rockland59 Sullivan62 Ulster66 Westchester
New York City . 12 New York City . 0 0 * 0 & 31 New York32 Bronx33 Kings34 Queens35 Richmond
8 Long Island . . 13 Nassau-Suffolk. 28 Nassau58 Suffolk
The reader is also referred to maps A and B.

THE STATE PLANNING AND DEVELOPMENT REGIONS
LAKE CHAINLAKE GEC
_ESTERN
/Wog= ;
GENESEE-FINGER LAKES
CINIA/1
;
-UPPER MOHAWK
"4'4G VALLEY. ,CENTRAL
-- 4 MADISON
SOUTHERN TIER WEST . ...SOUTHERN TIER
CENTRAL
.. matt_ i.j cat =
Map B. gp Economic Development REGIONS
4 9
ofiAlvmTI
Not
50
EDB Region
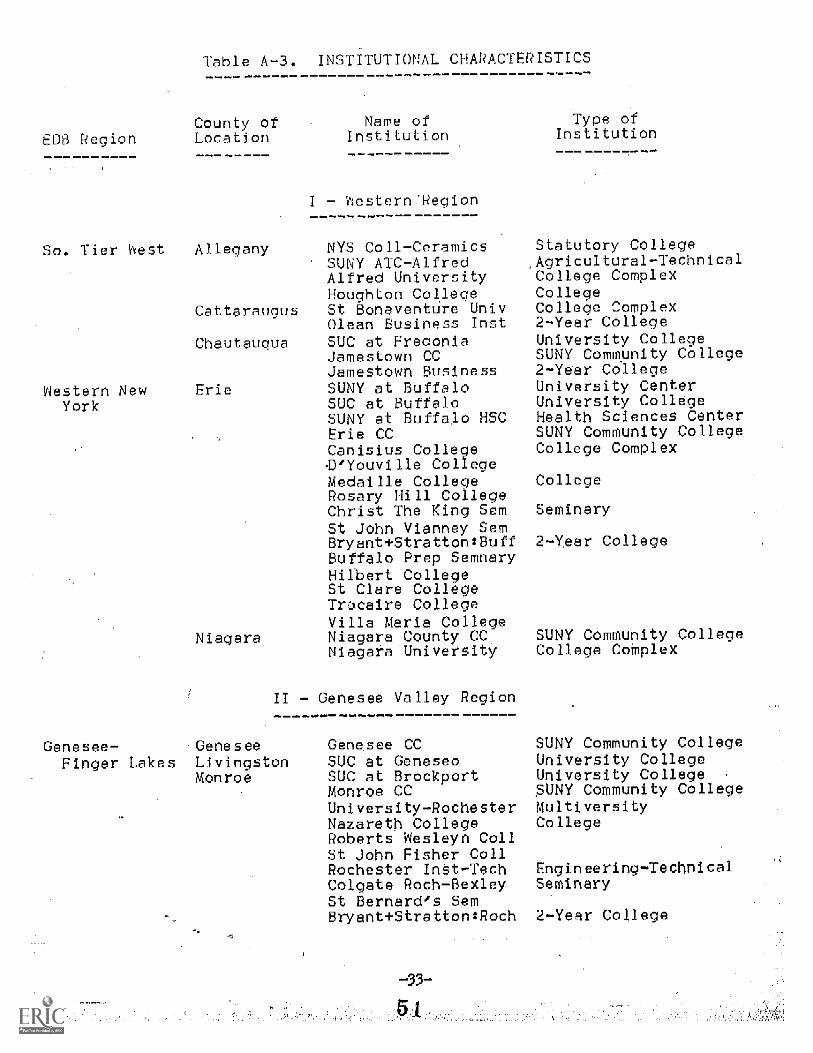
Table A-3. INSTiTUTIONAL CHA ACTERISTICS
County ofLocation
Name ofInstitution
I Vestern 'Region
So. Tier hest Allegany NYS CollCeramicsSUNY ATCAlfredAlfred UniversityHoughton College
Cattaraugus St Bonaventure UnivOlean Business Inst
Chautauqua SUC at FredoniaJamestown CCJamestown Business
Nestern New Erie SUNY at BuffaloYork SUC at Buffalo
SUNY at Buffalo HSCErie CCCanisius College-D'Youville CollegeMedaille CollegeRosary Hill CollegeChrist The King SemSt John Vianney SemBryant+Stratton:BuffBuffalo Prep SemnaryHifbert CollegeSt Clare CollegeTrocaire CollegeVilla Maria College
Niagara Niagara County CCNiagara University
II Genesee Valley Region
Genesee -GeneseeFinger Lakes Livingston
Monroe
Genesee CCSUC at GeneseoSUC at BrockportMonroe CCUniversityRochesterNazareth CollegeRoberts Wesleyn CollSt John Fisher CollRochester InSt7TechColgate Roch.-.BexleySt Bernard's SemBryant+Stratton:Roch
33
Type ofInsti ution
Statutory College,Agricultural7TechnicalCollege ComplexCollegeCollege Complex2Year CollegeUniversity CollegeSUNY Community College2Year CollegeUniversity CenterUniversity CollegeHealth Sciences CenterSUNY Community CollegeCollege Complex
College
Seminary
2Year 'College
SUNY Community Col --eCollege CoMplex
SUNY Community CollegeUniversity CollegeUniversity CollegeSUNY Community Calle eMultiversityCollege
EngineeringTethnivalSeminary
2Year College
EDB Region
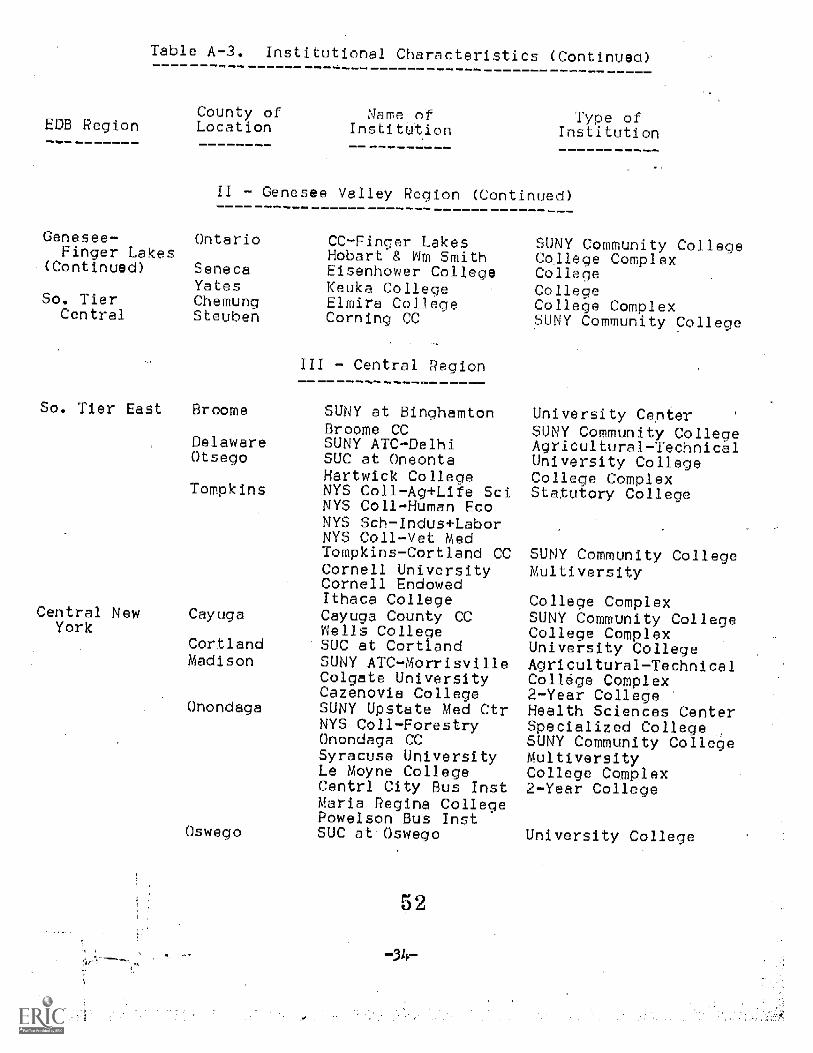
Table A-3. Institutional Characteristics (Continued)
County ofLocation
.me ofInstitution
Type ofInstitution-----------
Genesee-
II -
Ontario
Genesee Valley Region ( ontinued)
CC-Finger _ekes SUNY Community CollegeFinger Lake- Hobart & Wm Smith College Complex(Continued) Seneca Eisenhower College College
Yates Keuka College ColleoeSo. Tier Chemung Elmira College Colle6e ComplexCentral Steuben Corning CC SUNY Community Colle e
Tier East Broome
DelawareOtsego
Tompkins
Central NewYork
Cayuga
CortlandMadison
Onondaga
Osw ego
III - Central Region
SUNY at BinghamtonBroome CCSUNY ATC-DelhiSUC at OneontaHartwick CollegeNYS Coll-Ag+Life SciNYS Coll-Human EcoNYS Soh-Indus-I-LaborNYS Coll-Vet MedTompkins-Cortland CCCornell UniversityCornell EndowedIthaca CollegeCayuga County CCWells College
-SUC at CortlandSUNY ATC-MorrisvilleColgate UniversityCazenovia CollegeSUNY Upstate Med CtrNYS Coll-ForestryOnondaga CCSyracuse UniversityLe Moyne CollegeCentrl City Bus lnstMaria Regina CollegePowelson Bus InstSUC at Oswego
5 2
University CantersuNY Community CollegeAgricultural-TechnicalUniversity CollegeCollege ComplexStatutory College
SUNY Community CollegeMultiversity
College ComplexSUNY Community CollegeCollege ComplexUniversity CollegeAgricultural-Technical,College Complex2-Year CollegeHealth Sciences CenterSpecialized CollegeSUNY Community CollegeMultiversityCollege Complex2-Year College
Universi y College

EDB Region
Table A-3. Institutional Characteristics (Continued)
County ofLocation
Name ofInstitution
IV - Northern Region
Black River- Franklin Paul Smith's Coll
St. Lawrence Jefferson Jefferson CCSt. Lawrence SUC at Potsdam
SUNY ATC-CantonSt Lawrence UnivVadhams HallClarkson College
. Mater Dei College
L. Champlain- ClintonL. George.
EssexINarrenHerkimer
Oneida-
:Upper Mohawk
Upper Hudson Albany
GreeneMontgomeryRensselaer
V - Northeast Region
Type ofInstitution
2-Year CollegeSUNY Community CollegeUniversity CollegeAgricultural-TechnicalCollege ComplexCollegeEngineering-Technical2-Year College
SUC at Plattsburgh University CollegeClinton CC SUNY Community, College
North Country CC SUNY Community CollegeAdirondack CC SUNY Community CollegeHerkimer County CC SUNY Community College
Holy Trinity Seminry SeminarySUC at Utica/Rome University CollegeMohawk Valley CC SUNY Community CollegeHamilton College College ComplexKirkland College CollegeSyracuse-Utica CollUtica Sch-Commerce 2-Year CollegeRegents Ext Dea Prog Public-SpecialSUN? at Albany Universi-ty Center
College of St Rose CollegeSiena CollegeAlbany Law School Specialized College
Albany Coll-Pharmacy Health Sciences CenterAlbany Medical CollAlbany Business Coll 2-Year College
LaSalette SeminaryMaria College-AlbanyColumbia-Greene CC SUNY Community CollegeFulton-Montgomery CC SUNY Community CollegeHudson Valley CC SUN? Community College
Russell Sage College College ComplexRensselaer Poly lnst Engineerino-TechnicalImmclte Concptn-Troy SeminarySt Anthony-on-Hudson
5 3
-35-
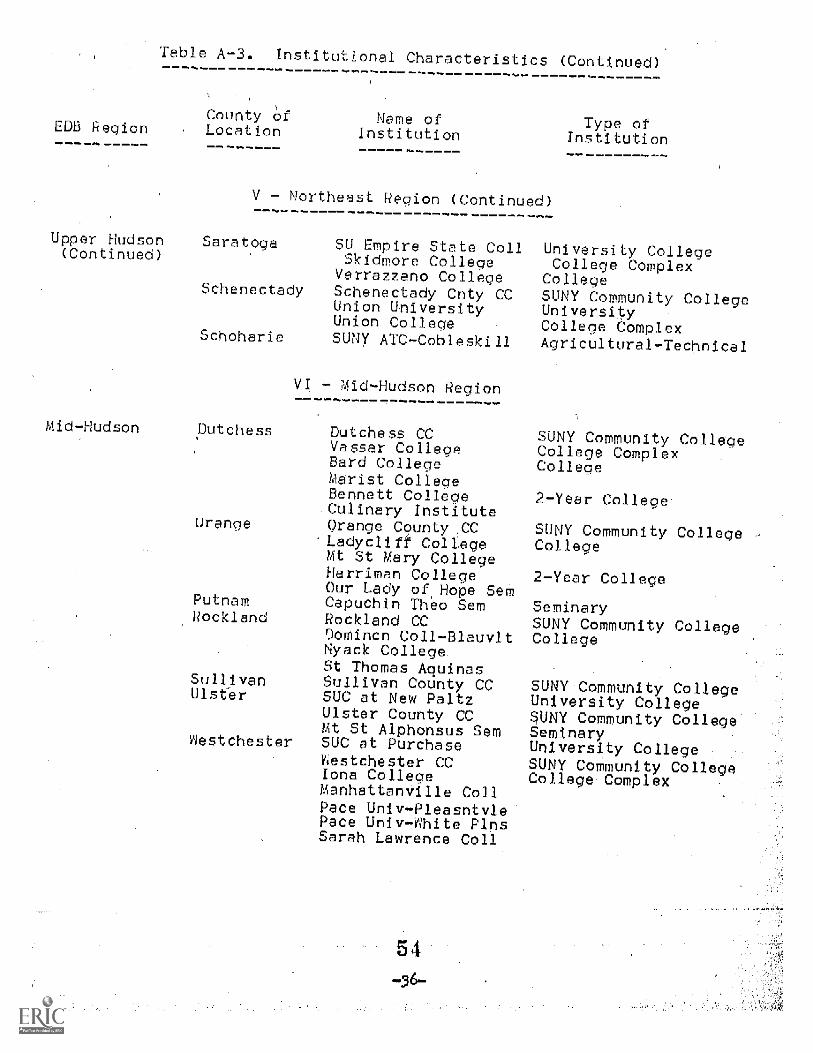
Table A-3. In- i-utional Characteristics (Continued)
EDB Region----------
Upper Hudson(Continued)
Mid-Hudson
,
County orLocation
Name OfInstitution
V - Northeast Region (Continued)
Saratoga SU Empire State CollSkidmore College
Verrazzano CollegeSchenectady Schenectady Cnty CC
Union UniversityUnion College
Schoharie sny ATC-Cobleskill
VI - :-Hudson Region
putchess Dutchess CCVassar CollegeBard CollegeMarist CollegeBennett CollegeCulinary Institute
orange Orange CountyCC'Ladycliff CollegeMt,St Mary CollegeHarriman CollegeOur Lady of, Hope Sem
Putnam Capuchin Theo SemRockland Rockland CC
Domincn Coll-BlauvitNyack CollegeSt Thomas Aquinas
Sullivan Sullivan County CCUlst-er SUC. at New Paltz
Ulster County CCMt St Alphonsus Sem
Aestchester SUC at PurchaseNestchester CCIona CollegeManhattenVille CollPace Univ-PleasntviePace Univ-Ahite PinsSarah Lawrence Coll
5 4
Type ofInstitution
Ims
Universiry CollegeCollege Complex
CollegeSONY Community CollegeUniversityCollege ComplexAgricultural-Technical
SUNY Community CollegeCollege ComplexCollege
2-Year College
SUNY Community CollegeCollege
2-Year College
SeminarySUN't Community CollegeCollege
SUNY Community CollegeUniversity CollegeSUNY Community CollegeSeminaryUniversity CollegeSUNY Community ColleCollege Complex

EDB 1-iegion
Mid-Hudson(Continued)
Table A-3. Institu
County ofLocation
onal Characteristics (Continued)
Name ofInstitution
VI - lAid-Hudson (Continued)--_-_-_-_-_-_-_-_-_-_-_-___
viestchester(Continued)
New York City Bronx
Kings
Briarcliff C IlegeCollege-New RochelleCollege-Ahite PlainsConcordia CollegeKing's CollegeMarymount CollegeMercy CollegeMaryknoll SeminaryRogers CollegeSt Joseph's Sem+CollSt Vladimir's SemBerkeley SchoolElizabeth Seton Coil
VII - New York City
SUNY Mar-time CollegeHerbert Lehman CollBronx CCHostos CCFordham UniversityManhattan CollegeColl-Mt St VincentMonroe Business InsSUNY Downstate MedclBrooklyn CollegeMedgar Evers CollegeKingsborough CCNew York City CCLIU-Brooklyn CenterSt Francis CollegeSt Joseph's CollegePolytechnic Inst-NYPratt InstituteBrooklyn Law SchoolBrklyn Coll-PharmacyBoricua CollegeInst-Design+ConstrctPacker Coll Inst
5 a
-37-
Type oInstitution
Ilege
Semina-y
2-Year College
Specialited CollegeCUNY Senior CollegeCUNY Community College
UniversityCollege Com lexCollege2-Year CollegeHealth Sciences CenterCUNY Senior College
CUNY Community College
UniversityCollege
Engineering-Technical
Specialized CollegeHealth Sciences Ceh er2-Year College

Table A-3. Institutional Characteristics (Continued)
EDB Region_
New York City(Continued)
County ofLocation
V
lew Yor
Name ofInstitution
- New York City (Continued)
State Coll-OptometryFashion Inst-TechUrad Sch & Univ CntrBernard Raruch CollCity ColleneHunter CollegeJohn Jay CollegeBorough-itanhattan CCColumbia UniversityNew York UniversityYeshiva UniversityBarnaro CollegeNew School Soc ResPace UniversityPace Univ-New YorkFinch CollegeMarymt Manhattn ColSchool-Visual ArtsTouro UniversityCooper UnionNYIT-Metro CenterBank Street CollegeColl of InsuranceJuilliard SchoolManhattan Sch-MusicMannes Coll of MusicMills Coll-EducationNY Law SchoolParsons Sch-DesignTeachers CollegeColl-Phrmacuticl SciCornell Medical CollMt Sinai Sch-MedicneNY Coll-Podiatrc MedNY Medical CollegeRockefeller Univ
5 6
8-
-
Type ofInstitution
Specialized CollegeSUNY Cgmmunity CollegeCUNY Graduate SchoolCUNY Senior College
CUNY Conmunity CnlleqeMultiversity
UniversityCollege Complex
College
Engineering-Technical
Specialized College
Health Sciences Center

EDB Region,
Table A-3 Institutional Characteristics (Continued)
County ofLocation
Jame ofInstitution
VII - New York City (Continued)
New York City New York(Continued) (Continued)
Queens
Richmond
Auburn Theolo_cl SemGenII,Theologicl SemHebrew Union CollegeInst for Advcd StudyJewsh Theologicl SemNY Theological SemRabbi Isaac ElchananUnion Theologicl SemWoodstock CollegeAcademy Dramatic ArtBrkly-Claremont:NnColl Human ServicesCollegiate InstituteInterbcro instituteKatharine Gibbs SchLaboratory Inst-MdseNY Institute-FinanceTaylor Business InstTechncl Career InstsTobe-Cohurn SchoolVoorhees Tech lnstWood SchoolQueens CollegeYork CollegeLa Guardia CCQueensborough CCSt John's UniversityCathedral CollegePassionst Monstc SemAcademy-AeronauticsRichmond CollegeStaten Island CCWagner CollegeNotre Dame-Staten Is
57
Type ofinstitution
Seminary
2-Yea_ College
CUNY Senior College
CUNY Community College
UniversitySeminary
2-Year CollegeCUNY Senior CollegeCUNY Community CollegeCollege ComplexCollege

EDB Region
Table A-3. Institutional Characteristics (Continued
County ofLocation
Nassau-S_ folk Nassau
Suffolk
Name ofInstitution
V II - Long Island Reoion-------- 4-
SUC at Old NestburySUNY ATC-FarminodaleNassau CCAdelphi UniversityHofstra UniversityLong Island UnivLIU-C.K.Post CollMolloy CollegeNY Inst-TechnologyNYIT-Old Nestburyebh Inst-Naval Arch
George Mercer SchoolAdelphi Business SchBrkly-Claremont:HickFive Towns CollegeSUNY at Stony BrookSUNY at Stny Brk HSCSuffolk County CCLIU-Southampton CollDowling CollegeFriend's Norld CollBrentwood CollegeSem-Imac-Con-Rockyle
5 8
40--
Type ofInstitution
University CollegeAgricultural-TechnicalSUNY Community CollegeUniversity
CollegeEngineering-Technical
Seminary2-Year College
University CenterHealth Sciences CenterSUNY Commun,ity CollegeUniversityCollege
Seminary
APPENTIX B
S ecific Inst u lanai Data
69
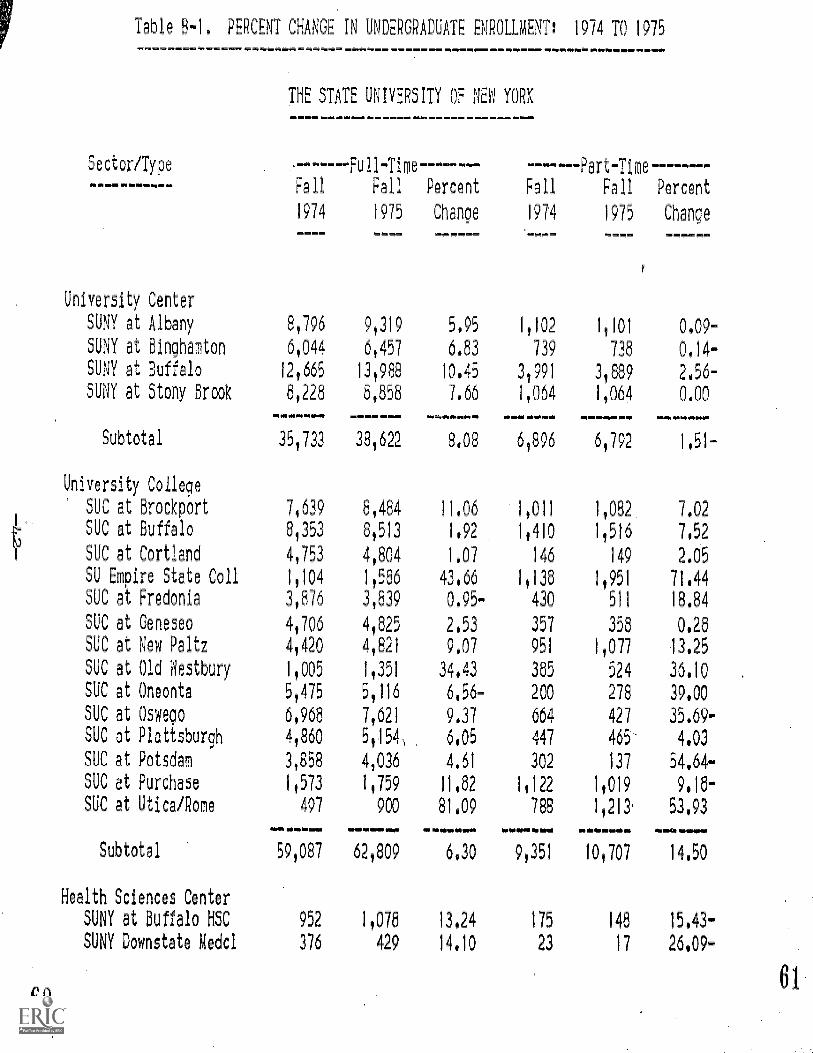
Table 8-1. PERCENT CHANGE IN UNDERGRADUATE ENROLLMENT: 1974 TO 1975
Sector/Type
University Center
SUNY at Albany
SUNY at Binghamton
SUN? at 3uffalo
SUNY at Stony Brook
Subtotal
University College
SUC at Brockport
5U0 at Buffalo
SUC at Cortland
SU Empire State Coll
SU0 at Fredonia
SUC at Geneseo
SUC at New Paltz
SUC at Old hstbury
SVC at Oneonta
SU0 at Oswego
SU0 at Plattsburgh
SUC at Potsdam
SUC at Purchase
SUC at Utica/Rome
Subtotal
Health ScienCes Center
SUNY at Buffalo HSC
SUNY Downstate Medd:
THE STATE UNIVERSITY OF ND YORK
F_ ll-Time-------
Fall Fall
1974 1975
8,796 9,319
6,044 6,457
12,665 13,988
8,228 8,858
mmiammmmm
35,733 381622
7,639 81484
8,353 8,513
4 753 4,804
1,104 1,586
3 876 3-839
4,706 4,825
4,420 41821
1,005 11351
5 475 5,116
60968 7,621
4,860 5,154,
3,858 4,036
1,573 11759
497 900
_-____. ______
591087 62,809
952 1,078
376 429
Percent Fall
Change 1974
5.95 1,102
6 83 739
10.45 31991
7 66 1,064
8,03 61896
11.06 1,011
1.92 1,410
1007 146
43.66 1 138
0.95- 430
2,53 357
9007 951
34.43 385
6.56- 200
9,37 664
, 6,05 447
4,61 302
1182 1,122
81,09 788
w-
6 30 91351
Fall Percent
1975 Change
1 101 0.09-
738 0.14-
31889 2.56-
1,064 0.00
6,792 1051-
11082, 7.02
1 516 7052
149 2.05
1,951 71.44
511 18,84
358 0.28
1 077 13025
524 36,10
278 39.00
427 35.69-
465- 4.03
137 54,64-
11019 9.18-
11213 53,93
10,707 14.50
13,24 175 148 15043-
14.10 23 17 26009-

62
Table 8-1, Change in Undergra uat Enrollment (Continued)
Sector/Type ---r---Full-Time-----
1974 1975 Chance 1974
Si
SUNY at Stny Brk FSC 512 560 9.38 11
SUNY Upstate Mec Ctr 341 384 12,61 21
Subtotal .2181 2,451 12,38 230
Specialized College
NYS Coll-Forestry 1,712 1,792 4,67 231
SUNY gartime College 756 335 1Q,45 1
Subtotal 2 468 2,627 6.44 232
Statutory College
NYS Coll-Agilife Sci 2.826 2,929 3,64 0
NYS Coll-Ceramics 445 478 7.42 40
HYS'Coll-liuman Eco 1,150 1 126 2,09-
NYS Sch-Indus+Labor 603 592 1.82
EmmeW.
Subtotal 5,024 5,125 2.01 40
Agricultural & Technical College
SUNY ATC-Alfred 3,941 4,086 3,66 259
SUNY ATC-Canton 2,296 2,402 ..62 329
SUP ATC-Cobleskill 2,530 2,600 2,77 129
SUNY ATC-Delni 2,283 2,559 12,09 300
SUNY ATC-Farmingdale 7,040 6,793 3 51- 5,931
SUNY ATC-Morrisville 2,626 2,657 1,18 334
Subtotal 20 716 21,097 1 84 7,282
Community College
Adirondack CC 890 1,025 15.17 675
roome CC 2 413 2,724 12.89 1,674
Cayuga County CC 1 577 1 704 8.05 1 454
_
1975 Change
-MS
33 200,00
17 19,05-
215 6,52-
243 5.19
2 100.00
245 5.60
0 0000
33 17.50-
0 0.00
515 0000
aiemeimMgi
546 1 70.00
300 15,83
432 31.31
161 24,81
196 34,67-
6 849 15.48
394 17.96
8,332 14 i2
2,493 269.83
2,029 8.27
1,602 10.18
63

Table B-10 Change in Undergraduate Enrollment (Continued)
Sector/Type
Clinton CC
Columbia-Greene CC
a-Finger Lakes
Corning CC
Dutchess CC
Erie CC
Fashion Inst-Tech
Fulton-Montgomery CC
Genesee CC ,
Herkimer County CC
Hudson Valley CC
Jamestown CC
Jefferson CC
Mohawk Valley CC
Monroe CC
Nassau CC
Niagara County CC
North Country CC
Onondaqa CC
Orange County CC
Rockland CC
Schenectady Cnty CC
Suffolk County CC
Sullivan County CC
Tompkins-Cortland CC
Ulster County CC
Nestehester CC
Subtotal
TOTAL STATE UNIVERSITY
64
-7.al! pj.m
-------Full-Time--------
1974 1975 ChangeMI in WIENI
wa.
1974
MMrirM
B.GMMIMEnin
1975
433 659 52,19 568 617
312 552 76,92 454 470
782 1,129 44.37 1,014 1,041
1 699 2 100 23.60 550 749
2,341 2,570 9,76 2,516 2,853
5,687 6,162 8,35 4,062 4,943
21337 2,663 13,95 3,558 3 912
935 1,093 16.90 543 608
1 379 1,716 24,44 807 079
949 1,115 17,49 262 324
4,712 4,828 2.46 1,859 2,178
1 427 1 724 20,81 1,369 1,543
857 991 15,64 507 533
2,580 3,131 21.36 3,000 31455
4,861 5,498 13,10 4,402 41800
10 120 10,144 0,24 7 421 7,411
2,673 3,170 18.59 1,255 1,481
564 602 20092 436 593
2,702 3,016 11062 2,559 21799
1,921 2,502 30024 2,212 21751
3 088 3,967 28.47 41043 4,314
796 954 19 85 1,734 1.970
7,499 0,735 16,48 7,511 9,802
4346 1,403 4.23 292 337
894 1 224 36,91 1,175 1 578
1,255 1 566 24.78 1,053 1,237
3,528 4,314 22.28 3,773 4,244
--
72,557 83,061 14,48 63,230 73,554
197 766 215,792 9-11 87,269 100,393
Change
8,63
3.52
2.66
11.08-
13.39
21,69
9,95
11.97
8,92
23.66
17.16
12,71
5.13
15.17
9022
0.13-
18.01
36001
9,38
24.37
6,70
13061
30,50
15041
34,30
17047
12.48
16.31
Ftfi amimpar.
15.04
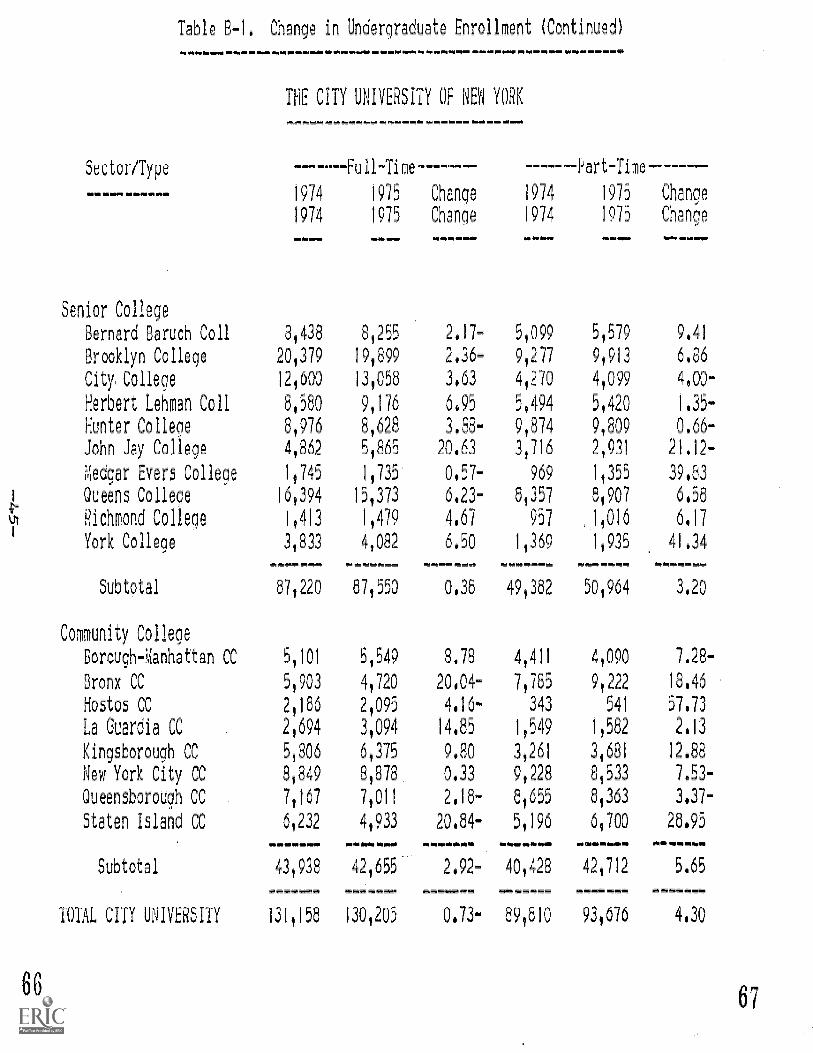
Table 8-1. Change in Undergraduate Enrollment (Continued)
Sector/Type
Senior College
ernard Baruch Coll
Brooklyn College
City, College
Herbert Lehman Coll
Hunter College
John Jay College
;.liedoar Evers College
Queens College
Richmond College
York College
Subtotal
Community College
Borough-Manhattan CC
Bronx CC
Hostos CC.
La Guardia CC
Kingsborough CC
New York City CC
Queensborough CC
Staten Island CC
Subtotal
TOTAL CITY UNIVERSITY
66
____E,!!ERRIMNPAR*LO
ThE CITY UNIVERSITY OF NB YORK
-------Full-Time--------
1974 1975 Change 1974 1975 Change
1974 1975 Change 1974 1975 Change
8 438 8,255 2017- 5,099 5,579 9,41
20,379 19,899 2 36- 9 277 9,913 6 86
12000 13,058 3 63 4,270 4,099 400°-
8,580 9,176 6.95 5.494 5,420
8,976 8,628 3.88- 9,874 9,809 0.66-
40862 5,865 20.63 3,716 2,931 21,12-
1,745 1,735' 0057- 969 1,355 39.83
16,394 15,373 6.23- 8,357 8,907 6.58
1,413 1,479 4.67 957 ,J,016 6,17
3,833 4,082 MC 1 369 1,935 41.34m,,
87,220 87,550 0.38 49,382 50,964 3.20
5 101 5,549 8.78 4,411 41090 7.28-
5,903 4,720 20,04- 7,785 9,222 18.46
2,186 2,095 4.16- 343 541 57,73
2,694 3,094 14.85 1,549 1,582 2.13
5,806 6,375 9.80 3,261 3,681 12.88
81849 8,878 0.33 9,228 8,533 7.53-
7,167 7,011 2.18- 8,655 8,363 3.37-
6 232 4,933 20.84- 5,196 6,700 28.95
43,938 42,655 2,92- 40,428 42,712 5.65
131,158 130,205 0.73- 89 810 93,676 4.30
67
Sector/Type
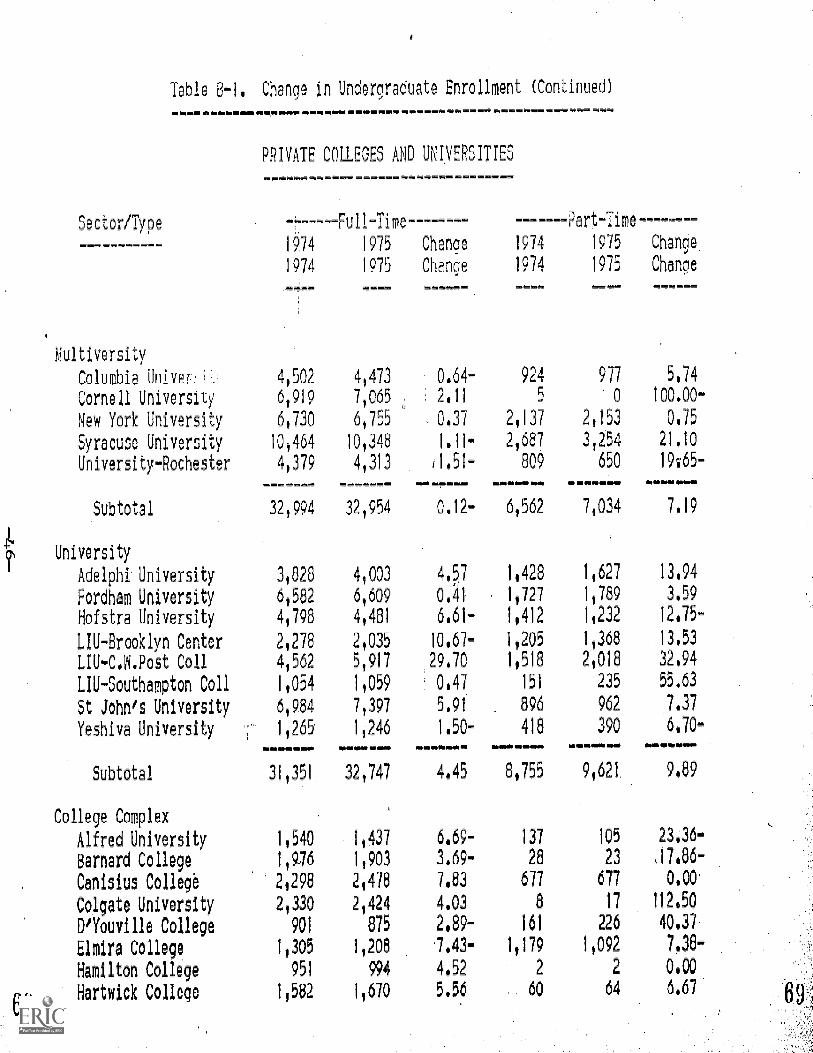
Table 8-1. Change in Underoraduate Enrollment (Continued)
PRIVATE COLLEGES AND UNIVERSITIES
------Full-Time------ Part-Time--------
1074
1974
Multiversity
Columbia Univeri. 40502
Cornell University 6,919
New York University 6,730
Syracuse University 10,464
University-Rochester 40379
Subtotal 32,994
University
Adelphi University 3,828
Fordham University 6,582
Hofstra University 4,798
LIU-Brooklyn Center 2,278
LIU-C.N.Post Coil 4,562
LIU-Southampton Coll 1,054
St John's University 6,984
Yeshiva University 1,265'
Subtotal 31,351
College Complex
Alfred University 1,540
Barnard College 1,976
Canisius College 2,298
Colgate University 2,330
D'Youville College 901
Elmira College 1,305
Hamilton College 951
Hartwick College 1,582
1975 Change
1975 Charm
4,473 0.64-
7,065 2.11
6,755 . 0.37
10,348 1.11-
4,313 [1.51-
32,954 0.12-
4,003 4.57
6,609 0.41
4,481 6.61-
2,035 10.67-
5,917 29.70
1,059 0.47
7,397 5.91
1,246 1.50-
32,747 4.45
1,437 6.69-
1,903 3.69-
2,478 7.83
2,424 4.03
875 2.89-
1,208 '7.43-
994 4.52
1,670 5.56
1974
1974
924
5
2,137
2,687
809
mftft.o4
6,562
1,428
1,727
1,412
10205
1,518
151
896
418=.=MI=Mi
8,755
1975 Char*.
1975 Change
977 5.74
0 100.00-
2,153 0.75
3,254 21.10
650 19165-
6E%
7,034 7.19
1,627 13.94
1,789 3.59
1,232 12.75-
1,368 13.53
2,018 32.94
235 55.63
962 7.37
390 6.70-
9,621 9.89
137 105 23J6-
28 23 ,17.86-
677 677 0.00'
a 17 112.50
161 226 40.37.
1,179 1,092 7,38.-
2 2 0.00
60 64 6.67
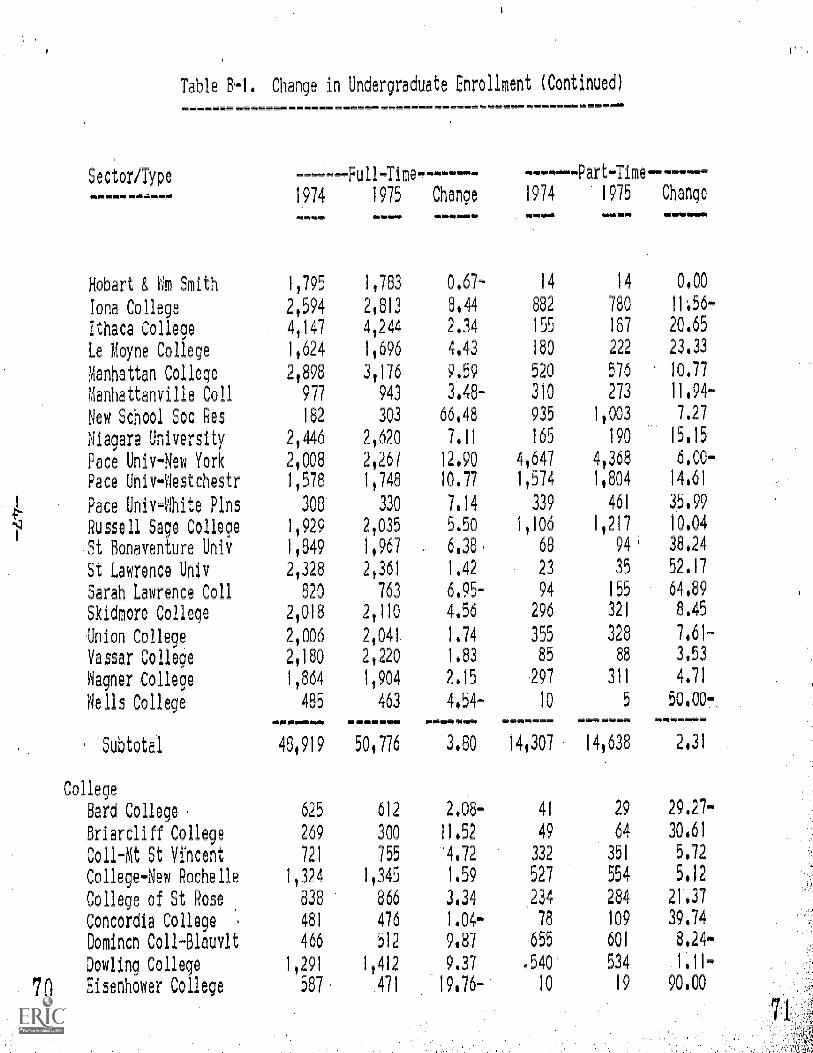
Table 8-1. Change in Undergraduate Enrollment (Continued)
Sector/Type
Hobart & Km Smith
Iona College
Ithaca College
Le Moyne College
Manhattan College
Manhattanville Coll
New School Soc Res
Niagara University
Pace Univ-New York
Pace Univ-Kestchestr
Pace Univ-Khite Pins
Russell Sage College
St Bonaventure Univ
St Lawrence Only
Sarah Lawrence Coll
Skidmore College
Union College
Vassar College
Nagner College
Neils College
Subtotal
-------Full-Timer------- -------Part-Time--------
1974 1975 Change 1974 1975 Change- WMimft
1-795 1,763 0.67- 14 14 0.00
2,594 2.813 8.44 882 760 11..56-
4,147 4,244 2.34 155 167 20.65
1,624 1,696 4.43 lao 222 23.33
2,898 3,176 9 59 520 576 10.77
977 943 3.48- 310 273 11.94-
'82 303 66.48 935 1 003 7.27
2,446 2,620 7.11 165 190 15,15
2,008 2,267 12,90 4,647 4,368 6,00-
1,578 1,748 10.77 1,574 1,804 14.61
308 330 7.14 339 461 35.99
1 929 2,035 5.50 1,106 1,217 10.04
1,849 1 967 6.38 68 94 38.24
2,328 2.361 1.42 23 35 52.17
820 763 6-95- 94 155 64,69
2 018 2,110 4.56 296 321 8.45
2,006 2,041, 1.74 355 328 7.61-
2,180 2,220 1.83 85 88 3.53
1,864 1,904 2415 ,297 311 4.71
485 463 4.54- 10 5 50.00,
....... ....... ._.....
48,919 50.776 3.60 14,307 14,638 2.31
College
Bard College 625 612 2.06- 41 29 29.27-
Briarcliff College 269 300 11.52 49 64 30.61
Coll-Mt St Vfncent 721 755 -4.72 332 351 5.72
College-New Rochelle 1-324 1 345 1.59 527 554 5.12
College of St Rose 838 866 3.34 ,234 284 21437
Concordia College 481 476 1404- 78 109 39.74
Dominon Coll-Bleuvlt 466 512 9.87 655 601 8,24-
Dowling College 1,291 1,412 9.37 .540' 534 1.11-
70 Eisenhower College 587 471 19 7' 10 19 90.00
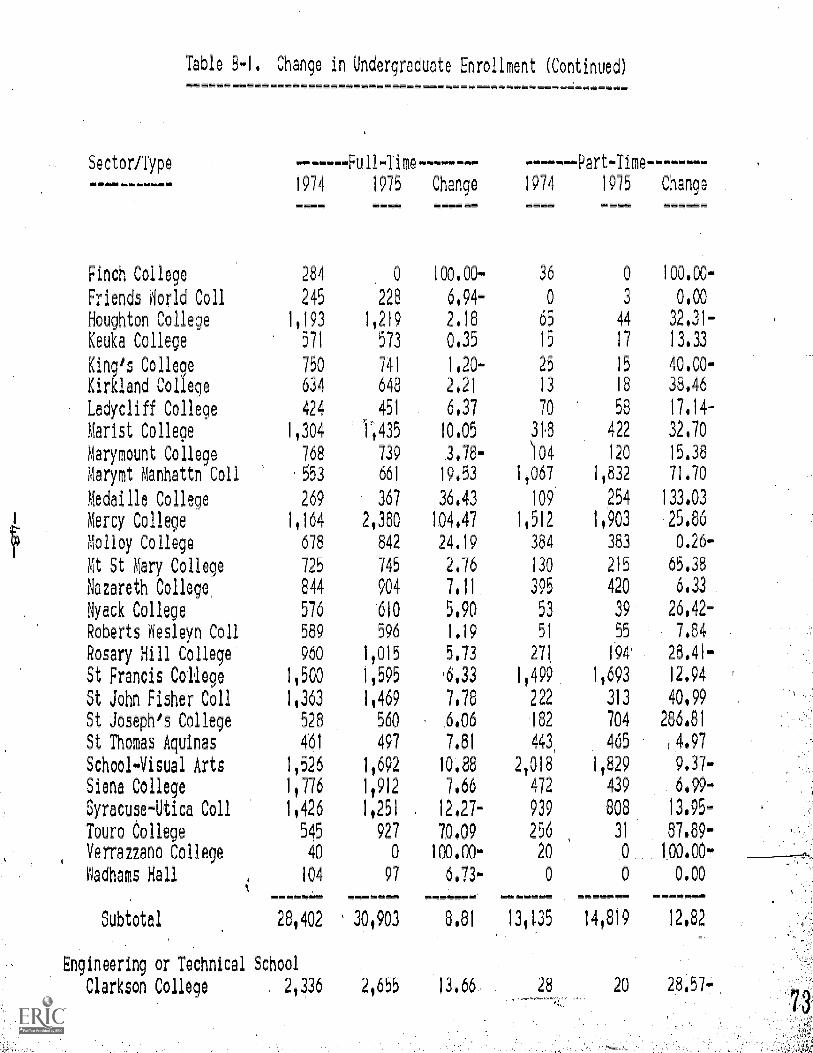
Table 6-1. Chan a in Undergraduate Enrollment (Continued)
Sector/Typemmm,mnia....mam
. _
1974 1975 Change
mmmmmm
1974
m
1975 ChangeMMMM
Finch College 284 0 100.00- 36 0 100.00-
Friends iiorld Coll 245 228 6.94- 0 3 0.00
Houghton College 1 193 1,219 2.18 65 44 32.31-
Keuka College 571 573 0.35 15 17 13 33
King's College 750 741 1 20- 25 15 40.00-
Kirkland Coliege 634 648 2.21 13 18 38.46
Ladycliff College 424 451 6.31 70 58 17.14-
Marist College 1 304 1035 10.05 31.8 422 32.70
Marymount College 768 739 3.78- )04 120 15.38
Marymt Manhattn Coll 553 661 19.53 1,067 1,832 71.70
Medaille College 269 367 36.43 109 254 133.03
Mercy College 1,164 2,380 104.47 1,512 1 903 25.86
Molloy College 678 842 24.19 384 383 0.26-
Mt St Mary College 725 745 2.76 130 215 65.38
Nazareth College, 844 904 7.11 395 420 6.33
Nyack College 576 610 5.90 53 39 26.42-
Roberts Osleyn Coll 589 596 1.19 51 55 7.84
Rosary Hill College 960 1,015 5.73 271 194 28.41-
St Francis College 11500 1 595 6 33 1,499 1,693 12.94
St John Fisher Coll 1 363 1 469 7.76 222 313 40.99
St Joseph's College 528 560 6.06 182 704 286.81
St Thomas Aquinas 461 497 7.81 443, 465 14.97
School-Visual Arts 1,526 1,692 10.86 2,018 1,829 9.37-
Siena College 1,776 1,912 7.66 472 439 6.99-
Syracuse-Utica Coll 1,426 1 251 12.27- 939 808 13.95-
Tour° College 545 927 70.09 256 31 87.89-
Verrazzano College 40 0 100.00- 20 0 100.00-
Odhams Hell 104 97 6.1 0 0 0.00- MM m MSubtotal 28,402 30;903 8.81 13,1=35 14,819 12.82
Engineering or Technical School
Clarkson College 2036 2,655 13.66 28 20 28057
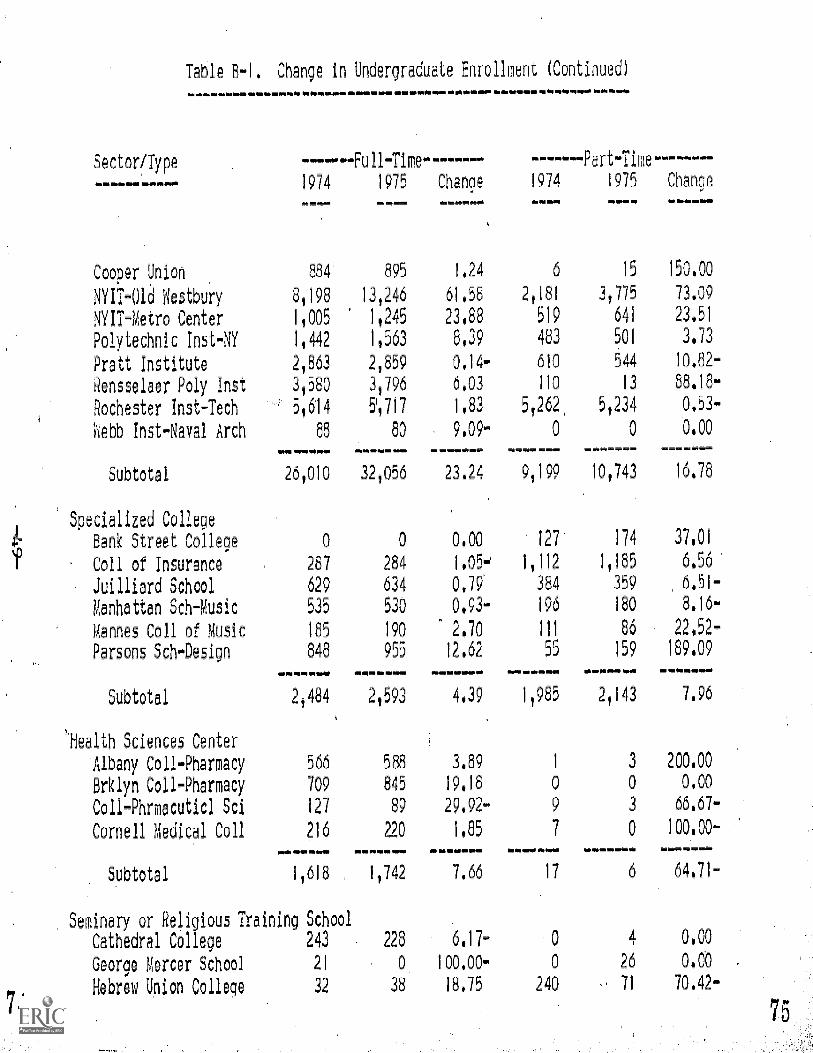
Sector/Type
Table 8-1. Change in Undergradu- e Enrollment (Continued)
1974Mir.AN
Cooper cinion 884
NYIT-Old Westbury 8,198
NYIT-Metro Center 1,005
Polytechnic Inst-NY 11442
Pratt Institute 2,863
Rensselaer Poly Inst 3,580
Rochester Inst-Tech 5,614
Webb Inst-Naval Arch 88
Subtotal
=mmm.mm
26,010
Specialized CollegeI
P. Bank Street College 0%.0
1 Coll of Insurance 287
Juilliard School 629
Manhattan Sch-Music 535
Mannes Coll of Music 185
Parsons Sch-Design 848
74
milMammm,
Subtotal 21484
'Health Sciences Center
Albany Coll-Pharmacy
Brklyn Coll-Pharmacy
Coll-Phrmecuticl Sci
Cornell Medical Coll
Subtotal
566
709
127
216
1,618
--Full-Time- PartTime--------
Seminary or Religious Training School
Cathedral College 243
George Mercer School 21
Hebrew Union College 32
1975 Change 1974
895 1-24 6
13,246 61.58 2 181
11245 23.88 519
1,563 8039 483
2,859 0,14- 610
3,796 6003 110
51717 1,83 5,262,
80 9.09- 0
32,056 23.24 9,199
0 0000 127
284 1.05- 11112
634 0,79 384
530 0.93- 196
190 2.70 111
955 12.62 55
2,593 4 39 1,985
588 3.89 1
845 19,18 0
89 29.92- 9
220 1,85 7
.i.mgminmFm
1,742 7,66 17
228 6.17- 0
0 100,00- 0
38 18,75 240
1975 ChanpeftmeliW2
15 150.00
3,775 73.09
641 23.51
501 3.73
544 10,82-
13 88,18-
5,234 0.53-
0 0,00
10,743 16,78
174 37,01
1 185 6.56
359 6.51-
180 8.16-
86 22.52-
159 189.09
2,143 7.96
3 200000
0 0,00
3 66.67-
0 100.00-
6 64.71-
4 0000
26 0.00
71 70.42-

Table 8-1. Change in Undergraduate Enrollment (Continued)
Sector/Type
1974 1975
Holy Trinity Seminry 28 40
Iclte Concptn-Troy 35 22'
Jewsh Nologicl Sem 144 131
NY Theological Sem 1 0
Rabbi ISaac Elchanan 0 0
St Bernard's Sem 0 0
St Joseph's Sem+Coll 0 0
St Vladimir's Sem 19 24
#ifmmbmm mmamme.
Subtotal 523 483
2-Year College
Academy-Aeronautics 546 933
Adelphi Business Sch 107 323
Albany Business Coll 410 443
Academy Dramatic Art 355 327
Bennett College 242 218
Brkly-Claremont:Hick 176 162
Brkly-Claremont:NYC 318 441
Berkeley School 568 685
Boricua College 0 74
Bryant+Stratton:Buff 1,661 1 688
Bryant+Stratton:Roch 0 238
Cazenovia College 306 331
Centr1 City Bus 1nst 306 1,276
Coll Human Services 114 200
Collegiate Institute 110 115
Culinary Institute 1,296 1,362
Elizabeth Seton Coll 383 655
Five Towns College 95 190
Harriman College., 125, 159
Hilbert College 416 423
Jnst-Design+Constrct 34 62
--------
Change
42.86
37,14-
9.03-
100.00-
0000
0.00
0.00
26.32
art-Time
1974 1975
0
62
3
83
23
0
34
Q
97
1
0
5
. ....... Amma=
7.65- 419
Change
100.00-
0,00
45016-
100000-
10.23
0.00
100.0°-
0000
238 43.20-
70086 204 165
201.87 0 136
645 L60 199
7.89- 150 0
9.92- 21 13
2.25 0 0
38.68 0 0
20.60 0
0.00 0 0
1 103 958 1,418
3
.8017 14 14
314,94 0 5
y 75.140 0
4.55 25 22
5009 0 0
71.02 176 122
100000 39 68
27.20 57 0
1.68, 136 151
82,35 171 123
9 31-
%0010.56
100,00-
38.10-
0-00
0.00
0.00
0400
48002
0.00
0,00
0.00
0.00
12.00-
0,00
30068-
74.36
100.00'
11,03
28-007r
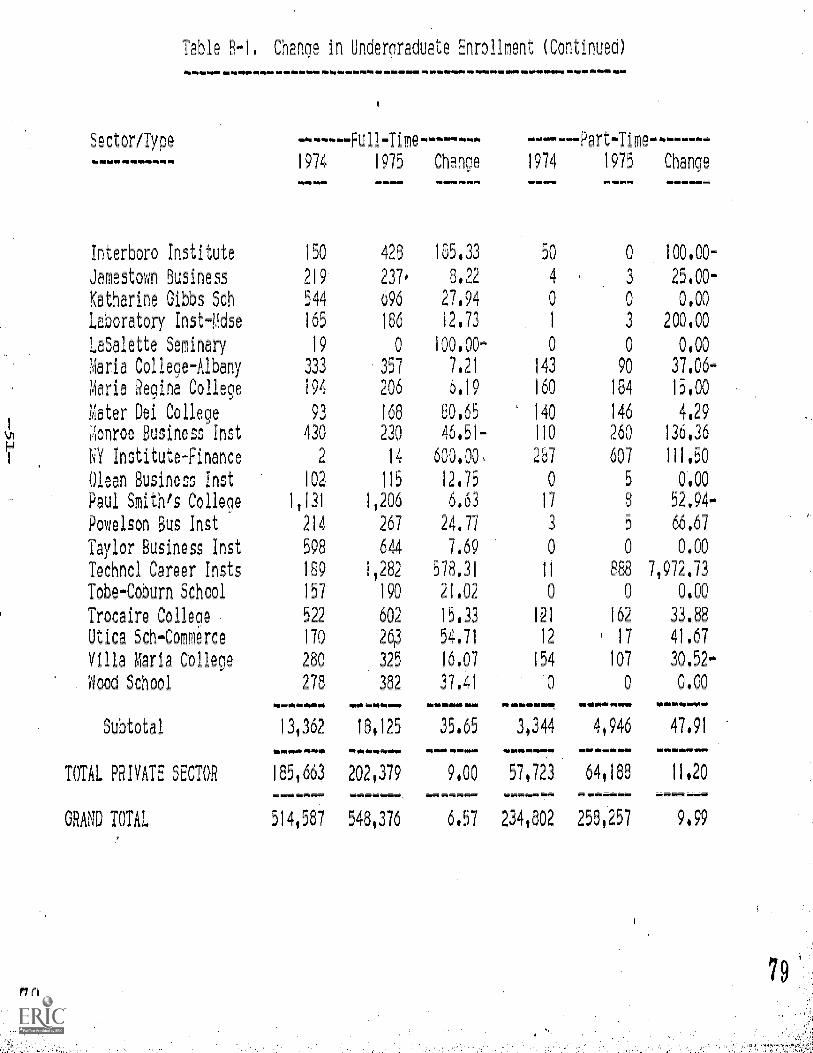
Table B-I Chne in Undergraduate Enrollment (Continued)
Sector/Type 1-Tima--------
1974 1975 Change 1974 1975==, mimmift,mft NIMMiiIVEM WIMMT,
Interboro Institute 150 428 105.33 50 0
Jamestown Business 219 237, S.22 4,
3
Katharine Gibbs Sch 544 096 27.94 0 0
Laboratory Inst-Mse 165 186 12.73 I 3
LaSalette Seminary 19 0 100.00- 0 0
Maria College-Albany 333 357 7.21 143 90
Maria egina College 194 206 6.19 160 184
1
vi
11.ater Dei College
;Ionroe Business Inst
93
430
166
230
60.65
46,51-
140
110
146
260H1 NY Institute-Finance 2 14 600.00, 237 607
Olean Business Inst 102 115 12.75 0 5
Paul Smith's College 1,131 1,206 6.63 17 8
Powelson Bus Inst 214 267 24.77 3 5
Taylor Business Inst 598 644 7.69 0 0
Techncl Career Insts 169 1,282 578.31 11 888 7
Tobe-Coburn School 157 190 21.02 0 0
Trocaire College 522 602 15.33 121 162
Utica Sch-Commerce 170 243 54,71 12 17
Villa Maria College 280 325 16.07 154 107
Wood School 273 382 37,41 0 0
Subtotal
TOTAL PRIVATE SECTOR
GRAND TOTAL
78
MiS.MMW .RfMIWWW mftmmorPEem
13,362 13,125 35.65
....... ....... .......
165,663 202,379 9,00
--..--- -------, .......
514,587 548,376. 6,57
ftmlimmftft m.*vq0
Change
100.00-
25,00-
0.00
200.00
0.00
37.06-
13.00
4.29
136.36
111,50
0,00
52.94-
66.67
0.00
972.73
0.00
33.88
41.67
30.52-
0.00
3,344 4,946 47.91
....... .......
57.723 64.188 11020
.......
234,802 258,257 9.99
79
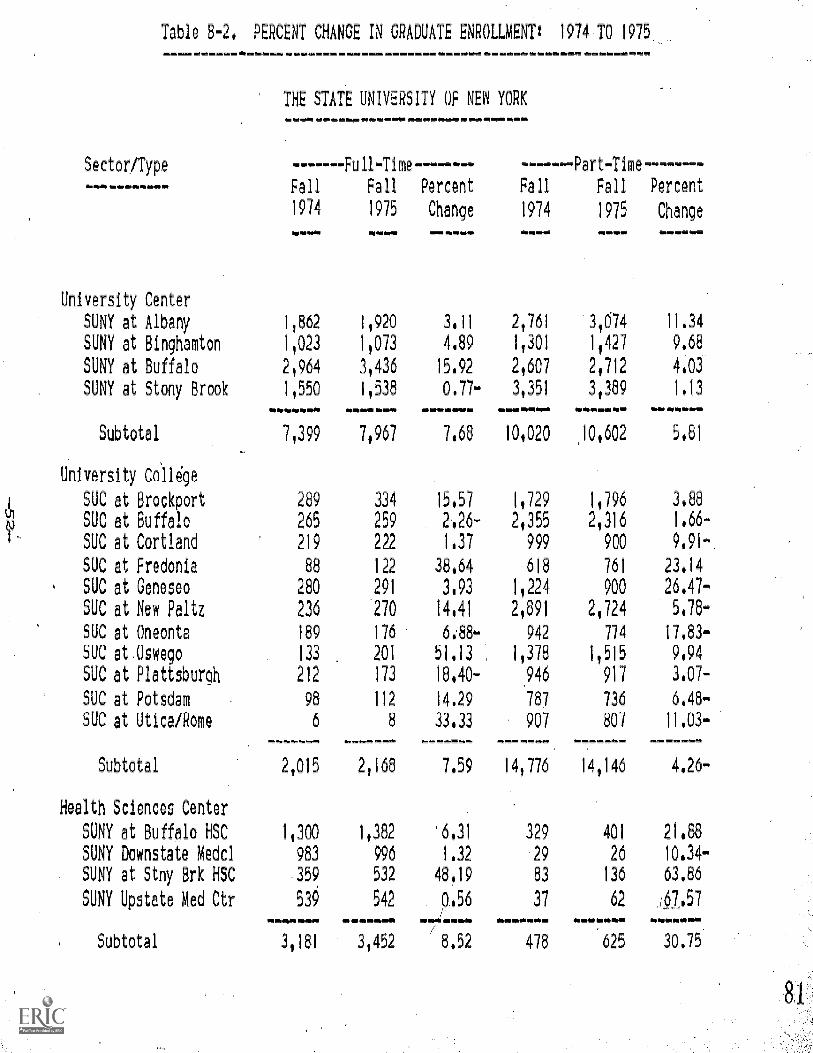
Table B-2. PERCENT CHANGE IN GRADUATE ENROLLMENT: 1974 TO 1975
==========....====== mmmmm
ector/Typa
THE STATE UNIVERSITY OF NEW YORK
-------Full-Time--------
Fall
1975
University Center
Fall
1974
WWW.
SUN? at Albany 11862
SUNY at Binghamton 1,023
SUN? at Buffalo 2,964
SUN? at Stony Brook 11550
Subtotal 71399
University Collige
SUC at Brockport 289
SUC at Buffalo 265
SUC at Cortland 219
SUC at Fredonia 88
SUC at Oeneseo 280
SUC at New Paltz 236
SUC at Oneonta 189
SUC at.Oswego 133
SUC at Plattsburgh 212
SUC at Potsdam 98
SUC at Utica/Rome 6.......Subtotal 21015
HeaIth Sciences Center
SUN? at Buffalo HSC
SUN? Downstate Medcl
SUNY at Stny Brk HSC
SUN? Upstate Med Ctr
1 300
983
-359A
539
Subtotal
SO
1,920
1,073
3,436
1,538
7,967
Percent
Change
Fall
1974
Fall
1975
==..w. W.W.
3 11 2 761 3,074
4.89 1,301 1,427
15,92 2,607 2,712
0.77- 3,351 31389
7,68 10,020 .10,602
Percent
Change
11.34
9.68
4.03
1.13
5 61
334 15,57 1,729 1,796 3.88
259 2426- 2,355 21316 1.66-
222 1.37 999 900 9091-.
122 38.64 618 761 23.14
291 3.93 1,224 900 26.47-
270 14.41 2,691 21724 5,78-
176 6.88- 942 774 17.83-
201 51.13 1 378 1 515 9494
173 18,40- ,946 917 3007-
112 14.29 787 736 6048-
8 33,33 907 807 11,03-
2,168
1,382
996
532
542
.....m.
31181 31452
====7.59 141776
'6.31 329
1.32 29
48.19 83
446 37
8.52 476
14,146 4.26-
401 21. 8
26 10.34-
136 63.86
62 67457
625 30.75
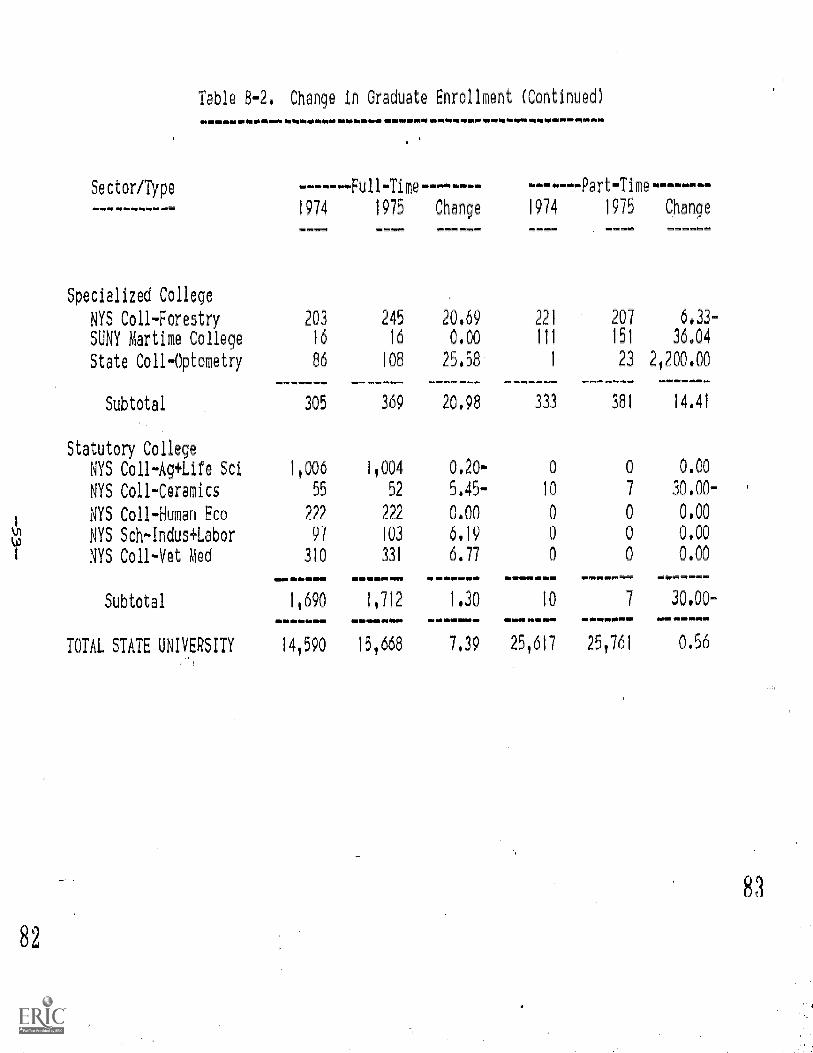
Table 8-2. Chan e in Graduate Enrollment (Continued)
Sector/Type
Specialized College
NYS Coll-Forestry
SUN? Martime College
State Coll-Optometry
Subtotal
Statutory College
NYS Coll-Ag+Life Sci
NYS Coll-Ceramics
NYS Coll-Human Eco
NYS Sch-Indus+Labor
NYS Coll-Vet Med
Subtotal
TOTAL STATE UNIVERSITY
82
-------Full-Time-------- -------Part-Time--
Change
seem.1975
mftM.
Change 1974 1975
203 245 20,69 221 207
16 16 0.00 111 151
86 108 25.58 1 23
-_-_-..
305 369 20.98 33 381
1,006 1,004 0.20- 0 0
55 52 5.45- 10 7
222 222 0.00 0 0
97 103 6.19 0
310 331 6.77 0
1,690 1,712 1.30 10 7WMPAM.ft
14,590 15,668 7.39 25,617 25,761
6.33-
36,04
2,200,00
14441
0.00
30.00-
0.00
0.00
0.00
30.00-
0.56
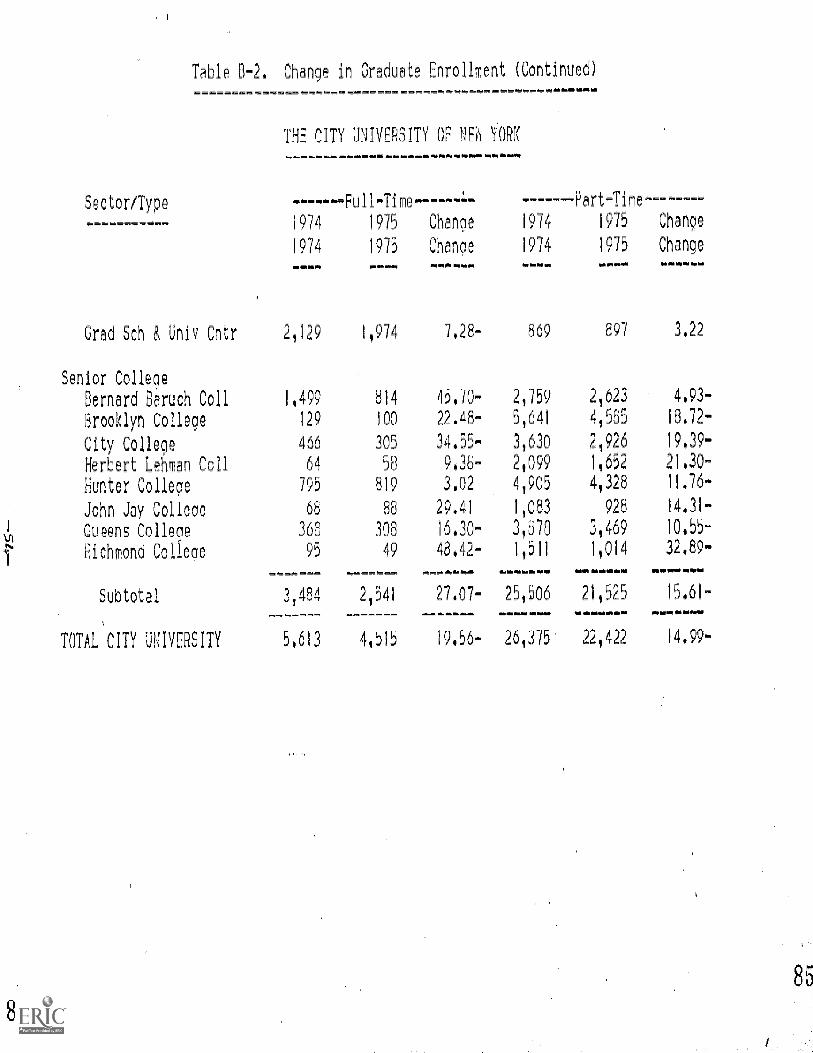
Table B2 Change in Graduate Enrollment (Continued)GGGG . GMMGR.MEGGGGGGG GGAMGGGG
Sector/Type
Greg Sch & Univ Cntr
Senior College
Bernard Baruch Coil
Brooklyn College
City Colleae
Herbert Lehman Coll
Hunter College
John Jay Colleoll
Queens College
Richmond Collepe
Subtotal
TOTAL CITY UNIVERSITY
8i
THE CITY UNIVERSITY OF NE'6 YORK
-------Full-Time--...
GE_
1974
1974
1975
1975
Change
Change
1974
1974GG
1975
1975
Change
Change
21129 1,974 7,28- 869 897 3.22
11499 814 45 70- 2 759 2,623 4.93-
129 100 22.48- 5,641 4,565 18.72-
466 305 34.55- 3,630 2,926 19039-
64 58 9,36- 21099 1,652 21,30-
795 819 3.02 4,905 49328 11.76-
68 88 29 41 11083 928 14.31-
368 300 16.30- 3,D78 3,469 10.55-
95 49 48,42- 1,511 1,014 32,89-
meinrms aG==-- e!1wmqp.
3,484 2,541 27 07- 25,506 21,525 15.61-
5,613 4,515 19.56- 26,375 229422 14099-

Sector/Tyoe
Table 3-2. Change in Graduate Enrollment (Continued). as aaamummaaaaaaaaaa
PPIVATE COLLEGES MI UNIVERSITIES..... saaaa .mft -----Full-Tine
1974
1974
gultiversity.
Columbia University 7,569
Cornell University 2,898
New York University 6,753
Syracuse University 3,261
University-'qochester 1,916
Subtotal 22,396
University
Adelphi University 662
Edrdhan.University 1,415
Hofstra University 1,085
LIU-Froonyn Center 471
LIU-C..Post Coll 35e
LIU-Southampton Coll 1
St John's University 1,477
Yeshiva University 1,039
aaamaaa
Subtotal 6,508
College Complex
Alfred University 45
Canisius iCollege 60
Colgate University 59
Elmira College 8
lona College 61
Ithaca College 66
ganhattan College 61
as a a4,0 a
1975 Change 1974 1975 Change
1975 Change 1974 1975 Change
aaa aomma aa-aa
7,625 0.75 2,411 2,385 1.08-
3,168 9.32 H 0 100.00-
6,870 1.73 13,395 13,920 3.92
3,190 2.18- 4,634 4,275 7.75-
1,925 0.47 1,495 1,291 13.65-
....--.22,775 1.71 , 21,946 21,871 0.34-
731 10.42 3,670 3,885 5.56
14388 1.91- 4,487 4,480
1,171 7.93 4,472 3,815 14.69-
466 1.06- 31056 2,926 4.25-
685 91.34 4,354 6,540 50.21
1 0.00 208 204 1.92-
1,477 0.00 4,714 4,923 4.43
1,096 5.49 728 596 18.13-
aaaaaa
71015 7.79 251689 27,369 6154
55 22.22 123 93 .20.33-
63 5.00 970 1,056 8.87
67 13.56 19 6 68.42-
26 225.00 '845 994 17.63
67 9.84 1,146 1,248 3.90
67 1.52 113 108 4.42-
67 9.84 748 771 3.07.
87
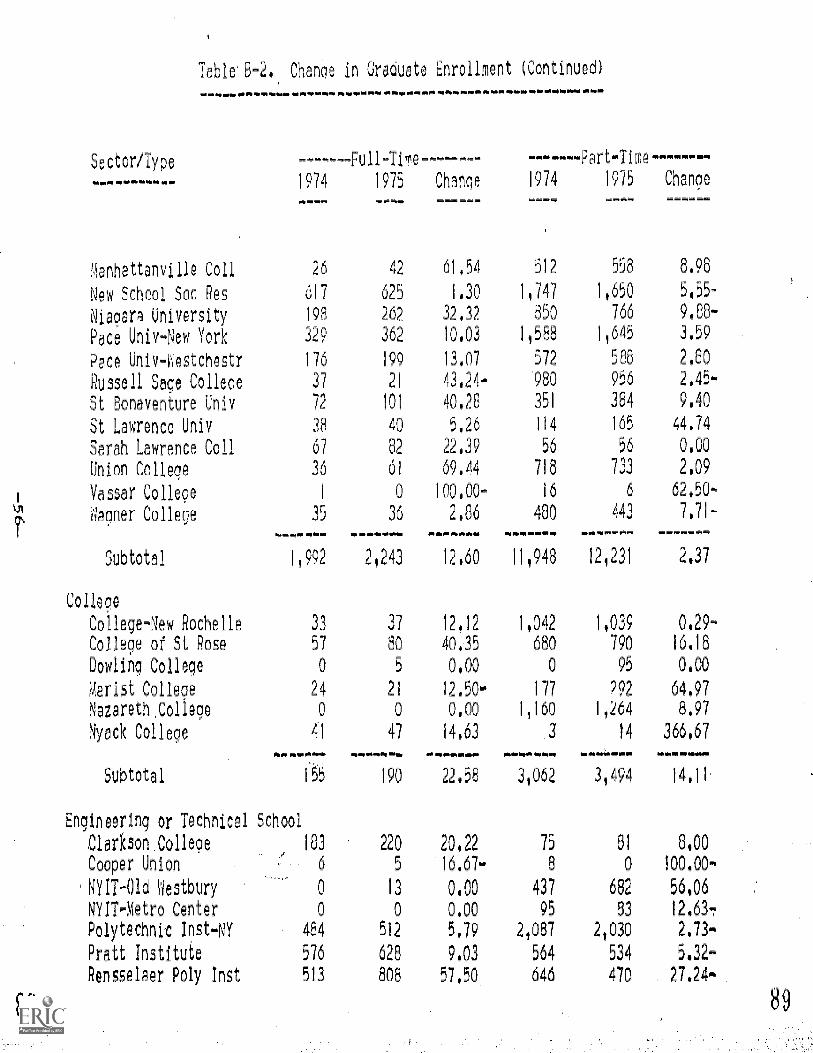
88
Table 8-2.. Change in Graduate Enrollment (Continued)
immaleMft__ftmemwei efts
Sector/Type -------Full-Time--------
mm m 1974 1975 Channe
,i,anhattanville Coll 26 42 61,54
New School Soo Res 617 625 1,30
Niagara University 198 262 32,32
Pace Univ-New York 329 362 10.03
Pace Univ-Ostchestr 176 199 13,07
Russell Sane Colleoe 37 21 43.24-
St 6onaventure Univ 72 101 40,28
St Lawrence Univ .8 40 5026
Sarah Lawrence Coll 67 82 22-39
Union College 36 61 69.44
Vassar College 1 0 100,00-
honer College 35 36 2.86
Subtotal 1,992 2 43 12060
Collebe
College-New Rochelle 3 37 12 12
College of St Rose 57 80 40.35
Dowling College 0 5 0.00
M.arist College 24 21 12.50-
Nazareth College 0 0 0,00
Nyack College 41 47 14,63
Subtotal 155 190 22 58
En ineerinn or Technical School
Clarkson:Colleoe 183 220 20.22
Cooper Union 6 5 16.67-
, NYIT-Old Westbury 0 13 0.00
NUT-Metro Center 0 0 0.00
Polytechnit Inst-NY 484 512 5.79
Pratt Institute 576 628 9.03
Rensselaer Poly Inst 513 808 57050
-------Part-Time--
1974 1975 Change
512 558 8.96
1,747 1,650 5,55-
850 766 9.88-
11598 1,645 3.59
572 586 2.80
980 956 2.45-
351 384 9,40
114 165 44,74
56 56 0.00
718 733 2,09
16 6 62, 50-
480 443 7071-
11,948 12,231 2 37
1,042 1,039 0.29-
680 790 16.18
0 95 0.00
177 292 64.97
1,160 1,264 8.97
3 14 366.67
3,062 3,494 14.11.
75 61 8.00
8 0 100.00-
437 682 56.06
95 83 12.637
2.087 2.030 2.73-
564 534 5.32-
646 470, 27.24-
89
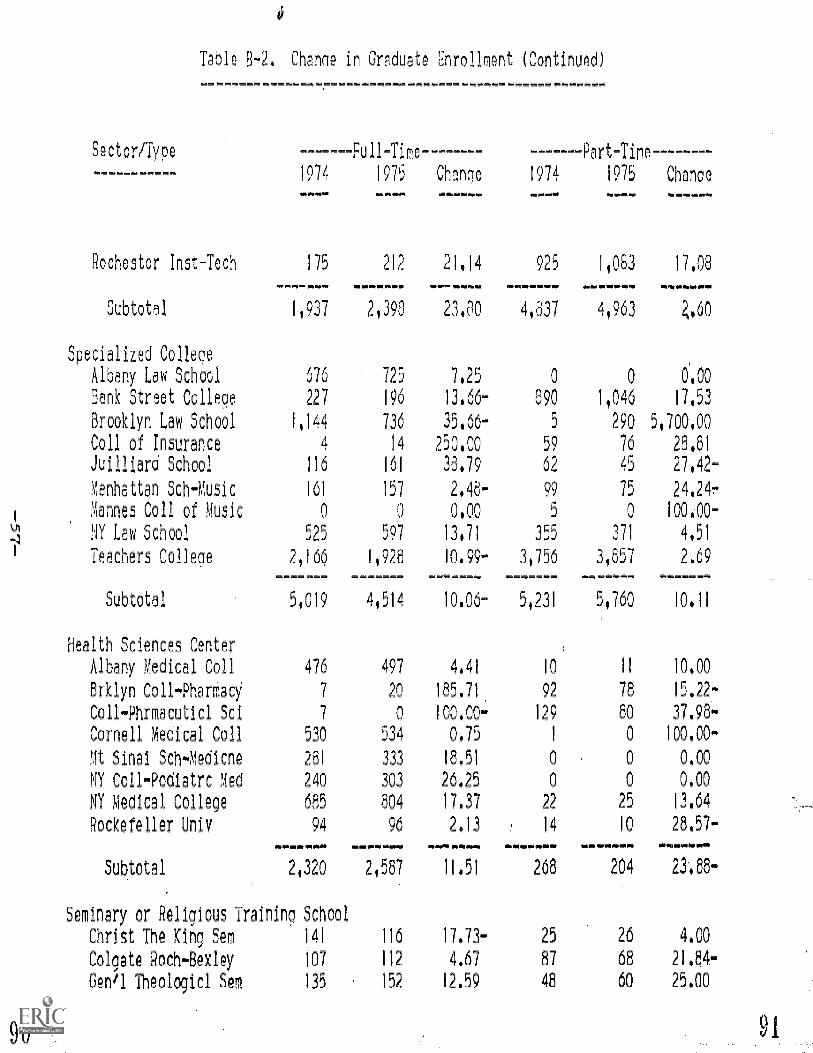
Sector/Type
Table 0-2. Change in Graduate Enrollment (Continued)
ais 1.31 il!elsEiwesmq rmee rimnrs &Age, elm m !mpg
-------Full-lime art-Time--------
1974 1975=7411111
Rochester Inst-Tech 175 212
Subtotal 1,937 2,398
Specialized College
Albany Law School 676 725
Sank Street College 227 196
Brooklyn Law School 1,14 736
Coll of Insurance 4 14
Juilliard School 116 161
Manhattan Sch-Music 161 157
1
Mannes Coll of Music 0 00
NY Law School 525 597-,)
1
Teachers College 2,166 1,928
Subtotal 5,019 4,514
Health Sciences Center
Albany gedical Coll 476 497
Brklyn 0o117Pharthaey 7 20
Coll-Phrmacuticl Sci 7 0
Cornell Medical Coll 530 534
Mt Sinai Sch-Medicne 281 333
NY Coll-Podiatrc Med 240 303
NY Medical College 685 804
Rockefeller Univ 94 96
SOtotal 2,320 2,587
Seminary or Religious Training School
Christ The King Sem 141 116
Colgate Roch-8exley 107, 112
%1./1 Theologicl Sem 135 152
90
Change 1974 1975Mpl4M
21.14 925 1,083
21.80 4,837 4,963
7.25 0 0
13.66- 890 1,046
35,66- 5 290
250.00 59 76
38.79 62 45
2.48- 99 75
0.00 5 0
13.71 355 371
10.99- 3,756 3,657
10.06- 5,231 50760
4.41 10 11
185.71 92 78
100.00- 129 80
0.75 1 0
18.51 0 0
26.25 0 0
17.37 22 25
2.13 14 10
11.51 268 204
17.73- 25 _26
4067 87 68
12.59 48 60
Chance
17.08
2.60
040
17.53
5,700,00
28,81
27.42-
24.247
100.00-
4,51
2.69
10.00
15.22-
37.98-
100.00-
0.00
0.00
13.64
28057-
21.88-
4.00
21084-
25.00
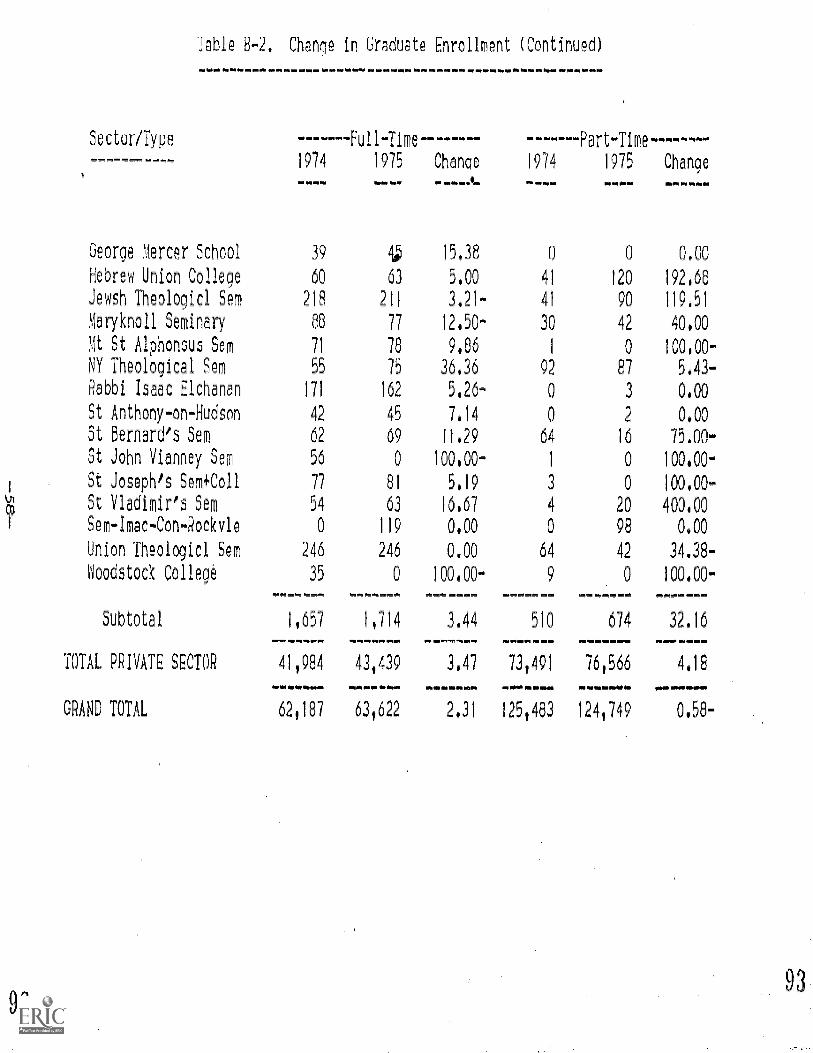
Sector/Type
Table 8-2, Change in Graduate Enrollment (Continued)
mmkEmm ..... ismmasimmimmaimmosi*Iiiimigg
-------FullTime-------- --Part-Time--------
1974 1975
George Mercer School 39 4Hebrew Union College 60 63
Jewsh Theoloqicl Sem 218 211
Maryknoll Seminary 88 77
Mt St Alphonsus Sem 71 78
NY Theological Sem 55 75
'-abbi Isaac Elchanan 171 162
St Anthony-on-Hudson 42 45
St Bernard's Sem 62 69
St John Vianney Sem 56 0
St Joseph's Sem+Coll 77 81
St Vladimir's Sem 54 63
Sem-lmac-Con-Rockvle 0 119
Union Theologicl Sem 246 246
hodstock College 35 0
Subtotal l657 11714
TOTAL PRIVATE SECT R 41,984 43,439
GRAND TOTAL 62,187 63,622
92
Chanoe 1974 1975 Change-_--JL
15.38 0 0 0.00
5.00 41 120 192.68
3.21- 41 90 119,51
12,50- 30 42 40.00
9,86 1 0 100.00-
36,36 92 87 5.43-
5.26- 0 3 0.00
7.14 0 2 0,00
11.29 64 16 75.00-
100.00- 1 0 100,00-
5.19 3 0 100,00-
16,67 4 20 400,00
0.00 0 98 0.00
0 00 64 42 34,38
100.00- 9 0 100.00-
3.44 510 674 32.16
3.47 73,491 76,566 4.18
2.31 125,483 124,749 0,58