RECENT DEVELOPMENTS OF THE DESIGN AND ANALYSIS OF FLOATING WIND TURBINES · 2013-04-08 · RECENT...
10
1 RECENT DEVELOPMENTS OF THE DESIGN AND ANALYSIS OF FLOATING WIND TURBINES Torgeir Moan et al. Centre of Ships and Ocean Structures (CeSOS) Department of Marine Technology Norwegian Centre for Offshore Wind Technology (NOWITECH) [email protected] http://www.cesos.ntnu.no/ http://www.marin.ntnu.no/~tormo e 2 Outline • Background - the threat of climate change - renewable energy – from the oceans • Wind energy offshore • Wind technology development and research - concept development - design - analysis • Demonstration projects (field testing) • Concluding remarks 3 Background Motivation: IEA/IPCC “The threat of climate change calls for an energy revolution, -especially to limit the GHG emissions” - investment in renewable energy, led by wind and solar, is increasing substantially, and shows signs that this change is underway (IEA Energy Technology Perspectives 2010; IPCC SRREN,2011)) Renewable energy is forecasted to increase its share from 12.9 % of the total global primary energy supply in 2008 to 21 % in 2050 year Wave energy etc Offshore wind 4 Europe : 40 GW by 2020 150 GW by 2030 USA : 10 GW by 2020 54 GW by 2030 China : 2 GW by 2020 Korea : 13.5 GW by 2025 Wind energy offshore - prognosis EU: Offshore wind power is expected to grow from - 0.4 % in 2011 to - 4.2 % in 2020 - 13.9 % in 2030 of the electricity supply IPCC, SRREN, 2011 Development trend in Europe in Europe 40 GW is planned by 2020, implying a 20-25 % annual growth in installed capacity installing 40 GW requires about 10-15 000 windmills. This will imply a multi-billion-euro/dollar-industry in the years to come. 4GW
Transcript of RECENT DEVELOPMENTS OF THE DESIGN AND ANALYSIS OF FLOATING WIND TURBINES · 2013-04-08 · RECENT...

1
1
RECENT DEVELOPMENTS OF THE DESIGN AND ANALYSIS OF FLOATING
WIND TURBINES
Torgeir Moan et al.Centre of Ships and Ocean Structures (CeSOS)
Department of Marine Technology
Norwegian Centre for Offshore Wind Technology (NOWITECH)[email protected]
http://www.cesos.ntnu.no/http://www.marin.ntnu.no/~tormo
e
2 Outline• Background
- the threat of climate change- renewable energy – from the oceans
• Wind energy offshore
• Wind technology development and research- concept development- design- analysis
• Demonstration projects (field testing)
• Concluding remarks
3 BackgroundMotivation: IEA/IPCC“The threat of climate change calls for an energy revolution,-especially to limit the GHG emissions”- investment in renewable energy, led by wind and solar, isincreasing substantially, and shows signs that this change is underway (IEA Energy Technology Perspectives 2010; IPCC SRREN,2011))
Renewable energyis forecasted to increase its sharefrom 12.9 % ofthe total global primary energysupply in 2008 to 21 % in 2050
year
Wave energy etc
Offshore wind
4
Europe : 40 GW by 2020150 GW by 2030
USA : 10 GW by 202054 GW by 2030
China : 2 GW by 2020Korea : 13.5 GW by 2025
Wind energy offshore - prognosis
EU: Offshore wind poweris expected to growfrom - 0.4 % in 2011
to - 4.2 % in 2020 - 13.9 % in 2030
of the electricity supply
IPCC, SRREN, 2011
Development trend in Europe
in Europe 40 GW is planned by 2020, implying a 20-25 % annualgrowth in installed capacity
installing 40 GW requires about 10-15 000 windmills. This will imply a multi-billion-euro/dollar-industry in the years to come.
4GW

5 Wind energy conversion into mechanicaltorque and finally to electrical power
• Kinetic energy in wind:• Power in the wind:• Electrical power: P = CP Pmax
• Power generation depends on:– Air density– Wind velocity (cubed)– Swept area
Average annual produced power (kWh/h)- electrical to absorbed or aerodynamicpower (”efficiency”= 95%)
Rated power (instantaneous peak power) for design of power take off or drive train system
6
Control systems
Control system objectives:• Ensure efficient and safe
operation- control torque at below rated speed and the power above rated, and limitthe structural loads.
Supervisory systems to control:• Yaw control• Rotor speed control (blade-pitch)• Power control (generator torque)
Combined wind speed and direction sensor.
Schematic illustration of power production by a 5 MW bottom fixed wind turbine
Rotor condition
Maximizepower
Constantpower
7
To avoid negative damping implied by a conventional controller, the controller frequency should be less than the natural frequency of the floating wind turbine
Servo-induced negative damping
Power production
0
100
200
300
400
500
600
700
800
0 5 10 15 20 25
Relative wind speed (m/s)
Thru
st(k
N) Maximum
powerConstantpower
Operating wind turbine, active control
Relative wind speed (m/s)
Control systems, continued
at 10 mat the nacelle(90 m aboveMWL)
Pow
er (M
W)
Wind speed (m/s)
Maximizepower
Constantpower
8 Development trends
- deeper waterfrom fixed to floating
- increasedrotor size (capacity):California 1980 : 55 kWto 3.6 MW and upwards
5 MW
Integratingknowledge
• One of a kind OG install. versus mass produced WTs.
• No hydro carbons and people on board wind turbines
• The wind energy sector is a “marginal business”
• Return are more sensitive to IMMR (O&M) costs (access)
9
Operation & Maintenance costsFailure rates and down times
Availability- 96 - 98 % on land- 80 % for early wind
farms offshore
-Need for robust design,(reliable and fewcomponents) & smart maintenance, but also improvedaccessibility
- Larger turbine size? ( > 5 - 20 MW)
Courtesy: Fraunhofer
- Predict, monitor and measure degradation
10 Costs of (bottom fixed) offshore wind turbines
Contribution to total CapEx
1-10 % 2-10 %Other
5-10 %2-10 %Engineering
5-10 %1-10 %Electricalinstall.
15-20 %2-10 %Grid connection
15-30 &1-10 %Supportstructure
40-50 %70-85 %Turbine
OffshoreOnshoreComponent
CapEx- more expensive substructure/soil foundations- more complex and expensive installationOpEx (20 – 30 % of CapEx lifetime costs)- bad weather can lead to downtime- seabed preparation; e.g. to protect against scour
Courtesy: Dong Energy
Reduce costs as done for land based turbines:- Increase turbine size- Improve manufacturing- Improve infrastructure
11
Support structure and drive trainMinimize cost while complying with safety and durabilityrequirements. Larger units and reduced failure rates
Support structures
Rotor to generator (drive train)
Power system:Innovation in transmission, grid connection and system integration while maximizing power availability, quality, and stability
Marine operations:Improve efficiency of installation (transportation, site surveying,cable laying; etc ) and personnel access to facilities whileminimizing the risks and the cost of operation.
Technology development 12
12
- power production- limit states
- Ultimate failure (ULS)- Ultimate failure initiated by faults (ALS)- Degradation (fatigue, corrosion, wear)
- account of automatic control
Design criteria
New or improved Concepts(a system of rotor, machinery, generator, support structure)- charact. behaviour- satisfy criteria- costs
- Guidelines and standards: Fixed wind turbines: IEC 61400-3, DNV, GL, Floating turbines?
R & D of Offshore Wind turbines
Methods of analysis/ software- land based wind industry: FAST, Hawc”, Bladed+- offshore oil and gas: SIMO/Riflex, Orcaflex etc +
IEA OC3-4 Benchmarkingof support structure analysis

13
Development of Floating Wind Turbines - no commercial wind farms based on floating turbines yet
Support structure concepts
Floating turbinesespecially fordeep water areas inthe North Sea, USA, Medeterainean sea, Japan, Korea
- Design for mass production and easy installation; i.e..cost reduction
- At which water depthwould floating windturbines be competitive ?Number of units
on a floater
14
14
Dynamics of spar type turbine of size 5 MW
If resonancecan not be avoideddamping becomescrucial
water depth:300 m
15Design of Semi-submersible or Spar Concepts5 MW wind turbine
Criteria“Stability” requirement• The tilt angle should be limited (e.g. to 7 degrees)
under design overturning moment (800KN*90m)- implying pitch a minimum restoring stiffness
(C55) Hydrodynamic performance requirement• Heave natural period (T33) should be above 20s• Pitch natural period should (T55) be around 30sStructure response• ULS/ALS, FLS
Minimum displacement, or increase added mass
Cost effectiveness• Steel weight• Displacement• Fabrication complexity
2 ii iii
ii
M ATC
π+
=
Displacement of semi-submersible designs vary between4500 – 14 000 tRef.: Spar: 7500 t
Restoring by- water plane - KB>>KG
16
Floating wind turbines for more shallow water- by comparison of responses
Spar for 320 m vs 150 m water depth
Spar WT can beused to captureadditional powerfrom wave-inducedmotions for the belowrated wind regime (”WEC”) by modifyingthe controller

17
Design of floating wind turbinesSpar designs for 5 MW turbines
Stability, hydrodynamic and structural aspects
Mooring system aspects
320 m w.d. 150 m w.d.
Initial developmentof HyWind: 320 m w.d.
18
Combined spar WT and Torus WEC
SparSpar
Torus
Torus
Wind turbinewith rated power:5 MW
• Shared mooring system and cable• Synergy in maintenance
Power production
0
1000
2000
3000
4000
5000
6000
7 9 11 13 15 17 19
Ele
ctri
cal
Pow
er P
rodu
ctio
n (k
W)
Vmean (m/s)
Mean Wind Power - Spar FWT alone
Mean Wind Power - STC
Mean Wave Power - STC
19
• Surge/Sway natural periods > 25 s
• Heave/Roll/Pitch natural periods < 3.5 s• Mean surge offset
< 5% water depth• No tendon slack:
Tendons may not yield for 2 times initial tendon tension
• Minimum displacement 2 000 tonnes
Challenge:-non-converging design spiral
Constraints
Design of Tension Leg Platform Wind Turbine -excessive buoyancy creates pretension and limited heave and pitch
20
blade
Rotor blades (for a 5 MW turbine the blade is 63 m long)
Smart bladesFull-scale structural testing of blades
Larger blades
• Can active devices
- reduce loads ?
- improve energy capturein low wind conditions ?
- increase the area sweptwith the same blade ?

21
Drive train – from rotor to generator• Machineries (Gear systems, yaw & pitch mechanism, bearings, shafts)
• Structure
≈ 10 to 1500 rpm
(Exploded view of the drive train)
22
22
Alternative drive trains ?
Fixed or variable speed w/gear box Direct drive variable speed- With a weight penalty
A main question:- Is the drive train, rotor…. used on bottom-fixedturbines feasible for floating ones?
23 Particular challenge for floating concepts:Some alternative ways to reduce top weight
Downwind turbine Hydraulic Smarttransmission generator
Wind
Use - new materials and
- new designs
24
Source: NREL/Wind power today, 2010.
Analysis for design of offshore wind turbinesAerodynamic, hydrodynamics,….Integrated (aero-, hydro-, elastic-, servo-) analysis
- loads: irregular waves, turbulentwind, rotor rotation in agravitational field and a nonuniform wind field,
- conditions: operating, parked –intact or with faults
- response extremes and histories -st.dev. (for fatigue, wear..) for different failure modes,
- time versus frequencydomain simulation
- refined versus simplified methods
Laboratory or field testsDifferent failure modes

25
Aerodynamic loads
CFD: Navier-Stokes (NS) equations for the global compressible flow in addition to the flow near the blades.
Atmospheric icing on a blade after 24 hours in arelevant offshore site
- Ice accumulation on theleading edge and
- rime influencingthe surface roughness(sand grain roughness height of 0.5 mm)
Example of CFD analysis: Effect of atmospheric icing on the bladesrime
BEM: blade element momentum theory based on lift, drag, moment coefficients (engineering methods)
- relies on airfoil data
26
Numerical (RANS/K‐ε) and experimental results for profile ICE‐2 after 24 hours
Aerodynamics for ice blade using the Fluent CFD codeValidation – especially the tubulence model; mesh sensitivity
Effect of icing on the lift coefficient Effect of icing on the power
Ratedwindspeed
Cutoutwindspeed
27
Effect of wakes Benchmarking exercisefrom Offshore Wind Accelerator
Two or three turbineson a single floater
Row number downstream
Turbines are arranged in a regular grid
CFD
Measurements from Horns rev in Denmark
Multiple turbine conceptsrequire turret mooring system
28
28
Challenging hydrodynamics phenomenafor floating structures (wind turbines):
28
• Ringing
• Springing occurs when steady state load componentswith frequencies
2ω, 3ω. 2ω or 3ω coincide with a natural frequency
Springing Ringing
Springing and ringing response in TLP tendons
- Wave - and high frequency
Nonlinear phenomenaassociated withfinite wave amplitudesand large motion amplitudes(especially for large volumestructures)
Load formulationfor catenary moored sparbased on Morison formula andpressure on the bottom,…………..- load calculation atthe instantaneous position

29
■ modeling of excitation mechanisms (wind, waves and current)
■ rotor aerodynamics■ hydrodynamics■ structural dynamics■ automatic control theory■ power generation
■ Nacelle
■ Blades
■ Column
■ Floater hull
■ Mooring lines
■ Rotor
Water depth > 50m
Particular challenges for floating concepts:System modelling, including automatic control
Different concepts
•tightly coupled system• nonlinear
Electrical cable(insulated conductorand armour)
30
30
NREL 5-MW Wind Turbine mounted on a 120-m spar platform
CatenaryMooredSpar (CMS) (similar to HYWIND)
Tension Leg Spar (TLS) (similar to SWAY)
Integrated dynamic analysisExample: Spar type wind turbines
(M. Karimirad, T.Moan)
31
31
Example: Structural dynamic response ofCatenary Moored Spar
32
32
Example: Ameliorating the negative damping inthe dynamic responses of a TLS withdownwind turbine

33
The resulting wind forces on the rotor consist of 3 force and 3 moment components. A simplified model is achieved by only considering the thrust force.
2 212 a T RELT R C Uπρ=
Simplified aerodynamic response analysis
Further simplification is achieved by simulatingthe effect of control in the over rated responseup to cut-out wind speed by a filter.
Tower bending moment
Load cases for operational conditions
The simulation time for 1 hour real time:-15 min for SRT -24 hours for
the ”full” method
34
• Decoupled analysis to determineTooth contact forces, Bearing forces, Gear deflections.
- Global aero-hydro-servo-elastic simulation- Drivetrain multi-body simulation
based on main shaft loading andnacelle motions
Comparison of drivetrain responses in FWT and WT
GRC Drive train config.
Both mean and st.dev. ofthe low speed shaft BM(and hence bearing, tooth contact forces) increases significantly Comparison of the standard deviation
35Example: response analysis under faults during power production of a spar wind turbine
• IEC code requires checking of nearly 40 cases with environmental loads for a system which is intact or fault. One case is:
(Jiang et al, to appear)
Time history of tower bottom bending moment of a spar-typewind turbine under different fault conditions. Mean wind speed: 25m/s, Turbulence Intensity: 0.15, Hs=5.9m, Tp=11.3s
36 Marine operationsInstallation of wind turbines-requires a weather window-consideration of human factors-analysis of operations
HyWindinstallation
Offshore GE 3.6 MW 104 m rotor diameter
Boeing 747-400
NTNU marine students 1.prizeSNAME design competition 2008
Alternative installation: Windflip
Perspective onmarine operations
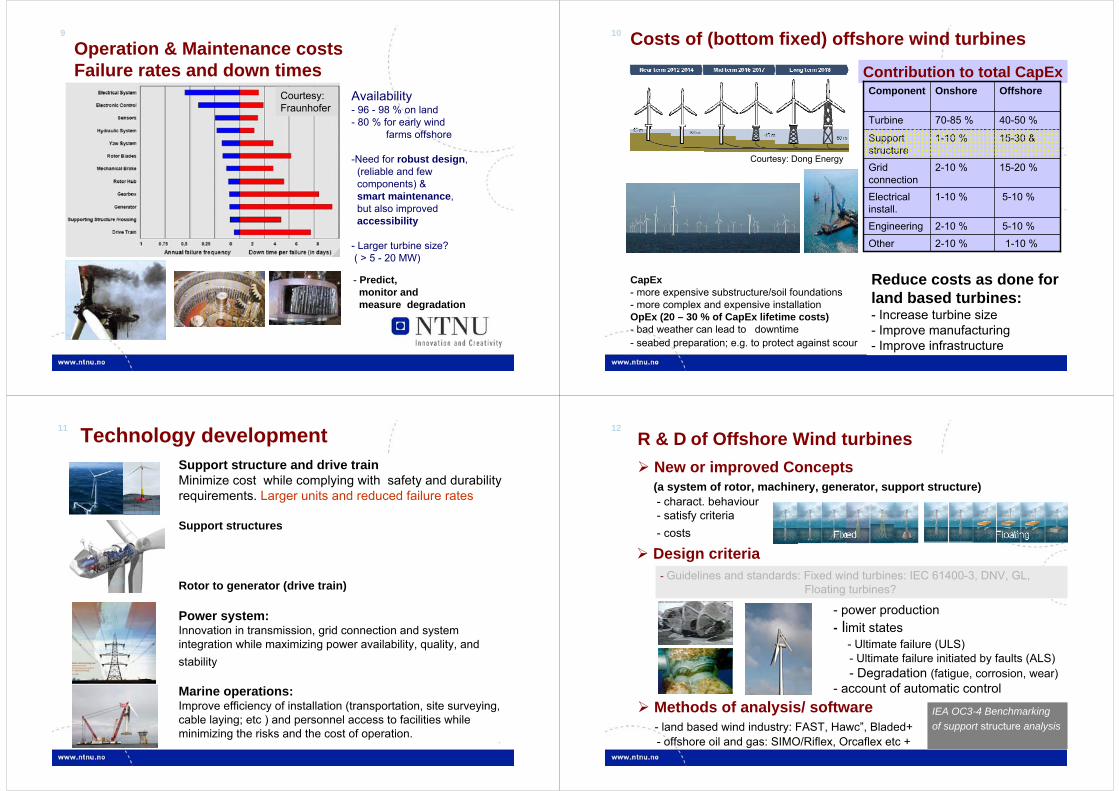
37
Field tests or demonstration projects
Blue H (Dutch), HyWind, Norway, in Italy 1 2.3-MW turbine
Beatrice, UK, 2 5-MW Alpha Ventus, Germany12 5-MW (during construction)
Other projects for floating wind turbines:- Noweri (NOWITECH-NORCOWE); Norway- Principle Power (American) at a site in Portugal- Japan, Spain, USA
Field tests to demonstrate- functionality- validate analysis tools
Laboratory tests- Rotor blades- Drive train- Support structure- Model basins/wind tunnels.
38
Concluding remarksA huge untapped potential for offshore wave and
wind power exists. Only wind power is currently ”commercial”
Technology is still at an early stage, especially for floating wind turbines- Various concepts need to be pursued- possible influence on rotor and drive train design
Rules and standards for design of floating wind turbine is urgently needed.
Significant efforts are required to - increase robustness/reliability, - reduce costs (utilise mass production potential)
Concerted efforts in R & D are required by theindustry, research institutes and universities
integrated dynamic analysisconsideration of faults
39
AcknowledgementThanks to researchers Z Gao and M Karimirad, and PhD candidates E E Bachynski, M Etemaddar, Z Jiang, M I Kvittem, M. Muliawan,Y Xing, in CeSOS and Nowitechfor excellent cooperation
Thank you!