Chapter 4: Local integration 1: Reasoning & evolutionary psychology
Upload
ariel-sharyl-byrdCategory
view
228download
0
Reasoning in PsychologyUsing Statistics
Psychology 138
2015

Reasoning in Psychology Using
Statistics
Annoucements
• Don’t forget quiz 8 due this Friday
Reasoning in Psychology Using
Statistics
Chi-Square Test for Independence
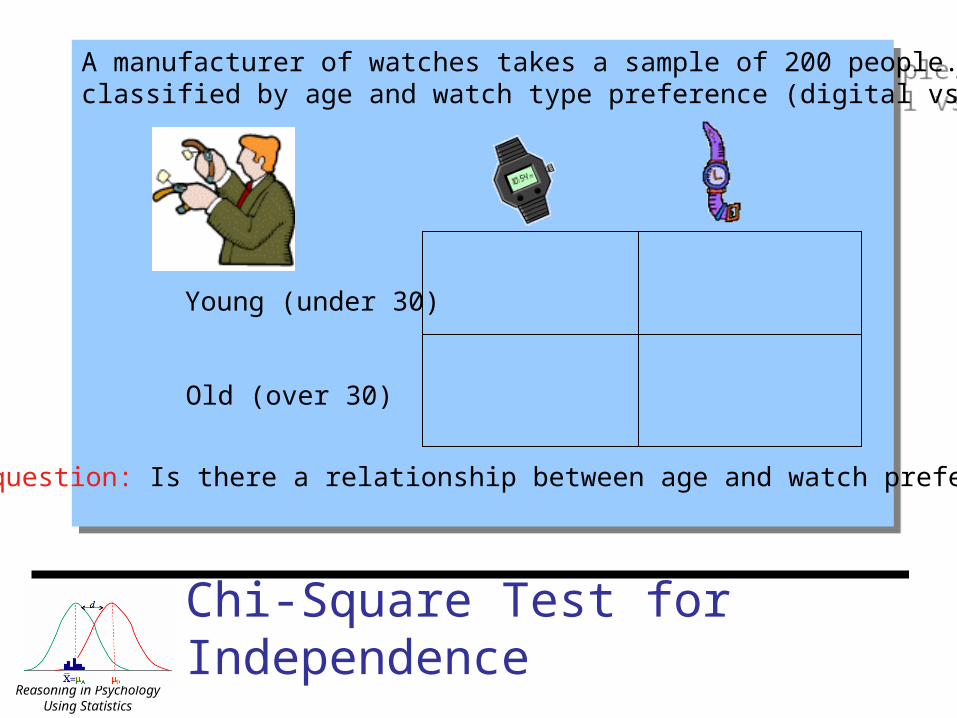
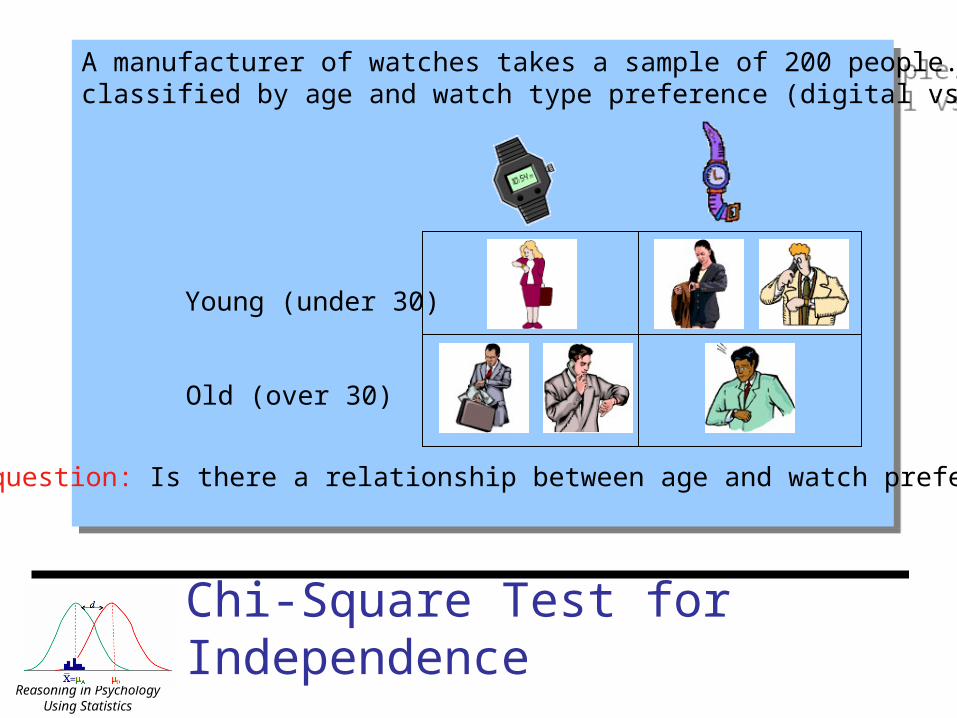
A manufacturer of watches takes a sample of 200 people. Each person isclassified by age and watch type preference (digital vs. analog).
A manufacturer of watches takes a sample of 200 people. Each person isclassified by age and watch type preference (digital vs. analog).
The question: Is there a relationship between age and watch preference?
Young (under 30)
Old (over 30)
Reasoning in Psychology Using
Statistics
Chi-Square Test for Independence
A manufacturer of watches takes a sample of 200 people. Each person isclassified by age and watch type preference (digital vs. analog).
A manufacturer of watches takes a sample of 200 people. Each person isclassified by age and watch type preference (digital vs. analog).
The question: Is there a relationship between age and watch preference?
Young (under 30)
Old (over 30)

Reasoning in Psychology Using
Statistics
Decision tree
• Chi-square test of independence (χ2 lower-case chi )– Describing the relationship between two categorical
variables
or Young Oldor

Reasoning in Psychology Using
Statistics
A manufacturer of watches takes a sample of 200 people. Each person isclassified by age and watch type preference (digital vs. analog). The question: is there a relationship between age and watch preference?
A manufacturer of watches takes a sample of 200 people. Each person isclassified by age and watch type preference (digital vs. analog). The question: is there a relationship between age and watch preference?
Chi-Squared Test for Independence

Reasoning in Psychology Using
Statistics
Chi-Squared Test for Independence
Step 1: State the hypotheses and select an alpha level – H0: Preference is
independent of age (“no relationship”)
– HA: Preference is related to age (“there is a relationship”)
– We’ll set α = 0.05
A manufacturer of watches takes a sample of 200 people. Each person isclassified by age and watch type preference (digital vs. analog). The question: is there a relationship between age and watch preference?
A manufacturer of watches takes a sample of 200 people. Each person isclassified by age and watch type preference (digital vs. analog). The question: is there a relationship between age and watch preference?
Observed scores

Reasoning in Psychology Using
Statistics
Step 2: Compute your degrees of freedom & get critical value
df = (#Columns - 1) * (#Rows - 1)
= (3-1) * (2-1) = 2
• For this example, with df = 2, and α = 0.05
Chi-Squared Test for Independence
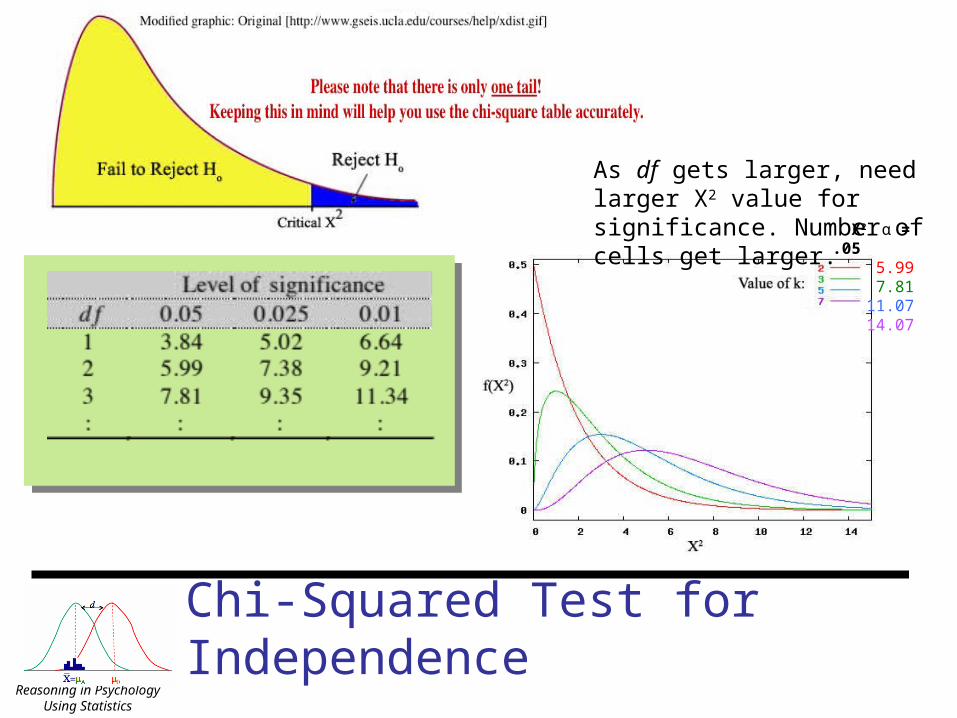
• The critical chi-squared value is 5.99
– Go to Chi-square statistic table and find the critical value
Reasoning in Psychology Using
Statistics
Chi-Squared Test for Independence
X2 α = .055.997.81
11.0714.07
As df gets larger, need larger X2 value for significance. Number of cells get larger.

Reasoning in Psychology Using
Statistics
Step 3: Collect the data. Obtain row and column totals (sometimes called the marginals) and calculate the expected frequencies
Chi-Squared Test for Independence
Observed scores

Reasoning in Psychology Using
Statistics
Step 3: Collect the data. Obtain row and column totals (sometimes called the marginals) and calculate the expected frequencies
Chi-Squared Test for Independence
Observed scores
Spot check: make sure the row totals and column totals add up to the same thing

Reasoning in Psychology Using
Statistics
Chi-Squared Test for Independence
Under 30
Over 30
Digital Analog Undecided
70 56 14
30 24 6
Observed scores
Expected scores
Step 3: Collect the data. Obtain row and column totals (sometimes called the marginals) and calculate the expected frequencies (in each cell)

Reasoning in Psychology Using
Statistics
Chi-Squared Test for Independence
Under 30
Over 30
Digital Analog Undecided
70 56 14
30 24 6
Observed scores
Expected scores
Step 3: Collect the data. Obtain row and column totals (sometimes called the marginals) and calculate the expected frequencies
“expected frequencies” - if the null hypothesis is correct, then these are the frequencies that
you would expect
“expected frequencies” - if the null hypothesis is correct, then these are the frequencies that
you would expect
Reasoning in Psychology Using
Statistics
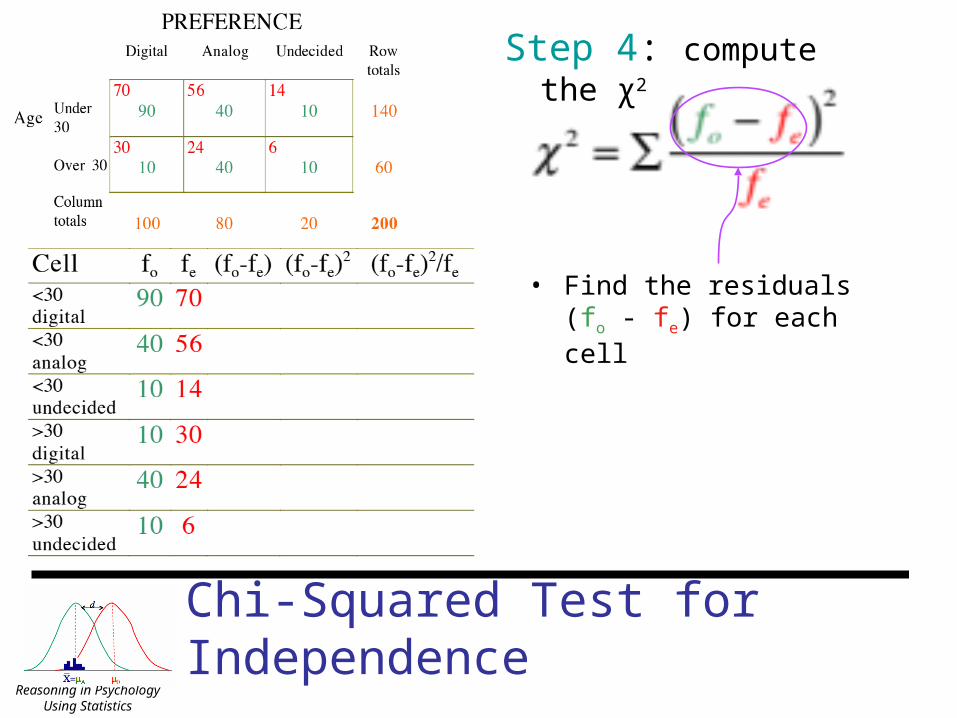
• Find the residuals (fo - fe) for each cell
Step 4: compute the χ2
Chi-Squared Test for Independence

Reasoning in Psychology Using
Statistics
Computing the Chi-square
• Find the residuals (fo - fe) for each cell
Step 4: compute the χ2
Reasoning in Psychology Using
Statistics
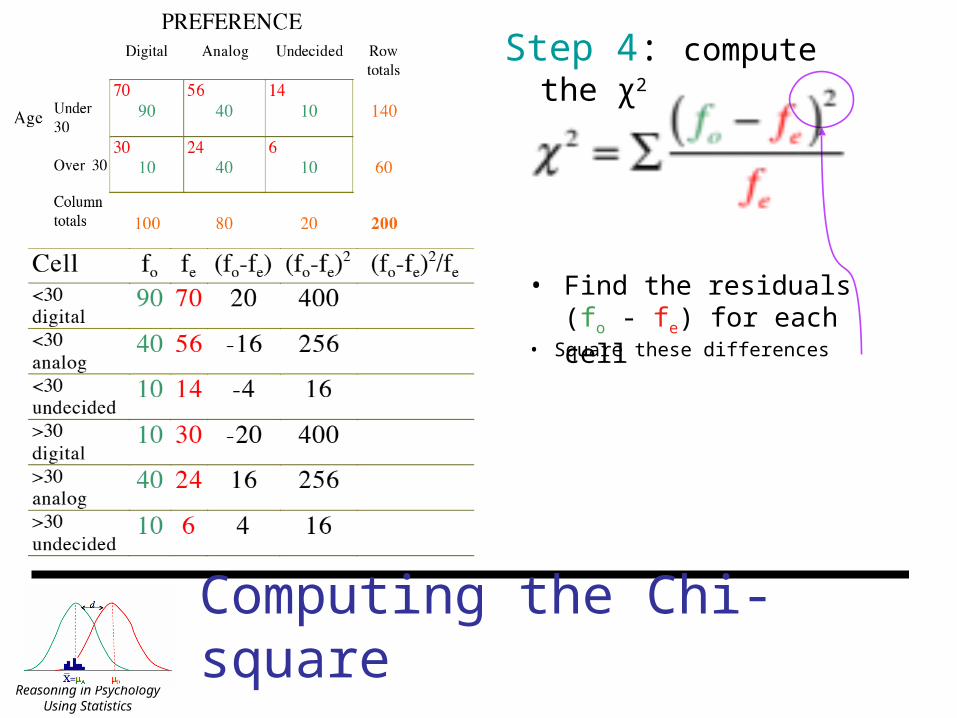
Computing the Chi-square
• Square these differences
• Find the residuals (fo - fe) for each cell
Step 4: compute the χ2

Reasoning in Psychology Using
Statistics
Computing the Chi-square
• Find the residuals (fo - fe) for each cell
• Divide the squared differences by fe
Step 4: compute the χ2
• Square these differences
Reasoning in Psychology Using
Statistics
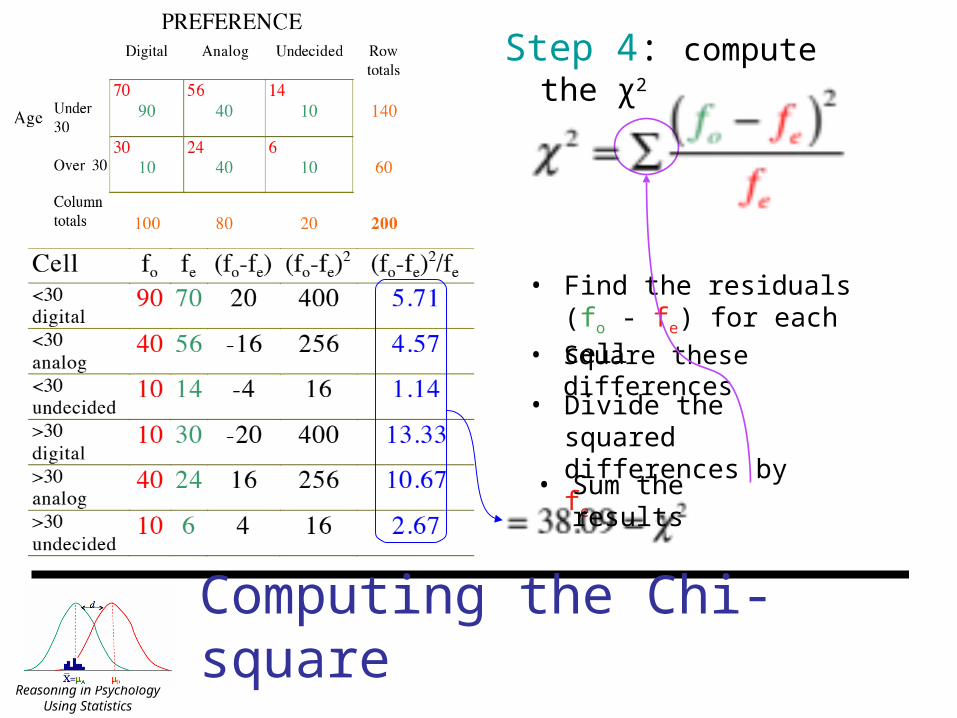
Computing the Chi-square
• Square these differences
• Find the residuals (fo - fe) for each cell
• Divide the squared differences by fe
• Sum the results
Step 4: compute the χ2

Reasoning in Psychology Using
Statistics
Chi-Squared, the final step
Step 5: Compare this computed statistic (38.09) against the critical value (5.99) and make a decision about your hypotheses
A manufacturer of watches takes a sample of 200 people. Each person isclassified by age and watch type preference (digital vs. analog). The question: is there a relationship between age and watch preference?
A manufacturer of watches takes a sample of 200 people. Each person isclassified by age and watch type preference (digital vs. analog). The question: is there a relationship between age and watch preference?
here we reject the H0 and conclude that there is a relationship between age and watch preference

Reasoning in Psychology Using
Statistics
Chi square as a statistical test
each cell = observed difference . difference expected by chance

Reasoning in Psychology Using
Statistics
Chi-Square Test in SPSS
Analyze Descriptives Crosstabs

Reasoning in Psychology Using
Statistics
Chi-Square Test in SPSS
Analyze Descriptives Crosstabs
Click this to get the expected frequencies and residuals
Click this to get bar chart of the results

Reasoning in Psychology Using
Statistics
Chi-Square Test in SPSS

Reasoning in Psychology Using
Statistics
Wrap up
• In lab: Gain experience using and interpreting Chi-square procedures
• Questions?