RDP Chapter 10
12
Chapter 10 Accelerating Human Capital Development | 73
-
Upload
national-economic-and-development-authority-xii -
Category
Government & Nonprofit
-
view
160 -
download
0
Transcript of RDP Chapter 10

Chapter 10 Accelerating Human Capital Development | 73

74 | Regional Development Plan 2017-2022

Chapter 10 Accelerating Human Capital Development | 75
Chapter 10
Accelerating Human Capital Development
Human Capital Development as Means to an End
It is the responsibility of the State to ensure the development of its people. Un-der the pillar Pagbabago, the Plan recognizes human development not just as a means to an end (i.e., human capital as a factor of production) but also an end in itself. Thus, in the next six years, individuals and people groups will have more options to develop their full potential. Better human development outcomes will be attained by reducing inequalities in the peoples’ ability to stay healthy, be well-nourished, and continue learning throughout their lives. Inclusive strategies and other interventions will be directed at ensuring that all people, especially the poor and underserved, will have long, healthy, and productive lives; lifelong learn-ing opportunities; and improved income-earning ability. The region shall continue to provide its people opportunities to become productive citizens through quality technical education and skills development and relevant courses in higher edu-cation. To ensure that graduates meet the industry standards with employable skills, mandatory Competency and Certification Programs will be continually im-plemented. Such efforts will support the region’s investment for quality human resources for the labor market both domestically and globally. The skills devel-opment program should include returning migrants and their families to ensure equality of employment opportunities. Human development training will comple-ment the acquired skills and learning of the overseas workers as they reintegrate in the Philippine society.
Assessment
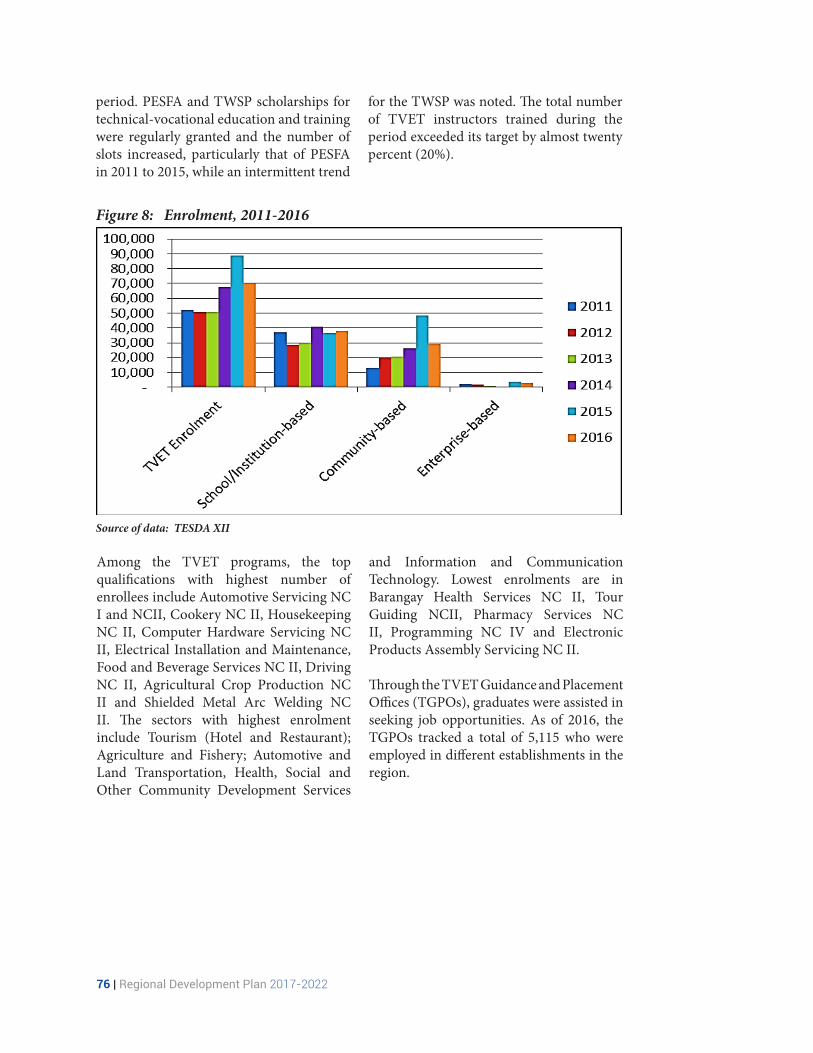
For the period 2011-2016, enrolment in technical-vocational education and training in school/ institution-based was generally higher than those in the community-based centers. In 2015, total enrolment in technical-vocational education and training was highest at 88,666, with almost fifty-five (55) percent enrolled in community-based programs and forty-one (41) in schools and technical-vocational institutions. One of the reasons for the decrease in enrolment in TVET institutions was the migration
Technica l–Vocat ional Education and Training
of programs and the high cost incurred on the process of migration. Scholarship grants (under TWSP, STEP and BUB) and programs being offered free encouraged high enrolment in community-based programs. The weak linkage with the industries caused a decrease in the enrolment in enterprise-based centers.
A high rate of graduates was recorded at more than eighty percent (80%) during the period of assessment and certification rate of graduates of skills training and would-be skilled workers who took the assessment test showed an increasing trend during the
76 | Regional Development Plan 2017-2022
period. PESFA and TWSP scholarships for technical-vocational education and training were regularly granted and the number of slots increased, particularly that of PESFA in 2011 to 2015, while an intermittent trend
for the TWSP was noted. The total number of TVET instructors trained during the period exceeded its target by almost twenty percent (20%).
Source of data: TESDA XII
Figure 8: Enrolment, 2011-2016
Among the TVET programs, the top qualifications with highest number of enrollees include Automotive Servicing NC I and NCII, Cookery NC II, Housekeeping NC II, Computer Hardware Servicing NC II, Electrical Installation and Maintenance, Food and Beverage Services NC II, Driving NC II, Agricultural Crop Production NC II and Shielded Metal Arc Welding NC II. The sectors with highest enrolment include Tourism (Hotel and Restaurant); Agriculture and Fishery; Automotive and Land Transportation, Health, Social and Other Community Development Services
and Information and Communication Technology. Lowest enrolments are in Barangay Health Services NC II, Tour Guiding NCII, Pharmacy Services NC II, Programming NC IV and Electronic Products Assembly Servicing NC II.
Through the TVET Guidance and Placement Offices (TGPOs), graduates were assisted in seeking job opportunities. As of 2016, the TGPOs tracked a total of 5,115 who were employed in different establishments in the region.

Chapter 10 Accelerating Human Capital Development | 77
Table 31: Core TVET Indicators, Accomplishments 2011-2015
Source of data: TESDA XII
INDICATORSACCOMPLISHMENTS
2011 2012 2013 2014 2015 2016No. of registered Institution-Based Programs
122 135 64 82 123 73
No. of compliance audited and evaluated TVET programs
26 163 420 377 399 146
TVET Enrollment 52,303 50,710 50,789 67,801 88,666 69,989School/Institution-
based 36,846 28,628 29,652 40,951 36,627 38,243
Community-based 13,245 20,095 20,467 26,400 48,525 29,143Enterprise-based 2,212 1,987 670 450 3,514 2,603Number of TVET
Graduates 43,332 41,701 40,824 56,877 77,883 64,627
School/Institution-based 28,694 28,628 21,420 33,101 28,470 34,425
Community-based 12,645 20,095 18,868 23,366 45,904 27,557Enterprise-based 1,993 1,843 536 410 3,509 2,645
Number of Scholarship SlotsPESFA 869 1,535 1,298 1,590 2,040 -TWSP 1,915 4,215 7,487 3,611 5,879 3,989
Assessment and CertificationNo. of Persons
Assessed 29,842 37,033 37,969 38,619 44,040 38,796
No. of Persons Certified 24,226 30,645 31,575 33,635 39,223 35,198
Certification Rate (%) 81 83 83 87 89 91
Capability-building ProgramNo. of Trainers
Trained 215 222 403 266 123 110
Number of TVET Graduates 43,332 41,701 40,824 56,877 77,883 64,627
School/Institution-based 28,694 28,628 21,420 33,101 28,470 34,425
Community-based 12,645 20,095 18,868 23,366 45,904 27,557Enterprise-based 1,993 1,843 536 410 3,509 2,645
Number of Scholarship SlotsPESFA 869 1,535 1,298 1,590 2,040 -TWSP 1,915 4,215 7,487 3,611 5,879 3,989
Assessment and CertificationNo. of Persons
Assessed 29,842 37,033 37,969 38,619 44,040 38,796
No. of Persons Certified 24,226 30,645 31,575 33,635 39,223 35,198
Certification Rate (%) 81 83 83 87 89 91
Capability-building ProgramNo. of Trainers
Trained 215 222 403 266 123 110

78 | Regional Development Plan 2017-2022
Table 32: Higher Education Core Indicators Accomplishments, 2011-2015
* LUC-Local Government Unit CollegeSource of data: CHED XII
Enrolment and graduation rates across disciplines in two higher education institutions (USM and CCSPC) showed increases during the assessment periods. Of the total enrolment and graduates from the main campus of USM, the College of Business, Development Economics and Management, College of Education and College of Agriculture consistently produced the highest number of graduates during the period of assessment while the least both in enrolment and graduates is from the Institute of Sports, PE and Recreation. For CCSPC, the highest graduates were those enrolled in BS in Secondary Education
Higher Education while the least are those in Agriculture Technology.
The increase in enrolment in advance education (post graduate studies) showed that more graduates have the desire and drive to grow professionally for better job opportunities. Enrollees in post-graduate studies come from the academe, both private and public and from various government offices, as well. Likewise, instructors who serve the universities and colleges are well-equipped having masters and doctorate degrees in various areas of specialization. This makes them more proficient, effective and efficient in their respective fields of instruction.
INDICATORS 2011 2012 2013 2014 2015 2016
Enrollment across disciplines * 30,858 33,108 35,064 39,337 42,764 -
No. of graduates across disciplines* 11,673 14,647 18,134 20,013 21,821 23,374
Higher Education Faculty with
Master’s Degree 1,149 1,940 2,118 1,916
Doctorate Degree 188 394 431 396
No. of scholarship slots* 459 386 1,326 13,444 19,398 23,459
No. of HEIs
Public SUCs 5 5 5 5 5 5
LUC - - 1 1 1 1
Private 87 87 94 95 95
Passing Percentage in Licensure Examinations across all disciplines (%)
25.58 31.35 30.12 30.19 31.38
As to the scholarships granted to deserving students in various colleges and universities, a decreasing number of slots were recorded in USM. However, sponsors of these scholarships from various national line agencies and local government units and officials are maintained.
Regarding the performance in the licensure examinations of the state colleges and universities, highest rating was in
Social Works and lowest ratings were in Civil Engineering and Bachelor in Secondary Education for CCSPC while that of USM, highest ratings were in Mechanical Engineering, BS in Electronics Communication and BS in Nutrition and Dietetics and the lowest was in BTE-elementary level. There is still a need to improve the performance of graduates in the licensure examinations.
Chapter 10 Accelerating Human Capital Development | 79
Challenges in Industry
The following are the challenges that need to be addressed.
• Mismatch in education sector outputs with manpower requirements of an agri-industrial economy due to the weak linkage between the industry sector, academe, and other stakeholders.
• Need for a strong collaboration among education sector agencies such as: DepEd, CHED, and TESDA in the implementation of the K-12 curricula.
• Inequitable distribution of slots for scholarship programs.
• Need for Training Centers for the out-of-school youth.
• Need for expanded training programs for women, persons with disabilities
(PWDs) and senior Citizens.• Need for Training for Entrepreneurship
and Family Enterprises.• Need for support funds for the provision
of skills training programs for surfacing personalities involved in drugs and inmates and their families.
• Untapped skills of returning migrants due to lack of employment opportunities for them and inadequate reintegration program support.
• On Technical-Vocational and Higher Education: - Low performance in the licensure examinations across disciplines- Irrelevant courses not responsive to the needs of industries and manpower requirements of the region
Priority Strategy
The priority strategies to address the challenges are the following:
• Conducting studies on matching education sector outputs with the manpower requirements of Region XII’s agri-industrial economy.
• Reviewing and developing curricula that are more relevant and responsive to the manpower needs of industries in the region.
• Strengthening academe-industry linkages and collaboration
• Establishing stronger collaboration
among education agencies.• Establishing provincial training
centers to cater to young boys and girls dropping out from school.
• Supporting Project Duterte and strengthen collaboration with NGAs concerned with drug dependents and inmates
• Expanding community-based training programs for women, PWDs, senior citizens and returning migrants.
• Integrating entrepreneurship training to institution-based, enterprise-based and community-based programs
Targets
The targets shall support the foundation for inclusive growth, high-trust society and a globally competitive knowledge economy with the outcome on increased returns to human capital. The objectives
of the interventions would be to invest in human capital development and match skills and training to meet the demand of businesses and the private sector.

80 | Regional Development Plan 2017-2022
Human Development as an End to ItselfBasic education is the foundation of every school age child towards shaping his/her future as a productive citizen. Hence, schools must be made accessible even in far-flung areas. Considering the importance of instructional materials and learning resources in the learners’ growth, the development of curriculum materials shall be pursued to be utilized in the next five years and beyond. The lack of classrooms and teachers which are vital in the learning process shall be addressed to ensure the quality education of the school children. To hone the skills and inclinations of the young, fund support shall be increased for schools implementing special curricular programs such as the special Education for the differently-abled and those in the secondary with special talents in the arts and sports, as well as, those who are inclined to pursue science, engineering, and mathematics.
To ensure that all school-age children are given equal opportunities to basic education, the alternative Learning System (ALS) shall be strengthened and other learning modes shall be delivered for the
Table 33: Persons Assessed and Certified, Region XII, 2017-2022
Source of data: TESDA XII
Indicator
Base Year Annual Plan Targets
2015 2017 2018 2019 2020 2021 2022
No. of persons assessed 44,040 44,040 46,242 48,554 50,981 53,531 56,207
No. of persons certified 39,223 37,434 39,445 41,457 43,468 45,479 49,502
marginalized learners in special situations. With the expansion of the Conditional Cash Transfer, poor students aged 18 and above and have completed Grade 10 will be assisted to proceed to Grades 11 and 12 or the senior high school. One strategy for increasing the survival and completion rates of school children is to ensure their physical and mental health and nutrition status. Healthy children can learn their lessons fast and participate well in school activities.
Health begins from conception and the nutritional status of pregnant mothers is equally important with both the physical and mental condition of the unborn child. Thus, the health sector aims to reduce the prevalence of malnutrition among children and lactating mothers and shall continue to implement programs that will reduce MMR and IMR. The sector shall also continue providing health services for the populace, particularly the disadvantaged sectors in the region and would endeavor to address the lack of health manpower and improvement/ upgrading of hospitals and their facilities.
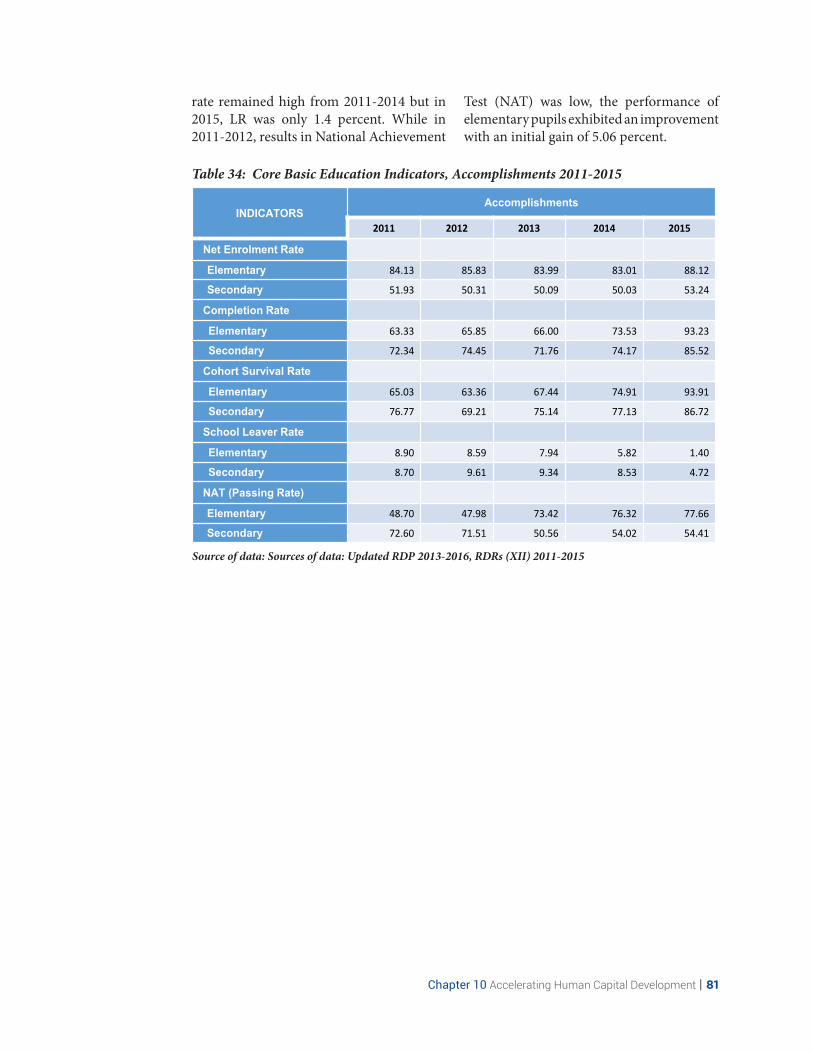
In the elementary level, while participation rate was high, an erratic trend was noted from 2013-2014 and in 2015, PR increased by more than 5 percent. Completion rate
Basic Education from 2013-2015 showed an improvement and in 2015 a very significant increase of more than 20 percent from the previous year was recorded. Similarly, a significant increase was also noted in the survival rate of elementary pupils in 2015. School leaver
Assessment
Chapter 10 Accelerating Human Capital Development | 81
rate remained high from 2011-2014 but in 2015, LR was only 1.4 percent. While in 2011-2012, results in National Achievement
Test (NAT) was low, the performance of elementary pupils exhibited an improvement with an initial gain of 5.06 percent.
Table 34: Core Basic Education Indicators, Accomplishments 2011-2015
Source of data: Sources of data: Updated RDP 2013-2016, RDRs (XII) 2011-2015
INDICATORSAccomplishments
2011 2012 2013 2014 2015
Net Enrolment Rate
Elementary 84.13 85.83 83.99 83.01 88.12
Secondary 51.93 50.31 50.09 50.03 53.24
Completion Rate
Elementary 63.33 65.85 66.00 73.53 93.23
Secondary 72.34 74.45 71.76 74.17 85.52
Cohort Survival Rate
Elementary 65.03 63.36 67.44 74.91 93.91
Secondary 76.77 69.21 75.14 77.13 86.72
School Leaver Rate
Elementary 8.90 8.59 7.94 5.82 1.40
Secondary 8.70 9.61 9.34 8.53 4.72
NAT (Passing Rate)
Elementary 48.70 47.98 73.42 76.32 77.66
Secondary 72.60 71.51 50.56 54.02 54.41
82 | Regional Development Plan 2017-2022
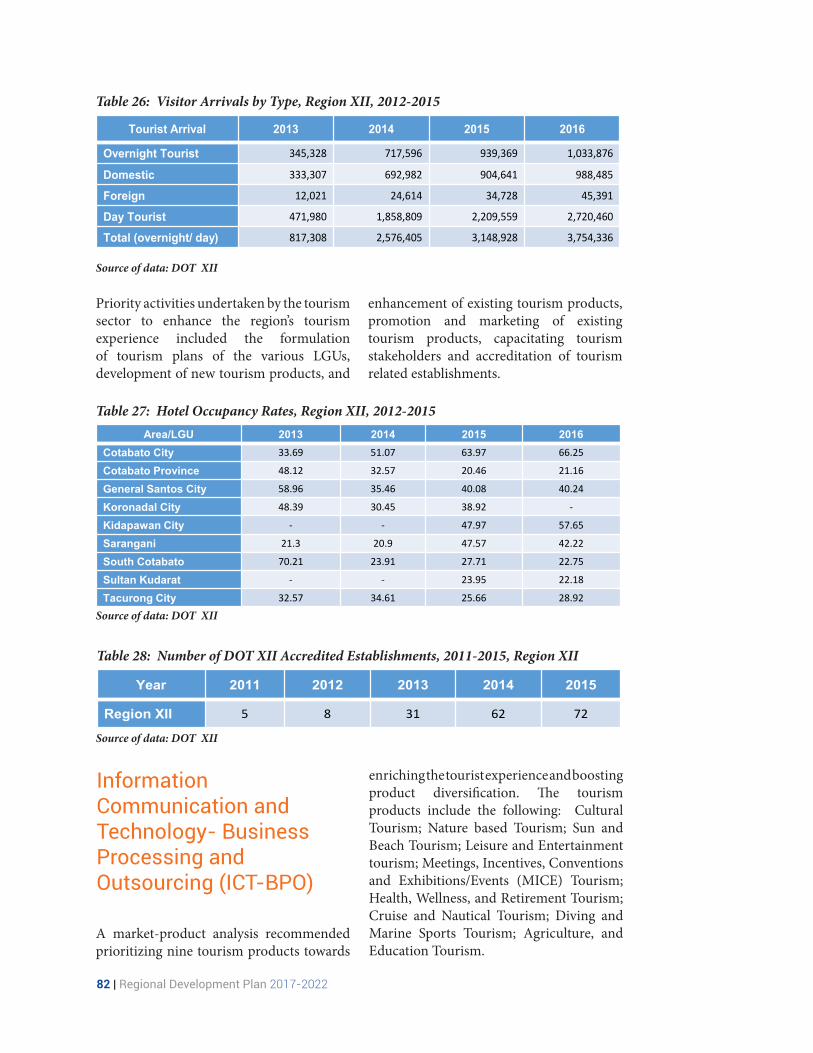
Table 26: Visitor Arrivals by Type, Region XII, 2012-2015
Source of data: DOT XII
Tourist Arrival 2013 2014 2015 2016
Overnight Tourist 345,328 717,596 939,369 1,033,876
Domestic 333,307 692,982 904,641 988,485
Foreign 12,021 24,614 34,728 45,391
Day Tourist 471,980 1,858,809 2,209,559 2,720,460
Total (overnight/ day) 817,308 2,576,405 3,148,928 3,754,336
Priority activities undertaken by the tourism sector to enhance the region’s tourism experience included the formulation of tourism plans of the various LGUs, development of new tourism products, and
enhancement of existing tourism products, promotion and marketing of existing tourism products, capacitating tourism stakeholders and accreditation of tourism related establishments.
Table 27: Hotel Occupancy Rates, Region XII, 2012-2015
Source of data: DOT XII
Area/LGU 2013 2014 2015 2016Cotabato City 33.69 51.07 63.97 66.25
Cotabato Province 48.12 32.57 20.46 21.16
General Santos City 58.96 35.46 40.08 40.24
Koronadal City 48.39 30.45 38.92 -
Kidapawan City - - 47.97 57.65
Sarangani 21.3 20.9 47.57 42.22
South Cotabato 70.21 23.91 27.71 22.75
Sultan Kudarat - - 23.95 22.18
Tacurong City 32.57 34.61 25.66 28.92
Table 28: Number of DOT XII Accredited Establishments, 2011-2015, Region XII
Source of data: DOT XII
Year 2011 2012 2013 2014 2015
Region XII 5 8 31 62 72
A market-product analysis recommended prioritizing nine tourism products towards
Information Communication and Technology- Business Processing and Outsourcing (ICT-BPO)
enriching the tourist experience and boosting product diversification. The tourism products include the following: Cultural Tourism; Nature based Tourism; Sun and Beach Tourism; Leisure and Entertainment tourism; Meetings, Incentives, Conventions and Exhibitions/Events (MICE) Tourism; Health, Wellness, and Retirement Tourism; Cruise and Nautical Tourism; Diving and Marine Sports Tourism; Agriculture, and Education Tourism.
Chapter 10 Accelerating Human Capital Development | 83
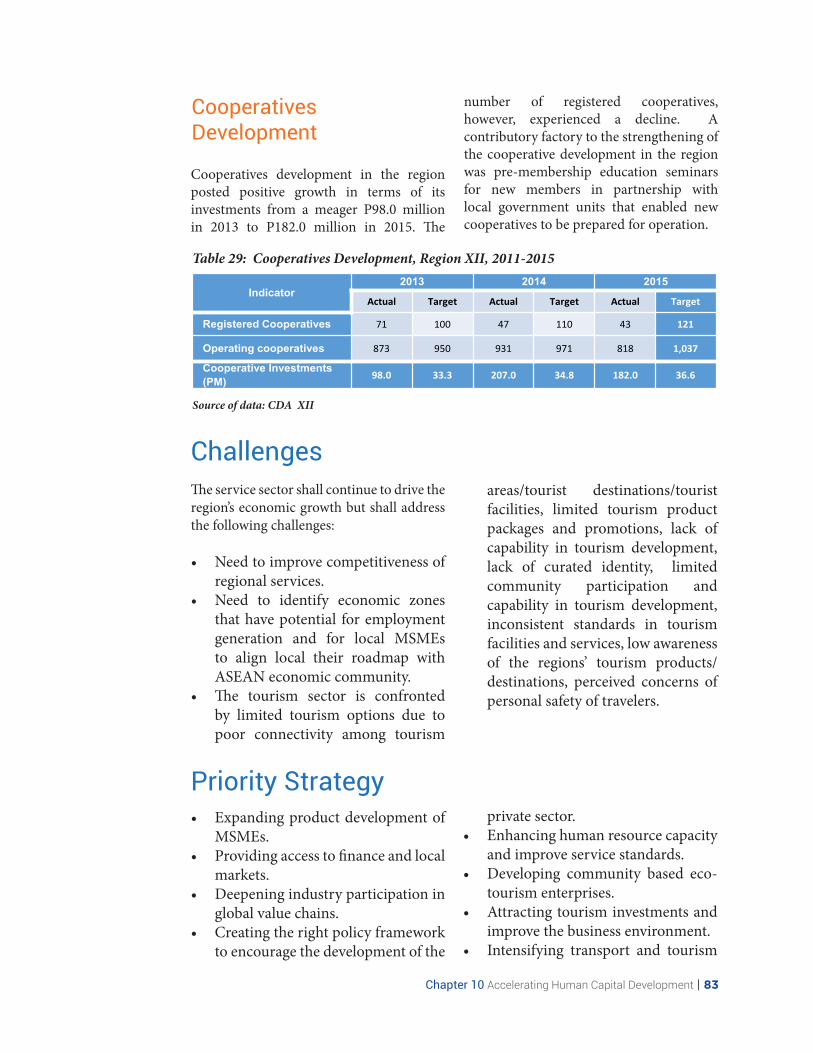
Cooperatives development in the region posted positive growth in terms of its investments from a meager P98.0 million in 2013 to P182.0 million in 2015. The
Cooperatives Development
number of registered cooperatives, however, experienced a decline. A contributory factory to the strengthening of the cooperative development in the region was pre-membership education seminars for new members in partnership with local government units that enabled new cooperatives to be prepared for operation.
Table 29: Cooperatives Development, Region XII, 2011-2015
Source of data: CDA XII
Indicator2013 2014 2015
Actual Target Actual Target Actual Target
Registered Cooperatives 71 100 47 110 43 121
Operating cooperatives 873 950 931 971 818 1,037
Cooperative Investments (PM) 98.0 33.3 207.0 34.8 182.0 36.6
ChallengesThe service sector shall continue to drive the region’s economic growth but shall address the following challenges:
• Need to improve competitiveness of regional services.
• Need to identify economic zones that have potential for employment generation and for local MSMEs to align local their roadmap with ASEAN economic community.
• The tourism sector is confronted by limited tourism options due to poor connectivity among tourism
areas/tourist destinations/tourist facilities, limited tourism product packages and promotions, lack of capability in tourism development, lack of curated identity, limited community participation and capability in tourism development, inconsistent standards in tourism facilities and services, low awareness of the regions’ tourism products/destinations, perceived concerns of personal safety of travelers.
Priority Strategy• Expanding product development of
MSMEs.• Providing access to finance and local
markets.• Deepening industry participation in
global value chains.• Creating the right policy framework
to encourage the development of the
private sector. • Enhancing human resource capacity
and improve service standards.• Developing community based eco-
tourism enterprises.• Attracting tourism investments and
improve the business environment.• Intensifying transport and tourism

84 | Regional Development Plan 2017-2022
infrastructure development.• Improving skills and services of
DOT accredited tourism enterprises.
Priority Strategy• Expanding product development of
MSMEs.• Providing access to finance and local
markets.• Deepening industry participation in
global value chains.• Creating the right policy framework
to encourage the development of the private sector.
• Enhancing human resource capacity and improve service standards.
• Developing community based eco-tourism enterprises.
• Attracting tourism investments and improve the business environment.
• Intensifying transport and tourism infrastructure development.
• Improving skills and services of DOT accredited tourism enterprises.
• Promoting agriculture tourism and the dive, nature, sun and beach.
• Promoting agriculture tourism and the dive, nature, sun and beach.
Target Table 30: Cooperatives Development Targets, 2017-2022
Source of data: CDA XII
INDICATORTarget
2017 2018 2019 2020 2021 2022
Registered Cooperatives 50 50 75 75 80 80
Operating cooperatives 870 920 995 1070 1150 1230
Cooperative Assets (PM) 10,500 10,900 11,550 12,670 13,937 14,076
Cooperative Investments (P’000) 4,500,000 4,950,000 5,445,000 5,989,500 6,588,450 6,589,109
Priority Legislative Agenda