
RCV
54
Biological Variation 1 - Prague - 16 May 2006 Biological Variation: From Principles to Practice Dr Callum G Fraser Biochemical Medicine - NHS Tayside Ninewells Hospital and Medical School Dundee Scotland
-
Upload
robson-machado -
Category
Documents
-
view
215 -
download
2
description
Apresentação sobre Reference Change Value
Transcript of RCV

Biological Variation 1 - Prague - 16 May 2006
Biological Variation: From Principles to Practice
Dr Callum G FraserBiochemical Medicine - NHS Tayside
Ninewells Hospital and Medical School
Dundee Scotland

Biological Variation 1 - Prague - 16 May 2006
������������������������ ��
After this lecture, participants should :
• be able to list the types of biological variation,• know how to generate and/or find data on random
biological variation, and• appreciate how to use the data in laboratory medicine.

Biological Variation 1 - Prague - 16 May 2006
������������������������ ��
Participants should appreciate how to use data on biological variation in:
• setting quality specifications, • assessing the significance of changes in serial results from
an individual,• deciding the utility of conventional population based
reference values, and • managing aspects of quality.

Biological Variation 1 - Prague - 16 May 2006
��������������������
Variation over the span of lifePredictable rhythmical/cyclical variationRandom variation around setting points

Biological Variation 1 - Prague - 16 May 2006
������������������������������
Some analytes change over the span of life -
• neonatal period• childhood• puberty• menopause• old age
This is taken care of by creation of age stratified reference values when needed.

Biological Variation 1 - Prague - 16 May 2006
����������������� ������������������� �
• Dailycortisol, growth hormone
• MonthlyLH, FSH, progesterone
• Seasonalvitamin D - also cholesterol, HbA1c

Biological Variation 1 - Prague - 16 May 2006
������ �������������� ��������� ��������
� it is impossible to develop good reference values for every time point during the cycle
• knowledge of the expected values throughout the cycle is vital for clinical interpretation
� for some analytes, samples should be taken at relevant times for the clinical purpose
� absence of the expected cycle may provide clinically useful information

Biological Variation 1 - Prague - 16 May 2006
� �������������� ����� ����������
A series of four results taken from an individual
Sodium [mmol/L] 137 139 136 138 [135 -147]Potassium [mmol/L] 4.3 4.6 4.5 4.4 [3.5 - 5.0]Urea [mmol/l] 4.0 4.4 4.1 3.9 [3.3 - 6.6]Creatinine [�mol/L] 88 97 89 92 [64 - 120]Bilirubins [�mol/L] 19 21 16 20 [up to 17]

Biological Variation 1 - Prague - 16 May 2006
�����������������������������������
• Preparation of subject
– fasting– exercise– posture

Biological Variation 1 - Prague - 16 May 2006
� ��������������� ����������
• Pre-analytical - preparation of subjectsample collection and handling
Examples of increase in large molecules and quantities bound to large molecules on venous stasis

Biological Variation 1 - Prague - 16 May 2006
�����������������������������������
• Preparation of subject
– fasting– exercise– posture
• Sample collection and handling
– type of sample– anticoagulant– tourniquet– transport time– centrifugation
Biological Variation 1 - Prague - 16 May 2006
� ��������������� ���������������������
Analytical - imprecisionchanges in bias

Biological Variation 1 - Prague - 16 May 2006
� ��������������� ���������������������
Imprecision - random error - usually expressed as SD or CV [SD/mean]*100
• intrinsic to all measurements, • due to factors such as variations in
temperature, volume of sample or reagent delivered, AND
• is method dependent.

Biological Variation 1 - Prague - 16 May 2006
� ��������������� ���������������������
Bias - systematic error [due to calibration and other constant sources of error]
constant bias does not affect results over time [they may all be low or all be high due to bias] but changes in bias - most importantly on re-calibration of methods - is a source of variation in serial results

Biological Variation 1 - Prague - 16 May 2006
�!��������������� ����������������� �������������������
Series 1 Series 2140 140 Series 1 done with one141 142 calibrator - mean = 140 mmol/L139 141 SD = 1.15 mmol/L140 141142 139 Series 2 - after re-calibration138 143 mean = 141 mmol/L139 140 SD = 1.15 mmol/L141 141140 142 Overall SD = 1.24 mmol/L140 141

Biological Variation 1 - Prague - 16 May 2006
� ��������������� ����������
• Pre-analytical - preparation of subjectsample collection/handling
• Analytical - imprecisionchanges in bias
• Biological - within-subject biological variation

Biological Variation 1 - Prague - 16 May 2006
"���� ����������������������
A series of four results taken from each of a cohort of four individuals - sodium [mmol/L]
Individual 1 137 139 136 138 [135 -147]Individual 2 144 146 145 144 [135 -147]Individual 3 141 143 142 140 [135 -147] Individual 4 136 138 137 135 [135 -147]
homeostatic setting points do vary amongst individuals - between-subject biological variation

Biological Variation 1 - Prague - 16 May 2006
#���������������������������
Date Creat Urea Alb Age eGFR11 March 1992 92 4.4 45 47 87.421 April 1995 97 4.3 46 50 82.923 January 1996 86 3.7 45 51 94.928 August 1998 94 4.7 44 53 82.312 July 1999 88 4.3 44 54 88.913 January 2003 89 4.4 42 58 85.2
Derived indices have random variation over time!

Biological Variation 1 - Prague - 16 May 2006
$ ��������������� ����������� ���������� ������������������������������
• select a small number of reference individuals• apply exclusion criteria [just as for reference values]• take samples at intervals minimizing pre-analytical
sources of variation [subject preparation and sample collection and handling]
• store as to ensure stability• analyze in random duplicate in one batch• look for outliers [complex]• use nested ANOVA to determine CVA, CVI, CVG

Biological Variation 1 - Prague - 16 May 2006
� �������������������������������� ���������������%&����'����

Biological Variation 1 - Prague - 16 May 2006
( �����������������������������)
It is dogma that all laboratories generate their own reference values
- analogously, do all laboratories have to generate their own data on components of biological variation?
The answer is ………….absolutely NOT!

Biological Variation 1 - Prague - 16 May 2006
* ���������'��������������������������������� ��������������#
No Time Sex Na Urea Country
11 2 weeks M 0.7 12.3 Denmark10 4 weeks M 0.9 14.3 USA10 8 weeks M 0.6 9.5 Germany14 8 weeks F 0.5 11.3 Germany9 12 weeks M 1.4 13.6 USA11 15 weeks M 0.6 15.7 Denmark37 22 weeks M 0.5 11.1 England15 40 weeks M&F 0.7 13.9 Scotland

Biological Variation 1 - Prague - 16 May 2006
����������������������������������������������#
Quantity Young ElderlySodium 0.7 0.9Urea 13.8 10.3Calcium 2.1 1.6Albumin 2.2 2.6Cholesterol 4.9 5.8
Glucose 4.8 4.7

Biological Variation 1 - Prague - 16 May 2006
* ���������'���������������������������#
Analyte Australia Scotland SpainSodium 28.0 26.5 28.7Calcium 25.1 26.2 27.5Creatinine 11.2 11.0 15.0Phosphate 16.6 16.9 20.6

Biological Variation 1 - Prague - 16 May 2006
+ ���������������������������
Over the years, many compilations, most recent -
Ricos C, et al. Current databases on biologic variation: pros, cons and progress.Scand J Clin Lab Invest 1999;59:491-500
2006 update at www.westgard.com/guest32.htm
Available at www.aacc.org

Biological Variation 1 - Prague - 16 May 2006
Clinical Chemistry. 2006;52:650-656© 2006 American Association for Clinical Chemistry, Inc.
Estimation and Application of Biological Variation of Urinary Delta -Aminolevulinic Acid and Porphobilinogen in Healthy Individuals and in Patients with Acute Intermittent Porphyria
Aasne K. Aarsand1,a, Per Hyltoft Petersen2 and Sverre Sandberg1,2

Biological Variation 1 - Prague - 16 May 2006
����������������������������������������
, ��������!��������������������
• assessing the significance of changes in serial results from an individual
• deciding the utility of conventional population based reference values
• other uses in quality management

Biological Variation 1 - Prague - 16 May 2006
� �������!��������������������
Imprecision < x • CVI
For most situations, x should be 0.5 [1/2].

Biological Variation 1 - Prague - 16 May 2006
� �������!��������������������
Bias < y • [CVI2 + CVG
2]½
For most situations, y should be 0.25 [1/4].
Nobias
Positivebias
RILRL URL
Nobias
Positivebias
RILRL URL

Biological Variation 1 - Prague - 16 May 2006
� �������!��������������������
• Total error < Z• x • CVI + y • [CVI2 + CVG
2]½
• Other specifications based on biology include:reference methodsfixed limits for EQASallowable difference between 2 methods.

Biological Variation 1 - Prague - 16 May 2006
����������������
• setting quality goals,, ���������������������������������������������������������������������������������������������������� �������������������������������� ��������������
• deciding the utility of conventional population based reference values
• other uses in quality management

Biological Variation 1 - Prague - 16 May 2006
"����������������������
In order to decide whether a change is due to the patient improving or deteriorating, the “critical difference” or “reference change value” that would be expected due to inherent sources of variation must be exceeded
RCV depend on probability [Z], analytical [CVA] and within-subject biological [CVI] variation, if pre-analytical variation is minimized -
Change > RCV = 21/2 * Z * [CVA2 + CVI
2]1/2

Biological Variation 1 - Prague - 16 May 2006
"����������������������
Each result has a dispersion dependent on -probability [Z],analytical [CVA] and biological [CVI] variation -First result - Z * [CVA
2 + CVI2]1/2
Second result - Z * [CVA2 + CVI
2]1/2
Total variation = [sum of squares]1/2
= {Z 2 * [CVA2 + CVI
2] + Z 2 * [CVA2 + CVI
2]}1/2
= 21/2 * Z * [CVA2 + CVI
2]1/2

Biological Variation 1 - Prague - 16 May 2006
���������������"�#
RCV = 2½ � Z � [CVA2 + CVI
2]½
• use 2½ because we have 2 samples• use 1.96 and 2.58 as the Z-scores for significant
and highly significant respectively• use CVA from your own IQC program - at
“clinically significant levels” • use CVI from the most recent data base available
[as per Carmen Ricos and colleagues]

Biological Variation 1 - Prague - 16 May 2006
���� �������������������

Biological Variation 1 - Prague - 16 May 2006
������������"�#
• in reporting of results to aids clinical interpretation
• in auto-verification• in delta checking
This will be explored in Biological Variation 2 in more detail.

Biological Variation 1 - Prague - 16 May 2006
����������������
• setting quality goals• assessing the significance of changes in serial
results from an individual, ��������������������������������������������������������������������
• other uses in quality management
Biological Variation 1 - Prague - 16 May 2006
-���������������������������������.�����������
Biological Variation 1 - Prague - 16 May 2006
1234
0 25 50 75 100 125
1234
0 5 10 15 20 25
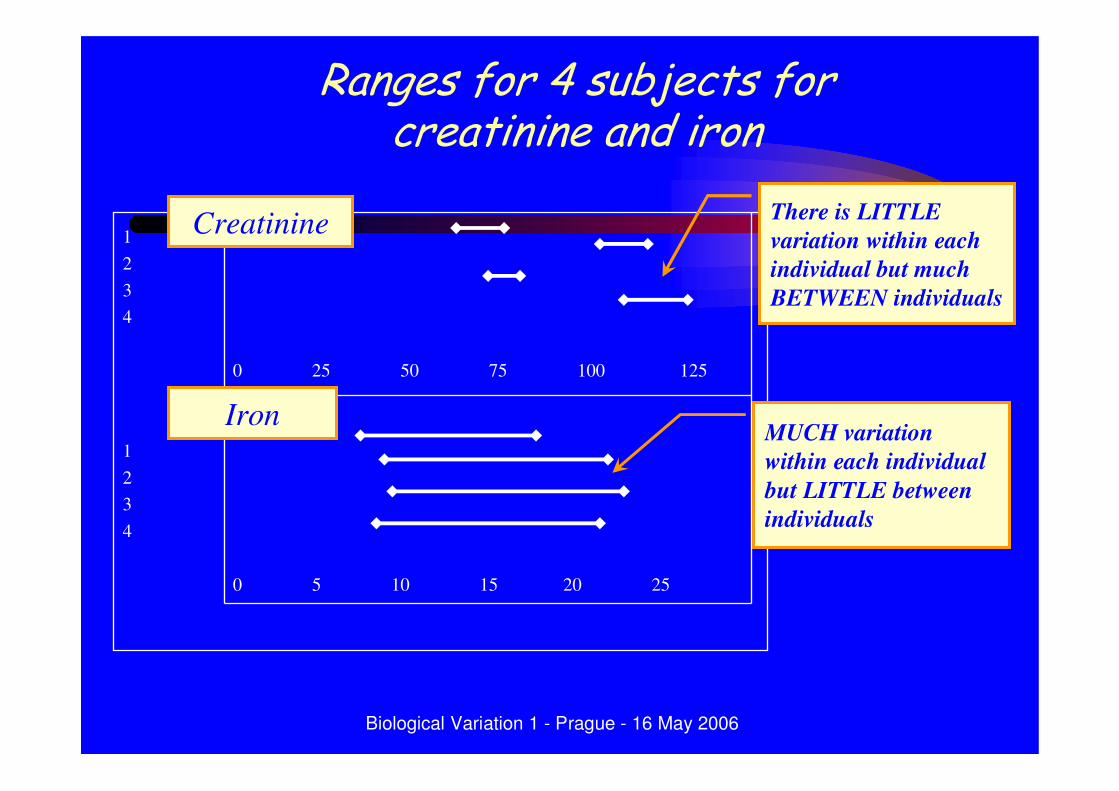
Creatinine
Iron
There is LITTLE variation within each individual but much BETWEEN individuals
MUCH variation within each individual but LITTLE between individuals
"����������/����'���������������������������

Biological Variation 1 - Prague - 16 May 2006
-��������������������
• this is easily calculated as - CVI/CVG
• it is important to note that a low index of individuality means that the analyte has marked individuality whereas a high index of individuality means that the analyte has little individuality
• creatinine has II of 0.33, iron has II of 1.4

Biological Variation 1 - Prague - 16 May 2006
-�������������������������������������
• When II is low [0.6], values for any individual span only a small part of the reference interval. Reference values will be of little utility, particularly when deciding whether changes in an individual have occurred. RCV preferred!
• In contrast, when II is high [1.4], values from an individual will cover much of distribution of the reference interval de. Thus, conventional reference values will be of significant value in many clinical settings.

Biological Variation 1 - Prague - 16 May 2006
"����������0�� � �������1� �������������������������������

Biological Variation 1 - Prague - 16 May 2006
-��������������������������������
Group Within Between II
Whole 13.0 28.2 0.46Women 15.7 11.0 1.42
Men 11.0 6.0 1.83
This provides a scientific basis why stratification of reference values is often desirable.

Biological Variation 1 - Prague - 16 May 2006
-�������������������������������
Is electrophoresis of serum to look for abnormal immunoglobulins an obsolete test? Proposal - measure IgG, IgA, IgM, kappa-chains [�] and lamba-chains [�]and calculate the heavy [IgG + IgA + IgM] to light chain [� + �] ratio and the �/� ratio to see if there was abnormal immunoglobulin and what type of protein was present.
Can biological variation data shed light on the clinical utility of this approach to diagnosis?

Biological Variation 1 - Prague - 16 May 2006
-����������������� �������������������������������
Analyte Within Between II
• IgG 4.4 13.0 0.34• IgA 5.0 35.0 0.14• IgM 5.9 48.5 0.12• � 4.8 15.3 0.31• � 4.8 17.3 0.28• �/� ratio 0.7 12.1 0.06• H/L ratio 4.2 4.8 0.87

Biological Variation 1 - Prague - 16 May 2006
"����������������� �����
12345678910
1.3 1.5 1.7 1.9 2.1

Biological Variation 1 - Prague - 16 May 2006
-������������������ �������������������
Analyte Within Between II
• hemoglobin 2.8 6.6 0.42• hematocrit 2.8 6.6 0.42• MCV 1.3 4.8 0.27• erythrocytes 3.2 6.1 0.52• leukocytes 10.4 27.8 0.37
• platelets 9.1 21.9 0.42

Biological Variation 1 - Prague - 16 May 2006
-�������������
• few analytes have II greater than 1.4• most analytes have II less than 0.6• reference values usually not of great utility -
especially for monitoring• hardly surprising that laboratory tests not good
for case finding or screening• stratification of reference values increases II

Biological Variation 1 - Prague - 16 May 2006
2 ��������������#
Number of samples needed to ensure estimate is within a certain percentage of the homeostatic setting point with a predetermined probability –
n = (Z * [CVA2 + CVI
2]½/D)2
where Z is the Z-score appropriate for the probability eg1.96 for P < 0.05 and D is the desired percentage closeness.

Biological Variation 1 - Prague - 16 May 2006
���� ���� �����������
• within-subject variation CVI= 6% maximum imprecision -NCEP CVA= 3%
• estimate to be within 5% of the true homeostatic setting point with 95% probability n = (Z * [CVA
2 + CVI2]½/D)2 = (1.96 * [32 + 62]½/5)2 = 7
decreasing the number of samples required done by -• lowering probability • increasing window of acceptability• decreasing imprecision
Biological Variation 1 - Prague - 16 May 2006
� ������������������� ��
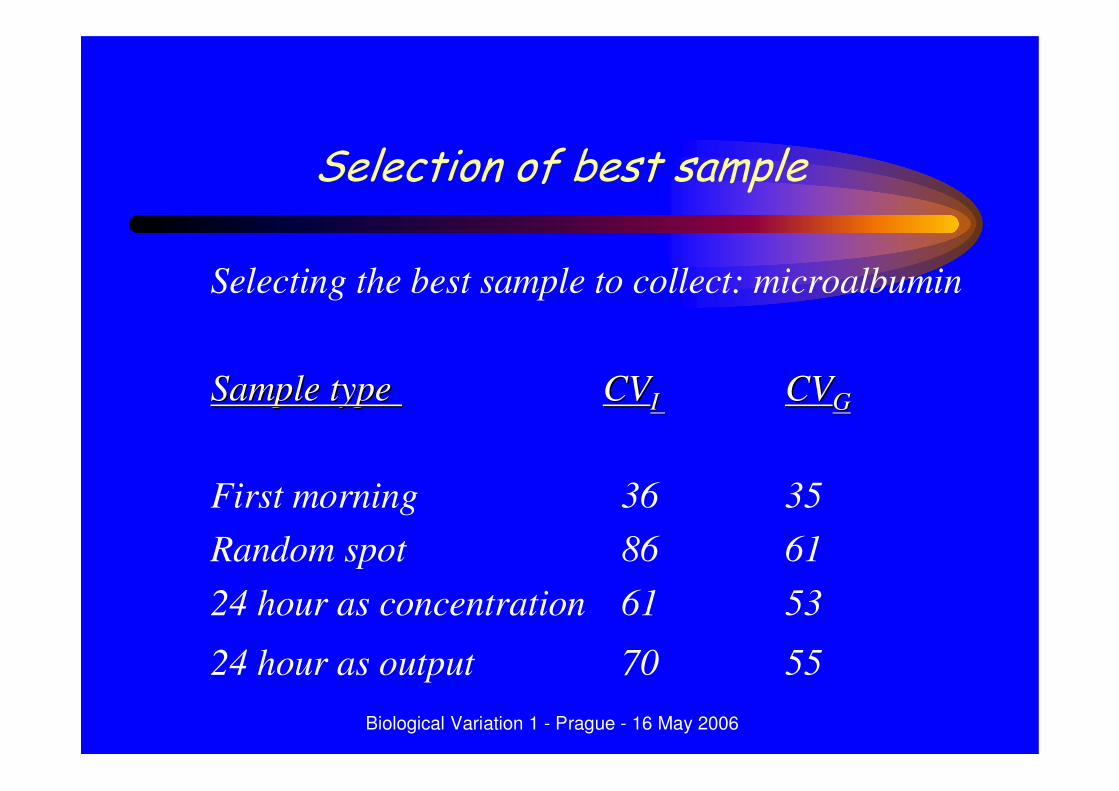
Selecting the best sample to collect: microalbumin
Sample typeSample type CVCVI I CVCVGG
First morning 36 35Random spot 86 6124 hour as concentration 61 53
24 hour as output 70 55

Biological Variation 1 - Prague - 16 May 2006
�� ���������������
AnalyteAnalyte CVCVI I CVCVGG
cystatin-C 13.3 8.1creatinine 4.9 18.2
consider individuality and RCV - cystatin-C will be better in diagnosis [less individual] but creatinine better in monitoring [smaller RCV].

Biological Variation 1 - Prague - 16 May 2006
�� �����������������������������������
1234
0 25 50 75 100 125
1234
0 5 10 15 20 25
Creatinine
Cystatin-C
There is MUCH variation between each individual -high individuality
There is LITTLE variation between each individual -low individuality

Biological Variation 1 - Prague - 16 May 2006
$ �������������������������������������������������������
Usually not necessary to generate your own data-use existing database - then apply in -
• setting quality specifications,• assessing the significance of changes in serial
results from an individual,• deciding the utility of conventional population
based reference values, and• other uses in quality management.


![FSAE Brochure 4-29-19 - RCV Performance Products · 2020-02-25 · [FSAE BROCHURE] RCV Performance RCV Performance | Sales@rcvperformance.com 10 Snap ring groove cutting print and](https://static.fdocuments.net/doc/165x107/5e8c5f41bffc4f21c32e0f89/fsae-brochure-4-29-19-rcv-performance-products-2020-02-25-fsae-brochure-rcv.jpg)


