RCM Baltic report 2015 Final version 191115
151
1 FINAL Report of the Regional Co-ordination Meeting for the Baltic Sea region (RCM Baltic) 2015 Fish Resources Research Department of Institute BIOR Daugavgrivas str. 8, RIGA, LATVIA 24 – 28 August, 2015 (19 th November 2015)
Transcript of RCM Baltic report 2015 Final version 191115

1
FINAL
Report of the Regional Co-ordination Meeting
for the Baltic Sea region (RCM Baltic)
2015
Fish Resources Research Department of Institute BIOR Daugavgrivas str. 8, RIGA, LATVIA
24 – 28 August, 2015
(19th November 2015)
2
Table of Contents
Table of Contents .............................................................................................................. 2 1. Executive summary .................................................................................................. 4 2. Introduction ........................................................................................................... 7
2.1 General ............................................................................................................... 7 2.2 Background & legal requirements ................................................................................... 7 2.3 Terms of Reference .................................................................................................. 8 2.4 Structure of the report ................................................................................................ 9 2.5 Participants ......................................................................................................... 10
3. Progress in regional co-ordination since 214 following up the 11th Liaison Meeting outcome .................. 11 3.1 Follow-up of recommendations from the 2013 Liaison meeting ................................................ 11
4. Feedback from end-users and expert groups ...................................................................... 21 4.1 ICES general feed-back ............................................................................................ 21 4.2 WGCATCH 2014 .................................................................................................. 22 4.3 PGDATA ........................................................................................................... 23 4.4 WKISCON2 ........................................................................................................ 24 4.5 RDB-SC ............................................................................................................ 24 4.6 WKRDB 5 .......................................................................................................... 25 4.7 STECF general feed-back ......................................................................................... 26 4.8 STECF expert workshop on tranversal variables ................................................................. 27
5. Regional data collection, analysis and storage and evolution towards Regional Coordination Groups (RCGs) .............................................................................................................. 29 5.1 The FishPie project (mare/2014/19) ............................................................................... 29 5.2 Progress in data quality screening, harmonisation of national and regional data checking
procedures .......................................................................................................... 29 5.3 Design-based sampling: state of play ............................................................................. 31 5.4 Bilateral and multilateral agreements in place .................................................................... 31 5.5 Areas and topics where there is a need for intra-institute intersessional work .................................. 33
6. Analysis of RDB 2014 data ........................................................................................ 34 6.1 Status of the Regional Data Base (RDB) ......................................................................... 34 6.2 Response of the data call........................................................................................... 37 6.3 Métier-related sampling............................................................................................ 40
6.3.1 Ranking of métiers ..................................................................................... 40 6.3.2 Updated métier list ..................................................................................... 41
6.4 Stock-related sampling ............................................................................................. 41 6.4.1 Ranking of species ..................................................................................... 41 6.4.2 Case studies – Cod, sprat and herring ................................................................. 42
6.5 Landings by stock and harbour .................................................................................... 44 6.6 Sampling intensity ................................................................................................. 44
6.6.1 General overview ....................................................................................... 44 6.6.2 Data limited stocks (DLS) ............................................................................. 45 6.6.3 Salmon, sea trout and eel .............................................................................. 46
6.7 Task sharing for biological data ................................................................................... 47 7. Proposal for task sharing and criteria for joint surveys ........................................................... 48 8. Amendments needed to NP for 2016 .............................................................................. 49 9. Future funding mechanisms to continue strengthening regional cooperation .................................... 50
Study proposal on .................................................................................................. 50 ”Development of the Regional DataBase for support of RCM/RCGs and other user” ......................... 50 (Priority 1) .......................................................................................................... 50 RCM Baltic agreement on intermidiate solution for the WebGR ............................................... 51 Study proposal for .................................................................................................. 53 “Further development and improvement of WebGR ............................................................. 53 (PRIORITY 2) ...................................................................................................... 53
10. Landing obligation ................................................................................................. 54 10.1 Impact of the introduction of the landing obligation, and/or preparations for its implementation ............. 54 10.2 Operation of at-sea observer programmes and role of scientific observers ..................................... 54 10.3 Quality and integrity of catch data collected by the control agencies, i.e. logbook sales notes data ........... 55 10.4 Generation of catch estimates derived from sampling programme data ......................................... 55 10.5 Experiences of on-shore sampling of landed discards ........................................................... 57
11. National Administrations ........................................................................................... 58

3
11.1 Issues relating specifically to national administrations and the role of NC within the RCM/RCG context .............................................................................................................. 58
11.2 Harmonisation of control agency data collection, and the cross border sharing of control agency data, for vessels operating and landing outside their flag country ............................................... 59
11.3 Harmonisation of catch data recording e.g. metiers .............................................................. 59 11.4 The position of national administrations on populating the Regional Data Base according to the
RCM data call with i) Landings and effort data and ii) Sampling data .......................................... 59 11.5 Task sharing and task trading mechanisms within the context of a regional sampling design ................. 60
12. Future multi-annual programme for data collection ............................................................... 61 12.1 List of research surveys to be carried out in the region in 2016 ................................................. 61 12.2 Recreational fisheries necessary for the ICES advice ............................................................ 61 12.3 Comment on list of proposed stocks & biological variables to be included in EU MAP ...................... 62
13. Any other busines .................................................................................................. 63 13.1 Request from the Commission for the RCM’s to consider the impact of the implementation of the
landing obligation on the DCF data collection programmes ..................................................... 63 13.2 Eastern Baltic cod – needs for tagging study ..................................................................... 64
14. Glossary ............................................................................................................ 65 15. References .......................................................................................................... 68 16. Summary of recommendations ..................................................................................... 70 Annex 1. Agenda for the RCM Baltic 2015 ................................................................................ 72 Annex 2: Ranking of métiers ................................................................................................ 77 Annex 3: Updated métier list for the Baltic region per 28/08/2015 ...................................................... 105 Annex 4: Ranking of species .............................................................................................. 107 Annex 5: Age Length relationship for cod, herring and sprat ............................................................ 113 Annex 6: Age weight relationship for cod, herring and sprat ............................................................ 116 Annex 7: Harbours accounting for 95% of the landings by stock in the Baltic Sea area ................................ 119 Annex 8: Overviews of length measurements and weight, age, sex and maturity samples ............................. 137 Annex 9: Sampling intensity on salmon, sea trout and eel ............................................................... 146 Annex 10. Reply to questionaires on implementation of the landing obligation in the Baltic .......................... 150

4
1. Executive summary
The RCM Baltic met in Riga (Latvia) between 24 and 28 August 2015. The main purpose of the RCM is to coordinate the data collection carried out by EU Members States (MS) in the region concerned. For the RCM Baltic 2015 the coordination on the 2016 data collection in the Baltic region was limited as the MS’s National Programmes for 2011-2013 have been rolled over for the period 2014-2016. Therefore, the main focus at this year RCM meeting was i) assess the consequences of the implementation of the landing obligation on the DCF data collection programmes, ii) to improve data quality, iii) to take the first steps towards establishing regional programmes instead of national programmes, iv) the view of the national administrations on regional coordination and cooperation and regional data base issues, and finally v) the evolution towards the RCG’s (Regional Coordination Groups).
A data call was launched by the chairs of the RCM Baltic, RCM NS&EA and the RCM NA where MS were requested to upload data for 2014 into the regional data base (RDB FishFrame) hosted by ICES. All Baltic MS have put a lot of effort into quality assurance of the data and all complied with this request.
All Baltic Member States (Denmark, Estonia, Finland, Germnay, Latvia, Lithuania, Poland and Sweden) are willing to upload the “Landings and effort data” as well as “Sampling data” to the RBD at the present level of details. Further, all Baltic Member States would like to stress that a RBD is a prerequisite for regional coordination and cooperation.
Based on the uploaded data a number of analyses were carried out prior to the RCM Baltic meeting. This approach where analyses were carried out in advance of the meeting made it possible during the meeting to discuss the outcome of the analysis. In addition, the ICES Data Center has developed and implemented a number of standard reports in the RDB which enables quick and easy reporting and overviews, thus increasing the efficiency of the meeting. Based on the analysis the data quality issue could be discussed and agreements on actions to be taken to improve the data quality could be made.
The RCM Baltic 2015 would like to stress that for the coordination and the exchange of data the ICES Secretariat is seen as the ultimate RDB manager. In the management one crucial thing is that it includes development and implementation of new methods and functionalities in the RDB in close interaction with end-users (RCMs and e.g. ICES assessment working groups).
Clear progress in data availability to the RCM has been achieved since the FishFrame evolved into a RDB. However, the regional work would progress even faster if there were additional standard outputs including pre-produced reports, tables and graphs in the RDB. Hence, Baltic RCM 2015 reiterates its recommendation from 2014 that the RCM work will benefit immensely if the meeting can focus on the discussions and the decisions that are needed, instead of producing the standardised result tables and result graphs.
Analyses of total landings by species were compared with the Annex VII in COM DEC 2010/93/EU. The main outcomes of this comparison were that several important species in the region are not included in the Baltic Sea section. Hence, MS are presently not obliged to sample the relevant stocks for these species under DCF. Therefore, the RCM Baltic recommends that the stock list given in Annex VII in COM DEC 2010/93/EU for the Baltic region for the new EU-MAP is revised. Pike (Esox lucius) should be deleted and the following; Vendance (Coregonus albula), Smelt (Osmerus eperlanus) and Whiting (Merlangius merlangus) should be added.
The RCM Baltic carried out a number of case studies on length at age relationships and weight at age relationships for selected species. Standard reports on these relationships are suggested as a very useful tool in the stock assessment work and for all stock coordinators. Therefore, the RCM Baltic recommends that standard report on length at age relationship and weight at age relationship are developed in the RDB. In this context, when data from different MS are presented, the RCM Baltic stresses that it is crucial to take into account any differences in sampling design before jumping into false conclusions.
Based on the analyses carried out the RCM Baltic 2015 suggests that task-sharing in terms of e.g. age determination and quality improvement could be reorganized to increase efficiency, as earlier concluded by RCM Baltic 2011-2014. Present agreements including task sharing that has been concluded bi- or multi-laterally. Additional task-sharing is underway but too premature to implement.
The RCM Baltic 2015 concluded that all potential announcements of the new grants from the Commission intended to promote regional coordination will definitely give a possibility to enhance projects where task-sharing is included. Sharing e.g. age readings instead of having in house expertise for aging all species at each institute might be more efficient but he quality issues also have to be taken into account.The data quality in different senses could also be improved if coordinating this work.
The RCM Baltic 2015 would like to stress that a Regional Data Base is a crucial and essential tool for the regional coordination and cooperation data collection. Further, that the Regional Data Base is a prerequisite for successful regional data collection, for providing quality assured data that are processed transparently using agreed methods for

5
the use in the scientific advice processes for the support of the management of the Common Fisheries Policy.
Cost sharing of surveys has been discussed and the RCM Baltic agreed that before setting the surveys’ cost sharing model an analysis of the structure and distribution of the cost between MS regarding surveys currently conducted on the Baltic Sea is needed. The chair of the RCM Baltic has offered to collect and compile the data required for such an analysis to be performed before the RCM Baltic meeting next year.
Furthermore, before deciding on model to use for cost sharing of surveys, feedback from end-users is required. The group decided to request ICES, through the Commission, for a confirmation on what surveys in the Baltic Sea are required to meet the ICES needs for providing advice in support of the Common Fisheries Policy.
Landing obligation:
At the RCM Baltic meeting in 2014 it was agreed that all MS involved in the discard sampling of Baltic Sea cod fisheries (DK, DE, LT, LV, PL, SE) should provide RCM Baltic 2015 with a short summary on the experience gained from sampling activities in quarter 1 and 2 of 2015. The MS should assess the following aspects:
If and how the MS has adapted the sampling program to the new management regime?
Are there changes in the access to vessels to sample catches (rejection rates)?
Are there any indications on changes in the quality of the discard data?
Have fishermen changed their fishing behavior? If yes, what has changed and how can we adjust and account for these changes in our sampling?
A questionnaire was send to all MS in summer 2015 and the summary of the results were presented to the RCM Baltic 2015. There are indications that the reported amounts (volume in weight) in logbooks or landing declarations differ significantly to the observer estimates, where the observer estimates are 10 times or more higher than the reported catch of fish below the MCRS. In addition, one MS with big TAC has serious problems to get aboard on vessel >12 m. This will probably have a significantly negative impact on the quality of data provided for assessment. The RCM Baltic underlines the importance of establishing statistically sound sampling designs for the on-board observations. Also, in order to maintain the collection of unbiased catch data for scientific purposes, the integrity of scientific observers has to be maintained (no mixing with observers used for control). Therefore RCM Baltic reiterates that to remove doubts on the scientific estimates, it is essential that sampled vessels do not change their behaviour when observers are on-board. This is best achieved if there is no ambiguity on the scientific role of the observer. Separating clearly the monitoring for surveillance for control, from the collection of data for scientific assessment is the pre-condition to run a scientific observer program. If there is any doubt that the information collected by the scientific observers will be used for purposes of control and enforcement, then the data will be compromised and the information collected could become useless. The landing obligation was introduced in the Baltic in 2015 for the pelagic industry and for the cod and salmon fisheries. Data from 2015 in its present state has still not been fully evaluated for scientific purposes. However, there appear to be areas were the data quality could be improved. Haul by haul data in the logbook would increase the data quality. In the Baltic Sea haul by haul information in the logbook has been required and implemented for all MS since 2015. If the MCRS fish was recorded on these logbooks, this would allow more detailed information on where the main catches of BMS fish are taking place. Furthermore, haul by haul information can be used to link the logbook data with CCTV and with VMS data given a much higher resolution and quality in the data and thereby improving the discard Atlas. It would also improve the potential to ‘control’ the logbook data if the skippers are obliged to fill in the information on a haul by haul level. Effective implementation including adequate compliance of the landing obligation would imply possibly considerable reduction of discard sampling at sea observer trips, especially for the cod-directed fisheries. This possible reduction in sampling effort at sea could be used to collect information/data on wanted and unwanted catch from onshore sampling. As 2015 is the first year of implementation of the landing obligation, 2015 can serve as a transitional period to evaluate the reliability of the landings of the fraction which previously was discarded at sea. This fraction could be sampled at landing site. However, preliminary observation indicate that data on the landed volumes of unwanted cod (<35 cm) obtained during at sea observers trips and “discard” landed in harbors differs significantly, in some cases by orders of magnitude. Therefore, presently the discard data obtained from harbor sampling cannot be regarded as reliable and should not be used to estimate the amount of fish caught under MCRS when preparing data for stock assessment.in a raising procedure. For this reason most of the MS in the Baltic Sea region do not sample discards from landings in ports (only Germany and Sweden are doing it). It is important to note
6
that these significant differences between the logbook data and the “true” discards can only be detected by at-sea observers, thus highlighting their role even under a landing obligation probably also in the future.

7
2. Introduction
2.1 General
The RCM Baltic met in Riga (Latvia) 24-28 August 2015. The availability of SharePoint offered by ICES proves to be very
efficient in organising the work before, during and after the meeting.
The Terms of Reference for all the RCM have been made in cooperation between the Commission and the chair of the RCMs.
The RCM for the Baltic and the RCM for the North Sea & Eastern Arctic have agreed to use the same template for the reports
for the two RCMs in order to ease the subsequently work at the Liaison Meeting and by the fisheries data collection community.
This year all Baltic MS have uploaded data for 2014 to the RDB FishFrame according to the official data call. A large number of
data analyses were carried out prior to the RCM meeting which made the meeting very efficient.
The meeting dealt with all terms of reference and considered whether there was a need to adjust the National Programmes (NP)
for 2016. Most of the work was done in plenary but also in 3 subgroups.
Previous RCM meetings focused on developing examples of how quality of data could be demonstrated on a regional level
making use on data provided by Member States (MS) in a Regional Data Base (RDB). This year, a process, has been proposed,
how to deal with the quality control of national sampling data and reporting of data quality on a regional level in the future. The
work has been carried out in a subgroup.
The new Common Fishery Policy (CFP) has introduced an obligation to land all catches of quota species. This means that
undersized fish species allocated by quota, which previously were discarded needs to be landed and reported. The landing
obligation became effective to cod, salmon, herring and sprat in the Baltic from 2015 and for pelagic fisheries and industrial
fisheries in 2015 in other regions. In other regions, demersal species will gradually be faced in from 2016 to 2019. The landing
obligation may or will most likely have a big impact on the biological sampling of the catches.
Under the new CFP a revised Data Collection Framework will become operative. A recast of the DCF has been proposed by the
EU Commission and been lauched in June 2016. According to this proposal data collection programmes will be set up on a
regional level, taking better into account the data needs from end-users like ICES, STECF, ICCAT, GFCM, etc. This requires a
different kind of coordination and cooperation.
2.2 Background & legal requirements
The EU Data Collection Framework (DCF; EC 2008a, 2008b, 2008c, 2010) establishes a framework for the collection of
economic, biological and transversal data by Member States (MS). This framework provides the basic data needed to evaluate
the state of fishery resources and the fisheries sector and the impact of the fisheries on the marine ecosystems.
The Regional Coordination Meeting for the Baltic proceeds from the present Data Collection Framework (EC Regulation no.
199/2008) that establishes a community framework for the collection, management and use of data in fisheries sector for
scientific advice regarding the CFP. According to this regulation and without prejudice to their current data collection
obligations under EU law, MS shall collect primary biological, technical, environmental and socio-economic data within the
framework of a multi-annual national programme drawn up in accordance with the EU programme.
According to EC Regulation 665/2008, laying down detailed rules for the application of Council Regulation (EC) 199/2008, and
its technical Decision 2010/93/UE specifying practical aspects for data collection, actions planned by MS in their national
programme shall be presented according to the predefined regions.
The coordination of the data collection are carried out at a regional level and specific Regional Coordination Meetings (RCMs)
are in charge of facilitating this and these meetings aim to identify areas for standardisation, collaboration and task sharing
between MS. RCMs are held annually and involve participants from each MS involved in the DCF.
At present, five RCMs are operative: 1) The Baltic Sea (ICES areas III b-d), 2); The North Sea & Eastern Arctic (ICES areas IIIa, IV and VIId), (ICES areas I and II), (ICES divisions Va, XII & XIV and the NAFO areas. 3); The North Atlantic (ICES areas V_X, excluding Va and VIId); 4) The Mediterranean Sea and the Black Sea and 5) Long distance fisheries: regions where fisheries are operated by Community vessels and managed by Regional Fisheries Management Organisation's (RFMO) to which the Community is contracting party or observer.
The regional split over 5 regions allows for coordination while taking into account regional aspects and specific problems.
Regional Coordinating Meetings (RCMs) are held annually and involve National Correspondents and both biologists and

8
economists from each MS involved in the DCF programme. The key objectives of the RCMs are to identify areas for
standardisation, collaboration and co-operation between MS.
A Liaison Meeting (LM) between the chairs of the different RCMs is being held annually to analyse the RCM reports in order to
ensure overall co-ordination between the RCMs.
Within the DCF, the role of the RCMs and their tasks in regional coordination are clearly defined in various articles of the
Council regulation.
Council Regulation 199/2008 Article 5: Coordination and cooperation
1. Member States shall coordinate their national programmes with other Member States in the same marine region and make
every effort to coordinate their actions with third countries having sovereignty or jurisdiction over waters in the same marine
region. For this purpose the Commission may organise Regional Coordination Meetings in order to assist Member States in
coordinating their national programmes and the implementation of the collection, management and use of the data in same
region.
2. In order to take into account any recommendation made at regional level at the Regional Coordination Meetings, MS shall
where appropriate submit amendments to their national programmes during the programming period. Those amendments shall
be sent to the Commission at the latest two months prior to the year of implementation.
Commission Regulation 665/2008 Article 4: Regional co-ordination
1. The Regional Coordination Meetings referred to in Article 5(1) of Regulation (EC) No 199/2008 shall evaluate the regional
co-ordination aspects of the national programmes and where necessary shall make recommendations for the better integration of
national programmes and for task, sharing among MS.
2. The Chair of the meeting shall be designated by the Regional Coordination Meeting in agreement with the Commission for a
two year period.
3. The Regional Coordination Meetings may be convened once a year. The terms of reference for the meeting shall be proposed
by the Commission in agreement with the Chair and shall be communicated to the national correspondents referred to in Article
3(1) three weeks prior to the meeting. Member States shall submit to the Commission the lists of participants two weeks prior to
the meeting.
2.3 Terms of Reference
1. Review progress since 2014 following up the 11th liaison meeting report.
2. Review feedback from end users, and expert groups, to include: GFCM WG on DCRF, WGCATCH 2014, RDB SC and WKRDB 5, PGDATA, PGMED, STECF, WKISCON2, ICES, WK on trans variables, Zagreb 2015) and NC meetings.
3. Regional data collection, analysis and storage and the evolution towards RCGs.
a) Consider the progress of the “strengthening regional cooperation in data collection” mare/2014/19, and possible implications.
b) Review progress in data quality screening, harmonisation of national and regional data checking procedures.
c) Consider the role of the sampling data format in terms of integration of sampling data collection, recording and the present and future RCM data calls
d) Consider the data collection protocols for at-sea and on-shore sampling in the context of regional sampling designs and probability selection methods.
e) Discuss design-based sampling: state of play of which MS are using it or plan to use it.
f) Analyse the RCM data call for the RDB 2014 data (analysis to be done as much as possible prior to the meeting, and the type of analysis e.g. ranking of ports to sample, to be determined beforehand).
g) Identify the areas and topics where there is a need for intra-institute intersessional work to achieve coordinated sampling, and how such groups can be organised, coordinated, and funded e.g. joint surveys, sampling plans for MSFD variables, data quality scrutiny groups, international sampling frames.
4. Review proposal for task sharing and criteria for joint surveys. 5. Identify any amendments to NP needed in 2016. 6. Consider future funding mechanisms to continue strengthening regional cooperation

9
7. Landing Obligation.
a) Evaluate the impact of the introduction of the landing obligation, and/or preparations for its implementation.
b) The operation of at-sea observer programmes, and role of scientific observers.
c) Quality and integrity of catch data collected by the control agencies, i.e. logbook sales notes data.
d) The generation of catch estimates derived from sampling programme data.
e) Experiences of on-shore sampling of landed discards.
f) Review progress from last year’s recommendations
8. National Administrations
a) Address any issues relating specifically to national administrations and consider the role of NC within the RCM RCG context.
b) Harmonisation of control agency data collection and the cross border sharing of control agency data, for vessels operating and landing outside their flag country.
c) Harmonisation of catch data recordings.
d) The position of national administrations on populating the Regional Data Base according to the RCM data call with i) Landings and effort data and ii) Sampling data.
e) Task sharing and task trading mechanisms that might operate within the context of a regional sampling designs.
9. Metiers.
Discuss the role of metiers in sampling and estimation, as descriptors of fishing, as domains for estimation and their merging in the InterCatch, the RDB and the STECF data base and as an aide to sampling. Define how they are to be used in the future, the extent to which national and regional lists need to be harmonised and how lists are to be stored for use in a regional context.
10. Future multi-annual programme for data collection
a) Propose list of research surveys that should be carried out in the region in 2016.
b) Review and comment on ICES advice on what data are necessary for scientific advice regarding recreational fisheries
c) Review and comment on list of proposed stocks& biological variables to be included in EU MAP. (The Commission will provide background documents/input for this ToR)
11. Any other business
2.4 Structure of the report
The following table lists the sections in the report where the various t.o.r. have been addressed.
t.o.r section
1 3
2 4
3a-e+g 5
3f+6c 6
4 7
5 8
6 9
7 10

10
8 11
9 5
10 12
11 13
2.5 Participants
Name Country email
Ireneusz Wójcik Poland [email protected]
Maciej Adamowicz Poland [email protected]
Tomasz Nermer Poland [email protected]
Jørgen Dalskov, chair Denmark [email protected]
Marie Storr-Paulsen Denmark [email protected]
Georgs Kornilovs Latvia [email protected]
Uwe Krumme Germany [email protected]
Sven Stötera Germany [email protected]
Romas Statkus Lithuania [email protected]
Vilda Griuniene* Lithuania [email protected]
Irina Jakovleva Lithuania [email protected]
Andrei Baikov Estonia [email protected]
Tiit Raid Estonia [email protected]
Jukka Pönni Finland [email protected]
Timo Myllylä Finland [email protected]
Heikki Lehtinen* Finland [email protected]
Anna Hasslow* Sweden [email protected]
Katja Ringdahl Sweden [email protected]
Maria Hansson Sweden [email protected]
Susanne Tärnlund Sweden [email protected]
Ruth Fernandez* ICES [email protected]
Henrik Kjems-Nielsen* ICES [email protected]
Stanislovas Jonusas* EU Commission [email protected]
* part-time participation

11
3. Progress in regional co-ordination since 214 following up the 11th Liaison
Meeting outcome In 2013, the Commission put the proposal for a revised DCF forward until June 2015. Therefore, the Commission decided to carry over the National Progammes from the Member States for 2011-2013 unchanged to the period 2014-2016. The RCM Baltic though decided work towards the implementation of statistical sound sampling schemes as suggested by the various ICES expert groups and the RCM Baltic also started the discussion on how to establish regional sampling schemes instead of the present national sampling schemes. The Steering Committee for the Regional Data Base has continued its work. See section 4.5.
The chairs of the RCMs Baltic, North Sea & Eastern Arctic and North Atlantic cooperated in the formulation of a common data call for 2015 and also by preparing the terms of reference of this year’s meetings.
3.1 Follow-up of recommendations from the 2013 Liaison meeting
The 11th Liaison meeting (November 2014) considered all recommendations made by the RCMs and PGECON. These
recommendations are listed below. The Liason identified overlap between some recommendations made by the different RCMs
and decided to merge these. Note that the recommendations LM 1-6 are merged and composed from elements provided by
several RCMs.
The recommendations are complemented comments from the RCM Baltic 2014 in the field ‘follow up in 2014’.
LM 1. Regional Database – Consultation of RCMs
RCM Baltic and RCM NS&EA 2014 Recommendation 1
RCM NS&EA recommends that the RCMs are consulted before the Commission takes decision on future database structure for DCF data and that the future RCG needs are properly considered
Justification The RDB is the backbone in present regional coordination of data collection between MS and the RCM Baltic foresee that the importance of a well-functioning database adapted to the needs of the regional coordination group will be even more crucial in the future when moving towards regional programs, design based approach as well as stronger focus on quality assurance and end-user interactions. It is thereby of urgent importance that the RCM needs are carefully considered when the Commission choose system for storage and management of DCF data.
Follow-up actions needed COM to properly consult RCMs before decisions are taken on future database structures and to properly consider RCM/RCG needs
Responsible persons for follow-up actions
European Commission
Time frame (Deadline) 2014
LM comment The Commission has committed to consult the RCMs
Action – RCM Baltic 2014-2015 No further action is needed for the time being. COM has, according to the LM recommendation, concluded that the present set-up with regional database probable is the best solution. This conclusion was made after taking feed-back from different parties into account.

12
LM 2. Implications of the landing obligation - Scientific data collection and at-sea sampling
RCM NS&EA 2014 Recommendation 2
RCM NS&EA recommends that MS maintain scientific observer programmes and continue at-sea sampling schemes for the collection of scientific data for stock assessment and advice. Additionally that the role of scientific observer is not conflated with any monitoring role. Appropriate modifications to at-sea sampling protocols and recording should be devised for sampling the retained discard fraction.
Justification Discarding will become illegal for the most part, and this has the potential to disrupt the historical time series of catches used in assessment models.
Nevertheless, at-sea sampling needs to be maintained because discards at-sea will continue for various non TAC species and exemptions allowed under the landing obligation. Additionally the landing obligation will introduce a new category of retained discards and this fraction has to be sampled to obtain scientific data for the complete catch composition. Until such time as the feasibility of sampling this catch component on-shore can be determined there is a need to maintain at-sea sampling.
The RCM NS&EA underlines the importance of maintaining statistically sound sampling designs for the on-board observations, and the integrity of scientific observers.
Follow-up actions needed Scientific institutions to prepare sampling protocols appropriate for at-sea sampling of the retained fraction and the extra faction (landing part for industrial purpose of fish under the minimum reference size) due to the landings obligations and modify their sampling protocol .
MS & ICES to consider if modifications are needed for recording, storage and estimation processes (data exchange format, IT systems, ...)
Responsible persons for follow-up actions
Scientific institutions within MS
Time frame (Deadline) Prior to the implementation of the landing obligation
LM comments The LM fully support this recommendation and in addition that the ICES WGCATCH (November 2014) explore sampling strategies which can be applied under the landing obligation management regime including sampling of the landing fraction of the catch which previously was discarded. LM recommends to MS to follow the guidelines provided by WGCATCH.
Action – RCM Baltic 2014-2015 This issue was addressed in section 4 of the WGCATCH 2014 report: Provide advice on adapting sampling protocols to anticipated changes in management measures (e.g. discard ban) or technical advances in monitoring
Status for 2015: All MS have maintained scientific observer programmes and continue at-sea sampling schemes after the landing obligation entered into force as far as it has been possible. Due to co-operation issues with the fishing fleet, Sweden has had difficulties performing at sea-sampling.

13
LM 3. Implications of the landing obligation - Scientific data storage, IT systems and estimation
RCM NS&EA and RCM NA 2014 Recommendation 3
RCM NS&EA recommends that scientific institutions and ICES ensure that data recording systems, IT systems and estimation routines are able to appropriately deal with the retained discard fraction. Also, authorities should adjust logbooks and IT systems to accommodate the accurate recordings of all catch components, including the part that can be released under the de minimis exemptions.
Justification The landing obligation will introduce a new category of retained discards and this fraction of the catch will require to be estimated. This necessitates that within national institutions and ICES all stages of the recording, storage and estimation processes are able to accommodate this fraction.
Many national IT systems may have data models based on a distinction between landed and discarded data that will require modification to accommodate retained discards fraction. Routines to estimate national catch compositions for length and age for assessed stocks will need to be adjusted. The ICES InterCatch system and the regional data base may be similarly affected.
Follow-up actions needed Scientific institutions and ICES data centre to consider if present systems are appropriate and if not make the required modifications.
Responsible persons for follow-up actions
Scientific institutions within MS & ICES
National and EU authorities
Time frame (Deadline) Prior to the introduction of the landing obligation, January 2015 for pelagic stocks and January 2016 for demersal stocks.
LM comments LM agrees in principle but recognises that no action can be taken until the implementation of the landing obligation is specified. The LM though suggests that MS consider how the new data sets can be accommodated in their scientific data bases.
Action – RCM Baltic 2014-2015
A harmonization of the nomenclature is of importance. Therefore, RCM Baltic needs to agree on how to name the different catch fractions. Preferably a harmonisation with the control authorities would be recommended. Thereafter, it will be possible to develop databases accordingly to this standard.
14
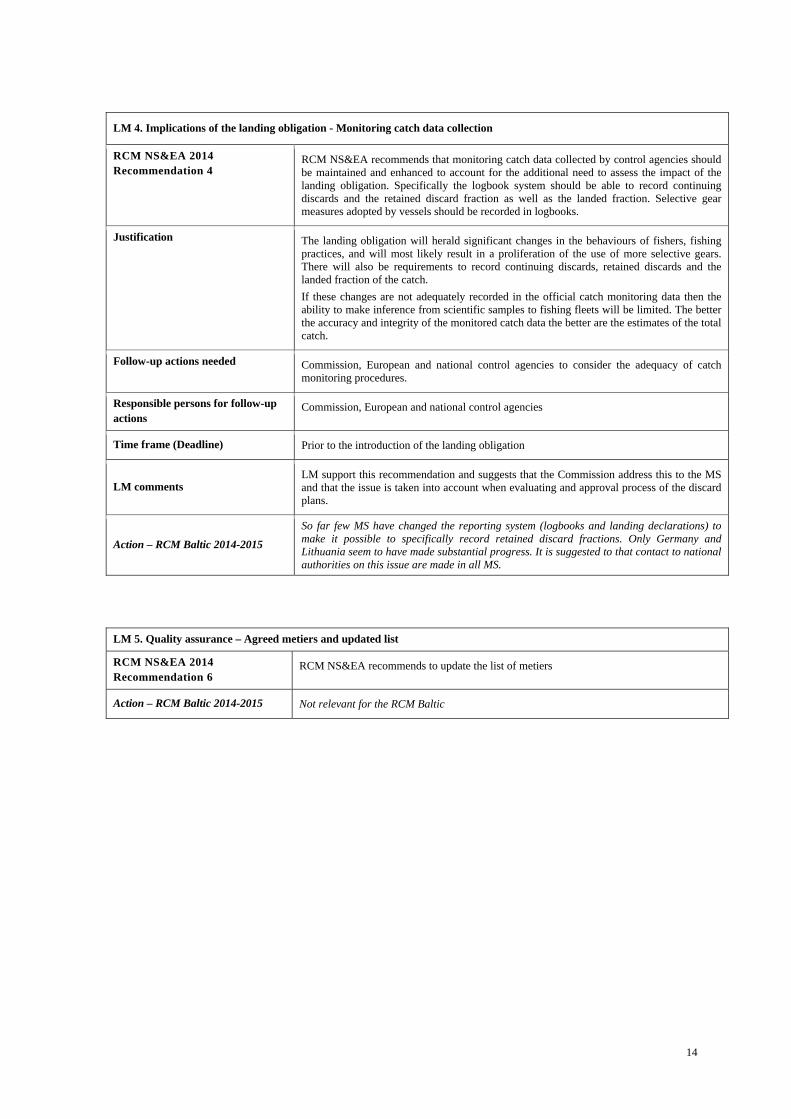
LM 4. Implications of the landing obligation - Monitoring catch data collection
RCM NS&EA 2014 Recommendation 4
RCM NS&EA recommends that monitoring catch data collected by control agencies should be maintained and enhanced to account for the additional need to assess the impact of the landing obligation. Specifically the logbook system should be able to record continuing discards and the retained discard fraction as well as the landed fraction. Selective gear measures adopted by vessels should be recorded in logbooks.
Justification The landing obligation will herald significant changes in the behaviours of fishers, fishing practices, and will most likely result in a proliferation of the use of more selective gears. There will also be requirements to record continuing discards, retained discards and the landed fraction of the catch.
If these changes are not adequately recorded in the official catch monitoring data then the ability to make inference from scientific samples to fishing fleets will be limited. The better the accuracy and integrity of the monitored catch data the better are the estimates of the total catch.
Follow-up actions needed Commission, European and national control agencies to consider the adequacy of catch monitoring procedures.
Responsible persons for follow-up actions
Commission, European and national control agencies
Time frame (Deadline) Prior to the introduction of the landing obligation
LM comments LM support this recommendation and suggests that the Commission address this to the MS and that the issue is taken into account when evaluating and approval process of the discard plans.
Action – RCM Baltic 2014-2015
So far few MS have changed the reporting system (logbooks and landing declarations) to make it possible to specifically record retained discard fractions. Only Germany and Lithuania seem to have made substantial progress. It is suggested to that contact to national authorities on this issue are made in all MS.
LM 5. Quality assurance – Agreed metiers and updated list
RCM NS&EA 2014 Recommendation 6
RCM NS&EA recommends to update the list of metiers
Action – RCM Baltic 2014-2015 Not relevant for the RCM Baltic

15
LM 6. Quality assurance – Tools to analyse the data uploaded to the RDB
RCM NS&EA 2014 Recommendation 7
RCM NS&EA recommends to develop tools to analyse the quality and the status of completeness of the data in the RDB
Justification It is presently difficult to access the completeness of data uploaded to the RDB. Knowledge of the status of data is essential to RCM work. Reports and tools allowing the RCMs to examine completeness thereby need to be developed. In order to ensure information on the status of the data uploaded to the RDB is available for the data user, it is further suggested that facilities to mark the status of the various data type uploaded the RDB.
Follow-up actions needed RCM NS&EA to list the needs for evaluating the quality and the status of completeness of the data in the RDB
Responsible persons for follow-up actions
RCM NS&EA
Time frame (Deadline) As soon as possible
LM comments The LM endorses this recommendation and stress the importance of the further development of such tools. The development of the requested tools is part of the roadmaps towards the implementation of the revised DCF and are included a study proposal. Therefore, the LM recommends that the study proposal will be funded as soon as possible.
Action – RCM Baltic 2014-2015 Discussions are ongoing to conclude what analyses that would be most relevant to perform. Besides, discussions are underway by whom these analyses should be performed. During RCM 2015, this issue will be dealt with further in the sub-groups. See section 6.
LM 7. Quality assurance - Calibration of age readings
RCM Baltic 2014 Recommendation
RCM recommends that WGBIOP develop a procedure for an annually intermediate calibration
Justification To make sure on a regular basis that age reading is done in a consistent way and that a reference set is available for age readers before the start reading a new seasons of otoliths. WebGr could be used as a tool for uploading pictures on otoliths. All experts involved in the age reading for the specific stock should participate in the exercise which should be performed annually for all stocks
Follow-up actions needed WGBIOP to look into a standard procedure
Responsible persons for follow-up actions
ICES WGBIOP
Time frame (Deadline) Next WGBIOP meeting to be held in August - September 2015.
LM comments LM endorses this recommendation
Action – RCM Baltic 2014-2015 RCM Baltic still supports the earlier suggested setup regarding intermediate age reading calibrations. Next WGBIOP meeting will be held in the first week of September 2015. Regarding Eastern Baltic Cod Stock: MS are obliged to collect otoliths under the DCF. All MS should continue to perform stock-related sampling according to their NP. However, RCM Baltic recommends/agrees that MS postpone the age readings og Baltic cod as it currently is not possible to do correct/quality ensured age reading and as no valid age-based assessment is carried out.When the age redaing problem is solved age reading of the archived cod can continue.

16
LM 8. Quality assurance – More detailed logbook registration
RCM Baltic 2014 Recommendation RCM Baltic recommends that all fishermen fishing in the Baltic region document their
catches on haul by haul basis in the logbook.
Justification The introduction of the new CFP (article 15) will probably change the approaches to monitoring the fishery with the current scientific observer sampling programmes and the control of the fisheries.
To ensure quality in catch data a more detailed registration of catches is necessary and
this can be implemented by document the catches on a haul-by-haul basis in the official
logbooks.
Follow-up actions needed
Responsible persons for follow-up
actions
Commission / BALTFISH
Time frame (Deadline) Before the 1st of January 2015
LM comments LM endorses this recommendation
Action – RCM Baltic 2014-2015 All MS (except Finland) are currently registering their catches on haul by haul basis.
LM 9. Concurrent sampling
RCM NA 2014
Recommendation 1. The RCM NA recommends that a comprehensive evaluation of the utility of the data
being collected with the concurrent sampling should be performed.
Justification It is unclear whether the significant resource needed to carry out concurrent sampling
provides benefits that outweigh the costs. Some ICES Working groups have benefited
from concurrent sampling data collected however there is no empirical evidence to
support this. In order to decide if concurrent sampling should continue, more feedback
from end-users is required.
Follow-up actions needed MS should carry out the evaluation on their own data collection schemes and report back to the RCM NA.
ICES to setup a workshop proposal to see the implication to the stopping the concurrent
sampling for those stocks and benefits concurrent sampling are providing or can
provide considering the new and broader scopes of the revised DCF, such as the
evaluation of impacts of fisheries on marine biological resources and on the ecosystem.
Responsible persons for follow-up
actions
1. MS, RCM NA
2. ICES
Time frame (Deadline) a) MS: Intersession work with results reported to RCM NA 2015.
b) ICES: Workshop to take place in 2015.
LM comments The LM endorses this recommendation.
Action – RCM Baltic 2014-2015 RCM Baltic supports the overall conclusion from WKISCON2 stating that sampling the full range of species should be the future aim when moving towards 4S in the commercial sampling. Further, for at sea a strict stock based sampling is not an option to take into account again. (RCM Baltic also supports the overall conclusion from WGRFS stating that the sampling method has to be chosen on a case by case basis in the recreational sampling.)

17
LM 10. Quality assurance – RDB data corrections
RCM NA 2014 Recommendation 2
The RCM NA recommends that
1. the reference lists for metiers, harbours and species in the RDB are restricted to the agreed lists (metiers: RCM metier lists, harbours: EU Master Data Register, species: AphiaID (WoRMS));
2. any data that cannot be uploaded should be recorded on a standard upload log distributed with the data call;
3. MS reload all their data in reference to the restricted lists.
Justification There are inconsistencies and errors in the data on the RDB that have been caused by non-restrictive reference lists for metiers, harbours and species, and insufficient data checks by MS. The annual data checking procedures that are currently carried out at RCMs reveal these errors and data gaps, limiting the potential for data analysis.
A log of data completeness is needed so that users can assess the limitations of the data and therefore what interpretations or analysis can be done with it. Currently it is unclear how the data can be used.
The RDB will be developed to record the status of the data within it, but until this feature is available a standard log submitted at the time of each data call can provide RCGs and data users with a reference to what data is not on the system as well as what is.
Follow-up actions needed 1. RCMs to provide ICES, as the RDB administrators, with the restricted
reference lists. ICES needs to incorporate these lists in the RDB;
2. RCM chairs to include upload log in data call 2015;
3. MS need to reload their data (ICES needs to delete all the data first) and complete the log and submit it to RCM chairs. These logs should be made available for analysis at the next RCMs.
Responsible persons for follow-up actions 1. RCMs, ICES (Data Centre)
2. RCM chairs
3. MS, ICES (Data Centre)
Time frame (Deadline) 1. Reference lists: before RCM data call 2015
2. Upload log: to include in data call 2015
3. Reloading of data and submitting of upload log to RCM chairs: by deadline specified in data call 2015
LM comments The LM endorses this recommendation. Based on the progress done in the RDB –considering no fundings are expected inmediately- RCM chairs will considerate in the moment of launching the Data Call if a complete reload –all year series- or current year is needed.
Action – RCM Baltic 2014-2015 The data base facilities are in progress. Corrections of the reference lists for métiers and harbours respectively are successfully finished. The species reference list is being processed.

18
LM 11. Enlarge PGMed scope to Large Pelagics
RCM MED&BS-LP 2014
Recommendation
LP sub-group
Considering the new configuration taken in place in 2014 with LP subgroup associated to RCM MED&BS within a RCM MED&BS-LP, the LP subgroup recommend to enlarge PGMed ToRs to take into account LP subgroup. The list of ToRs are annexed in this report (annex 3)
Action – RCM Baltic 2014‐2015 Not relevant for the RCM Baltic
LM 12. Coordinated PGMed and LP data call
RCM Med & BS-LP 2014
Recommendation
LP sub-group
The data required each year by the PGMed should be collected within the framework of a data-call defined by the following elements:
Content: The content is defined according to the ToRs, which can now include issues specifically dedicated to the Large Pelagics subgroup or relevant to both groups.
Format: For generic ToRs the format of the data will be similar to the format contained within the templates, spreadsheets and text files, used until now. For the CV computations and investigation of sampling consistency, the data will be collected to be consistent to the Standard Data Exchange Format (SDEF) proposed by the Large Pelagics subgroup, allowing to use the same tools and methodology for a more thorough investigation of sampling stratification and precision.
Dates: The start and end dates of the data-call are set-up so that member states have time and flexibility for answering it, while complying with the 6 months period after the end of data collection during which data cannot be required. It has been agreed to launch the data-call the 1st of March and to set the deadline to the 15th of July.
Person in charge: The chairs of the RCM MED&BS-LP will be responsible for launching the data-call.
Action – RCM Baltic 2014-2015 Not relevant for the RCM Baltic

19
LM A1. AGREEMENT
Quality assurance – Upload of historical data to RDB FishFrame
RCM Baltic 2014 Agreement
The RCM agrees on a data call demanding all MS to ensure that all historical data (including data in salmon and eel) for the period 2009-2013 are uploaded to RDB FishFrame.
Justification A complete and easily accessible regional data set is crucial for the progress of a statistical sound sampling design in the data collection at a regional level.
Follow-up actions needed Data call to all MS via NC Uploading of missing data by all MS
Responsible persons for follow-up actions
RCM Baltic chair to send out data call, NC data call followed
Time frame (Deadline) 1st December 2014
LM comments LM endorses this agreement
Action – RCM Baltic 2014-2015 Most MS have been working on uploading historic data back to 2009. This process is ongoing for the coming months.
LM A2.
AGREEMENT
Quality control documentation
RCM NS&EA 2014 Agreement 1
It is agreed that all MS attending the RCM NS&EA will document their data checks and quality control procedures in reference to the data capture and data processing stages of their national sampling programmes.
Justification In order to develop a comprehensive set of data checks in the RDB and in addition also can be implemented in MS national data bases it is suggested to assemble information of all present data quality checks used by MS.
Follow-up actions needed ICES to develop an easier procedure for comparing the data.
Responsible persons for follow-up actions
MS within RCM NSEA
Time frame (Deadline) RCMs 2015
LM comments The LM fully support this agreement and suggest that this work is done in all regions and by all RCMs.
Action – RCM Baltic 2014-2015
The RCM Baltic endorses the suggestion. It was agreed during the RCM that before a template is conducted on quality checks it is very difficult to use the information on quality check from other countries directly. It would however be a task for the intercessional RCM group on data quality to conduct a template for all RCMs on this issue.

20
LM A3.
AGREEMENT
Regional Coordination - Cost sharing of International Ecosystem Survey in Nordic Waters and Blue Whiting joint research surveys
RCM NS&EA 2014 Agreement 2
RCM NS&EA 2014 agreed that the cost sharing model where those MS having a EU-TAC share >= 5% is sharing the survey cost according to their EU-TAC shares for the main species concerned: i) the International Ecosystem Survey in the Nordic (Atlanto-Scandian herring), ii) the Blue Whiting Survey (blue whiting). This model will be used for the International Ecosystem Survey in the Nordic Seas (IESNS) carried out by the Danish R/V Dana and the Blue Whiting Survey carried out by the Irish R/V Celtic Explorer and the Dutch R/V Tridens for years 2014 and 2015 or until a new data regulation is in place.
Justification There is a need to update current agreements to reflect the new financial structure under the EMFF, while the surveys themselves are automatically rolled-over to 2014 and 2015 under the current DCF regime. Furthermore, the cost sharing models for both surveys should be aligned.
Follow-up actions needed Approved by National Correspondents from Belgium, Denmark, Germany, the Netherland, Sweden and UK.
The NC’s from Ireland, France, Portugal and Spain should at the RCM NA be consulted.
Responsible persons for follow-up actions
The RCM NS&EA and the RCM NA
Time frame (Deadline) Invoices should be sent to the MS concerned before 1 November 2014.
Follow up in 2014 The NC’s concerned from the RCM NA to be consulted.
LM comments LM endorses this agreement
Action – RCM Baltic 2014-2015 As no international joint surveys are carried out in the Baltic this issue has been postponed until the new DCF has been agreed.

21
4. Feedback from end-users and expert groups
4.1 ICES general feed-back
Recommendations to RCM Baltic from ICES Working Groups (2015) Two ICES Expert Groups directed recommendations to RCM Baltic in 2015. The Working Group on Bycatch of Protected Species (WGBYC) recommended increasing the sample coverage in in trammel nets and set gillnets in the Baltic under the DCF to contribute to the assessment of bycatch of Protected, Endangered and Threatened Species (PETS). The Baltic Salmon and Trout Assessment Working Group (WGBAST) recommended increasing the data coverage of sea trout parr densities from typical trout streams from Northern Sweden while achieving longer data time series is required from all Baltic member countries. At the same time WGBAST recommends to explore the unreporting of salmon in pelagic fisheries targeting other species. Recommendations to RCM Baltic from ICES Working Groups (2014) In 2014, two ICES Expert Groups reported recommendations to RCM Baltic, which should be followed up in the next RCM Baltic. The Baltic Salmon and Trout Assessment Working Group (WGBAST) recommended to 1) estimate recreational fishing catches for salmon and trout, 2) estimate the amount of undersize salmon taken as bycatch in longline and other fisheries, and 3) the amount of salmon bycaught in other fisheries (once all salmon quota has been fished) and released back into sea. The Baltic International Fish Survey Working Group recommends that Sweden should participate in the BASS survey covering Subdivision 27. Recommendations to RCM Baltic from the Liaison Meeting (2014) Four recommendations from the Liaison meeting are considered relevant for RCM Baltic and these recommendations have been considered by ICES and are listed below: LM 2. Implications of the landing obligation - Scientific data collection and at-sea sampling This was addressed in section 4 of the WGCATCH 2014 report: Provide advice on adapting sampling protocols to anticipate changes in management measures (e.g. discard ban) or technical advances in monitoring. LM 3. Implications of the landing obligation - Scientific data storage, IT systems and estimation. ICES reiterated that it will not be in the position to evaluate the implications the policy on the stock assessments until data and information on landings and discards become available . For the time being the catch options conducted by ICES assumes a constant selectivity and that this might not be what will occur in the fishery. Terminology used in ICES advice: Wanted catch” is used to describe fish that would be landed in the absence of the EU landing obligation. The “unwanted catch” refers to the component that was previously discarded. LM 7. Quality assurance - Calibration of age readings WGBIOP meeting will take place between the 7th and 11th of September 2015. LM 9. Concurrent sampling A specific workshop was setup, WKISCON2. The full report was not available at the time of the RCM Baltic meeting but a brief summary is outlined in the section “Main outputs from WKISCON2: Workshop on Implementation Studies on Concurrent Length Sampling” of this report.
Planned benchmarks relevant to RCM Baltic Sole (Solea solea) in Division IIIa and Subdivisions 22–24 (Skagerrak and Kattegat, Western Baltic Sea) An interbenchmark process for sole (IBPSOLKAT) is being conducted between August and October 2015 and will report by 1 November to the attention of ACOM. The main issues to consider in this interbenchmark relate to the analytical stock assessment method used to provide advice for this stock. Parameters that are planned to be evaluated are: quality of the commercial trawler cpue time series, survey design and survey index, additional model parameter settings. A new stock assessment method will be proposed based on the new results and biological reference points will be revised following WKMSYREF3 (ICES, 2015a) guidelines. Salmon (Salmo salar) in Subdivisions 22–31 (Baltic Sea, excluding Gulf of Finland) A benchmark process is proposed to take place in 2017. Thus, the corresponding data compilation workshop will be planned for the autumn of 2016. Data from river stocks in assessment units 5 and 6 will be required (smolt age distributions, maturation

22
rates, exploitation rates, post-smolt survival and exploitation of the stock in different sea areas (=migrations), smolt and spawner counts). In addition good quality data from effort and catches of recreational fisheries will be needed in order to include the recreational sea fishery into the assessment model. New parameterisation for SR-relationship Spawner stock biomass per recruit (SBPR) should be calculated as a function of post-smolt mortality (Mps), natural mortality (M), maturation rates, fecundities and sex ratios, instead of giving it a prior distribution (as currently). Because Mps and maturation rates vary in time, SBPR would also vary. Further, a model for predicting the maturation depending on sea surface temperature and an update of fecundity parameter values will be reviewed in the benchmark if necessary. The current biological reference points will be revised and specific stock MSY-levels will be explored. Cod (Gadus morhua) in Division IIIa East (Kattegat) A benchmark process is proposed to take place in 2017. Thus, the corresponding data compilation workshop will be planned for the autumn of 2016. During the benchmark the use of new Natural mortality (M) estimates in the stock assessment will be explored. This is of particular importance given the increasing number of Baltic grey seals (Halichoerus grypus). Genetic markers, historical tagging studies and otolith morphometrics will be used to establish a mix ratio between the Kattegat and North Sea cod stocks in the area. The tuning series used in the analytical stock assessment will be revised, especially given the availability of data from a new survey (CODS) that has been carried out since 2008. The coverage and representativeness of discard data will be evaluated, as well as biological parameters (i.e. catch weight, stock weight, maturity). Current and additional parameter settings in the used SAM model will be evaluated. Further, performance of the model SS3 will be explored. Biological reference points will be revised following WKMSYREF3 (ICES, 2015a) guidelines. Herring (Clupea harengus) in Subdivision 31 (Bothnian Bay) A benchmark process is proposed to take place in 2017 and the corresponding data compilation workshop will be planned for the autumn of 2016. During the benchmark the use of new Natural mortality (M) estimates in the stock assessment will be explored given the increasing local population of ringed seals (Phoca hispida). The impact of the addition of a tuning series (commercial gillnet data held at the Swedish University of Agricultural Sciences) to the stock assessment input data will be assessed. The degree of mixing between herring stocks from Subdivisions 31 and 30 will be explored. Currently, the stock assessment model used is XSA and runs using SAM will be tested during the benchmark. The possibility of defining biological reference points will be studied. Herring (Clupea harengus) in Subdivision 30 (Bothnian Sea) A benchmark process is proposed to take place in 2017 and the corresponding data compilation workshop will be planned for the autumn of 2016. Besides exploring the degree of stock mixing between the herring stocks from Subdivisions 31 and 30 as outlined above, the benchmark experts will explore changes in the assessment tuning series. Firstly, the cpue from the commercial trapnet (data available from 1990 onwards) is considered no longer reliable due to lack of trapnet fishing effort and unbalanced spatial coverage. On the other hand, an acoustic survey started in 2007 and the time series may be now enough to provide a fishery-independent tuning series. Biological reference points will be revised following WKMSYREF3 (ICES, 2015a) guidelines.
4.2 WGCATCH 2014
The Working Group on Commercial Catches (WGCATCH), chaired by Mike Armstrong (UK) and Hans Gerritsen (Ireland), met in ICES HQ, Copenhagen, Denmark, 10–14 November 2014. The meeting was attended by 34 experts from 21 laboratories or organizations, covering 16 countries. The tasks of the meeting were as follows:
1. Develop the longer term work plan for WGCATCH;
2. Evaluate methods and develop guidelines for best practice in carrying out sampling of commercial fish catches on shore;
3. Provide advice on adapting sampling protocols to anticipated changes in management measures (e.g. discard ban) or technical advances in monitoring;
4. Provide advice to the RDB Steering Group on development of the RDB to support design-based data collection and estimates;
5. Evaluate responses to test applications of data quality assurance tables for onboard and port sampling developed by WKPICS, SGPIDS and PGCCDBS, make improvements for further testing, and develop clear guidelines for completing and interpreting the tables.
In order to evaluate methods and develop guidelines for best practice in carrying out sampling of commercial sampling of commercial fish catches onshore, a questionnaire was circulated before the meeting. This questionnaire was structured around guidelines developed by the ICES Workshop on Practical Implementation of Statistically Sound Catch Sampling Programmes (WKPICS) for best practice at each stage of the sampling process, and asked for a description of current practices at each of

23
these stages. Based on these questionnaires, common and specific problems were catalogued and potential solutions were identified. At the same time, the discussion of the questionnaires provided a form of peer-review of the sampling designs and identified where improvements could be made. The other main subject addressed by WGCATCH concerns the provision of advice on adapting sampling protocols to deal with the impact of the introduction of the landing obligation, which will alter discarding practices and result in additional categories of catch being landed. A second questionnaire was circulated before the meeting to allow the group to identify the fleets that will be affected and possible issues that are anticipated, as well as to propose solutions to adapt existing monitoring and sampling schemes and to quantify bias resulting from the introduction of this regulation. In total 15 countries provided questionnaires with responses that were included into the report. WGCATCH outlined a range of likely scenarios and the expected effects of these on fishery sampling programmes, and developed guidelines for adapting sampling schemes. The group also explored a range of analyses that could be conducted in order to quantify bias resulting from the introduction of the landing obligation. Finally, a number of pilot studies/case studies were summarized, highlighting the practical issues involved. The group provided advice on how the Regional Data Base (RDB) should be developed to support design-based data collection and estimates. Some general comments on future development of quality indicators are given in the report The working group did not produce any data outputs; the outputs of the group are the report and the appendix with the responses from the Questionnaires. PGDATA
4.3 PGDATA
The group meet for the first time in the beginning of July 2015 in Lysekil, Sweden. The meeting was scheduled to be a 4 days meeting with the main focus this year on the benchmark process and how to increase the data quality in this process. 10 different countries were represented by 19 participants at the meeting, and 2 representatives from ICES were attending as well. ToRs for the meeting were:
Review all or a representative selection of previous ICES benchmark and associated data compilation and evaluation meetings to determine how these were implemented, focusing particularly on how (if at all) data quality was evaluated, how this information was utilised at the benchmark assessment meeting, how proposals for new work or data collection were arrived at and prioritised, and where there were shortfalls that need to be addressed through establishing a clearer framework for each type of benchmarking process.
Review the responses to the data-quality questionnaires for discards estimates included in the 2015 data call for stock assessment EGs, and how the information was used by the EGs.
Using the planned benchmark meeting for the Irish Sea (WKIRIS) as a test case, work with the assessment team to identify the data needed, and use this as a test case to develop an initial draft framework and guidelines for compilation and evaluation of relevant data for benchmark assessments, including provision of time series of data quality indicators (bias and precision) that can be incorporated directly in assessment models or used as supporting information.
Clearly define the scope and working practices of PGDATA and identify the working relationships that PGDATA should establish within ICES (e.g. ICES SCICOM/ACOM Steering Groups; survey and other data collection EGs; assessment EGs; ICES Data Centre) and with external bodies.
Review and adapt the work programme for the next two years of PGDATA, and develop the ToRs for the 2016 meeting.
Consider the need for specific workshops prior to the 2016 core-group meeting, or study proposals to address PGDATA goals.
(to be added by ICES – respond to Commission query on use of recreational fisheries data and frequency of surveys)
PGDATA could advising/ prirotazing ICES on the development and use of InterCatch for compiling and raising data for stock assessment working groups alongside developments in Regional Databases.
The 2 main issued at the meeting were to compile a template/ guideline for the Benchmark process using the Irish Sea as a test case (ToR C) evaluate former benchmarks and discard data quality score cards. All the participants had to evaluate a earlier benchmark process before the PGDATA meeting following a common template. 44 different benchmarkes were analysed before the meeting and a summarize of the quality were then presented at the workshop. The evaluated benchmarks differed in a lot of

24
issues, ex. if a separate data compliation workshop has been conducted, if stakeholdes have been involved, feeling out issues list (and including them in the report) or filling out score cards ect. These outcomes were used as guidelines on what would be important to focus at for the upcoming benchmark in the Irish Sea. During the meeting a flow chart were further developed on the benchmark process and on the feedback loop to the data provider if some data were lacking or not in the quality state that can be used in stock assessment. The planning group also received two late ToRs one on InterCatch and prioritising the work to be conducted within ICES, however do to time constrain this issue were postpone to be conducted intercessional. The second extra ToRs were on the frequency of recreational surveys, how they should be used in assessment and for whar purpose.
4.4 WKISCON2
Main outputs from WKISCON2: Workshop on Implementation Studies on Concurrent Length Sampling WKISCON2 originated from a request from RCM NA and the 11th Liaison Meeting to ICES WGCATCH to set up a workshop that would evaluate the utility of the data being collected by concurrent sampling. The group (Co-Chairs: Liz Clarke, Scotland, and Nuno Prista, Portugal) met 16–19 June 2015 in Sukarrieta, Spain and was attended by 12 experts from 9 institutes, covering 7 Member States. Two questionnaires and a data call were sent to DCF National Correspondents and ICES Expert Groups (EG). As a result 17 replies from National Institutes and 30 from ICES EGs were obtained. WKISCON2 concluded that stock assessment and discard estimation and management are the major current users of concurrent sampling data. Other users like scientific catch estimation, advice to local, national and international authorities, research on MSFD descriptors, mixed fisheries and gear interactions and on mortality of rare species, data-poor stocks and PETS also take place in ICES EGs and national institutes. Increased information on by-catch species, general catch composition, and improved data on mixed-fisheries were considered by EGs to be the major benefits of concurrent sampling. WKISCON2 noted that many of these uses and benefits do not specifically require length data that have been sampled concurrently on a trip and that models have not been developed yet to make full use of concurrent data at trip-level. WKISCON2 further concluded that concurrent sampling for lengths of discards and landings at-sea is a long-established practice in most MS and that haul-level and trip level data is already available for current and future uses albeit sometimes limited by the lower sample size of these programmes. In what concerns concurrent sampling of landings on-shore fewer MS carry it out, those that do not cite increased costs and workload as the main practical issues. Where it was applied, concurrent sampling of fishing trips onshore resulted in substantial increases in the number of species sampled for lengths without jeopardizing the main uses of the data. Overall, it is a simple and effective way to estimate species composition (in weight and length) of landings but it is prone to bias caused by incomplete sampling and can be an inefficient method of obtaining length distributions of specific stocks when officially reported species compositions (e.g. from logbooks) are considered accurate. Other statistically sound methods of selecting species to sample are not yet fully developed or tested in the field but may provide useful alternatives in these cases. Increased information on by-catch species, general catch composition, and improved data on mixed-fisheries were considered by EGs to be the major benefits of concurrent sampling. Finally, WKISCON2 concluded that full species concurrent sampling of the catch at a haul-level is the best way to provide data to measure the interactions between all species caught and evaluate the impacts of fisheries on marine biological resources and on the ecosystem and that sampling at-sea is the ideal way of sampling commercial fisheries. At-sea sampling is generally more costly and displays lower fleet coverage than on-shore sampling, but currently, it is not usually possible to sample the discarded component of the catch on-shore. To take full advantage of the benefits of concurrent sampling, both at-sea and on-shore, full-species concurrent sampling should be implemented without resort to species lists such as the current G1 and G2 lists. Incomplete sampling events need to be flagged in national and international databases. The sampling should be regionally coordinated to ensure implementation is consistent and data are comparable at a regional level. Overall, WKISCON2 concluded that the implementation of concurrent sampling of landings onshore and at-sea has provided benefits in terms of provision of data for more species. However, more than concurrent sampling itself, statistically sound sampling of the full range of species caught should be the overall aim of future revisions of the DCF and a return to strict stock based sampling should not be an option. To achieve statistically sound sampling of commercial catches various statistical approaches may be valid, concurrent sampling being one among them.
4.5 RDB-SC
The steering committee for the regional database (RDB-SC) met 25-26 November in Copenhagen, Denmark. It was the sixth
meeting of the committee. Participants were representatives from the RCM Baltic, RCM North Sea & Eastern Arctic, RCM

25
North Atlantic, ICES as well as observers from the RDB-SC for large pelagic fish (LPF) and Ireland. The RDB-SC is
responsible for strategic planning, technical governance, operational issues and estimates of costs in the overall governance of
the regional database (RDB). The RDB-SC interacts with the Regional Coordination Meetings (RCMs) and Liaison Meeting
(LM) on other tasks such as development needs and content governance.
Throughout the year have a long row of recommendations on development needs for the RDB been directed towards the RDB-
SC. The recommendations origins primarily from the RCMs and LM but also from expert groups dealing with methodological
aspects of data collection. The recommendations cover a wide range of aspects such as harmonization of reference lists, reports
from the database to the RCMs, possible reports to make compilation of technical reports to COM more efficient, uptake of
upload logs, adaptation of the exchange format to meet expected requirements coming from a design based approach, landing
obligation and regional sampling programmes but also future estimation processes and interaction between InterCatch and the
RDB. As there presently are limited funds (no EU funds for development) for development are however the possibilities to act
upon the recommendations limited. Nevertheless the RDB-SC discussed all different recommendations and initiatives, sorted
them into a short, medium and longterm time scale and suggested ways forward were possible. A new workshop, RDB VI, was
initiated within this process. The workshop will deal with exchange format for effort and landings data to meet requirements for
design based sampling and estimation. The workshop will be held in Sete, France November 2015.
The RDB-SC further went through all comments from the MS on the data policy document and prepared generic answers.
4.6 WKRDB 5
The WKRDB 2014-01 workshop for the regional database (RDB) was held in Aberdeen Scotland from 27 to 31 October 2014.
This was the 5th regional database workshop and was aimed at developing the data exchange formats to enable design based
sampling and estimation. Twenty-three participants from 13 national institutions including ICES and the RDB hosts attended.
The workshop was co-chaired by Alastair Pout and Liz Clarke from Marine Scotland Science.
Case studies of stratified and multi-stage sampling schemes from 13 nations were presented and scrutinised. For each case study,
the sampling hierarchies were identified, and at each level in the hierarchy inclusion probabilities were derived. Where the
inclusion probabilities were required to be estimated this was described. Traditionally a lot of estimation in fisheries has required
the recording of weights, and a move to design based sampling would be a move towards also recording probabilities based on
counts.
A prototype sampling data structure appropriate for design based sampling and estimation was developed prior to the workshop.
A key element of the new structure was the sampling event “SE” table which is required to contain information on the primary
sampling units and the sampling design that is not included in the current data format. It was agreed that the new sampling data
structure should incorporate a form of this table. The new structure also incorporated many of the suggested changes from
previous working groups (WKRDB 3, SGPIDS 2013, RCM NS & EA 2013, RCM NA 2013 etc.).
Insights from the case studies and scrutiny of the prototype data format served to highlight and identify the situations where new
fields were required and where modification to the code lists used by the RDB were necessary. More widespread use of this
format for design-based estimation could identify further requirements. The recording of numbers sampled, in relation to the
available total, as a means of generating a sampling probability, is a new feature of the exchange format. For the calculation of a
sample weight, this sampling probability is required at all levels of the sampling hierarchies. The issues this raises need further
consideration. Therefore despite the progress made it is apparent that a final data structure suitable for design-based estimation
will only emerge as a result of the widespread adoption of design-based estimation.
Within the workshop there was a discussion as to whether the exchange format should move towards an efficient storage system
(with much less replication of data already in the system) or a more informative descriptive exchange format (in which
information is replicated for ease of analysis). Consideration was also given to the idea of more than one exchange format might
be necessary ; perhaps that there will be an exchange format for importing the data into the RDB and another format for
exporting data out of the RDB and for use between countries.
A prototype population data structure was presented and discussed. It was agreed that the issues in the use and need for
population data was complex and could not be resolved at a single workshop. These issues included, amongst other things: when
the appropriate links between the population and the sample need to be made; how complex the population data need to be; how
effort metrics and landings values are combined, and how appropriate effort measures are defined for different fisheries. It was
felt that the development of the population data format required the input of a wide range of interested parties.
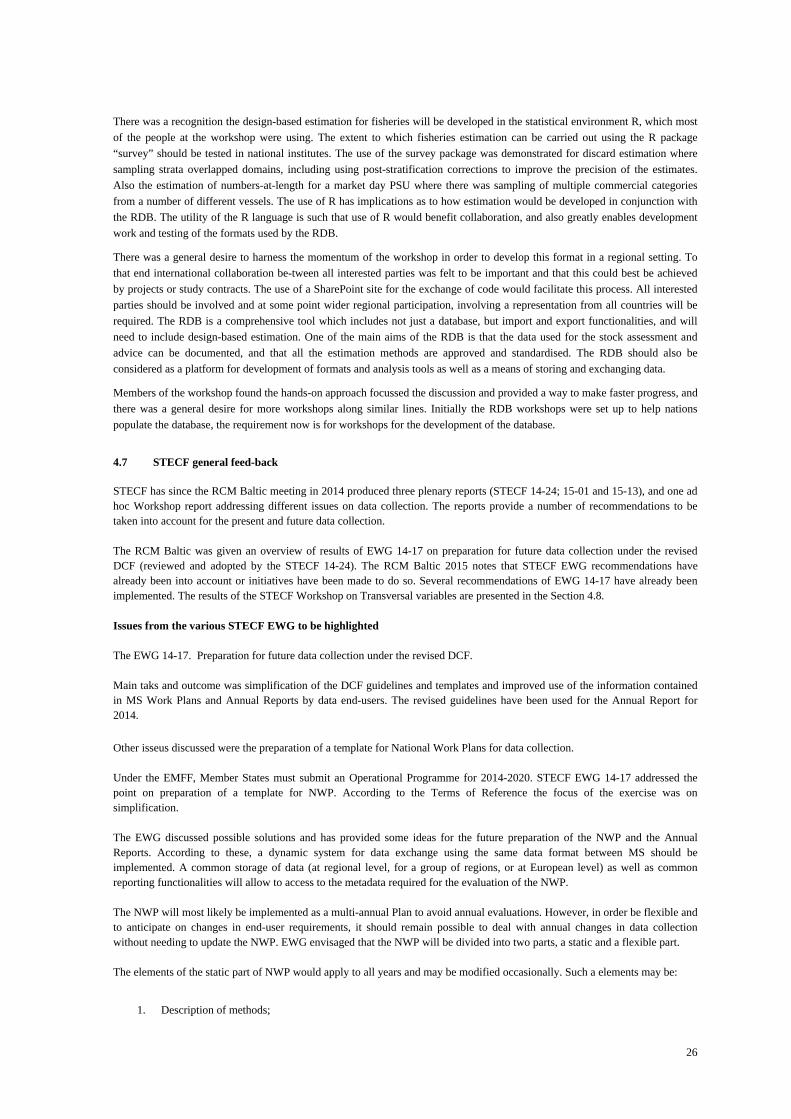
26
There was a recognition the design-based estimation for fisheries will be developed in the statistical environment R, which most
of the people at the workshop were using. The extent to which fisheries estimation can be carried out using the R package
“survey” should be tested in national institutes. The use of the survey package was demonstrated for discard estimation where
sampling strata overlapped domains, including using post-stratification corrections to improve the precision of the estimates.
Also the estimation of numbers-at-length for a market day PSU where there was sampling of multiple commercial categories
from a number of different vessels. The use of R has implications as to how estimation would be developed in conjunction with
the RDB. The utility of the R language is such that use of R would benefit collaboration, and also greatly enables development
work and testing of the formats used by the RDB.
There was a general desire to harness the momentum of the workshop in order to develop this format in a regional setting. To
that end international collaboration be-tween all interested parties was felt to be important and that this could best be achieved
by projects or study contracts. The use of a SharePoint site for the exchange of code would facilitate this process. All interested
parties should be involved and at some point wider regional participation, involving a representation from all countries will be
required. The RDB is a comprehensive tool which includes not just a database, but import and export functionalities, and will
need to include design-based estimation. One of the main aims of the RDB is that the data used for the stock assessment and
advice can be documented, and that all the estimation methods are approved and standardised. The RDB should also be
considered as a platform for development of formats and analysis tools as well as a means of storing and exchanging data.
Members of the workshop found the hands-on approach focussed the discussion and provided a way to make faster progress, and
there was a general desire for more workshops along similar lines. Initially the RDB workshops were set up to help nations
populate the database, the requirement now is for workshops for the development of the database.
4.7 STECF general feed-back
STECF has since the RCM Baltic meeting in 2014 produced three plenary reports (STECF 14-24; 15-01 and 15-13), and one ad hoc Workshop report addressing different issues on data collection. The reports provide a number of recommendations to be taken into account for the present and future data collection. The RCM Baltic was given an overview of results of EWG 14-17 on preparation for future data collection under the revised DCF (reviewed and adopted by the STECF 14-24). The RCM Baltic 2015 notes that STECF EWG recommendations have already been into account or initiatives have been made to do so. Several recommendations of EWG 14-17 have already been implemented. The results of the STECF Workshop on Transversal variables are presented in the Section 4.8. Issues from the various STECF EWG to be highlighted The EWG 14-17. Preparation for future data collection under the revised DCF. Main taks and outcome was simplification of the DCF guidelines and templates and improved use of the information contained in MS Work Plans and Annual Reports by data end-users. The revised guidelines have been used for the Annual Report for 2014.
Other isseus discussed were the preparation of a template for National Work Plans for data collection. Under the EMFF, Member States must submit an Operational Programme for 2014-2020. STECF EWG 14-17 addressed the point on preparation of a template for NWP. According to the Terms of Reference the focus of the exercise was on simplification. The EWG discussed possible solutions and has provided some ideas for the future preparation of the NWP and the Annual Reports. According to these, a dynamic system for data exchange using the same data format between MS should be implemented. A common storage of data (at regional level, for a group of regions, or at European level) as well as common reporting functionalities will allow to access to the metadata required for the evaluation of the NWP. The NWP will most likely be implemented as a multi-annual Plan to avoid annual evaluations. However, in order be flexible and to anticipate on changes in end-user requirements, it should remain possible to deal with annual changes in data collection without needing to update the NWP. EWG envisaged that the NWP will be divided into two parts, a static and a flexible part. The elements of the static part of NWP would apply to all years and may be modified occasionally. Such a elements may be:
1. Description of methods;

27
2. A description of the various sampling methods the MS will apply,
3. A description of data bases,
4. Quality assurance,
5. A description of actions taken at the MS level to ensure the quality of the data,
6. A description of the procedures the MS will apply e.g. with regard to the transmission of data through data calls,
7. Surveys,
8. Derogations: a list of agreed permanent derogations from obligation; Agreements: which apply between MS and have a multi-annual character.
The elements of the flexible part would house other elements in the NWP, which are subject to frequent revisions or annual changes. These revisions would need to be evaluated annually only if revisions are made. These elements are: Sampling intensities; Description of deviations, possible recent changes made in the static part of the NWP, derogations and recommendations. Proposed Database with NWP information The EWG 14-17 proposed that the future submission of the NWP should be facilitated by uploading intended sampling information to a database (to be developed). Similarly, the achieved sampling information, presently presented in Excel files in the Annual Report (AR) should be submitted to this database either through a RDB or directly from a national database. Regional coordination of NWP development and data quality evaluation EWG 14-17 considered that future tasks of RCGs include preparing general guidelines on sampling procedures, allocating tasks and harmonising quality standards at regional level. In general, the procedure of NWP creation should follow a series of steps, beginning from specifying objectives of the data collection in terms of end-user needs, identifying the most appropriate statistical design of data collection schemes, evaluating the sampling effort and its distribution across strata needed to deliver the required estimates and precision. After that, MS would implement this scheme in their NWP. Annual Reports The EWG 14-17 found that since the format and contents of National Work Plans are not defined yet, it was premature to conclude on future Annual Report structures. Ideally, most of the information needed on fleet activities, conducted sampling etc. can be generated from existing (or future) regional or supra-regional databases. Therefore the EWG reiterated a clear need for regional databases. It would be more efficient and cost effective to have databases designed by data type/regional requirement, rather than a more complicated, “hold all” database. Databases should be in place by 2017. The management of the future DCF could be greatly facilitated through these databases.
4.8 STECF expert workshop on tranversal variables
The Workshop on the Transversal Variables took place in Zagreb from the 19th to 23rd of January, 2015. This workshop was proposed by the Planning Group on Economic Issues (PGECON) at its 3rd meeting (May 31 - April 4, 2014). PGECON proposed the realization of an ad-hoc workshop on “Linking economic and biological effort data / call design” in 2014. The need for the workshop was due to the increasing need of having economic and biologic data on a level of disaggregation that would allow a proper interoperability between datasets. The terms of reference (ToR) the group addressed were:
A. Comparison of economic and biological effort data calls (resolution/level of aggregation); experience from management plan evaluation;
B. Definition of variables (e.g. days at sea vs. fishing days) – what is really required/used/desirable?;
C. Opportunities for harmonization (resolution, definition, codification); any conclusions for DCMAP?
D. Exploration of optimum timing for the data calls and specific data sets.
The workshop had 29 attendees (25 experts from MS, 3 experts from JRC and the focal point from DG MARE). The skills of the experts that attended the WK were deliberately varied through the request for registrations from biologists, economists and data managers. This allowed a broad coverage on the issues to be discussed. The work was conducted in three subgroups: data crunching (ToR A), variables estimation and definition (ToR B) and Codes Harmonization (ToR C). ToR D was addressed in plenary. Terms of Reference were addressed fully.

28
ToR A, was addressed using three approaches: 1. Identify what data is available from these three data calls launched by DGMARE (Fleet economic data call, Effort regimes data call and Mediterranean and Black sea data call.The Official data call letters and definitions can be found at DCF website at http://datacollection.jrc.ec.europa.eu/data-calls.) and managed by JRC and what data would be required to prepare a dataset to support bio-economic modelling. This analysis has focused on the data structure, rather than on the content and has allowed identification of the convergences and mismatches between data calls and to put forward solutions that would support overcoming the differences; 2. Compare landings and effort data between the data calls and explore the reasons for the different values; 3. Explore how datasets can be used and merged using a case study. The main conclusion is that though problems were found in terms of dimensionality in each data call individually, the group concluded that by merging the two data sets the dimensions in place would be the ones needed for bio-economic analysis at supra national level. Additionally, it was identified that there is a strong need for guidance and identification of standards with regards to data provision for the MS. Several specific misunderstandings from the effort data call and the economic data call were identified. Situations such as those arising due to data confidentiality must be objectively tackled by providing clear policy to MS to avoid missing data and/or data rejection during JRC data calls. Maybe EUROSTAT’s vast experience might be of good use for JRC. In general the effort and economic landings data sets are relatively comparable. However, an investigation into landings data in both data sets (limited to North Sea demersal species in 2012) revealed several inconsistencies and discrepancies, including mismatch between gears and values. To help resolve this there needs to be 1 clarification from some MS on how data are allocated to gear categories, particularly within the economic data call. On addressing ToR B, the group has prepared a full description of the calculation methods each MS uses when estimating effort variables - days at sea and fishing days - under 6 fishing scenarios; This has proved that different calculation methodologies are in place across MS and sometimes within a MS. This has a huge impact on data comparability and data coherence. The Transversal WS January 2015 agreed to set up common standards for calculating the number of days at sea and number of fishing days and recommends that all MS use this common standard when calculating days at sea and fishing days. In order to have sufficient information for carrying out the various analyses requested by the EU Commission the Transversal WS January 2015 recommends that the status of some of the existing logbook fields (dimension of passive gears, and fishing time) are changed from optional fields to mandatory fields. In addition, MS should make every effort to ensure completion of an existing mandatory field (number of fishing operations). Calculation of days at sea and fishing days in the EU Member States is carried out using several different methods. Ways to estimate fishing days for passive gears and vessels not carrying logbooks should be examined in a follow up technical workshop. The workshop should also identify the information needed to calculate the estimates and evaluate to what extent the identified information is available through logbooks and other official statistics. The workshop should then agree on harmonized ways to estimate fishing days that can be implemented in MS. With regard to ToR C, the group has thoroughly evaluated the drafted suggestions for standardisation of codes and variable definitions used in both the effort and economic data calls and defined a single approach (where possible). The main variable groups considered were Capacity, Landings and Effort. In reviewing the data call code lists the group also compared the standard codes published by DG MARE in the EC Master Data Register (MDR). This contains data structures and lists of fisheries codes to be used in electronic information recording and exchanges among Member States and for Member States' communications with Norway to record and report fishing activities. For harmonization on resolution, definition and codification: a set of tables with standard codes and levels of disaggregation to be used in the three data calls for the future was produced; (already aligned with the DGMARE Master Data Register). Also the group suggested standardisation of codes and variable definitions for use in both effort and economic data calls and definition of one single approach (where possible). The main variable groups considered were Capacity, Landings and Effort. ToR D, discussed the timing for the data calls, however it was agreed that this issue had already been fully addressed by a STECF EWG (EWG 14-17) 2 and therefore further elaboration from the workshop was unnecessary. Given the important conclusions drawn and the additional work identified, the group has agreed on a roadmap for the way forward to tackle the different problems encountered and put in place solutions. This roadmap entails firstly a presentation of the workshop results to the STECF spring plenary. Second, to have an intermediate workshop with MS to assess how MS data would result from the new standards and to assess to what extent the scenarios identified represent the range of situations MS will find in their own data, so as to guarantee a smooth implementation for the 2016 data calls.

29
5. Regional data collection, analysis and storage and evolution towards Regional
Coordination Groups (RCGs)
5.1 The FishPie project (mare/2014/19)
The project “strengthening regional cooperation in data collection” MARE2014-19 has been renamed “fishPi” and is a collaboration of 13 scientific institutions form 12 member states based on the RCM NSEA region. Members of the RCM NA and RCM Baltic have prominent roles within the project. There are two external experts with particular statistical and survey design experience involved. The fishPi project is running in parallel with a project with similar aims and objectives in the Mediterranean and Black Sea region. The project started in April 2015 and is due to run for one year. An overview of the project structure, work packages, aims, objectives and progress was presented to plenary. Progress since April 2015 has covered the following: A kick off meeting with the commission was held in April, this has been followed by project start up meetings, statistical planning meeting and software planning meeting in Aberdeen in May. A case study start up meeting was held in June, and a data quality work package meeting in July in Port en Bessan. The work package dealing with bycatch, stomach sampling designs and small scale fisheries was held in Sukarrieta during July. These face to face meetings have involved the work package leaders and their core teams from different institutes across Europe. Numerous web based meetings between the work package and core teams have occurred to facilitate the progress of the work. A web based meeting to explore mutual aspects of the fishPi project and the Mediterranean and Black Sea project was held in July. Document drafting the statistical principles underlying design based sampling and probability based selection, and the use of appropriate statistical estimators has been drafted. Software scripts to simulate two stage cluster sampling and scripts to run estimation software have been written. Each case study has collated a fine scale data sets based on logbook and sales note data has been assembled from 13 scientific institutions operating in the regions. These have been harmonized and checked for the various case study components and will enable simulation models of alternative sampling designs to be tested, and the estimation process used, to be tested. This process was facilitated by the generation of software tools, scripts and functions which have been disseminated within the core team of the work package. The csData format developed at the WKRDB 5 workshop in October 2014 has, with some additional refinements, has been defined as an R object and stored in an R package “fishPiFormats”. The code lists for WoRMS species list, the FAO ASFIS species lists, the revised metier table, the UNLOCODE table, and the DCF vessel type codes have been collected into R and compiled into an R package “fishPiCodes”. Prior to the commencement of the work of the project a consortium agreement was drawn up and signed by the project partners. Prior to the collation of the data a data sharing agreement was drawn up and signed by the project partners. An interim meeting with the commission is scheduled for 21st October.
5.2 Progress in data quality screening, harmonisation of national and regional data checking procedures
Data quality is an issue for all steps involved in data collection and the workflow was described involving seven steps in RCM NS&EA 2014 report. To reach a regional coordinated sampling program which can produce high quality data, all steps need to be taken into account. For the data collection community it is important to elaborate and develop procedures for each step, each involving different kinds of actions. However, the workflow below illustrates the ideal situation where the raising of data is conducted within the RDB, which is not the present situation. An additional step involving “Data archiving“ should also be considered. The outcome from several ICES workshops and working groups, EU projects (e.g. WKPICS, WGCATCH, WGRFS, fishPi) is valuable input to the different steps to increase the data quality.
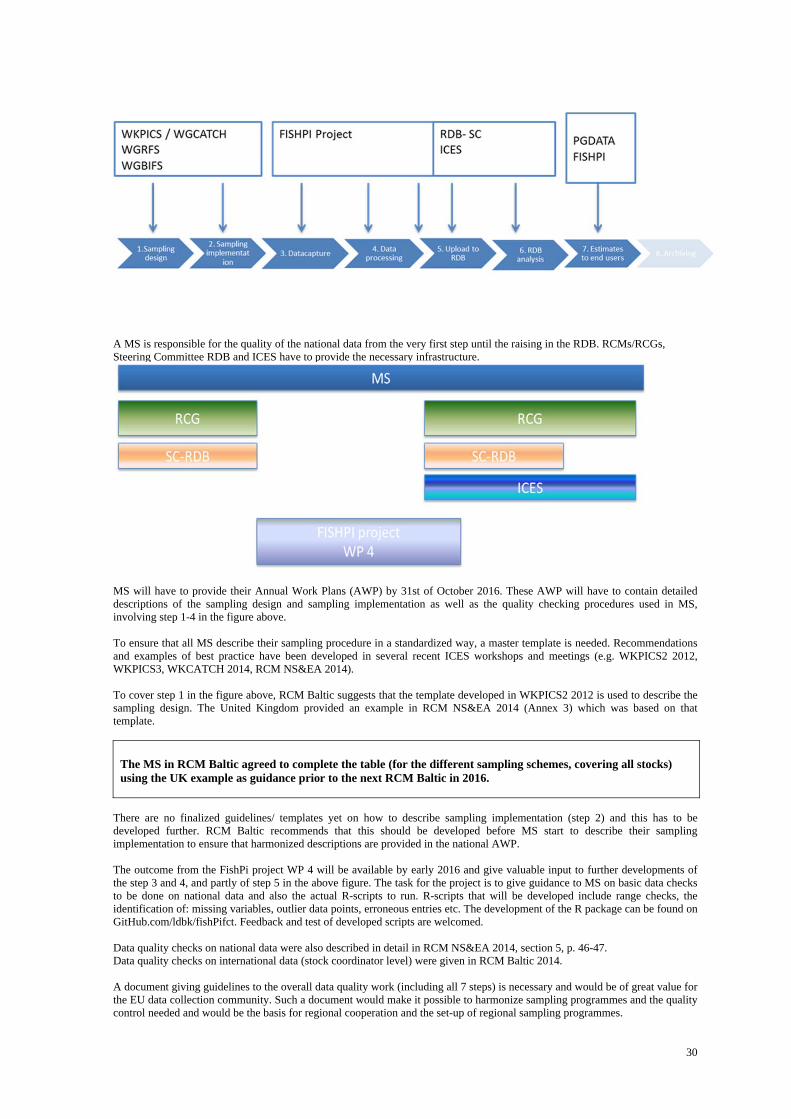
30
A MS is responsible for the quality of the national data from the very first step until the raising in the RDB. RCMs/RCGs, Steering Committee RDB and ICES have to provide the necessary infrastructure.
MS will have to provide their Annual Work Plans (AWP) by 31st of October 2016. These AWP will have to contain detailed descriptions of the sampling design and sampling implementation as well as the quality checking procedures used in MS, involving step 1-4 in the figure above. To ensure that all MS describe their sampling procedure in a standardized way, a master template is needed. Recommendations and examples of best practice have been developed in several recent ICES workshops and meetings (e.g. WKPICS2 2012, WKPICS3, WKCATCH 2014, RCM NS&EA 2014). To cover step 1 in the figure above, RCM Baltic suggests that the template developed in WKPICS2 2012 is used to describe the sampling design. The United Kingdom provided an example in RCM NS&EA 2014 (Annex 3) which was based on that template.
The MS in RCM Baltic agreed to complete the table (for the different sampling schemes, covering all stocks) using the UK example as guidance prior to the next RCM Baltic in 2016.
There are no finalized guidelines/ templates yet on how to describe sampling implementation (step 2) and this has to be developed further. RCM Baltic recommends that this should be developed before MS start to describe their sampling implementation to ensure that harmonized descriptions are provided in the national AWP. The outcome from the FishPi project WP 4 will be available by early 2016 and give valuable input to further developments of the step 3 and 4, and partly of step 5 in the above figure. The task for the project is to give guidance to MS on basic data checks to be done on national data and also the actual R-scripts to run. R-scripts that will be developed include range checks, the identification of: missing variables, outlier data points, erroneous entries etc. The development of the R package can be found on GitHub.com/ldbk/fishPifct. Feedback and test of developed scripts are welcomed. Data quality checks on national data were also described in detail in RCM NS&EA 2014, section 5, p. 46-47. Data quality checks on international data (stock coordinator level) were given in RCM Baltic 2014. A document giving guidelines to the overall data quality work (including all 7 steps) is necessary and would be of great value for the EU data collection community. Such a document would make it possible to harmonize sampling programmes and the quality control needed and would be the basis for regional cooperation and the set-up of regional sampling programmes.

31
RCM Baltic suggests to setup a project involving a few experts to come up with this document based on the outcome from the different meetings as well as good examples. Role of the sampling data format in terms of integration of sampling data collection, recording and the present and future RCM data calls
5.3 Design-based sampling: state of play
Statistically sound sampling programmes (Design-based sampling) in the Baltic Sea region have at present time been (partly)
implemented by Denmark, Sweden and Germany. Design-based sampling was first introduced in the observer programs, by the
three MS and the development of the programs has been time consuming and needed to be adjusted over time. Denmark and
Sweden introduced design–based sampling program in the at-shore sampling program in 2014. Each of those three MS applied
slightly different solutions regarding the design and practical implementation such as draw-list, stratification and effort
allocation ranking system. Some of these differences are reflecting the organisation pattern as well as the ability to target the
landings and vessels within the MS, however, in all cases sampling is based on statistical principles of random sample selections
and documentation. The most important elements of design-based sampling are documentation of design, implementation, a
random drawlist, relevant stratification, recording of refusal rate, methods to handle data gaps etc.,
Poland, Lithuania and Estonia have made some preparatory steps to implement the design-based sampling in the near future.
Latvia and Finland, due to the characteristic of their fisheries, do not consider changes to their current sampling designs.
For those MS which plan to implement design-based sampling schemes, Denmark and Germany offered to share its experience on that field, with an option of visiting relevant Institutes to see the way system works and is operated.
5.4 Bilateral and multilateral agreements in place
The RCM Baltic reviewed the list of bilateral and multilateral agreements currently in force in the Baltic region. Although some
of the bilateral agreements between the Baltic MS are under the revision process, there were no changes to both the number and
scope of those agreements as compared to previous years.
Following the recommendation of the RCM Baltic 2011 on procedures to be applied in order to identify where bilateral
agreements on sampling of foreign landings have to be set up, addressed by LM8 and secondly by STECF EWG 11-19 (STECF-
12-02) and subsequently agreed on, the RCM Baltic performed an analysis aimed to determine if a new bilateral agreements are
needed, based on landing data from 2012-2014 (from FishFrame) and applying following, previously agreed criteria:
• that the 200 tonnes limit exemption rule (2010/93/EU B2.1.5) is applied also for foreign landings;
• that species where less than 5% of a Member State’s total landings are landed abroad are excluded
(corresponding to the application of 1639/2001);
• that if the No. of samples according the old DCR (1639/2001appendix XV) are 3 or less, there is no need for
sampling of the landings by the landing country and can instead be sampled by the flag country. Also, in these
cases no formal agreement needs to be set up.
An overview giving the landings abroad of cod, herring and sprat for 2012 - 2014 is given in table 5.1
The Member States for whom the above table indicates that a bilateral agreement shall be set are invited to enter into appropriate
arrangements to establish such agreements in order to secure sufficient sampling level satisfying the needs of the end-users.
With regard to landings from cod stocks in the Baltic in 2012 – 2014 table 5.1 does not provide the split between western and
eastern cod stock and, therefore, in order to determine if the bilateral agreements are required MS concerned shall perform
further analysis of 2012 – 2014 landings by respective cod stock.
Table 5.1 Overview of 2012-2014 average annual national landings and landings abroad exceeding 200t, by country (Source:
RDB FishFrame)
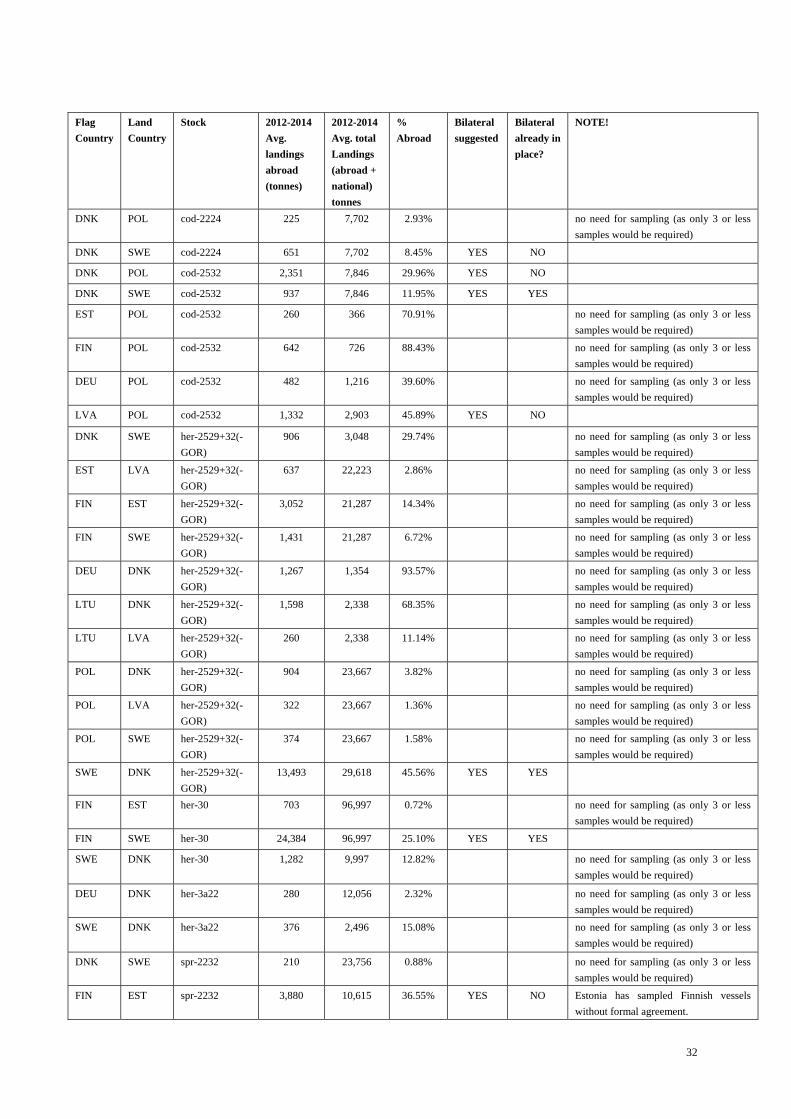
32
Flag
Country
Land
Country
Stock 2012-2014
Avg.
landings
abroad
(tonnes)
2012-2014
Avg. total
Landings
(abroad +
national)
tonnes
%
Abroad
Bilateral
suggested
Bilateral
already in
place?
NOTE!
DNK POL cod-2224 225 7,702 2.93% no need for sampling (as only 3 or less
samples would be required)
DNK SWE cod-2224 651 7,702 8.45% YES NO
DNK POL cod-2532 2,351 7,846 29.96% YES NO
DNK SWE cod-2532 937 7,846 11.95% YES YES
EST POL cod-2532 260 366 70.91% no need for sampling (as only 3 or less
samples would be required)
FIN POL cod-2532 642 726 88.43% no need for sampling (as only 3 or less
samples would be required)
DEU POL cod-2532 482 1,216 39.60% no need for sampling (as only 3 or less
samples would be required)
LVA POL cod-2532 1,332 2,903 45.89% YES NO
DNK SWE her-2529+32(-
GOR)
906 3,048 29.74% no need for sampling (as only 3 or less
samples would be required)
EST LVA her-2529+32(-
GOR)
637 22,223 2.86% no need for sampling (as only 3 or less
samples would be required)
FIN EST her-2529+32(-
GOR)
3,052 21,287 14.34% no need for sampling (as only 3 or less
samples would be required)
FIN SWE her-2529+32(-
GOR)
1,431 21,287 6.72% no need for sampling (as only 3 or less
samples would be required)
DEU DNK her-2529+32(-
GOR)
1,267 1,354 93.57% no need for sampling (as only 3 or less
samples would be required)
LTU DNK her-2529+32(-
GOR)
1,598 2,338 68.35% no need for sampling (as only 3 or less
samples would be required)
LTU LVA her-2529+32(-
GOR)
260 2,338 11.14% no need for sampling (as only 3 or less
samples would be required)
POL DNK her-2529+32(-
GOR)
904 23,667 3.82% no need for sampling (as only 3 or less
samples would be required)
POL LVA her-2529+32(-
GOR)
322 23,667 1.36% no need for sampling (as only 3 or less
samples would be required)
POL SWE her-2529+32(-
GOR)
374 23,667 1.58% no need for sampling (as only 3 or less
samples would be required)
SWE DNK her-2529+32(-
GOR)
13,493 29,618 45.56% YES YES
FIN EST her-30 703 96,997 0.72% no need for sampling (as only 3 or less
samples would be required)
FIN SWE her-30 24,384 96,997 25.10% YES YES
SWE DNK her-30 1,282 9,997 12.82% no need for sampling (as only 3 or less
samples would be required)
DEU DNK her-3a22 280 12,056 2.32% no need for sampling (as only 3 or less
samples would be required)
SWE DNK her-3a22 376 2,496 15.08% no need for sampling (as only 3 or less
samples would be required)
DNK SWE spr-2232 210 23,756 0.88% no need for sampling (as only 3 or less
samples would be required)
FIN EST spr-2232 3,880 10,615 36.55% YES NO Estonia has sampled Finnish vessels
without formal agreement.

33
FIN SWE spr-2232 1,429 10,615 13.46% no need for sampling (as only 3 or less
samples would be required)
DEU DNK spr-2232 9,432 10,564 89.28% YES YES
DEU SWE spr-2232 351 10,564 3.33% no need for sampling (as only 3 or less
samples would be required)
LVA DNK spr-2232 225 31,596 0.71% no need for sampling (as only 3 or less
samples would be required)
LTU DNK spr-2232 8,710 10,418 83.60% YES NO
LTU EST spr-2232 310 10,418 2.98% no need for sampling (as only 3 or less
samples would be required)
LTU LVA spr-2232 982 10,418 9.43% no need for sampling (as only 3 or less
samples would be required)
POL DNK spr-2232 13,629 67,195 20.28% YES YES
POL LVA spr-2232 1,774 67,195 2.64% no need for sampling (as only 3 or less
samples would be required)
POL SWE spr-2232 4,859 67,195 7.23% YES YES
SWE DNK spr-2232 25,685 47,819 53.71% YES YES
5.5 Areas and topics where there is a need for intra-institute intersessional work
The RCM Baltic discussed in response to ToR 3g various needs and aspects relevant for facilitating future work of the RCMs/RCGs. Future tasks do not differ much from the current tasks.
Structure of RCGs
Converting RCMs to RCGs has been subject of many discussions over the last years in various groups. The common idea is that the RCGs will work as a process rather than a meeting once a year, although the meetings are crucial for the success of the coordination process. In the future, one annual meeting (or more when required) of the RCGs is foreseen to address the four main topics listed above, including identifying, distributing and steering the work in support of the coordination tasks, such as developments of the regional database, updating reference lists and development and implementation of sampling procedures. The work in support of the coordinating tasks will be done intersessionally throughout the year either in structured and formalised subgroups like the current Steering Committee for the Regional Databases or on a more temporal basis to address ad hoc issues. A data preparation group prior to the main meeting(s) is needed as well, to compile, to quality check and prepare the data needed for analysis during the RCG, thus limiting the time needed at the RCG for manipulating the data. The annual meeting also details proposals for task sharing between MS to fulfil the commitments of a regional sampling plan. These proposals can then be discussed, refined when needed and agreed upon during a dedicated 2nd meeting by the NCs. The RCM Baltic expressed a short term need to identify persons within the national institutes that can support the coordination process by addressing specific issues. This list can also be used in the future to establish dedicated groups to cover certain subjects. Moreover, certain issues might require specific expertise and the RCGs may have the opportunity to employ expert panels to address certain issues e.g. quality audit on MS sampling schemes. In other cases, individual institutes might be requested to address a specific issue. This need implies that the RCG need commitment by MS to allocate certain tasks to (groups of) persons. This also requires the commitment of national institutes to the RCG processes by providing and facilitating the experts to carry out their tasks during the year, rather than during one meeting a year. Working procedures and subsequent responsibilities differ for each MS, and it is suggested that the RCM chairs liaise with the EFARO board to discuss this issue and to prepare the ground for commitment to future tasks.
Issues that are common for all RCGs should be addressed on a supra regional level, ensuring efficient use of resources and uniform development of tools, reference lists and sampling designs. To enhance this process, intersessional cooperation between the RCG chairs is needed, as well as the establishment of supra regional subgroups when addressing these issues. Aligning the annual workplan for the RCGs shall be done by the RCGs chairs.

34
6. Analysis of RDB 2014 data
6.1 Status of the Regional Data Base (RDB)
Harbour codes This year only LOCODE should be used for harbour codes. LOCODE is a 5 alphanumeric code (typically only alphabetic characters) where the first 2 is the ISO country code and the last 3 is the harbour code. The LOCODE reference list is the Code-location under the EC’s Master Data Register, the current version is Code-locatioon-v1.7.xls, https://circabc.europa.eu/faces/jsp/extension/wai/navigation/container.jsp?FormPrincipal:_idcl=FormPrincipal:libraryContentList:pager&page=1&FormPrincipal_SUBMIT=1&org.apache.myfaces.trinidad.faces.STATE=DUMMY . ICES has updated all existing LOCODE with correct harbour name (Gr+ñs+Â to Gräsö) Added missing LOCODE Automatically found the correct LOCODE where there was a match on the harbour and updated to LOCODE. Deleted 1768 none-LOCODE harbours.There is still some harbour codes which have not been substituted with LOCODE, when an obvious LOCODE harbour have not been identified. It the coming time ICES will contact countries, which will be asked to map the outstanding harbour codes to LOCODE codes. ICES will then make the final update. Metier acceptance per area This year the only specific metiers were allowed depending on the area. ICES received a matrix of valid metiers and fishing grounds. ICES then changed from the previous metier check to a tailored metier check where each metier is checked based on the area. If a country have a metier, which is not accepted, it should be tried to find a substituting valid metier from the list send with the data call. If that is not possible the country should take contact to the RCM chair who maybe together with experts should be able to advice on what metier to use or if the metier need to be allowed, in such case ICES should contacted for adding the new valid metier. Data exchange format document A new version of the RDB exchange format document has been send out and it is available on the RDB website, http://www.ices.dk/marine-data/data-portals/Pages/RDB-FishFrame.aspx , and in the RDB. It is not a new exchange format, it is the same data exchange format, but the document have been made simpler, references have been corrected and updated, and the document have been made consistent with the existing checks. Data Policy document Before last year’s RCM an updated version of the Data Policy document for the RDB was sent to all national correspondents for acceptance and support. All countries except France accepted and supported the Data Policy document and a few countries had comments or questions. Since last year ICES have compiled all comments and questions and the SCRDB have given answers, which was send to all countries. At the National Correspondent meeting in Brussels the 25th March 2015 the European Commission (EC) informed all Member States (MS) that the Commission sees the Data Policy as an important and the EC lawyers agreed in the content of the document. Therefore, the Commission encouraged all MS to sign in for it - including France. EC feasibility study on storage and transmission The EC’s feasibility study on “Scientific data storage and transmission under the 2014-2020 Data Collection Multi-Annual Programme (DC-MAP)” concluded that the majority supported scenario 4 referred to as “Fisheries data hub”, which is a structure not so far from the structure today, with data uploads to the RDB at ICES, see the figure 6.4 below. However, with indications of in the future to have a more streamlined data flow.

35
Figure 6.4 showing the preferred scenario 4 – Fisheries data hub The RDB strategy There are many benefits of having a central system like the RDB; common quality check also across countries, standardised methods to raise/estimate fisheries data, efficient standardised reports and analysis. Looking at the raising/estimation methods it is essential to only be able to raise/estimate data with approved and documented standardised methods, and it is also essential to be able to document all data processing steps. The move towards using statistical sound raising methods is ongoing in the fishPi project, WKRDB and WGCATCH. The starting point has been the R methods in the R survey. When the method have been approved and finalised, the most cost effective way to use these methods is to include the methods directly into the RDB using version control. Using standardised raising methods is one thing. But it is also essential that the national institutes after uploads and estimations can extract the data from the RDB, so they can verify the uploaded data and follow the data through the processing steps. In the figure 6.5 below the future RDB system structure is shown.

36
Figure 6.5 of the future RDB system structure ICES one time funding of development of the RDB The RDB improves the data quality, ensures standardised raising methods and documentation. It is therefore very important that there is funding for development of the RDB, so the RDB is able to adapt to new demands and there is progress. The Commission has so far not funded developments of the RDB hosted by ICES. But in September 2014 the ICES council delegates approved a one time development of the RDB for 91 000 EUR, because ICES sees the need for development. The focus has been on new analysis reports. RDB funding in the future The RDB have for several years been the essential system for data for analysis for the RCM Baltic Sea, RCM North Sea & Eastern Arctic and RCM North Atlantic, and it can support the Member states in raising national data and answering data calls. The RCMs depend on the RDB, and the data for stock assessment and advice to the Commission also depend on data quality, standardised proven raising methods and documentation, it is therefore difficult to understand that the Commission is financially supporting developments of the RDB. The RDB is a large and complex system with a large relational database behind it and complex data manipulations, algorithms and methods. The RDB is the most cost efficient way to work with all the data from all the countries because the heavy raising processing and processes for all data is more or less the same. Since the environment around the RDB is continuously changing with new needs and demands, it is essential that there is funding for development. The most optimal and cost efficient way of funding RDB development would be to include RDB development in the existing Memorandum of Understanding (MoU) agreement about the RDB between the Commission and ICES. This will ensure qualified resources, which would be able to implement new needs and demands, in the most cost efficient, safe and successful way. It would not be a sustainable approach not to have a longer term funding for development of a system like the RDB. If developments have to be funded by studies/projects, there would first of all be a long time delay from a need is identified to a call for tender, to a project proposal, to acceptance, to project start and finally the implementation. This approach administratively very burdensome and not cost efficient. In addition external experts without in depth knowledge of the RDB would have to be hired on short term contacts. It would reqiere a steep and long learning curve of the large and complex RDB system. Such a scenario is not cost efficient and would not benefit any parties. Therefore it is recommended that development of the RDB is included in the MoU between the Commission and ICES. It would also seem natural that the Commission is interested in progress and stabile development of the RDB, especially after the conclusions drawn from the feasibility study on storage and transmission.
The RCM Baltic 2015 would like to stress that a Regional Data Base is a crutial and essential tool for the regional coordination and cooperation data collection. Further, that the Regional Data Base is a prerequisite for successful regional data collection, for providing quality assured data that are processed transparently using agreed methods for the use in the scientific advice processes for the support of the management of the Common Fisheries Policy.

37
6.2 Response of the data call
Following the data call from 18th of June 2015 coordinated by the chairs of the RCM Baltic, RCM North Sea and Eastern Arctic and RCM North Atlantic all Baltic Sea countries were requested to upload 2014 data to the RDB FishFrame. The data call included only data from 2014 for all species and for all métiers. To ensure that existing data in the RDB until 2013 were complete, all MS were also instructed to check that all species, and not only the major species, had been uploaded in response to earlier data calls. Data uploaded to the RDB (by 23/08/2015) for 2009-2014 from the Baltic region are presented in tables 6.1 - 6.4. In the tables, information on RDB record used is included. Table 6.1 Number of records (CL) in the commercial landing statistics by flag country and data year (in the RDB per 23/08/2015).
Number of landings records held on the RDB as of the 23/8 2015 2009 2010 2011 2012 2013 2014
Denmark 2009 2010 2011 2012 2013 2014
Estonia 31855 28651 27620 26343 24503 28136
Finland 641 3904 4010 15639 18422 20526
Germany 1196 1179 1182 1185 1163 6187
Latvia 16699 14613 14511 15353 13409 14287
Lithuania 3632 2507 2579 2454 2522 3853
Poland 187 131 374 479 507 686
Sweden 8244 7773 9557 11009 11249 12010
Grand Total 86497 78117 77129 88144
90977 101340 Table 6.2 Number of species in commercial landings statistics (CL records) per flag country and data year (in the RDB per 23/08/2015).
Number species in the landings statistics per country (vessel flag) 2009 2010 2011 2012 2013 2014
Denmark 49 55 47 51 54 53
Estonia 28 38 40 33 38 35
Finland 21 21 21 21 21 21
Germany 43 43 40 45 46 45
Latvia 30 12 12 12 12 34
Lithuania 12 11 13 27 12 25
Poland 36 38 36 34 36 34
Sweden 49 48 47 42 42 45
Grand Total 268 266 257 265
261 292

38
Table 6.3 Number of species in the commercial samplings (HH and HL records) per flag country, catch category and data year (in the RDB 23/08/2015).
Table 6.4 Number of species in in the commercial samplings (CA records) per flag country, catch category and data year (in the RDB 23/08/2015).
Number species in the age sampling statistics per country (vessel flag)
Catch category 2009 2010 2011 2012 2013 2014
Denmark Landing 12 11 11 11 15 10
Discard 6 8 9 8 8 9
Estonia Landing 5 12 19 30 32 43
Discard - - - - - -
Finland Landing 6 7 7 8 7 7
Discard 1 5 3 3 5 4
Germany Landing 8 8 7 9 9 8
Discard 5 8 7 8 7 7
Latvia Landing 4 4 9 10 10 8
Discard 2 1 2 2 2 6
Lithuania Landing 3 4 4 4 4 5
Discard 2 1 2 2 2 4
Poland Landing 8 11 11 12 14 16
Discard 5 7 10 11 9 13
Sweden Landing 3 4 3 3 3 4
Discard 2 2 1 2 2 2
Grand Total
72 93 105 123 129 146
Number species in the length sampling statistics per country (vessel flag)
Catch category 2009 2010 2011 2012 2013 2014
Denmark Landing 25 27 20 22 19 18
Discard 31 38 30 23 24 35
Estonia Landing 5 12 19 30 32 43
Discard - - - - - -
Finland Landing 12 9 8 29 29 30
Discard 13 6 5 24 22 21
Germany Landing 22 15 17 19 23 24
Discard 23 27 22 25 25 24
Latvia Landing 4 4 10 11 9 9
Discard 2 4 15 10 12 15
Lithuania Landing 3 4 4 4 5 6
Discard 2 1 2 2 7 14
Poland Landing 19 18 22 36 32 36
Discard 23 21 36 34 36 39
Sweden Landing 13 18 19 16 14 20
Discard 22 24 20 25 28 47
Grand Total 219 228 249 310 317 381

39
Overall the response to the data call can be described as satisfactory. Even though a few of the MS, due to various reasons, have notified that they have not been able to upload parts of their data sets. E.g. Sweden has yet to upload the complete biological sampling of salmon and eel. There are also cases where data have been uploaded successfully, but probable not according to the current protocol. To be able to compile information on these issues further comparative analysis has to be carried out. However, a brief summary like this can also be very helpful. Having knowledge of the status of available data is crucial e.g. for auditing purposes, for quality control and for determination of usage of data. It also allows users, within reasons, to account for missing data in their estimates or reports. Therefore, RCM Baltic 2013 recommended that a system for administering and recording uploaded data and a facility to provide a clear reference for data users on how complete the data is should be developed in the RDB. The RCM Baltic 2014 and also the RCM Baltic 2015 reiterates this recommendation. RCM Baltic 2015 also stresses for the further work and development of the RCMs (or RCGs) that it is a prerequisite to have access to complete data sets on a regional level, preferable in the RDB maintained by the ICES Secretariat. See agreement below.
Agreement
Quality assurance – Upload of historical data to RDB FishFrame
RCM Baltic 2015 Agreement The RCM Baltic agrees on a repetitive data call demanding all MS to ensure that all historical data (including data on salmon and eel) for the period 2009-2014 are uploaded to the RDB hosted by ICES.
Justification A complete and easily accessible regional data set is crucial for the progress of a statistical sound sampling design in the data collection at a regional level.
Follow-up actions needed Data call to all MS via NC
Uploading of missing data by all MS
Responsible persons for follow-up actions
RCM Baltic chair to send out data call.
Time frame (Deadline) 1st February 2016
LM comments
The RCM Baltic 2015 takes the opportunity to once again acknowledge the ICES Secretariat as the ultimate RDB manager. In the management one crucial thing is that it includes development and implementation of new methods and functionalities in the RDB in close interaction with end-users (RCMs and e.g. ICES assessment working groups). In this context, the RCM Baltic also wants to thank the ICES Secretariat. The communication during the uploading process was a fast as usual and all MS appreciates the support including helpful suggestions that they received when encountering problems. The accessibility to data prior to the meeting resulted in that the meeting time could again be used even more effectively and some of the analyses in this section were already produced prior to the meeting thanks to standard outputs and to some extent recently pre-produced reports. Clear progress in data availability to the RCM has been achieved since the FishFrame evolved into a RDB. However, the regional work would progress even faster if there were additional standard outputs including pre-produced reports, tables and graphs in the RDB. Hence, Baltic RCM 2015 reiterates its recommendation from 2014 that the RCM work will benefit immensely if the meeting can focus on the discussions and the decisions that are needed, instead of producing the standardised

40
result tables and result graphs. Even if the adoption of the RDB considerably has improved, a substantial part of the RCM time is still spent compiling data and correcting errors. The list of possible outputs that are considered beneficial for future work that RCM Baltic compiled in 2013 (see Section 6.72 in 2013-report) is still valid. The RDB is discussed more in detail in section 6.7. Last, since RCM Baltic 2015 only presents a small part of data currently uploaded to the RDB mainly general conclusions have been possible to draw from the data call response.
6.3 Métier-related sampling
6.3.1 Ranking of métiers
Due to the delay in the legislation process related to the revision of the DCF, the COM and MS has agreed to roll-over the last
approved NPs from the period 2011-2013 to the new period 2014-2016 in order to avoid a legal vacuum in the data collection.
Bearing this in mind, there is not yet any real requirement for a detailed discussion on coordination of NPs at the regional level
the coming year. However, in order to check if the fisheries in 2014 had a similar pattern as in previous years or whether there
had been significant changes, the group continued performing a general overview of fishing activities in the Baltic Sea based on
the ranking of métiers at national and at regional level. Even though the RCM Baltic hold on to that current métier related
sampling is not the best approach for the stock assessment work due to various reasons.
First the ranking of métiers was done by using commercial landing statistics data on effort (days at sea), landings and values for
2014 from the RDB (per 23/08/2015). This ranking was then compared with the ranking based on the NP-s 2011-2013. Still, it
was not expected that the outcome of the two ranking methods would be identical. Instead differences between the 2014 data
uploaded to the RDB and the reference period applied in the NPs 2011-2013 was expected, since they are based on different
years.
When studying the ranking, it is wise to be aware of that effort data from the small-scale fisheries (i.e. vessels not obliged
carrying EU-logbook) is collected in multiple ways in the region depending on the strategy of each MS. Therefore, effort data
might not be comparable inbetween all métiers.
Results from the ranking exercises are presented in Annex 2. The ranking according to 2014 data for SD 22-24 are presented in
tables 1, 3 and 5 and for SD 25-32 in tables 7, 9 and 11. Results from the ranking based on NPs 2011-2013 are found in tables 2,
4 and 6 (SD 22-24) and in tables 8, 10 and 12 (SD 25-32). The results from these exercises are presented both at a national and a
regional level.
In SD 22-24, a total of 70 different métiers have been identified for 2014 and only 36 of them (51%) are covered by regional
ranking. In SD 25-32, a total of 85 different métiers have been identified for 2014 and only 28 of them (33%) are covered by
regional ranking. Hence, a regional approach in sampling design will require major changes in the sampling set-up for most MS.
In tables 13 and 14 in Annex 2, a comparison between the two ranking methods at the regional level is presented. Here, métiers
highlighted in grey are those that were ranked regionally according to the RDB FishFrame data for 2014. As can be seen, there
are some important métiers (e. g. OTB, OTM in SD 22-24 or PTB, GNS in SD 25-32) that are selected for sampling at national
level, but that are not covered by the regional ranking method.
Additionally, the RCM Baltic performed a comparison of métier rankings for the top ten métiers (in SD 22-24 and in SD 25-32)
selected on the basis of 2014 data for effort, landings and value in order to check if there were any substantial fluctuations in
ranking positions of the top métiers over the period 2011-2013. The results presented in tables 15-20 in Annex 2, show that, in
general, the five top métiers selected in 2014 were also top métiers in 2011 - 2013. The very top métier selected in 2014 for
landings, effort and values were also the top métier in 2013.
Based on the above analysis of the most recent métier ranking at the regional level compared with the métiers selected for
sampling in the NPs 2011-2014, the RCM Baltic is of the opinion that there is currently no need for changes or amendments to
the NPs for 2014-2016 in the Baltic region. Unless the individual MS concerned decides otherwise, based on its own analysis of
MS’s métiers ranking procedure.
Issues on quality insurance have again been discussed by RCM Baltic 2015 and are dealt with in section 5.2 (data quality).

41
6.3.2 Updated métier list
RCM Baltic 2015 compiled a new version of the region’s metíér list, see Annex 3.
The aim of the compilation was to ensure that all métiers in the updated version would be unique at a regional level.
The updated version of the métier list was presented in plenary and RCM Baltic decided that all MS should take it back home
and double check that the new minimized métier list comprises all national métiers. Further all MS should check that the updated
version of the métier list is compatible with their national databases. RCM Baltic 2015 chair will collect the requested
information through e-mail correspondence.
6.4 Stock-related sampling
6.4.1 Ranking of species
Additionally RCM Baltic 2015 did a ranking of all species by using commercial landing statistics data from RDB FishFrame
(per 23/08/2015). A weakness in the analysis might be that not all MS have uploaded landings for all species to the RDB.
This ranking exercise, that RCM Baltic performed for the first time, was first done for total landings (in tonnes) and secondly for total value (in thousand €). See Annex 4, table 1 and 2. Note that not all countries have uploaded landings values or the true values of the landings.
RCM Baltic 2015 then compared the species ranking list with Annex VII in COM DEC 2010/93/EU where a list of Biological
variables with stock sampling specification is presented for each region. The text table below shows the species in the Baltic
region that are included in the list of stocks in the DCF annex VII and whether the species is included in the MoU between the
Commission and ICES and whether a TAC is set.
Species DCF Annex VII ICES MoU TACs & Quotas
European Eel X X N
Herring X X X
Common Whitefish X N N
Pike X N N
Cod X X X
Dab X X N
Perch X N N
Flounder X X N
Plaice X N X
Turbot X X N
Salmon X X X
Sea trout X X N
Pike-perch X N N
Brill X N N
Sprat X X X
The main outcomes of this comparison were that several important species in the region are not included in the Baltic Sea
section. Hence, these have not obliged to sample under DCF. Therefore, RCM Baltic 2015 recommends the following species
(stocks) should be included for biological sampling in the future legislation:
- Vendance Coregonus albula
- Smelt Osmerus eperlanus
- Whiting Merlangius merlangus
RCM Baltic 2015 further recommends that the following species (stocks) should be removed:
- Pike Esox Lucius
By adding vendance and smelt, which are important for the fisheries in the northern part of the Baltic Sea, the present southern
focus in the Baltic region will shift to a true regional focus instead, since these species are important at the regional level too.

42
RCM Baltic 2015. Sampling of species
RCM Baltic 2015 Recommendation 1 The RCM Baltic recommends that the species list given in Annex VII in COM DEC 2010/93/EU
for the Baltic region for the new DC-MAP is revised. Pike (Esox lucius) should be deleted and
the stocks of the following species should be added; Vendance (Coregonus albula), Smelt
(Osmerus eperlanus) and Whiting (Merlangius merlangus).
Justification Analyses of the total landings/catches by species caought in the Baltic shows that several important species in the region are not included Annex VII in COM DEC 2010/93/EU for the Baltic region. Therefore, RCM Baltic 2015 recommends that the stock list is revised.
Follow-up actions needed The recommendation is forwarded to the LM and the Commission.
Responsible persons for follow-up actions The Commission
Time frame (Deadline) To be included in the new DC-MAP
Besides, while compiling the species ranking list, duplicate names of some species were detected in the RDB and this
information has been forwarded to ICES.
Further, RCM Baltic 2015 discussed briefly whether future supposed thresholds for stock sampling should be set according to
present criteria or if new criteria should be established. One of the suggestions raised was to follow similar rules as has been
applied for métier sampling with a cut-off for landings and value respectively. No decisions were made on at which percentage
this cut-off should be set in that case.
RCM Baltic 2015 suggests that, in the future, the ranking should preferably be made for stocks instead of species.
6.4.2 Case studies – Cod, sprat and herring
The RCM Baltic 2015 compiled and compared stock-related data collected by the MS in 2012-2014. Data from the RDB (per 23/08/2015) was used. Before presenting the results, RCM Baltic 2015 reminds of the fact that knowledge regarding the sampling design is crucial when performing analysis as discussed in Baltic RCM 2013 report (section 4.4). Besides, aiming for a standardisation of the sampling in the region might be an important objective. Also, detailed knowledge of the fishing pattern of the fleet is crucial. Another aspect is that the sampling size in some cases is low, which could have an impact on the results. Last, one should take into account the share in total landings that each of the countries has, when drawing conclusions. Unfortunately it was not possible to correct for all these factors here. Like in 2014, following was investigated a) length at age relationship and b) weight at age relationship for the key commercial species in the Baltic (cod, sprat and herring). The data from 2014 were plotted in graphs by SD and MS to facilitate the interpretation. See Annex 5 (age-length) and Annex 5 (age-weight). In addition, the RCM-Baltic continued exploring the length at age relationship of cod in SD 25 and length at age relationship of sprat in SD 28 more in detail by comparing the 2012-2014 data plots to try to trace any possible changes in the patterns over the period. Conclusions from the analysis of the length-age and weight-age relationships for cod, sprat and herring: Cod - For the length at age relationship there seems to be quite a high variability overall in between the MS and especially in SD 25 and SD 26. The information from SD 22 and 24, insists that the consistent differences between some countries in age interpretation decreased in the most recent data year. Age-length and age-weight relations now show an improved agreement compared to the analysis compiled by RCM Baltic 2014. Swedish data were excluded from the analysis, since national sampling scheme makes it impossible to compare the relationships directly. As pointed out earlier, one explanation for an observed discrepancy may be the different sampling approaches in the countries’ NP.

43
Sprat – A very good agreement among all MS in all SD was observed for the length at age relationship. For the weight at age relationship the results are more variable, where e.g. data from SD 24 display a high variability. To be able to explain the results in detail, further investigations are needed. Herring – A good agreement in the length at age relationship is displayed for all MS in almost all Sub-divisions. The agreement is less obvious in SD 26 and in 28. For the weight at age relationship the results are more variable, also here, the highest variability among the different MS is found in SD 24, 26 and 28. The variation increases in larger/older herring and decreasing sample sizes. The variation between the results in these subdivisions can be explained besides to possible different age interpretation also by the effect of population structure of herring.
Conclusions from the case studies of cod in SD 25 and sprat in SD 28: For cod in SD 25, the length at age relationship seemed to show some higher level of agreement for the countries in 2014 data sets, particularly for age groups <5. The coherence of results for older ages was very low (Figure 6.1). In fisheries targeting cod, the fishing pattern of the fleet in the region is believed to be relatively heterogeneous and also, the fleet uses different gear types. Besides, the heterogeneity probable holds for the sampling design. Altogether, this suggests that the validity of these results is low.
Figure 6.1. Cod in SD 25 and length at age relationship for 2012, 2013 and 2014 (Data from the RDB per 23/08/2015). As has been pointed out earlier years regarding the Swedish data set, the observed discrepancy is due to differences in sampling design, where Sweden alone applies a size category stratification method. In 2014 data sets, the Swedish data were removed to account for the national sampling scheme. Sweden will, prior to RCM Baltic 2016, present an R-script written to adjust for these differences. It should though be considered whether the Swedish sampling approach should be adjusted in accordance with the recommended methods. For sprat in SD 28, the good agreement for length at age relationship that has been seen earlier is also valid for 2014 data set (Figure 6.2). In fisheries targeting sprat, the fleet in terms of fishing pattern and gear is believed to be more homogenous in the region in comparison with fisheries targeting cod. This probable holds for the sampling design too. If this is true, the validity of these results is high.
Figure 6.2. Sprat in SD 28 and length at age relationship for 2012, 2013 and 2014 (Data from the RDB per 23/08/2015). The discrepancy in the interpretations of a given length as an age 0 or an age 1 is related to when the sampling has been performed. According to practice, the first otolith ring is interpreted as age 1 in samples from quarter 1 and as age 0 in samples

44
from quarter 4. RCM Baltic 2015 did a cross-check of the dataset to confirm that this was the case. The same pattern can be detected throughout the whole time series for both sprat and herring. General conclusion:
RCM Baltic 2015 emphasizes that these case studies on length at age relationship and weight at age relationship are a very useful tool in the stock assessment work and this conclusion is therefore addressed to all stock coordinators.
RCM Baltic 2015. Quality assurance – length at age relationship and weight at age relationship
RCM Baltic 2015 Recommendation 2
The RCM Baltic recommends that standard report on length at age relationship and weight at age relationship are developed in the RDB and that any sampling method is taken into account when data are aggregated over time and country.
Justification The RCM Baltic finds it useful to have stadard table on length at age relationship and weight at age relationship when analysing data. It would be a useful tool for the stock coordinator when analysing data to be used in the stock assessment prosesses.
Follow-up actions needed ICES Data Center has to analyse implications both in terms of cost and in terms of technicalities.
Responsible persons for follow-up actions The RCM Baltic chair to contact the ICES Data Center
Time frame (Deadline) Medio 2016
6.5 Landings by stock and harbour
For all Baltic small pelagic- and demersal stocks, RCM Baltic 2015 compiled landings per harbour that account for up to 95% of the total landings and a comparison of harbours that have accounted for 95% of Eastern Cod landings in years 2012-2014 (Annex 6). The outcome of this exercise will be used for intersessional work prior to RCM Baltic 2016. The first aim will be to look into the landings by stock and harbor in the Baltic region in more detail and the second aim will be to suggest possible improvements in the overall sampling scheme when moving towards a regional approach.
6.6 Sampling intensity
6.6.1 General overview
Overviews of the 2014 sampling per species for length and for weight, age, sex and maturity for SD 22-24 and SD 25-32 respectively are presented in Annex 8. Data are presented per species together with total landings (Annex 7, table 1) and per species and country (Annex 8, table 2). The overviews are based on data uploaded to the RDB per 23/08/2015. The total number of samples in the Baltic region 2014 for these parameters is summarized below (Table 6.5). Table 6.5. Total No of biological samples 2014 in SD 22-32 per country and grand total (in the RDB per 23/08/2015).
FlagCountry DEU DNK EST FIN LTU LVA POL SWE Grand Total
Age 13888 8900 35087 6112 6302 15980 13891 20057 120217
Weight 15249 16675 64101 10505 6307 15956 13891 20471 163155
Sex 12129 582 40550 9469 5398 12649 13673 12709 107159
Maturity 14219 8120 5487 6027 12761 617 47231
Length 15249 16675 64104 10505 6307 16056 13891 20471 163258
In general the sampling activity in the Baltic region is at a high level. The overview of the uploaded data show that most countries are sampling for age, weight, sex and sexual maturity to a high extent. Note that where more samples have been collected for “Maturity” than for “Sex”, this is due to that it is difficult to sex all juveniles.
45
6.6.2 Data limited stocks (DLS)
In the ICES Data Limited Stocks (DLS) Guidance Report (ICES 2012) the following stocks in the Baltic region are listed as data limited:
Plaice Pleuronectes platessa SD 21-23 (SD 21 is not in the Baltic region)
Plaice Pleuronectes platessa SD 24-32
Dab Limanda limanda SD 22-32
Turbot Psetta maxima SD 22-32
Brill Scophthalmus rhombus SD 22-32
Herring Clupea harengus SD 31
Flounder Platichthys flesus All stocks
RCM Baltic 2015 continued following eventual changes in the total number of length-measured individuals for the six species (plaice, dab, turbot, brill, herring and flounder) which have a DLS status in the Baltic and results for the period 2010-2014 are presented below (Figure 6.3). Data are unfortunately not compiled at stock level for Plaice. The same holds for Flounder, where the prevailing division into stocks in the Baltic has changed since 2012. The RCM-Baltic concluded that the sampling intensity in 2014 in the commercial fisheries has more or less remained at the same level as last year for all species except brill according to the output from the RDB (per 23/08/2015). However, some stocks showed a further decrease in sampling intensity, such as plaice and dab, while the number of sampled turbot increased significantly. This increase is explained by two German samples from a seasonal turbot-directed fishery in the second quarter of 2014.

46
Figure 6.3. Number of length-measured individuals for the period 2010-2014 for the five species having DLS in SD 22-32 (plaice, dab, turbot, brill and flounder) and the species having DLS in SD 31 (herring). (Data from the RDB per 23/08/2015).
6.6.3 Salmon, sea trout and eel
As previously known, not all MS have been able to upload data from their biological sampling of salmon and eel. In addition other MS have uploaded incomplete datasets. In order to get an overview of the quantity of available data in the RDB, RCM Baltic 2015 continued compiling this information on salmon and eel. RCM Baltic 2015 also included information on uploaded sea trout data. Figures on the total number of biological samples per stock 2009-2014 for these species are presented in Annex 9. In the Annex 9, the number of biological samples divided per country is also presented in a table. Note that not all MS have biological sampling of the three species in their NPs. Current recovery plans may lead to the reduction of TACs and several fishing restrictions and therefore it may not be possible to reach a required sampling intensity in the commercial sampling in the future. RCM Baltic 2015 discussed the possibility to include additional surveys in the region (nationally or regionally) to reach a higher sampling intensity for salmon, sea trout and eel. In this context, Finland informed the RCM that their national survey intensity for Salmon in rivers will be reduced because of diminishing resources. Here, cost-sharing in the region might improve the situation.

47
6.7 Task sharing for biological data
Task-sharing in terms of age determination and quality improvement could be reorganized to increase efficiency, as earlier concluded by RCM Baltic 2011-2014. Present agreements including task sharing that has been concluded bi- or multi-laterally, see section 5.4. Additional task-sharing is underway. The RCM 2015 concluded that all potential announcements of the new grants from COM intended to promote regional coordination will definitely give a possibility to enhance projects where task-sharing is included. This is because efficiency wise it is probably the best way to share e.g. age readings, instead of having in house expertise for aging all species at each institute. The data quality in different senses could also be improved if coordinating this work.

48
7. Proposal for task sharing and criteria for joint surveys Like in the present legislation, the proposal of a new EU-MAP regulation (which ultimately will replace the current DCF Regulation) contains the provision on the list of mandatory surveys to be carried by MS in support of i.a. the CFP and MSFD – support to stocks assessment, ecosystem indicators, plastic contaminants and other. This proposed new regulation provides also for rules of participation in surveys, including cost sharing between MS based on the relative shares in respective stock exploitation. There are currently six surveys in support of stock assessment conducted annually in the Baltic Sea. The group discussed the possible model for sharing the surveys costs between MS concerned, pointing out that a number of elements need to be taken into account, including, i.a:
Stock by stock approach (with more than one stock targeted during survey),
Relative shares in the catch possibilities (TAC),
Relevance of the survey for MS not involved so far.
The group agreed that before setting the surveys’ cost sharing model an analysis of the structure and distribution of the cost between MS regarding surveys currently conducted in the Baltic Sea is needed. The chair of the RCM Baltic has offered to collect and compile the data required for such an analysis to be performed before the RCM Baltic meeting next year. Furthermore, before deciding on key of sharing costs related to surveys, the feedback from an end-user is required. The group decided to request ICES, through the Commission, for a confirmation on what surveys in the Baltic Sea are required to meet the ICES needs for providing advice in support of the Common Fisheries Policy.

49
8. Amendments needed to NP for 2016 RCM Baltic concluded that there is no need to amend the NPs in 2016.

50
9. Future funding mechanisms to continue strengthening regional cooperation According the Regulation (EU) No 508/2014 of the European Parliament and of the Council article 86, under the direct management, Commission has funding available for the support of “cooperation activities between Member States in the field of data collection, including those between the various regional stakeholders, and including the setting–up and running of regionalised databases for the storage, management and use of data which will benefit regional cooperation and improve data collection and management activities as well as improving scientific expertise in support of fisheries management”. Therfore, it is possible for the Commission to fund initiatives suggested by the RCM/RCG’s. The RCM Baltic discussed various studies that could improve data collection and especially improve cooperation, cooordination and the quality assurance. The following study proposals were agreed:
Study proposal on
”Development of the Regional DataBase for support of RCM/RCGs and other user”
(Priority 1)
Background: From the European Commission there is focus on regional coordination and cooperation, and using the Regional DataBase (RDB) have huge cost-benefit advantages for the regions. However, the full potential of the RDB should be used, and this can be done by developing the needed functionalities. With focus on coordinating the sampling of all relevant species in the regions, which are using the RDB, is it essential to draw conclusions based on the comprehensive data in the RDB. Therefore it is important that the RDB fully support the needs of the RCM/RCGs. This include common harmonised quality checks and data analysis reports. Furthermore the RDB can support countries in raising/estimating national biologic data, landings and effort for further international raising in InterCatch for ICES stock assessment and advice to EC. But ensuring the right raising/estimation of the existing methods and development a new statistical method are needed to support the countries in reducing the resources spend in raising/estimating data for data calls. Indicative budget: € 450,000 Development The main fields for development in 2016-17 are identified by the RDB-Steering Committee and presented in no specific order of priority: 1. Development of additional reports for analysis and data tabulating to support regional coordination. (10 % of total budget) Outputs: Specifications of reports, programming development Development of output reports which provide:
• More advanced standard reports used by the RCM/RCGs • Reports Overview of data status by region; data coverage; • Overview of completeness of data uploads • Support the planning of future regional based sampling schemes; • Overview of potential areas for task sharing between member states.
2. Testing of trial species (12 % of total budget) Testing of trial species from different stock assessment working groups for national raising/estimations, by borrowing age-length keys from own and/or other countries and correction of eventual issues. This should be done in two phases: Phase A: Where one or two stocks should make a comprehensive test of the system and corrections should be made. Phase B: Several representative stocks should be tested throughout the system for raising/estimation and eventually corrections should be made. Outputs: Test plan, tests, coordination, reports, comparisons, issues, solutions, corrections
• All data submitters for the selected stocks raise data in the RDB in two phases • Output compared and corrections made where needed in two phases

51
3. Extended data logging - what have been uploaded when (12 % of total budget) Implement a functionality, which makes it possible to see down to details what have been imported when, full data auditing Outputs: Specification of functionalities, development, implementation, test
• Identify what is the optimal solution for this. User and time stamp in relevant tables or expand the existing logging. Develop functionalities that allows countries and end-users to see all details of what have been uploaded when. As it is now it is now it is possible to see the first part of data uploaded by persons.
4. Implement quality control functionality (12 % of total budget) Taking a starting point in the quality control checks developed under the fishPi project. Identifying the best way to incorporate the checks and implement them. The functionality will allow the users to identify differences within a country and across the countries. Outputs: Technical report, Technical meetings/workshops covering all regions, development and implementation of methods
• All relevant checks on country level and across countries should be documented • All relevant checks should be developed and implemented
5. Explore options and cost implications of implementing of external tools (i.e. COST) in the RDB (10% of total budget) Outputs: Technical report, Technical Workshop(s), conceptual development Such analysis should include the following elements:
• An inventory to collate and examine the tools present but also tools missing • Specification of relevant issues regarding data and format • Conceptual development of an interface to RDB
6. Requirements and automation of Data calls procedures. (12% of total Budget) Analysis of the different data calls and identify which can be extracted directly from the RDB, but also identify which data calls can be extracted from the RDB by changes to the RDB. Outputs: Technical report, programming development
• Analysis of the data and aggregation levels of relevant data calls • The present data and functionalities in the RDB need to be compared with possible data calls • Develop functionalities which automatically created potential data calls
7. Development of statistical sound raising in the RDB. (20% of total budget) Outputs: Technical report, Technical meetings/workshops covering all regions
• Identify the consequences of implementing the new exchange format for the existing methods, processes and data flow
• Specifications of the database changes to accommodate the new exchange formats in the RDB. • Specification of new tables and fields to store the new processed data raised with statistical methods.
Specifications of incorporation of statistical methods in R into the RDB. • Identify which additional processing functionalities are need to be developed in order to comply with
statistical raising methods • Prove of concept for inclusion of the methods in R in the RDB
8. Update of the existing roles and access module. (14 % of total budget) Outputs: Technical report, programming development
• Specification, test, development and implementation of updated internal structures final test
RCM Baltic comments
This RDB is prerequisite and therefore highly relevant. Indispensible tool needed for coordination by RCM and RCG’s. Development of tool is delayed because of lack of resources.
RCM Baltic agreement on intermidiate solution for the WebGR
WebGR is a set of Open Source web services developed within an EU tender project in 2008 to support studies of fish growth (age) and reproduction (maturity). This tool assists fisheries scientists in the organization and data analysis of calibration workshops for classification of biological structures and provides means to analyse the results of such exercises. WebGR is a set of web services, which support fisheries scientists in the organization and data analysis of calibration studies of biological parameters, and provide means to analyse the results of such exercises. These standard calibration exercises of age and maturity have been conducted among EU Members States (MS) under the Data Collection Framework umbrella and also for the routine work of age and Maturity quality assurance within a MS.

52
Currently WebGR 1.0 has 281 registered experts from 31 countries in Europe (6 of them on the Mediterranean coasts) and from 26 institutes. Studies using WebGR have been carried out on 41 species, across 61 workshops, resulting in 7195 images and 57412 annotations now stored on the database. The tool has not been further developed since 2010. Nevertheless, since 2010 more than 60 workshops and exchanges have used WebGR with variable success. Unanimously, the members of these expert groups saw a great potential in using this software and its tools. Unfortunately, there has been no team of developers available to update the open source code of WebGR. Therefore, after seven years a cybersecurity auditory at the hosting institute revealed that the WebGR server was presenting a large security weakness, and concluded that the system should be shut down by the end of 2015. Presently, the service is freely provided at http://webgr.azti.es, but without any warranties in case of problems, with a high risk of data loss. It would be rather beneficial both for ICES and the users, if ICES could host the server. This would guarantee a wider dissemination of this useful tool and ensure a better site management and support. To avoid the loss of important ageing and maturity calibration exercises and to aid in greater internationalize of the system, the following “Rescue Plan” has been proposed. Rescue Plan: The final aim of the Rescue Plan is to have a virtual machine on a GNU/Linux Debian LAMP server with all the latest security updates and with an updated (not upgraded) WebGR server running on it. The total cost is estimated to be 5 800€ excl VAT, and the transfer will be performed by the SME created by the original developer of WebGR (Rauthe IT) with the help of AZTI and ICES IT specialists. In any case, following the original spirit of WebGR, the code and virtual machine will be publicly available through the typical Open Source Repositories (SourceForge) in order to be used by any user. Detailed work plan
Update ZendFramework 1.9 to 1.12. o The Zend Framework is an open source, web application framework implemented in the programming
language PHP 5. The update fixes security issues, bugs and performance issues of this framework.
Update PHPIDS o This is an open source PHP Web Application Intrusion Detection System. The main goal is to give the
ability of finding intrusion data coming from client/hacker to php web application and stop it. The update includes the latest filter description for new kinds of attacks.
Publishing the new source code to sourceforge.com o Sourceforge is a platform for hosting Open Source projects like Berlios. Berlios was used for WebGR but it
was closed last year, therefore, the project needs a new home for further developing.
Making WebGR a virtual machine and deploying to the ICES server o Make the WebGR application work on the ICES server.
Update Database o The MySQL database server have to be updated to the latest version to make the application secure. For
this reason the WebGR database, with all the data, need an update to be compatible with the new database server.
Check WebGR Source code for deprecated funtions and security issues and refractor deprecated functions o The source code which was written by the BLE needs to be checked, whether old and outdated functions
from PHP (because the new Version 5.4 of PHP will be used) or the ZendFramework are to be used. If so, the functions have to be replaced or rewritten.
Testing the new version o A check of all functions of the WebGR UI; whether they work as expected with all the changes and new
components of the WebGR application.
RCM Baltic comments
WebGR is a tool already frequently used in quality evaluation of age reading. The RCM Baltic fully supports the rescue plan and therefore willing to finaciually to support it.
All RCM Baltic Member States, Denmark, Estonia, Finland, Germanay, Latvia, Lithuania, Poland and Sweden have
agreeded financially by a miximum of € 500.00 by MS to support the needed update of the WebGR.

53
Study proposal for
“Further development and improvement of WebGR
(PRIORITY 2)
WebGR is a set of Open Source web services developed within an EU tender project in 2008 to support studies of fish growth
(age) and reproduction (maturity). This tool assists fisheries scientists in the organization and data analysis of calibration
workshops for classification of biological structures and provides means to analyse the results of such exercises. The tool has not
been further developed since 2010. Nevertheless, since 2010 several workshops and exchanges have used WebGR with variable
success. Unanimously, the members of these expert groups saw a great potential in using this software and its tools. However
they experienced different problems while using it and at the same time had several requests on how to improve this tool and
obtaining more complex outputs. This feedback highlighted the strong need for further improvement of WebGR and it is the
basis for the present study proposal.
The objective is to substantially improve the software, which will amend the contribution to improve the quality of growth and
reproduction studies, by guaranteeing a consistent application of age reading protocols and maturity scales, ultimately
influencing fisheries management advice. Additionally, the use of this tool is not necessarily limited to age and maturity studies.
In principle WebGR can be applied to all situations, where individual scientists need to discuss the interpretation of a protocol,
for the identification of the status of biological material.
The desirable upgrading of WebGR is manifold. First of all, a more user-friendly interface would be beneficial both for
workshop managers organizing online exercises and for participants joining them. The arrangement of a workshop is currently
troublesome, consisting in more steps than actually needed, therefore a process consisting of sequential steps and a detailed error
report need to be implemented. Furthermore, there is a great need for improvement of the picture uploading mechanism and to
enhance exploring tools, in terms of new measuring tools. Concerning the output, the most basic features are presently
implemented and the easy export procedure allows users to use the data on a standard statistical package or spreadsheet. The
main aim is to develop an R package and implement a set of statistical methods. An extended statistical output will give a more
complete and standardized evaluation of potential differences among readers/stagers.
Presently, the service is freely provided at http://webgr.azti.es but without any warranties in case of problems, with a high risk of
data loss. It would be rather beneficial both for ICES and the users, if ICES could host the server. This would guarantee a wider
dissemination of this useful tool and ensure a better site management and support. Furthermore, an offline access to the
workshop is to be aimed for. This features needs to be implemented so that all individual users’ annotations will be synchronized
with the server as soon as one goes online again).
The second Workshop on national age reading coordinators (WKNARC2) took place in May 2013 and embarked on the first
phase through identification and debate on the more practical user interface improvements, and made an outline of a Study
proposal for a full upgrading of WebGR. Subsequently, the Workshop on Statistical Analysis of Biological Calibration Studies
(WKSABCAL), taking place in October 2014, will give the necessary input to the second phase (i.e. statistical output) of the
improvement of WebGR.
The project objectives will be achieved over 18 months through the realization of a list of tasks classified in 5 Work-Packages
(WP). WP 1: Project Management; WP 2: Development; WP 3: Statistical methods; WP 4: Training and dissemination; WP 5:
Site management.
PGCCDBS strongly supports this initiative and study proposal
Indicitative Budget
€ 300,000 for a 18 months project.
RCM Baltic comments
WebGR is a tool already frequently used in quality evaluation of age reading. The tool needs to be updated and a number of
bugs to be fixed and these tasks will be carried out financially supported by the MS.
Further, it is suggested that the tool is hosted, developed and maintained maintenance by an RFMO or an international scientific
organization with adequate expertise like ICES. It will be an important tool in quality evaluation process expected to be
implemented by RCG. The tool can be used supraregionally.

54
10. Landing obligation
10.1 Impact of the introduction of the landing obligation, and/or preparations for its implementation
RCM Baltic 2014 stated the following: “Under the new landing obligation, at-sea observers will monitor unwanted catches that has to be landed by the fishermen. However, there is an incentive for the fishermen to discard part or all of the unwanted catch of a trip as landing of lower-value unwanted catch is discounted from the quota of the vessel. Under these new circumstances, the at-sea observer may witness events where fishermen throw unwanted catch over board, i.e. the observer will register an illegal operation. (1) As a consequence, the level of refusal of observers by the skippers may increase. (2) Even if an observer is onboard, the sampled fishing trip may be still biased (e.g. fishing trip in another fishing ground or the fisherman will have a legal behavior although he would usually discard unwanted catch)”.
As a way to build on the experience of the different member states as well as getting early warning signals if the quality of the discard data deteriorates substantially, RCM Baltic 2014 proposed a following action in order to evaluate the consequences of the landing obligation to data sampling: All MS involved in the discard sampling of Baltic Sea cod fisheries (DK, DE, LT, LV, PL, SE) should provide RCM Baltic 2015 with short working papers, based on the experience from the sampling activities in quarter 1 and 2. The MS should assess the following aspects:
If and how the MS has adapted the sampling program to the new management regime
Are there changes in the access to vessels to sample catches (rejection rates)?
Are there any indications on changes in the quality of the discard data?
Have fishermen changed their fishing behavior? If yes, what has changed and how can we adjust and account for these changes in our sampling?
The questionnaire was circulated in summer 2015 among the countries involved and the summary of its results about running observer programmes is presented in the Annex 9. There are some indications that the reported amounts differentiate significantly of the observer estimates, being even ten times lower. In addition, one MS with big TAC has serious problems to get aboard on vessel >12 m, which with high probability will endanger the quality of the assessment.
Action to be taken: RCM Baltic expresses its concern about the uncertainity of the catches of cod in the Baltic Sea and that the present increased outtake of cod most like will increase the fishing mortality above the recommended and agreed levels. The chair of the RCM Baltic will raise the issue for the Presidency of the BALTFISH group.
10.2 Operation of at-sea observer programmes and role of scientific observers
RCM Baltic recommends that at-sea sampling needs to be maintained because discards at-sea will continue for various non TAC species and exemptions allowed under the landing obligation. Additionally the landing obligation will introduce a new category of retained discards and this fraction has to be sampled to obtain scientific data for the complete catch composition which is needed for stock assessment and advice. Therefore, there is an urgent need to define the different parts of the catch and to modify existing sampling protocols appropriate for at-sea sampling. Database recordings and estimation process has to be changed accordingly. The RCM Baltic underlines the importance of establishing statistically sound sampling designs for the on-board observations, and to maintain the integrity of scientific observers (no mixing with observers used for control), in order to maintaining the collection of unbiased catch data for scientific purposes. Therefore RCM Baltic reiterates that in order to remove doubts on scientific estimates, it is essential that sampled vessels do not change their behaviour when observers are on-board. This is best achieved if there is no ambiguity on the scientific role of the observer. Separating clearly the monitoring for surveillance for control, from the collection of data for scientific assessment, is the pre-condition to run a scientific observer program. If there is any doubt that the information collected by the scientific observers will be used for purposes of control and enforcement then the data will be compromised and no utilization of the information collected will be possible.

55
DEN EST FIN GER LAT LIT POL SWE
Running “at sea observer programme” Yes Yes No Yes Yes No Yes Yes
Problems in running at sea observer programmes in 2015
No No N/A N** No No No Yes
Type of sampling scheme (4S*/Ad hoc) 4S Ad hoc Ad hoc 4S Ad hoc Ad hoc Ad hoc 4S***
Recording of non-response rate Yes No Yes Yes No Yes No Yes
* Statistical Sound Sampling Scheme. ** Some problems for Eastern Baltic cod. *** Not all sampling Table 10.1. Overview showing the present status of the DCF at sea observer programme in the Baltic Sea
10.3 Quality and integrity of catch data collected by the control agencies, i.e. logbook sales notes data
The landing obligation was introduced in 2015 for the pelagic industry and for cod and salmon in the Baltic. Data from 2015 in its present state has still not been fully evaluated for scientific purposes. However, there appear to be areas were the data quality could be improved. See section 10.1 Presently there is only information on the total landings by species in the logbooks. This indicates that it is not possible to distinguish between the fraction landed below MCRS and the fraction landed above in the logbook. It is highly relevant that this fraction is recorded in the logbook and not just on the landing declaration. For some countries it appears to be problematic receiving information on the fraction below MCRS if this fraction is not sold and therefore not on a sale note. A solution for recording the BMS fraction not sold is needed. The preliminary results from the Baltic Sea indicate there is a discrepancy between the recorded data BMS in the landing declaration and the information from the observer trips. Vessels under 10 meters, except for vessels fishing for cod in the Baltic where the length is 8 meter, are presently not required to fill in a logbook. For some countries information from this segment is only available from sales notes (where the MCRS landings will not be apparent when it is not sold). Therefore there is a need for more detailed information from the under 10 meter vessels. Some countries have developed a monthly fishing journal (simplified logbook), where this information could be captured. Haul by haul data in the logbook would increase the data quality. In the Baltic Sea haul by haul information in the logbook has been required and implemented for all MS since 2015. If the MCRS fish was recorded on these logbooks this would allow more detailed information on where the main catches of BMS fish are taking place. Furthermore, haul by haul information can be used to link the logbook data with CCTV and with VMS data given a much higher resolution and quality in the data and thereby improve any discard Atlas. It would also improve the potential to ‘control’ the logbook data if the skippers are obliged to fill in the information by haul. To avoid catching MCRS fish many MS have been reviewing and developing more selective gears and implementing them in different regions. However, if it is not mandatory to report this gear information in the logbook it is very hard to define the fleets and compare the catch compositions between different fleets with in a region without this information. Therefore the RCM Baltic is recommending it to be mandatory to report any selective devices. Suggestions:
1. The below MCRS fraction in the logbook 2. Sales notes or equivalent for the none sold below MCRS fraction 3. Selective gear information in the logbook 4. Validation of the control data for the below MCRS fraction 5. Ensuring haul by haul information in the logbook
10.4 Generation of catch estimates derived from sampling programme data
Prior to 2015 the catch estimates from the commercial fisheries consist of the fraction of the catch that is landing and the estimated fraction that is discarded. Since January 2015 the entire catch of cod must be landed including the cod below the minimum conservation reference size (MCRS) of 35 cm for cod. In the Baltic Sea region, the landings estimates from 2009 and onwards are considered relatively reliable and are derived from logbooks and/or sales notes. However, the former landing information will now be merged with information from the BMS fraction.

56
All MS have to take the new fraction (MCRS) into account when raising the data. As an example, prior to the landing obligation the discard ratio could be calculated as: discard (estimated by observers on a trip) / total catch (landings from logbook + discard estimated by observers). Under the landing obligation, the landings from the logbook include the MCRS fraction. Figure 10.1 shows how the discard ratio could be (wrongly) calculated. It very depends on how the MS is conducting the raising and the main message is therefore to pay attention to the new BMS fraction and make sure it has been accounted for in the calculation.
Figure 10.1: Example of data available for an observer trip from two sources (i.e. observer programme and logbook data) under the assumption that the observer is aware of the BMS fraction and the vessel is not landing all discards.
Discards / Total catch:
CORRECT METHOD: 500 kg (discards) / 1500 kg (total catch) = 0.33
WRONG METHOD: 500 kg (discards) / 1600 kg (total catch) = 0.31
Discards / Total landings:
CORRECT METHOD: 500 kg (discards) / 1000 kg (total landings) = 0.5
WRONG METHOD: 500 kg (discards) / 1100 kg (total landings) = 0.45
There are other issues to take into account such as High-grading. One example was presented on how size grade categories of cod of the landed part can be used to assess the true landing catch composition. Size grade categories of cod of selected vessels were compared before and after the installation of a camera system onboard. Once the camera was onboard, the smallest size grade category increased in the landings, or appeared at all. Figure 10.2 shows an example of size grade composition of cod before and after installing a electronic monitoring system including cameras onboard a fishing vessel. This clearly indicated that the vessel had been highgrading (i.e. discarding small, but market-size cod) before the camera was on boardinstalled.
Figure 10.2 Example of size grade composition of cod before and after installing a electronic monitoring system including cameras onboard a fishing vessel. “NO CAM” is without a camera system and “CAM” is with the system. Red is sice grade 1 (largest), blue is sice grade 2, green is sice grade 3, black is sice grade 4 and yellow is sice grade 5. RCM Baltic recommends that MS conduct similar analysis with their sampling data assessing the composition of size sorting categories of cod in the landings from trips of sampled vessels before the vessel was sampled, from the sampled trip and after the vessel was sampled. Analysis of VMS tracks and spatial pattern in fishing may provide additional information on whether or not the vessel changed its spatial fishing behavior due to an onboard observer. In addition, the reported cod discard component of the vessel landed in the harbor (the fish landed as unwanted catch or below minimum reference size of 35 cm) could be compared with the total size distribution recorded at the observer trips. This would indicate if only a fraction of the catch has been landed. In addition, the landed size grade categories of trips before, during and after the vessel was sampled could be compared. This analysis could be prepared for cod before the next assessment working group (WGBFAS) and be presented there.
500 kg discards
Observer programme
1000 kg landed > BMS
Logbook data
100 kg landed < BMS

57
10.5 Experiences of on-shore sampling of landed discards
Since 1st January 2015 the landing obligation for the fisheries for cod, herring, sprat and salmon was introduced in the Baltic Sea. For cod this means that fish below the MCRS (cod<35 cm) have to be landed and may not be used for human consumption. It should be noted that until 2014, the minimum landing size of Baltic cod was 38 cm. Effective implementation, including adequate compliance of the landing obligation, would imply possible considerable reduction of discard sampling at sea observer trips, especially for the cod-directed fisheries. This possible reduction in sampling effort at sea could be used to collect information/data on wanted and unwanted catch from onshore sampling. As 2015 is the first year of implementation of the landing obligation, 2015 can serve as a transitional period to evaluate the reliability of the landings of the fraction which previously was discarded at sea. This fraction could be sampled at landing site. Preliminary observation indicate that data on the landed volumes of unwanted cod (<35 cm) obtained during at sea observers trips and “discards” landed in harbors differs significantly, in some cases by orders of magnitude. Therefore, presently the discard data obtained from harbor sampling cannot be regarded as reliable and should not be used to estimate the amount of fish caught under BMS (Below Minimum Size) when preparing data for stock assessment in a raising procedure. In the Baltic region most of the MS do not, for this reason, sample discards from landings in ports. Germany and Sweden are the only two countries that are doing it at the moment. It is important to note that these significant differences between the logbook data and the “true” discards can only be detected by at-sea observers, thus highlighting their role even under a landing obligation probably also in the future. However, the sampling of unwanted catch, (i.e.”MCRS fish”, landed in harbors performed by some MS (Germany and Sweden), provides useful additional biological data, giving information on age and length distribution of this fraction of the catch. A major challenge in most MS is that there presently seems to be no straight forward way to get information on the amount of fish below MCRS that are landed from the official catch statistics (if the fish is not sold it will not appear in the sales slips, it is not always a distinction between fish above and below MCRS in the logbook). This might cause problems when sampled data is combined with official data prior to stock assessment. At the next year’s RCM Baltic meeting discard sampling should be evaluated, based on experience gained in 2015.
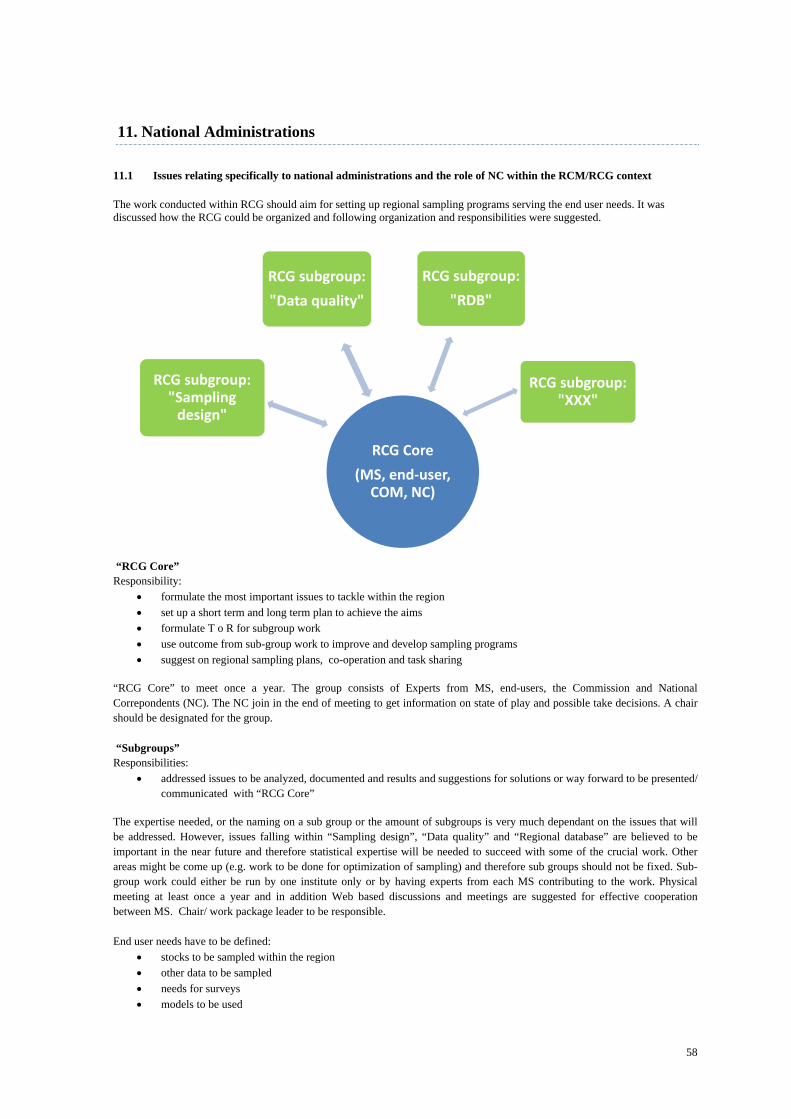
58
11. National Administrations
11.1 Issues relating specifically to national administrations and the role of NC within the RCM/RCG context
The work conducted within RCG should aim for setting up regional sampling programs serving the end user needs. It was discussed how the RCG could be organized and following organization and responsibilities were suggested.
“RCG Core” Responsibility:
formulate the most important issues to tackle within the region
set up a short term and long term plan to achieve the aims
formulate T o R for subgroup work
use outcome from sub-group work to improve and develop sampling programs
suggest on regional sampling plans, co-operation and task sharing
“RCG Core” to meet once a year. The group consists of Experts from MS, end-users, the Commission and National Correpondents (NC). The NC join in the end of meeting to get information on state of play and possible take decisions. A chair should be designated for the group. “Subgroups” Responsibilities:
addressed issues to be analyzed, documented and results and suggestions for solutions or way forward to be presented/ communicated with “RCG Core”
The expertise needed, or the naming on a sub group or the amount of subgroups is very much dependant on the issues that will be addressed. However, issues falling within “Sampling design”, “Data quality” and “Regional database” are believed to be important in the near future and therefore statistical expertise will be needed to succeed with some of the crucial work. Other areas might be come up (e.g. work to be done for optimization of sampling) and therefore sub groups should not be fixed. Sub-group work could either be run by one institute only or by having experts from each MS contributing to the work. Physical meeting at least once a year and in addition Web based discussions and meetings are suggested for effective cooperation between MS. Chair/ work package leader to be responsible. End user needs have to be defined:
stocks to be sampled within the region
other data to be sampled
needs for surveys
models to be used
RCG Core
(MS, end‐user, COM, NC)
RCG subgroup: "Sampling design"
RCG subgroup:
"Data quality"
RCG subgroup:
"RDB"
RCG subgroup: "XXX"

59
It will be difficult to fully implement EU-MAP already in 2017. Therefore, RCM Baltic 2015 aims for a stepwise approach, where the goal is a regional sampling program. The regional plan’s first step will be agreeing on methods etcetera. Here every country will be a stratum. Crucial will be to have a manual/guideline describing best practice. Case studies functioning as good example will be an important component in this work. Furthermore, RCM Baltic 2015 agrees on that NCs should take part in the RCGs. One of the main issues for the NCs will be to take decisions on task sharing. The role of NCs is described in the regulations and more responsibility will be designated to the NCs in the new legislation. It will not be possible for the NCs to take decisions instantly on all issues in the RCGs due to that some questions have to be discussed nationally beforehand. Besides, there will be differences in between MS depending on how the national administrations are organized. RCM Baltic 2015 also discussed the needs of the Liaison meetings. Even though all regions will be able to make decisions on their own, some coordination in between the regions will be need
11.2 Harmonisation of control agency data collection, and the cross border sharing of control agency data, for vessels operating and landing outside their flag country
The European Fisheries Control Agency (EFCA) does organize operational coordination of fisheries control and inspection activities by the Member States and assists them to cooperate so as to comply with the rules of the common fisheries policy in order to ensure its effective and uniform application. Most of Member States provide fisheries control information to EFCA (transfer of information is done automatically). In order to harmonize the monitoring of implementation of the landing obligation, MS in cooperation with EFCA have introduced a program called: “Last haul inspection” and a uniform report form has been set and is now used by control authorities in the Baltic Sea region. The purpose of this program is to get detailed information on the catch composition in the last haul of randomly selected fishing vessels during at sea inspection, in order to compare results with entries in the logbooks from previous hauls during the same fishing trip. The program of “Last haul inspection” covers both trawl and set nets fisheries. The reports from the last haul inspections are sent by MS directly to EFCA. Analysis of data on discards volume recorded by fisheries inspectors would be very useful for the work of the RCM BS in discussion on sampling strategy. In view of the fact that information on fisheries from control agencies is difficult to obtain, direct contacts and cooperation between the RCM Baltic and EFCA could be beneficial for both parties. It was agreed that the RCM Baltic will seek cooperation with EFCA via ICES in data collection as well as data access.
11.3 Harmonisation of catch data recording e.g. metiers
There is a discrepancy between the information registered in the fishing vessel log books and the information needed to be reported under the current Data Collection Framework regarding metiers, i.e. Member States may end up in a situation where they do not have all information needed to report on a metier level. Part of the solution may be that some variables in the log book that are currently optional to fill in should instead be mandatory. A tour de table among experts from member states during the RCM Baltic indicated that there are problems relating to reporting data on a metier level in nearly all countries present at the meeting, specifically regarding information on selection devices. Further, there are problems to report sufficient data for small scale fleets (fishing vessels below eight or ten meters which carry coastal journals), for which effort estimates can be poor. A more detailed review on harmonisation of catch data recordings in different Member States can be found in the report Scientific, Technical and Economic Committee for Fisheries (STECF) – Evaluation of Fisheries Dependent Information (STECF-15-12), 2015. In conclusion, there is a need for harmonisation of catch data recordings, i.e. more detailed information should be reported in the log book, otherwise it is difficult to evaluate selection patterns within different metiers. The RCM Baltic concluded that either the requirements set for data level regarding metiers under the DCF needs to be lowered, or Member States should assure that all the information needed is reported in the log book.
11.4 The position of national administrations on populating the Regional Data Base according to the RCM data call with i) Landings and effort data and ii) Sampling data
During the RCM Baltic 2015 meeting, where all Baltic MS national correspondents (Germany and Poland represented by a substitute) were present, the position by each MS on submitting its “Landings and effort data” as well as “Sampling data” to the

60
RDB was questioned. All Baltic MS are willing to upload the data to the RBD and there is a general consensus among all Baltic MS that a RBD is a prerequisite for regional coordination and cooperation.
All Baltic Member States (Denmark, Estonia, Finland, Germnay, Latvia, Lithuania, Poland and Sweden) are willing to upload the “Landings and effort data” as well as “Sampling data” to the RBD at the present level of details. Further, all Baltic Member States would like to stress that a RBD is a prerequisite for regional coordination and cooperation.
11.5 Task sharing and task trading mechanisms within the context of a regional sampling design
The topic on task sharing and task trading mechanisms within the context of regional sampling designs was briefly discussed. The RCM Baltic found that they at the present stage were unable to come up with any plan or possible solutions. It was agreed that based on the outcome of the FishPie project a test case for the Baltic Sea region could be investigated.

61
12. Future multi-annual programme for data collection
12.1 List of research surveys to be carried out in the region in 2016
In relation to the revision of the DCF and the new DC-MAP a list of research surveys to be carried out is needed. In relation to this revision the EFARO (The European Fisheries and Aquaculture Research Organisation) and ICES have initiatied a process with the aim to streamline surveys and data collection. It is suggested to try to develop joint data collection plans using vessel surveys. Therefore, until new or additional data needs or new information or more optimal use of survey effort in the Baltic Sea are available, the survey list is as given in the table below:
Survey name Acronym Area Period Main target species Survey effort (days)
Baltic International Trawl Survey BITS Q1 + Q4 IIIaS, IIIb-d 1 and 4 Q Cod, demersal species 160
Baltic International Acoustic Survey BIAS IIIa, IIIb-d Sep-Oct Herring, sprat 115
Gulf of Riga Acoustic Herring Survey GRAHS IIId 3 Q Herring 10
Sprat Acoustic Survey SPRAS IIId May Sprat, herring 60
Rügen Herring Larvae Survey RHLS IIId March-June Herring 50
12.2 Recreational fisheries necessary for the ICES advice
Main highlights from the 2015 EU request on data needs for monitoring of recreational fisheries In 2015, the Commission forwarded a special request to ICES to address the following questions related to recreational fishing data needs to meet expected end-user requirements: 1. What are the drivers for the collection of recreational fishing data? 2. What recreational fishery data (biological, economic & fisheries activity) are needed to support the scientific advice? 3. How will these data be used in stock assessment and fishery management advice? 4. What spatial and temporal resolution of data is needed to support fisheries management? The advice (ICES, 2015b) summary is as follows: ICES has identified that the main drivers for the collection of recreational fishery data are: providing advice on fishing opportunities, designing and evaluating management measures for recreational fisheries, developing fishery management plans and strategies, and supporting the development of marine spatial planning. The data needed to support the scientific advice and how these data are or could be used, are discussed for each of these drivers. The data needed depends on the type of advice and the scientific methods used in developing the advice. ICES is therefore not able to develop a generic list of recreational fishery data that would meet all needs for data in support of scientific advice. The species covered, type of data to collected, frequency of data collection, spatio-temporal resolution and target precision of recreational fishery catch estimates should be established on a regional basis with expert advice. With regards to data collected under the EU Data Collection Framework (DCF) (EU, 2008), ICES supports the process for evaluating end-user needs for data suggested by STECF (STECF, 2013) to deliver a balanced and cost-effective programme of data collection across recreational and commercial fisheries in each region. The questions touched upon the request more relevant to RCM Baltic are number 2, 3, and 4 and brief conclusions on each of these are summarized below. 2. What recreational fishery data (biological, economic & fisheries activity) are needed to support the scientific advice? ICES consider it important that the data to be collected are defined on a case-by-case basis. The first step in defining needs for recreational fishery data should be to document what data are available, not just those required under existing regulations, so that the relative removals and existing data gaps are identified and feed into any decisions around data collection at a regional level. The species covered, type of data to collected, frequency of data collection, spatio-temporal resolution and target precision of recreational fishery catch estimates should be established on a regional basis with expert advice from ICES. With regards to data

62
collected under the DCF, ICES supports the process for evaluating end-user needs for data suggested by STECF (STECF, 2013) to deliver a balanced and cost-effective programme of data collection across recreational and commercial fisheries. The core recreational fishery data needed assessing stock status to support advice on fishing opportunities are estimates of total removals (catches minus surviving released fish). If data are to be included in an analytical length- or age-based stock assessment, information on size or age compositions of catches is usually required. Recreational fishery survey data can also provide indices of relative abundance (as catch per unit of effort) for monitoring stock trends. If an end-user needs data to help establish and evaluate the outcome of management measures (e.g. fish size limits, bag and/or gear limits), recreational fishery surveys would need to be designed to provide the size compositions for retained and released fish, and the numbers of fish retained and released per individual fishing trip. The recreational fishery data needed for developing fisheries management plans/strategies will primarily include the catch estimates needed for advice on fishing opportunities, and the data needed for developing and evaluating management measures. When knowledge of the social and economic benefits of recreational fishing to communities is required, a common methodology for recreational and commercial fisheries is needed. Detailed information on spatial activities of all forms of fishing activities is required to evaluate candidate marine protected areas (MPAs) or any other form of spatial management. Additional, dedicated smaller-scale surveys at higher resolution and intensity would be required depending on the precision of estimates needed. 3. How will these data be used in stock assessment and fishery management advice? Catch options for recreational fisheries can be computed if a recreational dataseries is included in an assessment together with series of commercial data. If such a dataseries is not included in the assessment model, recent ratios of recreational to commercial catches may be used as a top-up on the forecasted commercial catch to estimate the total catch, as is done presently with discards in several stocks. To evaluate the impact of changes in size limits for recreational fisheries, it is necessary to estimate how the fishing mortality-at-age (selection pattern) will be altered, and evaluate the impact of this on forecasts or on long-term yield and stock size. This requires information on the size composition of recreational fishery catches and the proportion released at length, and a means of converting from selection-at-length to selection-at-age. The potential effects of bag limits can be evaluated from existing recreational survey data only if numbers of fish by species retained per fisher trip are recorded for each fisher. 4. What spatial and temporal resolution of data is needed to support fisheries management? The spatial and temporal resolution of recreational fishery surveys should be agreed on a case-by-case basis. For inclusion in stock assessment, annual estimates of recreational catches are preferable unless they are so small that imputations for missing survey years have only a small effect on the quality of assessment results and advice. In terms of spatial coverage, all recreational fisheries (e.g. rod-and-line, handlines, gillnets, pots, spearfishing, hand-picking by scuba divers) of importance for quantifying total recreational removals of the stocks concerned should be included. ToR 10b. ICES advice on what data are necessary for scientific advice regarding recreational fisheries.
12.3 Comment on list of proposed stocks & biological variables to be included in EU MAP
RCM Baltic 2015 as presented in section 6.3.1. analysed the species ranking list with Annex VII in COM DEC 2010/93/EU where a list of Biological variables with stock sampling specification is presented for each region (see section 6.3.1).

63
13. Any other busines
While taking into account EU Regulation 665/2008 Article 4.2, RCM Baltic proposes to elect Uwe Krumme, Germany as the
chair for 2016.
The RCM Baltic 2015 appreciated the invitation by Germnay to host the meeting in Rostock in 2016. It is suggested that timing
of the RCM Baltic depends on the progress of the new DC-MAP.
In order to facilitate the common memory of the group, the following table provides an overview of the venues and
chairmanship of this RCM.
Year Venue Chair
2004 Gdynia, Poland Henrik Degel, Denmark
2005 Tallin, Estonia Maris Plikshs, Latvia
2006 Lysekil, Sweden Johan Modin, Sweden
2007 Riga, Latvia Katja Ringdahl, Sweden
2008 Hamburg, Germany Katja Ringdahl, Sweden
2009 Helsinki, Finland Jukka Pönni, Finland
2010 Vilnius, Lithuania Jukka Pönni, Finland
2011 Charlottenlund, Denmark Jørgen Dalskov, Denmark
2012 Gdynia, Poland Jørgen Dalskov, Denmark
2013 Tallinn, Estonia Jørgen Dalskov, Denmark
2014 Uppsala, Sweden Jørgen Dalskov, Denmark
2015 Riga, Latvia Jørgen Dalskov, Denmark
13.1 Request from the Commission for the RCM’s to consider the impact of the implementation of the landing obligation on the DCF data collection programmes
The Commission has asked all the RCM’s to consider the impact of the implementation of the landing obligation on the DCF
data collection programmes. This issue has been dealt with at numerous ICES, STECF and RCM meetings and their response
can be found in reports RCM NS&EA 2014, RCM NS&EA 2013, RCM Baltic 2013, RCM Baltic 2014, RCM North Atlantic
2014, LM 2013, LM 2014, STECF 12-02, STECF 12-07, STECF 13-01, STECF 13-06, STECF 13-12, STECF 13-23, STECF
14-01, STECF 14-02, STECF 14-06, STECF 14-07.
The Commission is assuming that “under the Landing Obligation, discard data will become available for TAC species and
species subject to minimum sizes (Annex III of the Mediterranean Regulation). Therefore, with the gradual phasing-in of the
landing obligation, discard data may become less important. Assuming high levels of compliance with the landing obligation,
the use of observers on board could then be replaced by harbour sampling for species subject to the landing obligation. Still,
gaps in data may arise from the de minimis exemptions. So, there is a need to define fisheries, metiers and species falling under
the de minimis exemption”.
The RCM Baltic has been asked to address the following questions:
Under the discard ban, will there be a need to collect discard data?
Firstly, the landing obligation only applies to TAC species. Therefore, information on discards of non TAC species will not be
available without running at-sea observer programmes and full concurrent discard data is required to answer the requirements of
the DCF to provide data for ecosystem impact and MSFD assessments. Secondly, experiences in the Baltic region have shown
that, since the landing obligation was implemented 1st January 2015 for cod, salmon and pelagic species, recorded catches of
cod below the minimum reference size (BMS), which should be landed, are not reflected in the observed catches of BMS cod. If
reliable estimates of catches are to be used when carrying out stock assessment the only solution is to continue the at-sea
observer programmes, as recommended by the RCM Baltic 2014 and endorsed by the LM 2014.
Which are the fisheries, metiers and species falling under the de minimis exemption for which observers are still needed?
With the present setup for controlling the compliance of the landing obligation and with the information on the status on the
landing pattern of cod in all MS aournd the Baltic, there will probably be no fisheries or species where observers programmes
can be discontinued.

64
Is this depending on the definition of de minimis exemption: per trip, per fishery, per area, per Member State?
The definition of de minimis exemption: per trip, per fishery, per area, per Member State has no impact on whether observer
programmes should be continued or discontinued. As explained above, with the present setup for controlling the compliance of
the landing obligation, at-sea observers programmes need to be continued in order to get reliable catch estimates to be used for
assessing stock status and providing advice for the management of the stocks, ecosystem impact and MSFD indicators.
Is on-board sampling necessary/useful/feasible for TAC species or species subject to minimum sizes (Annex III of the Mediterranean Regulation) and if not, when should it be abandoned/replaced by other type of sampling?
As mentioned above the at-sea observer programme will be needed as not all species will be subject to landing obligation and
present setup for controlling the compliance of the landing obligation currently appears to be inadequate for ensuring reliable
catch estimates.
Is the data on discards recorded under the Control Regulation biased?
According to the Control Regulation since 2011 it has been mandatory for fishing masters to report all discard more than 50 kg
per species per trip in the logbook. Analysis of records of discards in several MS logbooks have shown that discard reporting is
biased. These issues are valid for all MS fishing in the North Sea, the Skagerrak, the Kattegat and the eastern Arctic area. This
provides clear evidence that discard records are biased. Information for 2015 from the Baltic region indicates that this is still an
issues even though the landing obligation has been implemented for that region.
Can this bias be quantified by observer trips?
The DCF observer programme is based on a statistical sound sampling approach where the aim is to quantify the total outtake of
a stock in volume and finally in catch at age. The sampling scheme is not designed to quantify bias of the catches by species
recorded in the logbooks. Such a quantification needs a complete different sampling programme.
If, under the landing obligation, observers would no longer be on board, can all other data still be reliably collected: non quota
species, concurrent sampling, incidental bycatch, do we not miss essential points that are perhaps not specified such as the
behaviour of fishermen, do we not get out of touch with the sector?
Without observers onboard it will not be possible to collect information on the diverse nature of non-quota species if they are
discarded at sea. Incidental bycatches of marine mammals and seabirds can be estimated by the use of cameras. Assessing
changes on behaviour of fishermen requires multiple analysis and information from multiple sources such as detailed
information on each fishing event, catch composition – all species, landing pattern by species and detailed information of gear
used.
13.2 Eastern Baltic cod – needs for tagging study
Eastern Baltic cod – urgent need for known-age otoliths: RCM Baltic re-emphasized the importance to make progress in the Eastern Baltic cod issue in terms of otoliths with known age. Another attempt to fund an international mark-recapture study on cod via the EU was not supported, partly due to the complexity of funding procedure. A potential private financier of a tagging study of Eastern Baltic cod had been approached but there is no response yet. Germany has started a tagging program of cod (external tags and internal marking of the otoliths with tetracycline; see http://www.ti.bund.de/de/of/arbeitsbereiche/forschung/lebende-meeresressourcen/altersbestimmung-und-wachstum/markierte-dorsche/) in SD22 in 2014 and is starting another one in SD24 this year. Denmark has plans to tag cod in SD25. The Baltic MS are encouraged to also initiate national initiatives. If there is not one international cod tagging project, there could be several nationally organized and funded tagging programmes that are interlinked, partly via the RCM and intersessionally by members of the RCM. A possible source for funding is the EMFF which could provide resources from November 2015. For more information and details on this possible funding source, please contact Jorgen Dalskov.

65
14. Glossary
AER Annual Economic Report
AR Annual Report (of activities carried out by MS under the DCF)
ACOM Advisory Committee of ICES
ASC Annual Science Committee
AWP Annual Work Plan
CE data exchange format for commercial effort data
CFP Common Fisheries Policy
CL data exchange format for commercial landings data
COST toolbox for quality evaluation of fisheries data
CR Council Resolution
CRR ICES Cooperative Research Report
CS data exchange format for commercial sampling data; calcified structures
CV Coefficient of Variation
DCF Data Collection Framework (follow up of DCR)
DC‐MAP Multi Annual Programme for Data Collection (follow up of DCF)
DCR Data Collection Regulation
EAFM Ecosystem Approach to Fisheries Management
EC European Commission
EMFF European Maritime and Fisheries Fund
EU European Union
EUROSTAT Directorate-General of the EC which provides statistical information to the EU
EWG STECF Expert Working Group
FAO Food and Agriculture Organisation of the United Nations
FishFrame RDB software
GFCM General fisheries Commission for the Mediterranean
IBTSWG International Bottom Trawl Survey Working Group
ICCAT International Commission for the Conservation of Atlantic Tunas
ICES International Council for the Exploration of the Sea
InterCatch ICES Database
JDP Joint Deployment Plan
LM Liaison Meeting
MFAQ Most Frequently Asked Questions
MoU Memorandum of Understanding
MRR Master Reference Register
MS Member State
MSFD Marine Strategy framework Directive
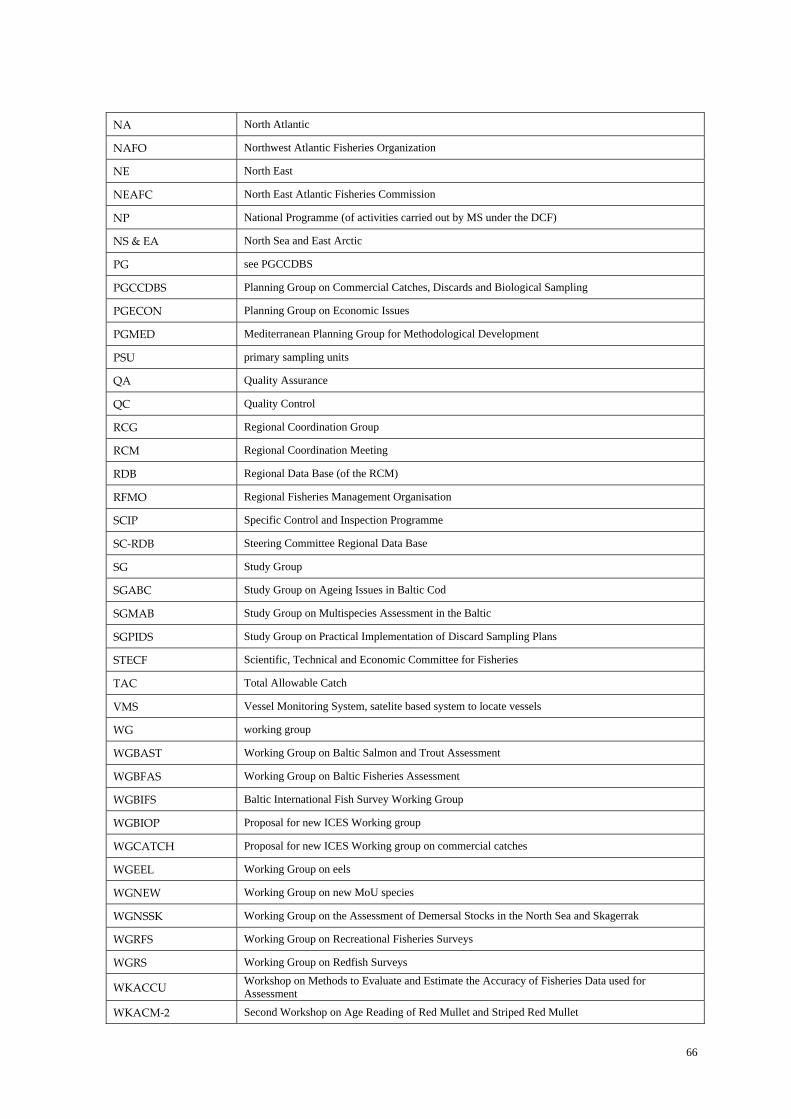
66
NA North Atlantic
NAFO Northwest Atlantic Fisheries Organization
NE North East
NEAFC North East Atlantic Fisheries Commission
NP National Programme (of activities carried out by MS under the DCF)
NS & EA North Sea and East Arctic
PG see PGCCDBS
PGCCDBS Planning Group on Commercial Catches, Discards and Biological Sampling
PGECON Planning Group on Economic Issues
PGMED Mediterranean Planning Group for Methodological Development
PSU primary sampling units
QA Quality Assurance
QC Quality Control
RCG Regional Coordination Group
RCM Regional Coordination Meeting
RDB Regional Data Base (of the RCM)
RFMO Regional Fisheries Management Organisation
SCIP Specific Control and Inspection Programme
SC‐RDB Steering Committee Regional Data Base
SG Study Group
SGABC Study Group on Ageing Issues in Baltic Cod
SGMAB Study Group on Multispecies Assessment in the Baltic
SGPIDS Study Group on Practical Implementation of Discard Sampling Plans
STECF Scientific, Technical and Economic Committee for Fisheries
TAC Total Allowable Catch
VMS Vessel Monitoring System, satelite based system to locate vessels
WG working group
WGBAST Working Group on Baltic Salmon and Trout Assessment
WGBFAS Working Group on Baltic Fisheries Assessment
WGBIFS Baltic International Fish Survey Working Group
WGBIOP Proposal for new ICES Working group
WGCATCH Proposal for new ICES Working group on commercial catches
WGEEL Working Group on eels
WGNEW Working Group on new MoU species
WGNSSK Working Group on the Assessment of Demersal Stocks in the North Sea and Skagerrak
WGRFS Working Group on Recreational Fisheries Surveys
WGRS Working Group on Redfish Surveys
WKACCU Workshop on Methods to Evaluate and Estimate the Accuracy of Fisheries Data used for Assessment
WKACM‐2 Second Workshop on Age Reading of Red Mullet and Striped Red Mullet

67
WKADS‐2 Workshop on age Determination of Atlantic salmon
WKAMDEEP Workshop on Age Estimation Methods of Deep Water Species
WKARBLUE Workshop on the Age Reading of Blue whiting
WKARHOM Workshop on Age Reading of Horse Mackerel, Mediterranean Horse Mackerel and Blue Jack Mackerel
WKAVSG Workshop on age validation studies of Gadoids
WKBALFLAT BENCHMARK WORKSHOP
WKBUT BENCHMARK WORKSHOP
WKCELT BENCHMARK WORKSHOP
WKDEEP BENCHMARK WORKSHOP
WKEID Workshop on Ecosystem Indicators of Discarding
WKESDCF Workshop on eel and salmon DCF data
WKHAD Benchmark Workshop on Haddock stocks
WKMATCH 2012‐ Workshop for maturity staging chairs
WKMERGE Workshop on methods for merging métiers for fishery based sampling
WKMIAS Workshop on Micro increment daily growth in European Anchovy and Sardine
WKMSEL Workshop on Sexual Maturity Staging of Elasmobranchs
WKMSGAD Workshop on sexual maturity staging of cod, whiting, haddock, saithe and hake
WKMSTB Workshop on the Sexual Maturity Staging of Turbot and Brill.
WKNARC Workshop of National Age Readings Coordinators
WKPELA BENCHMARK WORKSHOP
WKPICS Workshop on practical implementation of statistical sound catch sampling programmes
WKPRECISE Workshop on methods to evaluate and estimate the precision of fisheries data used for assessment
WKSOUTH BENCHMARK WORKSHOP
WKSPRAT BENCHMARK WORKSHOP
WoRMS
WSSD World Summit on Sustainable Development in Johannesburg
WP Work Package
68
15. References
Council Regulation (EC) 199/2008 of 25 February 2008 concerning the establishment of a Community Framework for the
collection, management and use of data in fisheries sector for scientific advice regarding the Common Fisheries Policy
Commission Regulation (EC) No 665/2008 of 14 July 2008 laying down detailed rules for the application of Council Regulation
(EC) No 199/2008 concerning the establishment of a Community framework for the collection, management and use of data in
the fisheries sector and support for scientific advice regarding the Common Fisheries Policy
Commission Regulation (EC) No 1078/2008 of 3 November 2008 laying down detailed rules for the implementation of Council
Regulation (EC) No 861/2006 as regards the expenditure incurred by Member States for the collection and management of the
basic fisheries data
Commission Decision (EC) No 2010/93/EC of 2010 adopting a multi annual Community programme pursuant to Council
Regulation (EC) No 199/2008 establishing a Community framework for the collection, management and use of data in the
fisheries sector and support for scientific advice regarding the Common Fisheries Policy.
RCM Baltic 2010. Report of the Regional Co-ordination Meeting for the BalticSea (RCM Baltic) 2010.
RCM Baltic 2011. Report of the Regional Co-ordination Meeting for the BalticSea (RCM Baltic) 2011.
RCM Baltic 2012. Report of the Regional Co-ordination Meeting for the BalticSea (RCM Baltic) 2012.
RCM Baltic 2013. Report of the Regional Co-ordination Meeting for the BalticSea (RCM Baltic) 2013.
RCM Baltic 2014. Report of the Regional Co-ordination Meeting for the BalticSea (RCM Baltic) 2014.
RCM NS&EA 2013: Report of the Regional Co-ordination Meeting for the North Sea and Eastern Arctic 2013.
RCM NS&EA 2014: Report of the Regional Co-ordination Meeting for the North Sea and Eastern Arctic 2014.
LM 2011: Report from the 8th Liaison Meeting 2011.
LM 2012: Report from the 9th Liaison Meeting 2012.
LM 2013: Report from the 10th Liaison Meeting 2013.
LM 2014: Report from the 11th Liaison Meeting 2014.
STECF 12-02 Review of the Revised 2012 National Programmes and on the Future of the DCF (EWG 11-19) EUR 25308 EN JRC 70899
STECF 12-07 Review of Proposed DCF 2014-2020 – Part 1 (EWG 12-2) EUR 25338 EN, JRC 71290
STECF 13-01 Review of Proposed DCF 2014-2020 – Part 2 (EWG 12-15) EUR 25825 EN, JRC 79209
STECF 13-06 Review of DC MAP- Part 1 (EWG 13-02) EUR 25974 EN, JRC 81593, 42 pp
STECF 13-12 Review of DC MAP- Part 2 (EWG 13-05) EUR 26095 EN, JRC 83566
STECF-13-23 Landing obligation in EU fisheries (EWG 13-16) EUR 26330 EN, JRC 86112, 115 pp
STECF 14-01 Landing Obligation in EU Fisheries - part II (EWG 13-17) EUR 26551 EN, JRC 88869, 67 pp
STECF 14-02 Revision of DCF (EWG 13-18) EUR 26573 EN, JRC89196, 103 pp
STECF 14-06 Landing Obligations in EU Fisheries - part 3 (EWG 14-01) EUR 26610 EN, JRC 89785, 56 pp.
STECF 14-07 DCF revision – Part 4 (EWG 14-02) EUR 26612 EN, JRC 89788, 77 pp.
ICES. 2010. Report of the Working Group on Ecosystem Indicators of Discarding (WKEID), 28 September - 1 October 2010,
ICES HQ, Copenhagen, Denmark. ICES CM 2010/ACOM:43. 70 pp.
ICES. 2014a. Report of the Planning Group on Commercial Catches, Discards and Biological Sampling (PGCCDBS), 17–21
February 2014, Horta (Azores), Portugal. ICES CM 2014 / ACOM: 34. 103 pp.
ICES. 2014b. Report of the Benchmark Workshop on Baltic Flatfish Stocks (WKBALFLAT), 27–31 January 2014,
Copenhagen, Denmark. ICES CM 2014/ACOM:39. 320 pp.
EU. 2008. COUNCIL REGULATION concerning the establishment of a Community framework for the collection, management
and use of data in the fisheries sector and support for scientific advice regarding the Common Fisheries Policy. COUNCIL
REGULATION (EC) No. 199/2008 of 25 February 2008. 12 pp.

69
ICES. 2015a. Report of the Joint ICES-MYFISH Workshop to consider the basis for FMSY ranges for all stocks
(WKMSYREF3), 17–21 November 2014, Charlottenlund, Denmark. ICES CM 2014/ACOM:64. 156 pp.
ICES. 2015b. EU request on data needs for monitoring of recreational fisheries. In Report of the ICES Advisory Committee,
2015. ICES Advice 2015, Book 1, Section 1.6.1.3. ICES Special Request Advice.
STECF. 2013. Scientific, Technical and Economic Committee for Fisheries (STECF) – Review of DC MAP – Part 1 (STECF-
13-06). 2013. Publications Office of the European Union, Luxembourg, EUR 25974 EN, JRC 81593. 42 pp.

70
16. Summary of recommendations
RCM Baltic 2015. Sampling of species
RCM Baltic 2015 Recommendation 1 The RCM Baltic recommends that the species list given in Annex VII in COM DEC 2010/93/EU
for the Baltic region for the new DC-MAP is revised. Pike (Esox lucius) should be deleted and
the following; Vendance (Coregonus albula), Smelt (Osmerus eperlanus) and Whiting
(Merlangius merlangus).
Justification Analyses of the total landings/catches by species caought in the Baltic shows that several important species in the region are not included Annex VII in COM DEC 2010/93/EU for the Baltic region. Therefore, RCM Baltic 2015 recommends the species list is revised.
Follow-up actions needed The recommendation is forwarded to the LM and the Commission.
Responsible persons for follow-up actions The Commission
Time frame (Deadline) To be included in the new DC-MAP
RCM Baltic 2015. Quality assurance – length at age relationship and weight at age relationship
RCM Baltic 2015 Recommendation 2
The RCM Baltic recommends that standard report on length at age relationship and weight at age relationship are developed in the RDB and that any sampling method is taken into account when data are aggregated over time and country.
Justification The RCM Baltic finds it useful to have stadard table on length at age relationship and weight at age relationship when analysing data. It would be a useful tool for the stock coordinator when analysing data to be used in the stock assessment prosesses.
Follow-up actions needed ICES Data Center has to analyse implications both in terms of cost and in terms of technicalities.
Responsible persons for follow-up actions The RCM Baltic chair to contact the ICES Data Center
Time frame (Deadline) Medio 2016

71
Agreement
Quality assurance – Upload of historical data to RDB FishFrame
RCM Baltic 2015 Agreement The RCM agrees on a repetitive data call demanding all MS to ensure that all historical data (including data in salmon and eel) for the period 2009-2014 are uploaded to the RDB hosted by ICES.
Justification A complete and easily accessible regional data set is crucial for the progress of a statistical sound sampling design in the data collection at a regional level.
Follow-up actions needed Data call to all MS via NC
Uploading of missing data by all MS
Responsible persons for follow-up actions
RCM Baltic chair to send out data call.
Time frame (Deadline) 1st February 2016
LM comments

72
Annex 1. Agenda for the RCM Baltic 2015
Regional Co-ordination Meeting for the Baltic Riga, 24 – 28 August, 2015
Fish Resources Research Department of Institute BIOR Daugavgrivas str. 8, RIGA
Agenda (draft)
General time schedule: Monday 14.00 - 18.00 - meeting time 16.00 – 16.30 - Coffee break Tuesday – Thursday 09.00 – 18.00 - meeting time 10.30 – 11.00 - Coffee break 13.00 - 14.30 - Lunch 16.00 – 16.30 - Coffee break Friday 09.00 – 13.00 - meeting time 10.30 – 11.00 - Coffee break
Work Plan
Monday, 24th August 2014 14.00 - 14.30: Plenary session: Welcome, introduction of the participants, organization & house rules, adoption of the agenda and appointment of subgroups & rapporteurs. 14.30- 16.00: Plenary session
ToR 1: Review progress since 2014 following up the 11th liaison meeting report. (Introduction Jørgen) (Rapporteur Susanne) ToR 2: Review feedback from end users, and expert groups, to include: WGCATCH 2014 (Introduction Romas) , RDB SC (Introduction Katja), WKRDB 5 (Introduction Ruth), PGDATA (Introduction Rie), STECF (Introduction Tiit), WKISCON2 (Introduction Katja), ICES (Introduction Ruth), WK on transversal variables (Introduction Katja), NC meetings (Introduction The commission). (All write a piece of the text for the report) 16.00 - 16.30: Coffee break 16.00 – 18.00: Plenary session: ToR 2: continued Agenda point outside the ToR: Presentation of the status of the DC-MAP (Introduction Jørgen) 18.00 End of the day Tuesday, 25th of August 2014 09.00 - 10.30: Plenary session: ToR 7: Landing Obligation.

73
a) Evaluate the impact of the introduction of the landing obligation, and/or preparations for its implementation. (Introduction Jørgen) (Rapporteur Timo)
b) The operation of at-sea observer programmes, and role of scientific observers. (Introduction Maria) (Rapporteur Georgs)
c) Quality and integrity of catch data collected by the control agencies, i.e. logbook sales notes data. (Introduction Rie) (Rapporteur Katja)
d) The generation of catch estimates derived from sampling programme data. (Introduction Uwe) (Rapporteur Sven)
e) Experiences of on-shore sampling of landed discards. (Introduction Irek) (Rapporteur Tomasz)
f) Review progress from last year’s recommendation on landing obligation. (Introduction Jørgen) (Rapporteur Timo)
10.30 - 11.00: Coffee break 11.00 – 13.00: Plenary session ToR 7: continued ToR 3b: Review progress in data quality screening, harmonisation of national and regional data checking procedures. (Introduction Maria) (continue in a sub-group) ToR 3c: Consider the role of the sampling data format in terms of integration of sampling data collection, recording and the present and future RCM data calls. (Introduction Katja) (continue in a sub-group)
13.00 – 14.30: Lunch break 14:30 – 16.00: Plenary session ToR 9: Discuss the role of metiers in sampling and estimation, as descriptors of fishing, as domains for estimation and their merging in the InterCatch, the RDB and the STECF data base and as an aide to sampling. Define how they are to be used in the future, the extent to which national and regional lists need to be harmonised and how lists are to be stored for use in a regional context. (Introduction Katja) (continue in a sub-group)
ToR 3d: Consider the data collection protocols for at-sea and on-shore sampling in the context of regional sampling designs and probability selection methods. (Introduction Rie) (Rapporteur Uwe) ToR 3e: Discuss design-based sampling: state of play of which MS are using it or plan to use it. (Introduction Irek) (Rapporteur Tomasz) ToR 3f: Analyse the RCM data call for the RDB 2014 data (analysis to be done as much as possible prior to the meeting, and the type of analysis e.g. ranking of ports to sample, to be determined beforehand). (Introduction Sven, Jukka, Maciej) 16.00 - 16.30: Coffee break 16.30 – 18.00: Sub-group work Establishing sub-groups
− Sub-group A: Quality control. Sub-group chair Rie
− Sub-group B: Sampling design, protocols, use of metiers, Data formats for future data calls. Sub-group
chair Uwe
− Sub-group D: Data analysis – catch data. Sub-group chair Susanne
− Sub-group E: Data analysis – biological information. Sub-group chair Sven
Start of sub-group work 18.00 End of the day
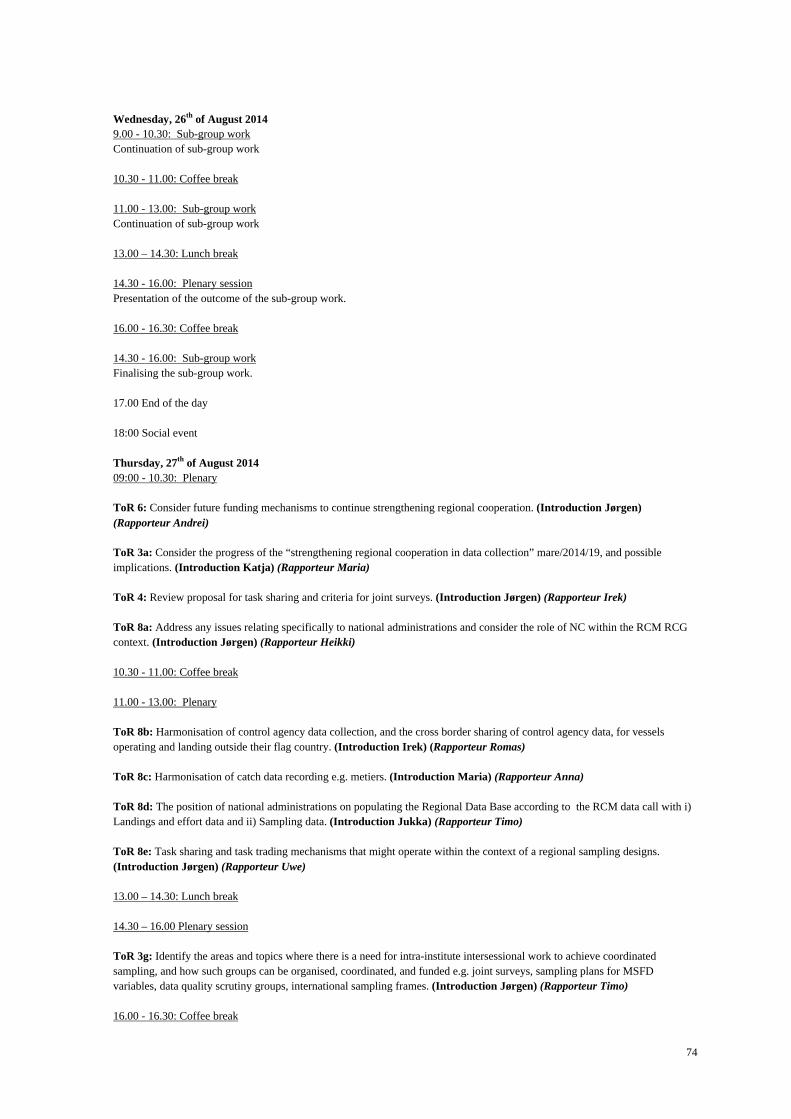
74
Wednesday, 26th of August 2014 9.00 - 10.30: Sub-group work Continuation of sub-group work 10.30 - 11.00: Coffee break 11.00 - 13.00: Sub-group work Continuation of sub-group work 13.00 – 14.30: Lunch break 14.30 - 16.00: Plenary session Presentation of the outcome of the sub-group work. 16.00 - 16.30: Coffee break 14.30 - 16.00: Sub-group work Finalising the sub-group work. 17.00 End of the day 18:00 Social event Thursday, 27th of August 2014 09:00 - 10.30: Plenary ToR 6: Consider future funding mechanisms to continue strengthening regional cooperation. (Introduction Jørgen) (Rapporteur Andrei) ToR 3a: Consider the progress of the “strengthening regional cooperation in data collection” mare/2014/19, and possible implications. (Introduction Katja) (Rapporteur Maria) ToR 4: Review proposal for task sharing and criteria for joint surveys. (Introduction Jørgen) (Rapporteur Irek) ToR 8a: Address any issues relating specifically to national administrations and consider the role of NC within the RCM RCG context. (Introduction Jørgen) (Rapporteur Heikki) 10.30 - 11.00: Coffee break 11.00 - 13.00: Plenary ToR 8b: Harmonisation of control agency data collection, and the cross border sharing of control agency data, for vessels operating and landing outside their flag country. (Introduction Irek) (Rapporteur Romas) ToR 8c: Harmonisation of catch data recording e.g. metiers. (Introduction Maria) (Rapporteur Anna) ToR 8d: The position of national administrations on populating the Regional Data Base according to the RCM data call with i) Landings and effort data and ii) Sampling data. (Introduction Jukka) (Rapporteur Timo) ToR 8e: Task sharing and task trading mechanisms that might operate within the context of a regional sampling designs. (Introduction Jørgen) (Rapporteur Uwe) 13.00 – 14.30: Lunch break 14.30 – 16.00 Plenary session ToR 3g: Identify the areas and topics where there is a need for intra-institute intersessional work to achieve coordinated sampling, and how such groups can be organised, coordinated, and funded e.g. joint surveys, sampling plans for MSFD variables, data quality scrutiny groups, international sampling frames. (Introduction Jørgen) (Rapporteur Timo) 16.00 - 16.30: Coffee break

75
16.30 – 18.00: Plenary ToR 10b: Review and comment on ICES advice on what data are necessary for scientific advice regarding recreational fisheries. (Introduction Jørgen) (Rapporteur Georgs) ToR 10c: Review and comment on list of proposed stocks & biological variables to be included in EU MAP. (The Commission will provide background documents/input for this ToR) 18.00 End of the day Friday, 28th of August 2014 9.00 - 10.30 : Plenary session ToR 5: Identify any amendments to NP needed in 2016. (Introduction Jørgen) (Rapporteur Georgs) ToR 10a: Propose list of research surveys that should be carried out in the region in 2016. (Introduction Jørgen) (Rapporteur Andrei) 10.30 - 11.00: Coffee break 11.00 – 13.00 : Plenary session
Report assemblage and finalisation of agreements and recommendations.
Election an appointment new chair and place and date of the next RCM/RCG Baltic
Closure of the meeting


77
Annex 2: Ranking of métiers
Table 1: Total effort subdivision 22-24 based on 2014 data from RDB FishFrame (per 18/08/2015). All métiers ordered by effort in days at sea. Shadowed lines show the métiers cumulating 90% of the total efforts in the fishing ground. Region FishingGround Metier Year Germany Denmark Estonia Finland Lithuania Latvia Poland Sweden SumEffortDaysAtSea Percentage AccuPercentage In_90
Baltic Sea 27,SD22‐24 GNS_DEF_110‐156_0_0 2014 26 528 6 506 0 0 0 98 1 582 2 600 37 314 33,63 33,63 Yes
Baltic Sea 27,SD22‐24 GNS_FWS_>0_0_0 2014 14 666 59 0 0 0 0 5 244 0 19 969 18,00 51,63 Yes
Baltic Sea 27,SD22‐24 MIS_MIS_0_0_0 2014 0 9 977 0 0 0 0 0 0 9 977 8,99 60,62 Yes
Baltic Sea 27,SD22‐24 GNS_SPF_32‐109_0_0 2014 7 986 70 0 0 0 0 174 328 8 558 7,71 68,33 Yes
Baltic Sea 27,SD22‐24 OTB_DEF_>=105_1_120 2014 2 497 4 588 0 0 0 0 931 205 8 221 7,41 75,74 Yes
Baltic Sea 27,SD22‐24 GNS_DEF_>=157_0_0 2014 0 3 438 0 0 0 0 17 730 4 185 3,77 79,51 Yes
Baltic Sea 27,SD22‐24 FPO_FWS_>0_0_0 2014 5 0 0 0 0 0 3 857 0 3 862 3,48 82,99 Yes
Baltic Sea 27,SD22‐24 GTR_DEF_110‐156_0_0 2014 2 193 0 0 0 0 0 0 525 2 718 2,45 85,44 Yes
Baltic Sea 27,SD22‐24 LLS_CAT_0_0_0 2014 2 075 0 0 0 0 0 25 0 2 100 1,89 87,33 Yes
Baltic Sea 27,SD22‐24 OTB_DEF_90‐104_0_0 2014 1 016 315 0 0 0 0 0 0 1 331 1,20 88,53 Yes
Baltic Sea 27,SD22‐24 LLS_FWS_0_0_0 2014 1 148 0 0 0 0 0 34 0 1 182 1,07 89,60 Yes
Baltic Sea 27,SD22‐24 FPN_CAT_>0_0_0 2014 42 624 0 0 0 0 0 449 1 115 1,00 90,60 No
Baltic Sea 27,SD22‐24 PTM_SPF_32‐104_0_0 2014 679 195 0 0 0 0 0 27 901 0,81 91,41 No
Baltic Sea 27,SD22‐24 PTB_DEF_>=105_1_120 2014 828 55 0 0 0 0 0 0 883 0,80 92,21 No
Baltic Sea 27,SD22‐24 LLS_DEF_0_0_0 2014 228 388 0 0 0 0 93 124 833 0,75 92,96 No
Baltic Sea 27,SD22‐24 FPO_DEF_>0_0_0 2014 633 47 0 0 0 0 7 22 709 0,64 93,60 No
Baltic Sea 27,SD22‐24 OTB_FWS_>0_0_0 2014 46 0 0 0 0 0 621 0 667 0,60 94,20 No
Baltic Sea 27,SD22‐24 FPN_DEF_>0_0_0 2014 159 493 0 0 0 0 0 0 652 0,59 94,79 No
Baltic Sea 27,SD22‐24 FPO_CAT_>0_0_0 2014 455 41 0 0 0 0 38 0 534 0,48 95,27 No
Baltic Sea 27,SD22‐24 FYK_CAT_>0_0_0 2014 0 0 0 0 0 0 0 530 530 0,48 95,75 No
Baltic Sea 27,SD22‐24 FPN_SPF_>0_0_0 2014 97 285 0 0 0 0 0 0 382 0,34 96,09 No
Baltic Sea 27,SD22‐24 FPN_FWS_>0_0_0 2014 349 15 0 0 0 0 8 0 372 0,34 96,43 No
Baltic Sea 27,SD22‐24 SDN_DEF_>=105_1_120 2014 0 346 0 0 0 0 0 0 346 0,31 96,74 No
Baltic Sea 27,SD22‐24 LLD_ANA_0_0_0 2014 0 307 0 0 0 0 9 0 316 0,28 97,02 No
Baltic Sea 27,SD22‐24 PTB_SPF_32‐104_0_0 2014 262 15 0 0 0 0 0 0 277 0,25 97,27 No
Baltic Sea 27,SD22‐24 OTM_SPF_32‐104_0_0 2014 0 97 0 0 0 0 172 0 269 0,24 97,52 No
Baltic Sea 27,SD22‐24 GTR_DEF_>=157_0_0 2014 0 0 0 0 0 0 0 243 243 0,22 97,74 No
Baltic Sea 27,SD22‐24 PTM_DEF_<16_0_0 2014 0 205 0 0 0 0 0 0 205 0,18 97,92 No
Baltic Sea 27,SD22‐24 OTM_DEF_<16_0_0 2014 0 23 0 0 0 0 173 0 196 0,18 98,10 No

78
Baltic Sea 27,SD22‐24 PTB_DEF_90‐104_0_0 2014 187 0 0 0 0 0 0 0 187 0,17 98,27 No
Baltic Sea 27,SD22‐24 FPO_SPF_>0_0_0 2014 68 0 0 0 0 0 98 0 166 0,15 98,41 No
Baltic Sea 27,SD22‐24 PTM_SPF_32‐89_0_0 2014 97 67 0 0 0 0 0 0 164 0,15 98,56 No
Baltic Sea 27,SD22‐24 GNS_ANA_>=157_0_0 2014 93 0 0 0 0 0 66 0 159 0,14 98,71 No
Baltic Sea 27,SD22‐24 PTM_SPF_16‐31_0_0 2014 48 102 0 0 0 0 0 0 150 0,14 98,84 No
Baltic Sea 27,SD22‐24 OTB_DEF_>=120_0_0 2014 0 0 0 0 0 0 0 137 137 0,12 98,96 No
Baltic Sea 27,SD22‐24 LHP_FIF_0_0_0 2014 19 30 0 0 0 0 0 82 131 0,12 99,08 No
Baltic Sea 27,SD22‐24 PTB_FWS_>0_0_0 2014 102 0 0 0 0 0 0 0 102 0,09 99,17 No
Baltic Sea 27,SD22‐24 GTR_FWS_>0_0_0 2014 8 0 0 0 0 0 92 0 100 0,09 99,26 No
Baltic Sea 27,SD22‐24 PTB_SPF_16‐31_0_0 2014 85 9 0 0 0 0 0 0 94 0,08 99,35 No
Baltic Sea 27,SD22‐24 OTT_DEF_>=105_1_120 2014 0 0 0 0 0 0 0 85 85 0,08 99,43 No
Baltic Sea 27,SD22‐24 PTB_SPF_32‐89_0_0 2014 82 0 0 0 0 0 0 0 82 0,07 99,50 No
Baltic Sea 27,SD22‐24 PTB_DEF_<16_0_0 2014 0 67 0 0 0 0 0 0 67 0,06 99,56 No
Baltic Sea 27,SD22‐24 OTM_SPF_16‐31_0_0 2014 0 10 0 0 0 0 53 0 63 0,06 99,62 No
Baltic Sea 27,SD22‐24 OTB_SPF_16‐31_0_0 2014 2 0 0 0 0 0 52 0 54 0,05 99,67 No
Baltic Sea 27,SD22‐24 OTB_SPF_32‐104_0_0 2014 0 0 0 0 0 0 47 0 47 0,04 99,71 No
Baltic Sea 27,SD22‐24 FPN_ANA_>0_0_0 2014 1 41 0 0 0 0 0 0 42 0,04 99,75 No
Baltic Sea 27,SD22‐24 GNS_DEF_90‐109_0_0 2014 0 16 0 0 0 0 0 21 37 0,03 99,78 No
Baltic Sea 27,SD22‐24 OTB_SPF_32‐89_0_0 2014 34 0 0 0 0 0 0 0 34 0,03 99,81 No
Baltic Sea 27,SD22‐24 SSC_DEF_>=105_1_120 2014 1 31 0 0 0 0 0 0 32 0,03 99,84 No
Baltic Sea 27,SD22‐24 OTM_SPF_32‐89_0_0 2014 0 24 0 0 0 0 0 0 24 0,02 99,86 No
Baltic Sea 27,SD22‐24 GTR_SPF_32‐109_0_0 2014 21 0 0 0 0 0 0 0 21 0,02 99,88 No
Baltic Sea 27,SD22‐24 GNS_CAT_>0_0_0 2014 0 18 0 0 0 0 0 0 18 0,02 99,91 No
Baltic Sea 27,SD22‐24 PTM_DEF_>=105_1_120 2014 18 0 0 0 0 0 0 0 18 0,02 99,91 No
Baltic Sea 27,SD22‐24 OTB_DEF_<16_0_0 2014 0 12 0 0 0 0 5 0 17 0,02 99,93 No
Baltic Sea 27,SD22‐24 GNS_SPF_110‐156_0_0 2014 0 16 0 0 0 0 0 0 16 0,01 99,94 No
Baltic Sea 27,SD22‐24 GNS_ANA_110‐156_0_0 2014 0 0 0 0 0 0 15 0 15 0,01 99,95 No
Baltic Sea 27,SD22‐24 LLS_SPF_0_0_0 2014 12 0 0 0 0 0 0 0 12 0,01 99,97 No
Baltic Sea 27,SD22‐24 OTB_CRU_>0_0_0 2014 0 11 0 0 0 0 0 0 11 0,01 99,98 No
Baltic Sea 27,SD22‐24 OTT_DEF_>=120_0_0 2014 0 0 0 0 0 0 0 10 10 0,01 99,98 No
Baltic Sea 27,SD22‐24 OTM_DEF_>=105_1_120 2014 0 6 0 0 0 0 0 0 6 0,01 100,00 No
Baltic Sea 27,SD22‐24 OTB_SPF_>=120_0_0 2014 0 0 0 0 0 0 6 0 6 0,01 100,00 No
Baltic Sea 27,SD22‐24 FPO_ANA_>0_0_0 2014 0 0 0 0 0 0 3 0 3 0,00 100,00 No
Baltic Sea 27,SD22‐24 PTM_FWS_>0_0_0 2014 2 0 0 0 0 0 0 0 2 0,00 100,00 No

79
Table 2: Total effort subdivision 22-24 based on NPs 2011-2013. All métiers ordered by effort in fishing days. Shadowed lines show the métiers cumulating 90% of the total effort in the fishing ground. The figures are from the report of the RCM Baltic 2010 and they have not been updated.
Métier LVL6 DNK GER POL SWE Total % Cum%
GNS_DEF_110-156_0_0 7020 12032 2496 4418 25966 31,6289 31,6289
OTB_DEF_>=105_1_110 6732 1509 1713 683 10636 12,9554 44,5843
GNS_FWS_>0_0_0 4983 4957 9940 12,1073 56,6916
GNS_SPF_32-109_0_0 17 8695 285 234 9230 11,2425 67,9341
FPO_FWS_>0_0_0 3 5493 5496 6,6944 74,6285
GTR_DEF_110-156_0_0 2467 1231 526 4224 5,1451 79,7736
GNS_DEF_>=157_0_0 1984 542 2526 3,0763 82,8499
FWR_FWS_>0_0_0 1136 1136 1,3832 84,2330
FPN_CAT_>0_0_0 374 706 1080 1,3155 85,5486
GTR_DEF_>=157_0_0 895 173 1068 1,3009 86,8495
FYK_CAT_>0_0_0 895 895 1,0896 87,9391
FPO_CAT_>0_0_0 727 50 777 0,9463 88,8854
LLS_DEF_0_0_0 367 54 238 86 745 0,9070 89,7923
OTB_DEF_>=90_0_0 489 197 686 0,8355 90,6278
SDN_DEF_>=105_1_110 607 5 612 0,7459 91,3736
PTB_DEF_>=105_1_110 102 511 612 0,7456 92,1192
FPN_DEF_>0_0_0 460 30 490 0,5963 92,7155
OTM_SPF_16-89_0_0 481 481 0,5853 93,3008
PTM_SPF_32-104_0_0 37 257 168 462 0,5628 93,8635
OTB_FWS_>0_0_0 15 439 453 0,5518 94,4153
PTB_SPF_32-104_0_0 95 292 14 401 0,4885 94,9038
OTB_SPF_32-104_0_0 18 208 61 287 0,3496 95,2534
FPN_SPF_>0_0_0 236 23 7 265 0,3222 95,5756
FPO_SPF_>0_0_0 68 150 218 0,2660 95,8416
LHP_FIF_0_0_0 37 178 214 0,2607 96,1023
FWR_SPF_>0_0_0 195 195 0,2375 96,3398
LLS_CAT_0_0_0 41 124 31 195 0,2369 96,5767
FWR_CAT_>0_0_0 190 190 0,2315 96,8082
PTM_SPF_16-31_0_0 142 18 159 0,1937 97,0019
PTB_SPF_16-31_0_0 141 17 158 0,1929 97,1948
PTB_SPF_32-89_0_0 67 87 154 0,1878 97,3826
GTR_FWS_>0_0_0 13 127 140 0,1702 97,5527
MIS_SPF_0_0_0 133 133 0,1618 97,7145
PTM_SPF_32-89_0_0 102 7 22 131 0,1598 97,8743
SSC_DEF_>=105_1_110 108 19 127 0,1543 98,0287
OTB_CRU_>0_0_0 119 1 120 0,1461 98,1748
SSC_FWS_>0_0_0 112 112 0,1358 98,3106
LLS_FWS_0_0_0 59 51 110 0,1334 98,4440
GNS_ANA_>=157_0_0 26 81 107 0,1301 98,5740
MIS_DEF_0_0_0 106 106 0,1288 98,7028
GNS_DEF_90-109_0_0 87 1 88 0,1066 98,8094
FWR_DEF_>0_0_0 77 77 0,0938 98,9032
PTM_DEF_>=105_1_110 68 68 0,0827 98,9859
TBB_DEF_>=105_1_110 68 68 0,0827 99,0686
LLD_ANA_0_0_0 53 4 11 68 0,0822 99,1508
OTB_SPF_32-89_0_0 25 42 67 0,0818 99,2326
MIS_CAT_0_0_0 50 50 0,0613 99,2939
PTB_DEF_>=90_0_0 42 42 0,0509 99,3448
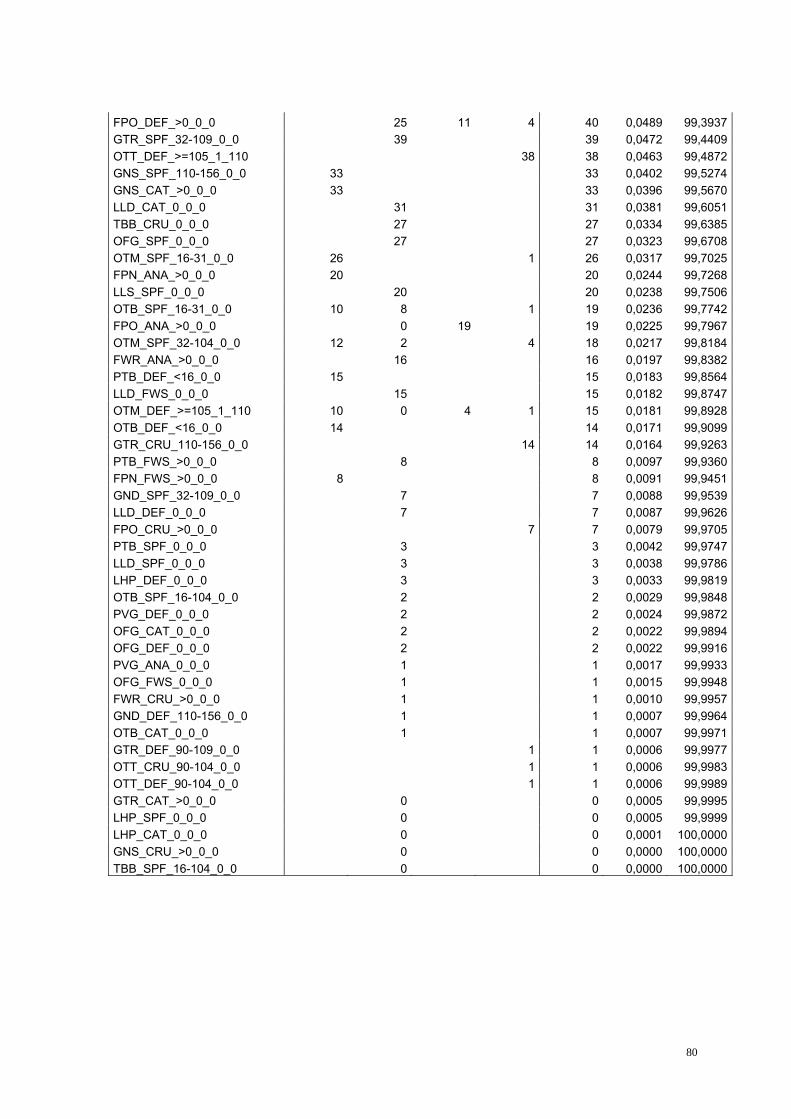
80
FPO_DEF_>0_0_0 25 11 4 40 0,0489 99,3937
GTR_SPF_32-109_0_0 39 39 0,0472 99,4409
OTT_DEF_>=105_1_110 38 38 0,0463 99,4872
GNS_SPF_110-156_0_0 33 33 0,0402 99,5274
GNS_CAT_>0_0_0 33 33 0,0396 99,5670
LLD_CAT_0_0_0 31 31 0,0381 99,6051
TBB_CRU_0_0_0 27 27 0,0334 99,6385
OFG_SPF_0_0_0 27 27 0,0323 99,6708
OTM_SPF_16-31_0_0 26 1 26 0,0317 99,7025
FPN_ANA_>0_0_0 20 20 0,0244 99,7268
LLS_SPF_0_0_0 20 20 0,0238 99,7506
OTB_SPF_16-31_0_0 10 8 1 19 0,0236 99,7742
FPO_ANA_>0_0_0 0 19 19 0,0225 99,7967
OTM_SPF_32-104_0_0 12 2 4 18 0,0217 99,8184
FWR_ANA_>0_0_0 16 16 0,0197 99,8382
PTB_DEF_<16_0_0 15 15 0,0183 99,8564
LLD_FWS_0_0_0 15 15 0,0182 99,8747
OTM_DEF_>=105_1_110 10 0 4 1 15 0,0181 99,8928
OTB_DEF_<16_0_0 14 14 0,0171 99,9099
GTR_CRU_110-156_0_0 14 14 0,0164 99,9263
PTB_FWS_>0_0_0 8 8 0,0097 99,9360
FPN_FWS_>0_0_0 8 8 0,0091 99,9451
GND_SPF_32-109_0_0 7 7 0,0088 99,9539
LLD_DEF_0_0_0 7 7 0,0087 99,9626
FPO_CRU_>0_0_0 7 7 0,0079 99,9705
PTB_SPF_0_0_0 3 3 0,0042 99,9747
LLD_SPF_0_0_0 3 3 0,0038 99,9786
LHP_DEF_0_0_0 3 3 0,0033 99,9819
OTB_SPF_16-104_0_0 2 2 0,0029 99,9848
PVG_DEF_0_0_0 2 2 0,0024 99,9872
OFG_CAT_0_0_0 2 2 0,0022 99,9894
OFG_DEF_0_0_0 2 2 0,0022 99,9916
PVG_ANA_0_0_0 1 1 0,0017 99,9933
OFG_FWS_0_0_0 1 1 0,0015 99,9948
FWR_CRU_>0_0_0 1 1 0,0010 99,9957
GND_DEF_110-156_0_0 1 1 0,0007 99,9964
OTB_CAT_0_0_0 1 1 0,0007 99,9971
GTR_DEF_90-109_0_0 1 1 0,0006 99,9977
OTT_CRU_90-104_0_0 1 1 0,0006 99,9983
OTT_DEF_90-104_0_0 1 1 0,0006 99,9989
GTR_CAT_>0_0_0 0 0 0,0005 99,9995
LHP_SPF_0_0_0 0 0 0,0005 99,9999
LHP_CAT_0_0_0 0 0 0,0001 100,0000
GNS_CRU_>0_0_0 0 0 0,0000 100,0000
TBB_SPF_16-104_0_0 0 0 0,0000 100,0000
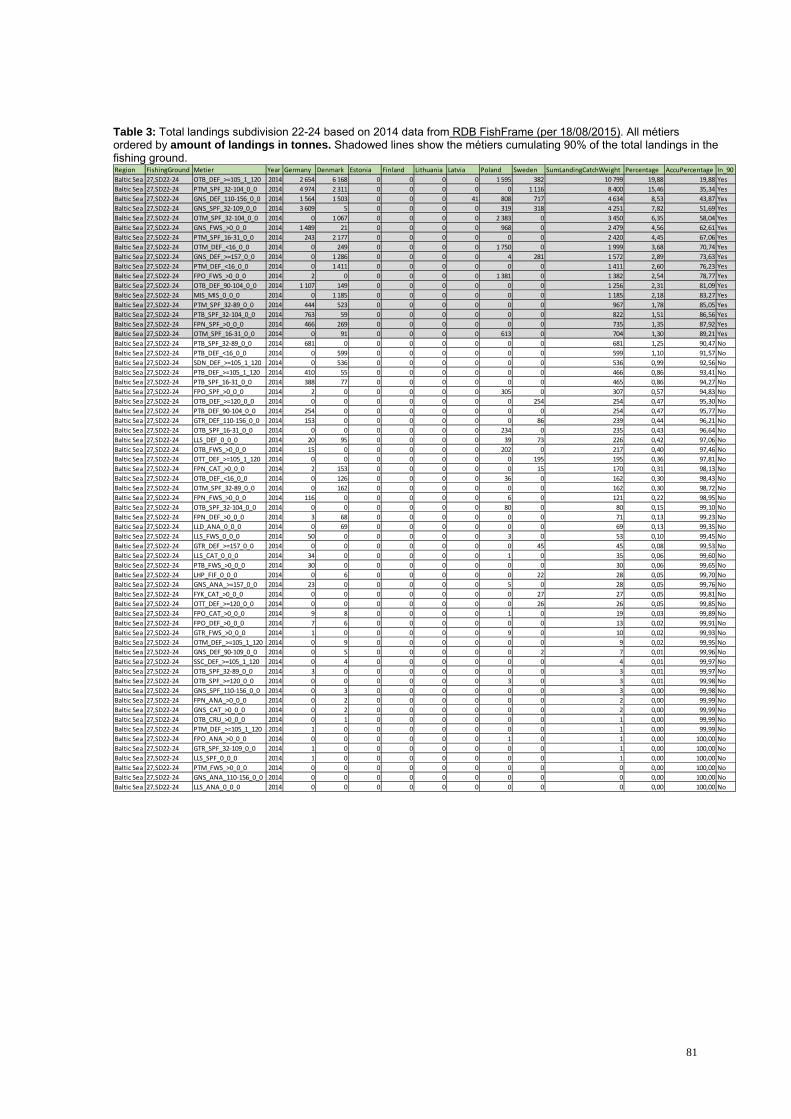
81
Table 3: Total landings subdivision 22-24 based on 2014 data from RDB FishFrame (per 18/08/2015). All métiers ordered by amount of landings in tonnes. Shadowed lines show the métiers cumulating 90% of the total landings in the fishing ground.
Region FishingGround Metier Year Germany Denmark Estonia Finland Lithuania Latvia Poland Sweden SumLandingCatchWeight Percentage AccuPercentage In_90
Baltic Sea 27,SD22‐24 OTB_DEF_>=105_1_120 2014 2 654 6 168 0 0 0 0 1 595 382 10 799 19,88 19,88 Yes
Baltic Sea 27,SD22‐24 PTM_SPF_32‐104_0_0 2014 4 974 2 311 0 0 0 0 0 1 116 8 400 15,46 35,34 Yes
Baltic Sea 27,SD22‐24 GNS_DEF_110‐156_0_0 2014 1 564 1 503 0 0 0 41 808 717 4 634 8,53 43,87 Yes
Baltic Sea 27,SD22‐24 GNS_SPF_32‐109_0_0 2014 3 609 5 0 0 0 0 319 318 4 251 7,82 51,69 Yes
Baltic Sea 27,SD22‐24 OTM_SPF_32‐104_0_0 2014 0 1 067 0 0 0 0 2 383 0 3 450 6,35 58,04 Yes
Baltic Sea 27,SD22‐24 GNS_FWS_>0_0_0 2014 1 489 21 0 0 0 0 968 0 2 479 4,56 62,61 Yes
Baltic Sea 27,SD22‐24 PTM_SPF_16‐31_0_0 2014 243 2 177 0 0 0 0 0 0 2 420 4,45 67,06 Yes
Baltic Sea 27,SD22‐24 OTM_DEF_<16_0_0 2014 0 249 0 0 0 0 1 750 0 1 999 3,68 70,74 Yes
Baltic Sea 27,SD22‐24 GNS_DEF_>=157_0_0 2014 0 1 286 0 0 0 0 4 281 1 572 2,89 73,63 Yes
Baltic Sea 27,SD22‐24 PTM_DEF_<16_0_0 2014 0 1 411 0 0 0 0 0 0 1 411 2,60 76,23 Yes
Baltic Sea 27,SD22‐24 FPO_FWS_>0_0_0 2014 2 0 0 0 0 0 1 381 0 1 382 2,54 78,77 Yes
Baltic Sea 27,SD22‐24 OTB_DEF_90‐104_0_0 2014 1 107 149 0 0 0 0 0 0 1 256 2,31 81,09 Yes
Baltic Sea 27,SD22‐24 MIS_MIS_0_0_0 2014 0 1 185 0 0 0 0 0 0 1 185 2,18 83,27 Yes
Baltic Sea 27,SD22‐24 PTM_SPF_32‐89_0_0 2014 444 523 0 0 0 0 0 0 967 1,78 85,05 Yes
Baltic Sea 27,SD22‐24 PTB_SPF_32‐104_0_0 2014 763 59 0 0 0 0 0 0 822 1,51 86,56 Yes
Baltic Sea 27,SD22‐24 FPN_SPF_>0_0_0 2014 466 269 0 0 0 0 0 0 735 1,35 87,92 Yes
Baltic Sea 27,SD22‐24 OTM_SPF_16‐31_0_0 2014 0 91 0 0 0 0 613 0 704 1,30 89,21 Yes
Baltic Sea 27,SD22‐24 PTB_SPF_32‐89_0_0 2014 681 0 0 0 0 0 0 0 681 1,25 90,47 No
Baltic Sea 27,SD22‐24 PTB_DEF_<16_0_0 2014 0 599 0 0 0 0 0 0 599 1,10 91,57 No
Baltic Sea 27,SD22‐24 SDN_DEF_>=105_1_120 2014 0 536 0 0 0 0 0 0 536 0,99 92,56 No
Baltic Sea 27,SD22‐24 PTB_DEF_>=105_1_120 2014 410 55 0 0 0 0 0 0 466 0,86 93,41 No
Baltic Sea 27,SD22‐24 PTB_SPF_16‐31_0_0 2014 388 77 0 0 0 0 0 0 465 0,86 94,27 No
Baltic Sea 27,SD22‐24 FPO_SPF_>0_0_0 2014 2 0 0 0 0 0 305 0 307 0,57 94,83 No
Baltic Sea 27,SD22‐24 OTB_DEF_>=120_0_0 2014 0 0 0 0 0 0 0 254 254 0,47 95,30 No
Baltic Sea 27,SD22‐24 PTB_DEF_90‐104_0_0 2014 254 0 0 0 0 0 0 0 254 0,47 95,77 No
Baltic Sea 27,SD22‐24 GTR_DEF_110‐156_0_0 2014 153 0 0 0 0 0 0 86 239 0,44 96,21 No
Baltic Sea 27,SD22‐24 OTB_SPF_16‐31_0_0 2014 0 0 0 0 0 0 234 0 235 0,43 96,64 No
Baltic Sea 27,SD22‐24 LLS_DEF_0_0_0 2014 20 95 0 0 0 0 39 73 226 0,42 97,06 No
Baltic Sea 27,SD22‐24 OTB_FWS_>0_0_0 2014 15 0 0 0 0 0 202 0 217 0,40 97,46 No
Baltic Sea 27,SD22‐24 OTT_DEF_>=105_1_120 2014 0 0 0 0 0 0 0 195 195 0,36 97,81 No
Baltic Sea 27,SD22‐24 FPN_CAT_>0_0_0 2014 2 153 0 0 0 0 0 15 170 0,31 98,13 No
Baltic Sea 27,SD22‐24 OTB_DEF_<16_0_0 2014 0 126 0 0 0 0 36 0 162 0,30 98,43 No
Baltic Sea 27,SD22‐24 OTM_SPF_32‐89_0_0 2014 0 162 0 0 0 0 0 0 162 0,30 98,72 No
Baltic Sea 27,SD22‐24 FPN_FWS_>0_0_0 2014 116 0 0 0 0 0 6 0 121 0,22 98,95 No
Baltic Sea 27,SD22‐24 OTB_SPF_32‐104_0_0 2014 0 0 0 0 0 0 80 0 80 0,15 99,10 No
Baltic Sea 27,SD22‐24 FPN_DEF_>0_0_0 2014 3 68 0 0 0 0 0 0 71 0,13 99,23 No
Baltic Sea 27,SD22‐24 LLD_ANA_0_0_0 2014 0 69 0 0 0 0 0 0 69 0,13 99,35 No
Baltic Sea 27,SD22‐24 LLS_FWS_0_0_0 2014 50 0 0 0 0 0 3 0 53 0,10 99,45 No
Baltic Sea 27,SD22‐24 GTR_DEF_>=157_0_0 2014 0 0 0 0 0 0 0 45 45 0,08 99,53 No
Baltic Sea 27,SD22‐24 LLS_CAT_0_0_0 2014 34 0 0 0 0 0 1 0 35 0,06 99,60 No
Baltic Sea 27,SD22‐24 PTB_FWS_>0_0_0 2014 30 0 0 0 0 0 0 0 30 0,06 99,65 No
Baltic Sea 27,SD22‐24 LHP_FIF_0_0_0 2014 0 6 0 0 0 0 0 22 28 0,05 99,70 No
Baltic Sea 27,SD22‐24 GNS_ANA_>=157_0_0 2014 23 0 0 0 0 0 5 0 28 0,05 99,76 No
Baltic Sea 27,SD22‐24 FYK_CAT_>0_0_0 2014 0 0 0 0 0 0 0 27 27 0,05 99,81 No
Baltic Sea 27,SD22‐24 OTT_DEF_>=120_0_0 2014 0 0 0 0 0 0 0 26 26 0,05 99,85 No
Baltic Sea 27,SD22‐24 FPO_CAT_>0_0_0 2014 9 8 0 0 0 0 1 0 19 0,03 99,89 No
Baltic Sea 27,SD22‐24 FPO_DEF_>0_0_0 2014 7 6 0 0 0 0 0 0 13 0,02 99,91 No
Baltic Sea 27,SD22‐24 GTR_FWS_>0_0_0 2014 1 0 0 0 0 0 9 0 10 0,02 99,93 No
Baltic Sea 27,SD22‐24 OTM_DEF_>=105_1_120 2014 0 9 0 0 0 0 0 0 9 0,02 99,95 No
Baltic Sea 27,SD22‐24 GNS_DEF_90‐109_0_0 2014 0 5 0 0 0 0 0 2 7 0,01 99,96 No
Baltic Sea 27,SD22‐24 SSC_DEF_>=105_1_120 2014 0 4 0 0 0 0 0 0 4 0,01 99,97 No
Baltic Sea 27,SD22‐24 OTB_SPF_32‐89_0_0 2014 3 0 0 0 0 0 0 0 3 0,01 99,97 No
Baltic Sea 27,SD22‐24 OTB_SPF_>=120_0_0 2014 0 0 0 0 0 0 3 0 3 0,01 99,98 No
Baltic Sea 27,SD22‐24 GNS_SPF_110‐156_0_0 2014 0 3 0 0 0 0 0 0 3 0,00 99,98 No
Baltic Sea 27,SD22‐24 FPN_ANA_>0_0_0 2014 0 2 0 0 0 0 0 0 2 0,00 99,99 No
Baltic Sea 27,SD22‐24 GNS_CAT_>0_0_0 2014 0 2 0 0 0 0 0 0 2 0,00 99,99 No
Baltic Sea 27,SD22‐24 OTB_CRU_>0_0_0 2014 0 1 0 0 0 0 0 0 1 0,00 99,99 No
Baltic Sea 27,SD22‐24 PTM_DEF_>=105_1_120 2014 1 0 0 0 0 0 0 0 1 0,00 99,99 No
Baltic Sea 27,SD22‐24 FPO_ANA_>0_0_0 2014 0 0 0 0 0 0 1 0 1 0,00 100,00 No
Baltic Sea 27,SD22‐24 GTR_SPF_32‐109_0_0 2014 1 0 0 0 0 0 0 0 1 0,00 100,00 No
Baltic Sea 27,SD22‐24 LLS_SPF_0_0_0 2014 1 0 0 0 0 0 0 0 1 0,00 100,00 No
Baltic Sea 27,SD22‐24 PTM_FWS_>0_0_0 2014 0 0 0 0 0 0 0 0 0 0,00 100,00 No
Baltic Sea 27,SD22‐24 GNS_ANA_110‐156_0_0 2014 0 0 0 0 0 0 0 0 0 0,00 100,00 No
Baltic Sea 27,SD22‐24 LLS_ANA_0_0_0 2014 0 0 0 0 0 0 0 0 0 0,00 100,00 No

82
Table 4: Total landings subdivision 22-24 based on NPs 2011-2013. All métiers ordered by amount of landings in tonnes. Shadowed lines show the métiers cumulating 90% of the total landings in the fishing ground. The figures are from the report of the RCM Baltic 2010 and they have not been updated.
Métier LVL6 DNK GER POL SWE Total % Cum%
OTB_DEF_>=105_1_110 7229 4534 2434 1403 15601 17,49965 17,49965
PTM_SPF_32-104_0_0 901 4383 7788 13072 14,66299 32,16264
GNS_SPF_32-109_0_0 12 8187 513 261 8973 10,06538 42,22802
GNS_DEF_110-156_0_0 1775 3001 1870 1251 7897 8,858482 51,0865
PTB_SPF_32-104_0_0 1561 4450 34 6046 6,781989 57,86849
OTM_SPF_16-89_0_0 5648 5648 6,335653 64,20415
PTB_SPF_32-89_0_0 2123 2034 4157 4,663558 68,8677
PTM_SPF_16-31_0_0 2753 805 3558 3,991038 72,85874
PTM_SPF_32-89_0_0 2353 676 54 3084 3,459672 76,31841
OTB_SPF_32-104_0_0 225 2567 33 2825 3,168937 79,48735
PTB_SPF_16-31_0_0 1922 870 2792 3,131474 82,61883
OTM_SPF_32-104_0_0 57 1629 324 2010 2,255232 84,87406
GNS_FWS_>0_0_0 1063 661 1724 1,933907 86,80796
FPO_FWS_>0_0_0 2 1331 1332 1,494468 88,30243
PTB_DEF_>=105_1_110 94 1086 1180 1,324181 89,62661
FPO_SPF_>0_0_0 556 471 1027 1,152234 90,77885
SDN_DEF_>=105_1_110 879 21 900 1,009714 91,78856
GNS_DEF_>=157_0_0 720 178 898 1,007319 92,79588
OTB_SPF_32-89_0_0 469 414 882 0,989918 93,7858
GTR_DEF_110-156_0_0 500 183 73 755 0,847416 94,63321
OTB_DEF_>=90_0_0 155 381 536 0,601264 95,23448
FPN_SPF_>0_0_0 302 131 0 434 0,486456 95,72093
LLS_DEF_0_0_0 132 11 202 56 401 0,450225 96,17116
OTB_SPF_16-31_0_0 158 133 17 308 0,345964 96,51712
GTR_DEF_>=157_0_0 283 23 307 0,343882 96,861
FPN_CAT_>0_0_0 265 41 307 0,343834 97,20484
SSC_DEF_>=105_1_110 117 164 281 0,315558 97,5204
OTM_SPF_16-31_0_0 258 3 261 0,292527 97,81292
PTB_DEF_<16_0_0 208 208 0,233749 98,04667
FWR_SPF_>0_0_0 175 175 0,195799 98,24247

83
PTM_DEF_>=105_1_110 174 174 0,194926 98,4374
OTB_DEF_<16_0_0 137 137 0,154069 98,59147
OTB_FWS_>0_0_0 6 127 133 0,149089 98,74056
TBB_DEF_>=105_1_110 130 130 0,146312 98,88687
PTB_DEF_>=90_0_0 127 127 0,142101 99,02897
FWR_FWS_>0_0_0 115 115 0,128837 99,1578
PTB_SPF_0_0_0 101 101 0,11364 99,27144
FPN_DEF_>0_0_0 81 2 83 0,093282 99,36473
FPO_CAT_>0_0_0 64 1 65 0,072356 99,43708
SSC_FWS_>0_0_0 62 62 0,069229 99,50631
OTT_DEF_>=105_1_110 61 61 0,068577 99,57489
OFG_SPF_0_0_0 52 52 0,058021 99,63291
LHP_FIF_0_0_0 8 30 37 0,042034 99,67494
OTM_DEF_>=105_1_110 26 7 2 1 36 0,040425 99,71537
FYK_CAT_>0_0_0 32 32 0,035588 99,75096
TBB_CRU_0_0_0 31 31 0,03513 99,78609
OTB_CRU_>0_0_0 30 0 31 0,034283 99,82037
LLS_SPF_0_0_0 20 20 0,022561 99,84293
OTB_SPF_16-104_0_0 15 15 0,016869 99,8598
GTR_FWS_>0_0_0 0 12 13 0,014367 99,87417
GNS_DEF_90-109_0_0 12 0 12 0,013231 99,8874
LLD_ANA_0_0_0 8 1 2 11 0,012277 99,89967
GNS_SPF_110-156_0_0 10 10 0,011547 99,91122
LLS_FWS_0_0_0 5 5 10 0,011006 99,92223
GTR_SPF_32-109_0_0 8 8 0,00847 99,9307
GNS_ANA_>=157_0_0 4 3 7 0,008368 99,93907
MIS_SPF_0_0_0 7 7 0,008216 99,94728
MIS_DEF_0_0_0 7 7 0,007446 99,95473
LLS_CAT_0_0_0 2 3 1 6 0,00644 99,96117
FPO_DEF_>0_0_0 4 2 0 6 0,006318 99,96749
MIS_CAT_0_0_0 5 5 0,005557 99,97304
GNS_CRU_>0_0_0 4 4 0,004983 99,97803
GNS_CAT_>0_0_0 4 4 0,004904 99,98293
FWR_CAT_>0_0_0 4 4 0,004225 99,98716

84
FWR_DEF_>0_0_0 4 4 0,004077 99,99123
FPO_ANA_>0_0_0 0 2 2 0,001893 99,99313
FPN_ANA_>0_0_0 2 2 0,001693 99,99482
PVG_DEF_0_0_0 1 1 0,001329 99,99615
PTB_FWS_>0_0_0 1 1 0,001243 99,99739
GND_SPF_32-109_0_0 1 1 0,001067 99,99846
LLD_CAT_0_0_0 1 1 0,000797 99,99926
LHP_DEF_0_0_0 1 1 0,000744 100

85
Table 5: Total value subdivision 22-24 based on 2014 data from RDB FishFrame (per 18/08/2015). All métiers ordered by value of landings in thousand €. Shadowed lines show the métiers cumulating 90% of the total values in the fishing ground.

86
Table 6: Total value subdivision 22-24 based on NPs 2011-2013. All métiers ordered by value of landings in €. Shadowed lines show the métiers cumulating 90% of the total values in the fishing ground. The figures are from the report of the RCM Baltic 2010 and they have not been updated.
Métier LVL6 DNK GER POL SWE Total % Cum%
OTB_DEF_>=105_1_110 10544177 5437099 1930144 2110407 20021827 31,39311 31,39311
GNS_DEF_110-156_0_0 3283292 4112410 1701088 1947849 11044639 17,31738 48,71049
GNS_SPF_32-109_0_0 6021,08 3224027 165319,4 63536,08 3458904 5,423368 54,13386
PTM_SPF_32-104_0_0 308262,8 1099705 1771220 3179188 4,98479 59,11865
GNS_DEF_>=157_0_0 1638606 1100581 2739188 4,294893 63,41354
GNS_FWS_>0_0_0 1593832 740628,7 2334461 3,660304 67,07384
PTB_DEF_>=105_1_110 146131,2 1592497 1738629 2,726073 69,79992
FPO_FWS_>0_0_0 2256,125 1648114 1650370 2,587689 72,3876
GTR_DEF_110-156_0_0 1230630 217575,8 164277,4 1612484 2,528284 74,91589
SDN_DEF_>=105_1_110 1484857 33922,41 1518780 2,381362 77,29725
FPN_CAT_>0_0_0 1217855 256356,6 1474212 2,311482 79,60873
OTM_SPF_16-89_0_0 1392850 1392850 2,183911 81,79264
PTB_SPF_32-104_0_0 421391,6 928500,2 14482,35 1364374 2,139263 83,93191
PTB_SPF_32-89_0_0 663552,6 466847,9 1130401 1,772405 85,70431
PTM_SPF_32-89_0_0 677109,5 372208 17128,25 1066446 1,672128 87,37644
OTB_DEF_>=90_0_0 549262,8 371125,3 920388,1 1,443117 88,81956
GTR_DEF_>=157_0_0 635156,8 73529,78 708686,5 1,111181 89,93074
OTB_SPF_32-104_0_0 70352,46 557747 28644,54 656744 1,029738 90,96047
PTM_SPF_16-31_0_0 444308,5 141193,6 585502,1 0,918035 91,87851
LLS_DEF_0_0_0 181525,7 18313,14 244350,4 84122,4 528311,6 0,828363 92,70687
SSC_DEF_>=105_1_110 192741,5 322889,7 515631,2 0,808481 93,51535
OTM_SPF_32-104_0_0 28552,54 327924,8 76111,19 432588,6 0,678275 94,19363
PTB_SPF_16-31_0_0 299399,8 126666 426065,9 0,668048 94,86168
FPO_CAT_>0_0_0 376783,1 4529,408 381312,5 0,597877 95,45955
FPO_SPF_>0_0_0 128635,2 150675,8 279311 0,437944 95,8975
OTB_SPF_32-89_0_0 159239,3 92735,66 251975 0,395083 96,29258
OTB_FWS_>0_0_0 11027,46 231674,2 242701,6 0,380543 96,67312
FPN_SPF_>0_0_0 186298,1 32364,02 9,229405 218671,4 0,342864 97,01599
PTM_DEF_>=105_1_110 217706,9 217706,9 0,341352 97,35734
TBB_DEF_>=105_1_110 202658,8 202658,8 0,317758 97,6751
FYK_CAT_>0_0_0 163962,5 163962,5 0,257084 97,93218
OTB_CRU_>0_0_0 151512,3 353,9 151866,2 0,238118 98,1703
PTB_DEF_>=90_0_0 115243,9 115243,9 0,180696 98,35099
FPN_DEF_>0_0_0 96986,74 8240,231 105227 0,16499 98,51598
OTT_DEF_>=105_1_110 92634,5 92634,5 0,145246 98,66123
TBB_CRU_0_0_0 88592,94 88592,94 0,138909 98,80014
OTB_SPF_16-31_0_0 23654,18 39490,28 2553,523 65697,98 0,103011 98,90315
FWR_FWS_>0_0_0 64638,78 64638,78 0,10135 99,0045
FIF_0_0_0 16184,65 44941,47 61126,12 0,095842 99,10034
GNS_DEF_90-109_0_0 55139,84 119,8208 55259,66 0,086644 99,18699
FWR_SPF_>0_0_0 47419,2 47419,2 0,074351 99,26134
LLD_ANA_0_0_0 34782,26 3225,117 6982,299 44989,68 0,070541 99,33188
OTM_SPF_16-31_0_0 35118,46 530,05 35648,51 0,055895 99,38777
OTM_DEF_>=105_1_110 24295,13 7514,1 2278,718 1422,871 35510,82 0,055679 99,44345
GNS_SPF_110-156_0_0 32734,06 32734,06 0,051325 99,49478
LLS_FWS_0_0_0 8033,64 24558,06 32591,7 0,051102 99,54588
SSC_FWS_>0_0_0 32519,34 32519,34 0,050989 99,59687
MIS_CAT_0_0_0 28813,77 28813,77 0,045178 99,64205
LLS_CAT_0_0_0 9319,771 11220,35 6253,122 26793,24 0,04201 99,68406

87
GNS_ANA_>=157_0_0 16321,83 8767,885 25089,72 0,039339 99,7234
PTB_SPF_0_0_0 20216,92 20216,92 0,031699 99,75509
GNS_CAT_>0_0_0 20153,13 20153,13 0,031599 99,78669
PTB_DEF_<16_0_0 16938,19 16938,19 0,026558 99,81325
GTR_FWS_>0_0_0 2305,55 13531,41 15836,96 0,024831 99,83808
GNS_CRU_>0_0_0 13799 13799 0,021636 99,85972
OFG_SPF_0_0_0 12800 12800 0,02007 99,87979
OTB_DEF_<16_0_0 12011,21 12011,21 0,018833 99,89862
MIS_DEF_0_0_0 10747,01 10747,01 0,016851 99,91547
FPO_DEF_>0_0_0 4862,535 3334,943 48,72866 8246,207 0,01293 99,9284
LLS_SPF_0_0_0 7746,99 7746,99 0,012147 99,94055
FWR_CAT_>0_0_0 6590,555 6590,555 0,010334 99,95088
FPO_ANA_>0_0_0 402,5 5226,271 5628,771 0,008826 99,95971
OTB_SPF_16-104_0_0 4227,145 4227,145 0,006628 99,96634
FPN_ANA_>0_0_0 3826,565 3826,565 0,006 99,97234
PTB_FWS_>0_0_0 3279,575 3279,575 0,005142 99,97748
GTR_SPF_32-109_0_0 2643,775 2643,775 0,004145 99,98162
PVG_DEF_0_0_0 2251,565 2251,565 0,00353 99,98515
LLD_CAT_0_0_0 1774,25 1774,25 0,002782 99,98794
GTR_CAT_>0_0_0 1411,025 1411,025 0,002212 99,99015
LLD_FWS_0_0_0 950,075 950,075 0,00149 99,99164
OTT_CRU_90-104_0_0 911,6127 911,6127 0,001429 99,99307
FPN_FWS_>0_0_0 835,4993 835,4993 0,00131 99,99438
GTR_CRU_110-156_0_0 786,1778 786,1778 0,001233 99,99561
LLD_DEF_0_0_0 539,715 539,715 0,000846 99,99646
LHP_DEF_0_0_0 472,275 472,275 0,000741 99,9972
MIS_SPF_0_0_0 413,005 413,005 0,000648 99,99784
FPO_CRU_>0_0_0 401,7123 401,7123 0,00063 99,99847
GND_SPF_32-109_0_0 229,6 229,6 0,00036 99,99883
GND_DEF_110-156_0_0 176,82 176,82 0,000277 99,99911
TBB_SPF_16-104_0_0 140 140 0,00022 99,99933
OTT_DEF_90-104_0_0 136,2323 136,2323 0,000214 99,99954
OFG_DEF_0_0_0 85 85 0,000133 99,99968
OTB_CAT_0_0_0 69,95 69,95 0,00011 99,99979
OFG_CAT_0_0_0 55 55 8,62E-05 99,99987
GTR_DEF_90-109_0_0 37,44399 37,44399 5,87E-05 99,99993
LLD_SPF_0_0_0 22,6 22,6 3,54E-05 99,99997
OFG_FWS_0_0_0 20,7 20,7 3,25E-05 100

88
Table 7: Total effort subdivision 25-32 based on 2014 data from RDB FishFrame (per 18/08/2015). All métiers ordered by effort in days at sea. Shadowed lines show the métiers cumulating 90% of the total efforts in the fishing ground.
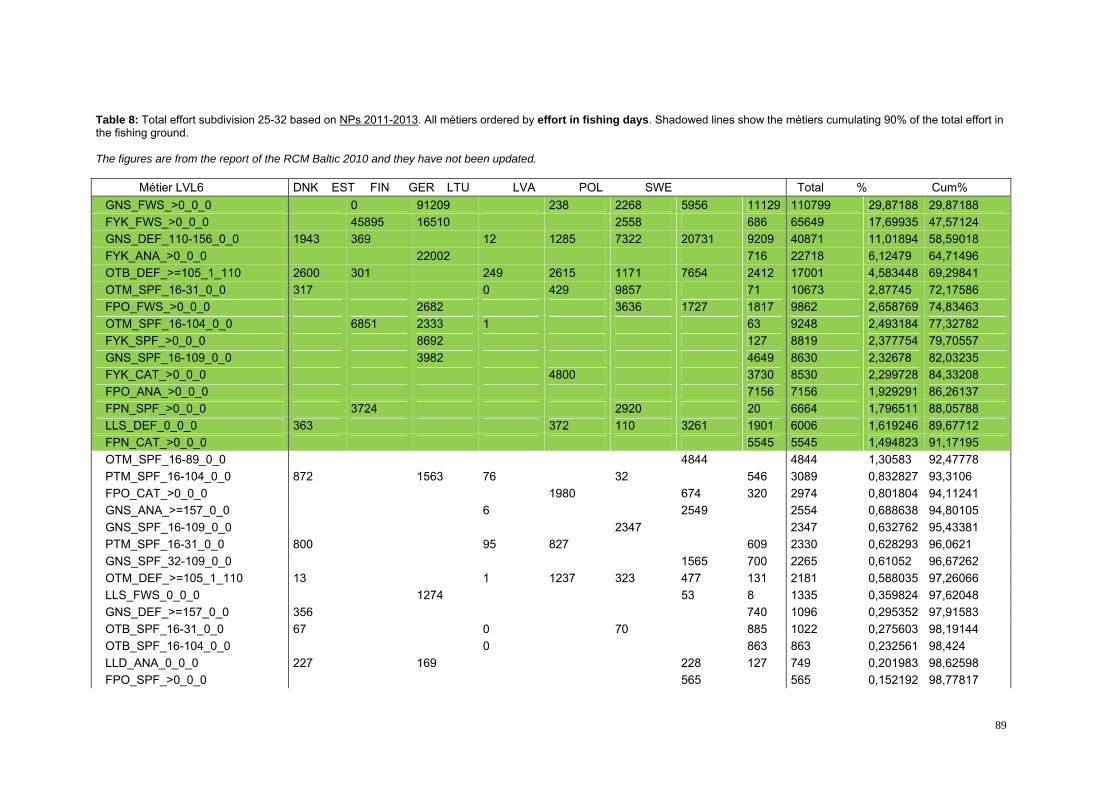
89
Table 8: Total effort subdivision 25-32 based on NPs 2011-2013. All métiers ordered by effort in fishing days. Shadowed lines show the métiers cumulating 90% of the total effort in the fishing ground. The figures are from the report of the RCM Baltic 2010 and they have not been updated.
Métier LVL6 DNK EST FIN GER LTU LVA POL SWE Total % Cum%
GNS_FWS_>0_0_0 0 91209 238 2268 5956 11129 110799 29,87188 29,87188
FYK_FWS_>0_0_0 45895 16510 2558 686 65649 17,69935 47,57124
GNS_DEF_110-156_0_0 1943 369 12 1285 7322 20731 9209 40871 11,01894 58,59018
FYK_ANA_>0_0_0 22002 716 22718 6,12479 64,71496
OTB_DEF_>=105_1_110 2600 301 249 2615 1171 7654 2412 17001 4,583448 69,29841
OTM_SPF_16-31_0_0 317 0 429 9857 71 10673 2,87745 72,17586
FPO_FWS_>0_0_0 2682 3636 1727 1817 9862 2,658769 74,83463
OTM_SPF_16-104_0_0 6851 2333 1 63 9248 2,493184 77,32782
FYK_SPF_>0_0_0 8692 127 8819 2,377754 79,70557
GNS_SPF_16-109_0_0 3982 4649 8630 2,32678 82,03235
FYK_CAT_>0_0_0 4800 3730 8530 2,299728 84,33208
FPO_ANA_>0_0_0 7156 7156 1,929291 86,26137
FPN_SPF_>0_0_0 3724 2920 20 6664 1,796511 88,05788
LLS_DEF_0_0_0 363 372 110 3261 1901 6006 1,619246 89,67712
FPN_CAT_>0_0_0 5545 5545 1,494823 91,17195
OTM_SPF_16-89_0_0 4844 4844 1,30583 92,47778
PTM_SPF_16-104_0_0 872 1563 76 32 546 3089 0,832827 93,3106
FPO_CAT_>0_0_0 1980 674 320 2974 0,801804 94,11241
GNS_ANA_>=157_0_0 6 2549 2554 0,688638 94,80105
GNS_SPF_16-109_0_0 2347 2347 0,632762 95,43381
PTM_SPF_16-31_0_0 800 95 827 609 2330 0,628293 96,0621
GNS_SPF_32-109_0_0 1565 700 2265 0,61052 96,67262
OTM_DEF_>=105_1_110 13 1 1237 323 477 131 2181 0,588035 97,26066
LLS_FWS_0_0_0 1274 53 8 1335 0,359824 97,62048
GNS_DEF_>=157_0_0 356 740 1096 0,295352 97,91583
OTB_SPF_16-31_0_0 67 0 70 885 1022 0,275603 98,19144
OTB_SPF_16-104_0_0 0 863 863 0,232561 98,424
LLD_ANA_0_0_0 227 169 228 127 749 0,201983 98,62598
FPO_SPF_>0_0_0 565 565 0,152192 98,77817

90
GND_ANA_>0_0_0 538 538 0,145081 98,92325
PTB_FWS_0_0_0 514 514 0,138577 99,06183
PTB_SPF_32-104_0_0 130 278 59 466 0,125681 99,18751
FPN_FWS_>0_0_0 345 345 0,092879 99,28039
OTB_SPF_32-104_0_0 11 0 302 3 316 0,085155 99,36554
FPO_DEF_>0_0_0 263 23 286 0,076972 99,44252
LLS_CAT_0_0_0 227 55 282 0,075894 99,51841
SDN_DEF_>=90_0_0 269 269 0,072524 99,59093
GTR_DEF_110-156_0_0 44 143 187 0,050416 99,64135
PTB_SPF_16-31_0_0 106 43 148 0,039969 99,68132
PTM_SPF_32-104_0_0 12 120 132 0,035588 99,71691
FPN_ANA_>0_0_0 127 127 0,034105 99,75101
LHP_FIF_0_0_0 19 104 123 0,033027 99,78404
GTR_DEF_>=157_0_0 105 1 106 0,028443 99,81248
GTR_FWS_>0_0_0 93 93 0,025073 99,83755
PTM_FWS_>0_0_0 68 68 0,018343 99,8559
PTB_SPF_16-104_0_0 39 20 59 0,015934 99,87183
GND_FWS_>0_0_0 58 58 0,01565 99,88748
PTB_DEF_>=105_1_110 14 40 54 0,014505 99,90199
FPN_DEF_>0_0_0 43 43 0,011593 99,91358
SB_FIF_0_0_0 39 39 0,010515 99,92409
OTM_SPF_32-104_0_0 34 34 0,009032 99,93312
OTT_DEF_>=105_1_110 33 33 0,008897 99,94202
PTB_DEF_>105_1_110 32 32 0,008627 99,95065
LLS_SPF_0_0_0 29 1 29 0,007819 99,95847
SDN_SPF_32-89_0_0 27 27 0,007145 99,96561
PTM_DEF_>=105_1_110 24 24 0,006578 99,97219
BTF_DEF_>105_1_110 20 20 0,005257 99,97745
PTB_SPF_16-104_0_0 17 17 0,004583 99,98203
PTM_SPF_32-89_0_0 15 15 0,004044 99,98607
OTM_SPF_32-89_0_0 13 13 0,003505 99,98958
PS_SPF_32-104_0_0 12 12 0,003235 99,99282
PVG_ANA_0_0_0 11 11 0,002831 99,99565
OTB_FWS_>=105_1_110 6 6 0,001618 99,99726
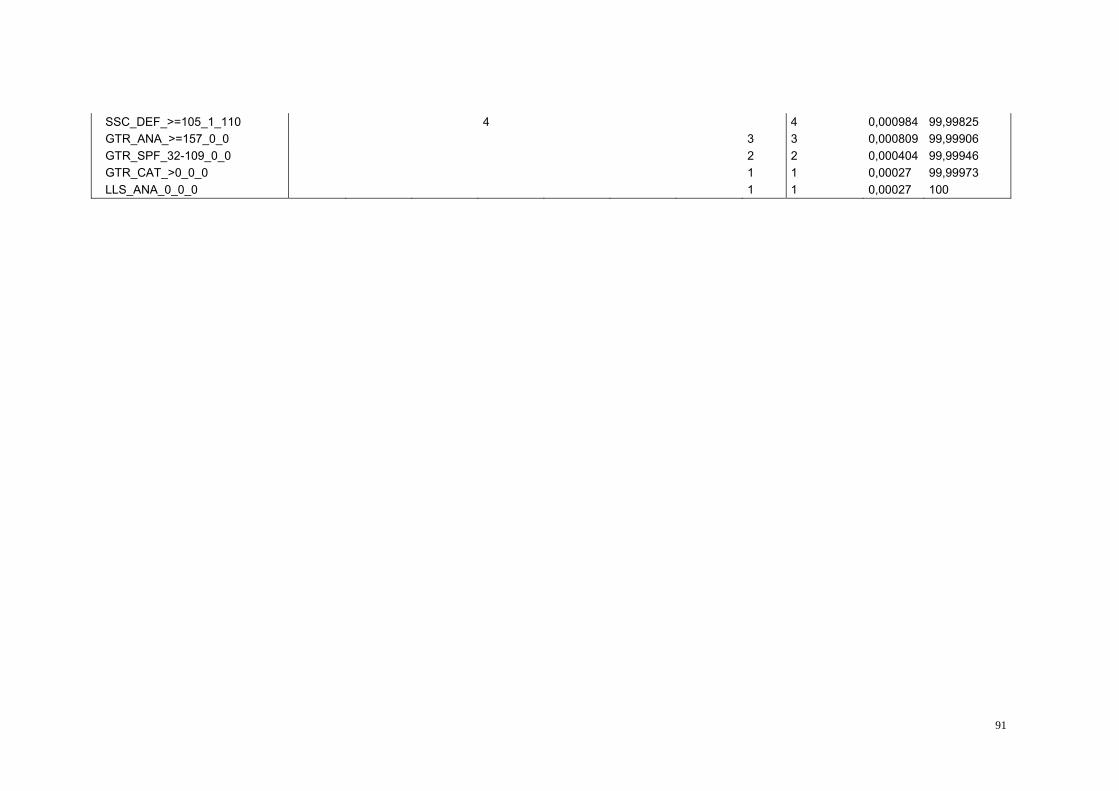
91
SSC_DEF_>=105_1_110 4 4 0,000984 99,99825
GTR_ANA_>=157_0_0 3 3 0,000809 99,99906
GTR_SPF_32-109_0_0 2 2 0,000404 99,99946
GTR_CAT_>0_0_0 1 1 0,00027 99,99973
LLS_ANA_0_0_0 1 1 0,00027 100

92
Table 9: Total landings subdivision 25-32 based on 2014 data from RDB FishFrame (per 18/08/2015). All métiers ordered by amount of landings in tonnes. Shadowed lines show the métiers cumulating 90% of the total landings in the fishing ground.

93
Table 10: Total landings subdivision 25-32 based on NPs 2011-2013. All métiers ordered by amount of landings in tonnes. Shadowed lines show the métiers cumulating 90% of the total amount of landings in the fishing ground. The figures are from the report of the RCM Baltic 2010 and they have not been updated.
Métier LVL6 DNK EST FIN GER LTU LVA POL SWE Total % Cum%
OTM_SPF_16-104_0_0 70622 71133 327 3684 145766 23,45397 23,45397
PTM_SPF_16-104_0_0 21018 26237 6972 177 52526 106930 17,20527 40,65924
OTM_SPF_16-31_0_0 4901 68 6120 79782 3617 94488 15,20324 55,86248
PTM_SPF_16-31_0_0 15540 6424 17063 52320 91346 14,69774 70,56021
OTM_SPF_16-89_0_0 68271 68271 10,98498 81,54519
OTB_DEF_>=105_1_110 6739 567 1718 1940 2148 8525 5988 27625 4,444881 85,99007
PTB_SPF_16-31_0_0 1667 10085 11752 1,890914 87,88099
GNS_DEF_110-156_0_0 811 301 26 223 2129 5401 1872 10763 1,731794 89,61278
FPN_SPF_>0_0_0 8288 1839 0 10127 1,629523 91,2423
OTB_SPF_16-31_0_0 1017 4 140 8650 9810 1,578492 92,8208
PTB_SPF_16-104_0_0 7655 56 47 7758 1,248219 94,06901
OTB_SPF_16-104_0_0 5 6498 6503 1,046296 95,11531
PTM_SPF_32-104_0_0 247 5887 6134 0,987 96,10231
FYK_SPF_>0_0_0 5077 2 5079 0,81717 96,91948
GNS_FWS_>0_0_0 907 1848 1 29 423 232 3440 0,55344 97,47292
OTM_DEF_>=105_1_110 92 7 920 451 722 695 2887 0,464467 97,93739
LLS_DEF_0_0_0 114 56 2 1291 661 2124 0,341812 98,2792
FYK_FWS_>0_0_0 1327 516 15 6 1864 0,299893 98,57909
PTB_SPF_32-104_0_0 1179 379 6 1564 0,251611 98,8307
GNS_SPF_16-109_0_0 233 108 856 1197 0,192604 99,02331
OTB_SPF_32-104_0_0 67 3 952 17 1039 0,167157 99,19047
FPO_SPF_>0_0_0 866 866 0,139373 99,32984
PTB_FWS_0_0_0 865 865 0,139187 99,46903
FYK_ANA_>0_0_0 514 12 526 0,08471 99,55374
FPO_FWS_>0_0_0 46 150 144 18 359 0,057709 99,61144
PTB_DEF_>=105_1_110 60 250 6 316 0,050916 99,66236
FPN_CAT_>0_0_0 215 215 0,034639 99,697
OTM_SPF_32-104_0_0 207 207 0,033252 99,73025
GNS_DEF_>=157_0_0 121 74 194 0,031275 99,76153
FPO_ANA_>0_0_0 194 194 0,031182 99,79271

94
GNS_SPF_32-109_0_0 168 13 180 0,029001 99,82171
LLD_ANA_0_0_0 33 35 48 59 175 0,028099 99,84981
PTM_FWS_>0_0_0 136 136 0,021858 99,87167
PTM_DEF_>=105_1_110 100 100 0,016069 99,88774
GND_ANA_>0_0_0 81 81 0,013076 99,90081
SSC_DEF_>=105_1_110 76 76 0,012307 99,91312
GNS_ANA_>=157_0_0 0 75 75 0,012134 99,92525
SDN_DEF_>=90_0_0 71 71 0,011424 99,93668
OTT_DEF_>=105_1_110 63 63 0,010167 99,94684
PS_SPF_32-104_0_0 62 62 0,010001 99,95684
GTR_DEF_>=157_0_0 49 0 49 0,007914 99,96476
FYK_CAT_>0_0_0 10 34 44 0,007071 99,97183
OTM_SPF_32-89_0_0 35 35 0,005553 99,97738
SB_FIF_0_0_0 31 31 0,004978 99,98236
PTM_SPF_32-89_0_0 23 23 0,003716 99,98608
FPN_FWS_>0_0_0 15 15 0,0024 99,98848
LHP_FIF_0_0_0 3 11 13 0,00212 99,9906
FPO_CAT_>0_0_0 4 5 4 13 0,002106 99,9927
LLS_FWS_0_0_0 8 2 0 10 0,001645 99,99435
GTR_DEF_110-156_0_0 5 4 9 0,001442 99,99579
FPO_DEF_>0_0_0 8 1 8 0,00132 99,99711
OTB_FWS_>=105_1_110 4 4 0,000662 99,99777
LLS_CAT_0_0_0 4 0 4 0,000641 99,99841
FPN_ANA_>0_0_0 2 2 0,000375 99,99879
FPN_DEF_>0_0_0 2 2 0,000301 99,99909
LLS_SPF_0_0_0 2 0 2 0,000263 99,99935
GTR_FWS_>0_0_0 2 2 0,000243 99,99959
SDN_SPF_32-89_0_0 1 1 0,000166 99,99976
BTF_DEF_>105_1_110 1 1 0,000121 99,99988
PVG_ANA_0_0_0 1 1 0,00012 100

Table 11: Total value subdivision 25-32 based on 2014 data from RDB FishFrame (per 18/08/2015). All métiers ordered by value of landings in thousand €. Shadowed lines show the métiers cumulating 90% of the total values in the fishing ground.

96
Table 12: Total value subdivision 25-32 based on NPs 2011-2013. All métiers ordered by value of landings in €. Shadowed lines show the métiers cumulating 90% of the total values in the fishing ground. The figures are from the report of the RCM Baltic 2010 and they have not been updated.
Métier LVL6 DNK EST FIN GER LTU LVA POL SWE Total %Cum
%
OTB_DEF_>=105_1_110 7791887 382639 2034052 2358694 2353134 7249108 9014508 31184023 17,7065 17,7065
OTM_SPF_16-104_0_0 11467990 10446273 54904 681208 2265037412,8
6130,5676
PTM_SPF_16-104_0_0 3058594 3584747 1064469 31342 9222676 169618279,63
140,1986
PTB_FWS_0_0_0 16869438 168694389,57
8649,7772
PTM_SPF_16-31_0_0 2207658 1081735 2694300 8950165 149338588,47
9558,2567
OTM_SPF_16-31_0_0 682817 11609 827010 12566117 624850 147124038,35
3866,6105
OTM_SPF_16-89_0_0 12725270 127252707,22
5573,836
GNS_DEF_110-156_0_0 1021333 199728 29885 324200 2882742 5006143 2777940 122419726,95
1180,7871
GNS_FWS_>0_0_0 1195478 4263549 942 19313 676646 1042154 71980824,08
7184,8742
OTM_DEF_>=105_1_110 86065 8672 1326926 631088 934195 1054986 40419332,29
587,1693
LLS_DEF_0_0_0 152220 82550 3901 1627602 996659 28629321,62
5688,7949
PTB_SPF_16-31_0_0 210854 1554125 17649801,00
2289,797
OTB_SPF_16-31_0_0 172493 454 20999 1500782 16947280,96
2390,7593
FPN_SPF_>0_0_0 1275065 332272 302 16076390,91
2891,6721
OTB_SPF_16-104_0_0 800 1371013 13718130,77
8992,4511
FYK_ANA_>0_0_0 1303164 42289 13454530,76
493,215
FYK_FWS_>0_0_0 862171 452286 7780 13816 13360530,75
8693,9736
PTM_SPF_32-104_0_0 95014 1240635 13356490,75
8494,732
FPN_CAT_>0_0_0 1325678 13256780,75
2795,4848
PTB_SPF_16-104_0_0 1164364 10190 11207 11857610,67
3396,158

97
FYK_SPF_>0_0_0 825260 37769 863029 0,49 96,6481
LLD_ANA_0_0_0 153090 139650 241823 213809 7483710,42
4997,073
FPO_ANA_>0_0_0 640151 6401510,36
3597,4365
PTB_SPF_32-104_0_0 386530 114370 1468 5023680,28
5297,7217
FPO_FWS_>0_0_0 49293 116577 213585 40762 4202180,23
8697,9603
FYK_CAT_>0_0_0 163722 217547 3812690,21
6598,1768
PTB_DEF_>=105_1_110 81876 281246 3631220,20
6298,383
GNS_ANA_>=157_0_0 0 354835 3548350,20
1598,5845
GNS_DEF_>=157_0_0 170717 142693 3134110,17
898,7625
GNS_SPF_16-109_0_0 36932 24661 230547 2921400,16
5998,9283
FPN_FWS_>0_0_0 262223 2622230,14
8999,0772
GND_ANA_>0_0_0 257326 2573260,14
6199,2233
OTB_SPF_32-104_0_0 20893 707 207371 2630 2316010,13
1599,3548
FPO_SPF_>0_0_0 213585 2135850,12
1399,4761
FPO_CAT_>0_0_0 65489 46984 20469 1329420,07
5599,5516
SSC_DEF_>=105_1_110 126094 1260940,07
1699,6232
PTM_DEF_>=105_1_110 120662 1206620,06
8599,6917
OTT_DEF_>=105_1_110 95983 959830,05
4599,7462
GNS_SPF_32-109_0_0 78066 3099 811650,04
6199,7923
SB_FIF_0_0_0 59040 590400,03
3599,8258
GTR_DEF_>=157_0_0 56371 157 565290,03
2199,8579
PTM_FWS_>0_0_0 36431 364310,02
0799,8786
OTM_SPF_32-104_0_0 35267 35267 0,02 99,8986

98
LLS_CAT_0_0_0 28746 1258 300040,01
799,9157
SDN_DEF_>=90_0_0 21775 217750,01
2499,928
LHP_FIF_0_0_0 5102 16086 211880,01
299,9401
LLS_FWS_0_0_0 9560 9478 121 191590,01
0999,9509
PS_SPF_32-104_0_0 15326 153260,00
8799,9596
OTM_SPF_32-89_0_0 12809 128090,00
7399,9669
FPO_DEF_>0_0_0 9830 977 108070,00
6199,973
GTR_DEF_110-156_0_0 4597 5250 98470,00
5699,9786
FPN_ANA_>0_0_0 8199 81990,00
4799,9833
PTM_SPF_32-89_0_0 6749 67490,00
3899,9871
OTB_FWS_>=105_1_110 6012 60120,00
3499,9905
PTB_DEF_>105_1_110 5650 56500,00
3299,9937
FPN_DEF_>0_0_0 3425 34250,00
1999,9957
LLS_SPF_0_0_0 2877 28 29050,00
1699,9973
GTR_FWS_>0_0_0 2482 24820,00
1499,9988
PVG_ANA_0_0_0 797 7970,00
0599,9992
GND_FWS_>0_0_0 780 7800,00
0499,9996
GTR_CAT_>0_0_0 202 2020,00
0199,9998
BTF_DEF_>105_1_110 198 1980,00
0199,9999
LLS_ANA_0_0_0 102 1020,00
0199,9999
GTR_ANA_>=157_0_0 54 54 0 100
SDN_SPF_32-89_0_0 49 49 0 100
GTR_SPF_32-109_0_0 18 18 0 100

Table 13: The métiers selected by the two ranking methods, fishing ground 22-24 – data from FishFrame (per 23/08/2015)
Métier LVL6 FF - selected, Days at sea
NP - selected, Days at sea
FF - selected, Landing weight
NP - selected, Landing weight
FF - selected, Landing
value
NP - selected, Landing
value
OTB_DEF_>=105_1_120 YES YES YES YES YES YES
PTM_SPF_32-104_0_0 YES YES YES YES
GNS_DEF_110-156_0_0 YES YES YES YES YES YES
GNS_SPF_32-109_0_0 YES YES YES YES YES YES
GNS_FWS_>0_0_0 YES YES YES YES YES YES
GNS_DEF_>=157_0_0 YES YES YES YES YES YES
OTB_DEF_90-104_0_0 YES YES YES YES YES
MIS_MIS_0_0_0 YES YES YES
FPO_FWS_>0_0_0 YES YES YES YES YES
LLS_DEF_0_0_0 YES YES YES
GTR_DEF_110-156_0_0 YES YES YES YES
LLS_CAT_0_0_0 YES
PTM_SPF_16-31_0_0 YES YES YES YES
PTM_DEF_<16_0_0 YES YES
OTM_SPF_32-104_0_0 YES YES YES YES
PTM_SPF_32-89_0_0 YES YES YES YES
OTM_SPF_16-31_0_0 YES YES YES YES YES
FYK_SPF_>0_0_0 YES
PTB_SPF_32-104_0_0 YES YES YES
PTB_SPF_16-31_0_0 YES
PTB_SPF_32-89_0_0 YES YES
PTB_DEF_<16_0_0
OTM_SPF_16-104_0_0
FPN_CAT_>0_0_0 YES YES YES
PTB_DEF_>=105_1_120 YES YES YES
SDN_DEF_>=105_1_120 YES YES YES YES
OTM_DEF_>=105_1_120 YES
OTT_DEF_>=105_1_120 YES
OTM_SPF_32-89_0_0 YES YES YES
No_logbook6
FYK_CAT_>0_0_0 YES
No_Matrix6
FPN_SPF_>0_0_0 YES
FPO_SPF_>0_0_0
OTB_FWS_>0_0_0
PTB_DEF_90-104_0_0
OTB_SPF_32-104_0_0 YES YES
OTB_DEF_>=120_0_0 YES
FPN_FWS_>0_0_0

100
LLD_ANA_0_0_0
GNS_ANA_>=157_0_0
FPN_DEF_>0_0_0 YES
OTB_SPF_16-31_0_0
LLS_FWS_0_0_0
OTM_DEF_<16_0_0
FPO_ANA_>0_0_0
FPO_CAT_>0_0_0 YES YES
PTB_FWS_>0_0_0
LHP_FIF_0_0_0
FPO_DEF_>0_0_0
GTR_DEF_>=157_0_0 YES YES
Table 14: The métiers selected by the two ranking methods, fishing ground 25-32 - data from RDB FishFrame (per 23/08/2015).
Métier LVL6 FF - selected, Days at sea
NP - selected, Days at sea
FF - selected, Landing weight
NP - selected, Landing weight
FF - selected, Landing
value
NP - selected, Landing
value
OTB_DEF_>=105_1_120 YES YES YES YES YES YES
OTM_SPF_16-104_0_0 YES YES YES YES YES YES
OTM_SPF_16-31_0_0 YES YES YES YES YES YES
GNS_DEF_110-156_0_0 YES YES YES YES
GNS_FWS_>0_0_0 YES YES YES YES
FYK_FWS_>0_0_0 YES YES YES YES
FYK_ANA_>0_0_0 YES YES YES
FYK_SPF_>0_0_0 YES YES YES YES
FPO_FWS_>0_0_0 YES YES
GNS_SPF_16-109_0_0 YES YES YES
FPN_CAT_>0_0_0 YES YES
FPO_ANA_>0_0_0 YES YES YES
FYK_CAT_>0_0_0 YES YES
PTM_SPF_16-31_0_0 YES YES YES YES YES
PTM_SPF_16-104_0_0 YES YES YES YES YES
FPN_SPF_>0_0_0 YES YES YES YES
OTM_SPF_32-104_0_0 YES
PTM_SPF_<16_0_0
MIS_MIS_0_0_0
OTT_DEF_>=105_1_120
PTB_FWS_>0_0_0 YES YES YES
OTB_SPF_16-104_0_0 YES YES YES
OTM_SPF_32-89_0_0 YES YES YES
GNS_SPF_32-109_0_0 YES
GTR_DEF_110-156_0_0
LLS_DEF_0_0_0 YES YES
OTM_DEF_>=105_1_120 YES YES
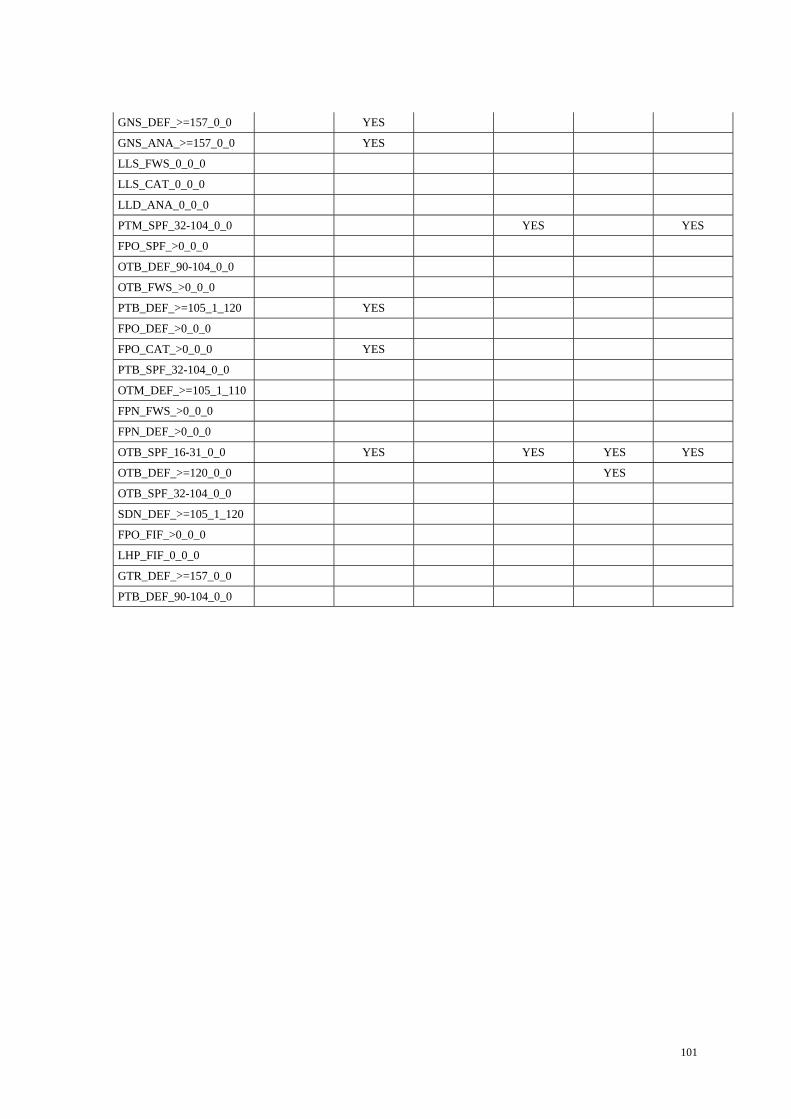
101
GNS_DEF_>=157_0_0 YES
GNS_ANA_>=157_0_0 YES
LLS_FWS_0_0_0
LLS_CAT_0_0_0
LLD_ANA_0_0_0
PTM_SPF_32-104_0_0 YES YES
FPO_SPF_>0_0_0
OTB_DEF_90-104_0_0
OTB_FWS_>0_0_0
PTB_DEF_>=105_1_120 YES
FPO_DEF_>0_0_0
FPO_CAT_>0_0_0 YES
PTB_SPF_32-104_0_0
OTM_DEF_>=105_1_110
FPN_FWS_>0_0_0
FPN_DEF_>0_0_0
OTB_SPF_16-31_0_0 YES YES YES YES
OTB_DEF_>=120_0_0 YES
OTB_SPF_32-104_0_0
SDN_DEF_>=105_1_120
FPO_FIF_>0_0_0
LHP_FIF_0_0_0
GTR_DEF_>=157_0_0
PTB_DEF_90-104_0_0

102
Table 15: Rankings Comparison for 2012-2014. Top 10 Métiers in 2012-2014- Effort (days at sea) in SD 22-24 - data from RDB FishFrame (per 18/08/2015).
Top 10 métiers Days at sea Position in ranking
2012‐2014 2012 2013 2014 2012 2013 2014
GNS_DEF_110‐156_0_0 39 567 38 010 37 314 1 1 1
GNS_FWS_>0_0_0 17 774 17 357 19 969 2 2 2
MIS_MIS_0_0_0 9 656 10 050 9 977 4 3 3
OTB_DEF_>=105_1_120 10 102 8 731 8 221 3 5 5
GNS_SPF_32‐109_0_0 9 503 8 740 8 558 5 4 4
GTR_DEF_110‐156_0_0 8 940 3 158 2 718 6 8 8
FPO_FWS_>0_0_0 3 580 4 067 3 862 7 6 7
GNS_DEF_>=157_0_0 3 444 3 764 4 185 8 7 6
LLS_CAT_0_0_0 2 128 1 969 2 100 9 9 9
LLS_DEF_0_0_0 1 442 1 525 833 10 10 15 Table 16: Rankings Comparison for 2012-2014. Top 10 Métiers in 2012-2014 – Effort (days at sea) in SD 25-32 - - data from RDB FishFrame (per 18/08/2015).
Top 10 métiers Days at sea Position in ranking
2012‐2014 2012 2013 2014 2012 2013 2014
GNS_FWS_>0_0_0 108 944 111 139 102 303 1 1 1
GNS_DEF_110‐156_0_0 35 084 34 129 34 923 2 2 2
FYK_FWS_>0_0_0 21 453 24 979 27 224 4 3 3
OTB_DEF_>=105_1_120 23 835 18 432 15 502 3 4 5
FYK_ANA_>0_0_0 19 562 17 580 16 809 5 5 4
OTM_SPF_16‐104_0_0 11 674 12 949 9 298 6 6 7
OTM_SPF_16‐31_0_0 10 243 10 590 9 461 7 7 6
FYK_SPF_>0_0_0 7 590 8 120 7 402 8 8 8
GNS_SPF_16‐109_0_0 7 181 7 318 7 159 9 9 9
FPO_FWS_>0_0_0 4 415 4 657 5 879 10 10 10

103
Table 17: Rankings Comparison for 2012-2014. Top 10 Métiers in 2012-2014 - Landings (tonnes) in SD 22-24 - data from RDB FishFrame (per 18/08/2015).
Top 10 métiers Landing weight (tonnes) Position in ranking
2012‐2014 2012 2013 2014 2012 2013 2014
OTB_DEF_>=105_1_120 13 122 11 222 10 799 1 2 1
PTM_SPF_32‐104_0_0 9 020 12 326 8 400 2 1 2
GNS_SPF_32‐109_0_0 5 393 5 831 4 251 4 4 4
GNS_DEF_110‐156_0_0 5 543 5 176 4 634 3 5 3
PTM_SPF_16‐31_0_0 5 280 6 616 2 420 5 3 7
OTM_SPF_32‐104_0_0 3 002 3 896 3 450 7 6 5
OTM_SPF_16‐104_0_0 4 213 3 190 NA 6 7 NA
GNS_FWS_>0_0_0 1 882 2 244 2 479 9 8 6
OTM_SPF_16‐31_0_0 2 935 811 704 8 21 17
PTM_DEF_<16_0_0 1 046 1 862 1 411 16 9 10
Table 18: Rankings Comparison for 2012-2014. Top 10 Métiers in 2012-2014– Landings (tonnes) in SD 25-32 - data from RDB FishFrame (per 18/08/2015).
Top 10 métiers Landing weight (tonnes) Position in ranking
2012‐2014 2012 2013 2014 2012 2013 2014
OTM_SPF_16‐104_0_0 176 539 202 545 219 748 1 1 1
OTM_SPF_16‐31_0_0 119 630 140 376 127 284 2 2 2
OTB_DEF_>=105_1_120 37 654 30 990 29 284 4 3 4
PTM_SPF_16‐104_0_0 40 895 30 581 24 644 3 4 5
PTM_SPF_16‐31_0_0 23 473 27 852 35 926 5 5 3
OTM_SPF_32‐104_0_0 19 060 16 534 22 243 6 6 6
FPN_SPF_>0_0_0 8 729 9 798 11 208 8 7 7
GNS_DEF_110‐156_0_0 9 318 7 537 6 509 7 9 10
FYK_SPF_>0_0_0 7 188 6 015 8 530 9 11 8
MIS_MIS_0_0_0 6 405 6 182 6 544 10 10 9

104
Table 19: Rankings Comparison for 2012-2014. Top 10 Métiers in 2012-2014 - Value (thousand €) in SD 22-24 - data from RDB FishFrame (per 18/08/2015). op 10 méties Landing value (k €) Position in ranking
2012‐201 2012 2013 2014 2012 2013 2014
OTB_DEF_>=105_1_120 13 898 10 776 9 908 1 1 1
GNS_DEF_110‐156_0_0 996 6 514 6 144 2 2 2
PTM_SPF_32‐104_0_0 3 632 4 857 2 914 3 3 3
MIS_MIS_0_0_0 3 059 144 2 739 4 4
S_DEF_>=57_0_0 2 640 2 583 2 755 5 6 4
GNS_SPF_32‐109_0_0 2 515 2 832 1 996 6 5 7
GNS_FWS_>0_0_0 2 207 2 267 2 365 7 7 6
FPN_CAT_>0_0_0 2 045 1 711 1 176 8 9 9
PTM_SPF_16‐31_0_0 1 339 2 031 554 9 8 12
OTB_DEF_90‐104_0_0 792 936 1 223 12 10 8 Table 20: Rankings Comparison for 2012-2014. Top 10 Métiers in 2012-2014- Value (thousand €) in SD 25-32 in thousand € - data from
Top 10 métiers Landing value (k €) Position in ranking
2012‐2014 2012 2013 2014 2012 2013 2014
OTM_SPF_16‐104_0_0 35 68 5 855 45 997 1 1 1
OTM_SPF_16‐30_0 16 854 19 725 22 264 3 2 2
OTB_DEF_>=105_1_120 23 965 12 751 10 114 2 3 3
PTM_SPF_16‐104_0_0 10 959 9 015 5 231 4 4 6
GNS_FWS_>0_0_0 7 199 8 041 8 750 5 5 4
PTM_SPF_16‐31_0_0 3 398 6 936 7 733 8 6 5
PTB_FWS_>0_0_0 6 764 5 505 5 216 6 7 7
FYK_FWS_>0_0_0 2 204 3 488 3 670 10 8 8
FPN_SPF_>0_0_0 1 975 2 295 2 540 12 9 9
OTT_DEF_>=105_1_120 3 807 2 058 799 7 11 19

105
Annex 3: Updated métier list for the Baltic region per 28/08/2015
Metiers marked with red should not be used in the Baltic region according to the metier description in the FF lookup tables. Next to the table
there is information on which MSs are using it and a suggestion which metier should be used instead. Metiers marked with yellow were
considered to be modified (merged). Next to the table there is a suggestion of the new (merged) metier codes and applicable areas.
Métier Applicable in (according to FF lookup tables)
FPN_ANA_>0_0_0 22‐32
FPN_CAT_>0_0_0 22‐32
FPN_DEF_>0_0_0 22‐32
FPN_FWS_>0_0_0 22‐32
FPN_SPF_>0_0_0 22‐32
FPO_ANA_>0_0_0 22‐32
FPO_CAT_>0_0_0 22‐32
FPO_DEF_>0_0_0 22‐32
FPO_FWS_>0_0_0 22‐32
FPO_SPF_>0_0_0 22‐32
FYK_ANA_>0_0_0 22‐32
FYK_CAT_>0_0_0 22‐32
FYK_FWS_>0_0_0 22‐32
FYK_SPF_>0_0_0 22‐32
GNS_ANA_>=157_0_0 22‐32
GNS_ANA_110‐156_0_0
GNS_CAT_>0_0_0 22‐32
GNS_DEF_>=157_0_0 22‐32
GNS_DEF_>=220_0_0 I,II,IIIa,V,VI,VII Latvia GNS_DEF_>=157_0_0
GNS_DEF_110‐156_0_0 22‐32
GNS_DEF_90‐109_0_0 22‐23
GNS_FWS_>0_0_0 22‐32
GNS_SPF_>=157_0_0 22‐32
GNS_SPF_110‐156_0_0 22‐32
GNS_SPF_16‐109_0_0 28‐32 GNS_SPF_16‐109_0_0
22‐32 GNS_SPF_32‐109_0_0 22‐27
GTR_DEF_>=157_0_0 22‐32
GTR_DEF_110‐156_0_0 22‐32
GTR_FWS_>0_0_0 22‐32
GTR_SPF_32‐109_0_0 22‐27
LHP_FIF_0_0_0 22‐32
LLD_ANA_0_0_0 22‐32 BEFORE 2008
LLS_ANA_0_0_0 22‐32
LLS_CAT_0_0_0 22‐32
LLS_DEF_0_0_0 22‐32
LLS_FWS_0_0_0 22‐32
LLS_SPF_0_0_0 22‐32
MIS_MIS_0_0_0

106
OTB_CRU_>0_0_0 22‐32
OTB_DEF_<16_0_0 22+ 24‐32
OTB_DEF_>=105_1_120 22‐32
OTB_DEF_>=120_0_0 I,II,IIIa,IVa,IVb,IVc,VIId Lithuania, Sweden OTB_DEF_>=105_1_120
OTB_DEF_90‐104_0_0 22‐23
OTB_FWS_>0_0_0 22‐32
OTB_SPF_>=120_0_0
OTB_SPF_16‐104_0_0 28‐32 OTB_SPF_16‐31_0_0 22+ 24‐32 OTB_SPF_16‐31_0_0 22+ 24‐27
OTB_SPF_32‐104_0_0 24‐27 OTB_SPF_32‐104_0_0 22+ 24‐32 OTB_SPF_32‐89_0_0 22
OTM_DEF_<16_0_0 22‐32
OTM_DEF_>=105_1_110 22‐32
OTM_DEF_>=105_1_120 22‐32
OTM_DEF_>=120_0_0 I,II Lithuania OTM_DEF_>=105_1_120
OTM_FWS_>0_0_0
OTM_SPF_16‐104_0_0 28‐32 OTM_SPF_16‐31_0_0 22‐32 OTM_SPF_16‐31_0_0 22‐27
OTM_SPF_32‐104_0_0 24‐27 OTM_SPF_32‐104_0_0 22‐32 OTM_SPF_32‐89_0_0 22‐23
OTT_DEF_>=105_1_120 22‐32
OTT_DEF_>=120_0_0 IIa,IIIa,IVa,IVb,Ivc,V,VI,VII Sweden OTT_DEF_>=105_1_120
PS_SPF_16‐31_0_0 22‐27
PTB_DEF_<16_0_0 22‐32
PTB_DEF_>=105_1_120 22‐32
PTB_DEF_90‐104_0_0 22‐23
PTB_FWS_>0_0_0 22‐32
PTB_SPF_16‐104_0_0 28‐32 PTB_SPF_16‐31_0_0 22‐32 PTB_SPF_16‐31_0_0 22‐27
PTB_SPF_32‐104_0_0 24‐27 PTB_SPF_32‐104_0_0 22‐32 PTB_SPF_32‐89_0_0 22‐23
PTM_DEF_<16_0_0 22‐32
PTM_DEF_>=105_1_120 22‐32
PTM_FWS_>0_0_0 22‐32
PTM_SPF_16‐104_0_0 28‐32 PTM_SPF_16‐31_0_0 22‐32 PTM_SPF_16‐31_0_0 22‐27
PTM_SPF_32‐104_0_0 24‐27 PTM_SPF_32‐104_0_0 22‐32 PTM_SPF_32‐89_0_0 22‐23
SB_FIF_>0_0_0 22‐32
SDN_DEF_>=105_1_110 22‐32
SDN_DEF_>=105_1_120 22‐32
SSC_DEF_>=105_1_120 22‐32
SSC_FWS_>0_0_0

107
Annex 4: Ranking of species
Table 1: Total landings (tonnes) for the species in the Baltic region in 2014. Data from RDB FishFrame (per 27/08/2015).
Species (Scientific name) Species Official Landing Catch Weight (t) % Cum %
Clupea harengus Atlantic herring 276 054 47,01 47,01
Sprattus sprattus European sprat 221 799 37,77 84,78
Gadus morhua Atlantic cod 38 809 6,61 91,39
Platichthys flesus European flounder 19 578 3,33 94,72
Ammodytes sp. Sandeels 5 986 1,02 95,74
Perca fluviatilis European perch 4 232 0,72 96,46
Osmerus eperlanus European smelt 2 593 0,44 96,90
Rutilus rutilus Roach 2 248 0,38 97,29
Coregonus albula Vendace 2 108 0,36 97,64
Abramis brama Freshwater bream 2 084 0,35 98,00
Pleuronectes platessa European plaice 2 020 0,34 98,34
Osteichthyes Bony fishes 1 458 0,25 98,59
Limanda limanda Common dab 1 237 0,21 98,80
Sander lucioperca Pike‐perch 1 187 0,20 99,00
Coregonus lavaretus European whitefish 855 0,15 99,15
Merlangius merlangus Whiting 752 0,13 99,28
Anguilla anguilla European eel 579 0,10 99,38
Salmo salar Atlantic salmon 578 0,10 99,47
Esox lucius Northern pike 447 0,08 99,55
Belone belone Garfish 401 0,07 99,62
Cyclopterus lumpus Lumpfish(=Lumpsucker) 319 0,05 99,67
Trachurus trachurus Atlantic horse mackerel 277 0,05 99,72
Scophthalmus maximus Turbot 254 0,04 99,76
Salmo trutta Brown trout 212 0,04 99,80
Vimba vimba Vimba bream 145 0,02 99,82
Pollachius virens Saithe(=Pollock) 135 0,02 99,85
Neogobius melanostomus Round goby 131 0,02 99,87
Carassius gibelio Prussian carp 88 0,01 99,88
Myoxocephalus scorpius Bullhead 78 0,01 99,90
Pelecus cultratus Sichel 74 0,01 99,91
Lota lota Burbot 64 0,01 99,92
Zoarces viviparus Eelpout 49 0,01 99,93
Solea solea Common sole 48 0,01 99,94
Engraulis encrasicolus European anchovy 46 0,01 99,95
Leuciscus idus Orfe(=Ide) 44 0,01 99,95
Gymnocephalus cernuus Ruffe 37 0,01 99,96
Carassius carassius Crucian carp 33 0,01 99,97
Blicca bjoerkna White bream 32 0,01 99,97

108
Scophthalmus rhombus Brill 28 0,00 99,98
Palaemon adspersus Baltic prawn 26 0,00 99,98
Abramis bjoerkna White bream 20 0,00 99,98
Scomber scombrus Atlantic mackerel 16 0,00 99,99
Tinca tinca Tench 16 0,00 99,99
Gasterosteidae sp. Sticklebacks 12 0,00 99,99
Gobiidae sp. true gobies 8 0,00 99,99
Oncorhynchus mykiss Rainbow trout 7 0,00 99,99
Microstomus kitt Lemon sole 5 0,00 99,99
Hippoglossoides platessoides Amer. plaice(Long rough dab) 4 0,00 99,99
Aspius aspius Asp 4 0,00 100,00
Scardinius erythrophthalmus Rudd 3 0,00 100,00
Carcinus maenas Green crab 3 0,00 100,00
Homarus gammarus European lobster 3 0,00 100,00
Melanogrammus aeglefinus Haddock 2 0,00 100,00
Mugilidae Mullets 2 0,00 100,00
Silurus glanis Sheatfish 2 0,00 100,00
Molva molva Ling 2 0,00 100,00
Nephrops norvegicus Norway lobster 1 0,00 100,00
Cottidae Bullheads/sculpins 1 0,00 100,00
Cyprinus carpio European carp 1 0,00 100,00
Myoxocephalus quadricornis Fourhorn sculpin 1 0,00 100,00
Anarhichas sp. Wolffish 1 0,00 100,00
Mugil cephalus Flathead grey mullet 1 0,00 100,00
Cancer pagurus Edible crab 1 0,00 100,00
Chelon labrosus Thicklip grey mullet 1 0,00 100,00
Gasterosteus aculeatus Three‐spined stickleback 0 0,00 100,00
Lycodes vahlii Vahl's eelpout 0 0,00 100,00
Anarhichas lupus Wolf‐fish 0 0,00 100,00
Lampetra fluviatilis River lamprey 0 0,00 100,00
Pollachius pollachius Pollack 0 0,00 100,00
Merluccius merluccius European hake 0 0,00 100,00
Glyptocephalus cynoglossus Witch flounder 0 0,00 100,00
Alosa fallax Twaite shad 0 0,00 100,00
Alburnus alburnus bleak 0 0,00 100,00
Pandalus borealis Northern prawn 0 0,00 100,00
Chelidonichthys lucerna Tub gurnard 0 0,00 100,00
Lophius piscatorius Anglerfish 0 0,00 100,00
Triglopsis quadricornis Fourhorn sculpin 0 0,00 100,00
Ammodytes tobianus Small sandeel 0 0,00 100,00
Trachinus draco Greater weever 0 0,00 100,00
Hippoglossus hippoglossus Atlantic halibut 0 0,00 100,00
Eutrigla gurnardus Grey gurnard 0 0,00 100,00
Labrus bergylta Ballan wrasse 0 0,00 100,00

109
Leuciscus leuciscus Common Dace 0 0,00 100,00
Rajidae rays and skates 0 0,00 100,00
Thymallus thymallus Grayling 0 0,00 100,00
Dicentrarchus labrax European seabass 0 0,00 100,00
Acipenser sturio Sturgeon 0 0,00 100,00
Mullus surmuletus Striped red mullet 0 0,00 100,00
Reinhardtius hippoglossoides Greenland halibut 0 0,00 100,00
Cephalopoda sp. Octopus and squids 0 0,00 100,00
Brosme brosme Tusk(=Cusk) 0 0,00 100,00
Total 587 242 100,00

110
Table 2: Total value (thousand €) for the species in the Baltic region in 2014. Data from RDB FishFrame (per 27/08/2015). Note that not all countries have uploaded landings values or the true values of the landings.
Species (Scientific name) Species Official Landing Value (thousand €) % Cum %
Clupea harengus Atlantic herring 59 375 34,91 34,91
Sprattus sprattus European sprat 40 545 23,84 58,75
Gadus morhua Atlantic cod 31 494 18,52 77,27
Coregonus albula Vendace 6 099 3,59 80,85
Perca fluviatilis European perch 4 986 2,93 83,78
Anguilla anguilla European eel 4 263 2,51 86,29
Sander lucioperca Pike‐perch 4 195 2,47 88,76
Platichthys flesus European flounder 3 443 2,02 90,78
Coregonus lavaretus European whitefish 3 146 1,85 92,63
Salmo salar Atlantic salmon 2 115 1,24 93,88
Pleuronectes platessa European plaice 1 758 1,03 94,91
Scophthalmus maximus Turbot 1 064 0,63 95,53
Osmerus eperlanus European smelt 969 0,57 96,10
Limanda limanda Common dab 861 0,51 96,61
Abramis brama Freshwater bream 709 0,42 97,03
Esox lucius Northern pike 657 0,39 97,41
Solea solea Common sole 573 0,34 97,75
Rutilus rutilus Roach 547 0,32 98,07
Merlangius merlangus Whiting 455 0,27 98,34
Ammodytes sp. Sandeels 452 0,27 98,61
Salmo trutta Brown trout 411 0,24 98,85
Cyclopterus lumpus Lumpfish(=Lumpsucker) 399 0,23 99,08
Belone belone Garfish 332 0,20 99,28
Lota lota Burbot 207 0,12 99,40
Palaemon adspersus Baltic prawn 197 0,12 99,51
Scophthalmus rhombus Brill 161 0,09 99,61
Pollachius virens Saithe(=Pollock) 114 0,07 99,68
Vimba vimba Vimba bream 97 0,06 99,73
Trachurus trachurus Atlantic horse mackerel 63 0,04 99,77
Homarus gammarus European lobster 49 0,03 99,80
Zoarces viviparus Eelpout 44 0,03 99,83
Osteichthyes Bony fishes 43 0,03 99,85
Neogobius melanostomus Round goby 35 0,02 99,87
Scomber scombrus Atlantic mackerel 32 0,02 99,89
Myoxocephalus scorpius Bullhead 22 0,01 99,90
Microstomus kitt Lemon sole 18 0,01 99,91
Leuciscus idus Orfe(=Ide) 18 0,01 99,92
Oncorhynchus mykiss Rainbow trout 16 0,01 99,93
Mugilidae Mullets 15 0,01 99,94

111
Carassius gibelio Prussian carp 15 0,01 99,95
Nephrops norvegicus Norway lobster 13 0,01 99,96
Engraulis encrasicolus European anchovy 11 0,01 99,97
Tinca tinca Tench 10 0,01 99,97
Gymnocephalus cernuus Ruffe 5 0,00 99,97
Blicca bjoerkna White bream 5 0,00 99,98
Lycodes vahlii Vahl's eelpout 3 0,00 99,98
Mugil cephalus Flathead grey mullet 3 0,00 99,98
Molva molva Ling 3 0,00 99,98
Hippoglossoides platessoides Amer. plaice(=Long rough dab) 3 0,00 99,98
Carassius carassius Crucian carp 3 0,00 99,99
Carcinus maenas Green crab 3 0,00 99,99
Melanogrammus aeglefinus Haddock 2 0,00 99,99
Anarhichas sp. Wolffish 2 0,00 99,99
Gasterosteidae sp. Sticklebacks 2 0,00 99,99
Gobiidae sp. true gobies 2 0,00 99,99
Anarhichas lupus Wolf‐fish 2 0,00 99,99
Chelon labrosus Thicklip grey mullet 2 0,00 100,00
Lampetra fluviatilis River lamprey 1 0,00 100,00
Cancer pagurus Edible crab 1 0,00 100,00
Cyprinus carpio European carp 1 0,00 100,00
Glyptocephalus cynoglossus Witch flounder 1 0,00 100,00
Pollachius pollachius Pollack 1 0,00 100,00
Pandalus borealis Northern prawn 1 0,00 100,00
Scardinius erythrophthalmus Rudd 0 0,00 100,00
Cottidae Bullheads/sculpins 0 0,00 100,00
Lophius piscatorius Anglerfish 0 0,00 100,00
Merluccius merluccius European hake 0 0,00 100,00
Hippoglossus hippoglossus Atlantic halibut 0 0,00 100,00
Alosa fallax Twaite shad 0 0,00 100,00
Alburnus alburnus bleak 0 0,00 100,00
Gasterosteus aculeatus Three‐spined stickleback 0 0,00 100,00
Chelidonichthys lucerna Tub gurnard 0 0,00 100,00
Trachinus draco Greater weever 0 0,00 100,00
Ammodytes tobianus Small sandeel 0 0,00 100,00
Ammodytes sp. Ammodytes 0 0,00 100,00
Aspius aspius Asp 0 0,00 100,00
Eutrigla gurnardus Grey gurnard 0 0,00 100,00
Dicentrarchus labrax European seabass 0 0,00 100,00
Reinhardtius hippoglossoides Greenland halibut 0 0,00 100,00
Thymallus thymallus Grayling 0 0,00 100,00
Triglopsis quadricornis Fourhorn sculpin 0 0,00 100,00
Mullus surmuletus Striped red mullet 0 0,00 100,00
Labrus bergylta Ballan wrasse 0 0,00 100,00

112
Rajidae rays and skates 0 0,00 100,00
Acipenser sturio Sturgeon 0 0,00 100,00
Leuciscus leuciscus Common Dace 0 0,00 100,00
Cephalopoda sp. Octopus and squids 0 0,00 100,00
Brosme brosme Tusk(=Cusk) 0 0,00 100,00
Myoxocephalus quadricornis Fourhorn sculpin 0 0,00 100,00
Pelecus cultratus Sichel 0 0,00 100,00
Abramis bjoerkna White bream 0 0,00 100,00
Silurus glanis Sheatfish 0 0,00 100,00
Total 170 078 100,00

113
Annex 5: Age Length relationship for cod, herring and sprat
* Swedish stock-related sampling data of cod were preliminary, missing a scaling in the age-length and age-weight relation, hence they were incompatible with the other national data and removed from the compilation

114

115

116
Annex 6: Age weight relationship for cod, herring and sprat
* Swedish stock-related sampling data of cod were preliminary, missing a scaling in the age-length and age-weight relation, hence they were incompatible with the other national data and removed from the compilation.

117

118

119
Annex 7: Harbours accounting for 95% of the landings by stock in the Baltic Sea
area
STOCK Harbour kg % Cumulative %
Baltic Sprat DKSKA 31135700 14 % 14 %
Baltic Sprat PLHEL 25396728 11 % 25 %
Baltic Sprat DKGRE 20387859 9 % 35 %
Baltic Sprat LVVNT 18588652 8 % 43 %
Baltic Sprat SEVVK 17263517 8 % 51 %
Baltic Sprat DKNEX 13757671 6 % 57 %
Baltic Sprat LVLPX 11931903 5 % 62 %
Baltic Sprat EEDIR 10643200 5 % 67 %
Baltic Sprat PLWLA 8871644 4 % 71 %
Baltic Sprat PLKOL 7943177 4 % 75 %
Baltic Sprat EEMDR 5765224 3 % 77 %
Baltic Sprat EEVEE 5709053 3 % 80 %
Baltic Sprat PLUST 4615862 2 % 82 %
Baltic Sprat FIKNA 3804745 2 % 84 %
Baltic Sprat SERNH 2623787 1 % 85 %
Baltic Sprat SESIM 2590653 1 % 86 %
Baltic Sprat EEMRS 2558400 1 % 87 %
Baltic Sprat DKTHN 2459479 1 % 88 %
Baltic Sprat SENOT 2038971 1 % 89 %
Baltic Sprat DKRNN 1938068 1 % 90 %
Baltic Sprat EELHT 1804273 1 % 91 %
Baltic Sprat EEPLA 1676547 1 % 92 %
Baltic Sprat SENOD 1353104 1 % 92 %
Baltic Sprat EESMA 1276921 1 % 93 %
Baltic Sprat SEHEL 1243001 1 % 93 %
Baltic Sprat EEPLS 1125092 1 % 94 %
Baltic Sprat FIUKI 1006338 0 % 94 %
Baltic Sprat DKKOG 892085 0 % 95 %
Baltic Sprat LVPAV 879919 0 % 95 %

120
STOCK Harbour kg % Cumulative %
Central Baltic Herring DKSKA 14099578 10 % 10 %
Central Baltic Herring SEVVK 9665307 7 % 17 %
Central Baltic Herring FIKNA 8390329 6 % 23 %
Central Baltic Herring PLKOL 7545010 5 % 28 %
Central Baltic Herring LVROJ 6725073 5 % 33 %
Central Baltic Herring FITUO 5708808 4 % 37 %
Central Baltic Herring PLWLA 5505390 4 % 41 %
Central Baltic Herring DKGRE 5468766 4 % 44 %
Central Baltic Herring EEDIR 4341186 3 % 47 %
Central Baltic Herring PLUST 3971083 3 % 50 %
Central Baltic Herring LV999 3940088 3 % 53 %
Central Baltic Herring FIKLD 3831555 3 % 56 %
Central Baltic Herring SESIM 3822819 3 % 58 %
Central Baltic Herring PLHEL 3725644 3 % 61 %
Central Baltic Herring LVMRX 3414700 2 % 63 %
Central Baltic Herring FILPN 2933001 2 % 65 %
Central Baltic Herring LVSAL 2677677 2 % 67 %
Central Baltic Herring SERNH 2639290 2 % 69 %
Central Baltic Herring LVSKU 2512349 2 % 71 %
Central Baltic Herring EEMDR 2469643 2 % 73 %
Central Baltic Herring LVVNT 2412984 2 % 74 %
Central Baltic Herring EEVEE 2045607 1 % 76 %
Central Baltic Herring EEVIR 1895735 1 % 77 %
Central Baltic Herring SENOT 1868589 1 % 78 %
Central Baltic Herring SENOD 1626706 1 % 80 %
Central Baltic Herring EELIN 1576593 1 % 81 %
Central Baltic Herring LVRIX 1543140 1 % 82 %
Central Baltic Herring PLPAA 1295705 1 % 83 %
Central Baltic Herring EELIU 1294886 1 % 84 %
Central Baltic Herring EERMS 1275567 1 % 85 %
Central Baltic Herring DKNEX 1259523 1 % 85 %
Central Baltic Herring LVLPX 1227542 1 % 86 %
Central Baltic Herring EEPLA 1193651 1 % 87 %
Central Baltic Herring EEVOI 1176186 1 % 88 %
Central Baltic Herring SEHEL 961150 1 % 89 %
Central Baltic Herring EETOI 934886 1 % 89 %
Central Baltic Herring EEMRS 914341 1 % 90 %
Central Baltic Herring FIINK 838527 1 % 91 %
Central Baltic Herring SEBYX 740037 1 % 91 %
Central Baltic Herring SEKKT 624283 0 % 91 %
Central Baltic Herring EEPRN 616903 0 % 92 %
Central Baltic Herring EEPLS 553091 0 % 92 %
Central Baltic Herring PLDAR 523271 0 % 93 %
Central Baltic Herring FISRK 515480 0 % 93 %
Central Baltic Herring EELHT 504096 0 % 93 %
Central Baltic Herring EEMNT 476831 0 % 94 %
Central Baltic Herring EEMUN 462739 0 % 94 %
Central Baltic Herring EERHK 461529 0 % 94 %
Central Baltic Herring LTKLJ 398059 0 % 95 %
Central Baltic Herring EENJD 383578 0 % 95 %
Central Baltic Herring PLDZN 383062 0 % 95 %

121
STOCK Harbour kg % Cumulative %
Bothnian Sea Herring SENOT 46253170 42 % 42 %
Bothnian Sea Herring FIUKI 20832096 19 % 61 %
Bothnian Sea Herring FIKAS 15097599 14 % 74 %
Bothnian Sea Herring FIREP 10703523 10 % 84 %
Bothnian Sea Herring FIRAU 4225401 4 % 88 %
Bothnian Sea Herring FITUO 2887499 3 % 90 %
Bothnian Sea Herring SEVVK 2263001 2 % 92 %
Bothnian Sea Herring FIKLB 1849695 2 % 94 %
Bothnian Sea Herring FILPN 1390961 1 % 95 %
STOCK Harbour kg % Cumulative %
Bothnian Bay Herring FIKON 3110592 64 % 64 %
Bothnian Bay Herring FIKVN 463765 10 % 74 %
Bothnian Bay Herring FIOUL 314568 6 % 80 %
Bothnian Bay Herring FIHAO 305062 6 % 86 %
Bothnian Bay Herring FIUKP 226008 5 % 91 %
Bothnian Bay Herring SESRO 92676 2 % 93 %
Bothnian Bay Herring FIKOK 87709 2 % 95 %
STOCK Harbour kg % Cumulative %
Gulf of Riga Herring LVROJ 6647153 22 % 22 %
Gulf of Riga Herring LV999 3818300 12 % 34 %
Gulf of Riga Herring LVMRX 3397500 11 % 45 %
Gulf of Riga Herring LVSKU 2512349 8 % 54 %
Gulf of Riga Herring LVSAL 1821977 6 % 60 %
Gulf of Riga Herring EEVIR 1794030 6 % 65 %
Gulf of Riga Herring EELIN 1576593 5 % 71 %
Gulf of Riga Herring LVRIX 1543140 5 % 76 %
Gulf of Riga Herring EELIU 1294886 4 % 80 %
Gulf of Riga Herring EERMS 1275567 4 % 84 %
Gulf of Riga Herring EEVOI 1176186 4 % 88 %
Gulf of Riga Herring LVSAL 855700 3 % 91 %
Gulf of Riga Herring EEPRN 616903 2 % 93 %
Gulf of Riga Herring EEMUN 462739 2 % 94 %
Gulf of Riga Herring EEMNT 398731 1 % 96 %

122
STOCK Harbour kg % Cumulative %
Eastern Cod PLWLA 3243858 13 % 13 %
Eastern Cod DKNEX 3109028 12 % 25 %
Eastern Cod PLDAR 3042093 12 % 37 %
Eastern Cod PLKOL 2692331 11 % 47 %
Eastern Cod PLUST 2195798 9 % 56 %
Eastern Cod SEKKT 1934995 8 % 64 %
Eastern Cod SESIM 1257294 5 % 69 %
Eastern Cod LVLPX 1042857 4 % 73 %
Eastern Cod LTKLJ 1002934 4 % 77 %
Eastern Cod PLLEA 893408 4 % 80 %
Eastern Cod PLJAT 709782 3 % 83 %
Eastern Cod PLHEL 566050 2 % 85 %
Eastern Cod DKTEJ 416315 2 % 87 %
Eastern Cod SEESO 312398 1 % 88 %
Eastern Cod FIHEL 305419 1 % 89 %
Eastern Cod SENOD 232436 1 % 90 %
Eastern Cod PLSWI 166634 1 % 91 %
Eastern Cod LV999 163285 1 % 91 %
Eastern Cod PLMEZ 158547 1 % 92 %
Eastern Cod PLDZN 156430 1 % 93 %
Eastern Cod DESAS 151855 1 % 93 %
Eastern Cod PLCPY 145534 1 % 94 %
Eastern Cod SESLE 105244 0 % 94 %
Eastern Cod DEHHF 98375 0 % 95 %
Eastern Cod PLJAL 93119 0 % 95 %

123
STOCK Harbour kg % Cumulative %
Western Cod DKRNN 919387 7 % 7 %
Western Cod DKKLH 822824 6 % 13 %
Western Cod SEYST 628898 5 % 18 %
Western Cod DEHHF 598459 4 % 22 %
Western Cod DKBAG 584413 4 % 27 %
Western Cod SESIM 581387 4 % 31 %
Western Cod DEBSK 520709 4 % 35 %
Western Cod DESAS 516151 4 % 39 %
Western Cod DKKOG 493680 4 % 43 %
Western Cod PLDAR 335652 3 % 45 %
Western Cod PLKOL 302260 2 % 47 %
Western Cod DKSBK 281891 2 % 49 %
Western Cod DKNEX 266001 2 % 51 %
Western Cod PLDZN 260711 2 % 53 %
Western Cod SESLE 256967 2 % 55 %
Western Cod DKSPB 232115 2 % 57 %
Western Cod DKLNG 225403 2 % 59 %
Western Cod DKGLE 212199 2 % 60 %
Western Cod DEKAP 210370 2 % 62 %
Western Cod PLMEZ 208750 2 % 63 %
Western Cod DKRQD 207000 2 % 65 %
Western Cod DKHSL 203702 2 % 67 %
Western Cod DEMAO 182776 1 % 68 %
Western Cod SELOM 179024 1 % 69 %
Western Cod DKGED 173163 1 % 71 %
Western Cod DETRV 172980 1 % 72 %
Western Cod DE64Z 167128 1 % 73 %
Western Cod DKVBK 166871 1 % 74 %
Western Cod DKKTD 165473 1 % 76 %
Western Cod DKSOB 148096 1 % 77 %
Western Cod DKHES 147197 1 % 78 %
Western Cod SEKKT 147054 1 % 79 %
Western Cod SEBOU 145963 1 % 80 %
Western Cod SETRG 133108 1 % 81 %
Western Cod DKDRA 128593 1 % 82 %
Western Cod DKSKU 106897 1 % 83 %
Western Cod DKSLT 105501 1 % 84 %
Western Cod DKNBG 105377 1 % 84 %
Western Cod DEFRJ 96807 1 % 85 %
Western Cod DKFAB 96244 1 % 86 %
Western Cod DKAGO 95289 1 % 87 %
Western Cod SELIM 91003 1 % 87 %
Western Cod DESH2 83210 1 % 88 %
Western Cod DEECK 82845 1 % 88 %
Western Cod DEHED 81361 1 % 89 %
Western Cod DKMRS 79204 1 % 90 %
Western Cod DKOMO 78657 1 % 90 %
Western Cod DKKRZ 57554 0 % 91 %
Western Cod DKKRR 56542 0 % 91 %
Western Cod PLSWI 54331 0 % 92 %
Western Cod DKHAN 52216 0 % 92 %
Western Cod DEBH7 51665 0 % 92 %
Western Cod DETMD 48141 0 % 93 %
Western Cod DKSGD 45846 0 % 93 %
Western Cod DEWAR 43954 0 % 93 %
Western Cod DKMOM 43331 0 % 94 %
Western Cod DEGLY 40796 0 % 94 %
Western Cod DKKTP 35868 0 % 94 %
Western Cod DELPA 34487 0 % 94 %
Western Cod DELAB 33818 0 % 95 %
Western Cod DKROD 30611 0 % 95 %
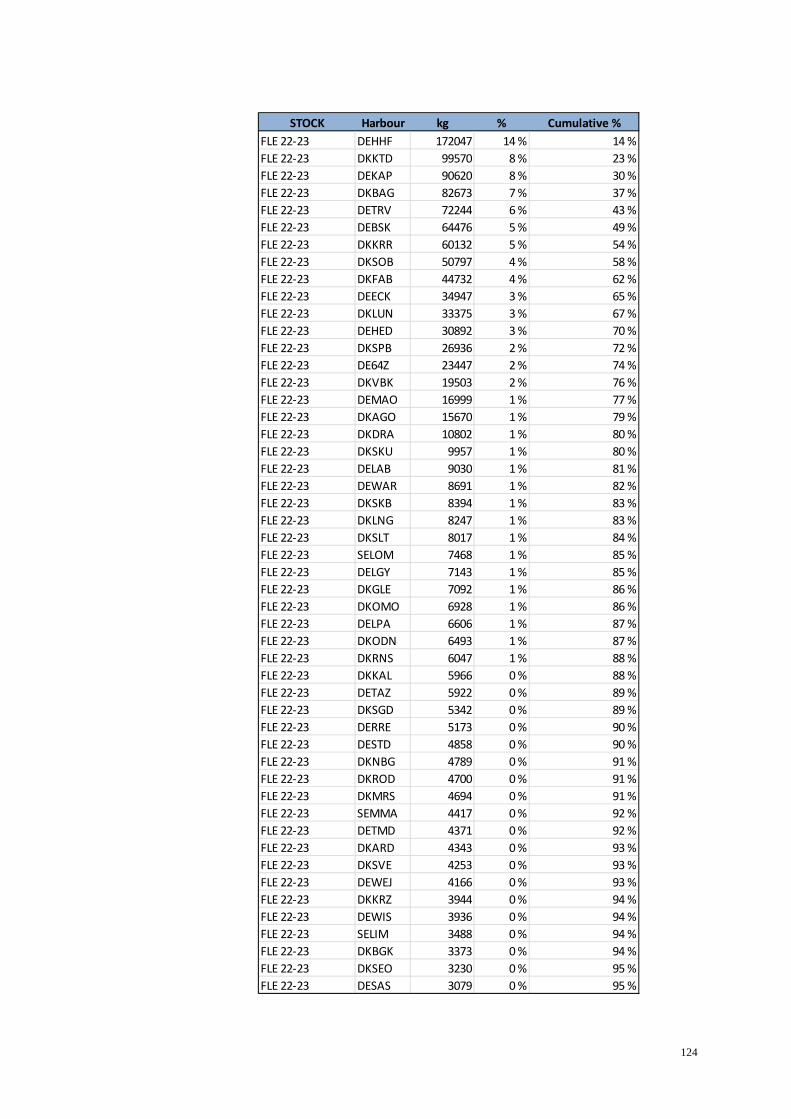
124
STOCK Harbour kg % Cumulative %
FLE 22‐23 DEHHF 172047 14 % 14 %
FLE 22‐23 DKKTD 99570 8 % 23 %
FLE 22‐23 DEKAP 90620 8 % 30 %
FLE 22‐23 DKBAG 82673 7 % 37 %
FLE 22‐23 DETRV 72244 6 % 43 %
FLE 22‐23 DEBSK 64476 5 % 49 %
FLE 22‐23 DKKRR 60132 5 % 54 %
FLE 22‐23 DKSOB 50797 4 % 58 %
FLE 22‐23 DKFAB 44732 4 % 62 %
FLE 22‐23 DEECK 34947 3 % 65 %
FLE 22‐23 DKLUN 33375 3 % 67 %
FLE 22‐23 DEHED 30892 3 % 70 %
FLE 22‐23 DKSPB 26936 2 % 72 %
FLE 22‐23 DE64Z 23447 2 % 74 %
FLE 22‐23 DKVBK 19503 2 % 76 %
FLE 22‐23 DEMAO 16999 1 % 77 %
FLE 22‐23 DKAGO 15670 1 % 79 %
FLE 22‐23 DKDRA 10802 1 % 80 %
FLE 22‐23 DKSKU 9957 1 % 80 %
FLE 22‐23 DELAB 9030 1 % 81 %
FLE 22‐23 DEWAR 8691 1 % 82 %
FLE 22‐23 DKSKB 8394 1 % 83 %
FLE 22‐23 DKLNG 8247 1 % 83 %
FLE 22‐23 DKSLT 8017 1 % 84 %
FLE 22‐23 SELOM 7468 1 % 85 %
FLE 22‐23 DELGY 7143 1 % 85 %
FLE 22‐23 DKGLE 7092 1 % 86 %
FLE 22‐23 DKOMO 6928 1 % 86 %
FLE 22‐23 DELPA 6606 1 % 87 %
FLE 22‐23 DKODN 6493 1 % 87 %
FLE 22‐23 DKRNS 6047 1 % 88 %
FLE 22‐23 DKKAL 5966 0 % 88 %
FLE 22‐23 DETAZ 5922 0 % 89 %
FLE 22‐23 DKSGD 5342 0 % 89 %
FLE 22‐23 DERRE 5173 0 % 90 %
FLE 22‐23 DESTD 4858 0 % 90 %
FLE 22‐23 DKNBG 4789 0 % 91 %
FLE 22‐23 DKROD 4700 0 % 91 %
FLE 22‐23 DKMRS 4694 0 % 91 %
FLE 22‐23 SEMMA 4417 0 % 92 %
FLE 22‐23 DETMD 4371 0 % 92 %
FLE 22‐23 DKARD 4343 0 % 93 %
FLE 22‐23 DKSVE 4253 0 % 93 %
FLE 22‐23 DEWEJ 4166 0 % 93 %
FLE 22‐23 DKKRZ 3944 0 % 94 %
FLE 22‐23 DEWIS 3936 0 % 94 %
FLE 22‐23 SELIM 3488 0 % 94 %
FLE 22‐23 DKBGK 3373 0 % 94 %
FLE 22‐23 DKSEO 3230 0 % 95 %
FLE 22‐23 DESAS 3079 0 % 95 %

125
STOCK Harbour kg % Cumulative %
FLE 24‐25 PLSWI 1533225 10 % 53 %
FLE 24‐25 PLUST 1262895 9 % 61 %
FLE 24‐25 PLDZN 1016848 7 % 68 %
FLE 24‐25 PLLEA 845445 6 % 74 %
FLE 24‐25 PLDAR 734083 5 % 79 %
FLE 24‐25 PLWLA 480049 3 % 82 %
FLE 24‐25 PLMEZ 477020 3 % 86 %
FLE 24‐25 LVLPX 259431 2 % 87 %
FLE 24‐25 DESAS 242990 2 % 89 %
FLE 24‐25 DEHHF 237747 2 % 91 %
FLE 24‐25 DEFRJ 214696 1 % 92 %
FLE 24‐25 PLCPY 192287 1 % 93 %
FLE 24‐25 SESIM 141305 1 % 94 %
FLE 24‐25 DKKOG 92352 1 % 95 %
STOCK Harbour kg % Cumulative %
FLE 26+28 LVLPX 773124 22 % 22 %
FLE 26+28 LVVNT 726320 20 % 42 %
FLE 26+28 LTKLJ 518004 15 % 57 %
FLE 26+28 PLWLA 225463 6 % 63 %
FLE 26+28 PLHEL 197813 6 % 68 %
FLE 26+28 PLJAT 190521 5 % 74 %
FLE 26+28 LV999 188537 5 % 79 %
FLE 26+28 PLPII 83988 2 % 81 %
FLE 26+28 PLKTR 68598 2 % 83 %
FLE 26+28 PLKM2 64624 2 % 85 %
FLE 26+28 PLDEK 58580 2 % 87 %
FLE 26+28 PLSOP 41080 1 % 88 %
FLE 26+28 PLJAN 35093 1 % 89 %
FLE 26+28 PLSBN 34896 1 % 90 %
FLE 26+28 PLGKZ 31600 1 % 91 %
FLE 26+28 PLORW 31335 1 % 92 %
FLE 26+28 PLMEC 27774 1 % 92 %
FLE 26+28 PLOKY 23853 1 % 93 %
FLE 26+28 PLKUZ 22420 1 % 94 %
FLE 26+28 LVPAV 18527 1 % 94 %
FLE 26+28 PLSWR 16537 0 % 95 %
FLE 26+28 SEHEK 14171 0 % 95 %

126
STOCK Harbour kg % Cumulative %
FLE 27+29‐32 EEVEE 19015 10 % 10 %
FLE 27+29‐32 EENVA 11779 6 % 16 %
FLE 27+29‐32 EEVSE 8900 5 % 21 %
FLE 27+29‐32 EEKRG 7808 4 % 25 %
FLE 27+29‐32 SESDV 6232 3 % 29 %
FLE 27+29‐32 SEBOM 5570 3 % 32 %
FLE 27+29‐32 EESPH 5299 3 % 35 %
FLE 27+29‐32 SEVVK 5297 3 % 37 %
FLE 27+29‐32 EEDIR 3997 2 % 40 %
FLE 27+29‐32 EELSL 3992 2 % 42 %
FLE 27+29‐32 EETME 3538 2 % 44 %
FLE 27+29‐32 EESEB 3501 2 % 45 %
FLE 27+29‐32 SEBYX 3181 2 % 47 %
FLE 27+29‐32 EEMAD 2472 1 % 49 %
FLE 27+29‐32 SELTT 2430 1 % 50 %
FLE 27+29‐32 EEVRN 2381 1 % 51 %
FLE 27+29‐32 EEKTT 2112 1 % 52 %
FLE 27+29‐32 EEPLK 2107 1 % 53 %
FLE 27+29‐32 EEUNV 2080 1 % 54 %
FLE 27+29‐32 EEPLN 2038 1 % 56 %
FLE 27+29‐32 EEKKE 1990 1 % 57 %
FLE 27+29‐32 EEPNL 1970 1 % 58 %
FLE 27+29‐32 EEKAK 1917 1 % 59 %
FLE 27+29‐32 EELPR 1903 1 % 60 %
FLE 27+29‐32 EEMRM 1663 1 % 61 %
FLE 27+29‐32 EEKKN 1645 1 % 61 %
FLE 27+29‐32 EEMDS 1623 1 % 62 %
FLE 27+29‐32 EEPRP 1482 1 % 63 %
FLE 27+29‐32 EEHDI 1454 1 % 64 %
FLE 27+29‐32 EETSI 1450 1 % 65 %
FLE 27+29‐32 SEKLR 1443 1 % 65 %
FLE 27+29‐32 EEMLK 1390 1 % 66 %
FLE 27+29‐32 EEHRA 1366 1 % 67 %
FLE 27+29‐32 EEKAL 1314 1 % 68 %
FLE 27+29‐32 EESRU 1302 1 % 68 %
FLE 27+29‐32 EELUT 1295 1 % 69 %
FLE 27+29‐32 EELLM 1251 1 % 70 %
FLE 27+29‐32 EEELB 1232 1 % 70 %
FLE 27+29‐32 EEKBU 1131 1 % 71 %
FLE 27+29‐32 SEBDQ 1086 1 % 72 %
FLE 27+29‐32 EETIL 1071 1 % 72 %
FLE 27+29‐32 DKGRE 1046 1 % 73 %
FLE 27+29‐32 EEONN 1001 1 % 73 %
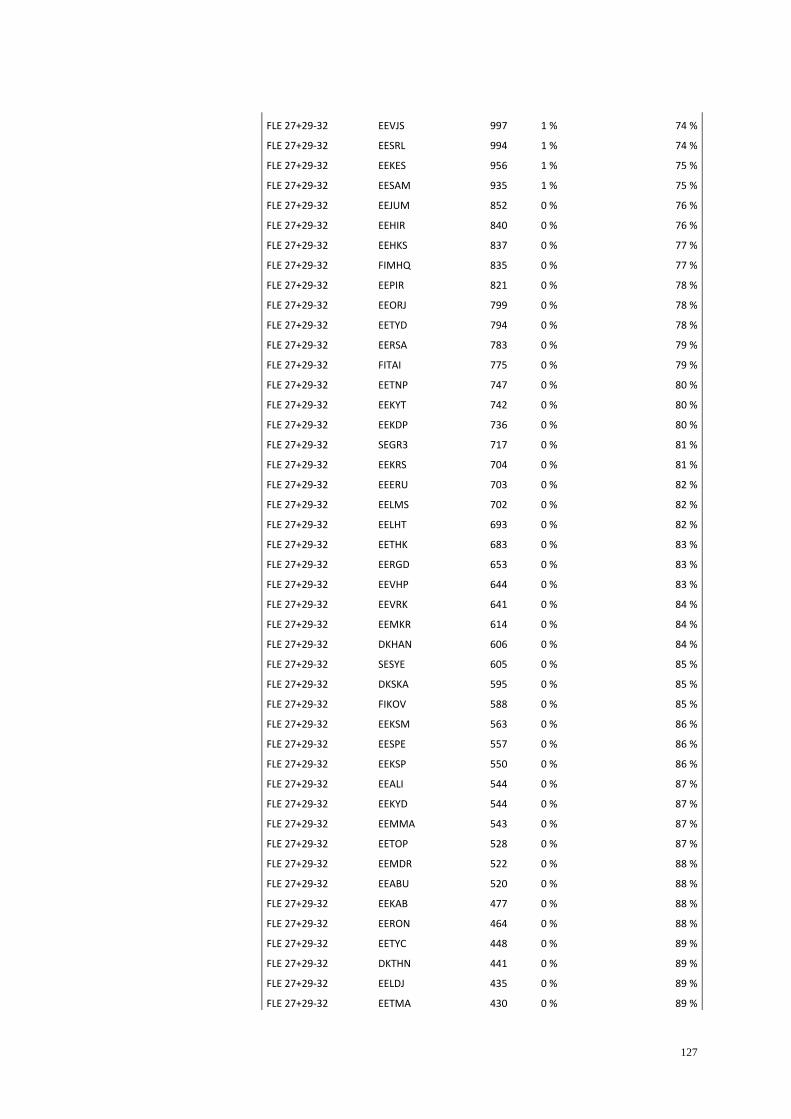
127
FLE 27+29‐32 EEVJS 997 1 % 74 %
FLE 27+29‐32 EESRL 994 1 % 74 %
FLE 27+29‐32 EEKES 956 1 % 75 %
FLE 27+29‐32 EESAM 935 1 % 75 %
FLE 27+29‐32 EEJUM 852 0 % 76 %
FLE 27+29‐32 EEHIR 840 0 % 76 %
FLE 27+29‐32 EEHKS 837 0 % 77 %
FLE 27+29‐32 FIMHQ 835 0 % 77 %
FLE 27+29‐32 EEPIR 821 0 % 78 %
FLE 27+29‐32 EEORJ 799 0 % 78 %
FLE 27+29‐32 EETYD 794 0 % 78 %
FLE 27+29‐32 EERSA 783 0 % 79 %
FLE 27+29‐32 FITAI 775 0 % 79 %
FLE 27+29‐32 EETNP 747 0 % 80 %
FLE 27+29‐32 EEKYT 742 0 % 80 %
FLE 27+29‐32 EEKDP 736 0 % 80 %
FLE 27+29‐32 SEGR3 717 0 % 81 %
FLE 27+29‐32 EEKRS 704 0 % 81 %
FLE 27+29‐32 EEERU 703 0 % 82 %
FLE 27+29‐32 EELMS 702 0 % 82 %
FLE 27+29‐32 EELHT 693 0 % 82 %
FLE 27+29‐32 EETHK 683 0 % 83 %
FLE 27+29‐32 EERGD 653 0 % 83 %
FLE 27+29‐32 EEVHP 644 0 % 83 %
FLE 27+29‐32 EEVRK 641 0 % 84 %
FLE 27+29‐32 EEMKR 614 0 % 84 %
FLE 27+29‐32 DKHAN 606 0 % 84 %
FLE 27+29‐32 SESYE 605 0 % 85 %
FLE 27+29‐32 DKSKA 595 0 % 85 %
FLE 27+29‐32 FIKOV 588 0 % 85 %
FLE 27+29‐32 EEKSM 563 0 % 86 %
FLE 27+29‐32 EESPE 557 0 % 86 %
FLE 27+29‐32 EEKSP 550 0 % 86 %
FLE 27+29‐32 EEALI 544 0 % 87 %
FLE 27+29‐32 EEKYD 544 0 % 87 %
FLE 27+29‐32 EEMMA 543 0 % 87 %
FLE 27+29‐32 EETOP 528 0 % 87 %
FLE 27+29‐32 EEMDR 522 0 % 88 %
FLE 27+29‐32 EEABU 520 0 % 88 %
FLE 27+29‐32 EEKAB 477 0 % 88 %
FLE 27+29‐32 EERON 464 0 % 88 %
FLE 27+29‐32 EETYC 448 0 % 89 %
FLE 27+29‐32 DKTHN 441 0 % 89 %
FLE 27+29‐32 EELDJ 435 0 % 89 %
FLE 27+29‐32 EETMA 430 0 % 89 %

128
FLE 27+29‐32 EEKYY 427 0 % 90 %
FLE 27+29‐32 EEHYA 404 0 % 90 %
FLE 27+29‐32 EESUS 393 0 % 90 %
FLE 27+29‐32 EERAG 372 0 % 90 %
FLE 27+29‐32 EETLS 363 0 % 90 %
FLE 27+29‐32 EEVRG 358 0 % 91 %
FLE 27+29‐32 EEIHS 355 0 % 91 %
FLE 27+29‐32 EEKJO 345 0 % 91 %
FLE 27+29‐32 EEHII 343 0 % 91 %
FLE 27+29‐32 EEANE 340 0 % 91 %
FLE 27+29‐32 EEPAO 333 0 % 92 %
FLE 27+29‐32 EESUP 331 0 % 92 %
FLE 27+29‐32 EENEE 328 0 % 92 %
FLE 27+29‐32 EERST 324 0 % 92 %
FLE 27+29‐32 EEVAU 321 0 % 92 %
FLE 27+29‐32 FIPRV 311 0 % 92 %
FLE 27+29‐32 SETMM 299 0 % 93 %
FLE 27+29‐32 EEUUD 292 0 % 93 %
FLE 27+29‐32 EEKLA 286 0 % 93 %
FLE 27+29‐32 EESKV 281 0 % 93 %
FLE 27+29‐32 SELOF 278 0 % 93 %
FLE 27+29‐32 EESLK 274 0 % 93 %
FLE 27+29‐32 EEVYC 271 0 % 93 %
FLE 27+29‐32 FIKTK 267 0 % 94 %
FLE 27+29‐32 EELBN 251 0 % 94 %
FLE 27+29‐32 EEPLS 241 0 % 94 %
FLE 27+29‐32 EELKY 228 0 % 94 %
FLE 27+29‐32 EEKOV 227 0 % 94 %
FLE 27+29‐32 SEKRS 227 0 % 94 %
FLE 27+29‐32 EELEP 210 0 % 94 %
FLE 27+29‐32 EEKYC 206 0 % 94 %
FLE 27+29‐32 SE999 206 0 % 95 %
FLE 27+29‐32 EEMKL 199 0 % 95 %
FLE 27+29‐32 EEPOK 198 0 % 95 %
FLE 27+29‐32 SEBLI 198 0 % 95 %
FLE 27+29‐32 EEUSK 197 0 % 95 %

129
STOCK Harbour kg % Cumulative %
Dab 22‐32 DEHHF 245335 20 % 20 %
Dab 22‐32 DEKAP 209295 17 % 37 %
Dab 22‐32 DKBAG 131527 11 % 47 %
Dab 22‐32 DEBSK 107740 9 % 56 %
Dab 22‐32 DEHED 104923 8 % 65 %
Dab 22‐32 DEMAO 73926 6 % 71 %
Dab 22‐32 DKSOB 46382 4 % 74 %
Dab 22‐32 DKSBK 26895 2 % 76 %
Dab 22‐32 DETRV 26046 2 % 79 %
Dab 22‐32 DKSPB 23424 2 % 80 %
Dab 22‐32 DEECK 20336 2 % 82 %
Dab 22‐32 DKKTD 19044 2 % 84 %
Dab 22‐32 DKROD 17154 1 % 85 %
Dab 22‐32 DKFAB 14703 1 % 86 %
Dab 22‐32 DKKLH 14375 1 % 87 %
Dab 22‐32 DE64Z 12407 1 % 88 %
Dab 22‐32 DKLNG 10663 1 % 89 %
Dab 22‐32 DKGED 10206 1 % 90 %
Dab 22‐32 DEWAR 9052 1 % 91 %
Dab 22‐32 DKNBG 8375 1 % 91 %
Dab 22‐32 DELAB 7024 1 % 92 %
Dab 22‐32 DKLUN 6406 1 % 93 %
Dab 22‐32 DKKRR 5375 0 % 93 %
Dab 22‐32 DKKAL 5306 0 % 93 %
Dab 22‐32 DKSGD 5192 0 % 94 %
Dab 22‐32 DESAS 5105 0 % 94 %
Dab 22‐32 DKOMO 4815 0 % 95 %
Dab 22‐32 DKKRZ 4668 0 % 95 %
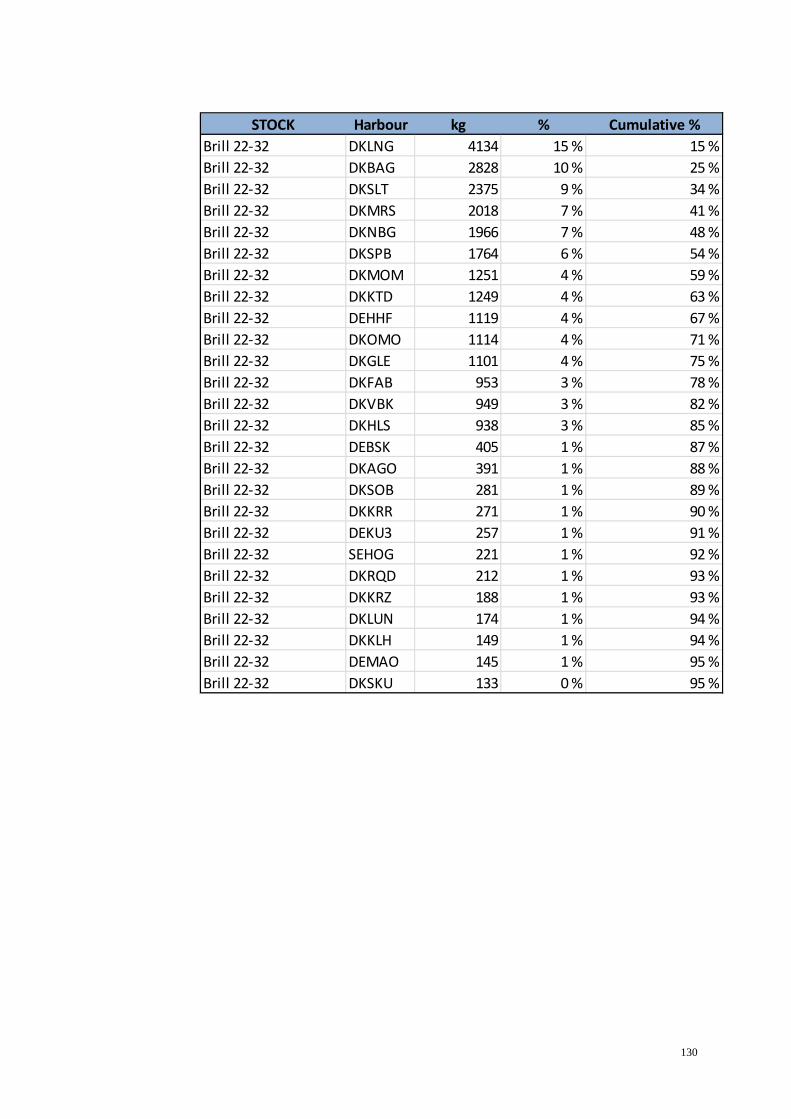
130
STOCK Harbour kg % Cumulative %
Brill 22‐32 DKLNG 4134 15 % 15 %
Brill 22‐32 DKBAG 2828 10 % 25 %
Brill 22‐32 DKSLT 2375 9 % 34 %
Brill 22‐32 DKMRS 2018 7 % 41 %
Brill 22‐32 DKNBG 1966 7 % 48 %
Brill 22‐32 DKSPB 1764 6 % 54 %
Brill 22‐32 DKMOM 1251 4 % 59 %
Brill 22‐32 DKKTD 1249 4 % 63 %
Brill 22‐32 DEHHF 1119 4 % 67 %
Brill 22‐32 DKOMO 1114 4 % 71 %
Brill 22‐32 DKGLE 1101 4 % 75 %
Brill 22‐32 DKFAB 953 3 % 78 %
Brill 22‐32 DKVBK 949 3 % 82 %
Brill 22‐32 DKHLS 938 3 % 85 %
Brill 22‐32 DEBSK 405 1 % 87 %
Brill 22‐32 DKAGO 391 1 % 88 %
Brill 22‐32 DKSOB 281 1 % 89 %
Brill 22‐32 DKKRR 271 1 % 90 %
Brill 22‐32 DEKU3 257 1 % 91 %
Brill 22‐32 SEHOG 221 1 % 92 %
Brill 22‐32 DKRQD 212 1 % 93 %
Brill 22‐32 DKKRZ 188 1 % 93 %
Brill 22‐32 DKLUN 174 1 % 94 %
Brill 22‐32 DKKLH 149 1 % 94 %
Brill 22‐32 DEMAO 145 1 % 95 %
Brill 22‐32 DKSKU 133 0 % 95 %

131
STOCK Harbour kg % Cumulative %
Turbot 22‐32 PLWLA 3243858 13 % 13 %
Turbot 22‐32 DKNEX 3109028 12 % 25 %
Turbot 22‐32 PLDAR 3042093 12 % 37 %
Turbot 22‐32 PLKOL 2692331 11 % 47 %
Turbot 22‐32 PLUST 2195798 9 % 56 %
Turbot 22‐32 SEKKT 1934995 8 % 64 %
Turbot 22‐32 SESIM 1257294 5 % 69 %
Turbot 22‐32 LVLPX 1042857 4 % 73 %
Turbot 22‐32 LTKLJ 1002934 4 % 77 %
Turbot 22‐32 PLLEA 893408 4 % 80 %
Turbot 22‐32 PLJAT 709782 3 % 83 %
Turbot 22‐32 PLHEL 566050 2 % 85 %
Turbot 22‐32 DKTEJ 416315 2 % 87 %
Turbot 22‐32 SEESO 312398 1 % 88 %
Turbot 22‐32 FIHEL 305419 1 % 89 %
Turbot 22‐32 SENOD 232436 1 % 90 %
Turbot 22‐32 PLSWI 166634 1 % 91 %
Turbot 22‐32 LV999 163285 1 % 91 %
Turbot 22‐32 PLMEZ 158547 1 % 92 %
Turbot 22‐32 PLDZN 156430 1 % 93 %
Turbot 22‐32 DESAS 151855 1 % 93 %
Turbot 22‐32 PLCPY 145534 1 % 94 %
Turbot 22‐32 SESLE 105244 0 % 94 %
Turbot 22‐32 DEHHF 98375 0 % 95 %
Turbot 22‐32 PLJAL 93119 0 % 95 %

132
STOCK Harbour kg % Cumulative %
PLE (21), 22‐23 DKBAG 292679 20 % 20 %
PLE (21), 22‐23 DKSOB 152423 10 % 30 %
PLE (21), 22‐23 DKSPB 114413 8 % 37 %
PLE (21), 22‐23 DEKAP 99845 7 % 44 %
PLE (21), 22‐23 DKKTD 83904 6 % 50 %
PLE (21), 22‐23 DKLNG 77730 5 % 55 %
PLE (21), 22‐23 DKFAB 73998 5 % 60 %
PLE (21), 22‐23 DEHHF 63266 4 % 64 %
PLE (21), 22‐23 DKMRS 47990 3 % 67 %
PLE (21), 22‐23 DEMAO 44147 3 % 70 %
PLE (21), 22‐23 DKOMO 39517 3 % 73 %
PLE (21), 22‐23 DKAGO 32305 2 % 75 %
PLE (21), 22‐23 SELOM 30772 2 % 77 %
PLE (21), 22‐23 DKNBG 29453 2 % 79 %
PLE (21), 22‐23 DEECK 29243 2 % 81 %
PLE (21), 22‐23 DKVBK 28068 2 % 83 %
PLE (21), 22‐23 DEBSK 26735 2 % 85 %
PLE (21), 22‐23 DKKRR 21289 1 % 86 %
PLE (21), 22‐23 DEHED 21005 1 % 88 %
PLE (21), 22‐23 DKLUN 18568 1 % 89 %
PLE (21), 22‐23 DKARD 18387 1 % 90 %
PLE (21), 22‐23 DKSGD 15043 1 % 91 %
PLE (21), 22‐23 DETRV 14042 1 % 92 %
PLE (21), 22‐23 DKMOM 13880 1 % 93 %
PLE (21), 22‐23 DKSLT 11988 1 % 94 %
PLE (21), 22‐23 DE64Z 8198 1 % 94 %
PLE (21), 22‐23 DKKRZ 7937 1 % 95 %
PLE (21), 22‐23 DKGLE 6194 0 % 95 %

133
STOCK Harbour kg % Cumulative %
PLE 24‐25 DKRNN 120840 23 % 23 %
PLE 24‐25 DKTEJ 62841 12 % 35 %
PLE 24‐25 PLKOL 51398 10 % 45 %
PLE 24‐25 DKKOG 48169 9 % 55 %
PLE 24‐25 PLSWI 43467 8 % 63 %
PLE 24‐25 SESIM 30840 6 % 69 %
PLE 24‐25 DKKLH 24801 5 % 74 %
PLE 24‐25 DESAS 18874 4 % 77 %
PLE 24‐25 DEHHF 15138 3 % 80 %
PLE 24‐25 DKNEX 9144 2 % 82 %
PLE 24‐25 DKRQD 8405 2 % 84 %
PLE 24‐25 SEYST 8265 2 % 85 %
PLE 24‐25 PLMEZ 6120 1 % 86 %
PLE 24‐25 PLUST 6110 1 % 88 %
PLE 24‐25 DEFRJ 5900 1 % 89 %
PLE 24‐25 SESLE 5797 1 % 90 %
PLE 24‐25 PLLEA 5730 1 % 91 %
PLE 24‐25 DKARS 5495 1 % 92 %
PLE 24‐25 PLDAR 5096 1 % 93 %
PLE 24‐25 PLDZN 4425 1 % 94 %
PLE 24‐25 DESH2 3723 1 % 94 %
PLE 24‐25 DEVT2 3595 1 % 95 %
STOCK Harbour kg % Cumulative %
Sole 22‐24 DKKTD 7604 16 % 16 %
Sole 22‐24 DKSPB 6816 14 % 30 %
Sole 22‐24 DKLNG 5592 12 % 42 %
Sole 22‐24 DKOMO 3991 8 % 50 %
Sole 22‐24 DKGLE 3910 8 % 59 %
Sole 22‐24 DKBAG 2825 6 % 64 %
Sole 22‐24 DKSEO 2694 6 % 70 %
Sole 22‐24 DKKRR 2382 5 % 75 %
Sole 22‐24 DKNBG 2232 5 % 80 %
Sole 22‐24 DKHLS 1932 4 % 84 %
Sole 22‐24 DKODN 1912 4 % 88 %
Sole 22‐24 DKSLT 1769 4 % 92 %
Sole 22‐24 DKAGO 644 1 % 93 %
Sole 22‐24 DKSNE 560 1 % 94 %
Sole 22‐24 DKKAL 475 1 % 95 %

Harbours accounting for 95% of the Eastern Cod landings in the Baltic Sea in 2012-2014.
Harbour kg % Cumulative % Harbour kg % Cumulative % Harbour kg % Cumulative %
Eastern Cod DKNEX 5076914 11 % 11 % PLWLA 4124745 15 % 15 % PLWLA 3243858 13 % 13 %
Eastern Cod PLWLA 4820755 11 % 22 % DKNEX 2751709 10 % 24 % DKNEX 3109028 12 % 25 %
Eastern Cod SEKKT 4622639 10 % 32 % PLKOL 2666905 9 % 34 % PLDAR 3042093 12 % 37 %
Eastern Cod PLDAR 4485395 10 % 42 % PLDAR 2433960 9 % 42 % PLKOL 2692331 11 % 47 %
Eastern Cod SESIM 4461692 10 % 52 % SEKKT 2331714 8 % 51 % PLUST 2195798 9 % 56 %
Eastern Cod PLKOL 3113280 7 % 59 % SESIM 2247362 8 % 59 % SEKKT 1934995 8 % 64 %
Eastern Cod PLUST 2758780 6 % 65 % PLUST 1916061 7 % 65 % SESIM 1257294 5 % 69 %
Eastern Cod LVLPX 1981764 4 % 69 % LVLPX 1367519 5 % 70 % LVLPX 1042857 4 % 73 %
Eastern Cod PLHEL 1718319 4 % 73 % LTKLJ 1278427 5 % 75 % LTKLJ 1002934 4 % 77 %
Eastern Cod PL999 1072849 2 % 75 % PLHEL 1127695 4 % 79 % PLLEA 893408 4 % 80 %
Eastern Cod PLLEB 980085 2 % 77 % PLJAS 1096406 4 % 83 % PLJAT 709782 3 % 83 %
Eastern Cod DEU‐0602 827904 2 % 79 % PLLEB 778570 3 % 85 % PLHEL 566050 2 % 85 %
Eastern Cod SEKAA 675260 1 % 81 % UNK 388537 1 % 87 % DKTEJ 416315 2 % 87 %
Eastern Cod POL‐3703 626920 1 % 82 % SEESO 313031 1 % 88 % SEESO 312398 1 % 88 %
Eastern Cod LTKLJ 604564 1 % 83 % DKTEJ 246166 1 % 89 % FIHEL 305419 1 % 89 %
Eastern Cod SEYST 588595 1 % 85 % PLSWI 230866 1 % 89 % SENOD 232436 1 % 90 %
Eastern Cod DKTEJ 581609 1 % 86 % PLMZZ 218473 1 % 90 % PLSWI 166634 1 % 91 %
Eastern Cod PLJAS 573955 1 % 87 % SENOD 169920 1 % 91 % LV999 163285 1 % 91 %
Eastern Cod DKRNN 463604 1 % 88 % DKRNN 165511 1 % 91 % PLMEZ 158547 1 % 92 %
Eastern Cod SEESO 428711 1 % 89 % SESLE 154193 1 % 92 % PLDZN 156430 1 % 93 %
Eastern Cod SESLE 397141 1 % 90 % DKARS 145690 1 % 92 % DESAS 151855 1 % 93 %
Eastern Cod DEU‐0207 354332 1 % 91 % PLDZI 140240 0 % 93 % PLCPY 145534 1 % 94 %
Eastern Cod LVVNT 281660 1 % 91 % PLCPY 135900 0 % 93 % SESLE 105244 0 % 94 %
Eastern Cod SE999 279794 1 % 92 % DKLID 135093 0 % 94 % DEHHF 98375 0 % 95 %
Eastern Cod DKARS 249421 1 % 93 % LVVNT 124941 0 % 94 % PLJAL 93119 0 % 95 %
Eastern Cod PLMRZ 220523 0 % 93 % LV999 92304 0 % 95 % SEKAA 90332 0 % 95 %
Eastern Cod SENOD 211080 0 % 94 % ‐ ‐ ‐ ‐ ‐ ‐ ‐ ‐
Eastern Cod PLSWI 175508 0 % 94 % ‐ ‐ ‐ ‐ ‐ ‐ ‐ ‐
Eastern Cod DKLID 171428 0 % 94 % ‐ ‐ ‐ ‐ ‐ ‐ ‐ ‐
Eastern Cod DKKOG 153042 0 % 95 % ‐ ‐ ‐ ‐ ‐ ‐ ‐ ‐
Eastern Cod DEU‐0674 143747 0 % 95 % ‐ ‐ ‐ ‐ ‐ ‐ ‐ ‐
Eastern Cod PLDZI 138205 0 % 95 % ‐ ‐ ‐ ‐ ‐ ‐ ‐ ‐
2013 2014STOCK
2012
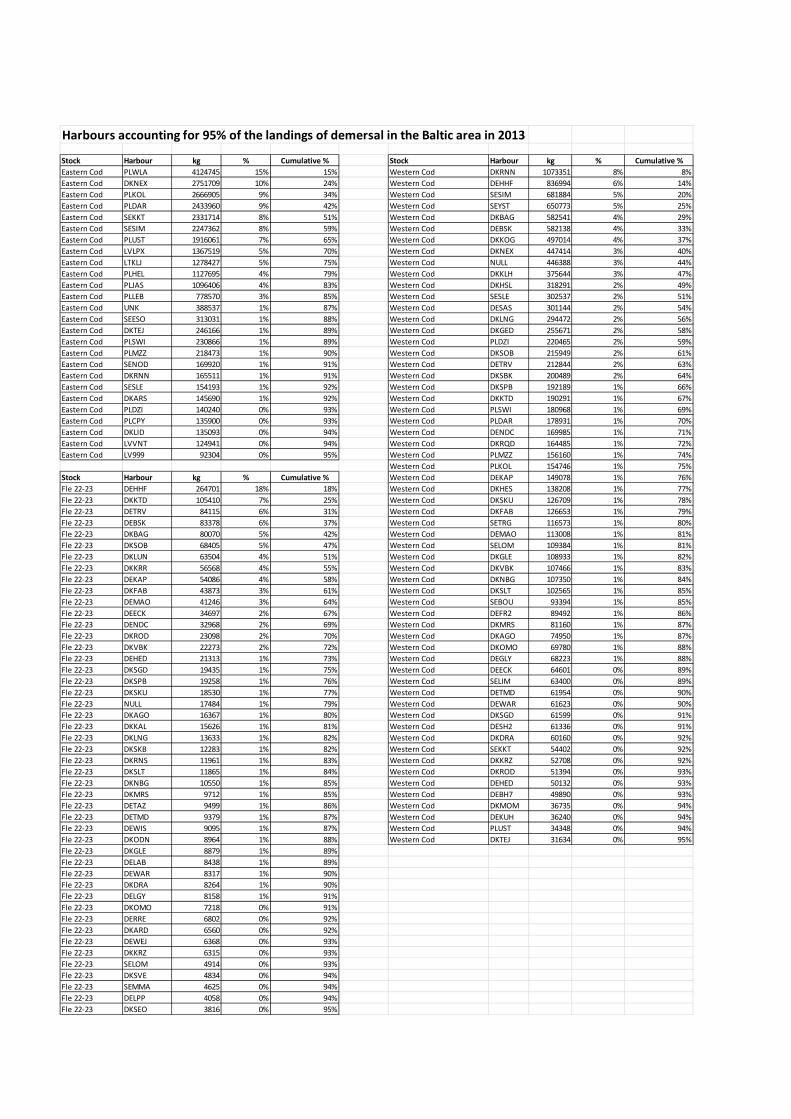
Harbours accounting for 95% of the landings of demersal in the Baltic area in 2013
Stock Harbour kg % Cumulative % Stock Harbour kg % Cumulative %
Eastern Cod PLWLA 4124745 15% 15% Western Cod DKRNN 1073351 8% 8%
Eastern Cod DKNEX 2751709 10% 24% Western Cod DEHHF 836994 6% 14%
Eastern Cod PLKOL 2666905 9% 34% Western Cod SESIM 681884 5% 20%
Eastern Cod PLDAR 2433960 9% 42% Western Cod SEYST 650773 5% 25%
Eastern Cod SEKKT 2331714 8% 51% Western Cod DKBAG 582541 4% 29%
Eastern Cod SESIM 2247362 8% 59% Western Cod DEBSK 582138 4% 33%
Eastern Cod PLUST 1916061 7% 65% Western Cod DKKOG 497014 4% 37%
Eastern Cod LVLPX 1367519 5% 70% Western Cod DKNEX 447414 3% 40%
Eastern Cod LTKLJ 1278427 5% 75% Western Cod NULL 446388 3% 44%
Eastern Cod PLHEL 1127695 4% 79% Western Cod DKKLH 375644 3% 47%
Eastern Cod PLJAS 1096406 4% 83% Western Cod DKHSL 318291 2% 49%
Eastern Cod PLLEB 778570 3% 85% Western Cod SESLE 302537 2% 51%
Eastern Cod UNK 388537 1% 87% Western Cod DESAS 301144 2% 54%
Eastern Cod SEESO 313031 1% 88% Western Cod DKLNG 294472 2% 56%
Eastern Cod DKTEJ 246166 1% 89% Western Cod DKGED 255671 2% 58%
Eastern Cod PLSWI 230866 1% 89% Western Cod PLDZI 220465 2% 59%
Eastern Cod PLMZZ 218473 1% 90% Western Cod DKSOB 215949 2% 61%
Eastern Cod SENOD 169920 1% 91% Western Cod DETRV 212844 2% 63%
Eastern Cod DKRNN 165511 1% 91% Western Cod DKSBK 200489 2% 64%
Eastern Cod SESLE 154193 1% 92% Western Cod DKSPB 192189 1% 66%
Eastern Cod DKARS 145690 1% 92% Western Cod DKKTD 190291 1% 67%
Eastern Cod PLDZI 140240 0% 93% Western Cod PLSWI 180968 1% 69%
Eastern Cod PLCPY 135900 0% 93% Western Cod PLDAR 178931 1% 70%
Eastern Cod DKLID 135093 0% 94% Western Cod DENDC 169985 1% 71%
Eastern Cod LVVNT 124941 0% 94% Western Cod DKRQD 164485 1% 72%
Eastern Cod LV999 92304 0% 95% Western Cod PLMZZ 156160 1% 74%
Western Cod PLKOL 154746 1% 75%
Stock Harbour kg % Cumulative % Western Cod DEKAP 149078 1% 76%
Fle 22‐23 DEHHF 264701 18% 18% Western Cod DKHES 138208 1% 77%
Fle 22‐23 DKKTD 105410 7% 25% Western Cod DKSKU 126709 1% 78%
Fle 22‐23 DETRV 84115 6% 31% Western Cod DKFAB 126653 1% 79%
Fle 22‐23 DEBSK 83378 6% 37% Western Cod SETRG 116573 1% 80%
Fle 22‐23 DKBAG 80070 5% 42% Western Cod DEMAO 113008 1% 81%
Fle 22‐23 DKSOB 68405 5% 47% Western Cod SELOM 109384 1% 81%
Fle 22‐23 DKLUN 63504 4% 51% Western Cod DKGLE 108933 1% 82%
Fle 22‐23 DKKRR 56568 4% 55% Western Cod DKVBK 107466 1% 83%
Fle 22‐23 DEKAP 54086 4% 58% Western Cod DKNBG 107350 1% 84%
Fle 22‐23 DKFAB 43873 3% 61% Western Cod DKSLT 102565 1% 85%
Fle 22‐23 DEMAO 41246 3% 64% Western Cod SEBOU 93394 1% 85%
Fle 22‐23 DEECK 34697 2% 67% Western Cod DEFR2 89492 1% 86%
Fle 22‐23 DENDC 32968 2% 69% Western Cod DKMRS 81160 1% 87%
Fle 22‐23 DKROD 23098 2% 70% Western Cod DKAGO 74950 1% 87%
Fle 22‐23 DKVBK 22273 2% 72% Western Cod DKOMO 69780 1% 88%
Fle 22‐23 DEHED 21313 1% 73% Western Cod DEGLY 68223 1% 88%
Fle 22‐23 DKSGD 19435 1% 75% Western Cod DEECK 64601 0% 89%
Fle 22‐23 DKSPB 19258 1% 76% Western Cod SELIM 63400 0% 89%
Fle 22‐23 DKSKU 18530 1% 77% Western Cod DETMD 61954 0% 90%
Fle 22‐23 NULL 17484 1% 79% Western Cod DEWAR 61623 0% 90%
Fle 22‐23 DKAGO 16367 1% 80% Western Cod DKSGD 61599 0% 91%
Fle 22‐23 DKKAL 15626 1% 81% Western Cod DESH2 61336 0% 91%
Fle 22‐23 DKLNG 13633 1% 82% Western Cod DKDRA 60160 0% 92%
Fle 22‐23 DKSKB 12283 1% 82% Western Cod SEKKT 54402 0% 92%
Fle 22‐23 DKRNS 11961 1% 83% Western Cod DKKRZ 52708 0% 92%
Fle 22‐23 DKSLT 11865 1% 84% Western Cod DKROD 51394 0% 93%
Fle 22‐23 DKNBG 10550 1% 85% Western Cod DEHED 50132 0% 93%
Fle 22‐23 DKMRS 9712 1% 85% Western Cod DEBH7 49890 0% 93%
Fle 22‐23 DETAZ 9499 1% 86% Western Cod DKMOM 36735 0% 94%
Fle 22‐23 DETMD 9379 1% 87% Western Cod DEKUH 36240 0% 94%
Fle 22‐23 DEWIS 9095 1% 87% Western Cod PLUST 34348 0% 94%
Fle 22‐23 DKODN 8964 1% 88% Western Cod DKTEJ 31634 0% 95%
Fle 22‐23 DKGLE 8879 1% 89%
Fle 22‐23 DELAB 8438 1% 89%
Fle 22‐23 DEWAR 8317 1% 90%
Fle 22‐23 DKDRA 8264 1% 90%
Fle 22‐23 DELGY 8158 1% 91%
Fle 22‐23 DKOMO 7218 0% 91%
Fle 22‐23 DERRE 6802 0% 92%
Fle 22‐23 DKARD 6560 0% 92%
Fle 22‐23 DEWEJ 6368 0% 93%
Fle 22‐23 DKKRZ 6315 0% 93%
Fle 22‐23 SELOM 4914 0% 93%
Fle 22‐23 DKSVE 4834 0% 94%
Fle 22‐23 SEMMA 4625 0% 94%
Fle 22‐23 DELPP 4058 0% 94%
Fle 22‐23 DKSEO 3816 0% 95%

136
Stock Harbour kg % Cumulative % Stock Harbour kg % Cumulative %
Fle 27+29‐32 EEVEE 46872 20% 20% Fle 24‐25 PLKOL 5344708 37% 37%
Fle 27+29‐32 EENVA 10865 5% 24% Fle 24‐25 PLSWI 2226303 16% 53%
Fle 27+29‐32 EEKRG 10234 4% 29% Fle 24‐25 PLDZI 1121083 8% 61%
Fle 27+29‐32 EEUNV 9585 4% 33% Fle 24‐25 PLUST 904811 6% 67%
Fle 27+29‐32 EESPH 8967 4% 37% Fle 24‐25 PLLEB 791805 6% 72%
Fle 27+29‐32 SEBOM 5831 2% 39% Fle 24‐25 PLMZZ 555759 4% 76%
Fle 27+29‐32 SESDV 5667 2% 42% Fle 24‐25 PLDAR 430625 3% 79%
Fle 27+29‐32 EEVRN 5365 2% 44% Fle 24‐25 DEHHF 411452 3% 82%
Fle 27+29‐32 SEVVK 5277 2% 46% Fle 24‐25 PLCPY 305534 2% 84%
Fle 27+29‐32 SEBYX 5098 2% 48% Fle 24‐25 SESIM 302652 2% 86%
Fle 27+29‐32 EEPLK 5083 2% 50% Fle 24‐25 DEFR2 192844 1% 88%
Fle 27+29‐32 EESEB 4453 2% 52% Fle 24‐25 DESAS 154815 1% 89%
Fle 27+29‐32 EELSL 3625 2% 54% Fle 24‐25 DKNEX 117085 1% 90%
Fle 27+29‐32 EEDIR 3582 2% 55% Fle 24‐25 DKRNN 108365 1% 90%
Fle 27+29‐32 EEMAD 3362 1% 57% Fle 24‐25 LVLPX 104095 1% 91%
Fle 27+29‐32 EELPR 2917 1% 58% Fle 24‐25 SEYST 97301 1% 92%
Fle 27+29‐32 EEKAK 2831 1% 59% Fle 24‐25 PLUNI 93314 1% 93%
Fle 27+29‐32 EEKKN 2561 1% 60% Fle 24‐25 DKKOG 90258 1% 93%
Fle 27+29‐32 PLHEL 2300 1% 61% Fle 24‐25 DKLID 90160 1% 94%
Fle 27+29‐32 EEVSE 2215 1% 62% Fle 24‐25 DKKLH 77898 1% 94%
Fle 27+29‐32 EEMRM 2180 1% 63% Fle 24‐25 DENMK 66614 0% 95%
Fle 27+29‐32 EETME 2142 1% 64%
Fle 27+29‐32 EETOP 2071 1% 65%
Fle 27+29‐32 EEKAL 2010 1% 66%
Fle 27+29‐32 EEPNL 1991 1% 67%
Fle 27+29‐32 EEKES 1866 1% 67% Stock Harbour kg % Cumulative %
Fle 27+29‐32 SEKLR 1831 1% 68% Fle 26+28 LVLPX 1049781 26% 26%
Fle 27+29‐32 EEKTT 1782 1% 69% Fle 26+28 LTKLJ 687179 17% 42%
Fle 27+29‐32 EELLM 1740 1% 70% Fle 26+28 LVVNT 463495 11% 54%
Fle 27+29‐32 FIunk 1680 1% 70% Fle 26+28 PLWLA 424914 10% 64%
Fle 27+29‐32 EESRU 1661 1% 71% Fle 26+28 PLHEL 238833 6% 70%
Fle 27+29‐32 EESRL 1658 1% 72% Fle 26+28 PLJAS 173791 4% 74%
Fle 27+29‐32 EEKKE 1598 1% 72% Fle 26+28 LV999 160186 4% 78%
Fle 27+29‐32 EEMDS 1558 1% 73% Fle 26+28 PLKTR 106429 3% 81%
Fle 27+29‐32 EEPIR 1537 1% 74% Fle 26+28 PLPII 88831 2% 83%
Fle 27+29‐32 EETYD 1507 1% 74% Fle 26+28 PLDEK 79790 2% 85%
Fle 27+29‐32 EEPRP 1462 1% 75% Fle 26+28 PLKMI 75006 2% 86%
Fle 27+29‐32 EETMA 1413 1% 76% Fle 26+28 PLJAN 65657 2% 88%
Fle 27+29‐32 EEVJS 1378 1% 76% Fle 26+28 PLSBN 44155 1% 89%
Fle 27+29‐32 EEMKR 1353 1% 77% Fle 26+28 PLKUZ 43849 1% 90%
Fle 27+29‐32 EETIL 1322 1% 77% Fle 26+28 PLSOP 38944 1% 91%
Fle 27+29‐32 EEERU 1212 1% 78% Fle 26+28 PLORW 36155 1% 92%
Fle 27+29‐32 EEONN 1204 1% 78% Fle 26+28 PLMEC 33270 1% 93%
Fle 27+29‐32 EEELB 1184 1% 79% Fle 26+28 PLSWR 26225 1% 93%
Fle 27+29‐32 EELDJ 1153 0% 79% Fle 26+28 PLGKZ 22696 1% 94%
Fle 27+29‐32 SEBDQ 1147 0% 80% Fle 26+28 PLLEB 20135 0% 95%
Fle 27+29‐32 EEHRA 1136 0% 80%
Fle 27+29‐32 SELTT 1117 0% 81%
Fle 27+29‐32 EEHDI 1090 0% 81%
Fle 27+29‐32 SESLI 1060 0% 82%
Fle 27+29‐32 EEHIR 1039 0% 82% Stock Harbour kg % Cumulative %
Fle 27+29‐32 EETSI 1025 0% 83% Dab 22‐32 DEHHF 291899 22% 22%
Fle 27+29‐32 SEGR3 949 0% 83% Dab 22‐32 DEBSK 178220 13% 35%
Fle 27+29‐32 EEVHP 927 0% 83% Dab 22‐32 DEKAP 166183 12% 47%
Fle 27+29‐32 EEKAB 852 0% 84% Dab 22‐32 DKBAG 154131 11% 58%
Fle 27+29‐32 EESPE 850 0% 84% Dab 22‐32 DEHED 68924 5% 63%
Fle 27+29‐32 EESAM 822 0% 84% Dab 22‐32 DKSOB 52120 4% 67%
Fle 27+29‐32 EERON 776 0% 85% Dab 22‐32 DEMAO 34283 3% 70%
Fle 27+29‐32 EEMMA 762 0% 85% Dab 22‐32 DKSBK 33038 2% 72%
Fle 27+29‐32 EEKBU 744 0% 85% Dab 22‐32 DETRV 29364 2% 74%
Fle 27+29‐32 EENOL 716 0% 86% Dab 22‐32 DKROD 27064 2% 76%
Fle 27+29‐32 EEPSK 715 0% 86% Dab 22‐32 DKGED 24772 2% 78%
Fle 27+29‐32 EERGD 712 0% 86% Dab 22‐32 DKKTD 22220 2% 80%
Fle 27+29‐32 EEVRG 697 0% 87% Dab 22‐32 DEECK 20323 2% 81%
Fle 27+29‐32 EEKYT 682 0% 87% Dab 22‐32 DKSPB 18033 1% 83%
Fle 27+29‐32 EEVAU 630 0% 87% Dab 22‐32 DENDC 17554 1% 84%
Fle 27+29‐32 EEALI 610 0% 87% Dab 22‐32 DKLNG 16157 1% 85%
Fle 27+29‐32 EEKSM 604 0% 88% Dab 22‐32 DKFAB 15397 1% 86%
Fle 27+29‐32 EEJUM 598 0% 88% Dab 22‐32 DKKLH 14076 1% 87%
Fle 27+29‐32 EEHKS 592 0% 88% Dab 22‐32 DEWAR 12421 1% 88%
Fle 27+29‐32 EEMDR 583 0% 88% Dab 22‐32 DKSGD 10868 1% 89%
Fle 27+29‐32 EETYC 578 0% 89% Dab 22‐32 DKNBG 10044 1% 90%
Fle 27+29‐32 EEKRS 566 0% 89% Dab 22‐32 DKKRR 9020 1% 91%
Fle 27+29‐32 FIUnk 549 0% 89% Dab 22‐32 DELAB 8654 1% 91%
Fle 27+29‐32 EEABU 531 0% 89% Dab 22‐32 DKKRZ 7647 1% 92%
Fle 27+29‐32 EELUT 514 0% 90% Dab 22‐32 DKMRS 7628 1% 92%
Fle 27+29‐32 EESOE 513 0% 90% Dab 22‐32 DKLUN 7388 1% 93%
Fle 27+29‐32 EELHT 493 0% 90% Dab 22‐32 DKSKB 6574 0% 93%
Fle 27+29‐32 EELMS 471 0% 90% Dab 22‐32 DKAGO 6266 0% 94%
Fle 27+29‐32 EEMLK 468 0% 90% Dab 22‐32 DKKAL 6024 0% 94%
Fle 27+29‐32 EEPLS 463 0% 91% Dab 22‐32 DKSLT 5593 0% 95%
Fle 27+29‐32 EEPOK 456 0% 91%
Fle 27+29‐32 EERST 436 0% 91%
Fle 27+29‐32 EESUS 425 0% 91% Stock Harbour kg % Cumulative %
Fle 27+29‐32 FIKor 415 0% 91% Brill 22‐32 DKLNG 6098 20% 20%
Fle 27+29‐32 EETHK 401 0% 91% Brill 22‐32 DKBAG 3469 11% 31%
Fle 27+29‐32 EEPAO 397 0% 92% Brill 22‐32 DKMRS 2526 8% 39%
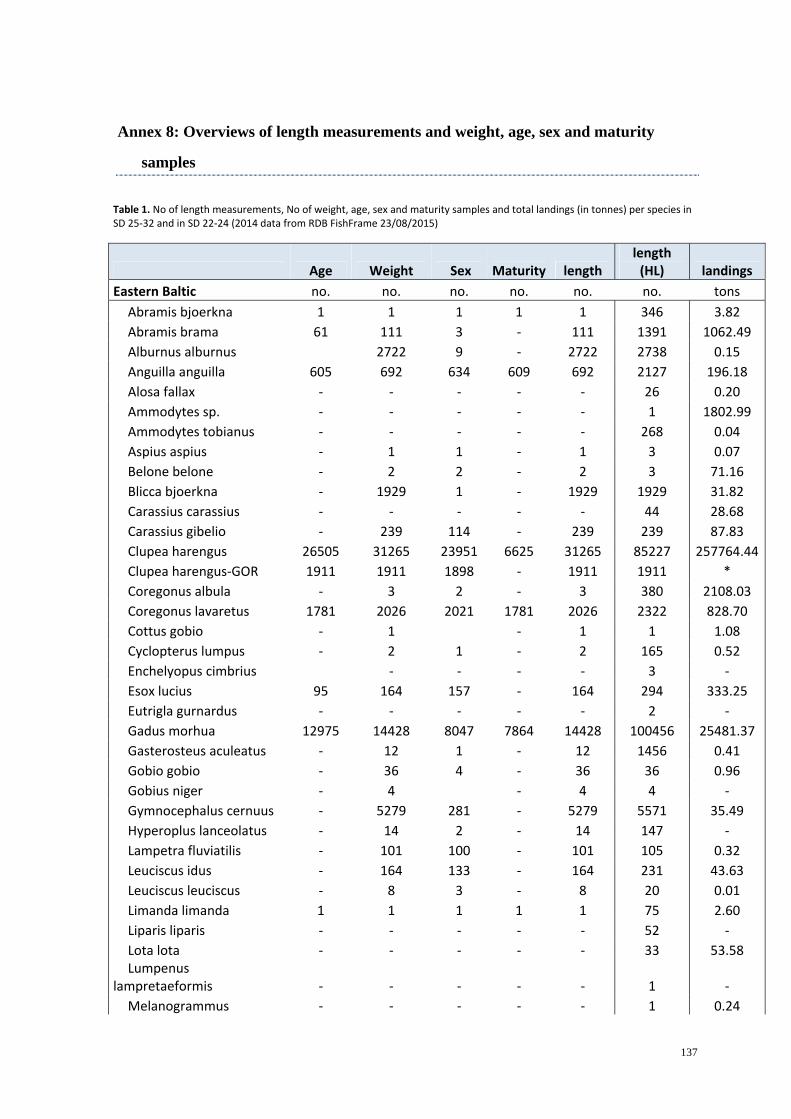
137
Annex 8: Overviews of length measurements and weight, age, sex and maturity
samples Table 1. No of length measurements, No of weight, age, sex and maturity samples and total landings (in tonnes) per species in SD 25‐32 and in SD 22‐24 (2014 data from RDB FishFrame 23/08/2015)
Age Weight Sex
Maturity length length (HL) landings
Eastern Baltic no. no. no. no. no. no. tons
Abramis bjoerkna 1 1 1 1 1 346 3.82
Abramis brama 61 111 3 ‐ 111 1391 1062.49
Alburnus alburnus 2722 9 ‐ 2722 2738 0.15
Anguilla anguilla 605 692 634 609 692 2127 196.18
Alosa fallax ‐ ‐ ‐ ‐ ‐ 26 0.20
Ammodytes sp. ‐ ‐ ‐ ‐ ‐ 1 1802.99
Ammodytes tobianus ‐ ‐ ‐ ‐ ‐ 268 0.04
Aspius aspius ‐ 1 1 ‐ 1 3 0.07
Belone belone ‐ 2 2 ‐ 2 3 71.16
Blicca bjoerkna ‐ 1929 1 ‐ 1929 1929 31.82
Carassius carassius ‐ ‐ ‐ ‐ ‐ 44 28.68
Carassius gibelio ‐ 239 114 ‐ 239 239 87.83
Clupea harengus 26505 31265 23951 6625 31265 85227 257764.44
Clupea harengus‐GOR 1911 1911 1898 ‐ 1911 1911 *
Coregonus albula ‐ 3 2 ‐ 3 380 2108.03
Coregonus lavaretus 1781 2026 2021 1781 2026 2322 828.70
Cottus gobio ‐ 1 ‐ 1 1 1.08
Cyclopterus lumpus ‐ 2 1 ‐ 2 165 0.52
Enchelyopus cimbrius ‐ ‐ ‐ ‐ 3 ‐
Esox lucius 95 164 157 ‐ 164 294 333.25
Eutrigla gurnardus ‐ ‐ ‐ ‐ ‐ 2 ‐
Gadus morhua 12975 14428 8047 7864 14428 100456 25481.37
Gasterosteus aculeatus ‐ 12 1 ‐ 12 1456 0.41
Gobio gobio ‐ 36 4 ‐ 36 36 0.96
Gobius niger ‐ 4 ‐ 4 4 ‐
Gymnocephalus cernuus ‐ 5279 281 ‐ 5279 5571 35.49
Hyperoplus lanceolatus ‐ 14 2 ‐ 14 147 ‐
Lampetra fluviatilis ‐ 101 100 ‐ 101 105 0.32
Leuciscus idus ‐ 164 133 ‐ 164 231 43.63
Leuciscus leuciscus ‐ 8 3 ‐ 8 20 0.01
Limanda limanda 1 1 1 1 1 75 2.60
Liparis liparis ‐ ‐ ‐ ‐ ‐ 52 ‐
Lota lota ‐ ‐ ‐ ‐ ‐ 33 53.58 Lumpenus
lampretaeformis ‐ ‐ ‐ ‐ ‐ 1 ‐
Melanogrammus ‐ ‐ ‐ ‐ ‐ 1 0.24

138
aeglefinus
Merlangius merlangus ‐ ‐ ‐ ‐ ‐ 81 2.49
Merluccius merluccius ‐ ‐ ‐ ‐ ‐ 1 0.01 Myoxocephalus
quadricornis ‐ 9 4 ‐ 9 247 0.78
Myoxocephalus scorpius ‐ 93 88 ‐ 93 498 78.18
Neogobius melanostomus ‐ 3277 16 ‐ 3277 3541 131.05
Nerophis ophidion ‐ 12 ‐ 12 24 ‐
Oncorhynchus mykiss ‐ ‐ ‐ ‐ ‐ 6 5.10
Osmerus eperlanus ‐ 1303 431 ‐ 1303 2456 2592.58
Oxyconger leptognathus ‐ ‐ ‐ ‐ ‐ 2 ‐
Pelecus cultratus ‐ ‐ ‐ ‐ ‐ 247 ‐
Perca fluviatilis 19211 21318 19510 2057 21318 24558 73.80
Platichthys flesus 4969 9108 8554 2777 9108 33195 2962.24
Pleuronectes platessa 278 283 175 174 283 3177 15719.61
Pollachius virens 6 6 6 6 6 183 200.73
Pomatoschistus minutus ‐ ‐ ‐ ‐ ‐ 1 31.27
Rutilus rutilus 1 3709 1666 1 3709 4496 1027.73
Salmo salar 2885 2868 2249 238 2894 2403 502.30
Salmo trutta 715 684 531 11 733 460 185.26
Sander lucioperca 835 3077 2342 2017 3102 3130 698.31 Scardinius
erythrophthalmus ‐ 470 10 ‐ 470 513 2.94
Scomber scombrus ‐ ‐ ‐ ‐ ‐ 1 0.92
Scophthalmus maximus 105 277 272 110 277 613 63.98
Spinachia spinachia ‐ 1 ‐ ‐ 1 1 ‐
Sprattus sprattus 20121 22089 17578 6906 22092 60270 217266.03
Taurulus bubalis ‐ 19 17 ‐ 19 20 ‐
Tinca tinca ‐ 9 8 ‐ 9 25 7.46
Triglopsis quadricornis ‐ ‐ ‐ ‐ ‐ 213 0.04
Vimba vimba 100 189 122 ‐ 189 220 144.90
Zoarces viviparus ‐ 175 3 ‐ 175 200 47.40
Age Weight Sex Maturity length length (HL) landings
Western Baltic no. no. no. no. no. no. tons
Abramis bjoerkna ‐ ‐ ‐ ‐ ‐ 2 16.26
Abramis brama ‐ ‐ ‐ ‐ ‐ 170 1021.94
Agonus cataphractus ‐ ‐ ‐ ‐ ‐ 26 ‐
Amblyraja radiata ‐ ‐ ‐ ‐ ‐ 6 ‐
Ammodytes marinus ‐ 789 ‐ ‐ 789 790 4812.79
Ammodytes marinus ‐ ‐ ‐ ‐ ‐ 789 ‐
Anguilla anguilla 445 449 371 215 449 483 382.91
Aspius aspius ‐ ‐ ‐ ‐ ‐ 3 3.82
Belone belone ‐ ‐ ‐ ‐ ‐ 6 330.00

139
Callionymus lyra ‐ ‐ ‐ ‐ ‐ 1 ‐
Callionymus maculatus ‐ ‐ ‐ ‐ ‐ 4 ‐
Carassius carassius ‐ ‐ ‐ ‐ ‐ 10 4.74
Carcinus maenas ‐ ‐ ‐ ‐ ‐ 171 2.86
Chelidonichthys cuculus ‐ ‐ ‐ ‐ ‐ 1 ‐
Chelidonichthys lucerna ‐ ‐ ‐ ‐ ‐ 9 0.06
Chelon labrosus ‐ ‐ ‐ ‐ ‐ 1 0.50
Clupea harengus 4673 6053 2536 2720 6053 16004 18289.74
Coregonus lavaretus ‐ ‐ ‐ ‐ ‐ 35 26.61
Cyclopterus lumpus ‐ ‐ ‐ ‐ ‐ 1197 318.30
Enchelyopus cimbrius ‐ ‐ ‐ ‐ ‐ 3 ‐
Engraulis encrasicolus ‐ ‐ ‐ ‐ ‐ 2 45.95
Entelurus aequoreus ‐ ‐ ‐ ‐ ‐ 1 ‐
Esox lucius ‐ ‐ ‐ ‐ ‐ 2 113.76
Eutrigla gurnardus ‐ ‐ ‐ ‐ ‐ 67 0.01
Gadus morhua 10514 11418 5038 5036 11418 34761 13327.18
Gasterosteus aculeatus ‐ 1 ‐ ‐ 1 1 ‐ Glyptocephalus
cynoglossus ‐ ‐ ‐ ‐ ‐ 4 0.24
Gobius niger ‐ ‐ ‐ ‐ ‐ 1 6.65
Gymnocephalus cernuus ‐ ‐ ‐ ‐ ‐ 20 1.40 Hippoglossoides
platessoides ‐ 2 2 2 371 4.36
Hyperoplus lanceolatus ‐ 1262 ‐ ‐ 1262 1267 ‐
Leuciscus cephalus ‐ ‐ ‐ ‐ ‐ 3 ‐
Leuciscus idus ‐ ‐ ‐ ‐ ‐ 3 ‐
Limanda limanda 1983 2258 1513 1515 2258 9660 1234.69
Lota lota ‐ ‐ ‐ ‐ ‐ 15 9.97 Lumpenus
lumpretaeformis ‐ ‐ ‐ ‐ ‐ 2 ‐ Melanogrammus
aeglefinus 1 1 1 1 1 34 2.21
Merlangius merlangus 1 41 1 1 41 1361 749.31
Merluccius merluccius 1 1 1 1 1 23 0.23
Microstomus kitt ‐ 1 1 ‐ 1 29 4.77
Myoxocephalus scorpius ‐ ‐ ‐ ‐ ‐ 155 ‐ Neogobius
melanostomus ‐ ‐ ‐ ‐ ‐ 292 ‐
Nephrops norvegicus ‐ ‐ ‐ ‐ ‐ 322 1.32
Oncorhynchus mykiss ‐ ‐ ‐ ‐ ‐ 1 1.88
Osmerus eperlanus ‐ ‐ ‐ ‐ ‐ 14 ‐
Osteichthyes ‐ ‐ ‐ ‐ ‐ 1 239.77
Perca fluviatilis 213 213 213 213 213 1706 1270.02
Platichthys flesus 3912 4288 3433 3350 4288 15188 3857.96
Pleuronectes platessa 3243 3359 1605 1509 3359 14011 1819.48
Pollachius virens 41 54 41 41 54 1227 103.33

140
Rutilus rutilus 3 3 3 3 3 1095 1220.48
Salmo salar 187 189 ‐ ‐ 189 272 75.75
Salmo trutta 1 ‐ ‐ 1 22 27.11
Sander lucioperca 202 202 202 202 202 301 488.52 Scardinius
erythrophthalmus ‐ ‐ ‐ ‐ ‐ 1 ‐
Scomber scombrus ‐ ‐ ‐ ‐ ‐ 60 14.99
Scophthalmus maximus 405 516 500 500 516 695 190.32
Scophthalmus rhombus 23 26 26 26 26 92 27.87
Scyliorhinus canicula ‐ ‐ ‐ ‐ ‐ 1 ‐
Solea solea 27 28 25 ‐ 28 128 47.66
Sprattus sprattus 1182 1892 698 720 1892 4110 4533.04
Symphodus melops ‐ ‐ ‐ ‐ ‐ 78 ‐
Syngnathus typhle ‐ 1 ‐ ‐ 1 1 ‐
Taurulus bubalis ‐ ‐ ‐ ‐ ‐ 5 ‐
Trachurus trachurus ‐ 13 ‐ ‐ 13 16 276.51
Trisopterus esmarkii ‐ ‐ ‐ ‐ ‐ 1 ‐
Vimba vimba ‐ ‐ ‐ ‐ ‐ 5 0.08
Zoarces viviparus ‐ ‐ ‐ ‐ ‐ 21 2.07

141
Table 2. No of length measurements and No of weight, age, sex and maturity samples per species and country in SD 25‐32 and SD 22‐24 (2014 data from RDB FishFrame 23/08/2015)
Eastern Baltic Age Weight Sex
Maturity length length (HL) landings
no. no. no. no. no. no. tons
DEU
Clupea harengus 2 2 2 237 1731.33
Gadus morhua 638 899 899 899 899 3888 676.32
Limanda limanda 1 1 1 1 1 1 2.10
Platichthys flesus 351 400 400 400 400 451 211.81
Pleuronectes platessa 21 23 23 23 23 36 0.36
Sprattus sprattus 969 969 969 5165 9528.43
DNK
Clupea harengus 174 190 190 190 3316.78
Gadus morhua 1132 2126 2126 9972 5926.79
Gasterosteus aculeatus 6
6 6 ‐
Platichthys flesus 26 26 26 1847 1350.57
Pleuronectes platessa 106 108 108 679 115.37
Scophthalmus maximus 1 1 8 0.86
Sprattus sprattus 877 2760 2760 1881 24114.11
EST Abramis brama 50 3 50 50 12.93
Alburnus alburnus 2722 9 2722 2722 0.15
Anguilla anguilla 7 7 7 1.09
Aspius aspius 1 1 1 1
Belone belone 2 2 2 2 43.85
Blicca bjoerkna 1929 1 1929 1929 30.45
Carassius gibelio 239 114 239 239 87.83
Clupea harengus 6057 10325 5994 10325 10374 23130.11
Clupea harengus‐GOR 1911 1911 1898 1911 1911 *
Coregonus albula 3 2 3 3
Coregonus lavaretus 243 239 243 243 26.06
Cottus gobio 1 1 1
Cyclopterus lumpus 2 1 2 2
Esox lucius 95 162 157 162 162 65.53
Gadus morhua 193 183 193 193 165.17
Gasterosteus aculeatus 6 1 6 6 0.30
Gobio gobio 36 4 36 36
Gobius niger 4 4 4
Gymnocephalus cernuus 5279 281 5279 5279 35.31
Hyperoplus lanceolatus 14 2 14 14

142
Lampetra fluviatilis 101 100 101 101 0.31
Leuciscus idus 164 133 164 164 12.01
Leuciscus leuciscus 8 3 8 8
Myoxocephalus quadricornis 9 4 9 9
Myoxocephalus scorpius 93 88 93 93
Neogobius melanostomus 3277 16 3277 3277 19.19
Nerophis ophidion 12 12 12
Osmerus eperlanus 1303 431 1303 1303 234.02
Perca fluviatilis 19086 19259 17451 19259 19259 1566.85
Platichthys flesus 776 4631 4463 4631 4631 313.13
Pleuronectes platessa 1 1 1 1
Rutilus rutilus 3708 1665 3708 3708 93.36
Salmo salar 42 47 47 47 47 5.28
Salmo trutta 134 147 136 147 147 14.83
Sander lucioperca 48 293 211 293 293 173.31
Scardinius erythrophthalmus 470 10 470 470 2.67
Scophthalmus maximus 166 162 166 166 0.10
Spinachia spinachia 1 1 1
Sprattus sprattus 6838 6890 6587 6893 15171 28498.28
Taurulus bubalis 19 17 19 19
Tinca tinca 9 8 9 9 6.88
Vimba vimba 100 189 122 189 189 83.99
Zoarces viviparus 175 3 175 175 0.18
FIN
Clupea harengus 2702 3126 2616 2493 3126 33240 130414.08
Coregonus lavaretus 1781 1783 1782 1781 1783 1783 656.33
Esox lucius 2 2 2 221.33
Perca fluviatilis 1934 1934 1933 1934 1934 1062.78
Sprattus sprattus 9244 11811.60
Salmo salar 1629 1633 1117 1 1633 1633 249.32
Salmo trutta 5 5 5 5 5 35.14
Sander lucioperca 2022 2015 1907 2022 2022 362.27
LTU
Clupea harengus 1504 1504 1498 1504 1504 2581 2127.24
Gadus morhua 2401 2401 1580 1581 2401 7702 1185.72
Platichthys flesus 1553 1553 1553 1553 1553 4081 733.54
Pleuronectes platessa 34 34 34 34 34 41 ‐
Scophthalmus maximus 20 25 25 25 25 188 7.34
Sprattus sprattus 790 790 708 790 790 2071 9679.23
LVA
Anguilla anguilla 76 25 76 76 0.20
Clupea harengus 7105 7105 5048 7105 12136 23314.67
Gadus morhua 2871 2871 2871 2871 2871 31845 1998.95
Platichthys flesus 1039 1039 1039 1039 8104 1865.65
Pleuronectes platessa 97 ‐

143
Salmo salar 506 480 377 506 506 3.82
Salmo trutta 297 248 106 297 309 8.99
Sander lucioperca 604 579 604 605 2.71
Scophthalmus maximus 87 7.16
Sprattus sprattus 3558 3558 3183 3156 3558 7366 30760.84
POL
Abramis bjoerkna 1 1 1 1 1 1 3.82
Abramis brama 61 61 61 61 145.28
Anguilla anguilla 205 205 205 205 205 213 19.69
Clupea harengus 2631 2631 2631 2628 2631 11352 25895.30
Gadus morhua 2514 2514 2514 2513 2514 18187 11027.28
Perca fluviatilis 125 125 125 124 125 125 174.91
Platichthys flesus 824 824 824 824 824 7086 11032.23
Pleuronectes platessa 117 117 117 117 117 342 65.02
Pollachius virens 6 6 6 6 6 6 ‐
Rutilus rutilus 1 1 1 1 1 1 131.79
Salmo salar 708 708 708 237 708 720 15.06
Salmo trutta 284 284 284 6 284 296 112.54
Sander lucioperca 183 183 116 110 183 183 143.11
Scophthalmus maximus 85 85 85 85 85 139 22.80
Sprattus sprattus 2967 2967 2967 2960 2967 15139 56938.57
SWE
Anguilla anguilla 400 404 404 404 404 1214 174.84
Clupea harengus 6330 6382 6164 6382 15117 47834.93
Gadus morhua 3419 3424 3424 28669 4125.00
Limanda limanda 75 0.50
Pleuronectes platessa 2004 19.95
Scophthalmus maximus 24 18.55
Platichthys flesus 400 635 275 635 6992 208.06
Sprattus sprattus 4122 4155 4133 4155 4233 45934.96
Western Baltic Age Weight Sex
Maturity length length (HL) landings
no. no. no. no. no. no. tons
DEU
Anguilla anguilla 1 46.69
Clupea harengus 1934 1934 1934 1934 9747 10227.59
Gadus morhua 4221 4537 4537 4535 4537 7744 3243.00
Hippoglossoides platessoides 2 2 2 2 4.36
Limanda limanda 1266 1515 1513 1515 1515 2815 826.81
Microstomus kitt 1 1 1 1 0.03
Platichthys flesus 2558 2839 2837 2838 2839 3545 1340.53
Pleuronectes platessa 1381 1483 1477 1479 1483 1150 376.67
Salmo salar 3 1.25
Salmo trutta 13 14.58
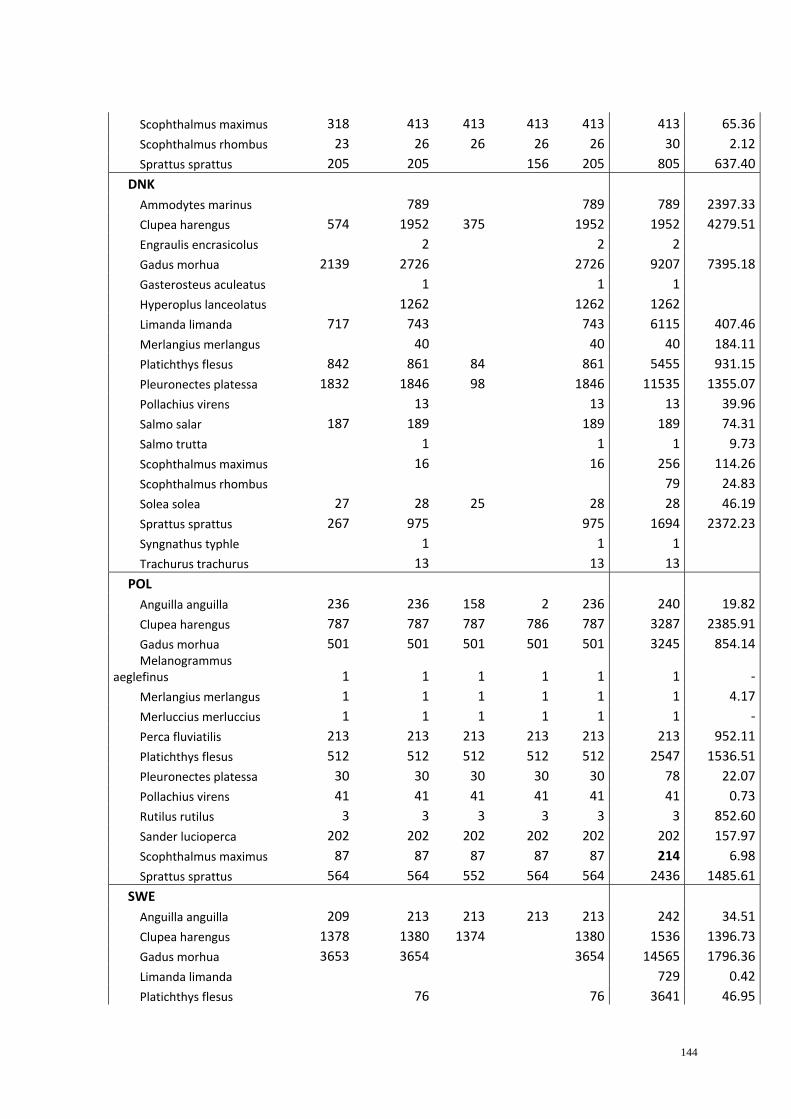
144
Scophthalmus maximus 318 413 413 413 413 413 65.36
Scophthalmus rhombus 23 26 26 26 26 30 2.12
Sprattus sprattus 205 205 156 205 805 637.40
DNK
Ammodytes marinus 789 789 789 2397.33
Clupea harengus 574 1952 375 1952 1952 4279.51
Engraulis encrasicolus 2 2 2
Gadus morhua 2139 2726 2726 9207 7395.18
Gasterosteus aculeatus 1 1 1
Hyperoplus lanceolatus 1262 1262 1262
Limanda limanda 717 743 743 6115 407.46
Merlangius merlangus 40 40 40 184.11
Platichthys flesus 842 861 84 861 5455 931.15
Pleuronectes platessa 1832 1846 98 1846 11535 1355.07
Pollachius virens 13 13 13 39.96
Salmo salar 187 189 189 189 74.31
Salmo trutta 1 1 1 9.73
Scophthalmus maximus 16 16 256 114.26
Scophthalmus rhombus 79 24.83
Solea solea 27 28 25 28 28 46.19
Sprattus sprattus 267 975 975 1694 2372.23
Syngnathus typhle 1 1 1
Trachurus trachurus 13 13 13
POL
Anguilla anguilla 236 236 158 2 236 240 19.82
Clupea harengus 787 787 787 786 787 3287 2385.91
Gadus morhua 501 501 501 501 501 3245 854.14Melanogrammus
aeglefinus 1 1 1 1 1 1 ‐
Merlangius merlangus 1 1 1 1 1 1 4.17
Merluccius merluccius 1 1 1 1 1 1 ‐
Perca fluviatilis 213 213 213 213 213 213 952.11
Platichthys flesus 512 512 512 512 512 2547 1536.51
Pleuronectes platessa 30 30 30 30 30 78 22.07
Pollachius virens 41 41 41 41 41 41 0.73
Rutilus rutilus 3 3 3 3 3 3 852.60
Sander lucioperca 202 202 202 202 202 202 157.97
Scophthalmus maximus 87 87 87 87 87 214 6.98
Sprattus sprattus 564 564 552 564 564 2436 1485.61
SWE
Anguilla anguilla 209 213 213 213 213 242 34.51
Clupea harengus 1378 1380 1374 1380 1536 1396.73
Gadus morhua 3653 3654 3654 14565 1796.36
Limanda limanda 729 0.42
Platichthys flesus 76 76 3641 46.95

145
Pleuronectes platessa 1248 65.66
Salmo salar 4 0.05
Salmo trutta 6 0.18
Scophthalmus maximus 15 3.72
Scophthalmus rhombus 9 0.92
Sprattus sprattus 146 148 146 148 150 37.80

146
Annex 9: Sampling intensity on salmon, sea trout and eel Remark: Not all MS (e.g. Sweden and Finland) have yet uploaded their historical datasets on the biological sampling of salmon, sea trout and eel.

147
Table 1: Overview of uploaded biological data on Eel (stock eel‐eur), Salmon (stocks sal‐2431 and sal‐32) and Sea trout (stock
trt‐bal) per year and member state (in RDB FishFrame per 23/08/2015).
Stock FlagCountry Year Age Weight Sex Maturity Length
eel‐eur
DNK 2009 75 81 81
2010 89 102 102
2011 189 189
2012 203 203
EST 2011 20 20
2012 13 13
2013 15 15
2014 7 7
LVA 2009 103 101 103
2010 155 155 155
2011 91 41 91
2012 54 51 54
2013 107 89 108
2014 76 25 76

148
POL 2009 369 369 369 369 369
2010 326 326 326 151 326
2011 332 332 332 332 332
2012 399 399 399 383 399
2013 382 382 382 290 382
2014 441 441 363 207 441
SWE 2012 703 714 714 714 714
2013 584 590 590 589 590
2014 609 617 617 617 617
sal‐2431
DEU 2013 103 103
DNK 2010 45 45
2011 256 256 256
2012 490 490 490
2013 271 344 344
2014 187 189 189
EST 2012 1 2 2 2
2013 19 20 20 20
2014 2 3 3 3
FIN 2010 862 867 580 1 868
2011 1203 1207 933 1207
2012 1815 1824 1382 1824
2013 1035 1038 657 1 1038
2014 1219 1223 707 1 1223
LVA 2010 457 456 457 457
2011 341 341 317 341
2012 852 852 845 852
2013 869 868 836 869
2014 506 480 377 506
POL 2010 251 251 251 239 251
2011 320 320 320 134 320
2012 363 363 363 28 363
2013 584 584 584 279 584
2014 708 708 708 237 708
sal‐32
EST 2009 3 39 39 39
2010 1 1 1
2011 49 49 49
2012 58 58 58 58
2013 75 75 69 75
2014 40 44 44 44
FIN 2014 410 410 410 410
trt‐bal
DNK 2014 1 1
EST 2009 187 137 187
2010 52 47 52
2011 190 181 190

149
2012 173 158 173
2013 206 210 197 210
2014 134 147 136 147
FIN 2010 24 22 22 24
2011 27 26 27 27
2012 20 37 36 16 37
2013 17 17 17 17
2014 5 5 5 5
LVA 2013 236 236 162 237
POL 2009 607 607 607 20 607
2010 394 394 394 2 394
2011 455 455 455 3 455
2012 621 621 621 8 621
2013 168 168 168 3 168
2014 284 284 284 6 284

150
Annex 10. Reply to questionaires on implementation of the landing obligation in the
Baltic A questionnaire for all MS involved in the discard sampling of Baltic Sea cod fisheries (DK, DE, LT, LV, PL, SE) in order to evaluate the consequences of the landing obligation to data sampling Do you have any problem in running you at sea observer programme?
No change • A number of vessels' owner are cooperating and are always ready to carry observers. Their approach
did not change and no problems in observer’s placement. • Sometimes problems to get on board of some >12 m vessels, cod bottom trawlers. • Presently no problems in running the observer programme. • Procurement procedure – fishers contractedly committed. • Did not manage to carry out any observer trips on demersal trawlers in the Baltic in the first quarter.
Self-sampling program for fisheries with passive gears, “discards” landed for sampling. Are the fishermen willing to carry observers onboard? • Yes. Presently, we have our first observer trip on a trawler in SD25. • We have a number of vessels' owner cooperating with us and always ready to take our observers. • Sometimes problems to get on board of some >12 m vessels, cod bottom trawlers. • Fishermen are still willing to bring observers onboard. • We don’t have problems to send our observers on vessels of the fishing firms with whom we have signed contracts. • In the first quarter no. A main problem though is to get firm answers from the fishermen. During
second quarter, the situation has slightly improved. For passive gears there have been few problems so far.
Do the fishermen change behavior when having an observer onboard? • No change in fishing place or gear; but sorting practices onboards may change. • Those vessels' owner willing to take our observers (cooperating with us for years) do not change
behavior when having our observers on onboard. • Not notably. • It is off course difficult to know 100%, however, most of our observer working in the Baltic have
not experienced anyone actually landing the “below reference size cod” but they are still discarded – also with observers onboard.
• With observer on board fishermen are working as usually, no changes in their behavior are observed.
• We do not know, since we have not been able to conduct any trips. Previously in the Baltic fisheries we have not seen observer effects. However, it might the case that the fishermen refuse to take observers instead of changing behavior.
Are the estimates of volume in weight of cod below the MCRS from the observers at the same magnitude as those recorded by the fishermen in the logbooks? • We have no yet received logbook entries from Q1 2015 but there is informal evidence that the
logbook entries underestimate the true amounts of BMS; hence there are unallocated discards taking place (because every ton discarded at sea is a ton of marketable cod that can be caught later in the year).
• No. From our observations it is clear that official records of undersized fish cought in the logbooks is marginal and far away from actual discards (which are still a common practice). Usually it is only one-two boxes of cod below MCRS landed to demonstrate such by catch which does not reflect the reality.
• Seems to be the same. • Have to check but I could not imagine. • Comparison of 2 trips (one from gillnetter and one from trawler) were performed - observer data
against fishermen’s catch data from electronic logbooks. Gillnetter landed cod in foreign harbour. Part of unwanted cod catch was very small – 43.7 kg (approximately 1.3% from the total catch). Fishermen’s did not deliver these fishes to the harbour. Reason – no possibilities to land these fish,

151
fish amount is very small. Fishery inspection is informed about this situation and accepts it. Trawler delivered 280 kg of unwanted cod catch to domestic harbour and unloaded it. According the observer data unvented cod catch was 548 kg (approximately 7% from the total catch).
• It is difficult to answer this question as we have not carried out any trips yet. However, given the length frequency of discard from former years and that the new MCRS are anticipating the discard volume of cod to be in the size range of 15-20% (preliminary figure) to be compared to approx. 2% (preliminary figure) in the logbooks.
Do you estimate that the quality of the landings data to be at the same quality as before the implementation of the landing obligation? • Landings data: Yes. But the BMS data are certainly minimum estimates. • Basically YES - as the fishermen's behavior and practice did not change from 1st January 2015, the
official records of fish under MCRS reported in logbooks is still marginal as compared to reality, based on trips with our observers onboard.
• Yes for the coastal fleet and trawlers in Baltic Sea, since the landing obligation has been included in national law previously.
• No • Fishermen don’t land all unwanted cod catches. • It is still early to judge but figures from the first quarter indicates that fish below MCRS is
underestimated. Do the fishermen land all catches of cod below the MCRS? • No. They seem to discard cod below MCRS at sea to variable amounts. That is, the reduction of
MLS from 38 cm to 35 cm MCRS for cod has led to (1) the landing of all cod =>35 cm, and (2) the landing of BMS cod (<35 cm) BUT at unrealistically low amounts so that we assume that cod <35 cm are still discarded at sea.
• From our observations it is clear that official records of undersized fish caught in the logbooks is marginal and far away from actual discards (which are still a common practice). Usually it is only one-two boxes of cod below MCRS landed to demonstrate such by catch which does not reflect the reality.
• In coastal fishery, there are very small amounts of cod catches which are landed (7 tons in 2014, mostly gill nets). In trawl fishery (158 tons in 2014, with OTB) all catches of cod are landed due to the landing obligation.
• Main part of the landings below MRC is from camera vessels. • Fishermen don’t land all unwanted cod catches • Discard volume of cod to be in the size range of 15-20% (preliminary figure) to be compared to
approx. 2% (preliminary figure) in the logbooks. Any other information on the issue? • The landing obligation improved our opportunities to sample age and length distribution of BMS
cod in the ports (more discard length distributions and more age distribution than in previous years). BUT: We know that there is an unknown amount of unallocated discards taking place (BMS cod). In case of the Western Baltic cod (SD2223), this is not too much of a problem because the discard rate is presently <5% and we could use estimates from previous years. But for Eastern Baltic, present discard rates at sea may be about 20% or higher while the reported amount of BMS cod may be <5%.
• There is rumours about agreement among fishermen about the amount of unwanted cod catch which is landed in the harbour. Idea – part of the unwanted cod catch should be more or less similar for all fishermen.
• Control authorities in the different MS are carrying out sea based measurements of the amount of cod below MCRS within ECFA’s last haul project. We do not know if these figures are public so far, but we think that it would be very wise to include them in an analysis of the quality of data from different sources (logbook, control and observers) of cod below MCRS.