Rating Matrix Gulf Oil Lubricants (GULO) - ICICI...
26
Initiating Coverage ICICI Securities Ltd | Retail Equity Research Lower crude prices to smoothen ride .... Gulf Oil Lubricants (GOL), part of the Hinduja group, is one of the leading private players in the domestic lubricant business. GOL was recently de- merged from Gulf Oil Corporation to have a pure India lubricants play, which is focused on accelerated growth. The company caters mainly to the automotive and industrial lubricant segments, including the marine segment. The automotive lubricants segment, which contributes 74% to the business, remains the key growth driver for the company. GOL has succeeded in increasing the market share in the automotive segment from 4.4% to 6.5% in the last seven years. The industrial lubricants segment, which contributes 26% to the business, is also expected to pick up with an improvement in industrial activities and new OEM tie-ups. We expect GOL to grow its revenues at a CAGR of 4% in FY14-17E on the back of strong growth in volumes. Profit is expected to increase at 16.4% CAGR in FY14-17E to | 105.9 crore in FY17E on account of higher margins. We initiate coverage on Gulf Oil Lubricants with a HOLD rating. Sharp decline in crude oil prices to boost margins With the sharp decline in crude oil prices over the past few months, raw material costs (base oil prices) have reduced for the company, which would lead to an improvement in margins. The impact of lower base oil prices is expected to start reflecting in raw material costs from Q4FY15E. Subsequently, we expect the EBITDA to increase from | 16.8/litre in FY14 to | 22.4/litre in FY17E. Volumes to increase at 6.4% CAGR over FY14-17E on revival in economy GOL had delivered strong volume growth of 11.7% CAGR over FY09-14. However, its volume remained subdued over the last two years (2.6% CAGR) due to the slowdown in the Indian economy. With the expected increase in market share and revival in the automobile sales and industrial growth, we believe GOL’s volumes will increase at 6.4% CAGR over FY14- 17E from 64.2 million litre in FY14 to 77.4 million litre in FY17E. Focus on bazaar trade segment & OEM tie-ups to create shareholder value GOL’s strong focus on personal mobility has led to an increase in its market share in the bazaar trade segment from 4.4% in FY07 to 6.9% in FY14, which will remain the key driver for the automotive lubricant business. New OEM tie-ups through aggressive marketing are also expected to help GOL gain market share in the industrial segment and create shareholder value. We value Gulf Oil Lubricant at 24x FY17E EPS of | 21.4 to arrive at a target price of | 513 with a HOLD recommendation. Exhibit 1: Financial Performance (Year-end March) FY13 FY14 FY15E FY16E FY17E Revenues (| crore) 847.0 881.8 947.2 935.5 991.8 EBITDA (| crore) 108.2 107.8 130.4 165.0 173.1 Net Profit (| crore) 71.7 67.1 78.1 99.9 105.9 EPS (|) 14.5 13.5 15.8 20.2 21.4 P/E (x) 33.0 35.3 30.3 23.7 22.4 Price / Book (x) NA NA 11.4 9.3 7.8 EV/EBITDA (x) NA NA 19.0 15.0 14.3 RoCE (%) NA NA 33.3 38.3 37.4 RoE (%) NA NA 37.5 39.0 34.9 Source: Company, ICICIdirect.com Research *Net profit and EPS for FY13 and FY14 is based on our internal estimates Gulf Oil Lubricants (GULO) | 478 Rating Matrix Rating : Hold Target : | 513 Target Period : 12 months Potential Upside : 7% YoY growth (%) (YoY Growth) FY14 FY15E FY16E FY17E Revenues 4.1 7.4 (1.2) 6.0 EBITDA (0.3) 20.9 26.6 4.9 Net Profit (6.4) 16.3 28.0 6.0 EPS (6.4) 16.3 28.0 6.0 Valuation summary FY14 FY15E FY16E FY17E P/E 35.3 30.3 23.7 22.4 Target P/E 37.9 32.6 25.4 24.0 EV / EBITDA NA 19.0 15.0 14.3 P/BV NA 11.4 9.3 7.8 RoNW (%) NA 37.5 39.0 34.9 RoCE (%) NA 33.3 38.3 37.4 Stock Data Bloomberg/Reuters Code GOLI IN/ GOLU NS Sensex 28,437 Average volumes 388,278 Market Cap (| crore) 2,369.6 52 week H/L 565/221 Equity Capital (| crore) 9.9 Promoter's Stake (%) 60.0 FII Holding (%) 12.3 DII Holding (%) 10.2 Comparative return matrix (%) Return % 1M 3M 6M 12M Castrol India (4.5) (4.3) 18.1 67.8 Tide Water Oil (11.9) (16.6) 4.9 99.9 Gulf Oil Lube. 0.0 (4.9) 53.4 - Price movement 0 100 200 300 400 500 600 700 Mar-15 Jan-15 Dec-14 Oct-14 Sep-14 3,000 4,000 5,000 6,000 7,000 8,000 9,000 10,000 Price (R.H.S) Nifty (L.H.S) Research Analyst Mayur Matani [email protected] Utkarsh Tathagath [email protected] March 17, 2015
-
Upload
vuongxuyen -
Category
Documents
-
view
214 -
download
0
Transcript of Rating Matrix Gulf Oil Lubricants (GULO) - ICICI...

Initiating Coverage
ICICI Securities Ltd | Retail Equity Research
Lower crude prices to smoothen ride.... Gulf Oil Lubricants (GOL), part of the Hinduja group, is one of the leading private players in the domestic lubricant business. GOL was recently de-merged from Gulf Oil Corporation to have a pure India lubricants play, which is focused on accelerated growth. The company caters mainly to the automotive and industrial lubricant segments, including the marine segment. The automotive lubricants segment, which contributes 74% to the business, remains the key growth driver for the company. GOL has succeeded in increasing the market share in the automotive segment from 4.4% to 6.5% in the last seven years. The industrial lubricants segment, which contributes 26% to the business, is also expected to pick up with an improvement in industrial activities and new OEM tie-ups. We expect GOL to grow its revenues at a CAGR of 4% in FY14-17E on the back of strong growth in volumes. Profit is expected to increase at 16.4% CAGR in FY14-17E to | 105.9 crore in FY17E on account of higher margins. We initiate coverage on Gulf Oil Lubricants with a HOLD rating.
Sharp decline in crude oil prices to boost margins
With the sharp decline in crude oil prices over the past few months, raw material costs (base oil prices) have reduced for the company, which would lead to an improvement in margins. The impact of lower base oil prices is expected to start reflecting in raw material costs from Q4FY15E. Subsequently, we expect the EBITDA to increase from | 16.8/litre in FY14 to | 22.4/litre in FY17E.
Volumes to increase at 6.4% CAGR over FY14-17E on revival in economy
GOL had delivered strong volume growth of 11.7% CAGR over FY09-14. However, its volume remained subdued over the last two years (2.6% CAGR) due to the slowdown in the Indian economy. With the expected increase in market share and revival in the automobile sales and industrial growth, we believe GOL’s volumes will increase at 6.4% CAGR over FY14-17E from 64.2 million litre in FY14 to 77.4 million litre in FY17E.
Focus on bazaar trade segment & OEM tie-ups to create shareholder value
GOL’s strong focus on personal mobility has led to an increase in its market share in the bazaar trade segment from 4.4% in FY07 to 6.9% in FY14, which will remain the key driver for the automotive lubricant business. New OEM tie-ups through aggressive marketing are also expected to help GOL gain market share in the industrial segment and create shareholder value. We value Gulf Oil Lubricant at 24x FY17E EPS of | 21.4 to arrive at a target price of | 513 with a HOLD recommendation.
Exhibit 1: Financial Performance
(Year-end March) FY13 FY14 FY15E FY16E FY17ERevenues (| crore) 847.0 881.8 947.2 935.5 991.8 EBITDA (| crore) 108.2 107.8 130.4 165.0 173.1 Net Profit (| crore) 71.7 67.1 78.1 99.9 105.9 EPS (|) 14.5 13.5 15.8 20.2 21.4 P/E (x) 33.0 35.3 30.3 23.7 22.4 Price / Book (x) NA NA 11.4 9.3 7.8 EV/EBITDA (x) NA NA 19.0 15.0 14.3 RoCE (%) NA NA 33.3 38.3 37.4 RoE (%) NA NA 37.5 39.0 34.9
Source: Company, ICICIdirect.com Research *Net profit and EPS for FY13 and FY14 is based on our internal estimates
Gulf Oil Lubricants (GULO)| 478
Rating Matrix Rating : HoldTarget : | 513Target Period : 12 monthsPotential Upside : 7%
YoY growth (%)
(YoY Growth) FY14 FY15E FY16E FY17ERevenues 4.1 7.4 (1.2) 6.0 EBITDA (0.3) 20.9 26.6 4.9 Net Profit (6.4) 16.3 28.0 6.0 EPS (6.4) 16.3 28.0 6.0
Valuation summary
FY14 FY15E FY16E FY17EP/E 35.3 30.3 23.7 22.4 Target P/E 37.9 32.6 25.4 24.0 EV / EBITDA NA 19.0 15.0 14.3 P/BV NA 11.4 9.3 7.8 RoNW (%) NA 37.5 39.0 34.9 RoCE (%) NA 33.3 38.3 37.4
Stock Data
Bloomberg/Reuters Code GOLI IN/ GOLU NSSensex 28,437 Average volumes 388,278 Market Cap (| crore) 2,369.6 52 week H/L 565/221Equity Capital (| crore) 9.9 Promoter's Stake (%) 60.0 FII Holding (%) 12.3 DII Holding (%) 10.2
Comparative return matrix (%)
Return % 1M 3M 6M 12M
Castrol India (4.5) (4.3) 18.1 67.8
Tide Water Oil (11.9) (16.6) 4.9 99.9
Gulf Oil Lube. 0.0 (4.9) 53.4 -
Price movement
0100200300400500600700
Mar
-15
Jan-
15
Dec-
14
Oct-1
4
Sep-
14
3,0004,0005,0006,0007,0008,0009,000
10,000
Price (R.H.S) Nifty (L.H.S)
Research Analyst
Mayur Matani
Utkarsh Tathagath
March 17, 2015
Page 2ICICI Securities Ltd | Retail Equity Research
Company background The ‘Gulf’ brand has been present in India since 1920s and is currently a part of the Hinduja Group. The Hinduja Group acquired Gulf from Chevron in the late 1980s and owns the rights to the brand for all countries worldwide, except Portugal, Spain and the US. The Indian lubricant business of the group is under the listed entity, Gulf Oil Lubricants (GOL). GOL was demerged from Gulf Oil Corporation as a separate entity In July 2014 to have a pure India lubricants play. The company derives 99% of revenues domestically while exports accounts for 1% of revenues. The company caters mainly to the automotive and industrial lubricant segment, including the marine segment. The automotive lubricants segment contributes 74% to the total business while the industrial lubricants (B2B) segment accounts for remaining 26% of the total business. The diesel engine segment contributes ~50% of its revenue followed by the two-wheeler segment and passenger car segment that contribute ~20% and ~7%, respectively. In the B2B segment, OEMs, state transport units and direct industrial segments have ~71% share followed by fleet & construction with ~25% and marine with ~4% share. GOL recently entered the two wheeler battery segment and will decide its future strategy based on synergy of sales channel and demand outlook. GOL currently has its plant in Silvassa with a capacity of 75,000 tonne. This is being expanded to 95,000 tonnes with a capex of around | 40 crore. The company is building a new plant in Chennai (with a capacity of 75,000 tonnes and capex of | 125 crore) in phases for which land has been acquired. GOL has a vast presence with depots and retailers’ network that form the major support for the company. It has 33 sales office and depots with over 50,000 retailers across India. GOL is also strong in OEM tie-ups and onsite services in the B2B segment, including workshops and service centres. The company has been aggressively advertising and marketing its brand over the past few years and has advertising spending of 6-7% of revenues. GOL’s marketing initiative with IPL teams, sporting events and brand focused approach have helped it to increase its market share. The company currently pays a royalty of ~1.5% of gross revenues to parent Gulf Oil International Inc. The next renewal of royalty will be in 2017. In the last four years, revenues and EBIT have grown at a CAGR of 15.4% and 28.9%, respectively. However, due to adverse economic conditions and a slowdown in volumes, revenues and EBIT in the last two years have recorded growth at a CAGR of 3.6% and 4.6%, respectively. Exhibit 2: Overview of Gulf Oil Lubricant market segments in FY14
Source: Company, ICICIdirect.com Research
Shareholding pattern (%) – Q3CY14
(in %) Dec-13 Mar-14 Jul-14 Sep-14 Dec-14Promoter NA NA 60.0 60.0 60.0FII NA NA 5.1 12.6 12.3DII NA NA 6.9 7.8 10.2Others NA NA 28.0 19.8 17.6
FII & DII holding trend (%)
12.6 12.3
5.1 6.97.8
10.2
-2.04.06.08.0
10.012.014.0
Q1FY
15
Q2FY
15
Q3FY
15
%
FII DII
Page 3ICICI Securities Ltd | Retail Equity Research
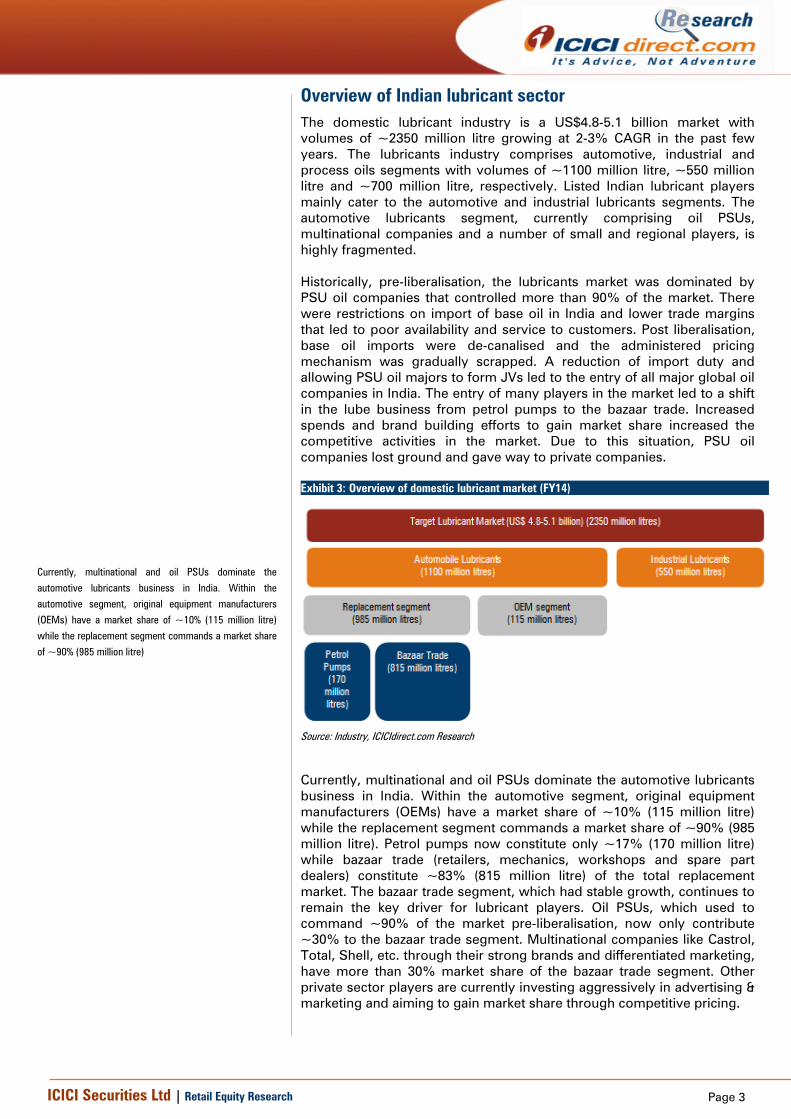
Overview of Indian lubricant sector The domestic lubricant industry is a US$4.8-5.1 billion market with volumes of ~2350 million litre growing at 2-3% CAGR in the past few years. The lubricants industry comprises automotive, industrial and process oils segments with volumes of ~1100 million litre, ~550 million litre and ~700 million litre, respectively. Listed Indian lubricant players mainly cater to the automotive and industrial lubricants segments. The automotive lubricants segment, currently comprising oil PSUs, multinational companies and a number of small and regional players, is highly fragmented. Historically, pre-liberalisation, the lubricants market was dominated by PSU oil companies that controlled more than 90% of the market. There were restrictions on import of base oil in India and lower trade margins that led to poor availability and service to customers. Post liberalisation, base oil imports were de-canalised and the administered pricing mechanism was gradually scrapped. A reduction of import duty and allowing PSU oil majors to form JVs led to the entry of all major global oil companies in India. The entry of many players in the market led to a shift in the lube business from petrol pumps to the bazaar trade. Increased spends and brand building efforts to gain market share increased the competitive activities in the market. Due to this situation, PSU oil companies lost ground and gave way to private companies. Exhibit 3: Overview of domestic lubricant market (FY14)
Source: Industry, ICICIdirect.com Research
Currently, multinational and oil PSUs dominate the automotive lubricants business in India. Within the automotive segment, original equipment manufacturers (OEMs) have a market share of ~10% (115 million litre) while the replacement segment commands a market share of ~90% (985 million litre). Petrol pumps now constitute only ~17% (170 million litre) while bazaar trade (retailers, mechanics, workshops and spare part dealers) constitute ~83% (815 million litre) of the total replacement market. The bazaar trade segment, which had stable growth, continues to remain the key driver for lubricant players. Oil PSUs, which used to command ~90% of the market pre-liberalisation, now only contribute ~30% to the bazaar trade segment. Multinational companies like Castrol, Total, Shell, etc. through their strong brands and differentiated marketing, have more than 30% market share of the bazaar trade segment. Other private sector players are currently investing aggressively in advertising & marketing and aiming to gain market share through competitive pricing.
Currently, multinational and oil PSUs dominate the
automotive lubricants business in India. Within the
automotive segment, original equipment manufacturers
(OEMs) have a market share of ~10% (115 million litre)
while the replacement segment commands a market share
of ~90% (985 million litre)

Page 4ICICI Securities Ltd | Retail Equity Research
Exhibit 4: Market share of lubricant companies in bazaar trade segment (FY14)
22%
28%21%
5%
6%
7%
7%4%
Castrol PSU's others Shell Total Gulf Oil Lubricants Veedol Valvoline
Source: Industry, ICICIdirect.com Research
Exhibit 5: Product portfolio of Indian lubricant companies
Two wheelers Petrol vehicles Diesel vehicles
Bharat Petroleum Corporation Ltd MAK MAK 2T, Mak 4T Plus SL MAK Elite MAK multigrade, MAK gold plus
Hindustan Petroleum Corporation Ltd HP HP Racer, Super Brake Fluid Hp Extra Super Motor oil, Hp Cruise Hp Laal Ghoda, Milcy
Indian Oil Corporation Ltd SERVO Servo-2T, Servo-4T Servo-Pride tc Super multigrade, Servo-Xtrapremium, Pride 40
Castrol India Ltd. Castrol Castrol Activ, Castrol Go GTX Petrol, Castrol Edge GTX Diesel, CRB Plus, CRB Turbo
Gulf Oil Corporation Ltd Superfleet Gulf Pride 2T, Gulf Pride 4T Gulf Formula GX, MAX Supreme Gulf XHD Plus, Superfleet LE Max, Super Diesel
Tide Water Oil Corporation Ltd Veedol Super Swift, Take-off Blue Blood, Turbostar Max-Pro, Turbo, HDB, Deep Sea
Company Name Brand NameMajor Products
Source: Industry, ICICIdirect.com Research
Multinational companies like Castrol, Total, Shell, etc.
through their strong brands and differentiated marketing,
have more than 30% market share in the bazaar trade
segment. Private sector players are currently investing
aggressively in advertising & marketing and aiming to gain
market share through competitive pricing
Page 5ICICI Securities Ltd | Retail Equity Research
Investment Rationale Sharp decline in crude oil prices to boost margins
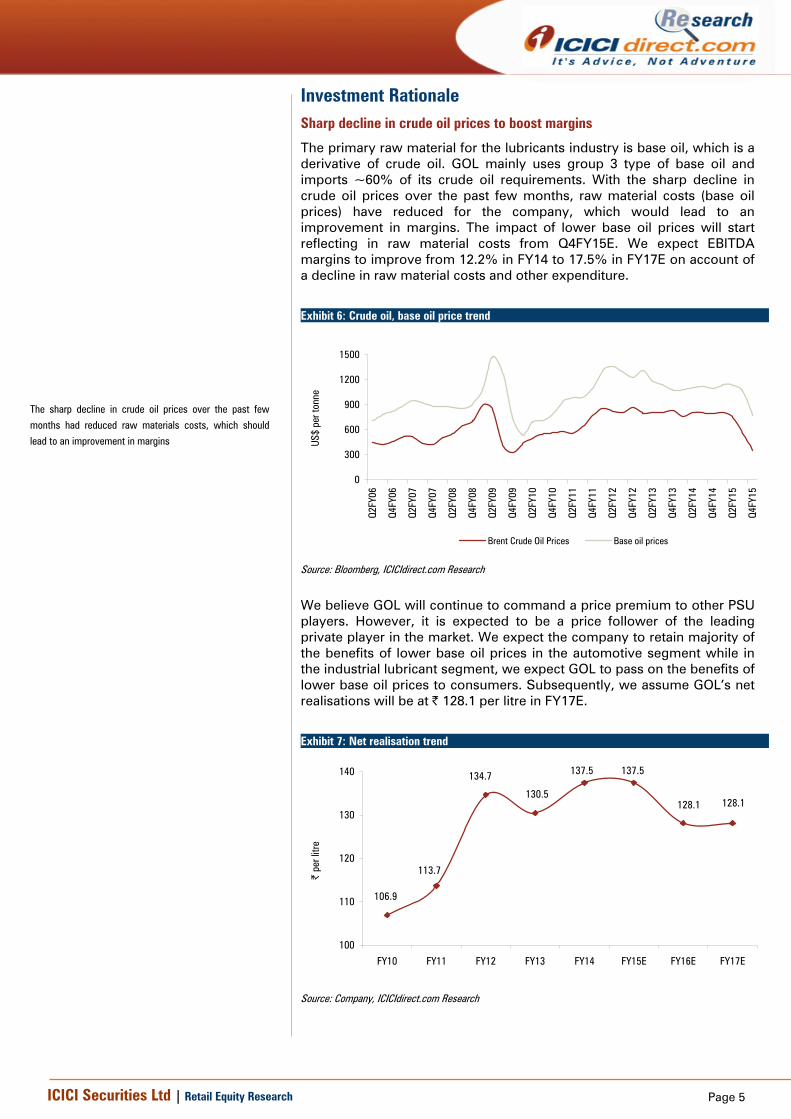
The primary raw material for the lubricants industry is base oil, which is a derivative of crude oil. GOL mainly uses group 3 type of base oil and imports ~60% of its crude oil requirements. With the sharp decline in crude oil prices over the past few months, raw material costs (base oil prices) have reduced for the company, which would lead to an improvement in margins. The impact of lower base oil prices will start reflecting in raw material costs from Q4FY15E. We expect EBITDA margins to improve from 12.2% in FY14 to 17.5% in FY17E on account of a decline in raw material costs and other expenditure.
Exhibit 6: Crude oil, base oil price trend
0
300
600
900
1200
1500
Q2FY
06
Q4FY
06
Q2FY
07
Q4FY
07
Q2FY
08
Q4FY
08
Q2FY
09
Q4FY
09
Q2FY
10
Q4FY
10
Q2FY
11
Q4FY
11
Q2FY
12
Q4FY
12
Q2FY
13
Q4FY
13
Q2FY
14
Q4FY
14
Q2FY
15
Q4FY
15
US$
per t
onne
Brent Crude Oil Prices Base oil prices
Source: Bloomberg, ICICIdirect.com Research
We believe GOL will continue to command a price premium to other PSU players. However, it is expected to be a price follower of the leading private player in the market. We expect the company to retain majority of the benefits of lower base oil prices in the automotive segment while in the industrial lubricant segment, we expect GOL to pass on the benefits of lower base oil prices to consumers. Subsequently, we assume GOL’s net realisations will be at | 128.1 per litre in FY17E.
Exhibit 7: Net realisation trend
106.9
113.7
134.7
130.5
137.5 137.5
128.1 128.1
100
110
120
130
140
FY10 FY11 FY12 FY13 FY14 FY15E FY16E FY17E
| pe
r litr
e
Source: Company, ICICIdirect.com Research
The sharp decline in crude oil prices over the past few
months had reduced raw materials costs, which should
lead to an improvement in margins

Page 6ICICI Securities Ltd | Retail Equity Research
On the cost side, we expect raw material prices to decline from | 73.7/litre in FY14 to | 60.8/litre in FY17E (assuming Brent crude oil prices at US$65/barrel). This is expected to lead to an improvement in gross margins from | 63.7/litre in FY14 to | 67.3/litre in FY17E. Subsequently, we expect the EBITDA to increase from | 16.8/litre in FY14 to | 22.4/litre in FY17E.
Exhibit 8: Net realisation, raw material cost and gross margin trends
130.5137.5 137.5
128.1 128.1
72.8 73.7 79.3
60.8 60.8
58.1
67.3
57.7
63.7
67.3
0
30
60
90
120
150
FY13 FY14 FY15E FY16E FY17E
| lit
re
50
56
62
68
74
80
| lit
re
Net Realisation Raw Material Costs Gross Margins
Source: Company, ICICIdirect.com Research
Exhibit 9: Expected change in EBITDA per litre
9.312.9
16.8
0.9
2.9
22.4
0
6
12
18
24
30
EBITDA(FY14)
Decline inrevenues
Decline inraw material
costs
Increase inemployee
costs
Decline inother
expenditure
EBITDA(FY17E)
| pe
r litr
e
Source: ICICIdirect.com Research
The impact of lower base oil prices will start reflecting in
raw material costs from Q4FY15E. We expect gross
margins to increase from | 63.7/litre in FY14 to
| 67.3/litre in FY17E
Page 7ICICI Securities Ltd | Retail Equity Research
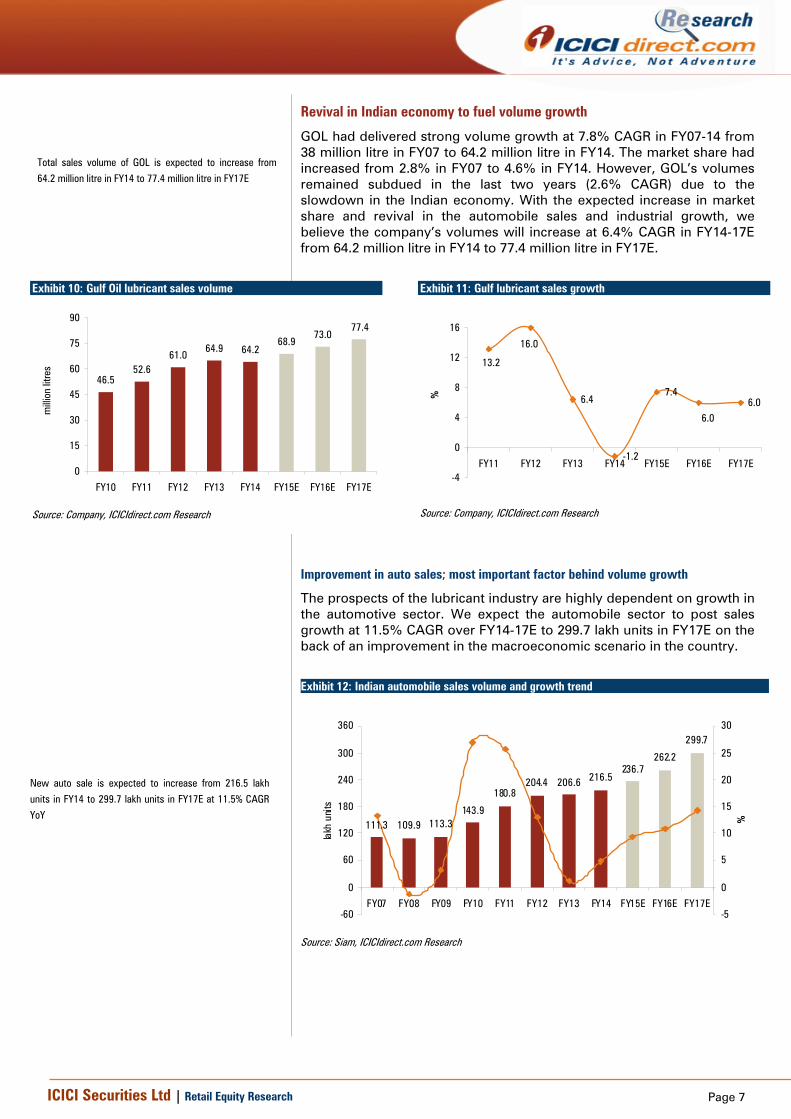
Revival in Indian economy to fuel volume growth
GOL had delivered strong volume growth at 7.8% CAGR in FY07-14 from 38 million litre in FY07 to 64.2 million litre in FY14. The market share had increased from 2.8% in FY07 to 4.6% in FY14. However, GOL’s volumes remained subdued in the last two years (2.6% CAGR) due to the slowdown in the Indian economy. With the expected increase in market share and revival in the automobile sales and industrial growth, we believe the company’s volumes will increase at 6.4% CAGR in FY14-17E from 64.2 million litre in FY14 to 77.4 million litre in FY17E.
Exhibit 10: Gulf Oil lubricant sales volume
46.552.6
61.064.9 64.2
68.973.0
77.4
0
15
30
45
60
75
90
FY10 FY11 FY12 FY13 FY14 FY15E FY16E FY17E
mill
ion
litre
s
Source: Company, ICICIdirect.com Research
Exhibit 11: Gulf lubricant sales growth
6.4
-1.2
7.46.0
13.2
16.0
6.0
-4
0
4
8
12
16
FY11 FY12 FY13 FY14 FY15E FY16E FY17E
%
Source: Company, ICICIdirect.com Research
Improvement in auto sales; most important factor behind volume growth
The prospects of the lubricant industry are highly dependent on growth in the automotive sector. We expect the automobile sector to post sales growth at 11.5% CAGR over FY14-17E to 299.7 lakh units in FY17E on the back of an improvement in the macroeconomic scenario in the country.
Exhibit 12: Indian automobile sales volume and growth trend
111.3 109.9 113.3143.9
180.8204.4 206.6 216.5
236.7262.2
299.7
-60
0
60
120
180
240
300
360
FY07 FY08 FY09 FY10 FY11 FY12 FY13 FY14 FY15E FY16E FY17E
lakh
uni
ts
-5
0
5
10
15
20
25
30%
Source: Siam, ICICIdirect.com Research
Total sales volume of GOL is expected to increase from
64.2 million litre in FY14 to 77.4 million litre in FY17E
New auto sale is expected to increase from 216.5 lakh
units in FY14 to 299.7 lakh units in FY17E at 11.5% CAGR
YoY

Page 8ICICI Securities Ltd | Retail Equity Research
Commercial vehicles sales, the largest contributor to the lubricant industry sales volume, had remained subdued in the past few years. CV sales are now expected to increase at 11.1% CAGR in FY14-17E to 8.5 lakh units in FY17E.
Exhibit 13: Indian commercial vehicle sales volume
4.6 4.9
3.8
5.3
6.8
8.0 7.8
6.2 6.17.1
8.5
0
2
4
6
8
10
FY07 FY08 FY09 FY10 FY11 FY12 FY13 FY14 FY15EFY16EFY17E
lakh
uni
ts
Source: Siam, ICICIdirect.com Research
Exhibit 14: Indian commercial vehicle sales growth
-30
-20
-10
0
10
20
30
40
50
FY07 FY08 FY09 FY10 FY11 FY12 FY13 FY14 FY15E FY16E FY17E
%
Source: Siam, ICICIdirect.com Research
Passenger vehicles, two-wheelers and four-wheelers are expected to witness a recovery on account of improved economic sentiments and pent-up demand due to subdued sales over the past few years. We expect two-wheelers and four-wheelers sales to increase at 11.6% and 10.4% CAGR, respectively, over FY14-17E to 209 lakh units for two-wheelers and 34.7 lakh units for four-wheelers in FY17E. Exhibit 15: Indian passenger vehicles, two-wheeler volume and growth trend
13.4 15.1 16.0 20.6 25.0 26.5 27.0 26.9
74.5 71.7 74.9
119.1136.5 138.4 150.2
165.9183.4
209.0
30.1 34.725.8
94.2
-50
0
50
100
150
200
250
FY07 FY08 FY09 FY10 FY11 FY12 FY13 FY14 FY15E FY16E FY17E
lakh
uni
ts
-10
0
10
20
30
40
50
%
Passenger Vehicles (PV) 2-Wheelers (2W) PV Growth 2W Growth
Source: Siam, ICICIdirect.com Research
Hence, on the back of an improvement in automotive demand, we expect automotive sales to be the major growth trigger for GOL, going forward.
Passenger vehicles and two-wheeler sales are expected to
increase from 25.8 lakh units and 150.2 lakh units in FY14
to 34.7 lakh units and 209 lakh units in FY17E, respectively

Page 9ICICI Securities Ltd | Retail Equity Research
Industry growth pick-up to contribute to higher industrial sales volume
The demand for lubricants in the industrial sector is primarily driven by industrial production. The last three years have been challenging for GOL and the industry in industrial sales due to subdued economic activity triggered by sustained inflation, higher raw material prices and lower demand for consumer goods & capital goods. However, manufacturing activity is expected to gain momentum in the coming years due to the strong focus of the new government on manufacturing and the industrial sector along with increasing domestic demand on the back of an improvement in consumer sentiments. We expect GOL’s industrial volumes to improve on the back of aggressive marketing and new OEM-tie-ups, going ahead.
Exhibit 16: IIP growth
4.8
8.9
3.01.3
-0.8
-3
0
3
6
9
12
15
FY10 FY11 FY12 FY13 FY14
%
Source: Company, ICICIdirect.com Research
GOL aims to grow at 2-3x industry volume growth
The company had outperformed the lubricant industry volume growth in the last few years. Its volumes had increased at 2-3x industry growth leading to an increase in market share from 2.8% in FY07 to 4.6% in FY14. The management expects to continue growing at the same rate of 2-3x industry growth, going forward. This is expected to lead to an increase in volumes at 6.4% CAGR over FY14-17E from 64.2 million litre in FY14 to 77.4 million litre in FY17E.
Exhibit 17: Overall market share (FY07)
2.8
97.2
Gulf Oil Lubricants Others
Source: Company, ICICIdirect.com Research
Exhibit 18: Overall market share (FY14)
4.6
95.4
Gulf Oil Lubricants Others
Source: Company, ICICIdirect.com Research
The last three years have been challenging for GOL as well
as the industry with respect to industrial sales due to
subdued economic activity triggered by sustained inflation,
higher raw material prices and lower demand for consumer
goods & capital goods

Page 10ICICI Securities Ltd | Retail Equity Research
Strong focus on product innovation and marketing for bazaar trade & OEMs
GOL’s strong focus on product innovation, advertising, marketing, retail distribution and OEM tie-ups have enabled the company to increase its market share, particularly in the automotive lubricant segment. Over the last seven years, the market share of the company in the automotive lubricant segment has increased from 4.4% in FY07 to 6.5% in FY14.
Exhibit 19: Automotive market share (FY07)
4.4
95.6
Gulf Oil Lubricants Others
Source: Company, ICICIdirect.com Research
Exhibit 20: Automotive market share (FY14)
6.5
93.5
Gulf Oil Lubricants Others
Source: Company, ICICIdirect.com Research
Strong distribution network & marketing to increase share in bazaar trade segment
In the automotive lubricant business, GOL has been aggressively positioning itself among the top players in the competitive bazaar trade segment through its distribution, branding and customer focused initiatives. The company has an extensive distribution network of 33 depots and 320 auto distributors. GOL has strengthened its distribution network from 30,000 retailers six years ago to over 50,000 retailers currently and plans to increase it to 75,000 retailers in the coming years. This will enable it to reach a wider customer base in semi urban and rural markets. The company also plans to implement a slew of ground level, below-the-line campaigns to increase its distribution reach and sales across urban and rural markets. Exhibit 21: GOL distribution network
Source: Company, ICICIdirect.com Research

Page 11ICICI Securities Ltd | Retail Equity Research
GOL’s current capacity of 75,000 tonne at Silvassa is being expanded to 95,000 tonnes at a capex of around | 40 crore. To cater to future demand needs, the company is also building a new plant in Chennai (with a capacity of 75,000 tonnes and capex of | 125 crore) in phases for which the land has been acquired.
GOL’s advertising, branding and marketing strategies have led to phenomenal growth of the company over the past few years. The company continues to spend 6.5-7.5% of its total revenues on advertising & marketing, thereby enabling it to position its products similar to FMCG companies. To achieve larger market share in the bazaar trade segment, GOL has roped in MS Dhoni as its brand ambassador and is sponsoring the Chennai Super Kings IPL team. The company’s marketing initiative with IPL teams, sporting events and brand focused approach have also helped it to enter various markets.
Hence, the company’s market share in the bazaar trade segment has increased from 4.4% in FY07 to 6.9% in FY14 mainly led by its strong focus on the personal mobility (two wheelers and passenger cars) segment. This will continue to remain the key driver for the automotive lubricant business.
Exhibit 22: Bazaar trade market share (FY07)
4.4
95.6
Gulf Oil Lubricants Others
Source: Company, ICICIdirect.com Research
Exhibit 23: Bazaar trade market share (FY14)
6.9
93.1
Gulf Oil Lubricants Others
Source: Company, ICICIdirect.com Research

Page 12ICICI Securities Ltd | Retail Equity Research
New and differentiated innovative products – a key advantage
GOL has also been among the first few to launch new and innovative products. Continuous innovations through products (multi-grade engine oil, two-stroke motor cycle oil, etc.) and differentiated marketing techniques have been key strengths of the company behind its volumes and premium pricing over PSU players. Focus on innovation through R&D to produce higher drain interval products has been the key initiative of the company over the last few years. Among its innovative products, GOL has recently launched a new product named ADBLUE that is specifically to be used for Bharat Stage IV and Bharat Stage V norms that will be implemented across the country in the coming years. This kind of new initiative has helped the company to increase its visibility in the market.
Exhibit 24: GOL’s long drain products innovation
Source: Company, ICICIdirect.com Research
Exhibit 25: GOL core products
Source: Company, ICICIdirect.com Research
Page 13ICICI Securities Ltd | Retail Equity Research
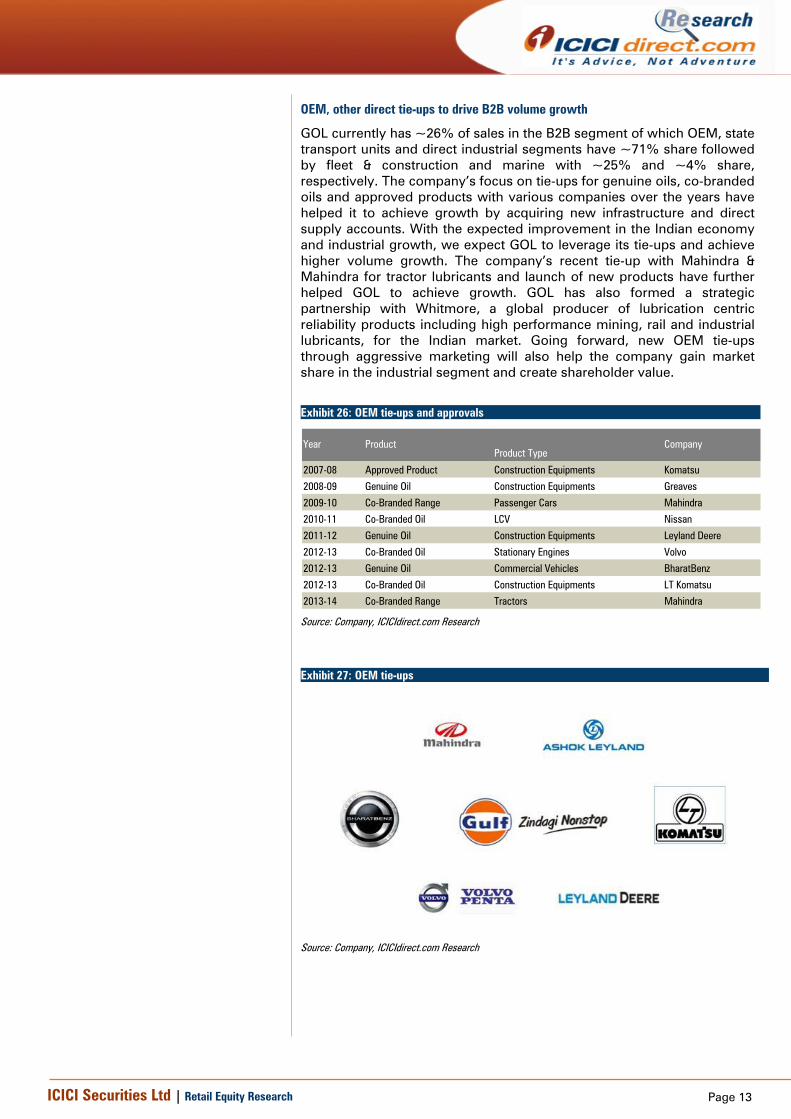
OEM, other direct tie-ups to drive B2B volume growth
GOL currently has ~26% of sales in the B2B segment of which OEM, state transport units and direct industrial segments have ~71% share followed by fleet & construction and marine with ~25% and ~4% share, respectively. The company’s focus on tie-ups for genuine oils, co-branded oils and approved products with various companies over the years have helped it to achieve growth by acquiring new infrastructure and direct supply accounts. With the expected improvement in the Indian economy and industrial growth, we expect GOL to leverage its tie-ups and achieve higher volume growth. The company’s recent tie-up with Mahindra & Mahindra for tractor lubricants and launch of new products have further helped GOL to achieve growth. GOL has also formed a strategic partnership with Whitmore, a global producer of lubrication centric reliability products including high performance mining, rail and industrial lubricants, for the Indian market. Going forward, new OEM tie-ups through aggressive marketing will also help the company gain market share in the industrial segment and create shareholder value.
Exhibit 26: OEM tie-ups and approvals
Product Type
2007-08 Approved Product Construction Equipments Komatsu
2008-09 Genuine Oil Construction Equipments Greaves
2009-10 Co-Branded Range Passenger Cars Mahindra
2010-11 Co-Branded Oil LCV Nissan
2011-12 Genuine Oil Construction Equipments Leyland Deere
2012-13 Co-Branded Oil Stationary Engines Volvo
2012-13 Genuine Oil Commercial Vehicles BharatBenz
2012-13 Co-Branded Oil Construction Equipments LT Komatsu
2013-14 Co-Branded Range Tractors Mahindra
Product CompanyYear
Source: Company, ICICIdirect.com Research
Exhibit 27: OEM tie-ups
Source: Company, ICICIdirect.com Research

Page 14ICICI Securities Ltd | Retail Equity Research
Gulf Oil Lubricants comparison with Castrol India
Castrol is the leading private player in the Indian lubricants business while Gulf Oil Lubricants is emerging as one of the fastest growing private players in the Indian lubricants business. The company’s focus remains on the personal mobility (bazaar trade) segment where Castrol commands a market share of ~22% and GOL has market share of ~7%. Over the past few years, the company’s aggressive marketing and pricing strategy has led to an increase in volumes at 6.9% CAGR in FY11-14 while Castrol’s volumes have remained subdued over the same period. However, Castrol’s strategy of focusing on premium brands has enabled it to command a price premium over its competitors leading to higher realisations, EBITDA margins and return ratios.
Castrol, being the price leader in the market, had realisation of | 160.9/litre in CY13 whereas Gulf lubricants had a realisation of | 137.5/litre in FY14. Hence, gross margins for Castrol stood at | 70.7/litre while for GOL gross margins stood at | 63.7/litre. Subsequently, the EBITDA per litre for Castrol stood at | 34.9/litre while for GOL the EBITDA stood at | 63.7/litre.
In terms of financial performance, GOL has performed better than Castrol over the last three years due to strong volume growth and improvement in EBITDA margins. Revenues for Castrol have increased at 5.1% CAGR over CY10-13 while EBITDA has remained subdued over the same period at ~| 700 crore. However, in case of GOL, revenues and EBITDA have increased at CAGR of 13.8% and 15.2% over FY10-14, respectively.
Exhibit 28: Gulf Oil Lubricants comparison with Castrol
Company Castrol India Gulf Oil Lubricants
Revenues (| crore) 3,179.6 881.8
CAGR (%) (CY10-13/FY11-14) 5.1 13.8
EBITDA (| crore) 687.6 107.8
CAGR (%) (CY10-13/FY11-14) (2.1) 15.2
EBITDA Margins (%) 21.6 12.2
Volumes (million litres) 196.8 64.2
CAGR (%) (CY10-13/FY11-14) (3.5) 6.9
Realisation (|/litre) 160.9 137.5
Gross Margins (|/litre) 70.7 63.7
EBITDA (|/ litre) 34.9 16.8
P/E (x) 26.3 22.4
EV/EBITDA (x) 17.0 14.3
ROCE (%) 168.2 37.4
ROE (%) 116.0 34.9
Operational Metrics (CY13/FY14)
Valuation Metrics (CY16E/FY17E)
Financial Metrics (CY13/FY14)
Source: Company, ICICIdirect.com Research

Page 15ICICI Securities Ltd | Retail Equity Research
Financials Higher volumes to lead to stable growth in revenues We expect revenues to increase from | 881.8 crore in FY14 to | 991.8 crore in FY17E at 4% CAGR over FY14-17E on account of the 6.4% CAGR in volumes due to an improvement in automotive lubricant business as well as the industrial lubricant business. Exhibit 29: Trend in revenues
847.0 881.8 950.3 935.5 991.8
0
300
600
900
1200
FY13 FY14 FY15E FY16E FY17E
| cr
ore
Source: Company, ICICIdirect.com Research
Higher gross margins to drive EBITDA growth
The gross margin per litre has remained stable in the last few years. We expect a revival in Indian automobile sales & industrial growth along with a decline in crude oil prices to lead to an increase in gross margins from | 63.7/litre in FY14 to | 67.3/litre in FY17E and volumes to increase from 64.2 million litre in FY14 to 77.4 million litre in FY17E at 6.4% CAGR in FY14-17E.
Subsequently, the EBITDA is expected to increase from | 107.8 crore in FY14 to | 173.1 crore in FY17E at 17.1% CAGR over FY14-17E. The EBITDA margin during the same period is expected to increase 530 bps from 12.2% in FY14 to 17.5% in FY17E.
Exhibit 30: EBITDA and EBITDA margins trend
108.2 107.8130.4
165.0 173.112.8 12.2
13.8
17.617.5
60
80
100
120
140
160
180
200
220
FY13 FY14 FY15E FY16E FY17E
| cr
ore
8
12
16
20
24
%
EBITDA EBITDA Margins
Source: Company, ICICIdirect.com Research
Total revenues are expected to increase from | 881.8 crore
in FY14 to | 991.8 crore in FY17E
The EBITDA is expected to increase from | 107.8 crore in
FY14 to | 173.1 crore in FY17E with margins improving
from 12.2% in FY14 to 17.5% in FY17E
Page 16ICICI Securities Ltd | Retail Equity Research
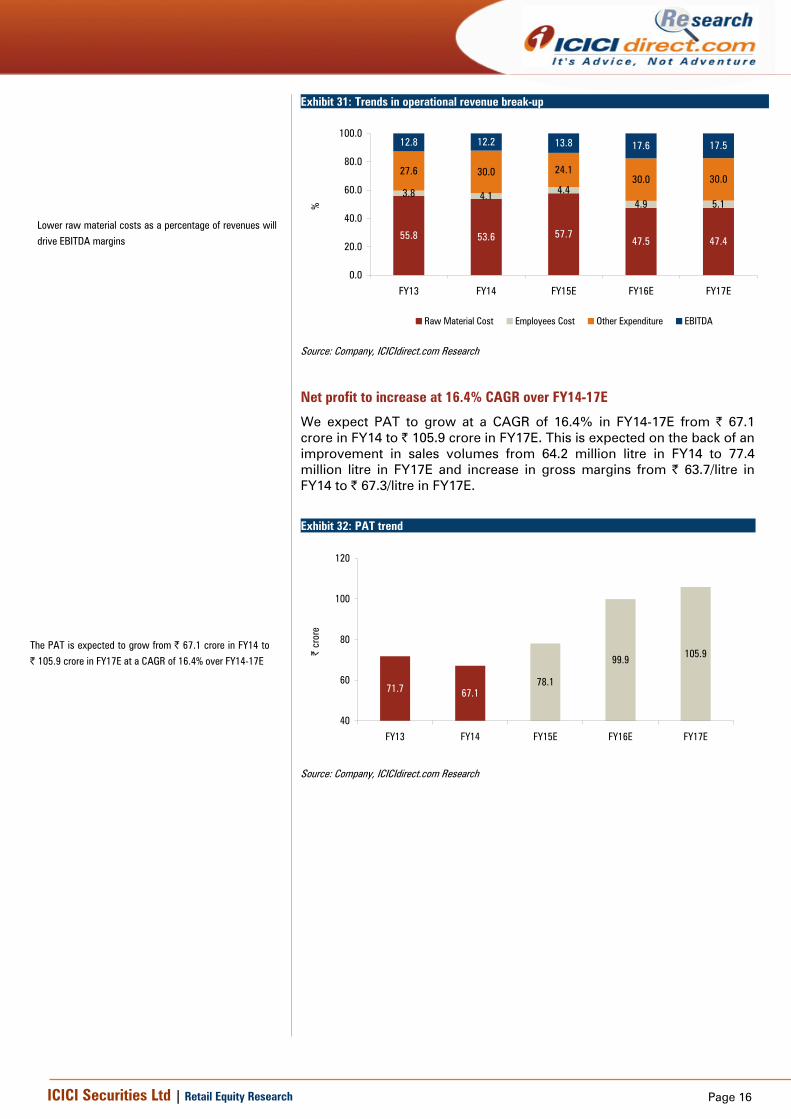
Exhibit 31: Trends in operational revenue break-up
55.8 53.6 57.747.5 47.4
3.8 4.1 4.44.9 5.1
27.6 30.0 24.130.0 30.0
12.8 12.2 13.8 17.6 17.5
0.0
20.0
40.0
60.0
80.0
100.0
FY13 FY14 FY15E FY16E FY17E
%Raw Material Cost Employees Cost Other Expenditure EBITDA
Source: Company, ICICIdirect.com Research
Net profit to increase at 16.4% CAGR over FY14-17E
We expect PAT to grow at a CAGR of 16.4% in FY14-17E from | 67.1 crore in FY14 to | 105.9 crore in FY17E. This is expected on the back of an improvement in sales volumes from 64.2 million litre in FY14 to 77.4 million litre in FY17E and increase in gross margins from | 63.7/litre in FY14 to | 67.3/litre in FY17E.
Exhibit 32: PAT trend
71.7 67.178.1
99.9 105.9
40
60
80
100
120
FY13 FY14 FY15E FY16E FY17E
| cr
ore
Source: Company, ICICIdirect.com Research
Lower raw material costs as a percentage of revenues will
drive EBITDA margins
The PAT is expected to grow from | 67.1 crore in FY14 to
| 105.9 crore in FY17E at a CAGR of 16.4% over FY14-17E
Page 17ICICI Securities Ltd | Retail Equity Research
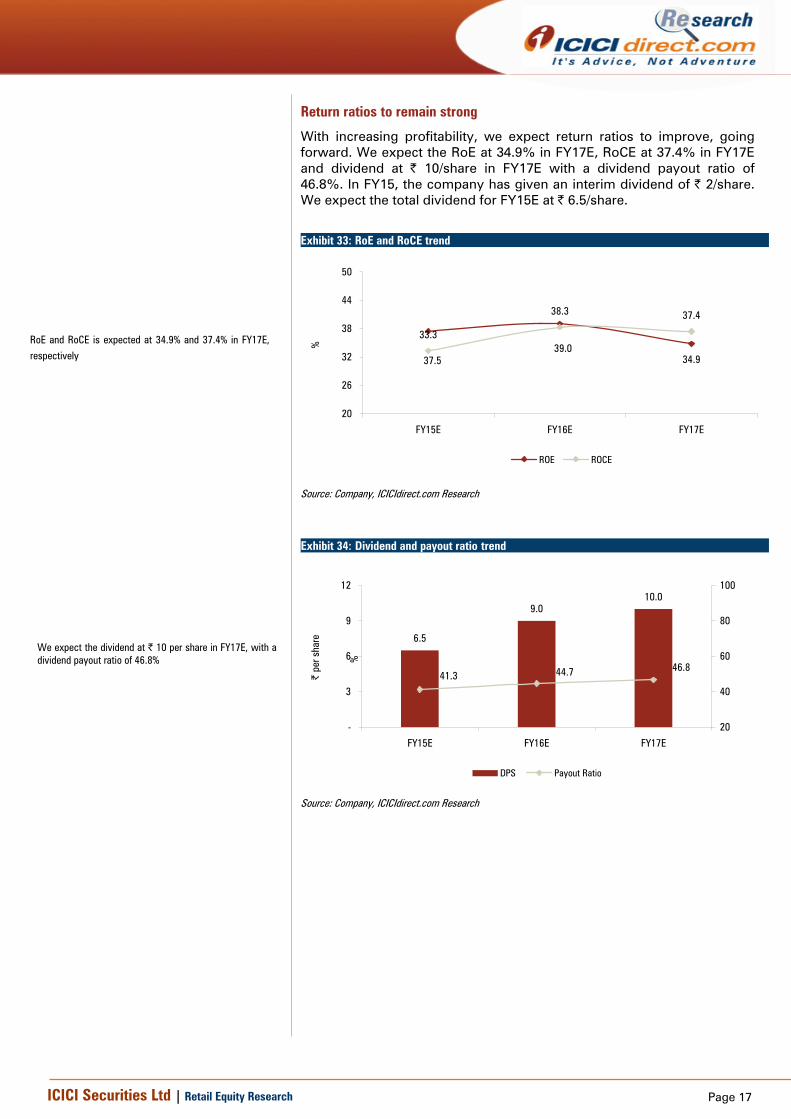
Return ratios to remain strong
With increasing profitability, we expect return ratios to improve, going forward. We expect the RoE at 34.9% in FY17E, RoCE at 37.4% in FY17E and dividend at | 10/share in FY17E with a dividend payout ratio of 46.8%. In FY15, the company has given an interim dividend of | 2/share. We expect the total dividend for FY15E at | 6.5/share.
Exhibit 33: RoE and RoCE trend
34.9
33.3
38.3 37.4
37.539.0
20
26
32
38
44
50
FY15E FY16E FY17E
%
ROE ROCE
Source: Company, ICICIdirect.com Research
Exhibit 34: Dividend and payout ratio trend
6.5
9.010.0
41.3 44.7 46.8
-
3
6
9
12
FY15E FY16E FY17E
| pe
r sha
re
20
40
60
80
100
%
DPS Payout Ratio
Source: Company, ICICIdirect.com Research
RoE and RoCE is expected at 34.9% and 37.4% in FY17E,
respectively
We expect the dividend at | 10 per share in FY17E, with a dividend payout ratio of 46.8%

Page 18ICICI Securities Ltd | Retail Equity Research
Risks & concerns Volatility in crude oil prices & exchange rate
Majority of Gulf Oil Lubricant’s raw material costs like base oil and additives are crude oil derivatives. Sharp volatility in crude oil prices along with foreign exchange volatility (~60% of raw materials are imported) may impact the margin outlook of the company and are key risks to the business. Any increase in crude oil prices from our estimates and depreciation in the rupee may impact the profitability of the company, going forward.
Exhibit 35: Sensitivity of EPS to change in crude oil prices
Crude Oil Prices US$ 80/bbl US$ 65/bbl (Base Case) US$ 50/bbl US$ 80/bbl US$ 65/bbl (Base Case) US$ 50/bbl
EPS (|) 16.2 20.2 25.8 17.7 21.4 29.3
FY16E FY17E
Source: ICICIdirect.com Research
Exhibit 36: Sensitivity of EPS to change in exchange rate
Exchange Rate | 65/ US$ | 62/ US$ (Base Case) | 59/ US$ | 65/ US$ | 62/ US$ (Base Case) | 59/ US$
EPS (|) 18.1 20.2 22.2 19.2 21.4 23.5
FY16E FY17E
Source: ICICIdirect.com Research
Improvement in technology may impact volume growth
Investments by OEMs and lubricant players on an improvement in technology are expected to lead to higher drain intervals in future, which may impact the volume growth outlook of the company. For example, engine oils in trucks are able to maintain their physicochemical and performance properties for a longer period of usage than earlier generation lubricants, thus lengthening oil drain intervals from ~10000 km to ~80000 km. This may have an impact on structural demand in the industry.
Increased competition from other private players, oil PSUs
GOL, one of the emerging players in the automotive lubricant market, faces stiff competition from other private players and oil PSUs due to aggressive pricing and higher sales promotion to gain market share. GOL has also been able to gain market share in the competitive southern market by aggressively pushing its products. However, any reduction in lubricant prices by its competitors may force the company to reduce prices as well and may impact our profitability estimates.
Exhibit 37: Sensitivity of EPS to change in realisations
Blended Price | 120/ litre | 128.1/ litre (Base Case) | 135/ litre | 120/ litre | 128.1/ litre (Base Case) | 135/ litre
EPS (|) 14.5 20.2 25.0 15.4 21.4 26.5
FY16E FY17E
Source: ICICIdirect.com Research

Page 19ICICI Securities Ltd | Retail Equity Research
Slowdown in auto sales and industrial activities Gulf Oil Lubricant’s future prospects rely heavily on growth in automotive sales, which witnessed a slowdown in the last few years. With the revival expected in the economy, we have estimated 11.5% CAGR in auto sales over FY14-17E. However, if the slowdown in the economy continues in future, it may impact GOL’s automotive as well as industrial lubricant sales.
Exhibit 38: Sensitivity of EPS to change in realisations
Volume Growth 4% 6% (Base Case) 8% 4% 6% (Base Case) 8%
EPS (|) 19.6 20.2 20.7 20.2 21.4 22.5
FY16E FY17E
Source: ICICIdirect.com Research

Page 20ICICI Securities Ltd | Retail Equity Research
Valuation We expect an improved performance from Gulf Oil Lubricants over the next two years on account of a sharp decline in crude oil prices and strong volume growth due to a revival in automobile sales and industrial growth. The decline in raw material costs for the company is expected to lead to an improvement in gross margins. GOL’s strong brand positioning and wide distribution network will allow it to command value for its products over its competitors. Also, the company’s focus on the personal mobility segment will remain the key driver for the automotive lubricant business and create value for shareholders, going forward. We value Gulf Oil Lubricant at 24x FY17E EPS of | 21.4 (22.5% discount to average P/E multiple of peers) to arrive at a target price of | 513. We have valued Gulf Oil Lubricant at a discount to peers on account of marginally lower return ratios. However, an improvement in return ratios may lead to an upgrade in P/E multiples. We initiate coverage on the stock with a HOLD recommendation.
Exhibit 39: Peer valuation
CMP M Cap(|) (| Cr) FY15E FY16E FY17E FY15E FY16E FY17E FY15E FY16E FY17E
Colgate (COLPAL) 2,077 28,256 41.3 47.9 54.9 50.3 43.3 37.8 78.8 74.5 71.1Dabur India (DABIND) 275 48,216 6.4 7.5 8.2 42.8 36.8 33.4 38.3 36.8 33.7Hindustan Unilever (HINLEV) 946 204,671 19.9 20.8 24.8 47.5 45.5 38.2 118.0 109.3 101.7ITC Limited (ITC) 342 273,871 11.9 12.4 14.1 28.8 27.5 24.2 33.5 32.8 33.7Jyothy Lab (JYOLAB) 274 4,950 8.7 9.8 10.1 31.6 28.0 27.1 11.1 19.2 19.7Marico (MARIN) 372 24,022 9.0 11.4 13.6 41.3 32.7 27.3 29.0 36.2 34.2Nestle (NESIND) 7,261 70,006 122.9 137.5 153.4 59.1 52.8 47.3 47.2 45.3 48.9Tata Global Bev (TATTEA) 156 9,672 6.2 7.8 8.7 25.2 19.9 18.0 8.2 6.3 7.6VST Industries (VSTIND) 1,637 2,528 87.3 77.5 102.0 18.7 21.1 16.1 45.8 40.1 34.8Procter & Gamble (PROGAM) 7,311 23,732 106.2 126.0 148.7 68.8 58.0 49.2 30.6 30.2 34.4Glaxo Consumer (SMIBC) 5,864 24,661 142.5 166.1 198.0 41.2 35.3 29.6 30.9 30.0 30.5Castrol India (CASIND) 486 24,036 9.7 16.4 18.0 50.1 29.6 27.0 82.9 116.5 110.5Average 42.1 35.9 31.3 46.2 48.1 46.7Gulf Oil Lubricants (GULO) 478 2,379 15.8 20.2 21.4 30.3 23.7 22.4 37.9 39.0 34.9
Sector / CompanyEPS (|) P/E (x) RoE (%)
Source: ICICIdirect.com Research
We have compared GOL’s valuation with FMCG companies on account of its brand position, aggressive advertising spends and high pricing power, which is similar to FMCG companies. Also, the company’s financials are comparable to FMCG companies, which deliver superior return ratios. Hence, we have valued GOL at 24x FY17E EPS of | 21.4 (22.5% discount to average P/E multiple of peers) to arrive at a target price of | 513.

Page 21ICICI Securities Ltd | Retail Equity Research
Financial Summary Exhibit 40: Profit and Loss Statement (| crore) (Year-end March) FY14 FY15E FY16E FY17ERevenue 881.8 947.2 935.5 991.8Growth (%) 4.1 7.4 -1.2 6.0(Inc.)/(Dec.) in stock in trade -19.1 -9.2 0.0 0.0Raw material Costs 465.2 526.7 424.0 449.4Purchase of Products 26.8 29.1 20.0 21.2Employee Costs 36.1 41.8 45.9 50.5Other Expenditure 265.0 228.4 280.7 297.5Op. Expenditure 774.0 816.8 770.5 818.6EBITDA 107.8 130.4 165.0 173.1Growth (%) -0.3 20.9 26.6 4.9Depreciation 2.7 5.1 10.3 11.6EBIT 105.1 125.3 154.8 161.6Interest 21.6 18.6 15.8 13.8Other Income 18.7 8.9 8.0 8.0PBT 102.2 115.6 146.9 155.8Growth (%) -5.1 13.1 27.1 6.0Tax 35.0 37.5 47.0 49.8Reported PAT 67.1 78.1 99.9 105.9Growth (%) -6.4 16.3 28.0 6.0EPS 13.5 15.8 20.2 21.4
Source: Company, ICICIdirect.com Research * FY14 data based on our internal estimates
Exhibit 41: Balance Sheet (| crore)
(Year-end March) FY14 FY15E FY16E FY17ESource of FundsEquity Capital NA 9.9 9.9 9.9Preference capital NA 0.0 0.0 0.0Reserves & Surplus NA 198.3 246.1 294.0Shareholder's Fund NA 208.3 256.0 303.9Loan Funds NA 168.2 148.2 128.2Deferred Tax Liability NA -0.2 -0.2 -0.2Minority Interest NA 0.0 0.0 0.0Source of Funds NA 376.3 404.0 431.9
Application of FundsNet Block NA 39.1 64.1 4.1Capital WIP NA 136.9 171.4 204.9Total Fixed Assets NA 176.0 235.5 209.0Investments NA 0.0 0.0 0.0Inventories NA 181.7 179.4 190.2Debtor NA 116.8 115.3 122.3Cash NA 54.3 46.5 26.6Loan & Advance, Other CA NA 22.4 27.4 32.4Total Current assets NA 375.2 368.7 371.5Current Liabilities NA 129.8 128.2 135.9Provisions NA 6.0 7.9 8.6Total CL and Provisions NA 135.8 136.1 144.5Net Working Capital NA 239.4 232.6 227.0Miscellaneous expense NA 0.0 0.0 0.0Application of Funds NA 376.3 404.0 431.9
Source: Company, ICICIdirect.com Research

Page 22ICICI Securities Ltd | Retail Equity Research
Exhibit 42: Cash Flow Statement (| crore) (Year-end March) FY14 FY15E FY16E FY17EProfit after Tax NA NA 99.9 105.9Less: Dividend Paid NA NA 52.2 58.0Add: Depreciation NA NA 10.3 11.6Add: Others NA NA 0.0 0.0Cash Profit NA NA 58.0 59.5Increase/(Decrease) in CL NA NA 0.3 8.4(Increase)/Decrease in CA NA NA -1.3 -22.7CF from Operating Activities NA NA 57.0 45.1Purchase of Fixed Assets NA NA 44.8 45.1(Inc)/Dec in Investments NA NA 0.0 0.0Others NA NA 2.0 3.0CF from Investing Activities NA NA -44.8 -45.1Inc/(Dec) in Loan Funds NA NA -20.0 -20.0Inc/(Dec) in Sh. Cap. & Res. NA NA 0.0 0.0Others NA NA 2.0 3.0CF from financing activities NA NA -20.0 -20.0Change in cash Eq. NA NA -7.8 -19.9Op. Cash and cash Eq. NA NA 54.3 46.5Cl. Cash and cash Eq. NA NA 46.5 26.6
Source: Company, ICICIdirect.com Research
Exhibit 43: Ratio Analysis
(Year-end March) FY14 FY15E FY16E FY17EPer share data (|)Book Value NA 42.0 51.6 61.3Cash per share NA 11.0 9.4 5.4EPS 13.5 15.8 20.2 21.4Cash EPS NA 16.8 22.2 23.7DPS NA 6.5 9.0 10.0Profitability & Operating RatiosEBITDA Margin (%) 12.2 13.8 17.6 17.5PAT Margin (%) 7.6 8.2 10.7 10.7Fixed Asset Turnover (x) NA 6.9 5.5 4.8Inventory Turnover (Days) NA 70.0 70.0 70.0Debtor (Days) NA 45.0 45.0 45.0Current Liabilities (Days) NA 50.0 50.0 50.0Return Ratios (%)RoE NA 37.5 39.0 34.9RoCE NA 33.3 38.3 37.4RoIC NA 38.9 43.3 39.9Valuation Ratios (x)PE 35.3 30.3 23.7 22.4Price to Book Value NA 11.4 9.3 7.8EV/EBITDA NA 19.0 15.0 14.3EV/Sales NA 2.6 2.6 2.5Leverage & Solvency RatiosDebt to equity (x) NA 0.8 0.6 0.4Interest Coverage (x) 4.9 6.7 9.8 11.7Debt to EBITDA (x) NA 1.3 0.9 0.7Current Ratio NA 2.8 2.7 2.6Quick ratio NA 1.4 1.4 1.3
Source: Company, ICICIdirect.com Research

Page 23ICICI Securities Ltd | Retail Equity Research
Annexure The global revenue for the lubricant industry is ~$18 billion. Globally, the demand for automotive lubricants is ~56% while industrial lubricants demand is ~44%. Exhibit 44: Global lube demand
36.4
35.6 35.7 35.436.1
36.536.9 37.1
36
32.2
34.535.1 35 35.3
30
31
32
33
34
35
36
37
38
2000 2001 2002 2003 2004 2005 2006 2007 2008 2009 2010 2011 2012 2013
Milli
on to
n
Source: FUCHS lubricants, ICICIdirect.com Research
Exhibit 45: Lube demand growth v/s GDP growth rate
-12
-9
-6
-3
0
3
6
9
12
FY01
FY02
FY03
FY04
FY05
FY06
FY07
FY08
FY09
FY10
FY11
FY12
FY13
%
GDP Growth Rate Lube Demand
Source: FUCHS lubricants, ICICIdirect.com Research
Exhibit 46: Industry growth in 2013
0 0.5 1 1.5 2 2.5 3 3.5 4 4.5 5
Lubricants
Engineering
Steel Industry
Car Industry
Chemical Industry
Source: FUCHS lubricants, ICICIdirect.com Research

Page 24ICICI Securities Ltd | Retail Equity Research
Exhibit 47: Region wise per capita consumption 2013
Source: FUCHS lubricants, ICICIdirect.com Research
Exhibit 48: Top lubricant consuming countries 2013
Source: FUCHS lubricants, ICICIdirect.com Research

Page 25ICICI Securities Ltd | Retail Equity Research
RATING RATIONALE ICICIdirect.com endeavours to provide objective opinions and recommendations. ICICIdirect.com assigns ratings to its stocks according to their notional target price vs. current market price and then categorises them as Strong Buy, Buy, Hold and Sell. The performance horizon is two years unless specified and the notional target price is defined as the analysts' valuation for a stock. Strong Buy: >15%/20% for large caps/midcaps, respectively, with high conviction; Buy: >10%/15% for large caps/midcaps, respectively; Hold: Up to +/-10%; Sell: -10% or more;
Pankaj Pandey Head – Research [email protected]
ICICIdirect.com Research Desk, ICICI Securities Limited, 1st Floor, Akruti Trade Centre, Road No 7, MIDC, Andheri (East) Mumbai – 400 093

Page 26ICICI Securities Ltd | Retail Equity Research
ANALYST CERTIFICATION We /I, Mayur Matani, MBA and Utkarsh Tathagath, MBA Research Analysts, authors and the names subscribed to this report, hereby certify that all of the views expressed in this research report accurately reflect our views about the subject issuer(s) or securities. We also certify that no part of our compensation was, is, or will be directly or indirectly related to the specific recommendation(s) or view(s) in this report.
Terms & conditions and other disclosures: ICICI Securities Limited (ICICI Securities) is a full-service, integrated investment banking and is, inter alia, engaged in the business of stock brokering and distribution of financial products. ICICI Securities is a wholly-owned subsidiary of ICICI Bank which is India’s largest private sector bank and has its various subsidiaries engaged in businesses of housing finance, asset management, life insurance, general insurance, venture capital fund management, etc. (“associates”), the details in respect of which are available on www.icicibank.com. ICICI Securities is one of the leading merchant bankers/ underwriters of securities and participate in virtually all securities trading markets in India. We and our associates might have investment banking and other business relationship with a significant percentage of companies covered by our Investment Research Department. ICICI Securities generally prohibits its analysts, persons reporting to analysts and their relatives from maintaining a financial interest in the securities or derivatives of any companies that the analysts cover. The information and opinions in this report have been prepared by ICICI Securities and are subject to change without any notice. The report and information contained herein is strictly confidential and meant solely for the selected recipient and may not be altered in any way, transmitted to, copied or distributed, in part or in whole, to any other person or to the media or reproduced in any form, without prior written consent of ICICI Securities. While we would endeavour to update the information herein on a reasonable basis, ICICI Securities is under no obligation to update or keep the information current. Also, there may be regulatory, compliance or other reasons that may prevent ICICI Securities from doing so. Non-rated securities indicate that rating on a particular security has been suspended temporarily and such suspension is in compliance with applicable regulations and/or ICICI Securities policies, in circumstances where ICICI Securities might be acting in an advisory capacity to this company, or in certain other circumstances. This report is based on information obtained from public sources and sources believed to be reliable, but no independent verification has been made nor is its accuracy or completeness guaranteed. This report and information herein is solely for informational purpose and shall not be used or considered as an offer document or solicitation of offer to buy or sell or subscribe for securities or other financial instruments. Though disseminated to all the customers simultaneously, not all customers may receive this report at the same time. ICICI Securities will not treat recipients as customers by virtue of their receiving this report. Nothing in this report constitutes investment, legal, accounting and tax advice or a representation that any investment or strategy is suitable or appropriate to your specific circumstances. The securities discussed and opinions expressed in this report may not be suitable for all investors, who must make their own investment decisions, based on their own investment objectives, financial positions and needs of specific recipient. This may not be taken in substitution for the exercise of independent judgment by any recipient. The recipient should independently evaluate the investment risks. The value and return on investment may vary because of changes in interest rates, foreign exchange rates or any other reason. ICICI Securities accepts no liabilities whatsoever for any loss or damage of any kind arising out of the use of this report. Past performance is not necessarily a guide to future performance. Investors are advised to see Risk Disclosure Document to understand the risks associated before investing in the securities markets. Actual results may differ materially from those set forth in projections. Forward-looking statements are not predictions and may be subject to change without notice. ICICI Securities or its associates might have managed or co-managed public offering of securities for the subject company or might have been mandated by the subject company for any other assignment in the past twelve months. ICICI Securities or its associates might have received any compensation from the companies mentioned in the report during the period preceding twelve months from the date of this report for services in respect of managing or co-managing public offerings, corporate finance, investment banking or merchant banking, brokerage services or other advisory service in a merger or specific transaction. ICICI Securities or its associates might have received any compensation for products or services other than investment banking or merchant banking or brokerage services from the companies mentioned in the report in the past twelve months. ICICI Securities encourages independence in research report preparation and strives to minimize conflict in preparation of research report. ICICI Securities or its analysts did not receive any compensation or other benefits from the companies mentioned in the report or third party in connection with preparation of the research report. Accordingly, neither ICICI Securities nor Research Analysts have any material conflict of interest at the time of publication of this report. It is confirmed that Mayur Matani, MBA and Utkarsh Tathagath, MBA, Research Analysts of this report have not received any compensation from the companies mentioned in the report in the preceding twelve months. Compensation of our Research Analysts is not based on any specific merchant banking, investment banking or brokerage service transactions. ICICI Securities or its subsidiaries collectively or Research Analysts do not own 1% or more of the equity securities of the Company mentioned in the report as of the last day of the month preceding the publication of the research report. Since associates of ICICI Securities are engaged in various financial service businesses, they might have financial interests or beneficial ownership in various companies including the subject company/companies mentioned in this report. It is confirmed that Mayur Matani, MBA and Utkarsh Tathagath, MBA, Research Analysts do not serve as an officer, director or employee of the companies mentioned in the report. ICICI Securities may have issued other reports that are inconsistent with and reach different conclusion from the information presented in this report. Neither the Research Analysts nor ICICI Securities have been engaged in market making activity for the companies mentioned in the report. We submit that no material disciplinary action has been taken on ICICI Securities by any Regulatory Authority impacting Equity Research Analysis activities. This report is not directed or intended for distribution to, or use by, any person or entity who is a citizen or resident of or located in any locality, state, country or other jurisdiction, where such distribution, publication, availability or use would be contrary to law, regulation or which would subject ICICI Securities and affiliates to any registration or licensing requirement within such jurisdiction. The securities described herein may or may not be eligible for sale in all jurisdictions or to certain category of investors. Persons in whose possession this document may come are required to inform themselves of and to observe such restriction.