Bharti Infratel (BHAINF) - ICICI...
26
March 31, 2015 Initiating Coverage ICICI Securities Ltd | Retail Equity Research Stability of cash flows, safest bet in telecom Bharti Infratel (BIL), with a portfolio of about 85064 towers (36747 towers at the standalone level and 48317 towers via 42% stake in Indus) is the largest pan-India tower infrastructure player. Though the telecom sector went through various rough patches, BIL demonstrated revenue, EBITDA and PAT CAGR of 11.5%, 16.6% and 57.0%, respectively, in FY10-14. The company enjoys very high operating leverage, with any increase in tenancy adding to EBITDA. BIL is in a sweet spot owing to the huge coverage and capacity requirements emanating from impending data growth. With a ramp up in 3G/4G data offerings and the impending launch of Reliance Jio’s services, tenancies/loading are bound to increase. In addition, the presence of industry leaders Airtel, Idea Cellular and Vodafone as its anchor tenants lends stability to BIL’s earnings. We expect tenancies to increase from 167202 in FY14 to 224585 by FY17E. Hence, this may lead to 9.7%, 13.2% and 21.7% CAGR in revenue, EBITDA and PAT in FY14-17E. With a dividend policy of distributing 60- 80% of standalone profit, dividend yields turn out to be attractive at 2.4%. Owing to the low risk profile coupled with the high probability of growth and stable dividend policy, we initiate coverage with a BUY rating with a target price of | 450 based on SOTP DCF based methodology. With GOI keen on data, data growth remains inevitable, BIL to gain With GoI taking key initiatives to meet the PMO’s Digital India vision and developing an eco-system for high speed data, data growth seems inevitable. The mobile data traffic, which is expected to grow 24x of the 2013 levels by FY18E, necessitates higher loading. Stable cash flows, strong dividend policy, optimisation of capital structure BIL has a stable annuity led business model with a remaining estimated contract life of about 7.5 years, which lends certainty to about | 20000 crore of future cash flows. The company has a strong dividend policy of distributing about 60-80% of standalone profit (excluding DDT) to enhance shareholder wealth. The management has been constantly highlighting its keen interest in re-aligning its capital structure where the debt/equity ratio is currently 0.1x by resorting to buyback, excess dividend route, etc. Such a re-alignment will be return ratio accretive. Re-rating begins as data story unfolds, recommend BUY with | 450 TP The stock has already rallied 27% over the past few months as data growth is ballooning. With the stable annuity based business model and tremendous growth opportunity considering the kind of spectrum purchased by telcos, we assign a target price of | 450 to Bharti Infratel, based on a DCF based methodology, providing an upside of 19%. Exhibit 1: Valuation Metrics (Year-end March) FY13 FY14 FY15E FY16E FY17E Net Sales (| crore) 10,272.0 10,826.7 11,741.6 12,938.3 14,296.6 EBITDA (| crore) 3,810.2 4,411.8 4,939.7 5,569.9 6,402.9 Net Profit (| crore) 1,002.5 1,529.6 1,927.8 2,235.4 2,758.7 EPS (|) 5.3 8.1 10.2 11.8 14.6 P/E (x) 72.5 47.6 37.8 32.6 26.4 Price / Book (x) 4.2 4.0 4.0 3.9 3.9 EV/EBITDA (x) 18.9 16.2 14.4 12.7 10.9 RoCE (%) 7.8 11.0 13.2 15.4 18.6 RoE (%) 5.8 8.5 10.6 12.1 14.7 Source: Company, ICICIdirect.com Research Bharti Infratel (BHAINF) | 385 Rating matrix Rating : Buy Target : | 450 Target Period : 12 months Potential Upside : 17% YoY growth (%) (YoY Growth) FY14 FY15E FY16E FY17E Net Sales 5.4 8.5 10.2 10.5 EBITDA 15.8 12.0 12.8 15.0 Net Profit 52.6 26.0 16.0 23.4 EPS (Rs) 52.5 25.9 16.0 23.4 Valuation summary FY14 FY15E FY16E FY17E P/E 47.6 37.8 32.6 26.4 EV / EBITDA 16.2 14.4 12.7 10.9 P/BV 4.0 4.0 3.9 3.9 RoNW 8.5 10.6 12.1 14.7 RoCE 11.0 13.2 15.4 18.6 Stock data Particulars Amount Market Capitalization | 72788.1 Crore Total Debt (FY14) | 2683.6 Crore Cash and Investments (FY14) | 4011.5 Crore EV | 71460.2 Crore 52 week H/L 391 / 195 Equity capital | 1890.6 Crore Face value | 10 MF Holding (%) 1.7 FII Holding (%) 17.8 Price movement 0 50 100 150 200 250 300 350 400 450 Mar-15 Jan-15 Sep-14 Jul-14 Apr-14 0 2,000 4,000 6,000 8,000 10,000 Price (R.H.S) Nifty (L.H.S) Research Analyst Karan Mittal [email protected] Sneha Agarwal [email protected]
Transcript of Bharti Infratel (BHAINF) - ICICI...
March 31, 2015
Initiating Coverage
ICICI Securities Ltd | Retail Equity Research
Stability of cash flows, safest bet in telecom Bharti Infratel (BIL), with a portfolio of about 85064 towers (36747 towers at the standalone level and 48317 towers via 42% stake in Indus) is the largest pan-India tower infrastructure player. Though the telecom sector went through various rough patches, BIL demonstrated revenue, EBITDA and PAT CAGR of 11.5%, 16.6% and 57.0%, respectively, in FY10-14. The company enjoys very high operating leverage, with any increase in tenancy adding to EBITDA. BIL is in a sweet spot owing to the huge coverage and capacity requirements emanating from impending data growth. With a ramp up in 3G/4G data offerings and the impending launch of Reliance Jio’s services, tenancies/loading are bound to increase. In addition, the presence of industry leaders Airtel, Idea Cellular and Vodafone as its anchor tenants lends stability to BIL’s earnings. We expect tenancies to increase from 167202 in FY14 to 224585 by FY17E. Hence, this may lead to 9.7%, 13.2% and 21.7% CAGR in revenue, EBITDA and PAT in FY14-17E. With a dividend policy of distributing 60-80% of standalone profit, dividend yields turn out to be attractive at 2.4%. Owing to the low risk profile coupled with the high probability of growth and stable dividend policy, we initiate coverage with a BUY rating with a target price of | 450 based on SOTP DCF based methodology.
With GOI keen on data, data growth remains inevitable, BIL to gain With GoI taking key initiatives to meet the PMO’s Digital India vision and developing an eco-system for high speed data, data growth seems inevitable. The mobile data traffic, which is expected to grow 24x of the 2013 levels by FY18E, necessitates higher loading.
Stable cash flows, strong dividend policy, optimisation of capital structure BIL has a stable annuity led business model with a remaining estimated contract life of about 7.5 years, which lends certainty to about | 20000 crore of future cash flows. The company has a strong dividend policy of distributing about 60-80% of standalone profit (excluding DDT) to enhance shareholder wealth. The management has been constantly highlighting its keen interest in re-aligning its capital structure where the debt/equity ratio is currently 0.1x by resorting to buyback, excess dividend route, etc. Such a re-alignment will be return ratio accretive.
Re-rating begins as data story unfolds, recommend BUY with | 450 TP
The stock has already rallied 27% over the past few months as data growth is ballooning. With the stable annuity based business model and tremendous growth opportunity considering the kind of spectrum purchased by telcos, we assign a target price of | 450 to Bharti Infratel, based on a DCF based methodology, providing an upside of 19%.
Exhibit 1: Valuation Metrics (Year-end March) FY13 FY14 FY15E FY16E FY17ENet Sales (| crore) 10,272.0 10,826.7 11,741.6 12,938.3 14,296.6 EBITDA (| crore) 3,810.2 4,411.8 4,939.7 5,569.9 6,402.9 Net Profit (| crore) 1,002.5 1,529.6 1,927.8 2,235.4 2,758.7 EPS (|) 5.3 8.1 10.2 11.8 14.6 P/E (x) 72.5 47.6 37.8 32.6 26.4 Price / Book (x) 4.2 4.0 4.0 3.9 3.9 EV/EBITDA (x) 18.9 16.2 14.4 12.7 10.9 RoCE (%) 7.8 11.0 13.2 15.4 18.6 RoE (%) 5.8 8.5 10.6 12.1 14.7
Source: Company, ICICIdirect.com Research
Bharti Infratel (BHAINF) | 385
Rating matrix
Rating : BuyTarget : | 450Target Period : 12 monthsPotential Upside : 17%
YoY growth (%)
(YoY Growth) FY14 FY15E FY16E FY17ENet Sales 5.4 8.5 10.2 10.5 EBITDA 15.8 12.0 12.8 15.0 Net Profit 52.6 26.0 16.0 23.4 EPS (Rs) 52.5 25.9 16.0 23.4
Valuation summary FY14 FY15E FY16E FY17E
P/E 47.6 37.8 32.6 26.4 EV / EBITDA 16.2 14.4 12.7 10.9 P/BV 4.0 4.0 3.9 3.9 RoNW 8.5 10.6 12.1 14.7 RoCE 11.0 13.2 15.4 18.6
Stock data Particulars Amount
Market Capitalization | 72788.1 CroreTotal Debt (FY14) | 2683.6 CroreCash and Investments (FY14) | 4011.5 CroreEV | 71460.2 Crore52 week H/L 391 / 195Equity capital | 1890.6 CroreFace value | 10MF Holding (%) 1.7FII Holding (%) 17.8 Price movement
050100150200250300350400450
Mar-15Jan-15Sep-14Jul-14Apr-14
0
2,000
4,000
6,000
8,000
10,000
Price (R.H.S) Nifty (L.H.S)
Research Analyst
Karan Mittal [email protected]
Sneha Agarwal [email protected]
Page 2ICICI Securities Ltd | Retail Equity Research
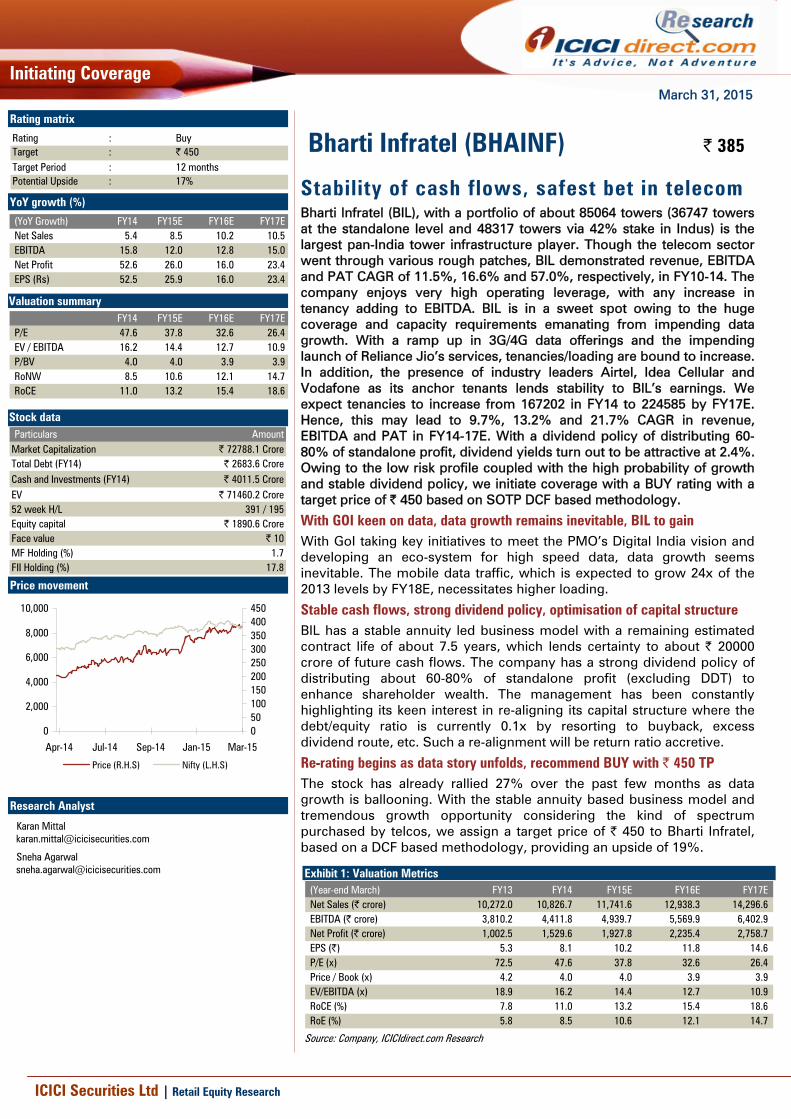
Company background Bharti Infratel (BIL) was incorporated in 2006 as a subsidiary of Bharti Airtel, which is, in turn, a part of the Bharti Group. BIL plays the role of a telecom tower infrastructure service provider that deploys, owns and manages telecom towers and communication structures, for various mobile operators. In January 2008, Bharti Airtel transferred its tower assets to Bharti Infratel through a scheme of arrangement effective as of January 31, 2008. On a standalone basis, the company has about 36747 towers as on date spread across 11 circles. BIL also has a 42% stake in Indus Towers, which is a joint venture between Bharti Airtel, Idea and Vodafone for passive infrastructure sharing. On a consolidated basis, with the Indus stake, BIL has emerged as the largest telecom tower company in India with a tower portfolio of 85064 towers and a pan-India presence. The company enjoys the competitive advantage of a very strong clientele with Bharti Airtel, Idea and Vodafone forming about ~70% of the total telecom market share as its anchor tenants. Exhibit 2: Ownership structure
Bharti Airtel
Bharti Infratel
74.9%
Public 25.1%
42%
Vodafone Indus Towers Idea
Aditya Birla Group
42%
100%16%
Source: DRHP, ICICIdirect.com Research
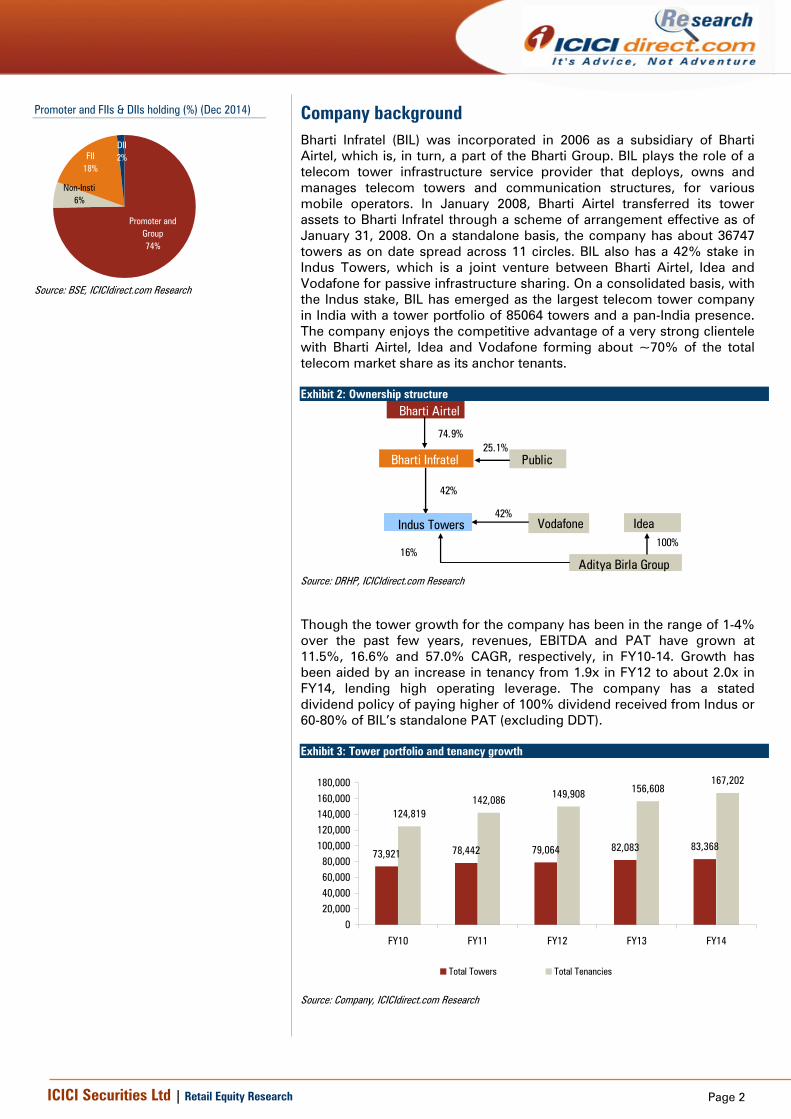
Though the tower growth for the company has been in the range of 1-4% over the past few years, revenues, EBITDA and PAT have grown at 11.5%, 16.6% and 57.0% CAGR, respectively, in FY10-14. Growth has been aided by an increase in tenancy from 1.9x in FY12 to about 2.0x in FY14, lending high operating leverage. The company has a stated dividend policy of paying higher of 100% dividend received from Indus or 60-80% of BIL’s standalone PAT (excluding DDT). Exhibit 3: Tower portfolio and tenancy growth
73,921 78,442 79,064 82,083 83,368
124,819142,086 149,908 156,608
167,202
020,00040,00060,00080,000
100,000120,000140,000160,000180,000
FY10 FY11 FY12 FY13 FY14
Total Towers Total Tenancies
Source: Company, ICICIdirect.com Research
Promoter and FIIs & DIIs holding (%) (Dec 2014)
Promoter and Group74%
Non-Insti6%
FII18%
DII2%
Source: BSE, ICICIdirect.com Research

Page 3ICICI Securities Ltd | Retail Equity Research
The company has institutionalised the ‘GreenTowers P7’ programme, aimed at minimising dependency on diesel consumption and thereby, reducing the carbon footprint. BIL has 2700 solar powered towers with installed capacity of ~9 MW and almost 23000 diesel free towers on its network. During FY13, the company came out with an IPO and raised about | 4118 crore (comprising public issue and subscription by anchor investors). The share price has rallied almost over 74% since then with the increasing investor confidence in BIL’s business model and improving fundamentals.
Exhibit 4: Bharti Infratel – Presence across the country -
Source: Company, ICICIdirect.com Research
Page 4ICICI Securities Ltd | Retail Equity Research
Investment Rationale Colossal in terms of tower portfolio (~85064 towers), falling competition….
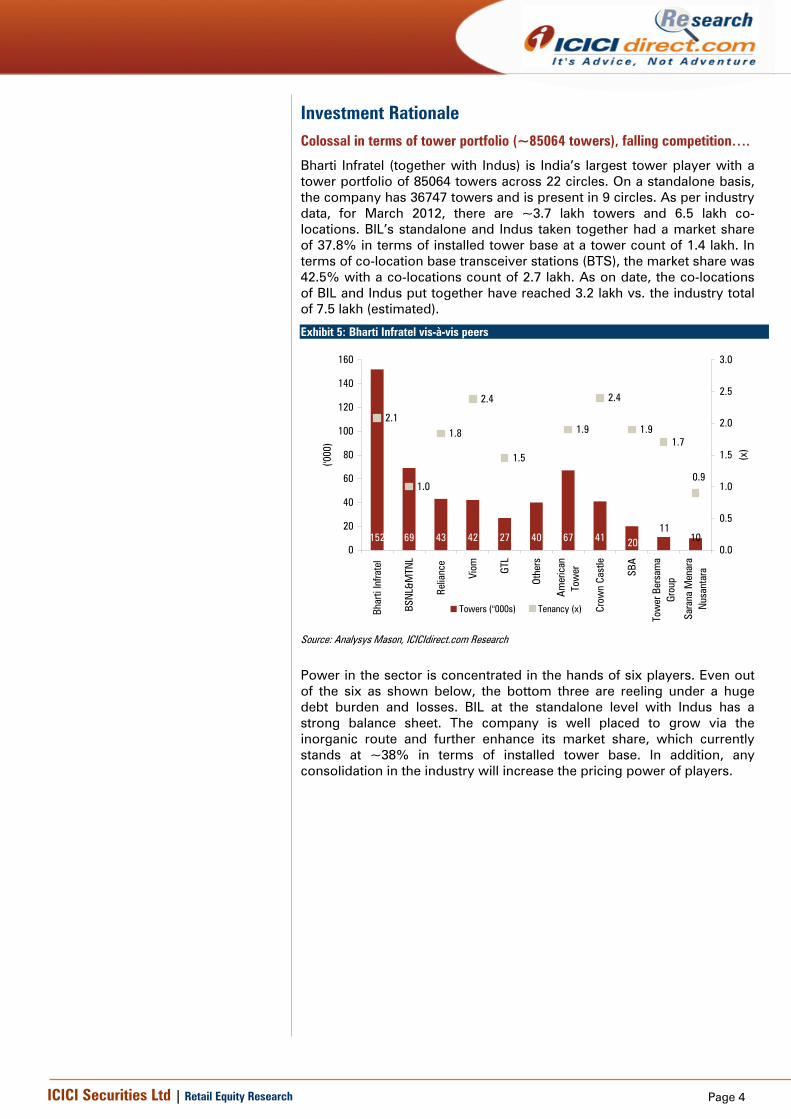
Bharti Infratel (together with Indus) is India’s largest tower player with a tower portfolio of 85064 towers across 22 circles. On a standalone basis, the company has 36747 towers and is present in 9 circles. As per industry data, for March 2012, there are ~3.7 lakh towers and 6.5 lakh co-locations. BIL’s standalone and Indus taken together had a market share of 37.8% in terms of installed tower base at a tower count of 1.4 lakh. In terms of co-location base transceiver stations (BTS), the market share was 42.5% with a co-locations count of 2.7 lakh. As on date, the co-locations of BIL and Indus put together have reached 3.2 lakh vs. the industry total of 7.5 lakh (estimated).
Exhibit 5: Bharti Infratel vis-à-vis peers
152 69 43 42 27 40 67 41 1011
20
2.1
1.0
1.8
2.4
1.5
1.9
2.4
1.91.7
0.9
0
20
40
60
80
100
120
140
160
Bhar
ti In
frate
l
BSN
L&M
TNL
Relia
nce
Viom GT
L
Othe
rs
Am
eric
anTo
wer
Crow
n Ca
stle
SBA
Tow
er B
ersa
ma
Grou
p
Sara
na M
enar
aN
usan
tara
('000
)
0.0
0.5
1.0
1.5
2.0
2.5
3.0
(x)
Towers ("000s) Tenancy (x)
Source: Analysys Mason, ICICIdirect.com Research
Power in the sector is concentrated in the hands of six players. Even out of the six as shown below, the bottom three are reeling under a huge debt burden and losses. BIL at the standalone level with Indus has a strong balance sheet. The company is well placed to grow via the inorganic route and further enhance its market share, which currently stands at ~38% in terms of installed tower base. In addition, any consolidation in the industry will increase the pricing power of players.

Page 5ICICI Securities Ltd | Retail Equity Research
Exhibit 6: Market share in terms of installed tower base (FY12)
Indus29%
Bharti Infratel (Standalone)
9%
BSNL.MTNL18%
RTIL13%
GTL Infra9%
Viom11%
Others11%
Source: Analysys Mason, ICICIdirect.com Research
Exhibit 7: Market share in terms of number of co-locations (FY12)
Indus32%
Bharti Infratel (Standalone)
10%
BSNL.MTNL11%
RTIL14%
GTL Infra7%
Viom16%
Others10%
Source: Analysys Mason, ICICIdirect.com Research
The capital intensive nature of the business insulates the company from the risk of new competition. The average cost to build a ground based tower and a roof-top based tower is | 25 lakh and | 17-18 lakh, respectively. In addition to the initial capex, the tower business entails a maintenance capex of about | 65000 per tower per annum. Moreover, additional tenancy and incremental loading would also entail about | 200000-250000 per tenant. Such a capital intensive nature of the business makes it difficult for any new player to enter as the visibility of healthy return ratios is highly oblique. Moreover, the B2B nature of the business coupled with significant penalties in case of termination of the contract makes a churn in tenancy highly improbable. The competition would remain limited within the players in the industry.
Tenancy to be fuelled by data growth, shift in voice to other spectrum bands Exhibit 8: Growth drivers
Loading all the existing sites with 3G BTS
Loading all the existing sites with additional tenancies for the 2100 MHz & 2300 MHz bands
Building additional towers to meet the current coverage gaps in the network of the telcos
Additional towers for new capacity to be generated over a period of time
The loading will bring in revenues to the tune of 10-15% of the rentals paid
Loading will bring in additional rental revenus (4-8% discount in rentals across operators) and, hence, high operating leverage
Near term triggers Medium term trigger Long term trigger
The loading will bring in revenues to the tune of 10-15% of the rentals paid
The loading will bring in revenues to the tune of 10-15% of the rentals paid
Source: ICICIdirect.com Research
Video, big data, social media, cloud and Internet of Things are gaining prominence with the increasing reach and access of the internet. As per Cisco VNI estimates, in India, internet traffic is expected to grow 5.5-fold from 2013 to 2018, at a CAGR of 41% and reach 3.1 billion GB per month in 2018, up from 0.5 billion GB per month in 2013. The mobile data traffic is expected to grow 24-fold from 2013 to 2018, at a CAGR of 88% reaching 1.2 billion GB per month in 2018, up from 52 million GB per month in 2013.
Page 6ICICI Securities Ltd | Retail Equity Research
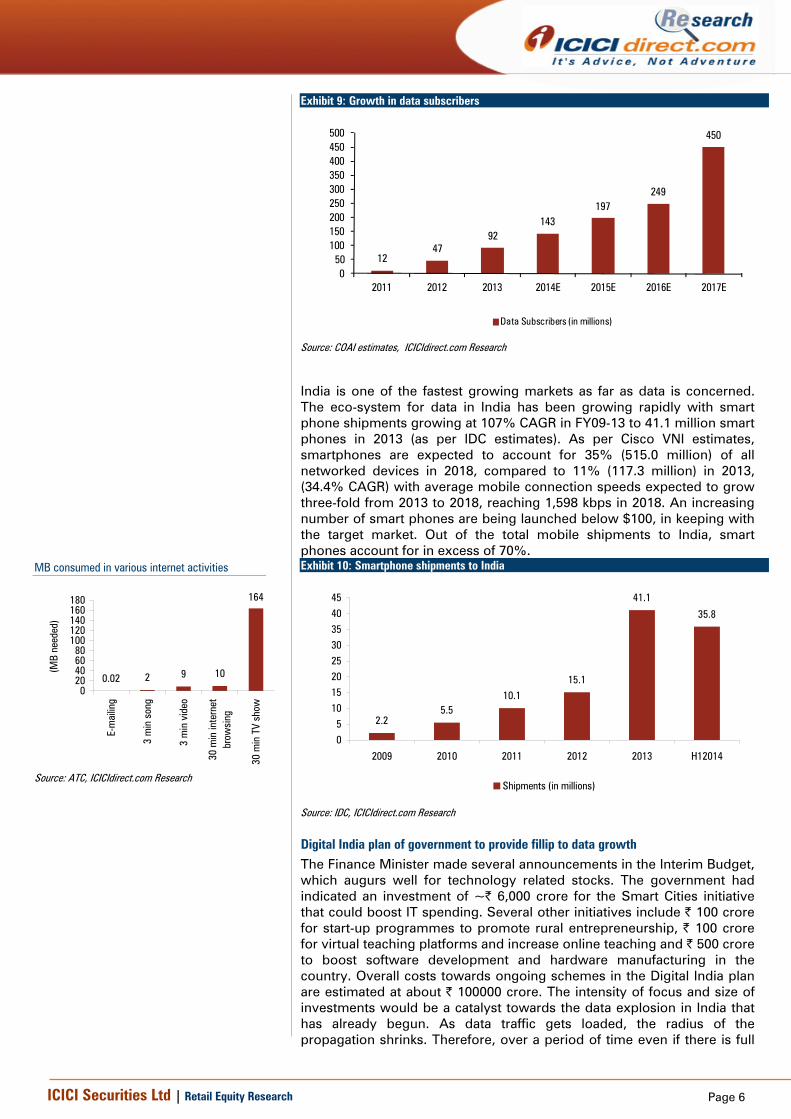
Exhibit 9: Growth in data subscribers
1247
92143
197249
450
050
100150200250300350400450500
2011 2012 2013 2014E 2015E 2016E 2017E
Data Subscribers (in millions)
Source: COAI estimates, ICICIdirect.com Research
India is one of the fastest growing markets as far as data is concerned. The eco-system for data in India has been growing rapidly with smart phone shipments growing at 107% CAGR in FY09-13 to 41.1 million smart phones in 2013 (as per IDC estimates). As per Cisco VNI estimates, smartphones are expected to account for 35% (515.0 million) of all networked devices in 2018, compared to 11% (117.3 million) in 2013, (34.4% CAGR) with average mobile connection speeds expected to grow three-fold from 2013 to 2018, reaching 1,598 kbps in 2018. An increasing number of smart phones are being launched below $100, in keeping with the target market. Out of the total mobile shipments to India, smart phones account for in excess of 70%. Exhibit 10: Smartphone shipments to India
2.25.5
10.115.1
41.1
35.8
05
1015202530354045
2009 2010 2011 2012 2013 H12014
Shipments (in millions)
Source: IDC, ICICIdirect.com Research
Digital India plan of government to provide fillip to data growth The Finance Minister made several announcements in the Interim Budget, which augurs well for technology related stocks. The government had indicated an investment of ~| 6,000 crore for the Smart Cities initiative that could boost IT spending. Several other initiatives include | 100 crore for start-up programmes to promote rural entrepreneurship, | 100 crore for virtual teaching platforms and increase online teaching and | 500 crore to boost software development and hardware manufacturing in the country. Overall costs towards ongoing schemes in the Digital India plan are estimated at about | 100000 crore. The intensity of focus and size of investments would be a catalyst towards the data explosion in India that has already begun. As data traffic gets loaded, the radius of the propagation shrinks. Therefore, over a period of time even if there is full
MB consumed in various internet activities
0.02 2 9 10
164
020406080
100120140160180
E-m
ailin
g
3 m
in s
ong
3 m
in v
ideo
30 m
in in
tern
etbr
owsi
ng
30 m
in T
V sh
ow
(MB
need
ed)
Source: ATC, ICICIdirect.com Research

Page 7ICICI Securities Ltd | Retail Equity Research
coverage, as sites get loaded the coverage would shrink and more sites will be needed. Hence, BIL would directly benefit from mobile data proliferation. Exhibit 11: Government’s plans for digital India
Source: GOI, ICICIdirect.com Research
The benefits of Smart City deals are already visible in BIL. Indus recently got an order for about 3000 towers in the Delhi area at an estimated outlay of ~| 220 crore over three years. Though the finer details of the deal are unavailable, the deal value of | 220 crore translates to a per tower capex of about | 7.3 lakh, which is significantly lower than the ground-based tower (GBT) and roof-top tower (RTT) capex requirements. In such towers, cell sites would be accommodated in specially designed street lights. The successful implementation of such an arrangement could be RoE accretive. We would, however, consider the same in our models once the company starts reporting benefits from the deal.
Telcos have already demonstrated stellar data growth Airtel, Idea and RCom demonstrated average YoY growth of 101%, 125% and 87%, respectively, in total data volume in the past six quarters in total data volume. Data consumption per quarter has increased from about 161 MB, 154 MB, 280 MB in Q3FY13 to about 622 MB, 472 MB and 834 MB, respectively, in the last quarter.
Exhibit 12: Total data consumed
15,8798,339
46,077
77,281
17,400
76,434
010,00020,00030,00040,00050,00060,00070,00080,00090,000
Q2FY
13
Q3FY
13
Q4FY
13
Q1FY
14
Q2FY
14
Q3FY
14
Q4FY
14
Q1FY
15
Q2FY
15
Q3FY
15
(Milli
on M
B's)
Airtel Idea Cellular RCoM
Source: ICICIdirect.com Research
Exhibit 13: Data revenues
2,114.1
514.1
283.0
1,247.2
422.4
1,222.9
0.0
500.0
1,000.0
1,500.0
2,000.0
2,500.0
Q2FY
13
Q3FY
13
Q4FY
13
Q1FY
14
Q2FY
14
Q3FY
14
Q4FY
14
Q1FY
15
Q2FY
15
Q3FY
15
(| C
rore
)
Airtel Idea Cellular RCoM
Source: ICICIdirect.com Research
Banking on this data revolution, telecom operators have made huge investments in spectrum. The industry has spent nearly |2.9 lakh crore in acquiring spectrum since 2010 (| 1.06 lakh crore in the 2010 auctions (2100 and 2300 MHz bands), | 9400 crore in the 2012 auctions (800 and 1800 MHz bands), | 3639 crore in the 2013 auctions (800 and 1800 MHz band of spectrum), | 61162 crore in the February 2014 auctions (1800 and
Page 8ICICI Securities Ltd | Retail Equity Research
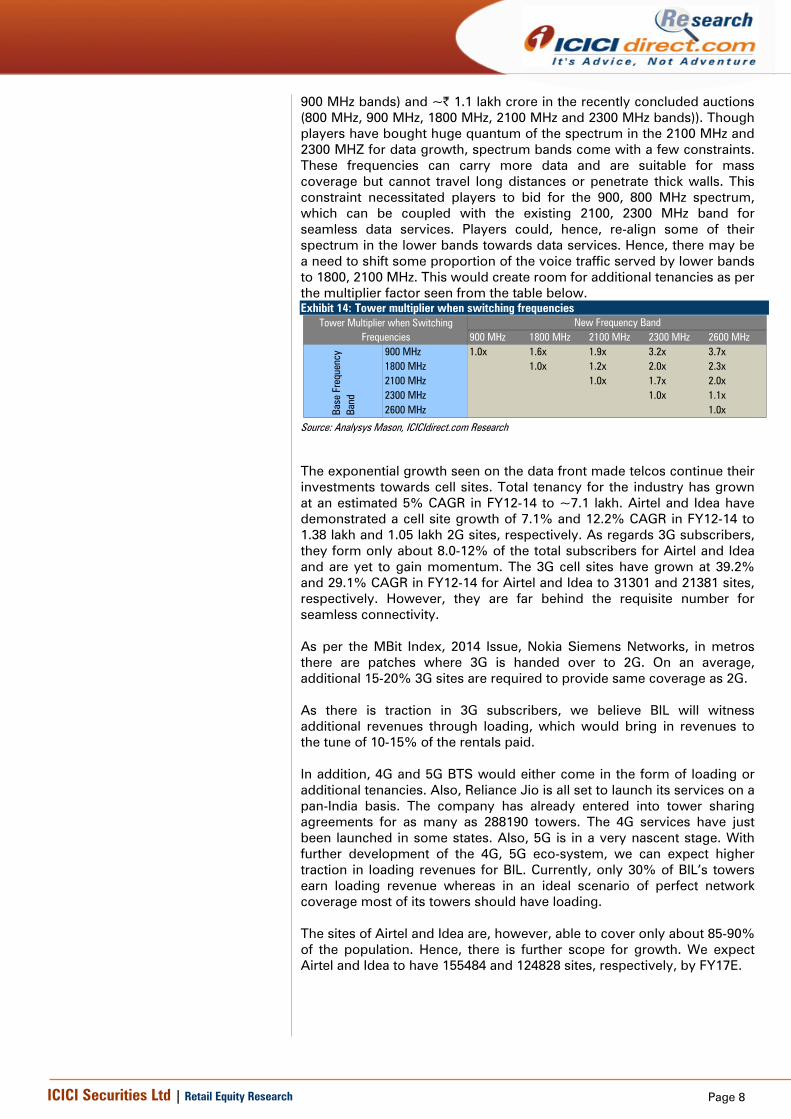
900 MHz bands) and ~| 1.1 lakh crore in the recently concluded auctions (800 MHz, 900 MHz, 1800 MHz, 2100 MHz and 2300 MHz bands)). Though players have bought huge quantum of the spectrum in the 2100 MHz and 2300 MHZ for data growth, spectrum bands come with a few constraints. These frequencies can carry more data and are suitable for mass coverage but cannot travel long distances or penetrate thick walls. This constraint necessitated players to bid for the 900, 800 MHz spectrum, which can be coupled with the existing 2100, 2300 MHz band for seamless data services. Players could, hence, re-align some of their spectrum in the lower bands towards data services. Hence, there may be a need to shift some proportion of the voice traffic served by lower bands to 1800, 2100 MHz. This would create room for additional tenancies as per the multiplier factor seen from the table below. Exhibit 14: Tower multiplier when switching frequencies
900 MHz 1800 MHz 2100 MHz 2300 MHz 2600 MHz900 MHz 1.0x 1.6x 1.9x 3.2x 3.7x1800 MHz 1.0x 1.2x 2.0x 2.3x2100 MHz 1.0x 1.7x 2.0x2300 MHz 1.0x 1.1x2600 MHz 1.0x
Tower Multiplier when SwitchingFrequencies
Base
Fre
quen
cy
Band
New Frequency Band
Source: Analysys Mason, ICICIdirect.com Research
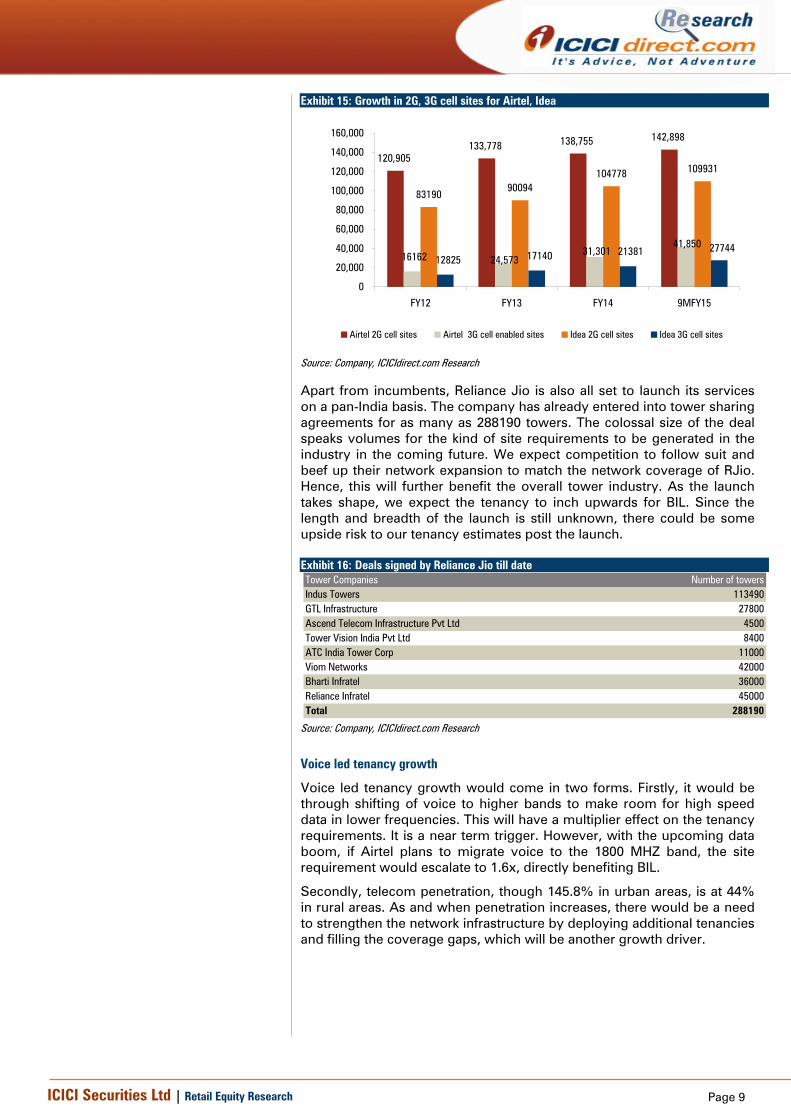
The exponential growth seen on the data front made telcos continue their investments towards cell sites. Total tenancy for the industry has grown at an estimated 5% CAGR in FY12-14 to ~7.1 lakh. Airtel and Idea have demonstrated a cell site growth of 7.1% and 12.2% CAGR in FY12-14 to 1.38 lakh and 1.05 lakh 2G sites, respectively. As regards 3G subscribers, they form only about 8.0-12% of the total subscribers for Airtel and Idea and are yet to gain momentum. The 3G cell sites have grown at 39.2% and 29.1% CAGR in FY12-14 for Airtel and Idea to 31301 and 21381 sites, respectively. However, they are far behind the requisite number for seamless connectivity. As per the MBit Index, 2014 Issue, Nokia Siemens Networks, in metros there are patches where 3G is handed over to 2G. On an average, additional 15-20% 3G sites are required to provide same coverage as 2G. As there is traction in 3G subscribers, we believe BIL will witness additional revenues through loading, which would bring in revenues to the tune of 10-15% of the rentals paid. In addition, 4G and 5G BTS would either come in the form of loading or additional tenancies. Also, Reliance Jio is all set to launch its services on a pan-India basis. The company has already entered into tower sharing agreements for as many as 288190 towers. The 4G services have just been launched in some states. Also, 5G is in a very nascent stage. With further development of the 4G, 5G eco-system, we can expect higher traction in loading revenues for BIL. Currently, only 30% of BIL’s towers earn loading revenue whereas in an ideal scenario of perfect network coverage most of its towers should have loading. The sites of Airtel and Idea are, however, able to cover only about 85-90% of the population. Hence, there is further scope for growth. We expect Airtel and Idea to have 155484 and 124828 sites, respectively, by FY17E.
Page 9ICICI Securities Ltd | Retail Equity Research
Exhibit 15: Growth in 2G, 3G cell sites for Airtel, Idea
120,905133,778 138,755 142,898
8319090094
104778 109931
16162 24,57331,301
41,850
12825 17140 21381 27744
0
20,000
40,000
60,000
80,000
100,000
120,000
140,000
160,000
FY12 FY13 FY14 9MFY15
Airtel 2G cell sites Airtel 3G cell enabled sites Idea 2G cell sites Idea 3G cell sites
Source: Company, ICICIdirect.com Research
Apart from incumbents, Reliance Jio is also all set to launch its services on a pan-India basis. The company has already entered into tower sharing agreements for as many as 288190 towers. The colossal size of the deal speaks volumes for the kind of site requirements to be generated in the industry in the coming future. We expect competition to follow suit and beef up their network expansion to match the network coverage of RJio. Hence, this will further benefit the overall tower industry. As the launch takes shape, we expect the tenancy to inch upwards for BIL. Since the length and breadth of the launch is still unknown, there could be some upside risk to our tenancy estimates post the launch. Exhibit 16: Deals signed by Reliance Jio till date Tower Companies Number of towersIndus Towers 113490GTL Infrastructure 27800Ascend Telecom Infrastructure Pvt Ltd 4500Tower Vision India Pvt Ltd 8400ATC India Tower Corp 11000Viom Networks 42000Bharti Infratel 36000Reliance Infratel 45000Total 288190
Source: Company, ICICIdirect.com Research
Voice led tenancy growth
Voice led tenancy growth would come in two forms. Firstly, it would be through shifting of voice to higher bands to make room for high speed data in lower frequencies. This will have a multiplier effect on the tenancy requirements. It is a near term trigger. However, with the upcoming data boom, if Airtel plans to migrate voice to the 1800 MHZ band, the site requirement would escalate to 1.6x, directly benefiting BIL.
Secondly, telecom penetration, though 145.8% in urban areas, is at 44% in rural areas. As and when penetration increases, there would be a need to strengthen the network infrastructure by deploying additional tenancies and filling the coverage gaps, which will be another growth driver.

Page 10ICICI Securities Ltd | Retail Equity Research
Exhibit 17: Urban and rural penetration
88.7
119.7
169.6
145.8
14.824.3
33.8 39.2 41.0 44.0
157.3147.0
0.020.040.060.080.0
100.0120.0140.0160.0180.0
FY09 FY10 FY11 FY12 FY13 FY14
(%)
Urban Rural
Source: Company, ICICIdirect.com Research
Stable cash flows, long term contracts, built-in inflation linked escalation
The company enters into master services agreements (MSAs) for 10-15 years with its tenants, providing visibility for stable cash flows. There are significant exit penalties laid out in the MSA, which discourages early termination of contracts. Revenues are so designed that any additional tenancy has a multiplier effect on EBITDA margins.
Tower operators have, however, remained insulated from the repercussions of the intense rivalry in the telecom space. A lot of new players entered the telecom space, leading to a hyper competition phase in the sector with about 10-12 operators in each circle vs. the global average of five to six players. This led to a huge decline in the ARPU across telcos. Though telecom sector ARPUs (GSM) declined from | 131 to | 97 in FY10 to FY12, the sharing revenue per tenant per month remained pretty stable for BIL at ~| 34000 levels. There has been some resilience in pricing power in the past year. However, the fact that there is very little correlation between the revenues of BIL and other telcos comes in as a solace, especially when the industry fears an impending price war after Reliance Jio’s launch. Exhibit 18: Sharing revenue per tower per month of BIL vs. telecom industry ARPUs
131
10097
105
112
34184
34724 34,625 34,716
33,863
70
80
90
100
110
120
130(|
)
32000
32500
33000
33500
34000
34500
35000
35500
36000
(|)
ARPU (GSM) Sharing Revenue/tenant/p.m for BIL
Source: ,Trai, ICICIdirect.com Research
BIL is also insulated from the massive spectrum payouts to which the other players are exposed. The return ratios are not plagued by several payouts to the government in the form of license fees, spectrum usage charges. It is also safeguarded from various regulatory upheavals.
Page 11ICICI Securities Ltd | Retail Equity Research
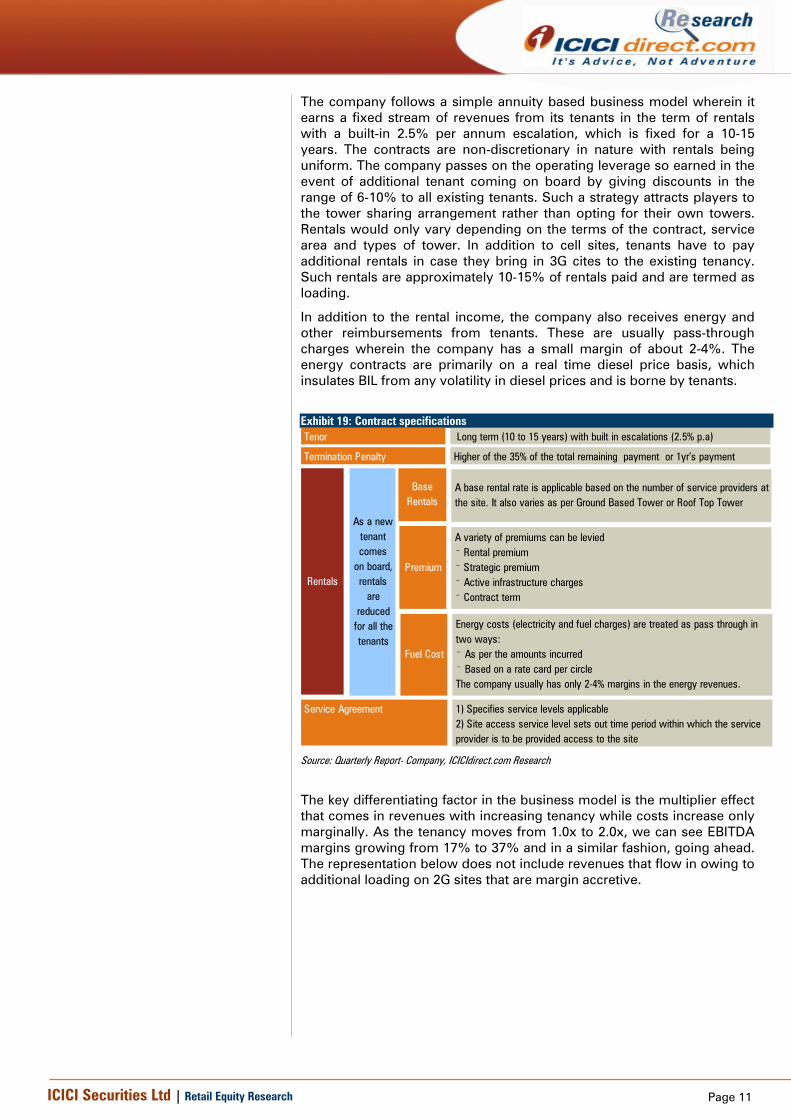
The company follows a simple annuity based business model wherein it earns a fixed stream of revenues from its tenants in the term of rentals with a built-in 2.5% per annum escalation, which is fixed for a 10-15 years. The contracts are non-discretionary in nature with rentals being uniform. The company passes on the operating leverage so earned in the event of additional tenant coming on board by giving discounts in the range of 6-10% to all existing tenants. Such a strategy attracts players to the tower sharing arrangement rather than opting for their own towers. Rentals would only vary depending on the terms of the contract, service area and types of tower. In addition to cell sites, tenants have to pay additional rentals in case they bring in 3G cites to the existing tenancy. Such rentals are approximately 10-15% of rentals paid and are termed as loading.
In addition to the rental income, the company also receives energy and other reimbursements from tenants. These are usually pass-through charges wherein the company has a small margin of about 2-4%. The energy contracts are primarily on a real time diesel price basis, which insulates BIL from any volatility in diesel prices and is borne by tenants.
Exhibit 19: Contract specifications Tenor
Termination Penalty
Long term (10 to 15 years) with built in escalations (2.5% p.a)
Higher of the 35% of the total remaining payment or 1yr’s payment
Rentals
Base Rentals
Premium
Fuel Cost
A base rental rate is applicable based on the number of service providers at the site. It also varies as per Ground Based Tower or Roof Top Tower
A variety of premiums can be levied⁻ Rental premium⁻ Strategic premium⁻ Active infrastructure charges⁻ Contract term
Energy costs (electricity and fuel charges) are treated as pass through in two ways:⁻ As per the amounts incurred⁻ Based on a rate card per circleThe company usually has only 2-4% margins in the energy revenues.
Service Agreement 1) Specifies service levels applicable2) Site access service level sets out time period within which the service provider is to be provided access to the site
As a new tenant comes
on board, rentals
are reduced
for all the tenants
Source: Quarterly Report- Company, ICICIdirect.com Research
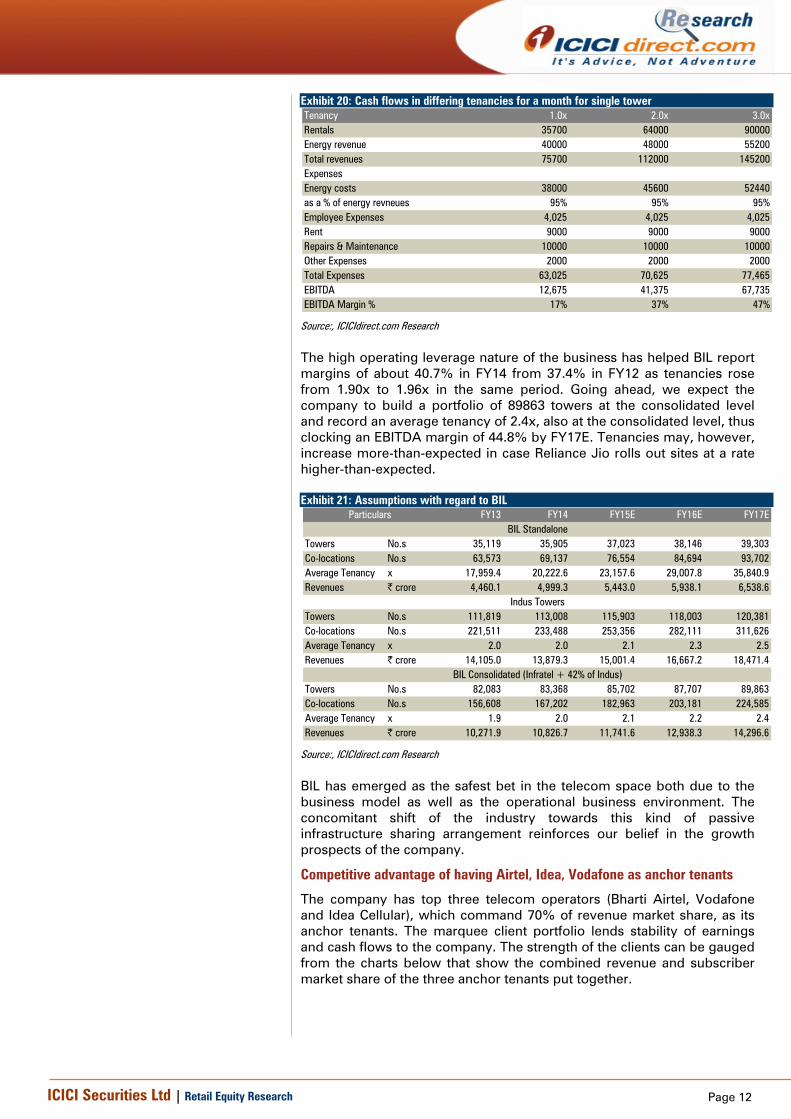
The key differentiating factor in the business model is the multiplier effect that comes in revenues with increasing tenancy while costs increase only marginally. As the tenancy moves from 1.0x to 2.0x, we can see EBITDA margins growing from 17% to 37% and in a similar fashion, going ahead. The representation below does not include revenues that flow in owing to additional loading on 2G sites that are margin accretive.
Page 12ICICI Securities Ltd | Retail Equity Research
Exhibit 20: Cash flows in differing tenancies for a month for single tower Tenancy 1.0x 2.0x 3.0xRentals 35700 64000 90000Energy revenue 40000 48000 55200Total revenues 75700 112000 145200ExpensesEnergy costs 38000 45600 52440as a % of energy revneues 95% 95% 95%Employee Expenses 4,025 4,025 4,025Rent 9000 9000 9000Repairs & Maintenance 10000 10000 10000Other Expenses 2000 2000 2000Total Expenses 63,025 70,625 77,465EBITDA 12,675 41,375 67,735EBITDA Margin % 17% 37% 47%
Source:, ICICIdirect.com Research
The high operating leverage nature of the business has helped BIL report margins of about 40.7% in FY14 from 37.4% in FY12 as tenancies rose from 1.90x to 1.96x in the same period. Going ahead, we expect the company to build a portfolio of 89863 towers at the consolidated level and record an average tenancy of 2.4x, also at the consolidated level, thus clocking an EBITDA margin of 44.8% by FY17E. Tenancies may, however, increase more-than-expected in case Reliance Jio rolls out sites at a rate higher-than-expected. Exhibit 21: Assumptions with regard to BIL
FY13 FY14 FY15E FY16E FY17E
Towers No.s 35,119 35,905 37,023 38,146 39,303Co-locations No.s 63,573 69,137 76,554 84,694 93,702Average Tenancy x 17,959.4 20,222.6 23,157.6 29,007.8 35,840.9Revenues | crore 4,460.1 4,999.3 5,443.0 5,938.1 6,538.6
Towers No.s 111,819 113,008 115,903 118,003 120,381Co-locations No.s 221,511 233,488 253,356 282,111 311,626Average Tenancy x 2.0 2.0 2.1 2.3 2.5Revenues | crore 14,105.0 13,879.3 15,001.4 16,667.2 18,471.4
Towers No.s 82,083 83,368 85,702 87,707 89,863Co-locations No.s 156,608 167,202 182,963 203,181 224,585Average Tenancy x 1.9 2.0 2.1 2.2 2.4Revenues | crore 10,271.9 10,826.7 11,741.6 12,938.3 14,296.6
BIL Standalone
Indus Towers
BIL Consolidated (Infratel + 42% of Indus)
Particulars
Source:, ICICIdirect.com Research
BIL has emerged as the safest bet in the telecom space both due to the business model as well as the operational business environment. The concomitant shift of the industry towards this kind of passive infrastructure sharing arrangement reinforces our belief in the growth prospects of the company.
Competitive advantage of having Airtel, Idea, Vodafone as anchor tenants
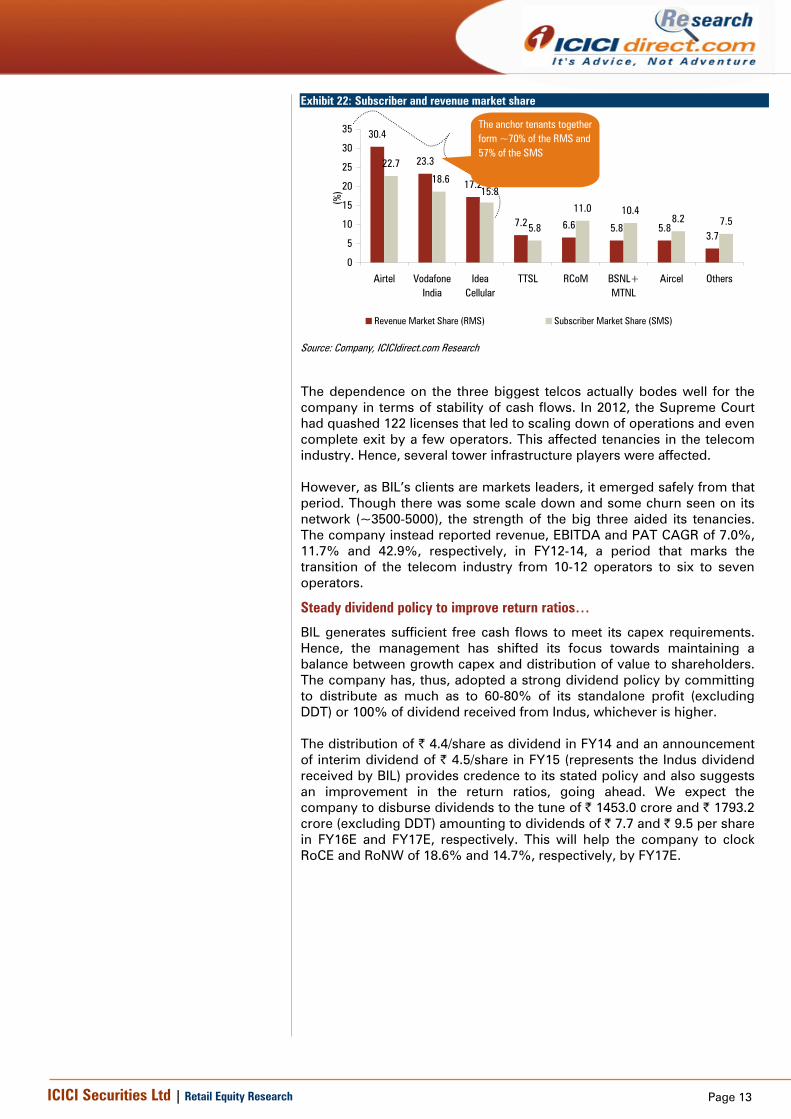
The company has top three telecom operators (Bharti Airtel, Vodafone and Idea Cellular), which command 70% of revenue market share, as its anchor tenants. The marquee client portfolio lends stability of earnings and cash flows to the company. The strength of the clients can be gauged from the charts below that show the combined revenue and subscriber market share of the three anchor tenants put together.
Page 13ICICI Securities Ltd | Retail Equity Research
Exhibit 22: Subscriber and revenue market share
30.4
23.3
17.2
7.2 6.6 5.8 5.83.7
22.7
5.8
11.0 10.48.2 7.5
18.615.8
0
5
10
15
20
25
30
35
Airtel VodafoneIndia
IdeaCellular
TTSL RCoM BSNL+MTNL
Aircel Others
(%)
Revenue Market Share (RMS) Subscriber Market Share (SMS)
The anchor tenants together form ~70% of the RMS and 57% of the SMS
Source: Company, ICICIdirect.com Research
The dependence on the three biggest telcos actually bodes well for the company in terms of stability of cash flows. In 2012, the Supreme Court had quashed 122 licenses that led to scaling down of operations and even complete exit by a few operators. This affected tenancies in the telecom industry. Hence, several tower infrastructure players were affected. However, as BIL’s clients are markets leaders, it emerged safely from that period. Though there was some scale down and some churn seen on its network (~3500-5000), the strength of the big three aided its tenancies. The company instead reported revenue, EBITDA and PAT CAGR of 7.0%, 11.7% and 42.9%, respectively, in FY12-14, a period that marks the transition of the telecom industry from 10-12 operators to six to seven operators.
Steady dividend policy to improve return ratios…
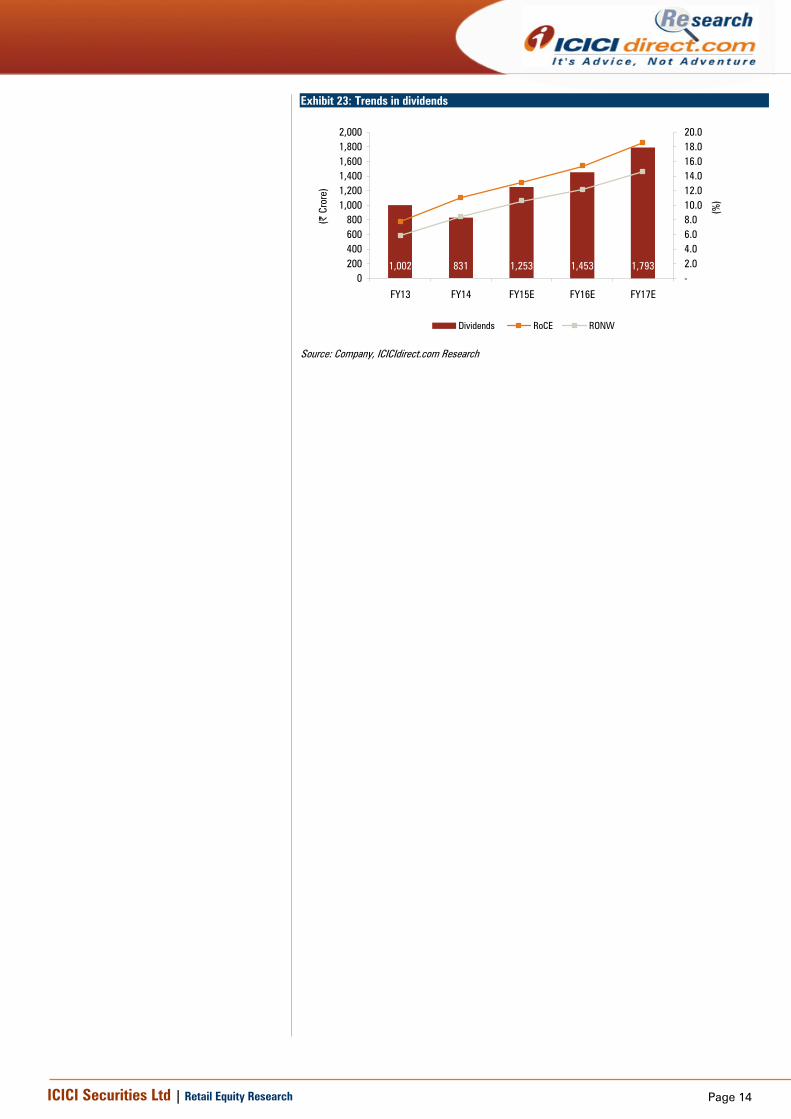
BIL generates sufficient free cash flows to meet its capex requirements. Hence, the management has shifted its focus towards maintaining a balance between growth capex and distribution of value to shareholders. The company has, thus, adopted a strong dividend policy by committing to distribute as much as to 60-80% of its standalone profit (excluding DDT) or 100% of dividend received from Indus, whichever is higher. The distribution of | 4.4/share as dividend in FY14 and an announcement of interim dividend of | 4.5/share in FY15 (represents the Indus dividend received by BIL) provides credence to its stated policy and also suggests an improvement in the return ratios, going ahead. We expect the company to disburse dividends to the tune of | 1453.0 crore and | 1793.2 crore (excluding DDT) amounting to dividends of | 7.7 and | 9.5 per share in FY16E and FY17E, respectively. This will help the company to clock RoCE and RoNW of 18.6% and 14.7%, respectively, by FY17E.
Page 14ICICI Securities Ltd | Retail Equity Research
Exhibit 23: Trends in dividends
1,002 831 1,253 1,453 1,7930
200400600800
1,0001,2001,4001,6001,8002,000
FY13 FY14 FY15E FY16E FY17E
(| C
rore
)
-2.04.06.08.010.012.014.016.018.020.0
(%)
Dividends RoCE RONW
Source: Company, ICICIdirect.com Research
Page 15ICICI Securities Ltd | Retail Equity Research
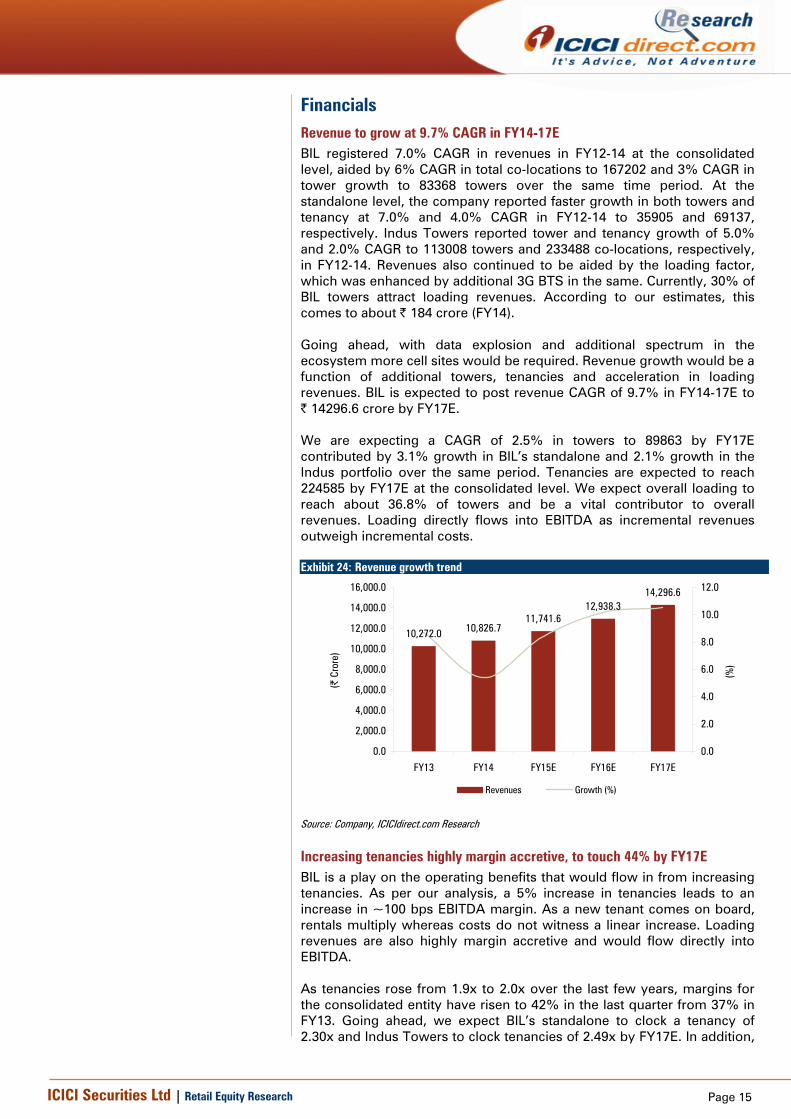
Financials Revenue to grow at 9.7% CAGR in FY14-17E BIL registered 7.0% CAGR in revenues in FY12-14 at the consolidated level, aided by 6% CAGR in total co-locations to 167202 and 3% CAGR in tower growth to 83368 towers over the same time period. At the standalone level, the company reported faster growth in both towers and tenancy at 7.0% and 4.0% CAGR in FY12-14 to 35905 and 69137, respectively. Indus Towers reported tower and tenancy growth of 5.0% and 2.0% CAGR to 113008 towers and 233488 co-locations, respectively, in FY12-14. Revenues also continued to be aided by the loading factor, which was enhanced by additional 3G BTS in the same. Currently, 30% of BIL towers attract loading revenues. According to our estimates, this comes to about | 184 crore (FY14). Going ahead, with data explosion and additional spectrum in the ecosystem more cell sites would be required. Revenue growth would be a function of additional towers, tenancies and acceleration in loading revenues. BIL is expected to post revenue CAGR of 9.7% in FY14-17E to | 14296.6 crore by FY17E. We are expecting a CAGR of 2.5% in towers to 89863 by FY17E contributed by 3.1% growth in BIL’s standalone and 2.1% growth in the Indus portfolio over the same period. Tenancies are expected to reach 224585 by FY17E at the consolidated level. We expect overall loading to reach about 36.8% of towers and be a vital contributor to overall revenues. Loading directly flows into EBITDA as incremental revenues outweigh incremental costs. Exhibit 24: Revenue growth trend
10,272.0 10,826.711,741.6
12,938.314,296.6
0.0
2,000.0
4,000.0
6,000.0
8,000.0
10,000.0
12,000.0
14,000.0
16,000.0
FY13 FY14 FY15E FY16E FY17E
(| C
rore
)
0.0
2.0
4.0
6.0
8.0
10.0
12.0
(%)
Revenues Growth (%)
Source: Company, ICICIdirect.com Research
Increasing tenancies highly margin accretive, to touch 44% by FY17E BIL is a play on the operating benefits that would flow in from increasing tenancies. As per our analysis, a 5% increase in tenancies leads to an increase in ~100 bps EBITDA margin. As a new tenant comes on board, rentals multiply whereas costs do not witness a linear increase. Loading revenues are also highly margin accretive and would flow directly into EBITDA. As tenancies rose from 1.9x to 2.0x over the last few years, margins for the consolidated entity have risen to 42% in the last quarter from 37% in FY13. Going ahead, we expect BIL’s standalone to clock a tenancy of 2.30x and Indus Towers to clock tenancies of 2.49x by FY17E. In addition,
Page 16ICICI Securities Ltd | Retail Equity Research
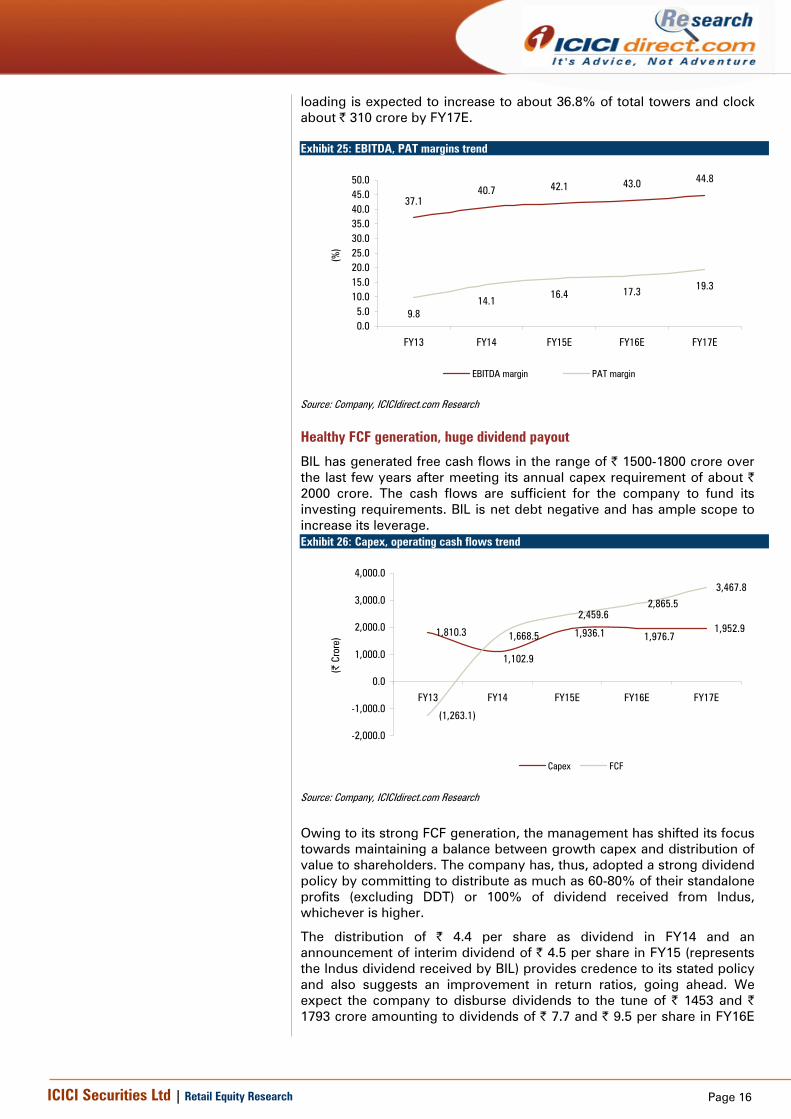
loading is expected to increase to about 36.8% of total towers and clock about | 310 crore by FY17E. Exhibit 25: EBITDA, PAT margins trend
37.140.7 42.1 43.0 44.8
9.814.1
16.4 17.3 19.3
0.05.0
10.015.020.025.030.035.040.045.050.0
FY13 FY14 FY15E FY16E FY17E(%
)
EBITDA margin PAT margin
Source: Company, ICICIdirect.com Research
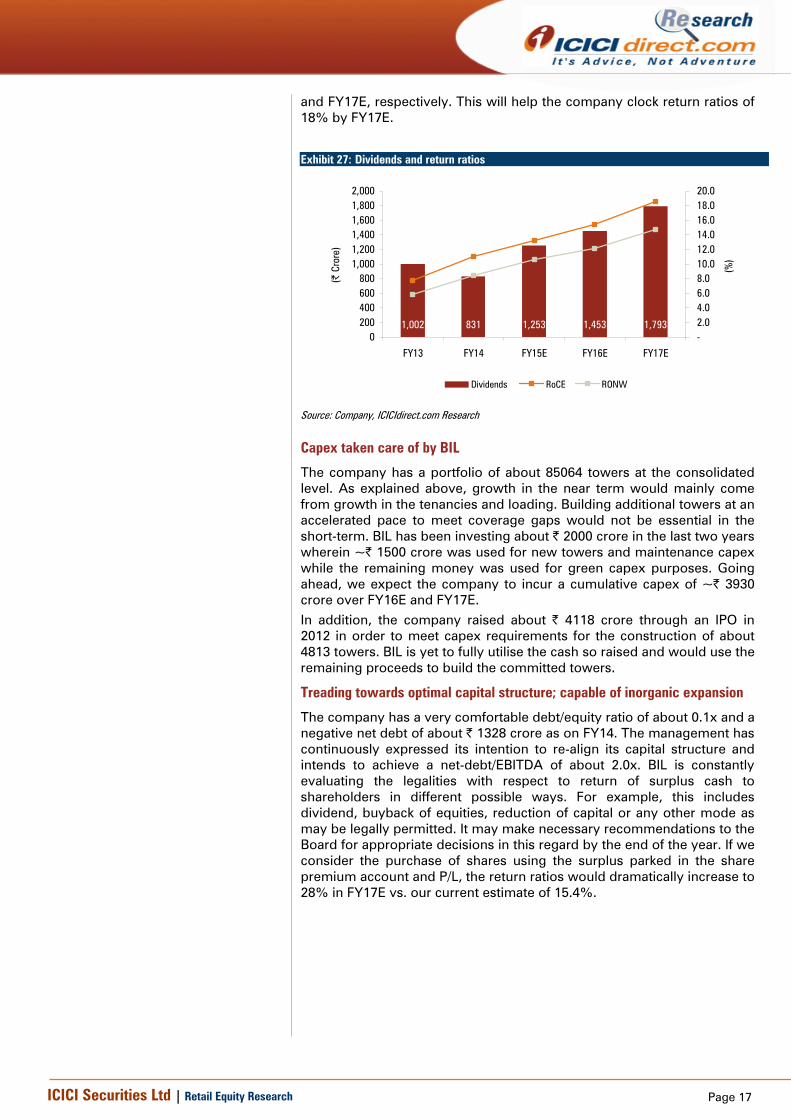
Healthy FCF generation, huge dividend payout
BIL has generated free cash flows in the range of | 1500-1800 crore over the last few years after meeting its annual capex requirement of about | 2000 crore. The cash flows are sufficient for the company to fund its investing requirements. BIL is net debt negative and has ample scope to increase its leverage. Exhibit 26: Capex, operating cash flows trend
1,810.3 1,952.9
(1,263.1)
1,668.5
2,459.62,865.5
3,467.8
1,102.9
1,936.1 1,976.7
-2,000.0
-1,000.0
0.0
1,000.0
2,000.0
3,000.0
4,000.0
FY13 FY14 FY15E FY16E FY17E
(| C
rore
)
Capex FCF
Source: Company, ICICIdirect.com Research
Owing to its strong FCF generation, the management has shifted its focus towards maintaining a balance between growth capex and distribution of value to shareholders. The company has, thus, adopted a strong dividend policy by committing to distribute as much as 60-80% of their standalone profits (excluding DDT) or 100% of dividend received from Indus, whichever is higher.
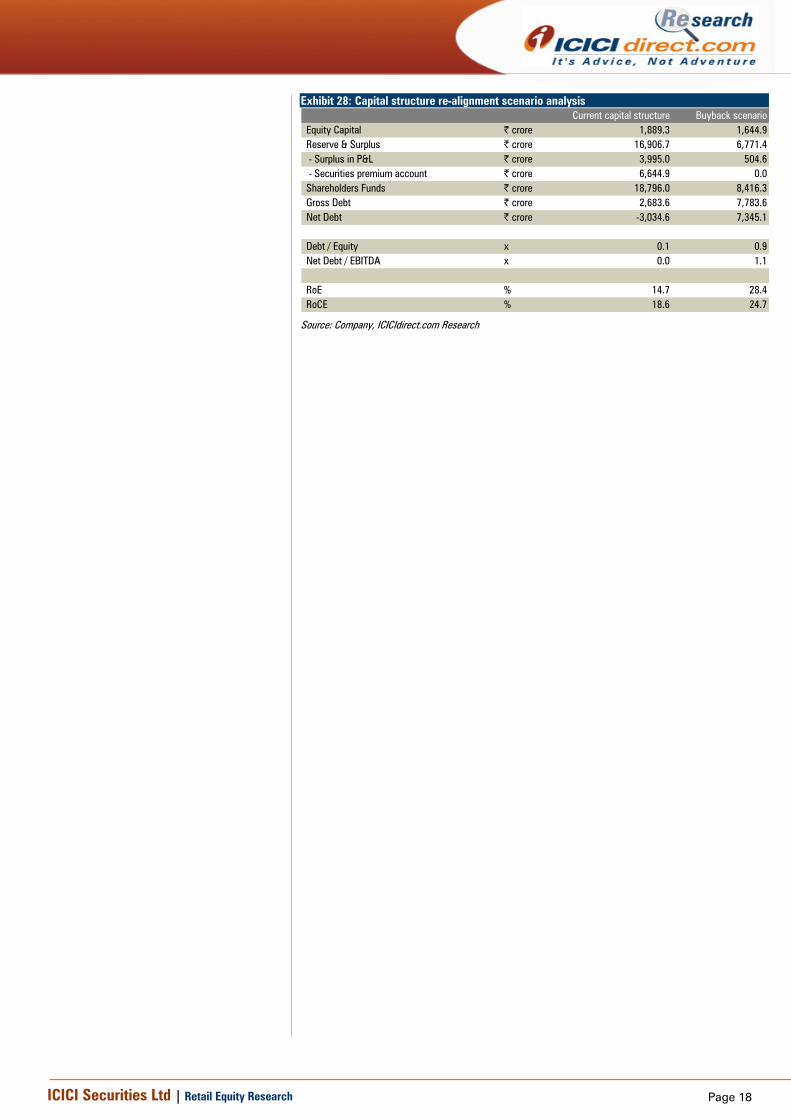
The distribution of | 4.4 per share as dividend in FY14 and an announcement of interim dividend of | 4.5 per share in FY15 (represents the Indus dividend received by BIL) provides credence to its stated policy and also suggests an improvement in return ratios, going ahead. We expect the company to disburse dividends to the tune of | 1453 and | 1793 crore amounting to dividends of | 7.7 and | 9.5 per share in FY16E
Page 17ICICI Securities Ltd | Retail Equity Research
and FY17E, respectively. This will help the company clock return ratios of 18% by FY17E.
Exhibit 27: Dividends and return ratios
1,002 831 1,253 1,453 1,7930
200400600800
1,0001,2001,4001,6001,8002,000
FY13 FY14 FY15E FY16E FY17E
(| C
rore
)-2.04.06.08.010.012.014.016.018.020.0
(%)
Dividends RoCE RONW
Source: Company, ICICIdirect.com Research
Capex taken care of by BIL
The company has a portfolio of about 85064 towers at the consolidated level. As explained above, growth in the near term would mainly come from growth in the tenancies and loading. Building additional towers at an accelerated pace to meet coverage gaps would not be essential in the short-term. BIL has been investing about | 2000 crore in the last two years wherein ~| 1500 crore was used for new towers and maintenance capex while the remaining money was used for green capex purposes. Going ahead, we expect the company to incur a cumulative capex of ~| 3930 crore over FY16E and FY17E.
In addition, the company raised about | 4118 crore through an IPO in 2012 in order to meet capex requirements for the construction of about 4813 towers. BIL is yet to fully utilise the cash so raised and would use the remaining proceeds to build the committed towers.
Treading towards optimal capital structure; capable of inorganic expansion
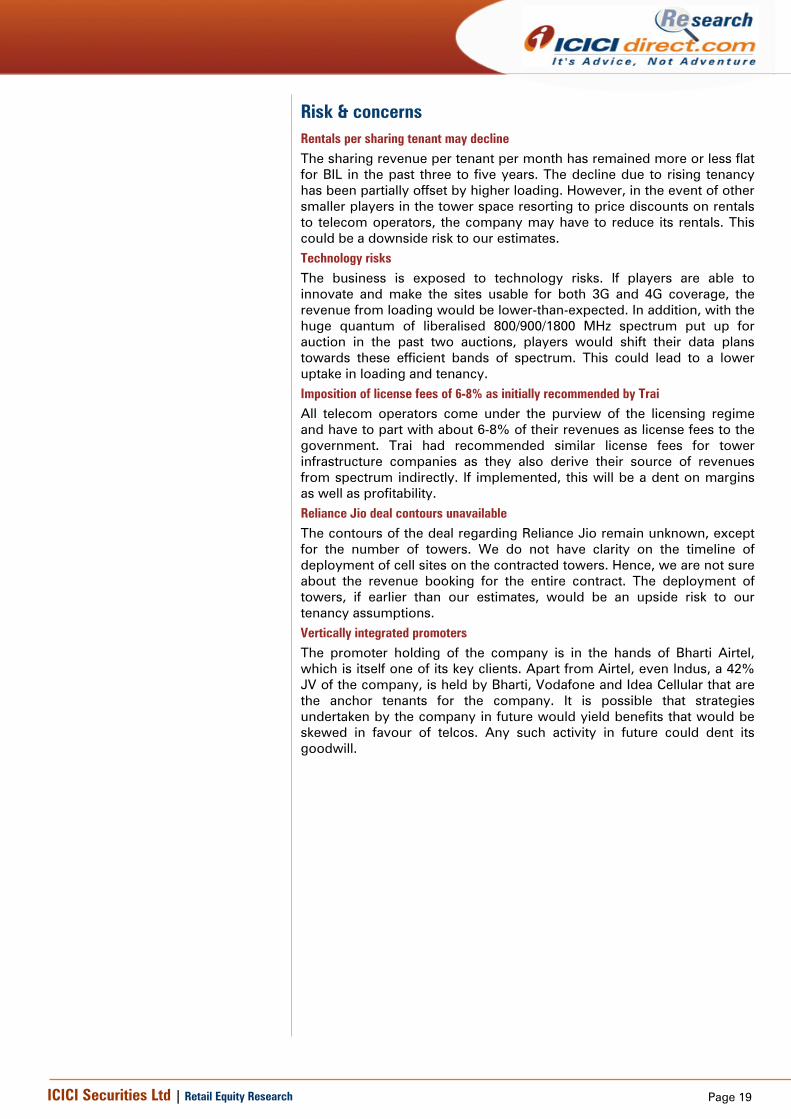
The company has a very comfortable debt/equity ratio of about 0.1x and a negative net debt of about | 1328 crore as on FY14. The management has continuously expressed its intention to re-align its capital structure and intends to achieve a net-debt/EBITDA of about 2.0x. BIL is constantly evaluating the legalities with respect to return of surplus cash to shareholders in different possible ways. For example, this includes dividend, buyback of equities, reduction of capital or any other mode as may be legally permitted. It may make necessary recommendations to the Board for appropriate decisions in this regard by the end of the year. If we consider the purchase of shares using the surplus parked in the share premium account and P/L, the return ratios would dramatically increase to 28% in FY17E vs. our current estimate of 15.4%.
Page 18ICICI Securities Ltd | Retail Equity Research
Exhibit 28: Capital structure re-alignment scenario analysis Current capital structure Buyback scenario
Equity Capital | crore 1,889.3 1,644.9Reserve & Surplus | crore 16,906.7 6,771.4 - Surplus in P&L | crore 3,995.0 504.6 - Securities premium account | crore 6,644.9 0.0Shareholders Funds | crore 18,796.0 8,416.3Gross Debt | crore 2,683.6 7,783.6Net Debt | crore -3,034.6 7,345.1
Debt / Equity x 0.1 0.9Net Debt / EBITDA x 0.0 1.1
RoE % 14.7 28.4RoCE % 18.6 24.7
Source: Company, ICICIdirect.com Research
Page 19ICICI Securities Ltd | Retail Equity Research
Risk & concerns Rentals per sharing tenant may decline The sharing revenue per tenant per month has remained more or less flat for BIL in the past three to five years. The decline due to rising tenancy has been partially offset by higher loading. However, in the event of other smaller players in the tower space resorting to price discounts on rentals to telecom operators, the company may have to reduce its rentals. This could be a downside risk to our estimates. Technology risks The business is exposed to technology risks. If players are able to innovate and make the sites usable for both 3G and 4G coverage, the revenue from loading would be lower-than-expected. In addition, with the huge quantum of liberalised 800/900/1800 MHz spectrum put up for auction in the past two auctions, players would shift their data plans towards these efficient bands of spectrum. This could lead to a lower uptake in loading and tenancy. Imposition of license fees of 6-8% as initially recommended by Trai All telecom operators come under the purview of the licensing regime and have to part with about 6-8% of their revenues as license fees to the government. Trai had recommended similar license fees for tower infrastructure companies as they also derive their source of revenues from spectrum indirectly. If implemented, this will be a dent on margins as well as profitability. Reliance Jio deal contours unavailable The contours of the deal regarding Reliance Jio remain unknown, except for the number of towers. We do not have clarity on the timeline of deployment of cell sites on the contracted towers. Hence, we are not sure about the revenue booking for the entire contract. The deployment of towers, if earlier than our estimates, would be an upside risk to our tenancy assumptions. Vertically integrated promoters The promoter holding of the company is in the hands of Bharti Airtel, which is itself one of its key clients. Apart from Airtel, even Indus, a 42% JV of the company, is held by Bharti, Vodafone and Idea Cellular that are the anchor tenants for the company. It is possible that strategies undertaken by the company in future would yield benefits that would be skewed in favour of telcos. Any such activity in future could dent its goodwill.
Page 20ICICI Securities Ltd | Retail Equity Research
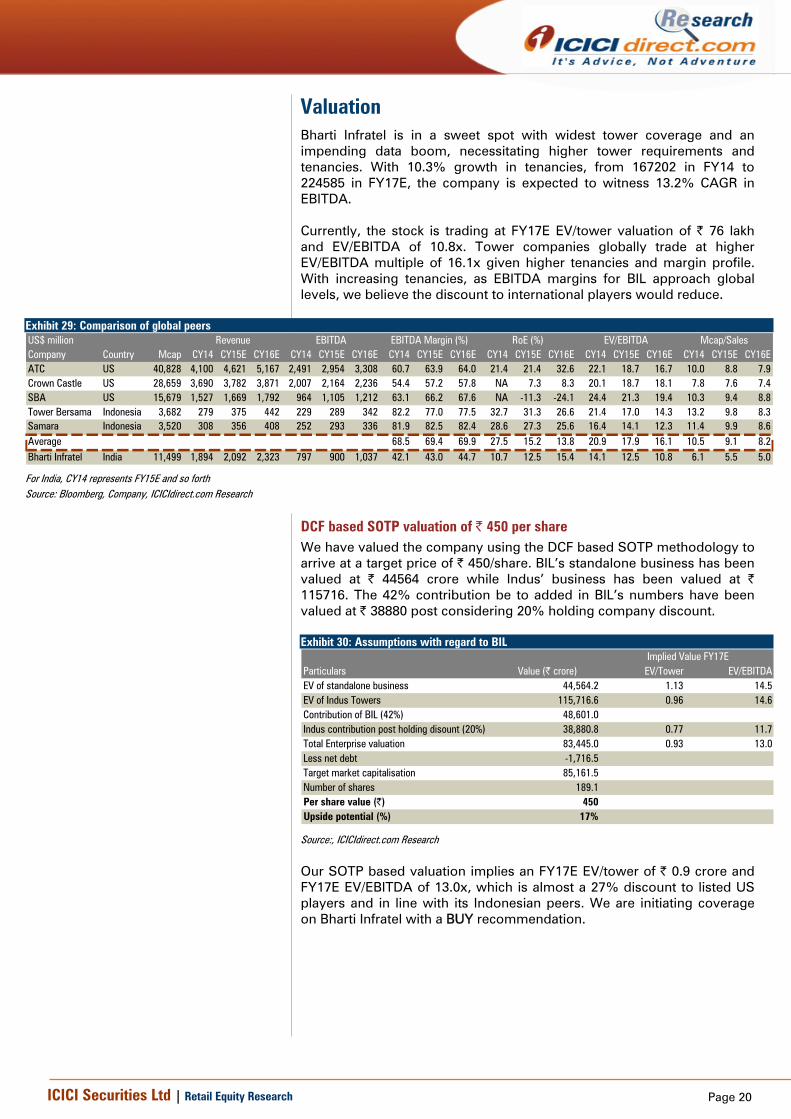
Valuation Bharti Infratel is in a sweet spot with widest tower coverage and an impending data boom, necessitating higher tower requirements and tenancies. With 10.3% growth in tenancies, from 167202 in FY14 to 224585 in FY17E, the company is expected to witness 13.2% CAGR in EBITDA. Currently, the stock is trading at FY17E EV/tower valuation of | 76 lakh and EV/EBITDA of 10.8x. Tower companies globally trade at higher EV/EBITDA multiple of 16.1x given higher tenancies and margin profile. With increasing tenancies, as EBITDA margins for BIL approach global levels, we believe the discount to international players would reduce.
Exhibit 29: Comparison of global peers US$ millionCompany Country Mcap CY14 CY15E CY16E CY14 CY15E CY16E CY14 CY15E CY16E CY14 CY15E CY16E CY14 CY15E CY16E CY14 CY15E CY16EATC US 40,828 4,100 4,621 5,167 2,491 2,954 3,308 60.7 63.9 64.0 21.4 21.4 32.6 22.1 18.7 16.7 10.0 8.8 7.9Crown Castle US 28,659 3,690 3,782 3,871 2,007 2,164 2,236 54.4 57.2 57.8 NA 7.3 8.3 20.1 18.7 18.1 7.8 7.6 7.4SBA US 15,679 1,527 1,669 1,792 964 1,105 1,212 63.1 66.2 67.6 NA -11.3 -24.1 24.4 21.3 19.4 10.3 9.4 8.8Tower Bersama Indonesia 3,682 279 375 442 229 289 342 82.2 77.0 77.5 32.7 31.3 26.6 21.4 17.0 14.3 13.2 9.8 8.3Samara Indonesia 3,520 308 356 408 252 293 336 81.9 82.5 82.4 28.6 27.3 25.6 16.4 14.1 12.3 11.4 9.9 8.6Average 68.5 69.4 69.9 27.5 15.2 13.8 20.9 17.9 16.1 10.5 9.1 8.2Bharti Infratel India 11,499 1,894 2,092 2,323 797 900 1,037 42.1 43.0 44.7 10.7 12.5 15.4 14.1 12.5 10.8 6.1 5.5 5.0
EV/EBITDA Mcap/SalesEBITDA Margin (%)Revenue EBITDA RoE (%)
For India, CY14 represents FY15E and so forth Source: Bloomberg, Company, ICICIdirect.com Research
DCF based SOTP valuation of | 450 per share We have valued the company using the DCF based SOTP methodology to arrive at a target price of | 450/share. BIL’s standalone business has been valued at | 44564 crore while Indus’ business has been valued at | 115716. The 42% contribution be to added in BIL’s numbers have been valued at | 38880 post considering 20% holding company discount. Exhibit 30: Assumptions with regard to BIL
Particulars Value (| crore) EV/Tower EV/EBITDAEV of standalone business 44,564.2 1.13 14.5EV of Indus Towers 115,716.6 0.96 14.6Contribution of BIL (42%) 48,601.0Indus contribution post holding disount (20%) 38,880.8 0.77 11.7Total Enterprise valuation 83,445.0 0.93 13.0Less net debt -1,716.5Target market capitalisation 85,161.5Number of shares 189.1Per share value (|) 450Upside potential (%) 17%
Implied Value FY17E
Source:, ICICIdirect.com Research
Our SOTP based valuation implies an FY17E EV/tower of | 0.9 crore and FY17E EV/EBITDA of 13.0x, which is almost a 27% discount to listed US players and in line with its Indonesian peers. We are initiating coverage on Bharti Infratel with a BUY recommendation.
Page 21ICICI Securities Ltd | Retail Equity Research
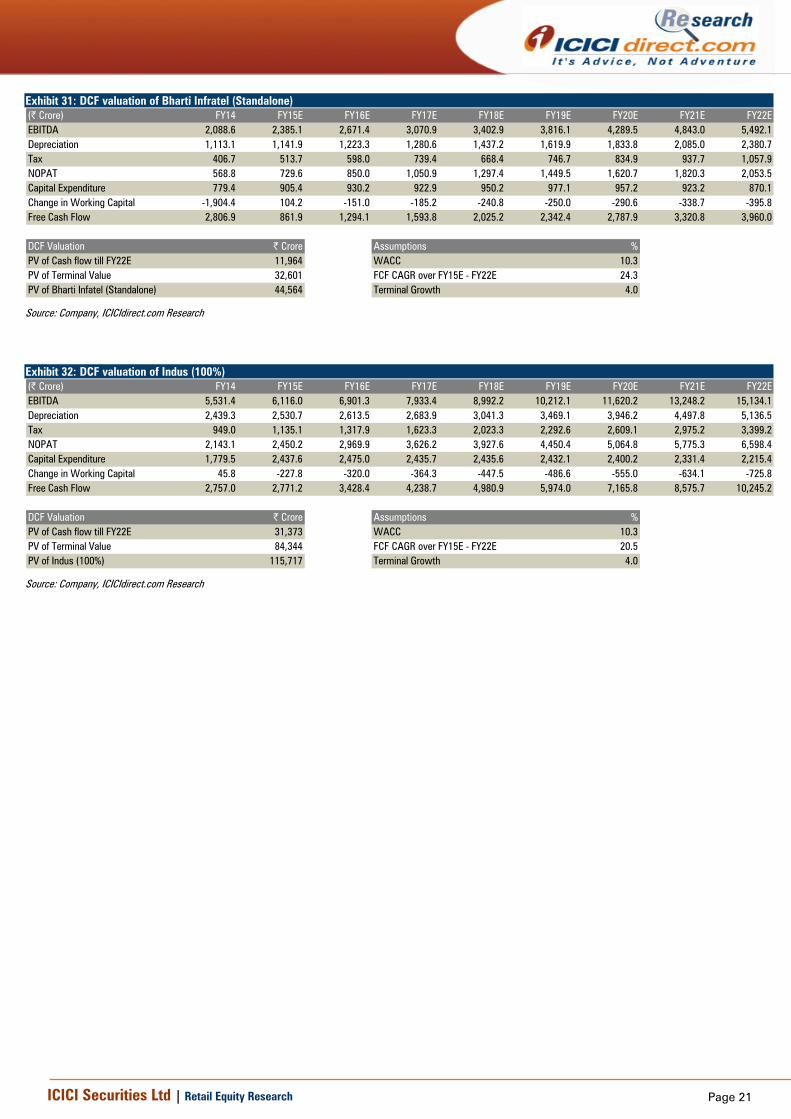
Exhibit 31: DCF valuation of Bharti Infratel (Standalone) (| Crore) FY14 FY15E FY16E FY17E FY18E FY19E FY20E FY21E FY22EEBITDA 2,088.6 2,385.1 2,671.4 3,070.9 3,402.9 3,816.1 4,289.5 4,843.0 5,492.1Depreciation 1,113.1 1,141.9 1,223.3 1,280.6 1,437.2 1,619.9 1,833.8 2,085.0 2,380.7Tax 406.7 513.7 598.0 739.4 668.4 746.7 834.9 937.7 1,057.9NOPAT 568.8 729.6 850.0 1,050.9 1,297.4 1,449.5 1,620.7 1,820.3 2,053.5Capital Expenditure 779.4 905.4 930.2 922.9 950.2 977.1 957.2 923.2 870.1Change in Working Capital -1,904.4 104.2 -151.0 -185.2 -240.8 -250.0 -290.6 -338.7 -395.8Free Cash Flow 2,806.9 861.9 1,294.1 1,593.8 2,025.2 2,342.4 2,787.9 3,320.8 3,960.0
DCF Valuation | Crore Assumptions %PV of Cash flow till FY22E 11,964 WACC 10.3PV of Terminal Value 32,601 FCF CAGR over FY15E - FY22E 24.3PV of Bharti Infatel (Standalone) 44,564 Terminal Growth 4.0
Source: Company, ICICIdirect.com Research
Exhibit 32: DCF valuation of Indus (100%) (| Crore) FY14 FY15E FY16E FY17E FY18E FY19E FY20E FY21E FY22EEBITDA 5,531.4 6,116.0 6,901.3 7,933.4 8,992.2 10,212.1 11,620.2 13,248.2 15,134.1Depreciation 2,439.3 2,530.7 2,613.5 2,683.9 3,041.3 3,469.1 3,946.2 4,497.8 5,136.5Tax 949.0 1,135.1 1,317.9 1,623.3 2,023.3 2,292.6 2,609.1 2,975.2 3,399.2NOPAT 2,143.1 2,450.2 2,969.9 3,626.2 3,927.6 4,450.4 5,064.8 5,775.3 6,598.4Capital Expenditure 1,779.5 2,437.6 2,475.0 2,435.7 2,435.6 2,432.1 2,400.2 2,331.4 2,215.4Change in Working Capital 45.8 -227.8 -320.0 -364.3 -447.5 -486.6 -555.0 -634.1 -725.8Free Cash Flow 2,757.0 2,771.2 3,428.4 4,238.7 4,980.9 5,974.0 7,165.8 8,575.7 10,245.2
DCF Valuation | Crore Assumptions %PV of Cash flow till FY22E 31,373 WACC 10.3PV of Terminal Value 84,344 FCF CAGR over FY15E - FY22E 20.5PV of Indus (100%) 115,717 Terminal Growth 4.0
Source: Company, ICICIdirect.com Research
Page 22ICICI Securities Ltd | Retail Equity Research
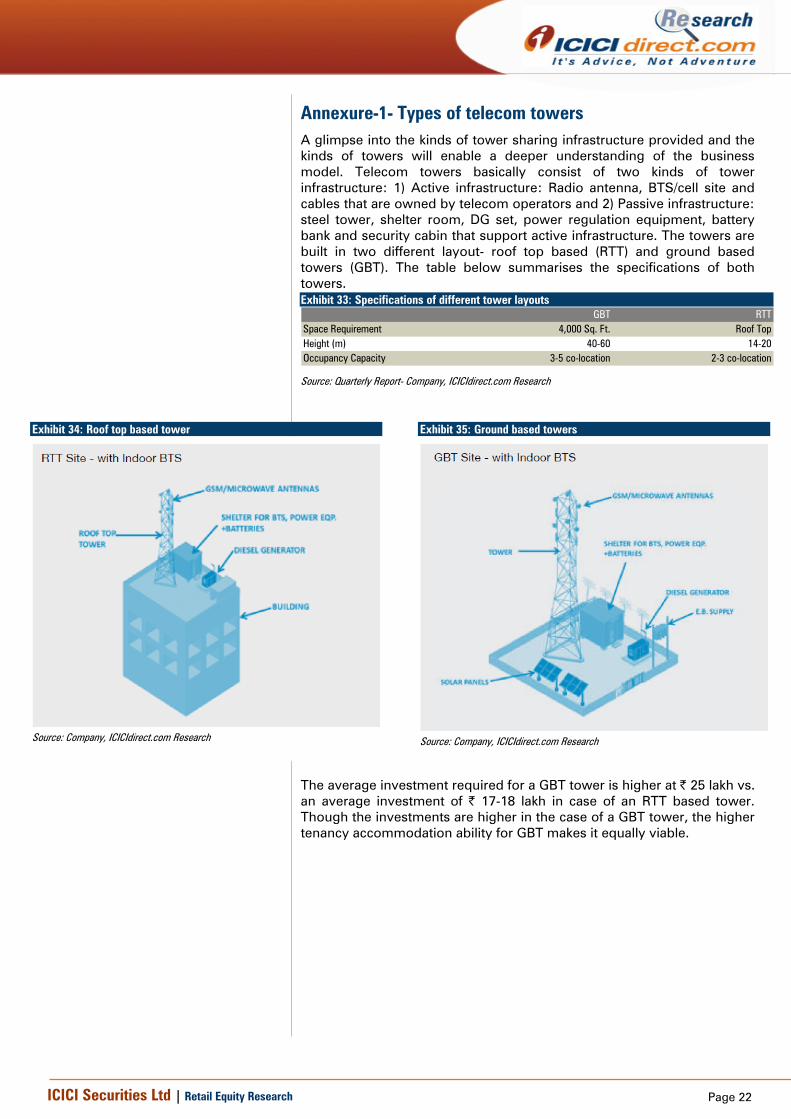
Annexure-1- Types of telecom towers A glimpse into the kinds of tower sharing infrastructure provided and the kinds of towers will enable a deeper understanding of the business model. Telecom towers basically consist of two kinds of tower infrastructure: 1) Active infrastructure: Radio antenna, BTS/cell site and cables that are owned by telecom operators and 2) Passive infrastructure: steel tower, shelter room, DG set, power regulation equipment, battery bank and security cabin that support active infrastructure. The towers are built in two different layout- roof top based (RTT) and ground based towers (GBT). The table below summarises the specifications of both towers. Exhibit 33: Specifications of different tower layouts
GBT RTTSpace Requirement 4,000 Sq. Ft. Roof TopHeight (m) 40-60 14-20Occupancy Capacity 3-5 co-location 2-3 co-location
Source: Quarterly Report- Company, ICICIdirect.com Research
Exhibit 34: Roof top based tower
Source: Company, ICICIdirect.com Research
Exhibit 35: Ground based towers
Source: Company, ICICIdirect.com Research
The average investment required for a GBT tower is higher at | 25 lakh vs. an average investment of | 17-18 lakh in case of an RTT based tower. Though the investments are higher in the case of a GBT tower, the higher tenancy accommodation ability for GBT makes it equally viable.
Page 23ICICI Securities Ltd | Retail Equity Research
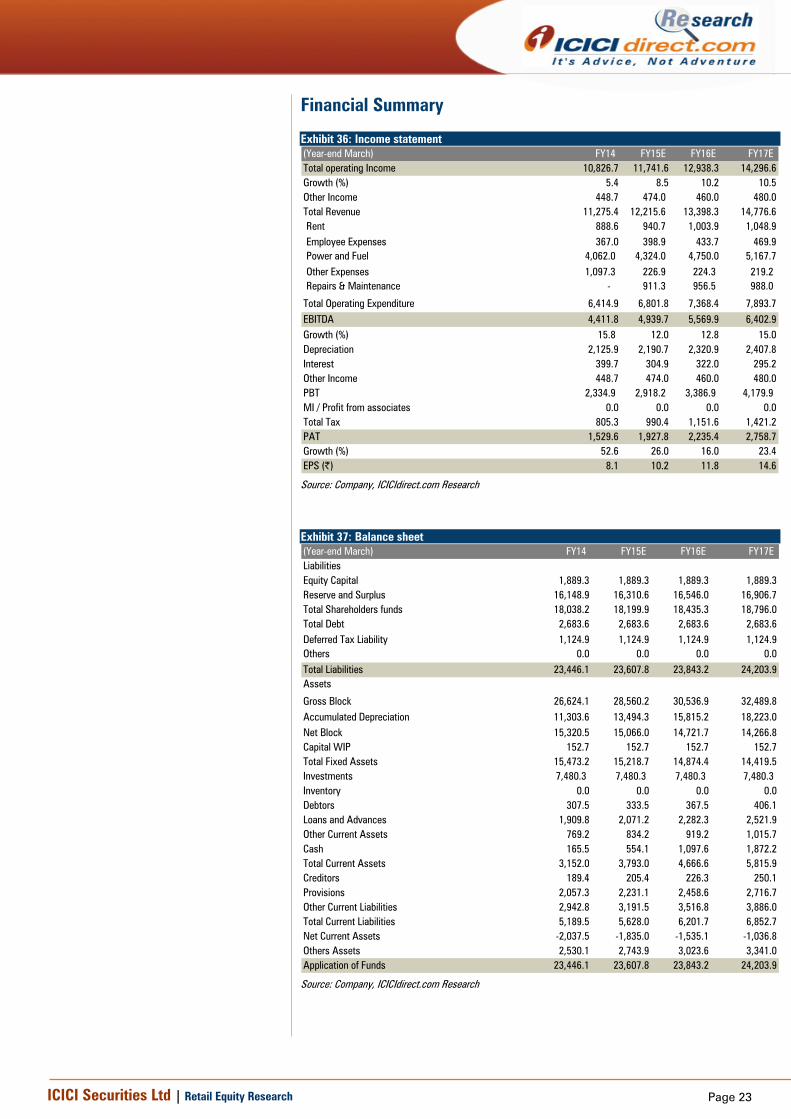
Financial Summary Exhibit 36: Income statement (Year-end March) FY14 FY15E FY16E FY17ETotal operating Income 10,826.7 11,741.6 12,938.3 14,296.6Growth (%) 5.4 8.5 10.2 10.5Other Income 448.7 474.0 460.0 480.0Total Revenue 11,275.4 12,215.6 13,398.3 14,776.6Rent 888.6 940.7 1,003.9 1,048.9Employee Expenses 367.0 398.9 433.7 469.9Power and Fuel 4,062.0 4,324.0 4,750.0 5,167.7Other Expenses 1,097.3 226.9 224.3 219.2 Repairs & Maintenance - 911.3 956.5 988.0
Total Operating Expenditure 6,414.9 6,801.8 7,368.4 7,893.7EBITDA 4,411.8 4,939.7 5,569.9 6,402.9Growth (%) 15.8 12.0 12.8 15.0Depreciation 2,125.9 2,190.7 2,320.9 2,407.8Interest 399.7 304.9 322.0 295.2Other Income 448.7 474.0 460.0 480.0PBT 2,334.9 2,918.2 3,386.9 4,179.9 MI / Profit from associates 0.0 0.0 0.0 0.0Total Tax 805.3 990.4 1,151.6 1,421.2PAT 1,529.6 1,927.8 2,235.4 2,758.7Growth (%) 52.6 26.0 16.0 23.4EPS (|) 8.1 10.2 11.8 14.6
Source: Company, ICICIdirect.com Research
Exhibit 37: Balance sheet (Year-end March) FY14 FY15E FY16E FY17ELiabilitiesEquity Capital 1,889.3 1,889.3 1,889.3 1,889.3Reserve and Surplus 16,148.9 16,310.6 16,546.0 16,906.7Total Shareholders funds 18,038.2 18,199.9 18,435.3 18,796.0Total Debt 2,683.6 2,683.6 2,683.6 2,683.6Deferred Tax Liability 1,124.9 1,124.9 1,124.9 1,124.9Others 0.0 0.0 0.0 0.0Total Liabilities 23,446.1 23,607.8 23,843.2 24,203.9Assets
Gross Block 26,624.1 28,560.2 30,536.9 32,489.8Accumulated Depreciation 11,303.6 13,494.3 15,815.2 18,223.0Net Block 15,320.5 15,066.0 14,721.7 14,266.8Capital WIP 152.7 152.7 152.7 152.7Total Fixed Assets 15,473.2 15,218.7 14,874.4 14,419.5Investments 7,480.3 7,480.3 7,480.3 7,480.3 Inventory 0.0 0.0 0.0 0.0Debtors 307.5 333.5 367.5 406.1Loans and Advances 1,909.8 2,071.2 2,282.3 2,521.9Other Current Assets 769.2 834.2 919.2 1,015.7Cash 165.5 554.1 1,097.6 1,872.2Total Current Assets 3,152.0 3,793.0 4,666.6 5,815.9Creditors 189.4 205.4 226.3 250.1Provisions 2,057.3 2,231.1 2,458.6 2,716.7Other Current Liabilities 2,942.8 3,191.5 3,516.8 3,886.0Total Current Liabilities 5,189.5 5,628.0 6,201.7 6,852.7Net Current Assets -2,037.5 -1,835.0 -1,535.1 -1,036.8Others Assets 2,530.1 2,743.9 3,023.6 3,341.0Application of Funds 23,446.1 23,607.8 23,843.2 24,203.9
Source: Company, ICICIdirect.com Research
Page 24ICICI Securities Ltd | Retail Equity Research
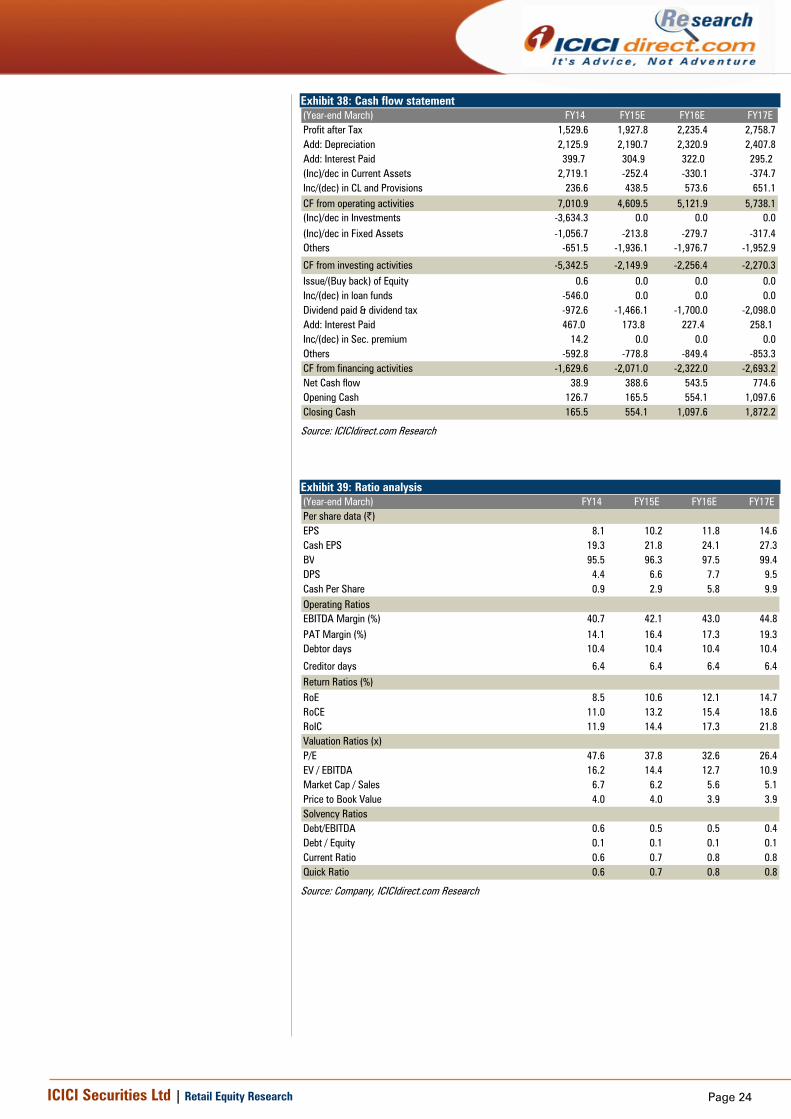
Exhibit 38: Cash flow statement (Year-end March) FY14 FY15E FY16E FY17EProfit after Tax 1,529.6 1,927.8 2,235.4 2,758.7Add: Depreciation 2,125.9 2,190.7 2,320.9 2,407.8Add: Interest Paid 399.7 304.9 322.0 295.2 (Inc)/dec in Current Assets 2,719.1 -252.4 -330.1 -374.7Inc/(dec) in CL and Provisions 236.6 438.5 573.6 651.1CF from operating activities 7,010.9 4,609.5 5,121.9 5,738.1(Inc)/dec in Investments -3,634.3 0.0 0.0 0.0(Inc)/dec in Fixed Assets -1,056.7 -213.8 -279.7 -317.4Others -651.5 -1,936.1 -1,976.7 -1,952.9
CF from investing activities -5,342.5 -2,149.9 -2,256.4 -2,270.3Issue/(Buy back) of Equity 0.6 0.0 0.0 0.0Inc/(dec) in loan funds -546.0 0.0 0.0 0.0Dividend paid & dividend tax -972.6 -1,466.1 -1,700.0 -2,098.0Add: Interest Paid 467.0 173.8 227.4 258.1 Inc/(dec) in Sec. premium 14.2 0.0 0.0 0.0Others -592.8 -778.8 -849.4 -853.3CF from financing activities -1,629.6 -2,071.0 -2,322.0 -2,693.2Net Cash flow 38.9 388.6 543.5 774.6Opening Cash 126.7 165.5 554.1 1,097.6Closing Cash 165.5 554.1 1,097.6 1,872.2
Source: ICICIdirect.com Research
Exhibit 39: Ratio analysis (Year-end March) FY14 FY15E FY16E FY17EPer share data (|)EPS 8.1 10.2 11.8 14.6Cash EPS 19.3 21.8 24.1 27.3BV 95.5 96.3 97.5 99.4DPS 4.4 6.6 7.7 9.5Cash Per Share 0.9 2.9 5.8 9.9Operating RatiosEBITDA Margin (%) 40.7 42.1 43.0 44.8PAT Margin (%) 14.1 16.4 17.3 19.3Debtor days 10.4 10.4 10.4 10.4
Creditor days 6.4 6.4 6.4 6.4Return Ratios (%)RoE 8.5 10.6 12.1 14.7RoCE 11.0 13.2 15.4 18.6RoIC 11.9 14.4 17.3 21.8Valuation Ratios (x)P/E 47.6 37.8 32.6 26.4EV / EBITDA 16.2 14.4 12.7 10.9Market Cap / Sales 6.7 6.2 5.6 5.1Price to Book Value 4.0 4.0 3.9 3.9Solvency RatiosDebt/EBITDA 0.6 0.5 0.5 0.4Debt / Equity 0.1 0.1 0.1 0.1Current Ratio 0.6 0.7 0.8 0.8Quick Ratio 0.6 0.7 0.8 0.8
Source: Company, ICICIdirect.com Research
Page 25ICICI Securities Ltd | Retail Equity Research
RATING RATIONALE ICICIdirect.com endeavours to provide objective opinions and recommendations. ICICIdirect.com assigns ratings to its stocks according to their notional target price vs. current market price and then categorises them as Strong Buy, Buy, Hold and Sell. The performance horizon is two years unless specified and the notional target price is defined as the analysts' valuation for a stock. Strong Buy: >15%/20% for large caps/midcaps, respectively, with high conviction; Buy: >10%/15% for large caps/midcaps, respectively; Hold: Up to +/-10%; Sell: -10% or more;
Pankaj Pandey Head – Research [email protected]
ICICIdirect.com Research Desk, ICICI Securities Limited, 1st Floor, Akruti Trade Centre, Road No 7, MIDC, Andheri (East) Mumbai – 400 093
Page 26ICICI Securities Ltd | Retail Equity Research
ANALYST CERTIFICATION We /I, Karan Mittal, MBA Sneha Agarwal, MBA Research Analysts, authors and the names subscribed to this report, hereby certify that all of the views expressed in this research report accurately reflect our views about the subject issuer(s) or securities. We also certify that no part of our compensation was, is, or will be directly or indirectly related to the specific recommendation(s) or view(s) in this report.
Terms & conditions and other disclosures: ICICI Securities Limited (ICICI Securities) is a full-service, integrated investment banking and is, inter alia, engaged in the business of stock brokering and distribution of financial products. ICICI Securities is a wholly-owned subsidiary of ICICI Bank which is India’s largest private sector bank and has its various subsidiaries engaged in businesses of housing finance, asset management, life insurance, general insurance, venture capital fund management, etc. (“associates”), the details in respect of which are available on www.icicibank.com. ICICI Securities is one of the leading merchant bankers/ underwriters of securities and participate in virtually all securities trading markets in India. We and our associates might have investment banking and other business relationship with a significant percentage of companies covered by our Investment Research Department. ICICI Securities generally prohibits its analysts, persons reporting to analysts and their relatives from maintaining a financial interest in the securities or derivatives of any companies that the analysts cover. The information and opinions in this report have been prepared by ICICI Securities and are subject to change without any notice. The report and information contained herein is strictly confidential and meant solely for the selected recipient and may not be altered in any way, transmitted to, copied or distributed, in part or in whole, to any other person or to the media or reproduced in any form, without prior written consent of ICICI Securities. While we would endeavour to update the information herein on a reasonable basis, ICICI Securitiesis is under no obligation to update or keep the information current. Also, there may be regulatory, compliance or other reasons that may prevent ICICI Securities from doing so. Non-rated securities indicate that rating on a particular security has been suspended temporarily and such suspension is in compliance with applicable regulations and/or ICICI Securities policies, in circumstances where ICICI Securities might be acting in an advisory capacity to this company, or in certain other circumstances. This report is based on information obtained from public sources and sources believed to be reliable, but no independent verification has been made nor is its accuracy or completeness guaranteed. This report and information herein is solely for informational purpose and shall not be used or considered as an offer document or solicitation of offer to buy or sell or subscribe for securities or other financial instruments. Though disseminated to all the customers simultaneously, not all customers may receive this report at the same time. ICICI Securities will not treat recipients as customers by virtue of their receiving this report. Nothing in this report constitutes investment, legal, accounting and tax advice or a representation that any investment or strategy is suitable or appropriate to your specific circumstances. The securities discussed and opinions expressed in this report may not be suitable for all investors, who must make their own investment decisions, based on their own investment objectives, financial positions and needs of specific recipient. This may not be taken in substitution for the exercise of independent judgment by any recipient. The recipient should independently evaluate the investment risks. The value and return on investment may vary because of changes in interest rates, foreign exchange rates or any other reason. ICICI Securities accepts no liabilities whatsoever for any loss or damage of any kind arising out of the use of this report. Past performance is not necessarily a guide to future performance. Investors are advised to see Risk Disclosure Document to understand the risks associated before investing in the securities markets. Actual results may differ materially from those set forth in projections. Forward-looking statements are not predictions and may be subject to change without notice. ICICI Securities or its associates might have managed or co-managed public offering of securities for the subject company or might have been mandated by the subject company for any other assignment in the past twelve months. ICICI Securities or its associates might have received any compensation from the companies mentioned in the report during the period preceding twelve months from the date of this report for services in respect of managing or co-managing public offerings, corporate finance, investment banking or merchant banking, brokerage services or other advisory service in a merger or specific transaction. ICICI Securities or its associates might have received any compensation for products or services other than investment banking or merchant banking or brokerage services from the companies mentioned in the report in the past twelve months. ICICI Securities encourages independence in research report preparation and strives to minimize conflict in preparation of research report. ICICI Securities or its analysts did not receive any compensation or other benefits from the companies mentioned in the report or third party in connection with preparation of the research report. Accordingly, neither ICICI Securities nor Research Analysts have any material conflict of interest at the time of publication of this report. It is confirmed that Karan Mittal, MBA Sneha Agarwal, MBA, Research Analysts of this report have not received any compensation from the companies mentioned in the report in the preceding twelve months. Compensation of our Research Analysts is not based on any specific merchant banking, investment banking or brokerage service transactions. ICICI Securities or its subsidiaries collectively or Research Analysts do not own 1% or more of the equity securities of the Company mentioned in the report as of the last day of the month preceding the publication of the research report. Since associates of ICICI Securities are engaged in various financial service businesses, they might have financial interests or beneficial ownership in various companies including the subject company/companies mentioned in this report. It is confirmed that Karan Mittal, MBA Sneha Agarwal, MBA, Research Analysts do not serve as an officer, director or employee of the companies mentioned in the report. ICICI Securities may have issued other reports that are inconsistent with and reach different conclusion from the information presented in this report. Neither the Research Analysts nor ICICI Securities have been engaged in market making activity for the companies mentioned in the report. We submit that no material disciplinary action has been taken on ICICI Securities by any Regulatory Authority impacting Equity Research Analysis activities. This report is not directed or intended for distribution to, or use by, any person or entity who is a citizen or resident of or located in any locality, state, country or other jurisdiction, where such distribution, publication, availability or use would be contrary to law, regulation or which would subject ICICI Securities and affiliates to any registration or licensing requirement within such jurisdiction. The securities described herein may or may not be eligible for sale in all jurisdictions or to certain category of investors. Persons in whose possession this document may come are required to inform themselves of and to observe such restriction.