RasGRP1 overexpression in T-ALL increases basal …rooselab.ucsf.edu/Lab_Papers_files/Olga Oncogene...
11
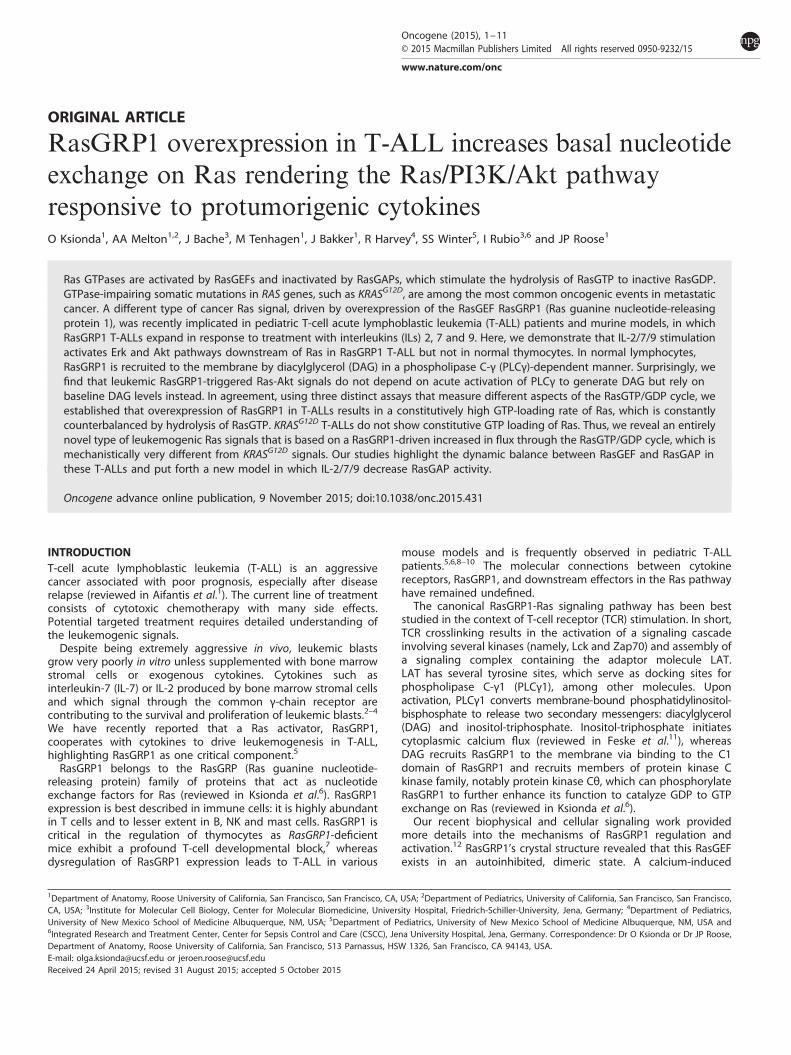
ORIGINAL ARTICLE RasGRP1 overexpression in T-ALL increases basal nucleotide exchange on Ras rendering the Ras/PI3K/Akt pathway responsive to protumorigenic cytokines O Ksionda 1 , AA Melton 1,2 , J Bache 3 , M Tenhagen 1 , J Bakker 1 , R Harvey 4 , SS Winter 5 , I Rubio 3,6 and JP Roose 1 Ras GTPases are activated by RasGEFs and inactivated by RasGAPs, which stimulate the hydrolysis of RasGTP to inactive RasGDP. GTPase-impairing somatic mutations in RAS genes, such as KRAS G12D , are among the most common oncogenic events in metastatic cancer. A different type of cancer Ras signal, driven by overexpression of the RasGEF RasGRP1 (Ras guanine nucleotide-releasing protein 1), was recently implicated in pediatric T-cell acute lymphoblastic leukemia (T-ALL) patients and murine models, in which RasGRP1 T-ALLs expand in response to treatment with interleukins (ILs) 2, 7 and 9. Here, we demonstrate that IL-2/7/9 stimulation activates Erk and Akt pathways downstream of Ras in RasGRP1 T-ALL but not in normal thymocytes. In normal lymphocytes, RasGRP1 is recruited to the membrane by diacylglycerol (DAG) in a phospholipase C-γ (PLCγ)-dependent manner. Surprisingly, we find that leukemic RasGRP1-triggered Ras-Akt signals do not depend on acute activation of PLCγ to generate DAG but rely on baseline DAG levels instead. In agreement, using three distinct assays that measure different aspects of the RasGTP/GDP cycle, we established that overexpression of RasGRP1 in T-ALLs results in a constitutively high GTP-loading rate of Ras, which is constantly counterbalanced by hydrolysis of RasGTP. KRAS G12D T-ALLs do not show constitutive GTP loading of Ras. Thus, we reveal an entirely novel type of leukemogenic Ras signals that is based on a RasGRP1-driven increased in flux through the RasGTP/GDP cycle, which is mechanistically very different from KRAS G12D signals. Our studies highlight the dynamic balance between RasGEF and RasGAP in these T-ALLs and put forth a new model in which IL-2/7/9 decrease RasGAP activity. Oncogene advance online publication, 9 November 2015; doi:10.1038/onc.2015.431 INTRODUCTION T-cell acute lymphoblastic leukemia (T-ALL) is an aggressive cancer associated with poor prognosis, especially after disease relapse (reviewed in Aifantis et al. 1 ). The current line of treatment consists of cytotoxic chemotherapy with many side effects. Potential targeted treatment requires detailed understanding of the leukemogenic signals. Despite being extremely aggressive in vivo, leukemic blasts grow very poorly in vitro unless supplemented with bone marrow stromal cells or exogenous cytokines. Cytokines such as interleukin-7 (IL-7) or IL-2 produced by bone marrow stromal cells and which signal through the common γ-chain receptor are contributing to the survival and proliferation of leukemic blasts. 2–4 We have recently reported that a Ras activator, RasGRP1, cooperates with cytokines to drive leukemogenesis in T-ALL, highlighting RasGRP1 as one critical component. 5 RasGRP1 belongs to the RasGRP (Ras guanine nucleotide- releasing protein) family of proteins that act as nucleotide exchange factors for Ras (reviewed in Ksionda et al. 6 ). RasGRP1 expression is best described in immune cells: it is highly abundant in T cells and to lesser extent in B, NK and mast cells. RasGRP1 is critical in the regulation of thymocytes as RasGRP1-deficient mice exhibit a profound T-cell developmental block, 7 whereas dysregulation of RasGRP1 expression leads to T-ALL in various mouse models and is frequently observed in pediatric T-ALL patients. 5,6,8–10 The molecular connections between cytokine receptors, RasGRP1, and downstream effectors in the Ras pathway have remained undefined. The canonical RasGRP1-Ras signaling pathway has been best studied in the context of T-cell receptor (TCR) stimulation. In short, TCR crosslinking results in the activation of a signaling cascade involving several kinases (namely, Lck and Zap70) and assembly of a signaling complex containing the adaptor molecule LAT. LAT has several tyrosine sites, which serve as docking sites for phospholipase C-γ1 (PLCγ1), among other molecules. Upon activation, PLCγ1 converts membrane-bound phosphatidylinositol- bisphosphate to release two secondary messengers: diacylglycerol (DAG) and inositol-triphosphate. Inositol-triphosphate initiates cytoplasmic calcium flux (reviewed in Feske et al. 11 ), whereas DAG recruits RasGRP1 to the membrane via binding to the C1 domain of RasGRP1 and recruits members of protein kinase C kinase family, notably protein kinase Cθ, which can phosphorylate RasGRP1 to further enhance its function to catalyze GDP to GTP exchange on Ras (reviewed in Ksionda et al. 6 ). Our recent biophysical and cellular signaling work provided more details into the mechanisms of RasGRP1 regulation and activation. 12 RasGRP1’s crystal structure revealed that this RasGEF exists in an autoinhibited, dimeric state. A calcium-induced 1 Department of Anatomy, Roose University of California, San Francisco, San Francisco, CA, USA; 2 Department of Pediatrics, University of California, San Francisco, San Francisco, CA, USA; 3 Institute for Molecular Cell Biology, Center for Molecular Biomedicine, University Hospital, Friedrich-Schiller-University, Jena, Germany; 4 Department of Pediatrics, University of New Mexico School of Medicine Albuquerque, NM, USA; 5 Department of Pediatrics, University of New Mexico School of Medicine Albuquerque, NM, USA and 6 Integrated Research and Treatment Center, Center for Sepsis Control and Care (CSCC), Jena University Hospital, Jena, Germany. Correspondence: Dr O Ksionda or Dr JP Roose, Department of Anatomy, Roose University of California, San Francisco, 513 Parnassus, HSW 1326, San Francisco, CA 94143, USA. E-mail: [email protected] or [email protected] Received 24 April 2015; revised 31 August 2015; accepted 5 October 2015 Oncogene (2015), 1 – 11 © 2015 Macmillan Publishers Limited All rights reserved 0950-9232/15 www.nature.com/onc
Transcript of RasGRP1 overexpression in T-ALL increases basal …rooselab.ucsf.edu/Lab_Papers_files/Olga Oncogene...
ORIGINAL ARTICLE
RasGRP1 overexpression in T-ALL increases basal nucleotideexchange on Ras rendering the Ras/PI3K/Akt pathwayresponsive to protumorigenic cytokinesO Ksionda1, AA Melton1,2, J Bache3, M Tenhagen1, J Bakker1, R Harvey4, SS Winter5, I Rubio3,6 and JP Roose1
Ras GTPases are activated by RasGEFs and inactivated by RasGAPs, which stimulate the hydrolysis of RasGTP to inactive RasGDP.GTPase-impairing somatic mutations in RAS genes, such as KRASG12D, are among the most common oncogenic events in metastaticcancer. A different type of cancer Ras signal, driven by overexpression of the RasGEF RasGRP1 (Ras guanine nucleotide-releasingprotein 1), was recently implicated in pediatric T-cell acute lymphoblastic leukemia (T-ALL) patients and murine models, in whichRasGRP1 T-ALLs expand in response to treatment with interleukins (ILs) 2, 7 and 9. Here, we demonstrate that IL-2/7/9 stimulationactivates Erk and Akt pathways downstream of Ras in RasGRP1 T-ALL but not in normal thymocytes. In normal lymphocytes,RasGRP1 is recruited to the membrane by diacylglycerol (DAG) in a phospholipase C-γ (PLCγ)-dependent manner. Surprisingly, wefind that leukemic RasGRP1-triggered Ras-Akt signals do not depend on acute activation of PLCγ to generate DAG but rely onbaseline DAG levels instead. In agreement, using three distinct assays that measure different aspects of the RasGTP/GDP cycle, weestablished that overexpression of RasGRP1 in T-ALLs results in a constitutively high GTP-loading rate of Ras, which is constantlycounterbalanced by hydrolysis of RasGTP. KRASG12D T-ALLs do not show constitutive GTP loading of Ras. Thus, we reveal an entirelynovel type of leukemogenic Ras signals that is based on a RasGRP1-driven increased in flux through the RasGTP/GDP cycle, which ismechanistically very different from KRASG12D signals. Our studies highlight the dynamic balance between RasGEF and RasGAP inthese T-ALLs and put forth a new model in which IL-2/7/9 decrease RasGAP activity.
Oncogene advance online publication, 9 November 2015; doi:10.1038/onc.2015.431
INTRODUCTIONT-cell acute lymphoblastic leukemia (T-ALL) is an aggressivecancer associated with poor prognosis, especially after diseaserelapse (reviewed in Aifantis et al.1). The current line of treatmentconsists of cytotoxic chemotherapy with many side effects.Potential targeted treatment requires detailed understanding ofthe leukemogenic signals.Despite being extremely aggressive in vivo, leukemic blasts
grow very poorly in vitro unless supplemented with bone marrowstromal cells or exogenous cytokines. Cytokines such asinterleukin-7 (IL-7) or IL-2 produced by bone marrow stromal cellsand which signal through the common γ-chain receptor arecontributing to the survival and proliferation of leukemic blasts.2–4
We have recently reported that a Ras activator, RasGRP1,cooperates with cytokines to drive leukemogenesis in T-ALL,highlighting RasGRP1 as one critical component.5
RasGRP1 belongs to the RasGRP (Ras guanine nucleotide-releasing protein) family of proteins that act as nucleotideexchange factors for Ras (reviewed in Ksionda et al.6). RasGRP1expression is best described in immune cells: it is highly abundantin T cells and to lesser extent in B, NK and mast cells. RasGRP1 iscritical in the regulation of thymocytes as RasGRP1-deficientmice exhibit a profound T-cell developmental block,7 whereasdysregulation of RasGRP1 expression leads to T-ALL in various
mouse models and is frequently observed in pediatric T-ALLpatients.5,6,8–10 The molecular connections between cytokinereceptors, RasGRP1, and downstream effectors in the Ras pathwayhave remained undefined.The canonical RasGRP1-Ras signaling pathway has been best
studied in the context of T-cell receptor (TCR) stimulation. In short,TCR crosslinking results in the activation of a signaling cascadeinvolving several kinases (namely, Lck and Zap70) and assembly ofa signaling complex containing the adaptor molecule LAT.LAT has several tyrosine sites, which serve as docking sites forphospholipase C-γ1 (PLCγ1), among other molecules. Uponactivation, PLCγ1 converts membrane-bound phosphatidylinositol-bisphosphate to release two secondary messengers: diacylglycerol(DAG) and inositol-triphosphate. Inositol-triphosphate initiatescytoplasmic calcium flux (reviewed in Feske et al.11), whereasDAG recruits RasGRP1 to the membrane via binding to the C1domain of RasGRP1 and recruits members of protein kinase Ckinase family, notably protein kinase Cθ, which can phosphorylateRasGRP1 to further enhance its function to catalyze GDP to GTPexchange on Ras (reviewed in Ksionda et al.6).Our recent biophysical and cellular signaling work provided
more details into the mechanisms of RasGRP1 regulation andactivation.12 RasGRP1’s crystal structure revealed that this RasGEFexists in an autoinhibited, dimeric state. A calcium-induced
1Department of Anatomy, Roose University of California, San Francisco, San Francisco, CA, USA; 2Department of Pediatrics, University of California, San Francisco, San Francisco,CA, USA; 3Institute for Molecular Cell Biology, Center for Molecular Biomedicine, University Hospital, Friedrich-Schiller-University, Jena, Germany; 4Department of Pediatrics,University of New Mexico School of Medicine Albuquerque, NM, USA; 5Department of Pediatrics, University of New Mexico School of Medicine Albuquerque, NM, USA and6Integrated Research and Treatment Center, Center for Sepsis Control and Care (CSCC), Jena University Hospital, Jena, Germany. Correspondence: Dr O Ksionda or Dr JP Roose,Department of Anatomy, Roose University of California, San Francisco, 513 Parnassus, HSW 1326, San Francisco, CA 94143, USA.E-mail: [email protected] or [email protected] 24 April 2015; revised 31 August 2015; accepted 5 October 2015
Oncogene (2015), 1–11© 2015 Macmillan Publishers Limited All rights reserved 0950-9232/15
www.nature.com/onc

conformational change releases RasGRP1 from its autoinhibitionand allows for binding of the C1 domain to DAG and forbinding of Ras to RasGRP1’s catalytic pocket. Our insightsfrom the RasGRP1 structure, RasGRP1’s overexpression inT-ALL and the novel RasGRP1-dependent cytokine-inducedRas activation recently identified in T-ALL5 inspired us toinvestigate the mechanism of RasGRP1-Ras signals in cytokine-responsive T-ALL.
RESULTSCytokine-induced Ras activation is unique to T-ALLT-ALL cell lines with high RasGRP1 expression robustly activate Raswhen stimulated with cytokines in a RasGRP1-dependentmanner,5 pointing to a potential cytokine receptor-RasGRP1-Raspathway. To compare directly the effects of TCR versus cytokinestimulation on Ras activation, we stimulated two T-ALL lines(1156S-O and T-ALL C6 cell lines) that express high levels ofRasGRP15 by either crosslinking CD3 and CD4 (TCR stimulation) orby exposure to a cocktail of IL-2, -7 and -9 (cytokine stimulation;ILs) and subjected cells to RasGTP pulldown assays. Both types of
stimuli demonstrated roughly similar increases in RasGTP levelswhen analyzed side by side (Figures 1a and b). As comparison, wesubjected a different T-ALL cell line (98) to the same assay. T-ALLline 98 does not overexpress RasGRP1 nor has it any leukemiavirus insertions in genes that are known to influence the Raspathway.5 As shown in Figure 1c, T-ALL 98 cells do accumulatesome RasGTP upon IL stimulation, albeit to much lesser extent aslines that overexpress RasGRP1.Based on cell surface marker expression, T-ALL blasts resemble
developing thymocytes.1,5 Therefore, we next investigated ifnormal thymocytes also use the IL-RasGRP1-Ras pathway. Incontrast to our T-ALL cell lines, ex vivo thymocytes activated Rasafter TCR stimulation but not following exposure to cytokines(Figure 1d). Signal transducer and activator of transcription 5phosphorylation (pSTAT5), a well-characterized signal induced bycytokine receptors containing the common γ-chain, is shown hereas a positive control to demonstrate proper IL-2/7/9 stimulation ofthymocytes (Figure 1d). Therefore, T-ALL cells with RasGRP1overexpression—and cell surface marker combinations reminis-cent of developing thymocytes—have the unique ability toactivate Ras in response to cytokine receptor stimulation(Figure 1e).
Ras
TCR
RasGRP1
Ras
ILsR
RasGRP1
Ras
ThymocytesT-ALLs
T-ALLs
0
IL-2/7/9
(min)02 2 55
CD3/4+Xlink
T-ALL C61156S-O
IL-2/7/9CD3/4+Xlink
RasGTP
(min)0 2 5 0 2 5
RasGTP
1.0 1.0 RasGTP/total Ras
Ras
RasGTP
pSTAT5
αTubulin
0
IL-2/7/9
(min)02 2 55
CD3/4+Xlink
1.0 1.0 RasGTP/total Ras
1.0 1.0 RasGTP/total Ras
Ras
Ras
0
IL-2/7/9
(min)02 2 55
CD3/4+Xlink
T-ALL 98
RasGTP
1.0 1.0
1.5 1.1 1.8 1.7
2.2 1.1 0.3 0.3
3.3 1.9 2.2 1.8
1.3 1.6 1.2 1.0 RasGTP/total Ras
Figure 1. Cytokine-induced Ras activation is unique to T-ALL. (a–d) Western blot analysis of Ras pulldown assays performed either in Rasgrp1T-ALL cell lines (a and b), non-RasGRP1-overexpressing T-ALL cell line 98 (c) or primary thymocytes (d). Cells were serum starved and treatedwith anti-CD3 and anti-CD4 followed by crosslinking antibodies or stimulated with IL-2/7/9 for the indicated amount of time. The abundanceof RasGTP was arbitrarily set at 1.0 for 0min time point by normalizing RasGTP to the abundance of total Ras. Phospho-STAT5 is shown in(d) as a control for cytokine stimulation efficiency. All panels in this figure are representative examples of three independent experiments.(e) Scheme depicting activation of TCR-RasGRP1-Ras pathway in thymocytes and T-ALL cells as well as IL-RasGRP1-Ras, which in contrast tothe first pathway seems to be unique to T-ALLs.
RasGRP1 overexpression in T-ALLO Ksionda et al
2
Oncogene (2015) 1 – 11 © 2015 Macmillan Publishers Limited

Distinct, RasGRP-1-dependent signals through the Akt pathway incytokine-stimulated T-ALLRasGTP signals to various effector kinase pathways to exert itscell biological effect on survival and proliferation.13 To compareeffector activation following ILR-RasGRP1 versus ‘canonical’TCR-RasGRP1 signals, we exposed T-ALLs with high RasGRP1 toeach of the stimuli and examined the activation status of twowell-characterized Ras effectors, Erk1/2 and PI3K. TCR stimulationresulted in transient Erk1/2 and sustained Akt phosphorylation(phospho-Akt serving as a surrogate for PI3K activation) inT-ALLs (Figure 2a). Cytokines (IL-2, -7 and -9) activated thePI3K/Akt pathway in T-ALL cells to a similar degree as TCRstimulation, whereas activity through the RasGTP-Raf-MEK-Erkpathway was modest (Figure 2b). As before, phosphorylation ofSTAT5 was measured as a positive control for IL stimulation(Figure 2b).Given that cytokines appear to preferentially trigger Ras-PI3K/
Akt over Ras-Raf-MEK-Erk pathway in T-ALL, we sought to exploreif TCR and IL-induced Akt activation depends on RasGRP1. Wetook advantage of previously generated cell lines with reducedRasGRP1 levels via stable expression of RasGRP1 short hairpin RNA(shRNA).5 Knockdown of RasGRP1 severely impairs both TCR- andIL-induced Akt phosphorylation without affecting cytokine-depending pSTAT5 levels (Figures 2c and d, respectively),revealing that activation of PI3K/Akt downstream of both receptorsystems depends on RasGRP1.Our RasGTP pulldown assay (Figure 1d) indicated that the
IL-RasGRP1-Ras pathway is not functional in normal thymocytes.Thymocytes consist of four major subsets that reflect uniquedevelopmental stages and which differ in the expression levelsof cytokine receptors (immgen.org). It is possible that only aminor population of cells activates Ras and Ras effectorpathways downstream of cytokine receptors and that thissignal is missed because of the detection limitations of theexperimental method that assays population averages. Toovercome these limitations and to confirm that normalthymocytes do not activate Ras and its effectors downstreamof cytokine receptors, we took advantage of flow cytometry.Flow cytometric analysis of signaling events induced by TCRstimulation, similar to ERK phosphorylation, has been used bymany groups including our own.14 We first separated thymo-cytes into double-negative CD4−CD8−, double-positive CD4+
CD8+ and single-positive CD4+ or CD8+ cell populations(Figure 2e) where single-positive CD8+s were gated on TCRβhigh
to exclude intermediate single-positive cells. Stimulation withIL-2/7/9 resulted in phosphorylation of STAT5 in all thymicsubsets except double-positive cells, consistent with reportedreceptor expression levels (immgen.org) (Figure 2e, bottompanel). We then looked at the activation of pErk1/2 and pAkt asa surrogate measure of Ras activity. We did not observeincreases in pErk or pAkt upon cytokine stimulation in any ofthe subsets, suggesting that Ras is not activated after cytokinereceptor activation by IL-2/7/9 in normal thymocytes (Figure 2e,top and middle panel). All thymic populations increased pErk1/2in response to phorbol myristate acetate stimulation (Figure 2e,top panel, blue histogram), which demonstrated that the lack ofpErk induction after cytokine exposure was not due to technicalinability to detect pErk.Thus, both TCR- and ILR-triggered Ras effector pathways are
operational in T-ALL cells, but cytokine stimulation triggers Aktactivation more robustly than Erk activation and does so in aRasGRP1-dependent manner (Figure 2f). Based on these results,we hypothesized that mechanisms of RasGRP1-driven Rasactivation may differ between TCR- and cytokine-stimulatedT-ALL cells.
Cytokine receptor-RasGRP1-Ras signaling does not require acutePLCγ1 activationWe next sought to explore if RasGRP1 couples to cytokinereceptors in leukemic T-ALL via PLCγ1 as it does in canonicalRasGRP1-Ras signaling induced by TCR stimulation. Pharmacologicalinhibition of PLCγ with a small-molecule inhibitor U73122 resultedin a profound decrease in RasGTP, confirming that TCR-inducedRasGTP in T-ALL cells indeed depends on PLCγ1 activity(Figure 3a). In agreement with canonical RasGRP1 signaling, TCRstimulation resulted in induction of both PLCγ1 and RasGRP1phosphorylation in T-ALL cells (Figure 3b) and TCR-inducedRasGRP1 phosphorylation was decreased following PLCγ inhibitortreatment (Figure 3c).We next asked if similar second messengers connect RasGRP1
and cytokine receptors. In contrast to TCR stimulation wherePLCγ inhibitor treatment almost completely abrogated RasGTPinduction, we observed only a modest effect of the PLCγ inhibitoron cytokine-induced RasGTP (Figure 3d and SupplementaryFigure 2). Consistent with the reduced requirement for acutePLCγ1 activation, cytokine treatment did not increase PLCγ1 orRasGRP1 phosphorylation above baseline levels in either of twoT-ALL cell lines tested (Figure 3e). Also, pharmacological inhibitionof PLCγ1 showed no effect on RasGRP1 phosphorylation followingcytokine stimulation (Figure 3f). Of note, we avoided furtherincreasing the concentration of the PLCγ inhibitor or extendingthe incubation time before stimulation, as these inducednonspecific cell toxicity.The above data suggest that cytokines do not couple to PLCγ1;
however, phosphorylation of PLCγ1 is only a surrogate foractivation rather than a direct measurement of activity. To testmore definitively that cytokine receptors do not induce PLCγ1enzymatic activity in T-ALL cells, we evaluated rises in intracellularcalcium as a direct effect of inositol-triphosphate production,which is a routine assay used by many to determine TCR-triggeredcalcium fluxes. Consistent with the data in Figures 3d and f, we didnot observe any detectable increase in calcium levels uponcytokine stimulation, even within 10 min of recording (Figure 3g,red tracing), whereas TCR stimulation resulted in a rapid rise inintracellular calcium (Figure 3g; blue tracing). Taken together,these data demonstrate that while RasGRP1-overexpressing T-ALLcells maintain the ability to respond to TCR stimulation thatrequires PLCγ1 activation, the IL-RasGRP1-Ras pathway does notrequire receptor-induced PLCγ1 activity.
RasGRP1 couples to the cytokine receptor via basal DAGBinding of calcium to the EF hands of the RasGRP1 proteinreleases autoinhibition through allosteric changes.12 NMR scatter-ing data indicates that autoinhibition of this RasGEF is notabsolute and that there is some level of flexibility in the basal statewithout calcium signals12 (Figure 4a, left panel).These structural aspects together with our observations that
basal, low-level PLCγ1 and RasGRP1 phosphorylation can bedetected in T-ALL cells (Figure 3e) prompted us to hypothesizethat basal levels of DAG are sufficient for RasGRP1-dependent Rasactivation in cytokine-stimulated T-ALL cells. To test this hypoth-esis, we used the DAG kinase (DGK) inhibitor R59945 tomanipulate DAG levels without changing Ca2+ levels (Figure 4a,right panel). DGKs convert DAG to phosphatidic acid andpharmacological inhibition of DGK results in increased DAGlevels15 and increased RasGTP in response to TCR stimulation.16
Treatment of T-ALL cells with DGK inhibitor (R59945) resulted ina dose-dependent induction of pAkt and pErk signals, in completeabsence of cytokine receptor or other stimulatory input(Figures 4b and c). These findings are consistent with our previousmathematical modeling, which predicted that in the presence ofhigh RasGRP1 concentration increasing DAG levels result inspontaneous Ras pathway activation.5 These results also reveal
RasGRP1 overexpression in T-ALLO Ksionda et al
3
© 2015 Macmillan Publishers Limited Oncogene (2015) 1 – 11

pErk1/2
pSTAT5
1156S-O-shRNA RasGRP1 1156S-O
0 2 5 10 0 2 5 10 IL-2/7/9 (min)
RasGRP1
0.2 2.8 8.9 10.5 1 2.6 14.6 14.3
0.1 0.1 0.1 0.2 1 0.8 1 0.9
0 2 5 10 CD3/4+Xlink(min)0 2 5 10
αTubulin
pErk1/2
αTubulin
pAkt (S473)
1156S-Oa
c
e f
d
b1713S-N
0 2 5 10 0 2 5 10
1156S-O 1713S-N
IL-2/7/9 (min)
0.3 0.6 0.3 0.2 1 3 0.5 0.6
pAkt (S473)
1156S-O-shRNA RasGRP1 1156S-O-GFP
0 2 5 101 CD3/4+Xlink(min)0 2 5 101
RasGRP1
αTubulin
pAkt (S473)
αTubulin
1.0 3.7 5.0 4.7 1.0 6.1 5.7 5.8
0.1 0.2 0.1 0.6 1.0 0.9 0.8
pAkt (S473)
pSTAT5
1.0 2.3 3.0 4.4 1.0 7.5 5.0 6.0
1.0 2.0 0.9 1.0 1.0 3.2 1.4 1.0
0.90.1 0.1
0.8 0.8 0.4 1.0 1.2 1.5 4.9 6.90.5 0.3
αTubulin
1.0 2.9 1.0 0.5 1.0 2.4 1.2 0.5
TCR
RasGRP1
Ras
ERK
RAF MEK
AKT
PI3K
others
ILsR
RasGRP1
Ras
ERK
RAF MEK
AKT
PI3K
others
αTubulin
αTubulin
αTubulin
Ce
lls (
%)
pErk1/2
CD
8
CD4
Ce
lls (
%)
pAkt
Ce
lls (
%)
pSTAT5
DN DP CD4SP CD8SP
0 min 2 min ILs5 min ILs10 min ILs2 min PMA
6
76
6236
4
55
4105
7
87
7341
7
87
6424
6
76
77
4
44
44
6
66
76
7
76
77
64
2134
7921
12
1111
1312
184
2286
19322
158
2998
16528
DP
DN
CD4SP
CD8SP
Figure 2. TCR and cytokines trigger RasGRP1-Ras effector pathways in T-ALL. (a and b) Western blot analysis of phospho-Akt (S473) andphospho-Erk1/2 (Thr202/Tyr204) in Rasgrp1 T-ALL cell lines stimulated with anti-CD3 and anti-CD4 antibodies followed by crosslinking (a) orcytokines (b) for indicated amount of time. The abundance of phosphoprotein was arbitrarily set at 1.0 for 0min time point by normalizing tothe abundance of α-tubulin. Phospho-STAT5 (Tyr 694) was used as a control for stimulation efficiency in cytokine-treated samples. (c and d)Western blot analysis of phospho-Akt (S473) and RasGRP1 abundance in 1156S-O-GFP (control) and 1156-S-O cell lines where RasGRP1knockdown was achieved via stable expression of RasGRP1 shRNA. Cells were either treated with anti-CD3 and anti-CD4 followed bycrosslinking antibodies (c) or stimulated with cytokines (d) for the indicated amount of time. Phospho-STAT5 (Tyr 694) was used as a controlfor stimulation efficiency in cytokine-treated samples. Quantification was carried out as in (a) normalizing to the amount of α-tubulin. (e). Flowcytometry analysis of phospho-Erk1/2 (Thr202/Tyr204), phospho-Akt (S473) and phospho-STAT5 (Tyr 694) in wild-type thymocytes (from 8- to10-week-old C57BL/6J females) stimulated with IL-2/7/9 or phorbol myristate acetate (PMA). Scatter plot on the left shows gating of double-negative (DN; CD4−CD8−), double-positive (DP; CD4+CD8+), CD8 and CD4 single-positive cells. Histograms on the right show levels ofphosphoproteins in gated populations. Numbers represent values of geometric mean for the indicated time point. Figure shows one out oftwo experiments. Each experiment was performed with three mice. All panels in this figure are representative examples of two or threeindependent experiments. (f) Model of downstream Ras pathway activation through RasGRP1 after either TCR or cytokine stimulation.
RasGRP1 overexpression in T-ALLO Ksionda et al
4
Oncogene (2015) 1 – 11 © 2015 Macmillan Publishers Limited

that overexpressed RasGRP1 couples to Ras in the basal state,without the requirement for receptor signals.We subsequently asked if increased levels of baseline DAG
could enhance cytokine-induced Ras effector activation. Indeed,we observed that cytokine-induced pAkt was increased afteraugmenting concentrations of DAG by treatment with DGK
inhibitor (Figure 4d). Last, we investigated if low levels of cytokineinput cooperates with increased baseline DAG levels anddetermined that R59945 concentrations as low as 100 nMpotentiated cytokine-induced pAkt (Figure 4e). Taken together,these results indicate that when expressed at high levels, similar toa subset of T-ALL leukemias,5 RasGRP1 responds to baseline
1156 1713
pPLCγ1
pRasGRP1
αTubulin
0 2 5 CD3/4+Xlink(min)
1156S-O
pPLCγ1
pRasGRP1
αTubulin
IL-2/7/9 (min)0 2 5 10 0 2 5 10
1156S-O 1713S-N
0 2 5 0 2 5
1.0 1.4 0.8 1.4 1.2 1.7
1.0 0.9 1.1 0.7 0.6 0.8
pPLCγ1
pRasGRP1
αTubulin
IL-2/7/9 (min)
0 2 5 CD3/4+Xlink(min)
DMSO U73122
0 2 5
1.0
1.0
3.1 7.0 1.1 3.4 3.9
2.4 1.4 1.0 1.5 1.2
pPLCγ1
pRasGRP1
αTubulin
DMSO U73122
TCR
ILs
200 400 600 200 400 600
1.0 16 16
1.0 3.5 3.0
1.0 1.0 1.0 0.8
1.0 0.7 0.8 1.0 1.0
0 02 2 55
RasGTP
αTubulin
DMSO U73122
CD3/4+Xlink(min)
1.0 4.5 0.7 1.0 1.2 0.4
0 02 2 55
RasGTP
αTubulin
DMSO U73122
IL-2/7/9 (min)
1.0 9.0 4.8 2.6 5.8 1.5
PLCγ1
1.0
RasGRP1 RasGRP1
0.7 0.5 0.4
0.6 0.5 0.6
PLCγ1
Indo
1 ra
tio
Time (sec)
Indo
1 ra
tio
Time (sec)
Figure 3. Cytokine receptor-RasGRP1-Ras signaling does not require acute PLCγ1 activation. (a and d) Western blot analysis of RasGTPpulldown performed in RasGRP1 T-ALL cell line (1156S-O) treated with DMSO (vehicle control) or PLCγ inhibitor (U73122, 20 μM), 30 min beforestimulation with CD3/CD4 and crosslinking antibodies (a) or IL-2/7/9 (d). Note that the increase in RasGTP after U73122 treatment in theunstimulated, baseline condition in (d) was not a consistent finding. (b and c) Western blot analysis of phospho-PLCγ1 (Y783) and phospho-RasGRP1 (T184) in 1156S-O cell line. Cells were stimulated with CD3/CD4 and crosslinking antibodies. Samples were untreated (b) or treatedwith DMSO (vehicle control) or PLCγ inhibitor (U73122, 20 μM) 30min before stimulation (c). (e and f) Western blot analysis of phospho-PLCγ1(Y783) and phospho-RAsGRP1 (T184) in 1156S-O or 1713S-N T-ALL cell lines after stimulation with IL-2/7/9 for the indicated times (e). 1156S-Ocells were treated with either DMSO (vehicle control) or PLCγ inhibitor (U73122, 20 μM) as described in (b) and (c). Note that the increase inpPLCγ1 after U73122 treatment in the unstimulated, baseline condition in (f) was not a consistent finding. The abundance of RasGTP orphosphoproteins was arbitrarily set at 1.0 for 0min time point by normalizing to the abundance of α-tubulin, total PLCγ1 or RasGRP1,respectively. (g) Median ratio of Indo-1 violet/blue fluorescence as a measure of intracellular Ca2+ over time in 1156S-O (left panel) and 1713S-N (right panel) that were stimulated with anti-CD3/CD4 and crosslinking antibodies (blue trace) or with IL-2/7/9 (red trace). Cells werestimulated after 20 s baseline was recorded. All panels in this figure are representative examples of three independent experiments.
RasGRP1 overexpression in T-ALLO Ksionda et al
5
© 2015 Macmillan Publishers Limited Oncogene (2015) 1 – 11

1000 2100 5200
0
10’
5’
2’
DMSO
2 μM
5 μM
10 μM
15 μM
pAkt (S473)1000 1750 2500
DMSO
100
nM
500n
M
1000
nM
pAkt (S473)
2000
nM
PBS
cyto
kine
s
DAG levels DAG levels
R59945 R59945
cyto
kine
s
1100 3250 5200
290 555 820
300 1350 2400
170 2335 4500
Cells
(%
)
pAkt (S473)
DMSO 2 μM 5 μM 10 μM 15 μM
Cells
(%
)
pErk1/2
1713S-N1195 1759 2740 2664 3290
296 355 549 643 653
305 355 890 1394 1700
191 683 2235 3385 5475
1156S-O
1713S-N
1156S-O
DAG levels
R59945 (DGK inhibitor)
- DGK inhibitor + DGK inhibitor
DGK
Ca
PA DAG
Ras
RasGRP1
pERKpAkt
pERKpAkt
basal DAG, Ca , phosphorylationsome membrane-bound RasGRP1
low pERK and pAkt
basal DAG, Ca , phosphorylationmore membrane-bound RasGRP1
higher pErk and pAkt
GRP1GRP1
GRP1GRP1
CYTOPLASM
MEMBRANE
Figure 4. RasGRP1 couples to the cytokine receptor via basal DAG. (a) Model of RasGRP1 in basal state. (Left) RasGRP1 exists in autoinhibitedform but can use basal Ca2+, DAG to shuttle between the cytoplasm and membrane. DGK converts DAG to PA (phosphatidic acid). (Right) Inthe presence of DGK inhibitor, DAG is no longer converted to PA and accumulates at the membrane. As a consequence, more RasGRP1 ispresent at the membrane to activate Ras and its downstream effectors (figure by Anna Hupalowska, PhD). (b and c) Histograms showingphospho-Akt (S473) (b) and phospho-Erk1/2 (Thr202/Tyr204) (c) in T-ALL cell lines (1156S-O and 1713S-N) treated with varying concentrationof DGK inhibitor (R59945) for 30min before analysis. DMSO-treated cells served as vehicle controls. Numbers represent median fluorescenceintensities. A representative example of three independent experiments is shown. (d) Heatmap depicting phospho-Akt (S473) in 1713S-NT-ALL cell line treated with the DGK inhibitor, R59945, at indicated concentrations for 30min before stimulation with IL-2/7/9 for the indicatedduration in minutes. (e) Heatmap depicting phospho-Akt (S473) in 1713S-N T-ALL cell line treated with DGK inhibitor, R59945, at the indicatedconcentrations for 30 min before stimulation for 5min with cytokines. IL-2/7/9 were used at various concentrations (1/10th standard, 1/5thstandard, 1 × standard cytokine dilutions compared with concentrations of cytokines used throughout this study). Panels d and e arerepresentative examples of two independent experiments completed in duplicate.
RasGRP1 overexpression in T-ALLO Ksionda et al
6
Oncogene (2015) 1 – 11 © 2015 Macmillan Publishers Limited

cellular levels of DAG to activate Ras effector pathways, which canbe further induced by cytokine stimulation.
Broad coverage of expressed RasGAP molecules in T-ALLGiven that our experiments in Figures 3 and 4 demonstrate thatRasGRP1 couples to basal DAG, one would predict that T-ALL cellswith RasGRP1 overexpression efficiently accumulate RasGTP in theunstimulated state. However, we previously established thatRasGRP1 T-ALLs display only very modest increases in the basallevels of RasGTP. This contrasted the high levels of baselineRasGTP observed in T-ALL with oncogenic Ras mutations (such asKRasG12D) that render Ras protein insensitive to GAP action.5 NetRasGTP levels are the sum of GTP loading and GTP hydrolysis. Wepostulated that T-ALLs may contain high steady-state RasGAPactivity to counteract the increased RasGRP1 activity in restingcells. To gain more insight into this equilibrium, we first looked atthe expression of the two best characterized RasGAPs, NF1 andp120RasGAP. In a panel of 11 human T-ALL cell lines, all cell lines
expressed both NF1 and p120RasGAP at roughly similar levels asdetermined by western blot analysis (Figure 5a). The Jurkat T-celllymphoma and JPRM441 cell line, a Jurkat derivate expressingonly 10% of normal RasGRP1 levels,17 revealed similar NF1 andp120RasGAP levels (Figure 5a), indicating that RasGRP1 does notinfluence expression levels of these RasGAPs.We reported that RasGRP1 reveals a large 128-fold range in
mRNA expression levels among 107 primary T-ALL samples ofpediatric patients.5 Here, we plotted mRNA levels for 10 RasGAPfamily members reported to be expressed in lymphocytes (Kinget al.,18 immgen.org) from the same microarray data of 107 T-ALLpatients. We were struck to find that the primary samplesexpressed all RasGAP family members with only relatively smallvariations in mRNA expression between patients (Figure 5b).Additionally, expression of individual RasGAPs did not correlatewith clinical outcome (Supplementary Figure 1). Given the aboveexpression data and the critical biologic importance of tightregulation of RasGTP levels in cells, the regulation of the
Rel
ativ
e ex
pres
sion
le
vels
(lo
g2)
T-ALL patients2
4
8
16 p120RasGAP(Rasa1)
T-ALL patients2
4
8
16 Rasa2 Rasa3
T-ALL patients2
4
8
16 Rasa4
T-ALL patients2
4
8
16
2
4
8
16
T-ALL patients
RasaL1
Rel
ativ
e ex
pres
sion
le
vels
(lo
g2)
T-ALL patients2
4
8
16 RasaL2 RasaL3
T-ALL patients
SynGAP family
SynGAP DAB2ip
Rel
ativ
e ex
pres
sion
le
vels
(lo
g2)
GAP1m family
2
4
8
16
2
4
8
16
2
4
8
16
T-ALL patients T-ALL patients
T-ALL patients
NF1
2
4
8
16
Mol
t 3
Mol
t 4
Mol
t 13
HB
P-A
LL
HU
T-78
CC
RF
-CE
M
CU
TL1
KO
PT
K1
PE
ER
JUR
KA
TS
JPR
441
αTubulin
NF1
p120RasGAP
260
50
110
160
Figure 5. T-ALLs express many RasGAPs. (a) Western blot analysis of NF1 and p120RasGAP expression in a panel of human T-ALL cell lines.Arrow indicates NF1 band; the upper band is nonspecific. (b) Standard Affymetrix analysis was used to generate and normalize signalintensities of 10 RasGAP mRNA expression in samples from 100 pediatric T-ALL patients treated on COG studies 9404 and AALL0434. Valueswere RMA (robust multiarray average) normalized.
RasGRP1 overexpression in T-ALLO Ksionda et al
7
© 2015 Macmillan Publishers Limited Oncogene (2015) 1 – 11

RasGTP-RasGDP equilibrium is unlikely to be regulated by a singleRasGAP family member but more likely by combined RasGAPactivity.
Increased RasGRP1 levels lead to high rate of flux throughRasGDP/RasGTP cycleTo investigate directly the equilibrium between RasGDP/GTP andthe equilibrium between RasGEF and RasGAP activity in the
setting of RasGRP1 overexpression, we compared and contrastedthree distinct Ras assays.First, we expanded on our published data with the traditional
RasGTP pulldown assay, confirming that increased RasGRP1expression does not result in high levels of RasGTP in the basalstate, especially when compared with T-ALL cell lines that harborKRasG12D mutation (Figures 6a).5 However, the pulldown assaydoes not provide any insights regarding the rate of RasGTP/GDPcycling (Figure 6a). To gain insight into the latter, we took
GT
P+
GD
P o
n R
as(c
.p.m
)
JurkatsJPRM441
200
600
400
0
GT
P+
GD
P o
n R
as
(c.p
.m)
Permeabilization time (min)
0 2 4 6 8 10
5000
1000150020002500
Cos7
0 2 4 6 80
200
400
600
Permeabilization time (min)
GT
P+
GD
P o
n R
as
(c.p
.m)
Rat-1500
0
1000
1500
0 2 4 61 3 5
HeLa
Permeabilization time (min)
GT
P+
GD
P o
n R
as
(c.p
.m)
0 2 41 3 5
Permeabilization time (min)
GT
P+
GD
P o
n R
as
(c.p
.m)
500
1000
1500
0
U937
0 2 41 3 5
Permeabilization time (min)
6
200
0
400500
100
300
GT
P+
GD
P o
n R
as
(c.p
.m)
Jurkats
0 2 4 6 8
Permeabilization time (min)
500
0
1000
1500
GT
P+
GD
P o
n R
as
(c.p
.m)
human T cells
800
1.5 2 43 54 5 60 1 2 30
200
400
600
800 1156C61555
200
400
600
2 41 3 5
1156C6998
Permeabilization time (min) Permeabilization time (min) Permeabilization time (min)
0
1156 GFP
2 41 3 50
200400
600
8001000
1156 KD
Permeabilization time (min)
Net RasGTP
1156
S-O
1713
S-N
TALL
C6
TALL
9TA
LL15
Ras-GTP
Total Ras
Traditional Ras pulldown
Ras α-32P-GTP Ras[α-32P]GTP
Add α-32P-GTP and digitonin
Time (min)
Rate of exchange by GEFs
+GEF
Ras[α-32P]GDP
GAP
Digitonin nucleotide exchange assay
RasGTP
Ras
RasGRP1
pErk1/2
0 3 6 0 3 6 0 3 60 3 6
GTP GMppNHp
Jurkats JurkatsJPRM 441 JPRM 441
Digitonin (min)
RasGAP
High expression of RasGRP1
High activity of RasGAPs
?
Downstream effectorsRasGTPRasGDP
RasGRP1
RasGRP1RasGRP1RasGRP1
RasGRP1
Cytokine receptor
RasGRP1 overexpression in T-ALLO Ksionda et al
8
Oncogene (2015) 1 – 11 © 2015 Macmillan Publishers Limited

advantage of a Ras nucleotide exchange assay19 to evaluate therate of GTP loading (Figure 6b). Briefly, cells are permeabilizedwith digitonin to allow entry of radioactive α-phosphate-labeledGTP. This radiolabeled GTP is loaded onto Ras and can behydrolyzed into RasGDP without loss of the radiolabeled nucleo-tide. Cells are lysed and Ras-bound radionucleotide is quantifiedand represents the amount of GTP loaded onto Ras as a functionof time (Figure 6b).We first investigated loading of GTP into Ras in three non-
immune cell lines (Cos7, Rat1 and HeLa), which lack or express lowlevels of RasGRP exchange factors.17,20,21 In agreement withpreviously reported data for Cos7 cells,21 all three cell lines show aslow rate of GTP loading and never reached plateau within theexperimental time frame (Figure 6c). In contrast, in immune cellsradioactivity levels quickly increased and were saturated atroughly 2 min, indicating that all Ras molecules had experiencedone round of nucleotide exchange. This result confirms previousfindings for T cells22,23 and suggests that immune cells thatexpress RasGRP family members (RasGRP4 in U937 and RasGRP1in Jurkat and human primary T cells; Roose et al.17) haveexceptionally high basal rates of nucleotide exchange on Ras(some 30-fold higher than the intrinsic exchange rate of Ras24)(Figure 6d).Focusing selectively on overexpression of RasGRP1 in leukemia,
we find the rapid GTP loading in the Jurkat T-cell lymphoma line isdependent on this RasGEF as the rate of radionucleotide loading issignificantly decreased in RasGRP1-deficient JPRM441 cells(Figure 6e, left graph). Similar to the results with Jurkat, murineT-ALL cell lines with high RasGRP1 expression (1156 and C6)revealed exceptionally high exchange rates with rapid accumula-tion of radioactive Ras and saturation of the experimental systemwithin 2 min of incubation (Figure 6e, middle and right graph; bluelines). In contrast, two cell lines with GTPase-crippling KRasG12D
mutations (T-ALL 15 and 9) had very slow exchange rates(Figure 6e, middle and right graph; green lines). Furthermore,two additional T-ALL cell lines that do not have any knowninsertions in genes involved in Ras signaling5 displayed slow ratesof GTP loading onto Ras (Figure 6e, middle and right graph; blacklines). To further prove the causal link between RasGRP1 and basalnucleotide exchange on Ras, we knocked down RasGRP1 in thehigh expressor line 1156S-O via shRNA. As shown in the far-rightgraph in Figure 6e, stable knockdown of RasGRP1 in the 1156S-OT-ALL line caused a marked reduction of nucleotide uptake by Rasthat was not seen in the GFP control 1156S-O line, confirming thatbasal GTP loading of Ras in these T-ALL lines was driven byRasGRP1. Collectively, these data demonstrate that high levels of
RasGRP1 expression in T-ALL cells lead to constitutively highnucleotide exchange rates on Ras.These data again argue for equally high basal RasGAP activity in
T-ALLs with RasGRP1 overexpression, given the minimallyincreased steady-state levels of RasGTP. As a third assay, wecombined the permeabilization approach with the RasGTPpulldown assay. We reasoned that loading T cells with the non-hydrolyzable GTP analog GMppNHp should promote Ras activa-tion solely via nucleotide exchange because RasGAP activity isfutile against Ras-GMppNHp. As shown in Figure 6f, Jurkat cellspermeabilized in the presence of GTP featured higher RasGTPlevels compared with the low-RasGRP1 derivative JPRM441, inaccordance with the notion that basal nucleotide uptake by Ras,as driven by RasGRP1, is a prerequisite for the accumulation ofRasGTP. Importantly, when permeabilized in the presence of thenon-hydrolyzable GTP analog, GMppNHp-active Ras accumulationrose markedly in Jurkat and also, albeit to a lesser extent, inJPRM441s. Although GMppNHp is certainly likely to affect theactivity of other G proteins in the T cells, the simplestinterpretation of these data was that resting T-ALL cells harborhigh RasGAP activity, which is needed to balance the equally highbasal nucleotide exchange on Ras driven by RasGRP1.
DISCUSSIONWe demonstrate that the cytokine receptor-RasGRP1-Ras pathwayis unique to T-ALL that overexpress RasGRP1, a feature observed inapproximately half of pediatric T-ALL patients.5 We also provideevidence that dysregulated RasGRP1 uses basal DAG to anchor tothe membrane, is already phosphorylated and therefore ‘primed’to facilitate GDP/GTP exchange on Ras. In agreement, weuncovered constitutively high levels of GTP loading on to Rasthat occurs exclusively in the setting of RasGRP1 overexpression.Analysis of Ras effectors revealed that in cytokine-stimulated
T-ALL, PI3K-Akt signals were more robustly induced than MEK/Erk.Interestingly, we observed a strong reduction in pAkt levels inT-ALL cell lines with RasGRP1 knockdown, and this effect wasmuch more pronounced than previously reported in thymocytes(Figures 2c and d).25 The molecular mechanism for this differentialsensitivity of pAkt compared with pErk is unknown. PI3K but notMEK is important for viability and cell cycle progression of T-ALLblasts.26 Our observation that RasGRP1 preferentially couples toPI3K-Akt signals combined with the fact that RasGRP1 is notubiquitously expressed suggest that targeting RasGRP1 may proveto be an effective way to dampen PI3K signals in leukemic cells.
Figure 6. Overexpression of RasGRP1 leads to high rate flux through RasGDP/RasGTP cycle. (a) Scheme of traditional Ras pulldown assay thatmeasures net RasGTP levels and western blot analysis of RasGTP after Ras pulldown in RasGRP1 (1156S-O, 1713S-N and T-ALL C6) and KRasG12D
(T-ALL 9, TALL15) T-ALL cell lines. (b) Scheme of digitonin exchange assay that measures loading of GTP into Ras. In short, cells arepermeabilized with digitonin and loaded with radioactively labeled GTP nucleotide. GTP is labeled at the α position; therefore, after GAP-mediated hydrolysis, the radioactive label is not released and Ras-bound radioactivity accumulates over time. Ras is then immunoprecipitatedand GTP loading quantified by scintillation counting. (c and d) Graphs depict rate of accumulation of radiolabeled guanine nucleotide incounts per minute that was loaded onto Ras in the basal state over time as measured with the digitonin exchange assay. Assays were carriedout in a panel of cell lines that either do not express RasGRP proteins or have low expression of RasGRP1 and 3 (Cos7, Rat1, HeLa) (c) andcompared with cell lines that express high levels of RasGRP1 or 4 (Jurkats, human T cells, myeloid U937) (d). (e) Accumulation of radiolabeledguanine nucleotide in counts per minute in resting cells on Ras as measured with the digitonin exchange assay in a panel of T-ALL cell lines.Left panel compares human T-ALL line, Jurkat and its derivative JPRM441, which express low levels of RasGRP1; two middle panels compareRasGRP1 T-ALL cell lines (1156, C6) with KRasG12D (T-ALL 15 and 9). Two T-ALL cell lines without known mutations in the Ras pathway (T-ALL 55and 98) are shown as controls. Far right panel compares 1156S-O GFP cell line with 1156S-O cell line with stable shRNA-mediated knockdownof RasGRP1 (1156 KD).5 Panels c–e are representative examples at least two independent experiments. (f) Biochemical RasGTP determinationin Jurkat T-ALL cell line and JPRM441 derivative expressing low levels of RasGRP1 treated with digitonin and loaded with either GTP or its non-hydrolyzable GTP analog GMppNHp for the indicated periods of time. (g) A proposed model elucidating a potential tumor suppressor role ofRasGAPs in RasGRP1 T-ALL cells. Dysregulated RasGRP1 uses basal DAG to anchor to the membrane to perform exchange of GDP to GTP onRas. High loading of GTP is counterbalanced by increased activity and/or expression of RasGAPs to hydrolyze GTP back to GDP and maintainlow RasGTP levels. Cytokine receptor activation disrupts this cycle by acting on RasGAPs to decrease their activity resulting in theaccumulation of RasGTP in the cell.
RasGRP1 overexpression in T-ALLO Ksionda et al
9
© 2015 Macmillan Publishers Limited Oncogene (2015) 1 – 11

The collective results of our three distinct Ras assays revealrapid nucleotide loading of GTP into Ras in T-ALL with RasGRP1overexpression, suggesting that even without receptor inputRasGRP1 can exert its function and the protein must ‘breathe’enough to be released from its autoinhibited state and use cellularDAG and Ca2+ for full activation (Figure 6e). Based onmathematical modeling one consequence of high flux throughRasGDP/GTP cycle at basal state would be much faster accumula-tion of RasGTP after receptor triggering as compared with thesettings with low basal flux.24
In light of our experimental observations, we have proposed amodel in which high loading of GTP into Ras by RasGRP1 iscounterbalanced by RasGAP-mediated hydrolysis to keep RasGTPlevels low under resting conditions (Figure 6g). Given that wefound no evidence of cytokine-induced RasGRP1 activation(Figure 3e), it is a logical possibility that cytokines decreaseRasGAP activity in the leukemic cell, ultimately resulting in RasGTPaccumulation (Figures 1a and b and Figure 6g). It is possible thatother receptor systems such as granulocyte-colony-stimulatingfactor or granulocyte–macrophage colony-stimulating factor(reviewed in Ksionda et al.6) cooperate with RasGRP signaling ina similar manner. This mode of GTPase activation, that is, viareceptor-induced inactivation of GAP, has been recently shown forRheb, a Ras-related GTPase, and some evidence points out that itmay also be the case for Ras (reviewed in Hennig et al.24 andLaplante and Sabatini27). It has previously been shown that certaingrowth factors such as platelet-derived growth factor or epidermalgrowth factor induce proteolytic degradation of NF1, one of theRasGAPs.28 However, we did not observe any change in levels ofNF1 or P120RasGAP after cytokine stimulation. Given that T-ALLcells express many RasGAPs (Figure 5), dissecting the mechanismsinvolved in both basal regulation of RasGTP/GDP and cytokinereceptor action in transformed lymphocytes will require newgenetic tools such as combination T-cell-specific knockout micefor RasGAPs or CRISPR/cas9-mediated cell line models.Our results strongly point to a role of RasGAPs as crucial
safeguards, especially in leukemic cells with dysregulated expres-sion of RasGRP1. The mutational status of all RasGAPs has notbeen explored in the context of T-ALL, but our results show that atleast 10 RasGAP family members are expressed in each of thepediatric T-ALL samples analyzed (Figure 5). It appears that broadcoverage with different RasGAP proteins is required to counter-balance Ras nucleotide loading. This idea is supported by studiesshowing that T-lineage knockouts of NF1 or p120RasGAP had onlyminor phenotype and did not result in T-ALL,29,30 but that theircombined deletion leads to the development of T-ALL.31 Theimportance of RasGAPs is also highlighted by emerging datashowing that NF1 is mutated in both pediatric and adult T-ALLpatients.32–34 Interestingly, there seems to be an increasedinstability of the Ras network evidenced by increasedco-occurrence of NF1 mutations with other RasGAPs or RasGEFsin a wide range of human cancers.35 It would be interesting toinvestigate whether high basal RasGRP1 activity would lead toincreased instability of the Ras network in T-ALL.In summary, our findings document that overexpression of
RasGRP1 in a subset of T-ALLs effectively renders Ras and Raseffector pathways in these leukemias responsive to pro-oncogeniccytokines. We propose that overexpression of RasGRP1 and theresulting high nucleotide exchange on Ras essentially create anew signaling avenue for proleukemic cytokines that can providepro-oncogenic Ras signals in T-ALL. It is intriguing to speculatethat similar scenarios may apply to other Ras-dependent tumors.For example, EGFR overexpression, as present in numerous solidcancers, might work in an analogous manner to high RasGRP1levels in leukemia to drive basal nucleotide exchange on Ras36,37
and to render Ras pathways in those cancers overresponsive toalternate mitogenic factors.
MATERIALS AND METHODSCell linesMurine T-ALL cell lines (1156S-O, 1156S-O-shRNA RasGRP1, 1156S-O-GFP,1713S-N, T-ALL C6, T-ALL 9, T-ALL 15, T-ALL 55 and 98) were originallygenerated and maintained as described in Hartzell et al.5 Human T-ALL celllines were cultured in RPMI 10% fetal bovine serum, penicillin andstreptomycin.
AntibodiesThe following antibodies were used in this study: phospho-Akt (S473) (CellSignaling, Danvers, MA, USA; No. 4060), phospho-Erk1/2 (T202/Y204) (CellSignaling; no. 4377), phospho-STAT5 (Y694) (Cell Signaling; no. 9351),phospho-PLCγ1 (Y783) (Invitrogen, Waltham, MA, USA; 44-696G), α-tubulin(Sigma, St Louis, MO, USA; T6074), total Ras (clone RAS10) (Millipore,Billerica, MA, USA; 05-516), neurofibromin (NF1) (Santa Cruz Biotechnol-ogies, Dallas, TX, USA; sc-67), p120RasGAP (BD Biosciences, San Jose CA,USA; 610040), anti-CD4 (GK1.5) (Alexa Fluor 488; eBiosciences, San Diego,CA, USA), CD8 (53-6.7) PerCP Cy5.5 (BD Biosciences), TCRβ (H57-597) (APCBiolegends, San Diego, CA, USA), and donkey anti-rabbit PE (711-116-152)and donkey anti-rabbit APC (711-136-152) from Jackson ImmunoResearch(West Grove, PA, USA). Murine RasGRP1 (m199) antibody was a gift from DrJim Stone. To detect phospho-RasGRP1 (T184), we generated an antibodyagainst epitope SRKL-pT-QRIKSNTC. This mouse monoclonal antibody(clone 4G7) was generated and purified by AnaSpec (Fremont, CA, USA).
In vitro stimulations, Ras pulldown and western blottingCells were washed and rested in phosphate-buffered saline at 37 °C for30min before stimulation. Where indicated, cells were treatedwith dimethyl sulfoxide (DMSO) or inhibitors (PLCγ inhibitor U73122;Calbiochem, San Diego, CA, USA; 662035; DGK inhibitor; Sigma; D5794)during resting. After resting, cells were stimulated with anti-CD3/anti-CD4(each 10 μg/ml) followed by goat anti-hamster (10 μg/ml) and goat anti-ratantibodies (1/1000), cytokines: IL-2, IL-7, IL-9 (each at 10 ng/ml, unlessotherwise noted; Peprotech, Rocky Hill, NJ, USA) or phorbol myristateacetate (25 ng/ml). All other techniques were described previously.5
Flow cytometry and fluorescent barcoding.Stainings were carried out in FACS buffer containing phosphate-bufferedsaline without calcium and magnesium salts (phosphate-buffered salineCMF) supplemented with 2% fetal calf serum, 2mM EDTA and 0.09% NaN3.Where surface staining was combined with intracellular staining, thefollowing protocol was followed: cells were fixed with 2% paraformalde-hyde for 20min at room temperature (RT). Cells were washed three timeswith FACS buffer and permeabilized with 90% ice-cold methanol for30 min at 4 °C. After washing, cells were incubated with antibodiesspecific for phosphoproteins for 1 h at RT followed by washing andincubation for 30 min at RT with secondary antibodies and antibodiesagainst surface markers. If samples were barcoded, fluorescent dyes(Alexa Fluor 488 carboxylic acid, succinimidyl ester; Molecular Probes(Eugene, OR, USA); A-20000; or Pacific Blue succinimidyl ester; MolecularProbes; P-10163) were added to methanol and permeabilization tookplace at RT as described.38 Samples were acquired on BD LSR II (FranklinLakes, NJ, USA) and analyzed with FlowJo (Ashland, OR, USA) or Cytobank(Mountain View, CA, USA).
Calcium flux measurementsCells were washed with IMDM (Iscove's modified Dulbecco's medium)without serum and loaded with 2 μg/ml of the Ca2+ indicator Indo-1(Molecular Probes; I1223) for 40min at 37 °C. Subsequently, cells werewashed and resuspended in IMDM medium. For calcium flux measure-ments via flow cytometery, cells were stimulated with anti-CD3 antibody(2C11, 10 μg/ml) and a baseline was registered for 20 s, then a crosslinkingantibody (goat anti-hamster immunoglobulin G; final concentration2 μg/ml) or cytokines were added and calcium levels were measuredand analyzed on as LSR II flow cytometer (BD Biosciences).
Gene expression analysis in pediatric T-ALL patientsPatient sample collection and RasGAP expression analysis was performedas described previously.5 In all cases, except RASAL3, multiple probe setswere identified for the gene of interest. Data were normalized using RMA(robust multiarray average).
RasGRP1 overexpression in T-ALLO Ksionda et al
10
Oncogene (2015) 1 – 11 © 2015 Macmillan Publishers Limited

Digitonin nucleotide exchange assayCells were starved in phosphate-buffered saline containing 0.1% bovineserum albumin, then permeabilized with digitonin (10 μg/ml finalconcentration; Serve Electrophoresis GmbH, Heidelberg, Germany) andloaded with 45 μCi (1.7 Mbq)/ml α-32P-GTP (which equals to 15 nM α-32P-GTP; Hartmann Analytic GmbH, Braunschweig, Germany). Cells were lysedat the indicated time points by adding the lysis buffer (50 mM HEPES, pH7.5, 100mM NaCl, 10mM MgCl2, 1% NP-40) supplemented with proteaseand phosphatase inhibitors (0.1 mg/ml Pefablock, 2 μg/ml leupeptin,100 μM PMSF, 1 μg/ml pepstatin A, 100 μM sodium vanadate, 4 mM β-glycerophosphate, 3.4 nm microcystin), GDP and GTP (both at 100 μM) andRas antibody Y13-259 (2.5 μg/ml). Lysates were cleared and Ras–antibodycomplexes were collected on gammaBind-Sepharose. After washing, thebeads were drained dry and subjected to Cherenkov counting in ascintillation counter for 1 min.
CONFLICT OF INTERESTThe authors declare no conflict of interest.
ACKNOWLEDGEMENTSWe thank the Roose lab members for helpful comments and Anna Hupalowska forthe graphics in Figure 4. Our research was supported by an NIH-NCI Physical ScienceOncology Center Grant U54CA143874, an NIH-NIAID Grant (P01 Program Project—AI091580), a Gabrielle’s Angel Foundation Grant and NIH-NCI Grant (R01—CA187318)(all to JPR), as well as by an NIH T32 training grant (5T32CA128583-05) and the KWF(Dutch Cancer Society) (MT and JB). This work was also supported by grants from theNCI to the Children’s Oncology Group including U10 CA98543 and CA180886 (COGChair's Grant), U10 CA98413 and CA180899 (COG Statistical Center) and U24CA114766 (COG Specimen Banking).
REFERENCES1 Aifantis I, Raetz E, Buonamici S. Molecular pathogenesis of T-cell leukaemia and
lymphoma. Nat Rev Immunol 2008; 8: 380–390.2 Barata J, Keenan T, Silva A, Nadler L, Boussiotis V, Cardoso A. Common gamma
chain-signaling cytokines promote proliferation of T-cell acute lymphoblasticleukemia. Haematologica 2004; 89: 1459–1467.
3 Silva A, Laranjeira ABA, Martins LR, Cardoso BA, Demengeot J, Yunes JA et al.IL-7 contributes to the progression of human T-cell acute lymphoblasticleukemias. Cancer Res 2011; 71: 4780–4789.
4 Zenatti PP, Ribeiro D, Li W, Zuurbier L, Silva MC, Paganin M et al. Oncogenic IL7Rgain-of-function mutations in childhood T-cell acute lymphoblastic leukemia. NatGenet 2011; 43: 932–939.
5 Hartzell C, Ksionda O, Lemmens E, Coakley K, Yang M, Dail M et al. DysregulatedRasGRP1 responds to cytokine receptor input in T cell leukemogenesis. Sci Signal2013; 6: ra21.
6 Ksionda O, Limnander A, Roose JP. RasGRP Ras guanine nucleotide exchangefactors in cancer. Front Biol (Beijing) 2013; 8: 508–532.
7 Dower NA, Stang SL, Bottorff DA, Ebinu JO, Dickie P, Ostergaard HL et al.RasGRP is essential for mouse thymocyte differentiation and TCR signaling.Nat Immunol 2000; 1: 317–321.
8 Kim R, Trubetskoy A, Suzuki T, Jenkins NA, Copeland NG, Lenz J. Genome-basedidentification of cancer genes by proviral tagging in mouse retrovirus-inducedT-cell lymphomas. J Virol 2003; 77: 2056–2062.
9 Klinger MB, Guilbault B, Goulding RE, Kay RJ. Deregulated expression of RasGRP1initiates thymic lymphomagenesis independently of T-cell receptors. Oncogene2004; 24: 2695–2704.
10 Oki T, Kitaura J, Watanabe-Okochi N, Nishimura K, Maehara A, Uchida T et al.Aberrant expression of RasGRP1 cooperates with gain-of-function NOTCH1mutations in T-cell leukemogenesis. Leukemia 2011; 26: 1038–1045.
11 Feske S, Skolnik EY, Prakriya M. Ion channels and transporters in lymphocytefunction and immunity. Nat Rev Immunol 2012; 12: 532–547.
12 Iwig JS, Vercoulen Y, Das R, Barros T, Limnander A, Che Y et al. Structural analysisof autoinhibition in the Ras-specific exchange factor RasGRP1. Elife 2013; 2: e00813.
13 Mitin N, Rossman KL, Der CJ. Signaling interplay in Ras superfamily function. CurrBiol 2005; 15: R563–R574.
14 Daley SR, Coakley KM, Hu DY, Randall KL, Jenne CN, Limnander A et al. Rasgrp1mutation increases naive T-cell CD44 expression and drives mTOR-dependentaccumulation of Helios(+) T cells and autoantibodies. Elife 2013; 2: e01020.
15 Jiang Y, Sakane F, Kanoh H, Walsh JP. Selectivity of the diacylglycerolkinase inhibitor 3-[2-(4-[bis-(4-fluorophenyl)methylene]-1-piperidinyl)ethyl]-2,3-dihydro-2-thioxo-4(1H)quinazolinone (R59949) among diacylglycerol kinasesubtypes. Biochem Pharmacol 2000; 59: 763–772.
16 Rubio I, Grund S, Song SP, Biskup C, Bandemer S, Fricke M et al. TCR-inducedactivation of Ras proceeds at the plasma membrane and requires palmitoylationof N-Ras. J Immunol 2010; 185: 3536–3543.
17 Roose J, Mollenauer M, Gupta V, Stone J, Weiss A. A diacylglycerol-protein kinaseC-RasGRP1 pathway directs Ras activation upon antigen receptor stimulation ofT cells. Mol Cell Biol 2005; 25: 4426–4441.
18 King PD, Lubeck BA, Lapinski PE. Nonredundant functions for Ras GTPase-activating proteins in tissue homeostasis. Sci Signal 2013; 6: re1.
19 de Vries-Smits AM, van der V, Downward J, Bos JL. Measurements ofGTP/GDP exchange in permeabilized fibroblasts. Methods Enzymol 1995; 255:156–161.
20 Ebinu JO, Bottorff DA, Chan EY, Stang SL, Dunn RJ, Stone JC. RasGRP, a Ras guanylnucleotide-releasing protein with calcium- and diacylglycerol-binding motifs.Science 1998; 280: 1082–1086.
21 Rubio I, Rennert K, Wittig U, Beer K, Durst M, Stang SL et al. Ras activation inresponse to phorbol ester proceeds independently of the EGFR via an uncon-ventional nucleotide-exchange factor system in COS-7 cells. Biochem J 2006; 398:243–256.
22 Downward J, Graves JD, Warne PH, Rayter S, Cantrell DA. Stimulation of p21rasupon T-cell activation. Nature 1990; 346: 719–723.
23 Rubio I, Wetzker R. A permissive function of phosphoinositide 3-kinase in Rasactivation mediated by inhibition of GTPase-activating proteins. Curr Biol 2000;10: 1225–1228.
24 Hennig A, Markwart R, Esparza-Franco MA, Ladds G, Ignacio R. Rasactivation revisited: role of GEF and GAPs systems. Biol Chem 2015; 396:831–848.
25 Gorentla BK, Wan CK, Zhong XP. Negative regulation of mTOR activation bydiacylglycerol kinases. Blood 2011; 117: 4022–4031.
26 Barata JT, Silva A, Brandao JG, Nadler LM, Cardoso AA, Boussiotis VA. Activation ofPI3K is indispensable for interleukin 7-mediated viability, proliferation, glucoseuse, and growth of T cell acute lymphoblastic leukemia cells. J Exp Med 2004; 200:659–669.
27 Laplante M, Sabatini DM. Regulation of mTORC1 and its impact on geneexpression at a glance. J Cell Sci 2013; 126: 1713–1719.
28 Cichowski K. Dynamic regulation of the Ras pathway via proteolysis of the NF1tumor suppressor. Genes Dev 2003; 17: 449–454.
29 Lapinski PE, Qiao Y, Chang C-H, King PD. A role for p120 RasGAP in thymocytepositive selection and survival of naive T cells. J Immunol (Baltimore, MD: 1950)2011; 187: 151–163.
30 Oliver JA, Lapinski PE, Lubeck BA, Turner JS, Parada LF, Zhu Y et al. The RasGTPase-activating protein neurofibromin 1 promotes the positive selection ofthymocytes. Mol Immunol 2013; 55: 292–302.
31 Lubeck BA, Lapinski PE, Oliver JA, Ksionda O, Parada LF, Zhu Y et al. Cutting edge:codeletion of the Ras GTPase-activating proteins (RasGAPs) neurofibromin 1 andp120 RasGAP in T cells results in the development of T Cell acute lymphoblasticleukemia. J Immunol 2015; 195: 31–35.
32 Balgobind BV, Van Vlierberghe P, van den Ouweland AMW, Beverloo HB,Terlouw-Kromosoeto JNR, van Wering ER et al. Leukemia-associated NF1inactivation in patients with pediatric T-ALL and AML lacking evidence forneurofibromatosis. Blood 2008; 111: 4322–4328.
33 Zhang J, Ding L, Holmfeldt L, Wu G, Heatley SL, Payne-Turner D et al. The geneticbasis of early T-cell precursor acute lymphoblastic leukaemia. Nature 2012; 481:157–163.
34 Neumann M, Heesch S, Schlee C, Schwartz S, Gokbuget N, Hoelzer D et al.Whole-exome sequencing in adult ETP-ALL reveals a high rate of DNMT3Amutations. Blood 2013; 121: 4749–4752.
35 Stites EC, Trampont PC, Haney LB, Walk SF, Ravichandran KS. Cooperationbetween noncanonical Ras network mutations. Cell Rep 2015; 10: 307–316.
36 Rubio I, Rennert K, Wittig U, Wetzker R. Ras activation in response to lysopho-sphatidic acid requires a permissive input from the epidermal growth factorreceptor. Biochem J 2003; 376: 571–576.
37 Downward J. Role of receptor tyrosine kinases in G-protein-coupled receptorregulation of Ras: transactivation or parallel pathways? Biochem J 2003; 376:e9–e10.
38 Krutzik PO, Nolan GP. Fluorescent cell barcoding in flow cytometry allowshigh-throughput drug screening and signaling profiling. Nat Methods 2006; 3:361–368.
Supplementary Information accompanies this paper on the Oncogene website (http://www.nature.com/onc)
RasGRP1 overexpression in T-ALLO Ksionda et al
11
© 2015 Macmillan Publishers Limited Oncogene (2015) 1 – 11