cancer anti-EGFR therapy response in colorectal RasGRP1 is ... · of CRC anti-EGFR therapy has...
17
RasGRP1 is a potential biomarker for stratifying anti-EGFR therapy response in colorectal cancer Oghenekevwe M. Gbenedio, … , Jeroen P. Roose, Philippe Depeille JCI Insight. 2019; 4(15):e127552. https://doi.org/10.1172/jci.insight.127552. Colorectal cancer (CRC) is the third most frequent neoplastic disorder and is a main cause of tumor-related mortality, as many patients progress to stage IV metastatic CRC. Standard care consists of combination chemotherapy (FOLFIRI or FOLFOX). Patients with WT KRAS typing are eligible to receive anti-EGFR therapy combined with chemotherapy. Unfortunately, predicting efficacy of CRC anti-EGFR therapy has remained challenging. Here we uncovered that the EGFR pathway component RasGRP1 acts as a CRC tumor suppressor in the context of aberrant Wnt signaling. We found that RasGRP1 suppresses EGF-driven proliferation of colonic epithelial organoids. Having established that RasGRP1 dosage levels impact biology, we next focused on CRC patients. Mining 5 different data platforms, we establish that RasGRP1 expression levels decrease with CRC progression and predict poor clinical outcome of patients. Last, deletion of 1 or 2 Rasgrp1 alleles made CRC spheroids more susceptible to EGFR inhibition. Retrospective analysis of the CALGB 80203 clinical trial showed that addition of anti-EGFR therapy to chemotherapy significantly improved outcome for CRC patients when tumors expressed low levels of RasGRP1 suppressor. In sum, our data support RasGRP1 as a biomarker in the EGFR pathway that has potential relevance to anti-EGFR therapy for CRC patients. Research Article Gastroenterology Therapeutics Find the latest version: http://jci.me/127552/pdf
Transcript of cancer anti-EGFR therapy response in colorectal RasGRP1 is ... · of CRC anti-EGFR therapy has...
RasGRP1 is a potential biomarker for stratifyinganti-EGFR therapy response in colorectalcancer
Oghenekevwe M. Gbenedio, … , Jeroen P. Roose, PhilippeDepeille
JCI Insight. 2019;4(15):e127552. https://doi.org/10.1172/jci.insight.127552.
Colorectal cancer (CRC) is the third most frequent neoplastic disorder and is a main causeof tumor-related mortality, as many patients progress to stage IV metastatic CRC. Standardcare consists of combination chemotherapy (FOLFIRI or FOLFOX). Patients with WT KRAStyping are eligible to receive anti-EGFR therapy combined with chemotherapy.Unfortunately, predicting efficacy of CRC anti-EGFR therapy has remained challenging.Here we uncovered that the EGFR pathway component RasGRP1 acts as a CRC tumorsuppressor in the context of aberrant Wnt signaling. We found that RasGRP1 suppressesEGF-driven proliferation of colonic epithelial organoids. Having established that RasGRP1dosage levels impact biology, we next focused on CRC patients. Mining 5 different dataplatforms, we establish that RasGRP1 expression levels decrease with CRC progressionand predict poor clinical outcome of patients. Last, deletion of 1 or 2 Rasgrp1 alleles madeCRC spheroids more susceptible to EGFR inhibition. Retrospective analysis of the CALGB80203 clinical trial showed that addition of anti-EGFR therapy to chemotherapy significantlyimproved outcome for CRC patients when tumors expressed low levels of RasGRP1suppressor. In sum, our data support RasGRP1 as a biomarker in the EGFR pathway thathas potential relevance to anti-EGFR therapy for CRC patients.
Research Article Gastroenterology Therapeutics
Find the latest version:
http://jci.me/127552/pdf

1insight.jci.org https://doi.org/10.1172/jci.insight.127552
R E S E A R C H A R T I C L E
Authorship note: CB, DG, and CYW contributed equally to this work. JPR and PD are co–senior authors.
Conflict of interest: PD, RSW, and JPR are holders of the patent PCT/US2016/025334, Prognostic and Diagnostic Methods for Colorectal Cancer. OMG, PD, RSW, and JPR hold stock in SealBiosciences Inc.
Copyright: © 2019, American Society for Clinical Investigation.
Submitted: January 23, 2019 Accepted: June 19, 2019 Published: August 8, 2019.
Reference information: JCI Insight. 2019;4(15):e127552. https://doi.org/10.1172/jci.insight.127552.
RasGRP1 is a potential biomarker for stratifying anti-EGFR therapy response in colorectal cancerOghenekevwe M. Gbenedio,1 Caroline Bonnans,1,2 Delphine Grun,3 Chih-Yang Wang,1 Ace J. Hatch,4 Michelle R. Mahoney,5 David Barras,3 Mary Matli,6 Yi Miao,7 K. Christopher Garcia,7 Sabine Tejpar,2 Mauro Delorenzi,3,8 Alan P. Venook,9 Andrew B. Nixon,5 Robert S. Warren,6 Jeroen P. Roose,1 and Philippe Depeille1
1Department of Anatomy, UCSF, San Francisco, California, USA. 2Institut National de la Santé et de la Recherche Médicale,
Montpellier, France. 3Bioinformatics Core Facility (BCF) at SIB Swiss Institute of Bioinformatics, Lausanne, Switzerland. 4Department of Medicine, Duke University, Durham, North Carolina, USA. 5Alliance Statistics and Data Center, Mayo Clinic,
Rochester, Minnesota, USA. 6Department of Surgery, UCSF, San Francisco, California, USA. 7Department of Molecular
and Cellular Physiology, Department of Structural Biology and Howard Hughes Medical Institute, Stanford University
School of Medicine, Stanford, California, USA. 8Department of Oncology, University of Lausanne, Lausanne, Switzerland. 9Hematology/Oncology, Department of Medicine, UCSF, San Francisco, California, USA.
IntroductionColorectal cancer (CRC) represents the third most frequent neoplastic disorder worldwide and one of the main causes of tumor-related mortality (1). Combination chemotherapy, such as FOLFIRI (leucovorin, flu-orouracil, and irinotecan) and FOLFOX (leucovorin, fluorouracil, and oxaliplatin), has become the main treatment option for patients with CRC (2, 3). Thirty-five percent of CRC patients are diagnosed at stage IV metastatic CRC, and a large proportion of stage II and III CRC patients progress to stage IV at some point during their course of disease (4). Unfortunately, the 5-year survival rate for stage IV metastatic CRC patients is only approximately 13% (https://www.cancer.org/cancer/colon-rectal-cancer/detection-diagnosis-stag-ing/survival-rates.html). EGFR expression is widespread in CRC (5). Use of targeted therapies that inhibit the action of the EGFR — such as cetuximab, an antibody that binds and interferes with the EGFR — have been approved in combination with chemotherapy for metastatic CRC (6). Multiple randomized trials includ-ing both chemorefractory and chemonaive patients with metastatic CRC have established the overall survival (OS) benefits of the anti-EGFR blocking antibodies cetuximab and panitumumab (5). Examples are the Can-cer and Leukemia Group B (CALGB; now part of Alliance for Clinical Trials in Oncology) 80203 trial with metastatic CRC patients on FOLFIRI/FOLFOX therapy, which was closed early (7); and the CALGB 80405 trial, which compares FOLFIRI/FOLFOX therapy with bevacizumab (anti-VEGF) or with cetuximab.
Colorectal cancer (CRC) is the third most frequent neoplastic disorder and is a main cause of tumor-related mortality, as many patients progress to stage IV metastatic CRC. Standard care consists of combination chemotherapy (FOLFIRI or FOLFOX). Patients with WT KRAS typing are eligible to receive anti-EGFR therapy combined with chemotherapy. Unfortunately, predicting efficacy of CRC anti-EGFR therapy has remained challenging. Here we uncovered that the EGFR pathway component RasGRP1 acts as a CRC tumor suppressor in the context of aberrant Wnt signaling. We found that RasGRP1 suppresses EGF-driven proliferation of colonic epithelial organoids. Having established that RasGRP1 dosage levels impact biology, we next focused on CRC patients. Mining 5 different data platforms, we establish that RasGRP1 expression levels decrease with CRC progression and predict poor clinical outcome of patients. Last, deletion of 1 or 2 Rasgrp1 alleles made CRC spheroids more susceptible to EGFR inhibition. Retrospective analysis of the CALGB 80203 clinical trial showed that addition of anti-EGFR therapy to chemotherapy significantly improved outcome for CRC patients when tumors expressed low levels of RasGRP1 suppressor. In sum, our data support RasGRP1 as a biomarker in the EGFR pathway that has potential relevance to anti-EGFR therapy for CRC patients.

2insight.jci.org https://doi.org/10.1172/jci.insight.127552
R E S E A R C H A R T I C L E
Nonetheless, it has been challenging to predict success with these antibodies or with EGFR kinase inhibitors (erlotinib) in CRC. After introduction of cetuximab and panitumumab into the clinic, evidence soon arose that tumors harboring activating mutations in KRAS are insensitive to EGFR inhibition. Somat-ic mutations in KRAS (8, 9) occur in roughly 40% of CRC patients (10), and these mutations in KRAS have also been implicated as mediators of acquired resistance to anti-EGFR therapy (11, 12). Furthermore, roughly 40% of CRC patients reveal mutations in NRAS (13). These notions led to systematic, FDA-ap-proved typing for RAS as an accompanying diagnostic, and since 2012 anti-EGFR therapy has been restricted to patients without detectible KRAS and NRAS mutations (5). Still, there remain significant gaps between available analytical tools used to assess therapeutic benefit or risk, the likelihood of response or progression, and actual patient clinical outcome, and it is clear that KRAS and NRAS status are not the only determinants. Further, anti-EGFR therapy is costly and can be toxic; thus, the need to better understand the role of EGFR signals in CRC and to identify additional predictive markers is clear.
In the intestine, Wnt ligands signal to ensure self-renewal of stem cells in the crypt regions that pro-duce daughter cells (14). Wnt signals support stem cell function in many organs and enable the genera-tion of organoids that can be perpetuated in Matrigel in vitro (15, 16). Binding of the ligand R-spondin to the receptor leucine-rich repeat-containing receptor 5 (Lgr5) enables sustained Wnt signals (17), and R-spondin and surrogate Wnt ligands are highly effective in sustaining the growth of organoids (18). Stem and progenitor cells in the intestine are also exposed to EGFR signals (14), and Ras/MAPK signals are observed in human progenitor cells in normal intestinal crypts as well (19). Deletion of Egfr in mice leads to disorganized crypts (20), and fine-tuning of EGFR signaling is critical for balanced proliferation in the intestinal stem cell niche (21, 22). Deletion of KRas has no effect on the adult intestinal epithelium in mice (23), but expression of an oncogenic form of KRas, KRasG12D, in the murine colonic epithelium leads to hyperproliferation in a Ras/MAP kinase–dependent manner (24). The above-mentioned studies imply that EGFR/Ras signals balance proliferation and differentiation in intestinal progenitor cells (19, 21, 22). Better understanding of how EGFR/Ras signaling nuances impact CRC and particularly responses to anti-EGFR therapy could improve the clinical use of EGFR-targeting agents.
The EGFR couples to Ras guanine nucleotide exchange factors (RasGEFs) that can activate the small GTPase Ras (25). We previously established that 2 RasGEFs, RasGRP1 and SOS1, are structurally and biochemically different (26–29). Both RasGRP1 and SOS lie downstream of the EGFR (30), and we demonstrated that these RasGEFs play opposing roles in the intestine. Whereas SOS1 stimulates prolif-eration of cancer cells (30, 31), RasGRP1 opposes EGFR/SOS1 signals and thus suppresses proliferation (30). Rasgrp1 deficiency results in hyperproliferation of nontransformed intestinal epithelial cells and leads to exacerbation of CRC when this epithelium also carries oncogenic mutations in KRas or adenomatous polyposis coli (APC) (30, 32, 33). Here, we established that RasGRP1 functions as a tumor suppressor in the colon and suppresses EGF-driven proliferation of colonic organoid cultures. Decreases in RasGRP1 levels were prognostic of poor clinical outcome for CRC patients. Last, spheroid assays and clinical trial data revealed that RasGRP1 expression levels predicted efficacy of anti-EGFR therapy in CRC.
ResultsRasGRP1 is a tumor suppressor in the colonic epithelium of ApcMin/+ mice. Given that RasGRP1 opposes prolif-erative EGFR/SOS1 signals in CRC (30), we performed a more detailed analysis of the expression levels of RasGRP1 and tested our hypothesis that deletion of only 1 Rasgrp1 allele may have a biological impact.
We first mined published gene expression data deposited in the Gene Expression Omnibus database (GEO GSE49355) on sets of trio samples from individual patients with advanced CRC receiving FOLFIRI (34). This platform revealed that the levels of RasGRP1 expression in epithelium from the same patient was lower in primary CRC compared with normal tissue. There was an additional decrease in RasGRP1 expres-sion when primary CRC and CRC metastasis was compared in the liver (Figure 1A), suggesting that levels of RasGRP1 could play a role in CRC progression.
We next determined Rasgrp1 expression levels along 5 segments of the intestinal track in the mouse (Figure 1B). We utilized intestine from Rag1-deficient mice, which do not have T or B cells, in order to avoid potential sample contamination with these lymphocyte subsets that express high levels of Rasgrp1 (35). We observed that Rasgrp1 protein levels were highest in the duodenum and more moderate in the oth-er parts along the intestinal track (Figure 1C and Supplemental Figure 1; supplemental material available online with this article; https://doi.org/10.1172/jci.insight.127552DS1), a pattern that was mirrored by

3insight.jci.org https://doi.org/10.1172/jci.insight.127552
R E S E A R C H A R T I C L E
Rasgrp1 mRNA expression data (Figure 1D). By contrast, mRNA expression levels of the RasGEF Sos1, proproliferative in its function (30, 31), were similar throughout the intestinal track (Figure 1E).
In mouse models, heterozygosity for Rasgrp1 results in roughly half the Rasgrp1 protein expression (36). To test the implications of reduced levels of RasGRP1 expression in the context of CRC, we capital-ized on the ApcMin/+ mouse model with aberrant Wnt signaling (37), which is widely used to mimic human CRC (38–40). Complete deficiency in Rasgrp1 results in reduced survival of ApcMin/+ mice due to increased EGFR/SOS1 signals driving proliferation (30). Here, we uncovered that Rasgrp1 had stereotypical features of a tumor suppressor; ApcMin/+ mice died earlier from disease when they harbored only 1 allele of Rasgrp1 (Figure 1F and Supplemental Figure 2A). ApcMin/+ mice develop frequent tumors in the small intestine but rarely in the colon (38–40), a limitation of this murine model for human CRC. Deficiency or heterozygos-ity for Rasgrp1 in the context of ApcMin/+ did not result in altered numbers or size of small intestine tumors (Supplemental Figure 2B and ref. 30); instead there was an effect on the colon. Strikingly, there was a prominent increase in the frequency of tumors in the distal part of the colon when Rasgrp1 was deleted (Figure 1, G and H). Individual tumors heterozygous for Rasgrp1 grew to a larger size before we had to euthanize ApcMin/+:Rasgrp1WT/– mice, while the absolute number of tumors was not different from that in ApcMin/+ mice (Figure 1I and Supplemental Figure 2C). It should be noted the that tumor data in Figure 1, G–I, and Supplemental Figure 2C originated from mice of different ages and that we had to euthanize ApcMin/+:Rasgrp1WT/– and ApcMin/+:Rasgrp1–/– mice at an earlier age. Of note, the effects on colonic tumors were not caused by T cell defects; first, Rasgrp1WT/– have normal T cell development (41), and second, when we grafted ApcMin/+:Rasgrp1–/– mice with ApcMin/+ bone marrow to circumvent the known T cell deficiency in Rasgrp1–/– mice (41), we also observed colonic tumors (Supplemental Figure 3). In sum, these results reveal that Rasgrp1 is a tumor suppressor gene in colonic epithelium with aberrant Wnt signaling.
Rasgrp1 suppresses EGFR-driven growth of colonic organoids. The features of increased number and size of colonic tumors in ApcMin/+ mice caused by decreases in Rasgrp1 alleles are similar to those of ApcMin/+ mice with deletion of leucine-rich repeats and Ig-like domains 1 (Lrig1) (22). Lrig1 is a transmembrane mole-cule and an intestinal stem cell marker (22). Tet-induced expression of Lrig1 provides negative feedback to EGFR signaling (42) to balance intestinal stem cell homeostasis (21). Because of these similarities, we next investigated the functional impact of Rasgrp1 deletion in the normal colonic epithelium by optimizing the generation of colonic epithelial organoids (Figure 2A).
Colonic epithelial organoids were originally described by Sato et al. (43). We capitalized on R-spondin and Wnt surrogate ligands that trigger Lgr5 and LRP/Frizzled receptors to phenocopy sustained, canon-ical Wnt signaling (ref. 18 and Figure 2B). These Rspo-Wnt ligands allowed for efficient generation of colonic epithelium organoids (termed colonic organoids herein) from both young WT and young Rasgrp1–/– mice (Figure 2C). WT and Rasgrp1–/– colonic organoids revealed similar Egfr and Sos1 expression levels (Figure 2D). Rasgrp1–/– colonic organoids proliferated more vigorously than WT counterparts in Rspo-Wnt surrogate–supplemented Matrigel (Figure 2E). We subsequently analyzed growth of organoids on day 3, a time point of exponential growth phase. The growth rate was drastically reduced in both WT and Rasgrp1–/– organoids when these were subjected to the EGFR kinase inhibitor erlotinib (Figure 2F), which supports the hypothesis that proliferation is EGFR signaling dependent. In sum, Rasgrp1 limited proliferation of colonic organoids and organoid proliferation required uninhibited EGFR signaling.
RasGRP1 is a prognostic marker for clinical outcome of CRC. Given our findings on Rasgrp1’s role in mouse colonic organoids, we next explored RasGRP1 expression relative to clinical outcome in samples from CRC patients using 4 different platforms.
We first interrogated the Cancer Genome Atlas (TCGA). Mutations in APC, the tumor suppressor P53, and KRAS are the 3 most frequent genetic events leading to CRC (44). Using TCGA data, we found that RasGRP1 expression levels were lower in patients with mutations in the APC or TP53 tumor suppressors when compared with patients with WT APC or P53 alleles in their tumors (Figure 3, A and B). We did not observe a significant difference in RasGRP1 expression when tumors were stratified solely based on KRAS status (Figure 3C). However, in agreement with the pattern of decreasing RasGRP1 expression when CRC advanced (Figure 1A), we observed progressively lower RasGRP1 levels when tumors accumulated more mutations in the 3 main drivers, APC, P53, and KRAS (Figure 3D). By contrast, SOS1 expression levels were not altered as a function of mutational load for APC, P53, or KRAS (Figure 3E).
Second, we capitalized on our own collection of resected, biobanked liver metastases from patients with stage IV CRC to establish that there is a range of RasGRP1 mRNA expression in tumor samples that

4insight.jci.org https://doi.org/10.1172/jci.insight.127552
R E S E A R C H A R T I C L E
Figure 1. RasGRP1 acts as a tumor suppressor in ApcMin mice. (A) Normalized RasGRP1 mRNA levels analyzed with GeneSpring GX software. Normal colon (n = 18), primary colonic tumor (n = 20) and liver metastasis (n = 19). One-way ANOVA statistical analysis with Bonferroni corrections was carried out using SPSS 17.0. Post hoc t tests using SPSS Bonferroni-adjusted P values. Box and whisker plots indicate the median value and upper- and lower- quartiles in the box and the upper- and lower- extremes in the whiskers. (B and C) Detection of Rasgrp1 expression by Western blot analysis in different sections of small intestine (duodenum, 1; jejunum, 2; and ileum, 3) and colon (proximal, 4; and distal, 5). The Western blot is a representative example of 3 inde-pendent experiments. β-Actin served as protein loading control. Protein lysate from CD4-positive mouse cells (C57BL/6; mCD4+ T) was used as positive control for Rasgrp1. Western blots from 2 more extraction are shown in Supplemental Figure 1. Rasgrp1 (D) and Sos1 (E) mRNA levels determined by TaqMan PCR on distinct portions of the intestinal tract. mRNA expression for one duodenum portion was used as an arbitrary reference and set at 1.0, and other samples values were related to it. Data are presented as fold difference compared with the value of 1.0 in duodenum and plotted from n = 3 inde-pendent experiments (n = 3 mice). Each point represents an average of 2 wells. **P < 0.001 (1-way ANOVA, Bonferroni’s multiple-comparisons test). (F) Kaplan-Meier curves of ApcMin/+ mouse survival with different copies of Rasgrp1 alleles. Statistical analysis was performed on ApcMin/+:Rasgrp1WT/– (n = 37) and compared with ApcMin/+ mice (n = 25). *P < 0.05, log-rank (Mantel-Cox) test, which means that the 2 groups are significantly different from each other. (G) Quantification of colonic tumor incidence in ApcMin/+, ApcMin/+:Rasgrp1WT/–, and ApcMin/+:Rasgrp1–/– mice (n = 16, 25, and 19, respectively; **P < 0.05, *** P < 0.001 (1-way ANOVA, Bonferroni’s multiple-comparisons test). One dot represents one mouse. (H) Distal colon of an ApcMin/+:Rasgrp1–/– mouse bearing colonic adenomas. (I) Percentages of colonic tumors of the indicated sizes in ApcMin/+, ApcMin/+:Rasgrp1WT/– and ApcMin/+:Rasgrp1–/– mice (n = 10, 15, and 19, respectively). Additional data are shown in Supplemental Figure 2C.
5insight.jci.org https://doi.org/10.1172/jci.insight.127552
R E S E A R C H A R T I C L E
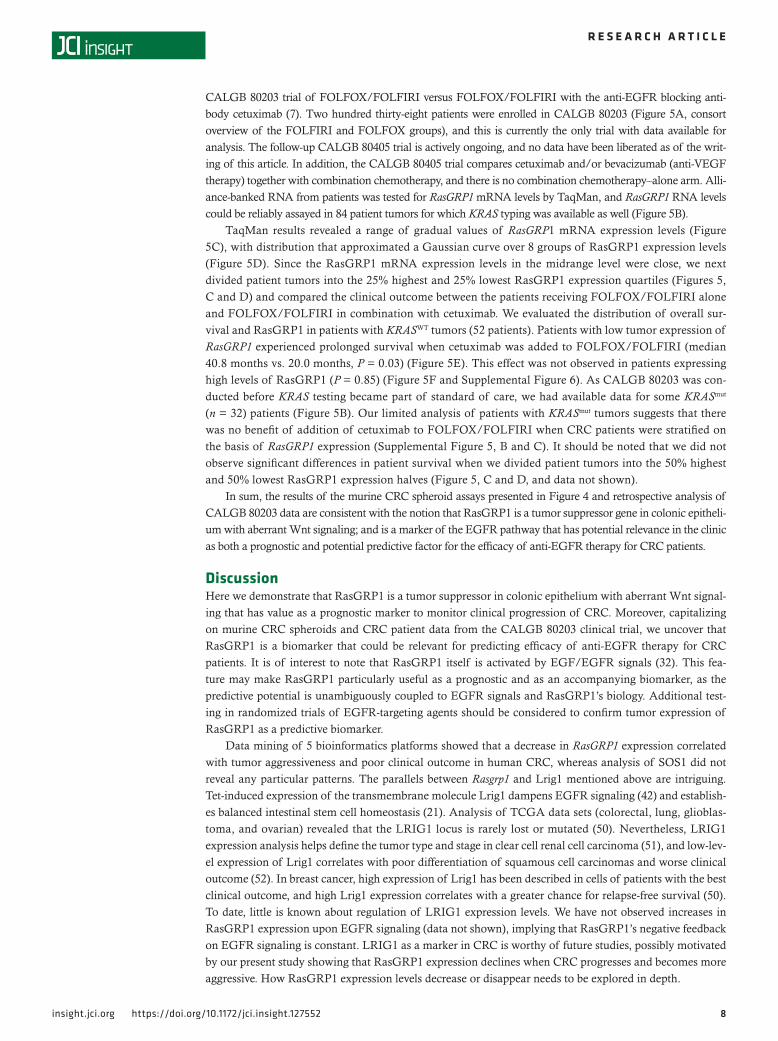
Figure 2. RasGRP1 is a critical suppressor of EGF-induced growth in the colon. (A) Pipeline of colonic organoid generation. (B) Schematic representa-tion of Wnt surrogate ligands simultaneously triggering LDL receptor-related protein 5 and 6 (LRP5/6) and Frizzled (FZD) as well as R-spondin (RSPO) contributing to sustained, canonical Wnt signaling. (C) Colonic organoids from individual WT and Rasgrp1–/– mice. Each image is a representative example of 12 wells of organoids per genotype from 3 independent experiments (n = 3 mice per genotype; n = 9 total). Scale bars: 200 μm. (D). Detection of Egfr and Sos1 expression by Western blot analysis in growing organoids from WT and Rasgrp1–/– mice (n = 2 mice per genotype). β-Actin served as protein loading control. Panels are representative of 2 independent organoid experiments. (E) Proliferation of developing organoids (represented in C) evaluated in growth media containing R-spondin and Wnt surrogate ligand over 5 days. Each point represents the average of 2 wells in triplicate (n = 3 mice per genotype). (F) Organoids were treated with erlotinib at different doses (0.2, 0.5, 2 μM) for 1, 3, and 5 days. All values were normalized to untreated on similar developing day. Data are representative of 3 independent experiments (n = 3 mice per genotype) with 2 wells per condition. We analyzed growth of organoids on day 3, when these were in the exponential growth phase. *P < 0.05, **P < 0.01, ****P < 0.01, NS not significant (1-way ANOVA, Bonferroni’s multiple-compari-sons test). Data are mean ± SEM.

6insight.jci.org https://doi.org/10.1172/jci.insight.127552
R E S E A R C H A R T I C L E
presents itself in a continuum, for both KRASWT and KRASMUT tumors (Figure 3F). By and large, the levels of RasGRP1 protein, determined by immunohistochemistry with a RasGRP1-specific monoclonal anti-body (Figure 3G), paralleled the mRNA levels.
Third, to assess whether RasGRP1 levels may have prognostic value for clinical outcome of CRC, we first explored the correlation between RasGRP1 expression and survival of 752 CRC patients who were enrolled in the Pan-European Trial in Adjuvant Colon Cancer 3 (PETACC-3) trial. The PETACC-3 trial (45) includes stage II and III patients and was designed to investigate whether disease-free status improved when irinotecan was added as adjuvant to infusional 5-fluorouracil/leucovorin (FU/LV) combination. Instead of applying more commonly used cutoff finder software, we divided the 752 patients without any bias into exact 50/50 groups (RasGRP1hi and RasGRP1lo) based solely on the RasGRP1 expression level in their tumors, as determined by using the ALMAC Colorectal Cancer DSA platform (45, 46). We next correlated RasGRP1hi and RasGRP1lo to overall survival. This unbiased 50/50 split revealed that RasGRP1 had prognostic value as a single marker on 282 stage II and III patients with KRASmut, with the 141 RasGR-P1hi patients showing significantly prolonged survival (Figure 3H). When all 752 stage II and III patients were analyzed in one group, RasGRP1 did not have prognostic value as a single marker (Supplemental Figure 4). Dividing patients in SOS1hi/SOS1lo groups did not correlate with survival, irrespective of KRAS status of the tumor (Supplemental Figure 4).
Various features of CRC have been described to correlate with clinical outcome. One of these is micro-satellite stability or instability. Microsatellite instability (MSI) generally correlates with better clinical out-come (47, 48), and in agreement with this notion, we observed better clinical outcome in the 75 PETACC-3 patients who demonstrated MSI (Supplemental Figure 5A). On average, these 75 MSI-positive PETACC-3 patients had higher RasGRP1 levels than the 603 patients with microsatellite stability (MSS) (Supplemental Figure 5B). Combining both RasGRP1 expression and MSI or MSS for the patient group analyzed in Fig-ure 3H revealed that MSI or MSS does not add additional discriminatory power for prediction of clinical outcome on the basis of RasGRP1 expression (Supplemental Figure 5C).
Last, we explored a fourth platform with a focus on metastatic CRC. We assessed RasGRP1 and SOS1 expression levels, using primary CRC with patient-matched liver metastases from the MOSAIC (Multi-center International Study of Oxaliplatin/5FU-LV in the Adjuvant Treatment of Colon Cancer with stage II and III CRC) study. Paired differential analysis revealed that RasGRP1 levels significantly decreased in liver metastases compared with primary tumors (Figure 3I, blue lines). By contrast, SOS1 expression levels were not significantly altered (Figure 3I, red and blue lines). In sum, expression levels of RasGRP1 — but not of SOS1 — decreased when CRC tumors became more aggressive, and RasGRP1 showed potential as a future prognostic marker for CRC clinical outcome in several platforms.
Murine CRC spheroids with less Rasgrp1 are more sensitive to anti-EGFR therapy. Given the challenge in identifying which individual patients will benefit most from anti-EGFR therapy and the clinical and finan-cial implications thereof in CRC, we explored whether RasGRP1 might be a valuable biomarker for the efficacy of anti-EGFR therapy.
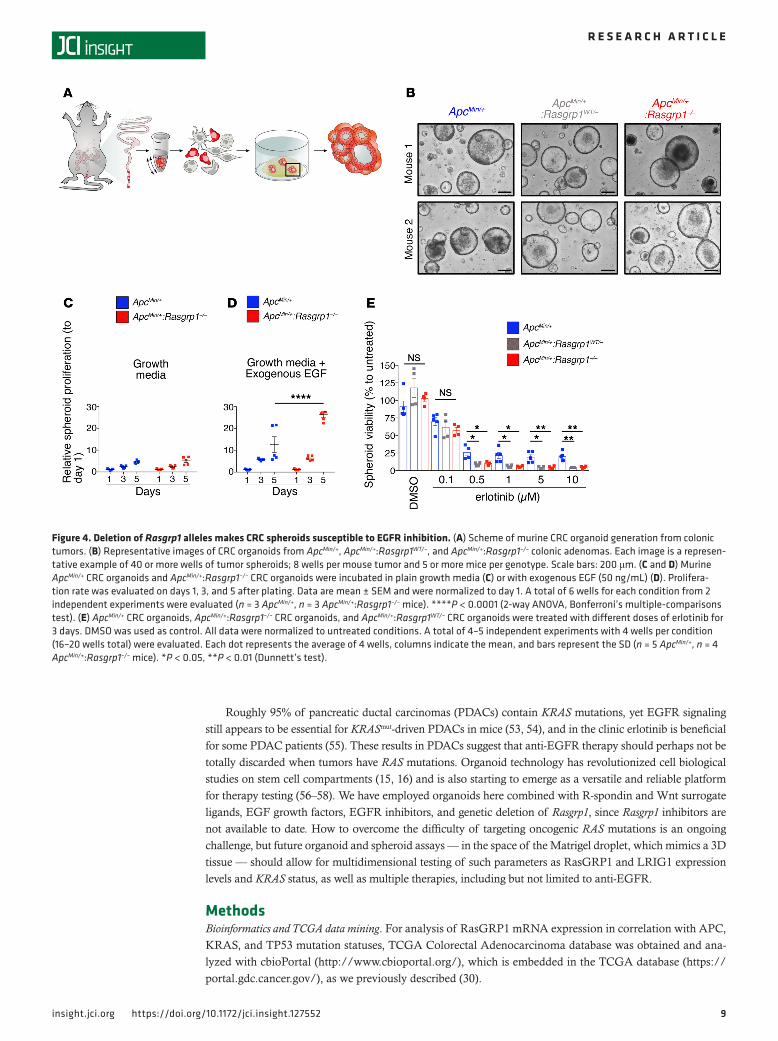
To first systematically test this idea, which was based on RasGRP1’s suppressive actions, we generated organoids from murine colonic tumors (termed spheroids herein) (Figure 4A). Spheroids from tumors found in the distal portion of the colon of ApcMin/+, ApcMin/+:Rasgrp1+/–, and ApcMin/+:Rasgrp1–/– mice were established with equal efficiency (data not shown) and manifested the stereotypic sphere appearance (Figure 4B). In agreement with increased Wnt signals when Apc function is perturbed (37), ApcMin/+ and ApcMin/+:Rasgrp1–/– spheroids proliferated spontaneously without addition of R-spondin and Wnt surrogate ligands (Figure 4C).
EGFR signaling is known to critically contribute to ApcMin/+-driven pathology; a hypomorphic Egfrwa2 allele crossed into ApcMin/+ results in a 90% reduction in intestinal polyps (49). Addition of exogenous EGF to the Matrigel revealed that this growth factor drove proliferation in all spheroids, but more extensively in ApcMin/+:Rasgrp1–/– spheroids, which lack suppression by Rasgrp1 (Figure 4D). Furthermore, inclusion of erlotinib in the media in which the Matrigel droplet was submerged (Figure 4A) reduced the viability of ApcMin/+ spheroids in a dose-dependent manner, and the efficacy was greatest when 1 or 2 alleles of Rasgrp1 were absent (ApcMin/+:Rasgrp1–/– and ApcMin/+:Rasgrp1WT/–; Figure 4E). This platform of CRC spheroids from well-defined genetically engineered mouse models reveals that anti-EGFR therapy was most effective when expression levels of the suppressor Rasgrp1 were low or absent.
RasGRP1 is a marker that stratifies anti-EGFR therapy efficacy. Last, we collaborated with the Alliance for Clini-cal Trials in Oncology and performed a retrospective analysis of CRC patients who were enrolled in the national

7insight.jci.org https://doi.org/10.1172/jci.insight.127552
R E S E A R C H A R T I C L E
Figure 3. RasGRP1 is a prognostic marker for CRC. (A–C) RasGRP1 expression in human CRC patients from the TCGA Colorectal Adenocarcinoma data sets. Expression of RasGRP1 in patients with WT versus mutant APC (A), WT versus mutant TP53 (B), and WT versus mutant KRAS (C). Statistical analyses were performed using unpaired t test; *P < 0.05. (D) Analysis of relative RasGRP1 expression using TCGA data as in A–C, organized by number of mutations in APC, TP53, and KRAS. *P < 0.05 (Dunnett’s test). (E) Analysis of relative SOS1 expression using TCGA data as in B–D, organized by number of mutations in APC, TP53, and KRAS. (F) RasGRP1 mRNA expression determined by TaqMan PCR on liver metastasis samples surgically removed from 124 patients with metastatic CRC. KRASmut, n = 87; KRASWT, n = 37. (G) Imunohistochemistry for RasGRP1 (brown staining) on liver metastasis patient samples selected from G with either low or high RasGRP1 levels. Scale bars: 20 μm. (H) Kaplan-Meier overall survival curve for stage II and III PETACC-3 CRC patients (n = 282) carrying KRAS mutation, divid-ed in 2 equal groups of 141 patients expressing high or low levels of RasGRP1 (*P = 0.02, log-rank [Mantel-Cox] test). (I) Analysis of RasGRP1 and SOS1 expression in matched primary and metastatic tumors from patients with metastatic CRC in the MOSAIC program. Gene expression levels (in log2 of RPKM) for RasGRP1 and SOS1 in metastases (red dots) were compared with levels in primary tumors (blue dots). Red lines and blue lines represent increase and decrease in expression level, respectively. Student’s t test was performed to assess the statistical significance between comparisons. *P < 0.05.
8insight.jci.org https://doi.org/10.1172/jci.insight.127552
R E S E A R C H A R T I C L E
CALGB 80203 trial of FOLFOX/FOLFIRI versus FOLFOX/FOLFIRI with the anti-EGFR blocking anti-body cetuximab (7). Two hundred thirty-eight patients were enrolled in CALGB 80203 (Figure 5A, consort overview of the FOLFIRI and FOLFOX groups), and this is currently the only trial with data available for analysis. The follow-up CALGB 80405 trial is actively ongoing, and no data have been liberated as of the writ-ing of this article. In addition, the CALGB 80405 trial compares cetuximab and/or bevacizumab (anti-VEGF therapy) together with combination chemotherapy, and there is no combination chemotherapy–alone arm. Alli-ance-banked RNA from patients was tested for RasGRP1 mRNA levels by TaqMan, and RasGRP1 RNA levels could be reliably assayed in 84 patient tumors for which KRAS typing was available as well (Figure 5B).
TaqMan results revealed a range of gradual values of RasGRP1 mRNA expression levels (Figure 5C), with distribution that approximated a Gaussian curve over 8 groups of RasGRP1 expression levels (Figure 5D). Since the RasGRP1 mRNA expression levels in the midrange level were close, we next divided patient tumors into the 25% highest and 25% lowest RasGRP1 expression quartiles (Figures 5, C and D) and compared the clinical outcome between the patients receiving FOLFOX/FOLFIRI alone and FOLFOX/FOLFIRI in combination with cetuximab. We evaluated the distribution of overall sur-vival and RasGRP1 in patients with KRASWT tumors (52 patients). Patients with low tumor expression of RasGRP1 experienced prolonged survival when cetuximab was added to FOLFOX/FOLFIRI (median 40.8 months vs. 20.0 months, P = 0.03) (Figure 5E). This effect was not observed in patients expressing high levels of RasGRP1 (P = 0.85) (Figure 5F and Supplemental Figure 6). As CALGB 80203 was con-ducted before KRAS testing became part of standard of care, we had available data for some KRASmut (n = 32) patients (Figure 5B). Our limited analysis of patients with KRASmut tumors suggests that there was no benefit of addition of cetuximab to FOLFOX/FOLFIRI when CRC patients were stratified on the basis of RasGRP1 expression (Supplemental Figure 5, B and C). It should be noted that we did not observe significant differences in patient survival when we divided patient tumors into the 50% highest and 50% lowest RasGRP1 expression halves (Figure 5, C and D, and data not shown).
In sum, the results of the murine CRC spheroid assays presented in Figure 4 and retrospective analysis of CALGB 80203 data are consistent with the notion that RasGRP1 is a tumor suppressor gene in colonic epitheli-um with aberrant Wnt signaling; and is a marker of the EGFR pathway that has potential relevance in the clinic as both a prognostic and potential predictive factor for the efficacy of anti-EGFR therapy for CRC patients.
DiscussionHere we demonstrate that RasGRP1 is a tumor suppressor in colonic epithelium with aberrant Wnt signal-ing that has value as a prognostic marker to monitor clinical progression of CRC. Moreover, capitalizing on murine CRC spheroids and CRC patient data from the CALGB 80203 clinical trial, we uncover that RasGRP1 is a biomarker that could be relevant for predicting efficacy of anti-EGFR therapy for CRC patients. It is of interest to note that RasGRP1 itself is activated by EGF/EGFR signals (32). This fea-ture may make RasGRP1 particularly useful as a prognostic and as an accompanying biomarker, as the predictive potential is unambiguously coupled to EGFR signals and RasGRP1’s biology. Additional test-ing in randomized trials of EGFR-targeting agents should be considered to confirm tumor expression of RasGRP1 as a predictive biomarker.
Data mining of 5 bioinformatics platforms showed that a decrease in RasGRP1 expression correlated with tumor aggressiveness and poor clinical outcome in human CRC, whereas analysis of SOS1 did not reveal any particular patterns. The parallels between Rasgrp1 and Lrig1 mentioned above are intriguing. Tet-induced expression of the transmembrane molecule Lrig1 dampens EGFR signaling (42) and establish-es balanced intestinal stem cell homeostasis (21). Analysis of TCGA data sets (colorectal, lung, glioblas-toma, and ovarian) revealed that the LRIG1 locus is rarely lost or mutated (50). Nevertheless, LRIG1 expression analysis helps define the tumor type and stage in clear cell renal cell carcinoma (51), and low-lev-el expression of Lrig1 correlates with poor differentiation of squamous cell carcinomas and worse clinical outcome (52). In breast cancer, high expression of Lrig1 has been described in cells of patients with the best clinical outcome, and high Lrig1 expression correlates with a greater chance for relapse-free survival (50). To date, little is known about regulation of LRIG1 expression levels. We have not observed increases in RasGRP1 expression upon EGFR signaling (data not shown), implying that RasGRP1’s negative feedback on EGFR signaling is constant. LRIG1 as a marker in CRC is worthy of future studies, possibly motivated by our present study showing that RasGRP1 expression declines when CRC progresses and becomes more aggressive. How RasGRP1 expression levels decrease or disappear needs to be explored in depth.
9insight.jci.org https://doi.org/10.1172/jci.insight.127552
R E S E A R C H A R T I C L E
Roughly 95% of pancreatic ductal carcinomas (PDACs) contain KRAS mutations, yet EGFR signaling still appears to be essential for KRASmut-driven PDACs in mice (53, 54), and in the clinic erlotinib is beneficial for some PDAC patients (55). These results in PDACs suggest that anti-EGFR therapy should perhaps not be totally discarded when tumors have RAS mutations. Organoid technology has revolutionized cell biological studies on stem cell compartments (15, 16) and is also starting to emerge as a versatile and reliable platform for therapy testing (56–58). We have employed organoids here combined with R-spondin and Wnt surrogate ligands, EGF growth factors, EGFR inhibitors, and genetic deletion of Rasgrp1, since Rasgrp1 inhibitors are not available to date. How to overcome the difficulty of targeting oncogenic RAS mutations is an ongoing challenge, but future organoid and spheroid assays — in the space of the Matrigel droplet, which mimics a 3D tissue — should allow for multidimensional testing of such parameters as RasGRP1 and LRIG1 expression levels and KRAS status, as well as multiple therapies, including but not limited to anti-EGFR.
MethodsBioinformatics and TCGA data mining. For analysis of RasGRP1 mRNA expression in correlation with APC, KRAS, and TP53 mutation statuses, TCGA Colorectal Adenocarcinoma database was obtained and ana-lyzed with cbioPortal (http://www.cbioportal.org/), which is embedded in the TCGA database (https://portal.gdc.cancer.gov/), as we previously described (30).
Figure 4. Deletion of Rasgrp1 alleles makes CRC spheroids susceptible to EGFR inhibition. (A) Scheme of murine CRC organoid generation from colonic tumors. (B) Representative images of CRC organoids from ApcMin/+, ApcMin/+:Rasgrp1WT/–, and ApcMin/+:Rasgrp1–/– colonic adenomas. Each image is a represen-tative example of 40 or more wells of tumor spheroids; 8 wells per mouse tumor and 5 or more mice per genotype. Scale bars: 200 μm. (C and D) Murine ApcMin/+ CRC organoids and ApcMin/+:Rasgrp1–/– CRC organoids were incubated in plain growth media (C) or with exogenous EGF (50 ng/mL) (D). Prolifera-tion rate was evaluated on days 1, 3, and 5 after plating. Data are mean ± SEM and were normalized to day 1. A total of 6 wells for each condition from 2 independent experiments were evaluated (n = 3 ApcMin/+, n = 3 ApcMin/+:Rasgrp1–/– mice). ****P < 0.0001 (2-way ANOVA, Bonferroni’s multiple-comparisons test). (E) ApcMin/+ CRC organoids, ApcMin/+:Rasgrp1–/– CRC organoids, and ApcMin/+:Rasgrp1WT/– CRC organoids were treated with different doses of erlotinib for 3 days. DMSO was used as control. All data were normalized to untreated conditions. A total of 4–5 independent experiments with 4 wells per condition (16–20 wells total) were evaluated. Each dot represents the average of 4 wells, columns indicate the mean, and bars represent the SD (n = 5 ApcMin/+, n = 4 ApcMin/+:Rasgrp1–/– mice). *P < 0.05, **P < 0.01 (Dunnett’s test).

1 0insight.jci.org https://doi.org/10.1172/jci.insight.127552
R E S E A R C H A R T I C L E
Figure 5. RasGRP1 as a biomarker marker for anti-EGFR therapy. (A) Consort overview of CALGB 80203 trial patients receiving the indicated therapy, provided by the Alliance for Clinical Trials in Oncology. (B) Scheme of CALG 80203 trial patients analyzed for RasGRP1 expression by TaqMan and organized on KRAS status. (C) RasGRP1 mRNA levels in 84 patients in the CALGB 80203 clinical trial. Graph shows the quartile of patients with highest RasGRP1 expression in their tumors (RasGRP1 High), as well as the quartile of patients with lowest RasGRP1 expression in their tumors (RasGRP1 Low). Groups were identified by calculating the average of Ct. Standard deviation (SEM) represents the value of repeat of same samples. (D) Patients were divided into 8 groups of stepwise, increasing Ct values. Nonlinear regression (curve fit) showing difference between high- and low-quartile patients. Blue bars represent quartile of patients with high expression of RasGRP1; red bars represent quartile of patients with low expression of RasGRP1. (E) Comparison of FOLFOX/FOLFIRI chemotherapy versus FOLFOX/FOLFIRI with cetuximab for the quartile of patients with lowest RasGRP1 expression in their tumors. Overall survival was graphed in a retrospective analysis of KRASWT CRC patients enrolled in the CALG 80203 trial. Median (med.) survival is indicated for the 2 groups in months; P = 0.03. (F) As in C, but the comparison between FOLFOX/FOLFIRI (dashed lines) and FOLFOX/FOLFIRI with cetuximab (solid lines) is made for the quartile of patients with the highest RasGRP1 expression in their tumors. Median survival was calculated for each group in months; P = 0.85. Log-rank (Mantel-Cox) test was used for statistical analysis in E and F.

1 1insight.jci.org https://doi.org/10.1172/jci.insight.127552
R E S E A R C H A R T I C L E
To evaluate the correlation with RasGRP1 expression in 18 normal colon, 20 primary colonic tumor, and 19 liver metastases, the GSE49355 data set (34) was downloaded from the NCBI Gene Expression Omnibus database. Gene expression values were normalized and annotated by GeneSpring GX 12 soft-ware (Agilent Technologies). One-way ANOVA statistical analysis with Bonferroni’s corrections was car-ried out by use of SPSS 17.0.
For analysis of RasGRP1 as a marker for survival of metastatic CRC patients, we used data from the PETACC-3 clinical trial (ArrayExpress E-MTAB-990) (45). The PETACC-3 data set gathers 752 FFPE samples from CRC patients and is a randomized, multicenter, adjuvant therapy clinical trial that evaluated FU and LV alone or combined with irinotecan in curatively resected stage II and III colon cancer. To assess whether RasGRP1 expression level affects survival of patients with metastatic CRC, we split metastatic CRC patients from PETACC-3 into 2 subgroups: one group of patients with high expression of RasGRP1; one group of patients with low RasGRP1 expression. The threshold used to split the data was the median RasGRP1 expression value, an arbitrary value leading to an equal number of patients in each subgroup. With the same strategy, we also assessed separately the effect of RasGRP1 expression level on survival for KRASWT and KRASmut patients. Survival analyses were done with the R programming language (version 3.3.1) using functions from the “survival” package. Survival curves were drawn following the Kaplan-Mei-er method and compared via the log-rank test. A Cox regression model was fitted on the data in order to compute the hazard ratios between the 2 RasGRP1 groups.
For the MOSAIC study, RNA quality was assessed using an Agilent Bioanalyzer, and only the samples displaying acceptable RNA integrity number (RIN > 7) were kept for sequencing, corresponding to 42 doublets (primary tumors + liver metastases), 8 triplets (normal colon + primary tumors + liver metasta-ses), and 2 unmatched metastases. RNA-Seq libraries were prepared using Illumina TruSeq Stranded Total RNA reagents (catalog RS-122-2201; Illumina) according to the protocol provided by the manufacturer and 400 ng total RNA. We used the Ribo-Zero Human kit (catalog MRZH11124; Illumina) in order to remove cytoplasmic ribosomal RNA. Cluster generation was performed with the libraries using Illumina HiSeq PE Cluster Kit v4 cBot reagents (catalog PE-401-400) and sequencing performed on the Illumina HiSeq 2500 using HiSeq SBS Kit v4 reagents (catalog FC-401-4002). Sequencing data were processed using Illumina Pipeline Software version 1.84. The initial number of reads averaged 123 ± 29 (mean ± SD) million per sample. Reads were first trimmed to remove poly(A) and Illumina TruSeq adapter sequences using cut-adapt (59) and aligned to the human reference hGRC37 genome using the STAR aligner (60). The number of counts was summarized at the gene level using featureCounts (61). Reads that uniquely mapped to the reference genome averaged 86% ± 14%. A non-negligible part of the sequences (30.4% ± 13.8%) mapped to intronic regions and thus were filtered out for subsequent analyses. After filtering out of intronic reads, the rate of reads mapping to ribosomal RNA was 8.1% ± 15.7%, while 88.2% ± 4.1% mapped to exonic protein-coding sequences, corresponding to a final read number of 59 × 106 ± 19 × 106 reads per sample. Read counts were normalized into reads per kilobase per million (RPKM) and log2 transformed after addi-tion of a pseudocount value of 0.001. Two patients were excluded based on principal component analysis, which resulted in a final gene expression matrix of 14,112 genes and 96 samples (corresponding to primary tumors and paired liver metastases of 48 patients).
Antibodies and reagents. Antibodies were obtained from the following sources and used at indicated con-centration: Sos1 (1:1000) from BD Biosciences (catalog 610095, clone 25/SOS1); EGFR (1:1000, catalog 4267) and β-actin (1:1000; catalog 4970) from Cell Signaling Technology; murine Rasgrp1 (m199) (1:500), generated by our laboratory together with Epitomic. Matrigel Growth Factor Reduced (GFR) Basement Membrane Matrix (product 354230) from Corning. Erlotinib HCl (OSI-744) was from Selleck Chemicals.
Mice. ApcMin/+ mice were crossed to Rasgrp1–/– mice (provided by Jim Stone, University of Alberta, Edmonton, Alberta, Canada) to generate mice expressing ApcMin/+ in the context of deletion of 1 and 2 Rasgrp1 alleles: ApcMin/+:Rasgrp1WT/– and ApcMin/+:Rasgrp1–/–, respectively (30). Rag-KO mice were provided by Averil Ma (UCSF). Primers used for genotyping of Rasgrp1 and ApcMin were described previously (30).
CALGB 80203 sample collection and RNA isolation. FFPE baseline tumor samples were collected from patients participating in CALGB 80203 (62). RNA was extracted from an FFPE block of primary colon or rectum tumor as previously described (63).
CALGB 80203 quantitative real-time PCR analysis. TaqMan quantitative PCR was performed for RasGRP1 using the StepOne Real Time PCR System (Applied Biosystems, Life Technologies). Rela-tive amounts of RasGRP1 mRNA expression were normalized to β-actin mRNA and expressed as ΔCT
1 2insight.jci.org https://doi.org/10.1172/jci.insight.127552
R E S E A R C H A R T I C L E
= CT(RasGRP1) – CT(β-actin), where CT is the threshold cycle. The RasGRP1 and β-actin assays were performed as previously described (30). The TaqMan β-actin assay was Hs00357333_g1; the RasGRP1 assay was Hs0096734_m1. All assays were performed in duplicate. Duplicate samples with CT SD > 0.5 cycles and average CT < 35 were rerun for improved quantitative PCR reproducibility. The second run was used if the SD was less than 0.5 cycles. Samples with a final SD > 0.7 cycles were excluded. A final total of 84 samples were used for this analysis.
Mouse organoids: preparation, culture, and imaging. Mouse (6–8 weeks old) colon was isolated and washed in cold PBS. Distal colon was cut longitudinally and into small pieces before being incubated in isolation buffer (PBS 3 mM EDTA) for 60 minutes, rotating at 4°C. Pieces were incubated in 20 mL cold buffer and shaken for 4 minutes. Suspension was collected, and the process was repeated until the suspension was clear (3–4 times). All suspensions were pooled, centrifuged at 500 g for 10 minutes at 4°C, and resuspended in cold PBS–10% FBS. After counting and centrifugation for 5 minutes, 700 g at 4°C, crypts were resus-pended in Matrigel at a concentration of 200–500 crypts per 50 μL Matrigel drop. Murine organoids were cultured in media (adapted from ref. 43) DMEM/F12 with GlutaMAX (Gibco, Life Technologies), penicil-lin/streptomycin (100 μg/mL), N-2 Supplement (1×), B27 Supplement minus Vitamin A (1×; Gibco, Life Technologies), HEPES (10 mM; UCSF Cell Culture Facility), Murine Recombinant Noggin (100 ng/mL; PeproTech), N-acetylcysteine (1 mM; Matrix Scientific), R-Spondin2 (25 nM), Wnt surrogate ligand (0.3 nM; K. Christopher Garcia Laboratory, Stanford University, Stanford, California) (18) and supplemented or not with Murine Recombinant EGF (50 ng/mL; PeproTech). Images were taken on day 11 using a BZ-X700 inverted microscope with a CCD cooling camera and BZ-X analysis software (KEYENCE).
Mouse CRC organoids. Colon was dissected and flushed with cold PBS. Colonic adenomas were collect-ed and incubated in cold PBS 5–10 minutes for gentle washing. As previously described (64), tumors were incubated in chelation buffer (2 mM EDTA [Corning], 5.6 mmol/L Na2HPO4, 8.0 mmol/L KH2PO4, 96.2 mmol/L NaCl, 1.6 mmol/L KCl, 43.4 mmol/L sucrose, 54.9 mmol/L d-sorbitol, 0.5 mmol/L dl-dithioth-reitol [Sigma-Aldrich] in distilled water) for 60 minutes on ice. Chelation buffer was then washed with cold PBS, and tumors were cut in pieces; incubated in digestion buffer (2.5% FBS [Omega Scientific Inc.,], 1 U/mL penicillin, 1 μg/mL streptomycin, 2.5 ng/mL amphotericin B [Sigma-Aldrich], 200 U/mL type IV col-lagenase [Gibco, Life Technologies], 125 μg/mL type II dispase [Sigma-Aldrich] in DMEM) for 2 hours at 37°C; and shaken regularly. Cells were then filtered, counted, and seeded with Matrigel to up to 15,000 cells per 50-μL Matrigel drop. Culture media was then added to the well after 5–10 minutes of polymerization at 37°C. Murine spheroids were cultured in DMEM/F12 with GlutaMAX penicillin/streptomycin (100 μg/mL), HEPES (10 mM), N-2 Supplement (1×), B27 Supplement minus Vitamin A (1X), N-acetylcysteine (1 mM), and amphotericin B (2.5 ng/mL) and supplemented with murine recombinant EGF (50 ng/mL) (64).
RNA extraction and real-time PCR. Total RNA was isolated from human tissue using an RNeasy kit (QIAGEN). RNA was reverse transcribed with random primers (Invitrogen) and Moloney murine leu-kemia virus reverse transcriptase. Mouse RNA extraction from intestinal epithelial cells was done using poly(DT) primers for reverse transcription. Real-time PCR was performed in triplicate using Eppendorf RealPlex2. Gene expression was normalized to GAPDH (human) or β-actin (mouse) and quantified with the comparative CT method according to the manufacturer’s instructions. Probes and primers for RasGRP1 and GAPDH were obtained from Applied Biosystems.
Western blot analysis. Cells were lysed with ice-cold 1% NP-40 supplemented with protease and phos-phatase inhibitors (10 mM sodium fluoride, 2 mM sodium orthovanadate, 0.5 mM EDTA, 2 mM phe-nyl-methylsulfonyl fluoride, 1 mM sodium molybdate, aprotonin [10 mg.mL–1], leupeptin [10 mg.mL–1], pepstatin [1 mg.mL–1]). For colonic organoids, protein extraction was done in 2% NP40. After 30 minutes on ice, lysates were centrifuged, and supernatants were mix with 4× LDS sample buffer (Invitrogen). Pro-tein lysates were separated on precast Tris-glycine gel 4%–12% (Invitrogen), transferred onto PVDF mem-branes, and incubated with primary antibodies of interest. Western blots were visualized with enhanced chemiluminescence and imaging on a Fuji LAS 4000 image station (GE Healthcare).
Extraction of intestinal epithelial cells. Intestinal epithelial cells were isolated as previously described (65). Briefly, small intestine and colon of mice (12–13 weeks old) were dissected, washed with cold PBS, and cut in three 2-cm pieces for small intestine — duodenum, jejunum and ileum; and two pieces for colon — proximal and distal. After cleaning, pieces were incubated on ice in 10 mL cold isolation buffer (2.7 mM KCl; 1 M KCl ; 150 mM NaCl; 1.2 mM KH
2PO
4; 680 mM Na
2HPO
4; 1.5 mM EDTA;
0.5 mM DTT [added fresh] in 1 L ddH2O). After 15 minutes of incubation, the suspension was dis-

1 3insight.jci.org https://doi.org/10.1172/jci.insight.127552
R E S E A R C H A R T I C L E
carded, and tissues were vortexed in 5 mL PBS. The suspension was collected in another tube, and isolation buffer was added to the tissue and incubated 15 minutes on ice. The process was repeated 3 times. The suspension of each repeat was pooled in the collecting tube and centrifuged at 1000 rpm, 4°C for 10 minutes. Cells were resuspended in PBS and separated for protein extraction (2/3 of sus-pension) or RNA extraction (1/3 of suspension).
Viability assays. Organoids were seeded in 96-well clear, flat-bottom plates in a mixture of Matrigel and media for 24 hours at 37°C. Organoids were then incubated with increasing concentrations of erlotinib with 4 wells per condition for 72 hours at 37°C. Viability of organoids was evaluated using CellTiter-Glo 3D as described by the manufacturer (Promega). Luminescence was read on a SpectraMax M5 (Molecular Devices). Values were normalized to those in untreated conditions after removal of background.
Immunohistochemistry. Human tissues were collected, fixed in 4% PFA, and paraffin embedded. Then 5-μm-thick sections were dewaxed in Histo-Clear (National Diagnostics) and rehydrated in graded alcohol baths. Antigen retrieval was performed in a pressure cooker for 10 minutes in 10 mM sodium citrate buffer, pH 6.0. Endogenous peroxidase activity was inhibited with 1.5% H2O2 in methanol for 20 minutes, and sections were washed in PBS. Nonspecific binding sites were blocked in blocking buffer (PBS, pH 7.4, 3% goat serum, 1% BSA, and 0.1% Tween) for 60 minutes at room temperature. Sections were then incubated with primary antibodies diluted in blocking buffer overnight at 4°C. Slides were then washed twice with 0.1% PBS-Tween before incubation in universal immunoperoxidase polymer anti-rabbit N-Histofine (Nichirei Biosciences), used as a secondary reagent. Stainings were visualized with DAB (Sigma-Aldrich), and hematoxylin counterstaining (Shandon Instant Hematoxylin) was per-formed before dehydration. After dehydration, sections were mounted in Cytoseal 60 (Thermo Fisher Scientific). To study the structure of tissue and cell types, H&E staining was performed. Images were acquired using Imager M2 microscope equipped with an AxioCam MRs (Zeiss).
Statistics. Pixel values were transformed into metric values using internal microscope scales. All data are represented as mean ± SEM. All specific statistical analyses and numbers of repeats are provided in the respective figure legends. Unpaired t test was used to compare 2 groups in Figure 3, A–C, and Sup-plemental Figure 6B. For all other experiments, with multiple comparisons, 1-way and 2-way ANOVA followed by a Bonferroni’s or Dunnett’s post hoc test were used for comparisons of 3 or more groups. Log-rank (Mantel-Cox) test was used for Kaplan-Meier survival curves. For all tests, a P value less than 0.05 was considered statistically significant. Analyses and graphs were done using GraphPad Prism 6.
Study approval. Mice were handled according to UCSF Institutional Animal Care and Use Com-mittee regulations, as approved in Roose laboratory mouse protocol AN084051, “Ras Signal Trans-duction in Lymphocytes and Cancer.” Decoded CRC patient samples (UCSF samples) were obtained for TaqMan analysis of RasGRP1 expression under approval of the Committee on Human Research [CHR] as part of approval study title “RasGRP1 in Human T Cell Lymphoma and Colorectal Cancer IRB 12-09467). RSW performed TaqMan analysis of the UCSF CRC patient samples. CALGB 80203 was approved by the Duke University Health System IRB under protocol ID Pro00018430, titled “Mark-ers of Efficacy and Resistance to Cetuximab Treatment in Metastatic Colorectal Cancer: A Correlative Sciences Study of Tissues from CALGB Protocol 80203.” Patient and ethics approval for this study was obtained from the PETACC-3 Translational Research Working Party (PTRW). For the MOSAIC study, bulk RNA-Seq data previously generated by the Colorectal Cancer Metastases Working Group (Sabine Tejpar, unpublished) was examined to compare the expression of RasGRP1 in primary colorectal carci-nomas and their matched liver metastases in previously untreated patients. All tissue was collected under local IRB-approved tissue banking projects at 11 sites within Europe and the USA.
Author contributionsOMG and PD performed the majority of the experiments. CB assisted with in vivo experiments and anal-yses. MM and RSW provided RNA of patient specimens. RSW performed TaqMan analysis of the UCSF CRC patient samples. AJH assisted with RasGRP1 expression in the CALGB 80203 trial. CYW, MRM, ABN, DB, MD, and ST assisted with bioinformatics approaches. YM and KCG provided innovative reagents. PD and JPR conceived the study, analyzed data, and wrote the manuscript. CB, DG, and CYW contributed equally to the manuscript, and their authorship order was assigned alphabetically. All authors commented on the manuscript.
1 4insight.jci.org https://doi.org/10.1172/jci.insight.127552
R E S E A R C H A R T I C L E
AcknowledgmentsThe authors thank the members of the Roose laboratory for active discussion; Marsilius Mues for help with bone marrow reconstitution; Kuang-Yu Jen (University California, Davis) for input in tissue section analysis; and Adam Olsen (UCSF) for suggestions on statistical analyses. Research was supported by the Sandler Pro-gram in Basic Science (start-up) and NIH grant 1P01AI091580-01 (to JPR); NIH grants U10CA180821 and U24CA196171 (to the Alliance for Clinical Trials in Oncology); as well as by grants from the Jeannik M. Little-field Foundation (to RSW), the Ministry of Science and Technology, Taiwan (104-2917-I-006-002 to CYW), and the Howard Hughes Medical Institute, Mathers Foundation, Ludwig Institute for Cancer Research, and NIH grant 1R01DK115728 (to KCG). PD is a Mark Foundation Momentum Fellow supported by a fellow-ship from the Mark Foundation for Cancer Research. Support for the CALGB 80203 analysis comes from an Alliance National Clinical Trials Network (NCTN) grant (U10CA180821, Alliance Chairman’s Grant to Monica Bertagnolli and Suzanne George), as well as an Alliance Biospecimens Grant (U24CA196171, Alliance NCTN Biorepository and Biospecimen Resource Grant to Mark Watson). The content is solely the responsibility of the authors and does not necessarily represent the official views of the NIH.
Address correspondence to: Jeroen P. Roose or Philippe Depeille, UCSF, 513 Parnassus Avenue, Room HSW-1326, San Francisco, California 94143-0452, USA. Phone: 415.476.3977; Email: [email protected] or [email protected].
DG’s present address is: Laboratory of Virology and Genetics (LVG), Ecole Polytechnique de Lausanne (EPFL), Lausanne, Switzerland.
CYW’s present address is: Department of Biochemistry and Molecular Biology, Institute of Basic Medical Sciences, College of Medicine, National Cheng Kung University, Tainan, Taiwan.
1. Siegel RL, Miller KD, Jemal A. Cancer statistics, 2016. CA Cancer J Clin. 2016;66(1):7–30. 2. de Gramont A, et al. Leucovorin and fluorouracil with or without oxaliplatin as first-line treatment in advanced colorectal can-
cer. J Clin Oncol. 2000;18(16):2938–2947. 3. Douillard JY, et al. Irinotecan combined with fluorouracil compared with fluorouracil alone as first-line treatment for metastatic
colorectal cancer: a multicentre randomised trial. Lancet. 2000;355(9209):1041–1047. 4. Zacharakis M, et al. Predictors of survival in stage IV metastatic colorectal cancer. Anticancer Res. 2010;30(2):653–660. 5. Di Fiore F, Sesboüé R, Michel P, Sabourin JC, Frebourg T. Molecular determinants of anti-EGFR sensitivity and resistance in
metastatic colorectal cancer. Br J Cancer. 2010;103(12):1765–1772. 6. Venook AP, et al. Effect of first-line chemotherapy combined with cetuximab or bevacizumab on overall survival in patients
with KRAS wild-type advanced or metastatic colorectal cancer: a randomized clinical trial. JAMA. 2017;317(23):2392–2401. 7. Hatch AJ, et al. Blood-based markers of efficacy and resistance to cetuximab treatment in metastatic colorectal cancer: results
from CALGB 80203 (Alliance). Cancer Med. 2016;5(9):2249–2260. 8. Normanno N, Tejpar S, Morgillo F, De Luca A, Van Cutsem E, Ciardiello F. Implications for KRAS status and EGFR-targeted
therapies in metastatic CRC. Nat Rev Clin Oncol. 2009;6(9):519–527. 9. Wheeler DL, Dunn EF, Harari PM. Understanding resistance to EGFR inhibitors-impact on future treatment strategies. Nat Rev
Clin Oncol. 2010;7(9):493–507. 10. Andreyev HJ, et al. Kirsten ras mutations in patients with colorectal cancer: the ‘RASCAL II’ study. Br J Cancer.
2001;85(5):692–696. 11. Diaz LA, et al. The molecular evolution of acquired resistance to targeted EGFR blockade in colorectal cancers. Nature.
2012;486(7404):537–540. 12. Misale S, et al. Emergence of KRAS mutations and acquired resistance to anti-EGFR therapy in colorectal cancer. Nature.
2012;486(7404):532–536. 13. Cicenas J, et al. KRAS, NRAS and BRAF mutations in colorectal cancer and melanoma. Med Oncol. 2017;34(2):26. 14. van der Flier LG, Clevers H. Stem cells, self-renewal, and differentiation in the intestinal epithelium. Annu Rev Physiol.
2009;71:241–260. 15. Clevers H. Modeling development and disease with organoids. Cell. 2016;165(7):1586–1597. 16. Sato T, Clevers H. Growing self-organizing mini-guts from a single intestinal stem cell: mechanism and applications. Science.
2013;340(6137):1190–1194. 17. de Lau W, et al. Lgr5 homologues associate with Wnt receptors and mediate R-spondin signalling. Nature. 2011;476(7360):293–297. 18. Janda CY, et al. Surrogate Wnt agonists that phenocopy canonical Wnt and β-catenin signalling. Nature. 2017;545(7653):234–237. 19. Aliaga JC, Deschênes C, Beaulieu JF, Calvo EL, Rivard N. Requirement of the MAP kinase cascade for cell cycle progression
and differentiation of human intestinal cells. Am J Physiol. 1999;277(3):G631–G641. 20. Threadgill DW, et al. Targeted disruption of mouse EGF receptor: effect of genetic background on mutant phenotype. Science.
1995;269(5221):230–234. 21. Wong VW, et al. Lrig1 controls intestinal stem-cell homeostasis by negative regulation of ErbB signalling. Nat Cell Biol.

1 5insight.jci.org https://doi.org/10.1172/jci.insight.127552
R E S E A R C H A R T I C L E
2012;14(4):401–408. 22. Powell AE, et al. The pan-ErbB negative regulator Lrig1 is an intestinal stem cell marker that functions as a tumor suppressor.
Cell. 2012;149(1):146–158. 23. Velho S, Haigis KM. Regulation of homeostasis and oncogenesis in the intestinal epithelium by Ras. Exp Cell Res.
2011;317(19):2732–2739. 24. Haigis KM, et al. Differential effects of oncogenic K-Ras and N-Ras on proliferation, differentiation and tumor progression in
the colon. Nat Genet. 2008;40(5):600–608. 25. Vigil D, Cherfils J, Rossman KL, Der CJ. Ras superfamily GEFs and GAPs: validated and tractable targets for cancer therapy?
Nat Rev Cancer. 2010;10(12):842–857. 26. Iwig JS, et al. Structural analysis of autoinhibition in the Ras-specific exchange factor RasGRP1. Elife. 2013;2:e00813. 27. Margarit SM, et al. Structural evidence for feedback activation by Ras.GTP of the Ras-specific nucleotide exchange factor SOS.
Cell. 2003;112(5):685–695. 28. Das J, et al. Digital signaling and hysteresis characterize ras activation in lymphoid cells. Cell. 2009;136(2):337–351. 29. Vercoulen Y, et al. A Histidine pH sensor regulates activation of the Ras-specific guanine nucleotide exchange factor RasGRP1.
Elife. 2017;6:e29002. 30. Depeille P, et al. RasGRP1 opposes proliferative EGFR-SOS1-Ras signals and restricts intestinal epithelial cell growth. Nat Cell
Biol. 2015;17(6):804–815. 31. Jeng HH, Taylor LJ, Bar-Sagi D. Sos-mediated cross-activation of wild-type Ras by oncogenic Ras is essential for tumorigenesis.
Nat Commun. 2012;3:1168. 32. Depeille P, Warren RS, Roose JP. Unexpected insights for anti-EGFR cancer therapy. Oncotarget. 2015;6(22):18746–18747. 33. Depeille P, Roose JP. Flavors of EGFR-Ras signals impacting intestinal homeostasis. Cell Cycle. 2015;14(20):3205–3206. 34. Del Rio M, et al. Gene expression signature in advanced colorectal cancer patients select drugs and response for the use of leu-
covorin, fluorouracil, and irinotecan. J Clin Oncol. 2007;25(7):773–780. 35. Ksionda O, Limnander A, Roose JP. RasGRP Ras guanine nucleotide exchange factors in cancer. Front Biol (Beijing).
2013;8(5):508–532. 36. Daley SR, et al. Rasgrp1 mutation increases naive T-cell CD44 expression and drives mTOR-dependent accumulation of
Helios+ T cells and autoantibodies. Elife. 2013;2:e01020. 37. Sansom OJ, et al. Loss of Apc in vivo immediately perturbs Wnt signaling, differentiation, and migration. Genes Dev.
2004;18(12):1385–1390. 38. Moser AR, Pitot HC, Dove WF. A dominant mutation that predisposes to multiple intestinal neoplasia in the mouse. Science.
1990;247(4940):322–324. 39. Su LK, et al. Multiple intestinal neoplasia caused by a mutation in the murine homolog of the APC gene. Science.
1992;256(5057):668–670. 40. Taketo MM, Edelmann W. Mouse models of colon cancer. Gastroenterology. 2009;136(3):780–798. 41. Dower NA, et al. RasGRP is essential for mouse thymocyte differentiation and TCR signaling. Nat Immunol. 2000;1(4):317–321. 42. Laederich MB, et al. The leucine-rich repeat protein LRIG1 is a negative regulator of ErbB family receptor tyrosine kinases. J
Biol Chem. 2004;279(45):47050–47056. 43. Sato T, et al. Long-term expansion of epithelial organoids from human colon, adenoma, adenocarcinoma, and Barrett’s epithe-
lium. Gastroenterology. 2011;141(5):1762–1772. 44. Fearon ER, Vogelstein B. A genetic model for colorectal tumorigenesis. Cell. 1990;61(5):759–767. 45. Van Cutsem E, et al. Randomized phase III trial comparing biweekly infusional fluorouracil/leucovorin alone or with irinotec-
an in the adjuvant treatment of stage III colon cancer: PETACC-3. J Clin Oncol. 2009;27(19):3117–3125. 46. Popovici V, et al. Identification of a poor-prognosis BRAF-mutant-like population of patients with colon cancer. J Clin Oncol.
2012;30(12):1288–1295. 47. Gupta R, Sinha S, Paul RN. The impact of microsatellite stability status in colorectal cancer. Curr Probl Cancer. 2018;42(6):548–559. 48. Popat S, Hubner R, Houlston RS. Systematic review of microsatellite instability and colorectal cancer prognosis. J Clin Oncol.
2005;23(3):609–618. 49. Roberts RB, et al. Importance of epidermal growth factor receptor signaling in establishment of adenomas and maintenance of
carcinomas during intestinal tumorigenesis. Proc Natl Acad Sci USA. 2002;99(3):1521–1526. 50. Wang Y, Poulin EJ, Coffey RJ. LRIG1 is a triple threat: ERBB negative regulator, intestinal stem cell marker and tumour sup-
pressor. Br J Cancer. 2013;108(9):1765–1770. 51. Thomasson M, Hedman H, Ljungberg B, Henriksson R. Gene expression pattern of the epidermal growth factor receptor fami-
ly and LRIG1 in renal cell carcinoma. BMC Res Notes. 2012;5:216. 52. Tanemura A, Nagasawa T, Inui S, Itami S. LRIG-1 provides a novel prognostic predictor in squamous cell carcinoma of the
skin: immunohistochemical analysis for 38 cases. Dermatol Surg. 2005;31(4):423–430. 53. Ardito CM, et al. EGF receptor is required for KRAS-induced pancreatic tumorigenesis. Cancer Cell. 2012;22(3):304–317. 54. Navas C, Hernández-Porras I, Schuhmacher AJ, Sibilia M, Guerra C, Barbacid M. EGF receptor signaling is essential for k-ras
oncogene-driven pancreatic ductal adenocarcinoma. Cancer Cell. 2012;22(3):318–330. 55. Moore MJ, et al. Erlotinib plus gemcitabine compared with gemcitabine alone in patients with advanced pancreatic cancer: a
phase III trial of the National Cancer Institute of Canada Clinical Trials Group. J Clin Oncol. 2007;25(15):1960–1966. 56. Muranen T, et al. Inhibition of PI3K/mTOR leads to adaptive resistance in matrix-attached cancer cells. Cancer Cell.
2012;21(2):227–239. 57. Schwank G, Clevers H. CRISPR/Cas9-mediated genome editing of mouse small intestinal organoids. Methods Mol Biol.
2016;1422:3–11. 58. Takebe T, et al. Vascularized and functional human liver from an iPSC-derived organ bud transplant. Nature.
2013;499(7459):481–484. 59. Martin M. Cutadapt removes adapter sequences from high-throughput sequencing reads. EMBnet.journal. 2011;17(1):10–12. 60. Dobin A, et al. STAR: ultrafast universal RNA-seq aligner. Bioinformatics. 2013;29(1):15–21.
1 6insight.jci.org https://doi.org/10.1172/jci.insight.127552
R E S E A R C H A R T I C L E
61. Liao Y, Smyth GK, Shi W. featureCounts: an efficient general purpose program for assigning sequence reads to genomic fea-tures. Bioinformatics. 2014;30(7):923–930.
62. Venook A, et al. Phase III study of irinotecan/5FU/LV (FOLFIRI) or oxaliplatin/5FU/LV (FOLFOX) ± cetuximab for patients (pts) with untreated metastatic adenocarcinoma of the colon or rectum (MCRC): CALGB 80203 preliminary results. J Clin Oncol. 2006;24(18 suppl):3509.
63. Cushman SM, et al. Gene expression markers of efficacy and resistance to cetuximab treatment in metastatic colorectal cancer: results from CALGB 80203 (Alliance). Clin Cancer Res. 2015;21(5):1078–1086.
64. Xue X, Shah YM. In vitro organoid culture of primary mouse colon tumors. J Vis Exp. 2013;(75):e50210. 65. Zeineldin M, Neufeld K. Isolation of epithelial cells from mouse gastrointestinal tract for western blot or RNA analysis. Bio Pro-
toc. 2012;2(22):e292.