Rapid Identification of Bacteria with a Disposable...
6
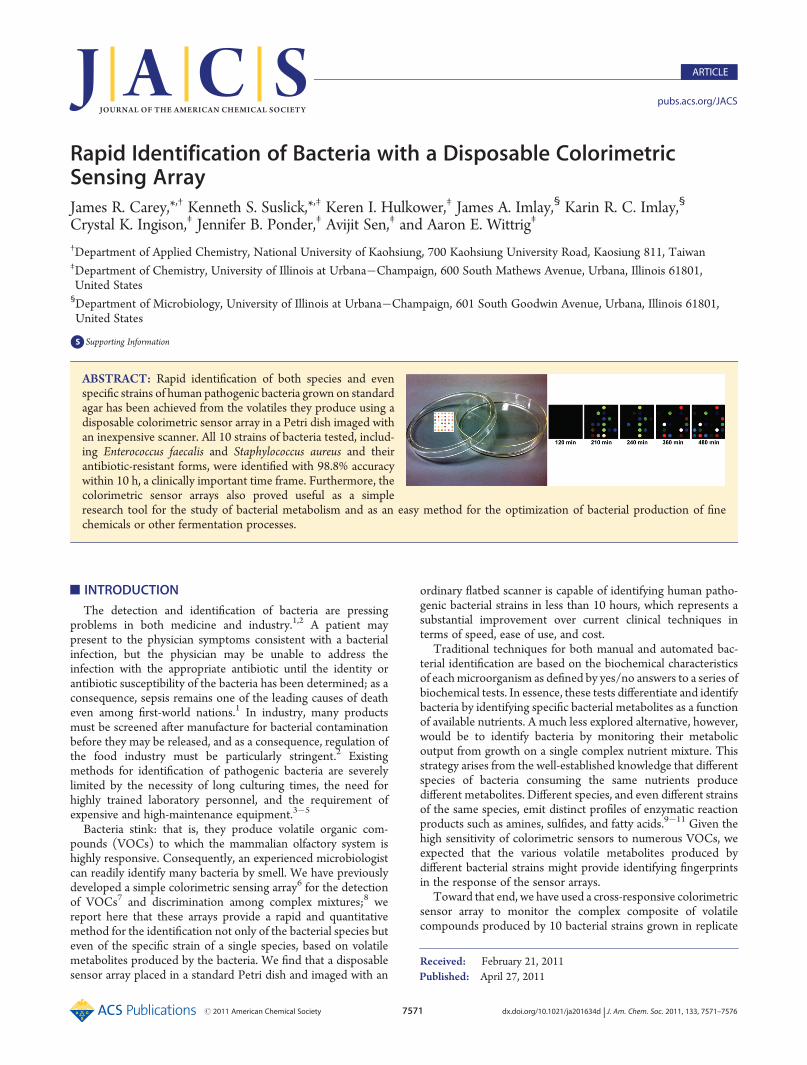
Published: April 27, 2011 r2011 American Chemical Society 7571 dx.doi.org/10.1021/ja201634d | J. Am. Chem. Soc. 2011, 133, 7571–7576 ARTICLE pubs.acs.org/JACS Rapid Identification of Bacteria with a Disposable Colorimetric Sensing Array James R. Carey,* ,† Kenneth S. Suslick,* ,‡ Keren I. Hulkower, ‡ James A. Imlay, § Karin R. C. Imlay, § Crystal K. Ingison, ‡ Jennifer B. Ponder, ‡ Avijit Sen, ‡ and Aaron E. Wittrig ‡ † Department of Applied Chemistry, National University of Kaohsiung, 700 Kaohsiung University Road, Kaosiung 811, Taiwan ‡ Department of Chemistry, University of Illinois at UrbanaChampaign, 600 South Mathews Avenue, Urbana, Illinois 61801, United States § Department of Microbiology, University of Illinois at UrbanaChampaign, 601 South Goodwin Avenue, Urbana, Illinois 61801, United States b S Supporting Information ’ INTRODUCTION The detection and identification of bacteria are pressing problems in both medicine and industry. 1,2 A patient may present to the physician symptoms consistent with a bacterial infection, but the physician may be unable to address the infection with the appropriate antibiotic until the identity or antibiotic susceptibility of the bacteria has been determined; as a consequence, sepsis remains one of the leading causes of death even among first-world nations. 1 In industry, many products must be screened after manufacture for bacterial contamination before they may be released, and as a consequence, regulation of the food industry must be particularly stringent. 2 Existing methods for identification of pathogenic bacteria are severely limited by the necessity of long culturing times, the need for highly trained laboratory personnel, and the requirement of expensive and high-maintenance equipment. 35 Bacteria stink: that is, they produce volatile organic com- pounds (VOCs) to which the mammalian olfactory system is highly responsive. Consequently, an experienced microbiologist can readily identify many bacteria by smell. We have previously developed a simple colorimetric sensing array 6 for the detection of VOCs 7 and discrimination among complex mixtures; 8 we report here that these arrays provide a rapid and quantitative method for the identification not only of the bacterial species but even of the specific strain of a single species, based on volatile metabolites produced by the bacteria. We find that a disposable sensor array placed in a standard Petri dish and imaged with an ordinary flatbed scanner is capable of identifying human patho- genic bacterial strains in less than 10 hours, which represents a substantial improvement over current clinical techniques in terms of speed, ease of use, and cost. Traditional techniques for both manual and automated bac- terial identification are based on the biochemical characteristics of each microorganism as defined by yes/no answers to a series of biochemical tests. In essence, these tests differentiate and identify bacteria by identifying specific bacterial metabolites as a function of available nutrients. A much less explored alternative, however, would be to identify bacteria by monitoring their metabolic output from growth on a single complex nutrient mixture. This strategy arises from the well-established knowledge that different species of bacteria consuming the same nutrients produce different metabolites. Different species, and even different strains of the same species, emit distinct profiles of enzymatic reaction products such as amines, sulfides, and fatty acids. 911 Given the high sensitivity of colorimetric sensors to numerous VOCs, we expected that the various volatile metabolites produced by different bacterial strains might provide identifying fingerprints in the response of the sensor arrays. Toward that end, we have used a cross-responsive colorimetric sensor array to monitor the complex composite of volatile compounds produced by 10 bacterial strains grown in replicate Received: February 21, 2011 ABSTRACT: Rapid identification of both species and even specific strains of human pathogenic bacteria grown on standard agar has been achieved from the volatiles they produce using a disposable colorimetric sensor array in a Petri dish imaged with an inexpensive scanner. All 10 strains of bacteria tested, includ- ing Enterococcus faecalis and Staphylococcus aureus and their antibiotic-resistant forms, were identified with 98.8% accuracy within 10 h, a clinically important time frame. Furthermore, the colorimetric sensor arrays also proved useful as a simple research tool for the study of bacterial metabolism and as an easy method for the optimization of bacterial production of fine chemicals or other fermentation processes.
Transcript of Rapid Identification of Bacteria with a Disposable...
Published: April 27, 2011
r 2011 American Chemical Society 7571 dx.doi.org/10.1021/ja201634d | J. Am. Chem. Soc. 2011, 133, 7571–7576
ARTICLE
pubs.acs.org/JACS
Rapid Identification of Bacteria with a Disposable ColorimetricSensing ArrayJames R. Carey,*,† Kenneth S. Suslick,*,‡ Keren I. Hulkower,‡ James A. Imlay,§ Karin R. C. Imlay,§
Crystal K. Ingison,‡ Jennifer B. Ponder,‡ Avijit Sen,‡ and Aaron E. Wittrig‡
†Department of Applied Chemistry, National University of Kaohsiung, 700 Kaohsiung University Road, Kaosiung 811, Taiwan‡Department of Chemistry, University of Illinois at Urbana�Champaign, 600 South Mathews Avenue, Urbana, Illinois 61801,United States§Department of Microbiology, University of Illinois at Urbana�Champaign, 601 South Goodwin Avenue, Urbana, Illinois 61801,United States
bS Supporting Information
’ INTRODUCTION
The detection and identification of bacteria are pressingproblems in both medicine and industry.1,2 A patient maypresent to the physician symptoms consistent with a bacterialinfection, but the physician may be unable to address theinfection with the appropriate antibiotic until the identity orantibiotic susceptibility of the bacteria has been determined; as aconsequence, sepsis remains one of the leading causes of deatheven among first-world nations.1 In industry, many productsmust be screened after manufacture for bacterial contaminationbefore they may be released, and as a consequence, regulation ofthe food industry must be particularly stringent.2 Existingmethods for identification of pathogenic bacteria are severelylimited by the necessity of long culturing times, the need forhighly trained laboratory personnel, and the requirement ofexpensive and high-maintenance equipment.3�5
Bacteria stink: that is, they produce volatile organic com-pounds (VOCs) to which the mammalian olfactory system ishighly responsive. Consequently, an experienced microbiologistcan readily identify many bacteria by smell. We have previouslydeveloped a simple colorimetric sensing array6 for the detectionof VOCs7 and discrimination among complex mixtures;8 wereport here that these arrays provide a rapid and quantitativemethod for the identification not only of the bacterial species buteven of the specific strain of a single species, based on volatilemetabolites produced by the bacteria. We find that a disposablesensor array placed in a standard Petri dish and imaged with an
ordinary flatbed scanner is capable of identifying human patho-genic bacterial strains in less than 10 hours, which represents asubstantial improvement over current clinical techniques interms of speed, ease of use, and cost.
Traditional techniques for both manual and automated bac-terial identification are based on the biochemical characteristicsof eachmicroorganism as defined by yes/no answers to a series ofbiochemical tests. In essence, these tests differentiate and identifybacteria by identifying specific bacterial metabolites as a functionof available nutrients. A much less explored alternative, however,would be to identify bacteria by monitoring their metabolicoutput from growth on a single complex nutrient mixture. Thisstrategy arises from the well-established knowledge that differentspecies of bacteria consuming the same nutrients producedifferent metabolites. Different species, and even different strainsof the same species, emit distinct profiles of enzymatic reactionproducts such as amines, sulfides, and fatty acids.9�11 Given thehigh sensitivity of colorimetric sensors to numerous VOCs, weexpected that the various volatile metabolites produced bydifferent bacterial strains might provide identifying fingerprintsin the response of the sensor arrays.
Toward that end, we have used a cross-responsive colorimetricsensor array to monitor the complex composite of volatilecompounds produced by 10 bacterial strains grown in replicate
Received: February 21, 2011
ABSTRACT: Rapid identification of both species and evenspecific strains of human pathogenic bacteria grown on standardagar has been achieved from the volatiles they produce using adisposable colorimetric sensor array in a Petri dish imaged withan inexpensive scanner. All 10 strains of bacteria tested, includ-ing Enterococcus faecalis and Staphylococcus aureus and theirantibiotic-resistant forms, were identified with 98.8% accuracywithin 10 h, a clinically important time frame. Furthermore, thecolorimetric sensor arrays also proved useful as a simpleresearch tool for the study of bacterial metabolism and as an easy method for the optimization of bacterial production of finechemicals or other fermentation processes.
7572 dx.doi.org/10.1021/ja201634d |J. Am. Chem. Soc. 2011, 133, 7571–7576
Journal of the American Chemical Society ARTICLE
on solid media in closed Petri dishes. The sensor arrays consist of36 chemically responsive dyes, including metalloporphyrins, pHindicators, metal salts, and solvatochromic dyes, that changecolor when exposed to a broad range of volatile analytes. Giventhe wide range of VOCs produced by bacteria,9�11 the chemicaldiversity of the sensor elements present in our array is critical toits capability to respond to broad classes of individual analytesand its ability to distinguish among complex mixtures.
’EXPERIMENTAL SECTION
Bacteria. Bacterial strains were purchased from the American TypeCulture Collection (Manassas, VA) and were cultured following man-ufacturer protocols before use. Bacteria were grown in tryptic soy broth(TSB) and plated during log phase growth on tryptic soy agar containing5% sheep blood (Becton Dickinson, Franklin Lakes, NJ). Bacterialsuspensions were prepared by inoculating 5 mL of TSB with a singlecolony and allowing it to grow overnight. A subculture then wasprepared in 5 mL of fresh TSB and shaken at 37 �C for 3 h to achievethe desired inoculum density of 0.5�5 on theMcFarland turbidity scale.This equates to∼3.0� 108�1.5� 109 CFU/mL. Next, 10�250 μL ofthe subculture was spread onto a 60 mm TSA/sheep blood Petri dish. Acontrol (10�250 μL of TSB broth without the bacterial inoculum) wasconducted in parallel for each experiment.Colorimetric Sensor Array. The disposable colorimetric sensor
array and its construction have been previously described,7 and thespecific dyes used for this study are listed in the Supporting Information,Table S1. An array was mounted in an inert platform that was insertedinto the lid of the Petri dish. The Petri dish was closed and inverted ontoan ordinary flatbed scanner (as shown in Figure 1) housed in anincubator at 35�37 �C; the printed side of the array faced toward thescanner. Data were collected using an Epson Perfection 3490 scannerevery 30 min. Color difference maps were generated by averaging theRGB color values for the center of each spot and subtracting from themthe RGB averages for the baseline image:ΔR,ΔG,ΔB, i.e. red value afterexposure minus red value at 90 min, etc. Substantial sensor array colorchanges arising from the media occur upon exposure as the mediaequilibrates to the incubator temperature of 37 �C, so the baseline imagewas taken at 90 min, which was sufficient for complete equilibration butbefore any significant bacterial growth had occurred. A completedatabase is available in the Supporting Information.
’RESULTS AND DISCUSSION
Current Clinical Bacterial Detection.Bloodstream infectionsby bacteria (i.e., bacteremia) are among the most serious medicalproblems because of their significantmorbidity andmortality.1 Inthe United States, an estimated 750,000 patients annually developbloodstream infections, with associated mortality rates rangingfrom 14 to 50%. Sepsis and septic shock are the tenth leadingcause of death in the U.S. and the third most common cause ofdeath in Germany; furthermore, sepsis and related complicationsrepresent a significant economic burden, with an estimatedannual cost beyond $17 billion in the U.S. alone.1
There remain major unmet needs to shorten and improvecurrent clinical and laboratory methods for the detection andidentification of bloodstream infections, and molecular diagnosticmethods (ranging frommass spectral analysis to PCR to peptide�nucleic acid fluorescent probes, etc.) have yet to have a majorimpact on such diagnoses.3d Blood cultures remain the “goldstandard” for the diagnosis of bacteremia.1,2 Current standardclinical procedures2 start with culturing (generally in liquid growthmedia), for example of blood samples, which generally takes
24�48 h to confirm the presence of bacteria but can take muchlonger for slow-growing bacteria (e.g., tuberculosis generallyrequires more than a week). Microorganisms taken from positiveblood cultures are then subjected to rapid gram staining (∼10min)but then must be subcultured and analyzed by culture-basedsystems such as the Analytical Profile Index (API) test or antibioticsusceptibility tests (e.g., bioM�erieux’s automated VITEK system),which require another 18�48 h.3 The reader is referred to anexcellent recent review of clinical procedures by Riedel andCarroll.1a Nucleic-acid-based identification,4,5 such as fluorescentin situ hybridization (FISH), can be performed directly frompositive blood cultures that require only 6 h, although identifica-tion by culture-based systems is needed for confirmation.4d,5e,f
Bacterial Detection by Electronic Nose. There have beenvarious studies using “electronic nose” technologies12,13 (i.e., electro-nic sensor arraysmade from conductive polymers, metal oxides, etc.)for headspace analysis in attempts to identify bacterial strains.14�16
Most such studies use a single time sampling of the headspace over amature bacterial culture.15 The temporal profile of the gasesproduced in a closed culture environment, however, providesvaluable additional information for bacterial identification. In addi-tion, the VOCs produced by bacteria in a closed environmentapproximate an integral of growth and may therefore improve therapidity of analysis. In those few studies in which the headspace wassampled at multiple time points,16 bacterial discrimination wasgenerally still quite limited. In part, this is due to the inherentlimitations6 in low dimensionality of prior array technology,12,13
which relies primarily on weak and nonselective analyte�sensorinteractions: in general, prior electronic nose technology needs onlytwodimensions, or atmost three, to capture >95%of the total datasetvariance. As such, previous bacterial identification efforts withtraditional electronic nose technology have typically required com-plex pattern recognition algorithms in order to achieve modestsuccess, even when attempting to classify small numbers of bacterialspecies.14�16
Colorimetric Sensor Arrays. The colorimetric sensor arraysare disposable, one-time-use sensors that are simply placed in theheadspace of bacterial cultures and imaged with an ordinaryflatbed scanner at multiple time points during bacteria growth(Figure 1). The responses of the chemically responsive dyes usedin the array are in general reversible. As shown below, the array
Figure 1. (a) Colorimetric sensor array used for bacterial identificationexperiments; details provided in Supporting Information Table S1.(b) Schematic of the experimental apparatus consisting of an invertedclosed Petri dish containing growth media (tryptic soy agar (TSA) with5% sheep blood) upon which was spread the appropriate liquid bacterialculture, an array positioned in the headspace, and an ordinary flatbedscanner. The array was scanned and images collected as a functionof time.

7573 dx.doi.org/10.1021/ja201634d |J. Am. Chem. Soc. 2011, 133, 7571–7576
Journal of the American Chemical Society ARTICLE
can thereforemonitor changes in the volatile metabolites evolvedby each bacterial strain over time and thereby differentiate onebacterial species from another.Representative data arising from exposure of the sensor array
to Escherichia coli are shown in Figure 2, as both color differencemaps and a time response profile that show the change in spotcolors as a function of bacterial growth time. Several notablefeatures are readily apparent in Figure 2. First, there is a time lag(∼150 min in this case) before appreciable signal is observedabove baseline. As will be shown below, the duration of this lagis species and strain dependent. Once signal is observed, itevolves through several stages; different volatile analytes appearto be generated at different points during growth. Note, forexample, the steeply negative color changes occurring between300 and 400 min. In addition, several color channels passthrough a maximum or minimum and then reverse direction,returning to their baseline values or crossing the baseline tochange sign. This too implies changes in the nature of volatilesemitted over time.
Time response profiles were collected in multiple replicates fornine additional bacterial strains (6�24 replicates per strain, cf.Supporting Information Table S2). Representative color differencemaps and time response profiles for each strain are shown inFigures 3and 4, respectively. All quantitative analyses were based on the fulldigital data, which are provided in Supporting Information Table S3.Array Response to Bacterial Growth. As illustrated in
Figures 3 and 4, each strain of bacterium has its own individualcolor change fingerprint. Even by simple visual examination ofthe color difference map (Figure 3) or of the time responseprofiles (Figure 4), all 10 of the bacterial strains are readilydifferentiated; quantitative classification (discussed below) is
Figure 2. Color difference maps and time response profile resultingfrom colorimetric sensor array exposure to a growing culture of E. coli,American Type Culture Collection (ATCC) No. 25922. (a) The colordifference maps (i.e., ΔR, ΔG, ΔB) at select times were generated bysubtracting the average RGB of each spot from a baseline image (taken at90 min). For the purpose of effective visualization only, the color rangeshown in the color range maps is expanded from RGB values of 0�31 to0�255. (b) The color change values versus time plotted for all colorchannels (ΔR,ΔG, andΔB values for each spot, i.e., 108 color channels)at each time point.
Figure 3. Color difference maps for 10 different bacterial strainsresulting from colorimetric sensor array exposure to Petri dish growingcultures after 480min. The color range shown is the same as in Figure 2a.
Figure 4. Time response profiles for 10 different bacterial strains (nameand ATCC number given in each panel). For each bacterial strain, the colorchange values versus time are plotted for all color channels at each timepoint.

7574 dx.doi.org/10.1021/ja201634d |J. Am. Chem. Soc. 2011, 133, 7571–7576
Journal of the American Chemical Society ARTICLE
highly accurate using standard statistical methods. This includesthe differentiation of Staphylococcus aureus from a methicillin-resistant S. aureus (MRSA), as well as Enterococcus faecalis from avancomycin-resistant E. faecalis (VRE). There are, moreover,genera- and species-based resemblances. This is most apparent inthe two strains of E. coli and E. faecalis, respectively, which showthe greatest interpair similarity in the time response profiles(Figure 4).There are at least three possible closely related contributions to
the changes and reversal of color features in the array, each of whichreflect the relationship between the chemical input and output ofbacteria. The dominant contributor is likely to be conventionaldiauxie, in which the bacteria consume one nutrient first and thenswitch to alternate nutrients when the first is exhausted:17 as theinput nutrients change, so too would the evolved volatiles. Con-sistentwith this, the response profiles do depend strongly on the typeof solid media (such as TSA, TSA/sheep blood or Luria�Bertani)used as a nutrient source. A second contributor to the temporalchanges in the array response (which is generally reversible7) may bethe bacterial consumption of a previously excreted product. Forexample, many bacteria ferment rich nutrients (e.g., glucose) andexcrete acetate; acetate can then, upon the exhaustion of bettercarbon sources, be consumed and oxidized to carbon dioxide.18 Athird possibility is a transition from aerobic to anaerobic growth, itselfa form of diauxie.19 Chemical analysis of the complex mixture ofvolatiles produced during bacterial growth presents a significantchallenge for conventional component-by-component analyses (e.g.,GC-MS):9�11 fortunately, one need not know the identities of theindividual volatile products for the identification of the bacteria usinga sensor array approach, which gives a composite response to thecomplex mixture of bacterial metabolites.The complex structures observed in the bacterial response
profiles underscore the importance of incorporating broadchemical diversity in a single sensor array. These structures alsoemphasize the value in having a reversible, real-time sensorcontinuously positioned in the headspace of growing bacterialcultures. The additional advantage of having a disposable,inexpensive sensor array allows for the facile monitoring ofbacterial cultures individually and continuously.Quantitative Classification. Classification of specific bacter-
ial strains based on the colorimetric sensor array data wassuccessfully accomplished using a variety of independent tech-niques. For quantitative analysis, the color change values for eachexperiment were analyzed as “time-stacked” vectors in order tocapture the temporal behavior of the response profiles. Theentire time-stacked vector, ν, from a single experiment is given byeq 1, using images collected every 30 min for 10 h, with the90 min image as the baseline for evolution of differences in red,green, and blue values for all 36 spots:
ν ¼ ΔR1, 120min,ΔG1, 120min,ΔB1, 120min,
ΔR2, 120min,ΔG2, 120min,ΔB2, 120min, ...
ΔR36, 120min,ΔG36, 120min,ΔB36, 120min,
ΔR1, 150min,ΔG1, 150min,ΔB1, 150min, ... ...
ΔR36, 600min,ΔG36, 600min,ΔB36, 600min ð1ÞSurprisingly, accurate identification was possible even using
simple Euclidean distances, which compares only the overall totalresponse of the array. Average time-stacked vectors were calcu-lated for each strain of bacteria, and the Euclidean distancebetween each of the 164 individual experimental vectors and each
of the average vectors was determined. Each input experimentalvector was classified as the strainwhose average vector was nearest.Using the time stack data from 90 to 600 min post innoculation,the correct classification was achieved for 162 of the 164 experi-ments (i.e., 98.8% accuracy); the only two misclassifications werebetween E. faecalis and its vancomycin resistant mutant (VRE).For the same experiments, the classification accuracy was 95% at420 min culturing time and 85% at 300 min.Beyond using just the Euclidean distance of the array response,
there is much greater information available in the variance of thespecific spots of the array. The ability of the colorimetric sensorarray to discriminate among different bacteria is due, in part, to thehigh dimensionality of the data. Principal component analysis(PCA) uses the variance in the array response to evaluate therelative contributions of independent dimensions and generatesoptimized linear combinations of the original 108 dimensions so asto maximize the amount of variance in as few dimensions aspossible (46�49). Using standard PCA, the data from 164experiments were analyzed. As we have observed with colorimetricsensor arrays applied to many other systems,6�8 the data haveexceptionally high dispersion, requiring 7 and 23 dimensions tocapture 90% and 95% of the total variance, respectively (SI FigureS1 provides the PCA scree plot). The first three dimensions inPCA space account for only 79% of the total variance. None-theless, a three-dimensional PCA score plot (Figure 5) shows verygood clustering of 164 experimental trials on the 10 bacteria.The extremely high dispersion of our colorimetric sensor array
data reflects the wide range of chemical-property space beingprobed by the choice of 36 chemically responsive dyes. Conse-quently, chemically diverse mixtures of volatiles produced bybacteria are easily recognizable, and even closely related bacteriacan be distinguished. In contrast, data from most prior electronicnose technologies are dominated by only two or three independent
Figure 5. PCA score plot using the three most important principalcomponents based on all 164 trials of 10 bacterial strains and controls. Theresolution between bacterial classes is in fact much better than can beshown by any three-dimensional PCA plot because the first three principalcomponents account for only 79% of the total variance. Color code: black,S. aureus; red, MRSA; dark green, S. epidermidis; purple, S. sciuri; orange,P. aeruginosa; white, E. faecium; light blue, E. faecalis; gray, E. faecalis VRE;yellow, E. coli 25922; light green, E. coli 53502; dark blue, control.
7575 dx.doi.org/10.1021/ja201634d |J. Am. Chem. Soc. 2011, 133, 7571–7576
Journal of the American Chemical Society ARTICLE
dimensions (one of which, analyte hydrophobicity, generally ac-counts for >90% of total variance); this is the inherent result ofrelying on van der Waals and other weak interactions for molecularrecognition.Given the high dimensionality of data from the colorimetric
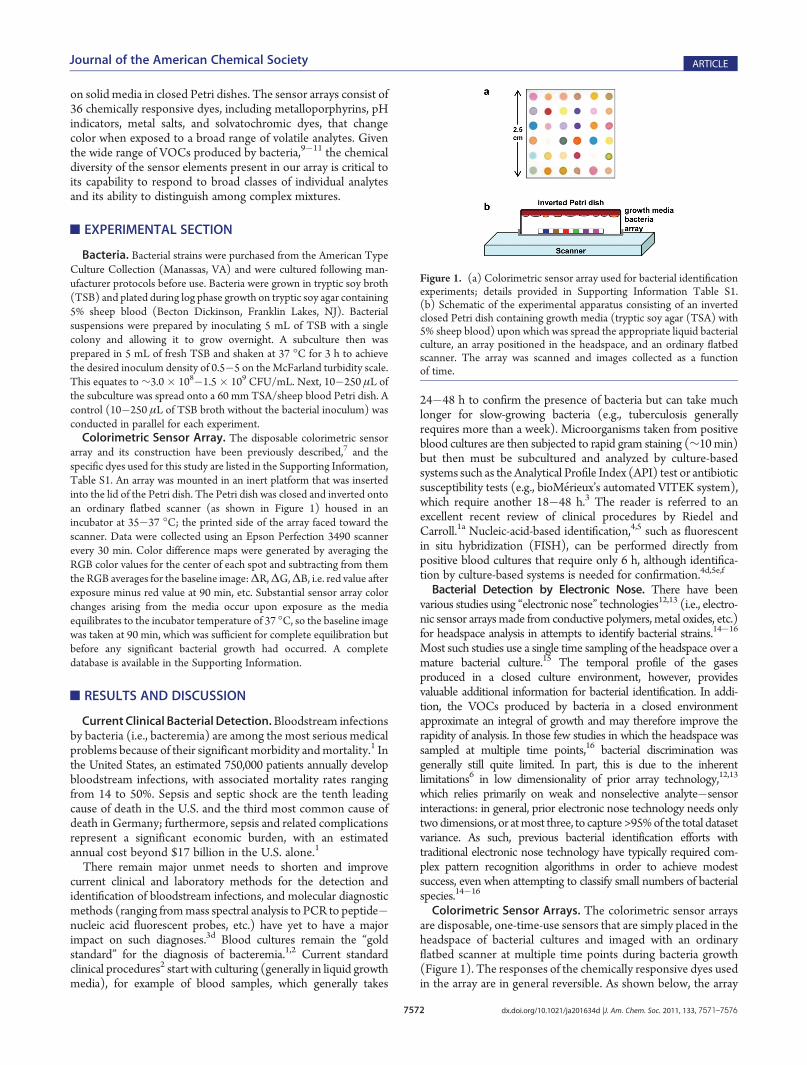
sensor array, the usual two- or three-dimensional PCA plots (e.g.,Figure 5) cannot adequately represent the discrimination amongexperimental trials. Instead, we prefer the use of another quitestandard chemometric approach, hierarchical cluster analysis(HCA), which is based on the grouping of the analyte vectorsaccording to their spatial distances in their full vector space.20
HCA has the advantages of being model-free (unlike, forexamples, linear discriminant analysis or neural nets) and ofusing the full dimensionality of the data. As shown in Figure 6,HCA generates dendrograms based on clustering of the arrayresponse data. Excellent classification is observed, with threemisclassifications among the 164 trials (all three confusions arebetween E. faecalis and its vancomycin-resistant mutant, VRE).To test quantitatively the ability of a more sophisticated
statistical model to classify new inputs (i.e., unknown cultures)as would be required in medical diagnostics, a randomized, strain-proportional 70% of the time stacks was used to train a Bayesianlinear classifier in PCA space.21 This classifier was then given theremainder of the data, unlabeled, to be classified as one of the 11strains, and the rate of correct classification was recorded. This wasrepeated 1000 times, randomizing the designated 70% each time.
Analysis using the first seven principal components (whichcaptured 90% of the total variance) produced 99.2% correctclassification. Twenty-three principal components (capturing95% of the variance) produced 99.5% correct classification.The changes in the array response as a function of time for
each bacterial strain imply that each strain of bacterium producesdifferent volatile metabolic products at different rates. Thissuggests in turn that such arrays may also prove useful as aninexpensive research tool for the study of bacterial metabolism.In addition, the colorimetric sensor arrays are likely to provide aneasy method for the optimization of bacterial production of finechemicals or other fermentation processes.The biomedical applications of this colorimetric sensing array
technology are also potentially significant. The sensor arrayssuccessfully identified all 10 strains of bacteria tested, includingE. faecalis and S. aureus together with their antibiotic resistantforms, by monitoring gases evolved during a 10 h growth ofbacterial cultures. This time frame is clinically important: becausewe are able to quickly monitor growth rates (even after just 3 h asshown in Figure 4), parallel monitoring of bacterial growth invarious antibiotic-doped media should provide physicians withvaluable and timely information to guide treatment. Because thetechnology developed here is inexpensive and builds easily onconventional culturing, it may find widespread application in lesseconomically developed regions.The initial studies reported herein are being used to guide
development of arrays with greater sensitivity and classificationcapabilities for bacteria. These arrays are currently being appliedto blood culture systems using liquid growthmedia with very lowinitial inoculum concentrations. In addition, this colorimetricsensor array has also proven highly effective in point-of-carediagnosis of bacterial sinusitis22 and in lung cancer screening,23
and the possibility of other applications of colorimetric sensorarrays for medical diagnosis by breath are likely to emerge.
’ASSOCIATED CONTENT
bS Supporting Information. Figure S1 and Tables S1�S3.This material is available free of charge via the Internet at http://pubs.acs.org.
’AUTHOR INFORMATION
Corresponding [email protected]; [email protected]
’ACKNOWLEDGMENT
We thank Dr. Sandra McMasters and David Saper for supportin experimental development and sample handling, Jeffrey D.Albarella for assistance in array printing, and Diana Biggs andJunho Pak for helpful discussions. At the time this work was done,J.R.C., K.I.H., A.S., and A.E.W. were employees of ChemSensing,Inc.Thisworkwas supported in part by the through theNIHGenes,Environment and Health Initiative through award U01ES016011.
’REFERENCES
(1) (a) Riedel, S.; Carroll, K. C. J. Infect. Chemother. 2010,16, 301–306. (b) Martin, G. S.; Mannino, D. M.; Eaton, S.; Moss, M.New Engl. J. Med. 2003, 348, 1546–1554. (c) Angus, D. C.; Linde-Zwirble,W. T.; Lidicker, J.; Clermont, G.; Carcillo, J.; Pinsky, M. R.Crit. Care Med.2001, 29, 1303–1310.
Figure 6. HCA dendrogram of 164 trials of 10 human pathogenicbacteria and control, using minimum variance (Ward’s method). Thedendrogram is based on the 23 dimensions from PCA that capture 95%of the total variance. The ATCCnumber is given below the name of eachbacterial strain.

7576 dx.doi.org/10.1021/ja201634d |J. Am. Chem. Soc. 2011, 133, 7571–7576
Journal of the American Chemical Society ARTICLE
(2) (a) Schmidt, R. H., Rodrick, G. E., Eds. Food Safety Handbook;Wiley: Hoboken, NJ, 2002. (b) Jay, J. M.; Loessner, M. J.; Golden, D. A.Modern Food Microbiology, 7th ed.; Springer: New York, 2005.(c) Lazcka, O.; Del Campo, F. J.; Munoz, F. X. Biosens. Bioelectron.2007, 22, 1205–1217. (d) Savov, A. V.; Kouzmanov, G. B. Biotechnol.Biotechnol. Equip. 2009, 23, 1462–1468.(3) (a) O’Hara, C. M. Clin. Microbiol. Rev. 2005, 18, 147–162.
(b) Carroll, K. C.; Weinstein, M. P. InManual Of Clinical Microbiology,9th ed.;Murray, P. R., Baron, E. J., Jorgensen, J. H., Landry,M. L., Pfaller,M. A., Eds.; Am. Soc. Microbiol.: Washington, DC, 2007; pp 192�217.(c) Seng, P.; Drancourt, M.; Gouriet, F.; La Scola, B.; Fournier, P. E.;Rolain, J. M.; Raoult, D. Clin. Infect. Dis. 2009, 49, 543–551. (d) Clerc,O.; Greub, G. Clin. Microbiol. Infect. 2010, 16, 1054–1061.(4) (a) Raoult, D.; Fournier, P. E.; Drancourt, M. Nature Rev.
Microbiol. 2004, 2, 151–159. (b) Peters, R. P. H.; van Agtmael, M. A.;Danner, S. A.; Savelkoul, P. H. M.; Vandenbroucke-Grauls, C. M. J. E.Lancet: Infect. Diseases 2004, 4, 751–760. (c) Peters, R. P. H.; Savelkoul,P. H. M.; Vandenbroucke-Grauls, C. M. J. E. Lancet 2010,375, 1779–1780. (d) Ecker, D. J.; Sampath, R.; Li, H. J.; Massire, C.;Matthews, H. E.; Toleno, D.; Hall, T. A.; Blyn, L. B.; Eshoo, M. W.;Ranken, R.; Hofstadler, S. A.; Tang, Y. W. Exp. Rev. Mol. Diagn. 2010,10, 399–415.(5) (a) Klouche, M.; Schroder, U. Clin. Chem. Lab. Med. 2008,
46, 888–908. (b) Miller, M. B.; Tang, Y. W. Clin. Microbiol. Rev. 2009,22, 611–633. (c) Boissinot, M.; Bergeron, M. G. Curr. Opin. Microbiol.2002, 5, 478–482. (d) Weile, J.; Knabbe, C. Anal. Bioanal. Chem. 2009,394, 731–742. (e) Peters, R. P. H.; Savelkoul, P. H. M.; Simoons-Smit,A. M.; Danner, S. A.; Vandenbroucke-Grauls, C. M. J. E.; van Agtmael,M. A. J. Clin. Microbiol. 2006, 44, 119–123. (f) Forrest, G. N. Exp. Rev.Mol. Diagn. 2007, 7, 231–236.(6) (a) Suslick, K. S.; Bailey, D. P.; Ingison, C. K.; Janzen, M.; Kosal,
M.A.;McNamara,W.B., III; Rakow,N.A.; Sen,A.;Weaver, J. J.;Wilson, J. B.;Zhang,C.;Nakagaki, S.Quim.Nova2007,30, 677. (b) Suslick,K. S.MRSBull.2004, 29, 720. (c) Rakow, N. A.; Suslick, K. S. Nature 2000, 406, 710.(7) (a) Rakow, N. A.; Sen, A.; Janzen, M. C.; Ponder, J. B.; Suslick,
K. S. Angew. Chem., Int. Ed. 2005, 44, 4528. (b) Janzen, M. C.; Ponder,J. B.; Bailey, D. P.; Ingison, C. K.; Suslick, K. S. Anal. Chem. 2006,78, 3591. (c) Lim, S. H.; Feng, L.; Kemling, J. W.; Musto, C. J.; Suslick,K. S. Nature Chem. 2009, 1, 562–567. (d) Feng, L.; Musto, C. J.;Kemling, J. W.; Lim, S. H.; Suslick, K. S. Chem. Commun. 2010,46, 2037–2039. (e) Feng, L.; Musto, C. J.; Kemling, J. W.; Lim, S. H.;Zhong, W.; Suslick, K. S. Anal. Chem. 2010, 82, 9433–9440.(8) (a) Suslick, B. A.; Feng, L.; Suslick, K. S. Anal. Chem. 2010,
82, 2067–2073. (b) Zhang, C.; Bailey, D. P.; Suslick, K. S. J. Agric. FoodChem. 2006, 54, 4925. (c) Zhang, C.; Suslick, K. S. J. Agric. Food Chem.2007, 55, 237.(9) (a) Schulz, S.; Dickschat, J. S.Nat. Prod. Rep. 2007, 24, 814–842.
(b) Kai, M.; Haustein, M.; Molina, F.; Petri, A.; Scholz, B.; Piechulla, B.Appl. Microbiol. Biotechnol. 2009, 81, 1001–1012.(10) (a) Wang, T.; Smith, D.; Spanel, P. Int. J. Mass Spectrom. 2004,
233, 245–251. (b) Demirev, P. A.; Fenselau, C. Annu. Rev. Anal. Chem.2008, 1, 71–93. (c) Zhu, J.; Bean, H. D.; Kuo, Y. M.; Hill, J. E. J. Clin.Microbiol. 2010, 48, 4426–31. (d) Ho, Y. P.; Reddy, P. M. Clin. Chem.2010, 56, 525–536.(11) (a) Zechman, J. M.; Aldinger, S.; Labows, J. N. J. Chromatogr.
1986, 377, 49–57. (b) Elgaali, H.; Hamilton-Kemp, T. R.; Newman,M. C.; Collins, R. W.; Yu, K. S.; Archbold, D. D. J. Basic Microbiol. 2002,42, 373–380. (c) Sondag, J. E.; Ali, M.; Murray, P. R. J. Clin. Microbiol.1980, 11, 274–277.(12) Gardner, J. W.; Bartlett, P. N. Electronic Noses: Principles and
Applications; Oxford University Press: New York, 1999. (b) Toko, K.Biomimetic Sensor Technology; Cambridge University Press: Cambridge,UK, 2000.(13) (a) Janata, J.; Josowicz, M. Nat. Mater. 2003, 2, 19–24.
(b) Lewis, N. S. Acc. Chem. Res. 2004, 37, 663–672. (c) Hsieh, M.-D.;Zellers, E. T. Anal. Chem. 2004, 76, 1885–1895. (d) Walt, D. R. Anal.Chem. 2005, 77, 45 A. (e) Anslyn, E. V. J. Org. Chem. 2007, 72, 687–699.(f) Falconi, C.; Martinelli, E.; Di Natale, C.; D’Amico, A.; Maloberti, F.;
Malcovati, P.; Baschirotto, A.; Stornelli, V.; Ferri, G. Sens. ActuatorsB�Chem. 2007, 121, 295–329. (g) R€ock, F.; Barsan, N.; Weimar, U.Chem. Rev. 2008, 108, 705–725. (h) Hierlemann, A.; Gutierrez-Osuna,R. Chem. Rev. 2008, 108, 563–613. (i) Janata, J.; Josowicz, M. J. SolidState Electrochem. 2009, 13, 41–49. (j)Walt, D. R.; Aernecke, M. J.; Guo,J.; Sonkusale, S. Anal. Chem. 2009, 81, 5281–5290. (k) Wilson, A. D.;Baietto, M. Sensors 2009, 9, 5099–5148. (l) Meier, D. C.; Raman, B.;Semancik, S. Annu. Rev. Anal. Chem. 2009, 2, 463–484. (m) Berna, A.Sensors 2010, 10, 3882–3910. (n) Walt, D. R. Chem. Soc. Rev. 2010,39, 38–50. (o) Stich, M. I. J.; Fischer, L. H.; Wolfbeis, O. S. Chem. Soc.Rev. 2010, 39, 3102–3114.
(14) (a) Thaler, E. R.; Hanson, C. W. Exp. Rev. Med. Dev. 2005,2, 559–566. (b) Thaler, E. R.; Hanson, C. W. Am. J. Rhinol. 2006,20, 170–172. (c) Anand, V.; Kataria, M.; Kukkar, V.; Saharan, V.;Choudhury, P. K. Drug Discovery Today 2007, 12, 257.
(15) (a) Gibson, T. D.; Prosser, O.; Hulbert, J. N.; Marshall, R. W.;Corcoran, P.; Lowery, P.; Ruck-Keene, E. A.; Heron, S. Sens. Actuators1997, B44, 413–422. (b) Rossi, V.; Talon, R.; Berdague, J. L. J. Microbiol.Methods 1995, 24, 183–190. (c) Dutta, R.; Morgan, D.; Baker., N.;Gardner, J. W.; Hines, E. L. Sens. Actuators 2005, B109, 355–362.(d) Karasinski, J.; Andreescu, S; Sadik, O. A.; Lavine, B.; Vora, M. N.Anal. Chem. 2005, 77, 7941–7949. (e) Moens, M.; Smet, A.; Naudts, B.;Verhoeven, J.; Ieven, M.; Jorens, P.; Geise, H. J.; Blockhuys, F. Lett. Appl.Microbiol. 2006, 42, 121–126. (f) Setkus, A.; Kancleris, Z.; Olekas, A.;Rimdeika, R.; Senulien_e, D.; Strazdien_e, Z. Sens. Actuators B�Chem.2008, 130, 351–358. (g) Thaler, E. R.; Huang, D.; Giebeig, L.; Palmer, J.;Lee, D.; Hanson, C. W.; Cohen, N. Am. J. Rhinol. 2008, 22, 29–33.
(16) (a) Dutta, R. Sens. Actuators B�Chem. 2006, 120, 156–165.(b)McEntegart, C.M.; Penrose,W. R.; Strathmann, S.; Stetter, J. R. Sens.Actuators B�Chem. 2000, 70, 170–176. (c) Holmberg, M.; Gustafsson,F.; Hornsten, E. G.; Winquist, F.; Nilsson, L. E.; Ljung, L.; Lundstrom, I.Biotechnol. Tech. 1998, 12, 319–324. (d) Gardner, J. W.; Craven, M.;Dow, C.; Hines, E. L. Meas. Sci. Technol. 1998, 9, 120–127.
(17) (a) G€orke, B.; St€ulke, J. Nature Rev. Microbiol. 2008,6, 613–624. (b) Narang, A.; Pilyugin, S. S. J. Theor. Biol. 2007,244, 326–48. (c) Mahadevan, R.; Edwards, J. S.; Doyle, F. J., III Biophys.J. 2002, 83, 1331–1340. (d) Chang, D. E.; Smalley, D. J.; Conway, T.Mol. Microbiol. 2002, 45, 289–306.
(18) Veit, A.; Polen, T.; Wendisch, V. F. Appl. Microbiol. Biotechnol.2007, 74, 406–421.
(19) Thomas, A. D.; Doelle, H.W.;Westwood, A. W.; Gordon, G. L.J. Bacteriol. 1972, 112, 1099–1105.
(20) (a) Hasswell, S. Practical Guide To Chemometrics; Dekker: NewYork, 1992. (b) Scott, S. M.; James, D.; Ali, Z. Microchim. Acta 2007,156, 183.(c) Johnson, R. A.; Wichern, D. W. Applied MultivariateStatistical Analysis, 6th ed.; Prentice Hall: Englewood Cliffs, NJ, 2007.(d) Hair, J. F.; Black, B.; Babin, B.; Anderson, R. E.; Tatham, R. L.Multivariate Data Analysis, 6th ed.; Prentice Hall: Englewood Cliffs, NJ,2005.
(21) Liu, J. Ind. Eng. Chem. Res. 2004, 43, 7815–7825.(22) Thaler, E. R.; Lee, D. D.; Hanson, C. W. J. Breath Res. 2008,
2, 37016-1–4.(23) Mazzone, P. J. J. Thorac. Oncol. 2008, 3, 774–80.


![Most Presentations Stink! [#PresentationTips]](https://static.fdocuments.net/doc/165x107/55d497ddbb61eb98698b45f7/most-presentations-stink-presentationtips.jpg)


![The southern green stink bug [ Nezara viridula (L.) ] and the brown stink bug](https://static.fdocuments.net/doc/165x107/56812d5a550346895d92608c/the-southern-green-stink-bug-nezara-viridula-l-and-the-brown-stink-bug.jpg)