Rapid Field Appraisal of Decentralization · 2012-08-15 · Rapid Field Appraisal of...
28
Northern Mindanao Region 10 Rapid Field Appraisal of Decentralization
Transcript of Rapid Field Appraisal of Decentralization · 2012-08-15 · Rapid Field Appraisal of...
Northern Mindanao
Region 10
Rapid FieldAppraisal of Decentralization

This study is made possible by the generous support of the American people through the United States Agency for International Development (USAID) through Cooperative Agreement Number AID 492-A-00-09-00031-00. The contents are the responsibility of The Asia Foundation and do not necessarily reflect the views of USAID or the United States Government.
Improved Legislative & Executive Actions
3
ExEcutivE Summary
The 11th Rapid Field Appraisal (RFA) sites for Region 10 (Northern Mindanao) were 12 sample local government units (LGUs) composed of three provinces (Misamis Oriental, Misamis Occidental, and Camiguin), two cities with one capital town (Gingoog City, Oroquieta City, and Mambajao), and six municipalities (Aloran, Catarman, Mahinog, Medina, Naawan, and Sinacaban).
Results of the study showed that from 2005 to 2009, the local governments of Region 10 were able to exercise their functions substantially in terms of formulation of local legislation and implementing the same in their respective areas of jurisdiction. These legislation and executive actions included regulations, transparency and accountability in LGU operations, crafting and implementation of plans (e.g. development, land use, solid waste management), revenue generation and fund appropriation, and investment promotion. However, revenue generation initiatives of most LGUs are limited, hence, their Internal Revenue Allotment (IRA) dependency remains high. For the cities, IRA dependency within the five-year period was declining, indicating a more aggressive stance of generating additional funds from internal sources (e.g. improving operations of public economic enterprises and/or local taxation, stemming mostly from real property, business, community and professional taxes). Moreover, cities tapped external fund sources (e.g. bank borrowings and/or build and transfer operations) to finance construction of commercial facilities and/or acquisition of heavy machineries.
Of the four devolved functions, health and nutrition was given priority and thus received the highest budgetary allocation. The bigger and increasing health budget of the local governments from 2005 to 2009, in spite of increasing population and inflationary pressures, had been able to help improve the health conditions of the people. This was reinforced by the highly favorable impressions of focused group discussion (FGD) participants toward decentralization’s contribution to health in all income classes of LGUs in Region 10.
Agriculture is next to health and nutrition in terms of priorities. While the budgetary allocation for agriculture and fisheries is meager, LGUs endeavor to finance programs and projects for this sector by building strong networks with outside funding sources, as well as with other stakeholders.
Improved Legislative & Executive Actions
Julita Bokingo

Rapid Field Appraisal of Decentralization: Region 10
4
Results also show, however, that provincial LGUs are giving the least premium and budget for environmental protection as shown in the budgetary appropriation. This function has been attached to the existing functions of the City or Municipal Agriculturist Office. Hence, there is no separate budget specific for environmental programs and projects. Consequently, these LGUs do not have substantial programs related to the environment.
Although the municipal and city LGUs have limited budget appropriation for the devolved functions, some of these LGUs are better able to deliver programs and projects if they closely coordinate with and are supported by their respective provincial LGUs. While decentralization has given LGUs autonomy to run their respective areas of responsibility using their budget appropriation, it has not prevented them from supporting and working with each other.
introduction
Region 10 is one of the fastest growing regions of the country. Located in the northern part of Mindanao, it serves as the island grouping’s gateway to and from other regions of the country. It is composed of five provinces: Bukidnon, Camiguin, Misamis Occidental, Misamis Oriental, and Lanao del Norte. These five provinces, nine cities, 84 municipalities, and 2,022 barangays make up Northern Mindanao.
The region stretches across an area of 20,186 square kilometers, of which 53.7 percent is forestland. It is blessed with abundant natural resources that make it very suitable for agriculture and fishing. Region 10 is relatively peaceful and has a comfortable climate that makes it attractive to both domestic and foreign investors. The region is also endowed with a lot of tourist spots, most of which are located in the province of Camiguin. The region’s seaports and airports are usually the entry and exit points of people and goods from and to other regions of the country, especially for the seaports of the cities of Cagayan de Oro, Iligan, and Ozamiz.
Notwithstanding the diversity in resource endowments, the different LGUs endeavoured to develop their respective potentials while at the same time complementing each other. The province of Camiguin continues to develop into a tourism haven; the province of Bukidnon as the food basket not only of Mindanao but of the country as well; the province of Misamis Occidental has distinguished itself with its fishery and aquamarine resources; the province of Misamis Oriental as the region’s hub for industrial and trade activities; and the province of Lanao del Norte as the agricultural-industrial center and an eco-tourism destination.
All these have only made the region’s economy robust and sustainable. Yet with the growth of Northern Mindanao’s economy, the population is also growing. As of 2007, the region has become home to about four million people (3,952,437), with its population rising at an average of 1.67 percent annually.

Improved Legislative & Executive Actions
5
Sample Size and Site Selection
Region 10 is made up of five provinces: two of these are classified as first class, two second class, and one as fifth. The three provinces chosen as sample sites meant that only the high and low income categories were represented. In the case of cities within the selected provinces, the high and medium income groups were represented. There was no existing city in the province of Camiguin, thus, its capital town was taken as one of the sample sites. The four municipalities representing the medium and low income categories were both taken as sample sites in each of the provinces of Misamis Occidental and Misamis Oriental whereas all sample sites for the municipalities in the province of Camiguin were of the low income classification. The existing five municipalities in the province of Camiguin are all fifth class municipalities except Mambajao which is classified as third class.
Table 1: 11th RFA Sites for Region 10Province City/Capital Town Municipality
Misamis Oriental(1st Class)
Gingoog City(2nd Class)
Medina(4th class)
Naawan(5th Class)
Misamis Occidental(2nd Class)
Oroquieta City (4th Class)
Aloran(4th class)
Sinacaban(5th Class)
Camiguin(5th Class)
Mambajao(3rd Class)
(Capital Town)
Catarman(5th class)Mahinog
(5th Class)
rESultS of dEcEntralization
i. local Governance and administration
local legislation. LGUs provided the necessary authorizations and mechanisms so that funds were appropriated to underwrite the expenditures of various development projects, including those under devolved functions. There were also local laws that focused on: regulating businesses; granting incentives to identified sectors; increasing the number of units for franchise operators for sikads and relas (pedal-powered tri-cycles); regulating the buy-and-sell of select agricultural/ non-agricultural commodities; incentives for enforcers of fisheries laws; accreditation of non-governmental organizations (NGOs)/ people’s organizations (POs); and, protecting and preserving historical landmarks. These, aside from the usual legislation, were all aimed at strengthening the socio-economic, infrastructure, health, and other developmental efforts of the local government units.
Rapid Field Appraisal of Decentralization: Region 10
6
In terms of general categories, the legislative measures passed focused on economic, social services, general administration, review and approval of barangay resolutions, and miscellaneous types. The economic legislative measures consisted of infrastructure, franchise and revenue generation, water-system services, livelihood programs, communication services, electrical power, agricultural development, employment services and tax amnesty. Social services measures included housing, zoning and land use, educational services, health and sanitation, promotion of arts and culture, environmental protection, social welfare, appreciation/facilitation/condolence, cooperatives and accreditation, and finally youth, sports and physical development. Legislative measures regarding general administration categories covered those that touch on auditing and treasury functions, traffic safety, and employees’ welfare/benefits. Memoranda of agreement, quasi-judicial functions, and house rules were those falling under miscellaneous measures. A few of these LGUs are maintaining computerize tracking system to track legislation and generate information on the legislative output of the LGU.
transparency. LGUs recognize the importance of ensuring that information is available and accessible to the public. Differences in the manner of responding to this service however, vary from one LGU to another. Presence of a public assistance and complaints desk is common. LGUs that have no designated desk or officer-of-the-day assign administrative personnel to provide information or referrals. LGUs have also maintained also logbooks for recording of visitors and those inquiring for information.
The unique layout placement of Gingoog City’s public assistance and complaints desk at the entrance of the office of the city administrator, coupled with the availability of the appropriate forms, encourages the reporting of both favorable and unfavorable interactions that they may experience with the city’s service providers. A female staff member is
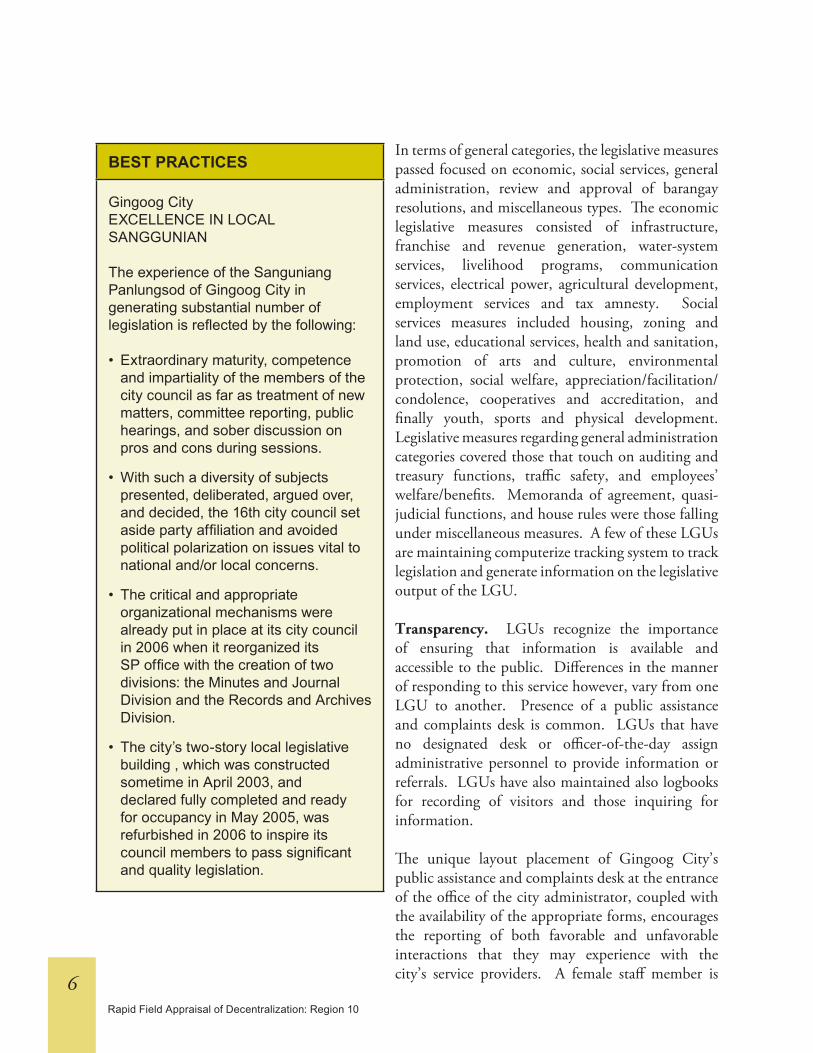
BEsT PRACTICEs
Gingoog CityEXCELLENCE IN LOCAL SANGGUNIAN
The experience of the Sanguniang Panlungsod of Gingoog City in generating substantial number of legislation is reflected by the following:
• Extraordinary maturity, competence and impartiality of the members of the city council as far as treatment of new matters, committee reporting, public hearings, and sober discussion on pros and cons during sessions.
• With such a diversity of subjects presented, deliberated, argued over, and decided, the 16th city council set aside party affiliation and avoided political polarization on issues vital to national and/or local concerns.
• The critical and appropriate organizational mechanisms were already put in place at its city council in 2006 when it reorganized its SP office with the creation of two divisions: the Minutes and Journal Division and the Records and Archives Division.
• The city’s two-story local legislative building , which was constructed sometime in April 2003, and declared fully completed and ready for occupancy in May 2005, was refurbished in 2006 to inspire its council members to pass significant and quality legislation.

Improved Legislative & Executive Actions
7
responsible for overseeing the complaints and public assistance in addition to her other administrative duties. The two boxes on top of her table contain two kinds of forms: one for client feedback, the other intended for anti-red tape comments. Feedback can be in the form of comments, suggestions, request, and commendations regarding the services rendered by the city government. In the anti-red tape form, various landline and mobile numbers, as well as the city government’s email address, are indicated.
LGUs continuously communicate to the public updated information about their respective services, plans, programs, and special events. The presence of public information bulletin boards was widespread, but the timeliness of information varies across LGUs. LGUs also maintain websites, mostly common among cities and areas with high tourist traffic. The website of Oroquieta City was part of the LGU’s aggressive social marketing campaign beginning last quarter of 2009. The print medium was used on a regular basis mostly by cities. Gingoog City is able to sustain its Gingoog Today, a quarterly bi-annual newsletter. Oroquieta City has its official government publication, the print version of its radio program, “Sidlak Oroquieta.”
The combination of media that LGUs likely use is influenced by the profile of population, geographical stretch of the barangays under its jurisdiction, availability of local funds, and the profile of the target audience.
LGUs normally post at the entrance of the capitol/city/municipal hall a summary of its yearly income and expenditures. This was observed particularly in Camiguin as a specific financial accountability mechanism.
Participation. LGUs have institutionalized participatory mechanisms through the local special bodies – the Local Development Council (LDC), Local Health Board (LHB), Local School Board (LSB), and the Peace and Order Council (POC).
development Planning. LGUs have existing comprehensive land use and development plans – a product of a joint undertaking of many sectors: LGU officials, NGOs, and other stakeholders.
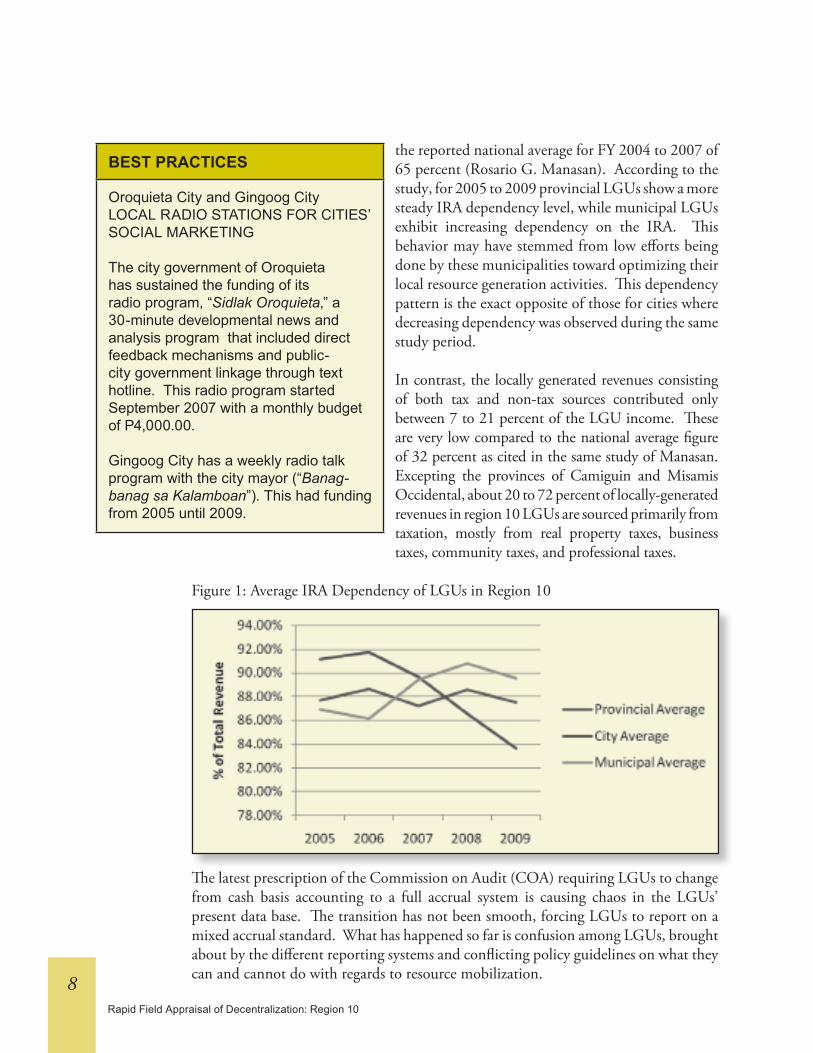
resource Generation. IRA continued to be the biggest source of revenue for all LGUs, accounting for 80 to 93 percent of LGU income. This pattern is way above
BEsT PRACTICEs
Misamis OccidentalCOMPUTERIZED LOCAL LEGISLATION TRACKING SYSTEM
The province of MisamisOccidental’s Sanggunian had been operating its computerized system in tracking legislation information since May 2001. It is referred to as the “Legislative Management and Information System,” an embedded system especially developed for tracking legislative enactments and actions with real-time computing and reporting design. The system was first installed when the current provincial vice governor was then a gubernatorial candidate. Since 1991, the system has undergone five enhancements, with the provincial government spending somewhere between P60,000.00 to P80,000.00 per enhancement activity.
Rapid Field Appraisal of Decentralization: Region 10
8
the reported national average for FY 2004 to 2007 of 65 percent (Rosario G. Manasan). According to the study, for 2005 to 2009 provincial LGUs show a more steady IRA dependency level, while municipal LGUs exhibit increasing dependency on the IRA. This behavior may have stemmed from low efforts being done by these municipalities toward optimizing their local resource generation activities. This dependency pattern is the exact opposite of those for cities where decreasing dependency was observed during the same study period.
In contrast, the locally generated revenues consisting of both tax and non-tax sources contributed only between 7 to 21 percent of the LGU income. These are very low compared to the national average figure of 32 percent as cited in the same study of Manasan. Excepting the provinces of Camiguin and Misamis Occidental, about 20 to 72 percent of locally-generated revenues in region 10 LGUs are sourced primarily from taxation, mostly from real property taxes, business taxes, community taxes, and professional taxes.
Figure 1: Average IRA Dependency of LGUs in Region 10
The latest prescription of the Commission on Audit (COA) requiring LGUs to change from cash basis accounting to a full accrual system is causing chaos in the LGUs’ present data base. The transition has not been smooth, forcing LGUs to report on a mixed accrual standard. What has happened so far is confusion among LGUs, brought about by the different reporting systems and conflicting policy guidelines on what they can and cannot do with regards to resource mobilization.
BEsT PRACTICEs
Oroquieta City and Gingoog CityLOCAL RADIO STATIONS FOR CITIES’ SOCIAL MARKETING
The city government of Oroquieta has sustained the funding of its radio program, “Sidlak Oroquieta,” a 30-minute developmental news and analysis program that included direct feedback mechanisms and public-city government linkage through text hotline. This radio program started September 2007 with a monthly budget of P4,000.00.
Gingoog City has a weekly radio talk program with the city mayor (“Banag-banag sa Kalamboan”). This had funding from 2005 until 2009.
Improved Legislative & Executive Actions
9
LGUs normally operate public economic enterprises like public markets, slaughterhouses, cemeteries, and bus terminals. Some LGUs have waterworks systems and are renting out commercial spaces from an LGU-owned building, as well as heavy equipments and agricultural machineries. For LGUs that are into eco-tourism, PEEs also includes cold/hot springs, island nature or eco parks with training center facilities, and an aqua-marine park. One provincial government that maintains hospitals (provincial and district types) legislated the transformation of its public hospital operations as an economic enterprise unit effective 2010. Management of these PEEs are either under the direct supervision of the governor or the mayor or a separate office, depending on how big the enterprises are.
Oroquieta City’s initiatives to enhance the revenue-generating capabilities of its public economic enterprises are highlighted in this report. Recognizing the great potentials of the LGU’s existing and future economic enterprises, it worked vigorously for the implementation of various reforms from 2007 to 2009. The significant quantitative improvements in the financial performance of the city’s economic enterprises can be observed starting the last quarter of 2008.
Revenue Generation through Reforms in the Management of Economic Enterprises: Case of the City of Oroquieta
Reforms Results• Amendments of the Market Code
of Oroquieta City were passed and approved in 2008, which involved increasing rentals and fees at the public market and slaughterhouse;
• Increased in total annual revenues from the operations of economic enterprises from P4,734,962.49 in 2007 to P7,253,345.19 in 2008, reflected a 53.19 % annual growth;
• Sec.15, Chapter IV of its Market Code ( payment of application for the lease of market stall, transfer fee and occupancy fee) revised and approved by SP in 2008, implemented on January 1, 2009;
• The increase in total revenues by more than one-half resulted to a net income in 2008 that was more than 17 times greater than in 2007;
• Implementation of the new rates and fees at the public market and slaughterhouse on February 1, 2008;
• The annual increase in revenues from the operations of the public market and bus terminal were 50.31 % and 87.05 %, respectively;
• Budgetary support for PEEs in 2008 was 23.24% higher than 2007; in 2009 budget allotment for CEEDO rose by 41.24% compared to 2008;
• The first quarter of 2009 resulted to a total revenue that was 43.53 % more than 2008;
Rapid Field Appraisal of Decentralization: Region 10
10
Revenue Generation through Reforms in the Management of Economic Enterprises: Case of the City of Oroquieta
Reforms Results• Proposed renovation of the CEEDO
office was allotted P1,000,000.00 in 2009;
• Computerization of collection system was fully implemented during the 1st quarter of 2010;
• Computerization of the public market’s collection / remittance system was budgeted with city’s counter-parting funds per MOA with a foreign grant;
• Planned renovation of the CEEDO building was started last quarter of 2009 and fully completed 1st quarter of 2010.
• The commitment of the Head of the Economic Enterprise Management Division in the proposal preparation and submission of revenue generating amendments, the cooperation of department heads, the overwhelming support of SP members and the sustained backing of the city mayor.
• The creation of its economic enterprise unit, City Economic Enterprise Development Office (CEEDO), as one separate department effective September, 2008.
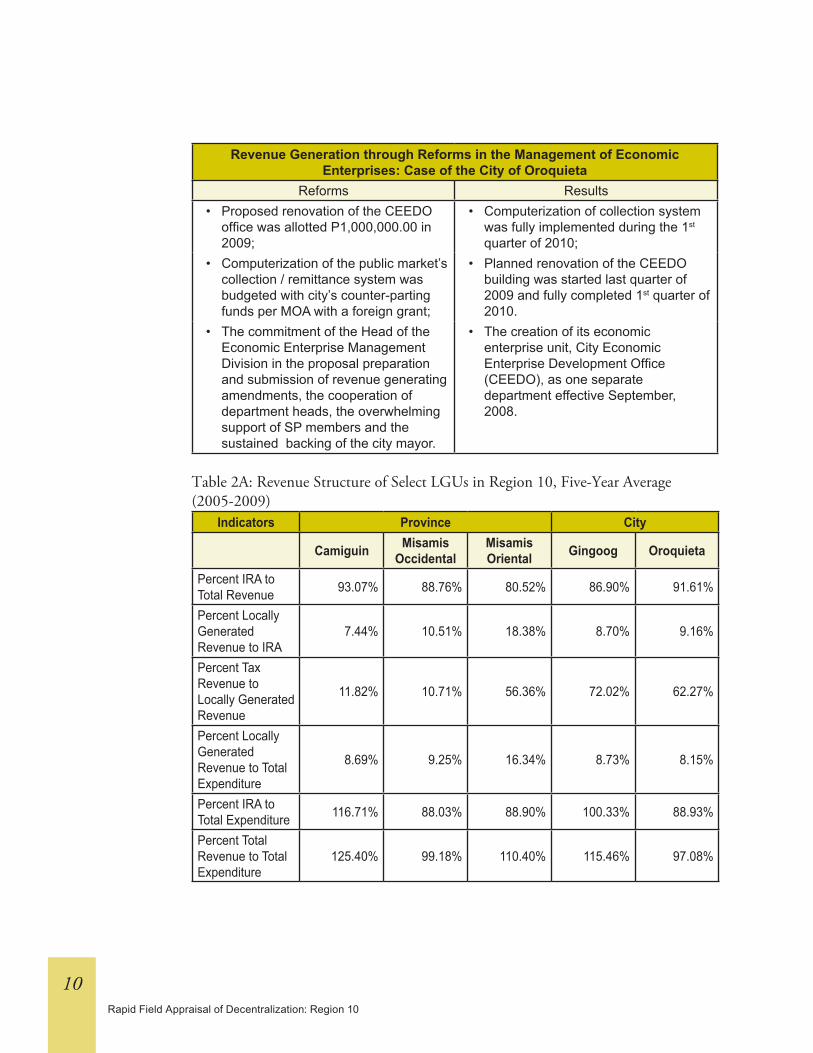
Table 2A: Revenue Structure of Select LGUs in Region 10, Five-Year Average(2005-2009)
Indicators Province City
Camiguin Misamis Occidental
Misamis Oriental Gingoog Oroquieta
Percent IRA to Total Revenue 93.07% 88.76% 80.52% 86.90% 91.61%
Percent Locally Generated Revenue to IRA
7.44% 10.51% 18.38% 8.70% 9.16%
Percent Tax Revenue to Locally Generated Revenue
11.82% 10.71% 56.36% 72.02% 62.27%
Percent Locally Generated Revenue to Total Expenditure
8.69% 9.25% 16.34% 8.73% 8.15%
Percent IRA to Total Expenditure 116.71% 88.03% 88.90% 100.33% 88.93%
Percent Total Revenue to Total Expenditure
125.40% 99.18% 110.40% 115.46% 97.08%

Improved Legislative & Executive Actions
11
Table 2B: Revenue Structure of Select LGUs in Region 10, Five-Year Average(2005-2009)
Indicators MunicipalityCatarman Mahinog Mambajao Aloran sinacaban Medina Naawan
Percent IRA to Total Revenue 91.45% 89.59% 82.33% 90.01% 92.70% 89.85% 85.03%
Percent Locally Generated Revenue to IRA
9.35% 11.62% 21.46% 11.10% 7.88% 10.90% 13.11%
Percent Tax Revenue to Locally Generated Revenue
48.56% 38.57% 70.45% 32.35% 28.32% 57.23% 20.28%
Percent Locally Generated Revenue to Total Expenditure
13.63% 11.06% 25.45% 10.77% 7.54% 9.80% 10.79%
Percent IRA to Total Expenditure 145.74% 95.19% 118.56% 97.01% 95.73% 89.91% 82.28%
Percent Total Revenue to Total Expenditure
159.36% 106.25% 144.01% 107.78% 103.28% 100.06% 96.77%
resource allocation and utilization for General operations. Majority of the LGUs adopt either the principle of zero-budgeting, and /or deficit spending as evidenced by the Total Revenue to Total Expenditures ratio for the province of Misamis Occidental, the city of Oroquieta, and the municipality of Naawan. Relying on their traditional sources of funding of IRA and own tax revenues, LGUs exert minimal efforts to creatively mobilize other (and more productive) fund sources. They also seldom access loans from Government Financial Institutions (GFIs), due to stringent requirements. Overall debt levels remain manageable in these LGUs. The existing policy of the Bangko Sentral ng Pilipinas (BSP) classifying LGU bonds under the 50-percent risk category dampens the interest of LGUs to explore bond market as an alternative mode of financing.
Notable in the chart is that the proportion of tax revenue to totally generated revenue is highest in cities (67 percent) and lowest in municipalities (26 percent). LGUs in general experienced surplus funds as shown by the proportion of their total revenue vis-à-vis their total expenditure. This implies that LGUs were not able to optimize fund use. These surpluses, after all, could have been invested in other more productive purposes instead of being earmarked as year-end savings/ reserves.
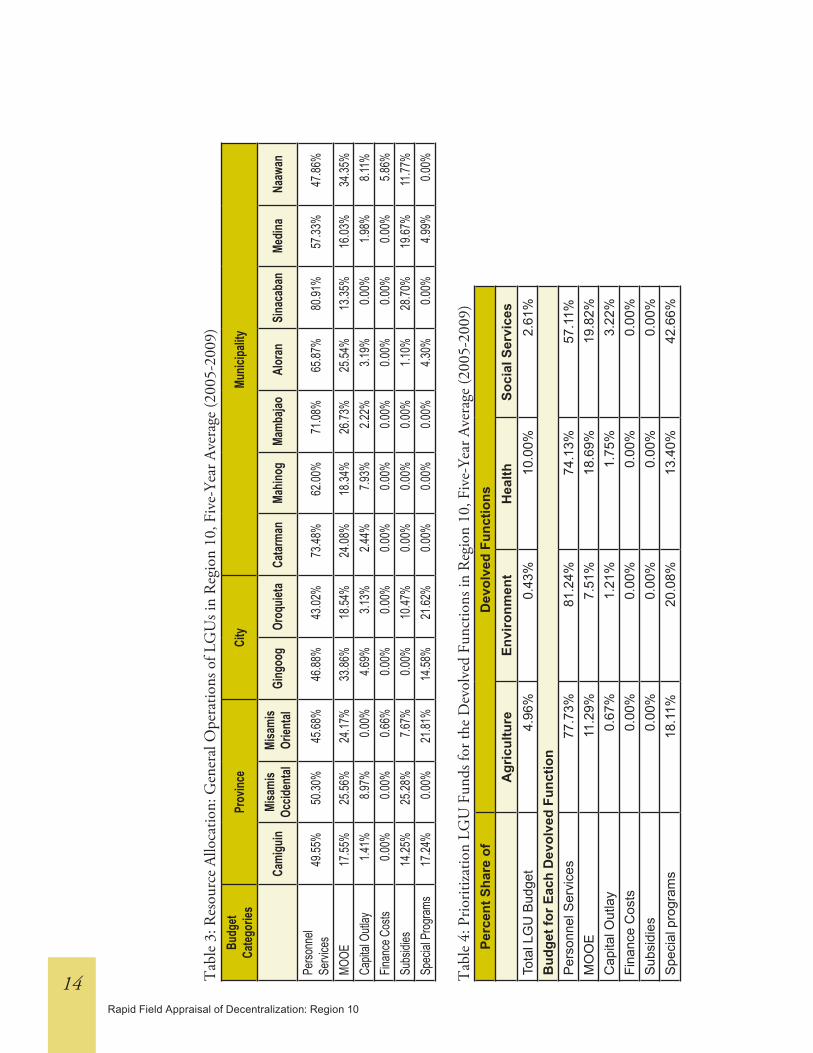
Table 3 shows the manner with which funds were being allocated to defray the operating expenditures dissected in terms of the major budget categories.
Rapid Field Appraisal of Decentralization: Region 10
12
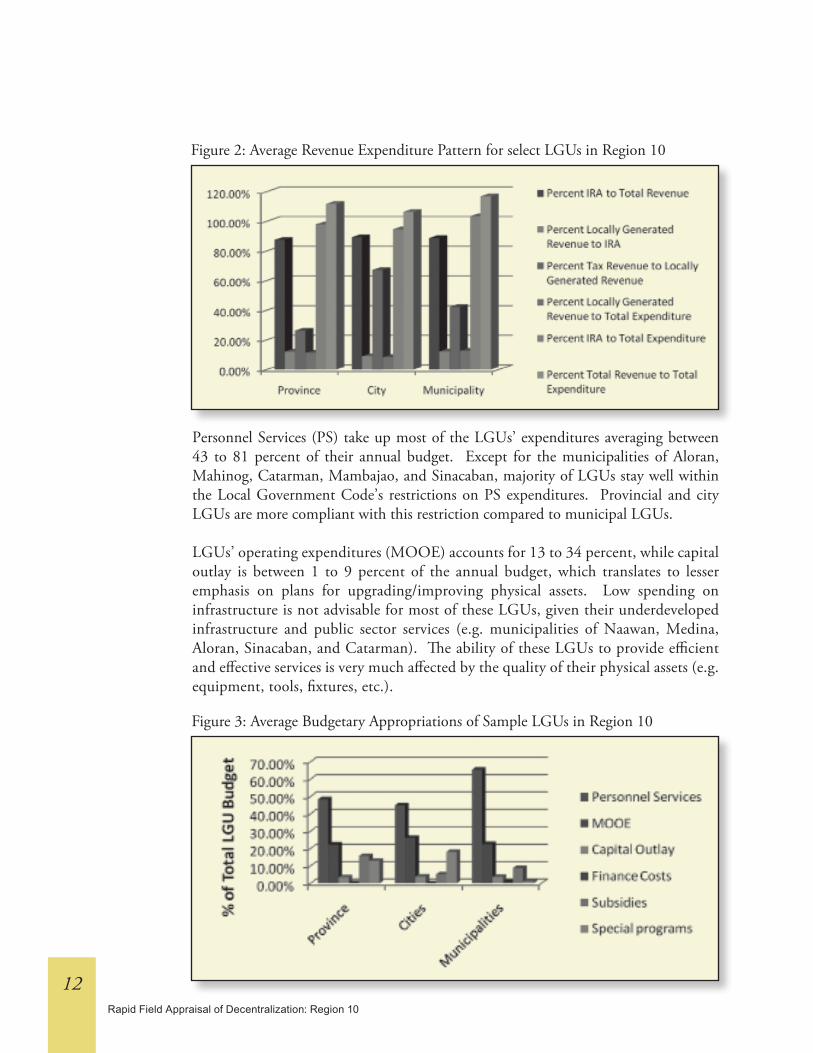
Personnel Services (PS) take up most of the LGUs’ expenditures averaging between 43 to 81 percent of their annual budget. Except for the municipalities of Aloran, Mahinog, Catarman, Mambajao, and Sinacaban, majority of LGUs stay well within the Local Government Code’s restrictions on PS expenditures. Provincial and city LGUs are more compliant with this restriction compared to municipal LGUs.
LGUs’ operating expenditures (MOOE) accounts for 13 to 34 percent, while capital outlay is between 1 to 9 percent of the annual budget, which translates to lesser emphasis on plans for upgrading/improving physical assets. Low spending on infrastructure is not advisable for most of these LGUs, given their underdeveloped infrastructure and public sector services (e.g. municipalities of Naawan, Medina, Aloran, Sinacaban, and Catarman). The ability of these LGUs to provide efficient and effective services is very much affected by the quality of their physical assets (e.g. equipment, tools, fixtures, etc.).
Figure 3: Average Budgetary Appropriations of Sample LGUs in Region 10
Figure 2: Average Revenue Expenditure Pattern for select LGUs in Region 10

Improved Legislative & Executive Actions
13
Debt servicing represents a very small portion of the total LGU expenditures, and was noted in only one province and one municipality. This reinforces the earlier observation that majority of the LGUs in the region are not putting substantial efforts in exploring debt as an alternative to financing their asset improvement/ expansion programs.
On the aspect of allocations for subsidy and other special programs, not all LGUs have these items in their budget. It appears that these expense categories are subject to the personal priorities of the LGU chief executive officer or his/her alter ego.
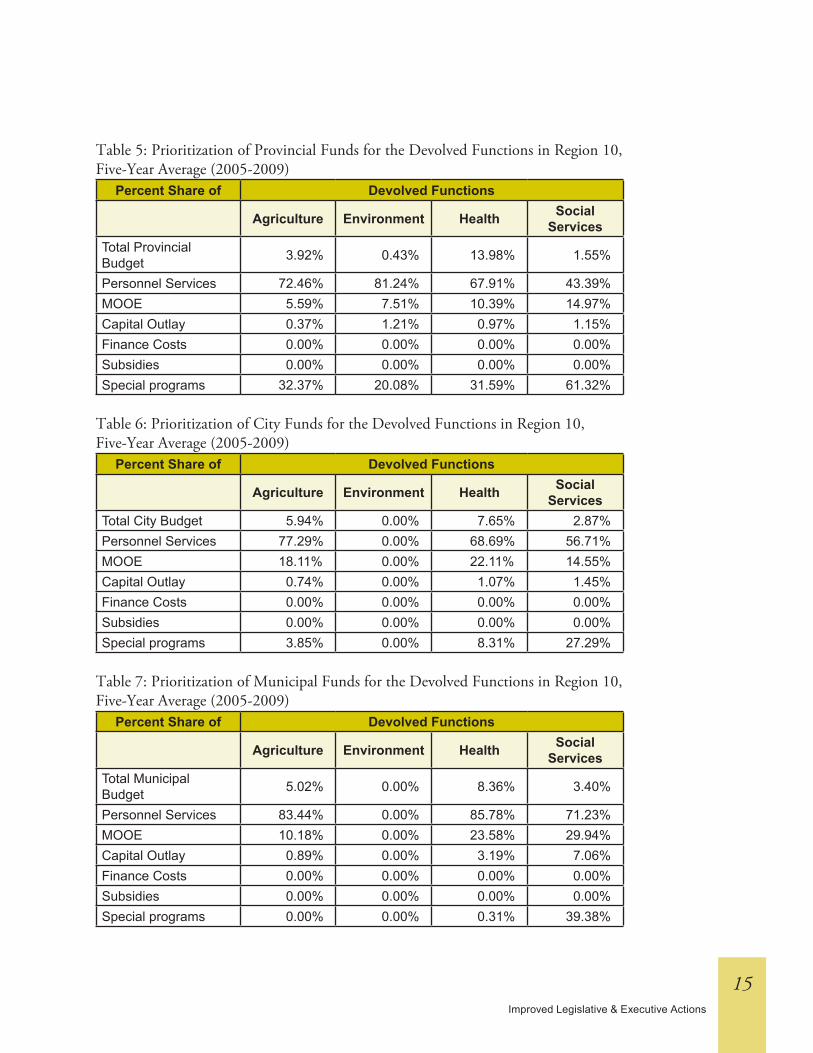
resource allocation and utilization. LGUs put premium on primary health care as reflected in its share to the total LGU budget. Agricultural support is second on the list of priorities, followed by social services. Meager funds have been set aside for environmental care and protection. Budgetary allocations for devolved functions, in general reflects the priorities of the LGUs. Except for the 20 percent allocation for development fund, the LGUs exercise full discretion in the allocation and utilization of their funds. Table 4 to 7 provides for the allocation of funds of LGUs across the devolved functions.
Rapid Field Appraisal of Decentralization: Region 10
14 Tab
le 3
: Res
ourc
e Al
loca
tion:
Gen
eral
Ope
ratio
ns o
f LG
Us i
n R
egio
n 10
, Fiv
e-Ye
ar A
vera
ge (2
005-
2009
)Bu
dget
Categ
ories
Prov
ince
City
Munic
ipality
Cami
guin
Misa
mis
Occid
ental
Misa
mis
Orien
talGi
ngoo
gOr
oquie
taCa
tarma
nMa
hinog
Mamb
ajao
Alor
ansi
naca
ban
Medin
aNa
awan
Perso
nnel
Servi
ces
49.55
%50
.30%
45.68
%46
.88%
43.02
%73
.48%
62.00
%71
.08%
65.87
%80
.91%
57.33
%47
.86%
MOOE
17.55
%25
.56%
24.17
%33
.86%
18.54
%24
.08%
18.34
%26
.73%
25.54
%13
.35%
16.03
%34
.35%
Capit
al Ou
tlay
1.41%
8.97%
0.00%
4.69%
3.13%
2.44%
7.93%
2.22%
3.19%
0.00%
1.98%
8.11%
Finan
ce C
osts
0.00%
0.00%
0.66%
0.00%
0.00%
0.00%
0.00%
0.00%
0.00%
0.00%
0.00%
5.86%
Subs
idies
14.25
%25
.28%
7.67%
0.00%
10.47
%0.0
0%0.0
0%0.0
0%1.1
0%28
.70%
19.67
%11
.77%
Spec
ial P
rogr
ams
17.24
%0.0
0%21
.81%
14.58
%21
.62%
0.00%
0.00%
0.00%
4.30%
0.00%
4.99%
0.00%
Tab
le 4
: Prio
ritiza
tion
LGU
Fun
ds fo
r the
Dev
olve
d Fu
nctio
ns in
Reg
ion
10, F
ive-
Year
Ave
rage
(200
5-20
09)
Perc
ent s
hare
of
Dev
olve
d Fu
nctio
nsA
gric
ultu
reEn
viro
nmen
tH
ealth
soci
al s
ervi
ces
Tota
l LG
U B
udge
t4.
96%
0.43
%10
.00%
2.61
%B
udge
t for
Eac
h D
evol
ved
Func
tion
Per
sonn
el S
ervi
ces
77.7
3%81
.24%
74.1
3%57
.11%
MO
OE
11.2
9%7.
51%
18.6
9%19
.82%
Cap
ital O
utla
y0.
67%
1.21
%1.
75%
3.22
%Fi
nanc
e C
osts
0.00
%0.
00%
0.00
%0.
00%
Sub
sidi
es0.
00%
0.00
%0.
00%
0.00
%S
peci
al p
rogr
ams
18.1
1%20
.08%
13.4
0%42
.66%
Improved Legislative & Executive Actions
15
Table 5: Prioritization of Provincial Funds for the Devolved Functions in Region 10, Five-Year Average (2005-2009)
Percent share of Devolved Functions
Agriculture Environment Health social services
Total Provincial Budget 3.92% 0.43% 13.98% 1.55%
Personnel Services 72.46% 81.24% 67.91% 43.39%MOOE 5.59% 7.51% 10.39% 14.97%Capital Outlay 0.37% 1.21% 0.97% 1.15%Finance Costs 0.00% 0.00% 0.00% 0.00%Subsidies 0.00% 0.00% 0.00% 0.00%Special programs 32.37% 20.08% 31.59% 61.32%
Table 6: Prioritization of City Funds for the Devolved Functions in Region 10,Five-Year Average (2005-2009)
Percent share of Devolved Functions
Agriculture Environment Health social services
Total City Budget 5.94% 0.00% 7.65% 2.87%Personnel Services 77.29% 0.00% 68.69% 56.71%MOOE 18.11% 0.00% 22.11% 14.55%Capital Outlay 0.74% 0.00% 1.07% 1.45%Finance Costs 0.00% 0.00% 0.00% 0.00%Subsidies 0.00% 0.00% 0.00% 0.00%Special programs 3.85% 0.00% 8.31% 27.29%
Table 7: Prioritization of Municipal Funds for the Devolved Functions in Region 10, Five-Year Average (2005-2009)
Percent share of Devolved Functions
Agriculture Environment Health social services
Total Municipal Budget 5.02% 0.00% 8.36% 3.40%
Personnel Services 83.44% 0.00% 85.78% 71.23%MOOE 10.18% 0.00% 23.58% 29.94%Capital Outlay 0.89% 0.00% 3.19% 7.06%Finance Costs 0.00% 0.00% 0.00% 0.00%Subsidies 0.00% 0.00% 0.00% 0.00%Special programs 0.00% 0.00% 0.31% 39.38%

Rapid Field Appraisal of Decentralization: Region 10
16
customer Service. Copies of the Citizens’ Charter are available in LGUs, in compliance with the requirements of the Anti-Red Tape Act of 2007. Variations in terms of the specific actions undertaken by each LGU to implement RA 9485 were noted. The most common was the availability of the electronic and hard copy versions of the Charter. Several LGUs printed their process flow charts showing the key services of its departments in booklet and/or tarpaulin form(s), which are usually posted at the main entrance of the offices or displayed conspicuously at various strategic areas of the LGUs. Oroquieta City posted its Citizen Charter in its website.
Human resource management. The most common organizational arrangement in the area of LGU human resources management is one in which a regular LGU personnel is designated as the Human Resource Management Officer (HRMO), which is under the supervision of the provincial/ city administrator or the city mayor/provincial governor. LGUs have their Human Resource Development (HRD) Plan, and in the formulation of these plans, there was reference on the directives of the Civil Service Commission and stakeholders’ participation was fully enjoined. But the degree of HRD Plan implementation (e.g. selection and promotion matters) appeared to be directly influenced by the prerogative of the appointing officer and/or by the behavior or affinities of the members of the Personnel Selection Board (PSB).
networking and linkaging. Records of completed projects reported by LGUs reflected long-term linkaging with funding institutions, especially the provincial governments. The participation of cities and/or municipalities in these province-led initiatives was based on the LGUs’ resource capabilities, needs and strong “political” coordination/ties between the provincial government and the city/municipal LGUs. Collaborative undertakings were also developed and sustained between the LGUs and the civil society organizations (CSOs) /people’s organizations (POs) and the business sector in the areas of agriculture, fishery development and social welfare services.
ii. Health and Social Services
Health and nutrition. Among municipal LGUs, the common health and nutrition support includes purchase of medicines and medical, dental and laboratory supplies; provision of sanitation and family planning services; conduct of health and nutrition-related information and education campaign; support to barangay nutrition scholars; and implementation of programs like anti-dengue campaigns and the National Tuberculosis Program.
In city LGUs, programs on health and nutrition includes purchase of medicines and medical/dental/laboratory supplies, financing annual special projects such as kidney and renal diseases control program, family planning, Garantisadong Pambata program,
Improved Legislative & Executive Actions
17
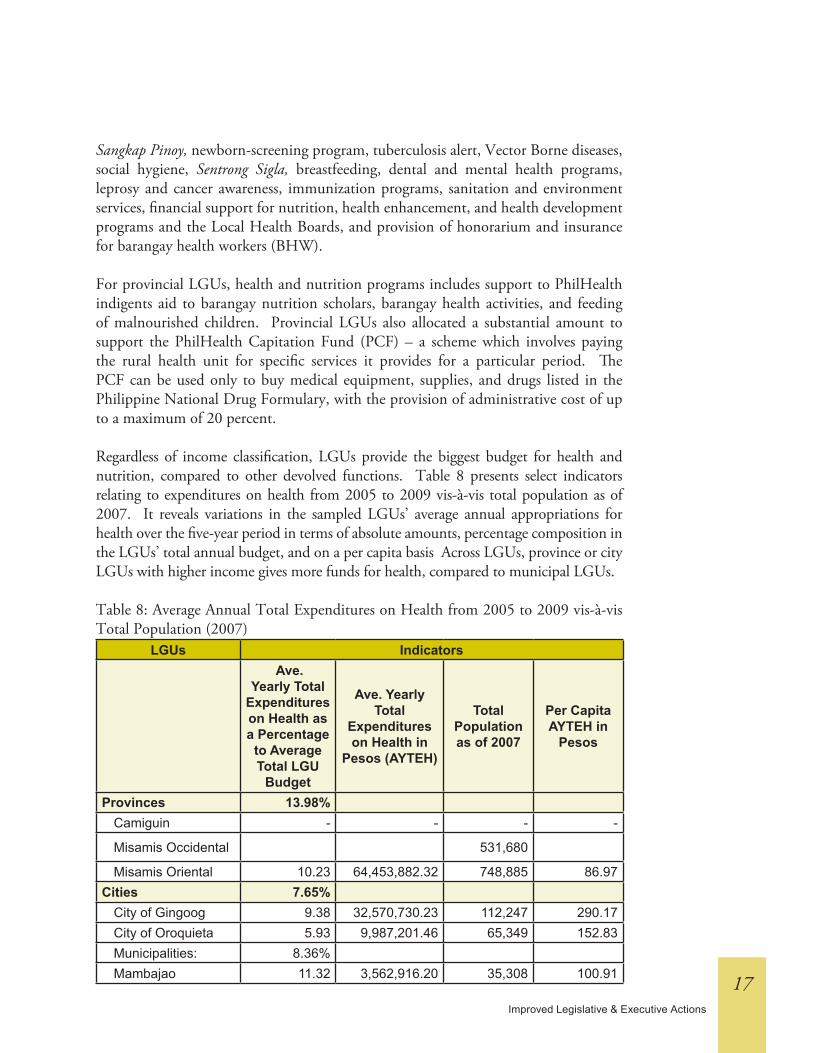
Sangkap Pinoy, newborn-screening program, tuberculosis alert, Vector Borne diseases, social hygiene, Sentrong Sigla, breastfeeding, dental and mental health programs, leprosy and cancer awareness, immunization programs, sanitation and environment services, financial support for nutrition, health enhancement, and health development programs and the Local Health Boards, and provision of honorarium and insurance for barangay health workers (BHW). For provincial LGUs, health and nutrition programs includes support to PhilHealth indigents aid to barangay nutrition scholars, barangay health activities, and feeding of malnourished children. Provincial LGUs also allocated a substantial amount to support the PhilHealth Capitation Fund (PCF) – a scheme which involves paying the rural health unit for specific services it provides for a particular period. The PCF can be used only to buy medical equipment, supplies, and drugs listed in the Philippine National Drug Formulary, with the provision of administrative cost of up to a maximum of 20 percent.
Regardless of income classification, LGUs provide the biggest budget for health and nutrition, compared to other devolved functions. Table 8 presents select indicators relating to expenditures on health from 2005 to 2009 vis-à-vis total population as of 2007. It reveals variations in the sampled LGUs’ average annual appropriations for health over the five-year period in terms of absolute amounts, percentage composition in the LGUs’ total annual budget, and on a per capita basis Across LGUs, province or city LGUs with higher income gives more funds for health, compared to municipal LGUs.
Table 8: Average Annual Total Expenditures on Health from 2005 to 2009 vis-à-vis Total Population (2007)
LGUs Indicators Ave.
Yearly Total Expenditures on Health as a Percentage
to Average Total LGU
Budget
Ave. Yearly Total
Expenditures on Health in
Pesos (AYTEH)
Total Population as of 2007
Per CapitaAYTEH in
Pesos
Provinces 13.98%Camiguin - - - -
Misamis Occidental 531,680
Misamis Oriental 10.23 64,453,882.32 748,885 86.97Cities 7.65%
City of Gingoog 9.38 32,570,730.23 112,247 290.17City of Oroquieta 5.93 9,987,201.46 65,349 152.83Municipalities: 8.36%Mambajao 11.32 3,562,916.20 35,308 100.91
Rapid Field Appraisal of Decentralization: Region 10
18
LGUs IndicatorsAloran 10.00 2,931,870.88 23,450 125.03Medina 9.14 3,609,604.04 31,173 115.79Catarman - 1,527,627.60 13,892 109.96Mahinog 22.29 1,847,717.00 13,168 140.32Naawan 7.74 2,648,078.9 17,988 142.21Sinacaban 9.25 2,495,051.13 16,772 148.76
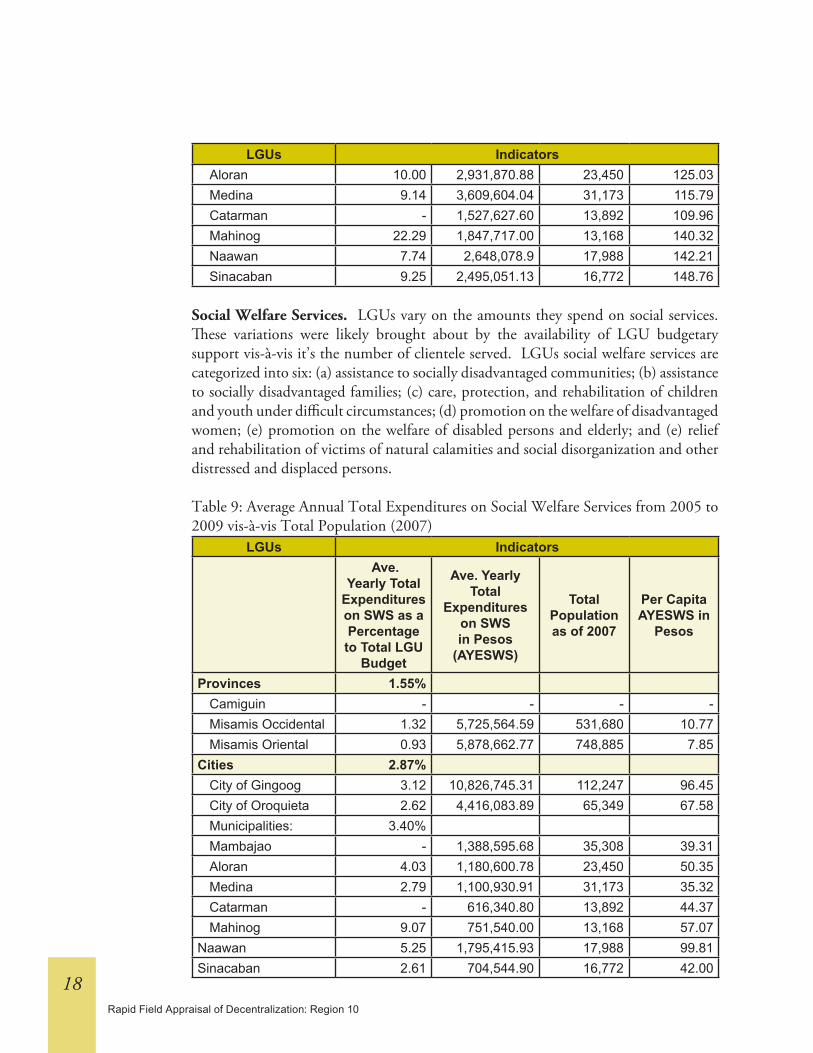
Social Welfare Services. LGUs vary on the amounts they spend on social services. These variations were likely brought about by the availability of LGU budgetary support vis-à-vis it’s the number of clientele served. LGUs social welfare services are categorized into six: (a) assistance to socially disadvantaged communities; (b) assistance to socially disadvantaged families; (c) care, protection, and rehabilitation of children and youth under difficult circumstances; (d) promotion on the welfare of disadvantaged women; (e) promotion on the welfare of disabled persons and elderly; and (e) relief and rehabilitation of victims of natural calamities and social disorganization and other distressed and displaced persons.
Table 9: Average Annual Total Expenditures on Social Welfare Services from 2005 to 2009 vis-à-vis Total Population (2007)
LGUs Indicators Ave.
Yearly Total Expenditures on sWs as a Percentage to Total LGU
Budget
Ave. Yearly Total
Expenditures on sWs in Pesos
(AYEsWs)
Total Population as of 2007
Per CapitaAYEsWs in
Pesos
Provinces 1.55%Camiguin - - - -Misamis Occidental 1.32 5,725,564.59 531,680 10.77Misamis Oriental 0.93 5,878,662.77 748,885 7.85
Cities 2.87%City of Gingoog 3.12 10,826,745.31 112,247 96.45City of Oroquieta 2.62 4,416,083.89 65,349 67.58Municipalities: 3.40%Mambajao - 1,388,595.68 35,308 39.31Aloran 4.03 1,180,600.78 23,450 50.35Medina 2.79 1,100,930.91 31,173 35.32Catarman - 616,340.80 13,892 44.37Mahinog 9.07 751,540.00 13,168 57.07
Naawan 5.25 1,795,415.93 17,988 99.81Sinacaban 2.61 704,544.90 16,772 42.00

Improved Legislative & Executive Actions
19
Peace and order. The average monthly crime rates (AMCR) for index and non-index crimes recorded vary widely across all LGUs. The city of Oroquieta posted the highest AMCR at 163.42 crimes per 100,000 population. Excepting Mahinog, Catarman, and Sinacaban, municipal LGUs generally indicate lowest AMCRs.
Municipalities generally show the highest crime-solution efficiencies (except Sinacaban, which posted a very low efficiency of 28 percent), followed by provinces. In terms of actual police strength, it is perplexing to note that compared to cities, municipal and provincial LGUs appear to be more compliant in maintaining the number of their policemen in accordance with the recommended ideal police strength of 1:500 (policeman to population ratio).
Figure 4 indicates the AMCR for cities to be widely fluctuating between 2005 and 2009. In contrast, those for provincial LGUs appear to be slightly increasing over the years, while municipalities exhibit a more or less constant pattern.
Figure 4: Average Monthly Crime Rate
Figure 5: Crime Solution Efficiency

Rapid Field Appraisal of Decentralization: Region 10
20
The actual police strengths across LGU appear to be decreasing over the years. No direct relationship, however, could be inferred between the declining police strength vis-à-vis the behaviour of crime solution efficiency or the AMCR curves in general, except in the case of provinces where the AMCR appears to be increasing over the years. What probably helped in taming the incidence of crimes in these LGUs was enhanced police visibility, coupled with active participation from local government units and the community. The creation of the Peace and Order Councils in the LGUs and the nationwide activation (starting June 25, 2009) of the Barangay Peacekeeping Action Teams (BPATs) are just two of the many strategic ingredients essential in the anti-criminality campaign of the PNP in these areas.
iii. local Economic development
General Economic condition. Region 10 is the fastest growing region in Mindanao. Its strategic location, abundant natural resources, highly skilled workforce serving the needs of the industrial, commercial, and financial establishments, and the generally peaceful and orderly environs make it very attractive to investors and tourists.
Northern Mindanao’s economy was growing at a stable rate until year 2007, leading other Mindanao regions. In 2008, when the Philippines experienced a slowdown and registered a growth of only 3.8 percent, Northern Mindanao’s growth decreased by 2.4 percent. It consequently posted a growth of only 5 percent – and yet ended up recording the fastest growth in all regions of the country. In 2008, Northern Mindanao posted a real Gross Regional Domestic Product (GRDP) of P71,169,547 – the biggest so far in Mindanao. In terms of the regional contribution to national output for the years 2007 and 2008, Region 10 ranks fifth.
Figure 6: Actual Police Strength (as percent of ideal)
Improved Legislative & Executive Actions
21
Regional output is led by the service sector, with Agriculture, Fishery and Forestry contributing an average of 30 percent for the past five years, while Manufacturing constitutes an average of 22 percent of GRDP. According to the 2008 NSCB report, the country’s Agriculture, Fishery and Forestry sector continued to grow but at a slower rate. Northern Mindanao posted the highest growth rate in these sectors, growing at 11 percent, or 4 percent higher than its growth in the previous year. This trend could be attributed to the aggressive program for the development of agriculture and fisheries implemented by most of the LGUs in the region.
Real GRDP per capita is one of the measures of economic well-being of the people. For Region 10, real GRDP per capita has been rising continuously in the past five years at an annual average rate of 4 percent. Unemployment rate in the region has been on a downward trend, except in 2007, when it increased by 2.6 percentage points.
The region posted a poverty incidence of 44 percent in the 2006. Among the region’s provinces, Misamis Occidental has the highest incidence of poverty at 54 percent while Misamis Oriental has the lowest, with a poverty incidence of 35 percent, way lower than the regional average.
Another measure of well-being is the human development index (HDI). This is an indicator that takes into account human capability, functioning and opportunities. For the three provinces included in this study, HDIs show a slight improvement in 2006 compared to the levels in 2003.
agriculture. In consonance with their plans, the LGUs have undertaken some economic development initiatives, particularly in the agriculture and fisheries sector.
LGUs have provided various programs and projects to support agricultural production and development from the budgetary allocation for this sector. These include infrastructure development (farm-to-market roads, irrigation facilities, farmers’ training center, and seedling nursery); strengthening and expansion of animal production, breeding, and dispersal; crop production including the provision of seeds; community organizing; the provision of farm supplies, machineries and equipment; and, technical training. LGUs also sought financial support from the national government and other funding institutions in financing some of the projects, given that as a devolved function, agriculture is getting only a small share of the LGU budget.
Aloran for example, has provided a very substantial listing of the projects and programs for agriculture that the local government has delivered since 2001. These include providing farm materials and supplies (fertilizers, pesticides), equipment (tractors with trailer, dryers, sheller, thresher, and chipper), infrastructure development (farm-to-market road, irrigation), animal production and dispersal, and livelihood training.
Rapid Field Appraisal of Decentralization: Region 10
22
fisheries. Fishing is also one of the major economic activities in Region 10, considering that it has a very long stretch of coastal waters. Just as in agriculture, LGUs have undertaken initiatives in the area of fisheries development. Some programs are funded purely from LGU funds while others are in partnership with the national government and other funding agencies. A few LGUs are even able to source funds from foreign agencies like the Australian Agency for Internatioanl Development (AusAID) and New Zealand Agency for International Development (NZAID). Projects commonly undertaken by the LGUs include mangrove rehabilitation and development, establishment of fish sanctuaries and marine protected areas, hatchery development and fingerling distribution, aquaculture and seaweed culture, acquisition of fishing gear materials and supplies, fish processing, community organizing (Bantay Dagat), formation of fishing cooperatives, and surveillance against illegal fishing.
industry Promotion. This study noted some important indicators of LGU initiatives for the promotion of the development of agriculture, fisheries and manufacturing. These are shown in terms of the presence of a local investment code/investment incentive program, presence of a simplified licensing system, partnership with the chamber of commerce and industries, presence of an active website, migration desk and desk in-charge for industry promotion. LGUs in Region 10 have undertaken programs for the promotion of the agriculture, fishing, and manufacturing sectors focused particularly on livelihood and skills training. A few LGUs, specifically cities, have already developed websites, along with a simplified system of business license processing and an operational Local Investment Code, which are very important in attracting investors in the area and in helping spur economic activity.
tourism development. Tourism and tourism-related activities are a growing source of LGU revenues. Tourism is developing into a provider of employment and business opportunities to local folk. This was evident in one province that had significantly higher tourist numbers compared to other LGUs. Based on the 2005 to 2009 tourist classification profile taken from the Tourism Office of the Province of Camiguin, municipalities within the province were able to receive an annual average of 264,575 tourists consisting of domestic travelers (85 percent), Panaad (10 percent), foreigners (3 percent), and Balikbayan (0.4 percent). The average yearly growth rate of the province’s tourist arrivals was 25 percent. institutions and organizations Supporting Economic development. LGUs would not be able to successfully implement their development initiatives in the absence of some institutions or organizations who worked hand in hand with them. These include associations of farmers, fisherfolk, women, and rural youth, as well as multipurpose cooperatives. In Camiguin, the provincial government implemented programs aimed at organizing, reorganizing, or strengthening the Rural Improvement Club, 4-H Club, farmers’ organizations, fisherfolk’s associations, the multisectoral Bantay Dagat, FARMC/BFARMC, MAFC/PAFC, and lanzones growers.

Improved Legislative & Executive Actions
23
iv. Environment management urban management. The LGUs exhibited varying degrees of concern for the environment. For solid waste management, most LGUs have an approved Solid Waste Management (SWM) Plan. Cities are responding more and implementing RA 9003 or the Solid Waste Management Act of 2000 (e.g. construction of material recovery facilities at various barangays, livelihood opportunities via waste recycling, and creation and operationalization of the Solid Waste Management Board, compared to municipalities.
Most of the LGUs’ programs on renewal and rehabilitation of the environment include reforestation, and mangrove and riverbank development. A few were able to put up eco-parks. LGUs have also put in place programs related to soil utilization and conservation. These include the promotion of the use of contour/salt farming systems, tree planting and reforestation, and the use of organic fertilizer.
Intensive and aggressive programs are also being undertaken in waterworks and water-quality management. The region’s fast-growing population is putting pressure on the demand for water. Aside from being a basic need, adequate and sustainable supply of water is a necessary precondition for the promotion of investment and tourism in the region. LGUs perform regular monitoring of water quality and rehabilitation of their water systems, while most of them have also installed flood control system like dams, river dikes, seawalls, and the planting of trees along riverbanks.
coastal management. Generally the percentage of live coral reefs in the region has remained constant for the past six years except in Gingoog, where this has been observed to be decreasing. Some sample sites, however, now have more live coral reefs, especially Medina.
Data show that the implementation of all programs and the enforcement of laws related to coastal resource management is a collaborative effort of several institutions organized by the local governments for the purpose. Among the factors cited as contributing to the increase in coral reefs in the region include the establishment of Marine Protected Areas, Coastal Resource Management Team, Bantay Dagat volunteers, implementation of coastal resource projects, and strong collaboration between the LGUs, NGOs, POs and the community for the stricter enforcement of laws. Factors believed to hinder the increase in coral reefs include illegal fishing, coral bleaching, community indifference to the program, and weak implementation of laws.
Although limited, data shows high regional average compliance rating for coastal ecosystem protection and laws against illegal fishing. This means that in terms of implementation, stricter enforcement is focused on fishing and coastal protection. The

Rapid Field Appraisal of Decentralization: Region 10
24
region has a very long coastline and is very rich in coastal resources. Apparently, protection of these resources is considered among the priorities of the local governments. This also explains why LGUs are conducting various programs for fisheries development.
forestry and upland Ecosystems. Of the estimated forestland area of the region, approximately around 65.03 percent is covered. Current reforestation activities are still inadequate to fully cover the remaining 35 percent of the region’s forestland. Among the forestry-related issues faced by the LGUs are the presence of small-scale illegal logging, soil erosion and natural calamities, timber poaching, and the unauthorized selling of rights to occupy/use these government-owned lands. To date, there is no recorded significant and relevant LGU initiative undertaken for the protection of forests and the implementation of forest laws. This seems to be one aspect of the environment that local officials may have taken for granted.
Economically, Northern Mindanao is leading other Mindanao regions in growth and development. Yet if environmental protection programs are not properly adopted, this growth can never be sustained. Among others, the following factors can help increase forest cover in the region:
• LGU reforestation projects• Strict law enforcement• Collaboration between LGU, NGOs, POs
These factors, meanwhile, can prevent the increase in forest cover:• Illegal logging• Population growth
Like in the drafting of the development plan and land use plan of local governments, stakeholders should also get involved in the planning and implementation of forest protection laws and programs. Notably, the degree of participation is generally high from the planning to the implementation stage. This is indicative of the high level of community awareness and commitment to the development of the locality.
Thus far, the perceived rating of the LGUs of Northern Mindanao on Forest Resource Management is moderate. This indicates that the region has still a lot more to do to protect, maintain and develop its forest resources in general. The major constraint that mitigates the development of forest resources, however, is the fact that municipal and city LGUs do not have designated offices and specific appropriation in their budget that is directly intended for environmental programs. In the absence of funds, LGUs find it difficult and challenging to conduct various programs related to the protection and maintenance of the environment.

Improved Legislative & Executive Actions
25
concluSion
The findings for region 10 pointed out the following conclusions:
In the area of local governance and administration, LGUs have generally exercised their respective local autonomies through initiatives that allows multisectoral participation via transparent mechanisms (e.g. presence of Citizen’s Charter, conduct of social marketing activities) that facilitated stakeholders’ access to LGU information on its services, plans, programs, and special events. Increased capacity to formulate and approved responsive and relevant local legislation (i.e. directed on the adaptation or localization of national laws) were observed to be aggressively undertaken more by cities.
On resource generation, LGUs are still IRA-dependent, although cities tend to be bolder in tapping external sources of funds for funding long-term projects. LGUs tended to allocate more for PS, less for MOOE, and even nil for capital outlays. For devolved functions, LGUs put premium first on primary health care, second on agriculture, followed by social services and lastly, environmental management. Finally, collaborative undertakings between sample LGUs and the CSOs/POs/business sector were exploited, developed, and sustained. Records of completed projects reflected long-term linkaging with foreign grant-making institutions, mostly by provincial and city governments.
Variations in average annual appropriations for health in terms of absolute amounts, percentage composition to total LGU budget, and per capita basis, were noted across LGUs. Between provinces and cities, higher-income provinces or cities had more funds for health. Improvements in health indicators were recorded, though not that significantly, probably because of increasing population and inflationary pressures. Peace and order condition as measured by average monthly crime rate over the last five years varies widely across LGUs, with cities posting highest figures.
LGUs have undertaken various programs and projects to support the agriculture and fisheries sectors. Given that as a devolved function, agriculture was getting only a small share of the local budget, some LGUs sought financial support from national government agencies, while a few tapped foreign assistance for the development of these sectors. The promotion of local economic development is continuously promoted and supported by the LGUs through the presence of local investment codes/investment incentive programs, simplified licensing systems, partnerships with the chamber of commerce and industries, presence of active websites, migration desks and desks in-charge for industry promotion.
On environment, Region 10, LGUs have generally undertaken aggressive programs and projects in the areas of managing urban, coastal and forest/upland ecosystems despite the very limited budgetary allocations for environmental protection and conservation. Economically, Northern Mindanao has been leading other Mindanao regions in growth and development, but if environmental management programs are not properly adopted, this growth can never be sustained.
Rapid Field Appraisal of Decentralization: Region 10
26
rEfErEncES
Accomplishment Report, CY 2004-2009 of Respective Departments, City of Oroquieta.
“Actual Program Appropriations and Obligations by Object for Devolved Functions (Agriculture, Health, Social Welfare Services, Environment) for FY 2005 to 2007.” Provincial Budget Office of Misamis Occidental.
“Actual Statement of Receipts for FY 2005 to 2007 per Province/City/Municipality.” Provincial Budget Office of Misamis Occidental.
Annual Accomplishment Report for the City of Gingoog for CY 2005.
Annual Accomplishment Report FY 2009 for the Province of Camiguin.
“Estimated Program Appropriations and Obligations by Object for Devolved Functions (Agriculture, Health, Social Welfare Services, Environment) for FY 2008 to 2009.” Provincial Budget Office of Misamis Occidental.
“Estimated Statement of Receipts for FY 2008 to 2009 per Province/City/Municipality.” Provincial Budget Office of Misamis Occidental.
State of the Province Address for 2009 for the Province of Camiguin.
State of Local Governance Reports: Municipality of Catarman, CY 2007 and 2008; Municipality of Mahinog, CY 2008; Province of Camiguin, CY 2006 and 2007.

About the WriterProfessor Julita Wong Bokingo is the Dean of the College of Business
Administration, Mindanao State University-Iligan Institute of Technology (MSU-IIT) and currently is a PhD candidate for the degree in Sustainable
Development Studies at the MSU-IIT. Professor Bokingo has expertise in marketing management, entrepreneurship education, business management, local governance, and public economic enterprises.
She also served as independent consultant for several projects of the Department of Health, the SOPREX Foundation, and was team leader
of the MSU-IIT for the 2009 Philippine Cities Competitiveness Ranking Project by the Asian Institute of Management Policy Center. Professor Bokingo has conducted various seminars, trainings, and workshops on
entrepreneurship, technology of participation (ToP), project monitoring and evaluation (M&E), and capacity-building at the national, regional,
and local government levels.