Perception-Based Histogram Equalization for Tone Mapping ...
Upload
muhammad-abubakarCategory
view
215download
0
Range Limited Peak-Separate Fuzzy HistogramEqualization for image contrast enhancement
Shangbo Zhou & Fuping Zhang &
Muhammad Abubakar Siddique
# Springer Science+Business Media New York 2014
Abstract Histogram equalization is a well-known technique for enhancing image contrast forits simplicity and effectiveness. However, the existing approaches to this technique maychange the contrast so sharply that it is unsuitable to be implemented in consumer electronics.In this paper, we propose a novel histogram equalization method referred to as Range LimitedPeak-Separate Fuzzy Histogram Equalization (RLPSFHE), which aims to gain a good trade-off between mean-brightness preservation and contrast enhancement, so that it can be appliedin consumer electronics. In the RLPSFHE, fuzzy statistics is applied to deal with digitalimages for their representation, and a set of peaks is calculated from the crisp fuzzy histogram,which is a set of points for separation. Since then, the input fuzzy histogram can be dividedinto several segments with those points of peak. After that, an intensity factor is employed tocontrol the intension of brightness preservation when a range limited method is used to processeach sub-histogram, the experimental results show that the RLPSFHE can achieve a bettertrade-off between mean-preservation and contrast enhancement.
Keywords Fuzzy histogram . Peaks . Range limited . Intensity factor . Mean-brightnesspreservation . Histogram equalization
1 Introduction
Histogram equalization (HE) is one of the most typical techniques for image enhancement,unlike other complex algorithms such as methods based on fractional-order [2, 7, 17] orwavelet theory [8, 14]. Although these algorithms may get a better performance than HE butmore time will be required when they are implemented so that these methods are unsuitable tothe fields of consumer electronics and medical image processing. However, HE is a techniquewhich is famous for its simplicity and validity, and it can produce an image that subjectively
Multimed Tools ApplDOI 10.1007/s11042-014-1931-4
S. Zhou : F. Zhang :M. A. SiddiqueKey Laboratory of Dependable Service Computing in Cyber Physical Society, Ministry of Education,Chongqing University, Chongqing 400030, China
S. Zhou (*) : F. Zhang :M. A. SiddiqueCollege of Computer Science, Chongqing University, Chongqing 400030, Chinae-mail: [email protected]

looks better than the original one by changing its pixel intensities. Global histogram equali-zation (GHE) [20] is one of the most commonly used methods based on histogram equaliza-tion. The GHE is basically using the intensity distribution of the whole image, and this willresult in undesirable artifacts in the processed images, so the GHE is rarely introduced inconsumer electronics such as TV, digital cameras etc.
In recent years, to overcome the flaws of the GHE mentioned above, many researchers haveproposed plenty of effective algorithms. These methods can be broadly categorized by thenumber of sub-histogram for equalization, which are two-segments or multi-segments (theamount of sub-histograms are more than three) based. Methods based on two-segmentsinclude Brightness preserving Bi-Histogram Equalization (BBHE) [10], which separates thewhole histogram into two parts with input mean brightness. Minimum Mean Brightness ErrorBi-Histogram Equalization in Contrast Enhancement (MMBEBHE) [3] is an extension ofBBHE, which is separated by the threshold level obtained through the minimum AbsoluteMean Brightness Error (AMBE). Equal Area Dualistic Sub-Image Histogram Equalization(DSIHE) [21] is also similar to BBHE except that the histogram creating of the DSIHE isbased on the median value. Range Limited Bi-Histogram Equalization for image contrastenhancement (RLBHE) [23] is another algorithm of this category, its threshold for histogramseparation is calculated by Otsu’s method [15]. Threshold calculated by this method canseparate the objects from the background effectively. There are still many algorithms basedon two-segments [5, 16, 19]. However, there are also many kinds of algorithms based onmulti-segments. Recursive Sub-Image Histogram Equalization (RMSHE) [4] is a recursivealgorithm of the BBHE. Brightness Preserving Dynamic Fuzzy Histogram Equalization(BPDFHE) [18] also divides its histogram into multi-histograms, where the thresholds areobtained at the peaks of the crisp histogram. To tackle the vagueness of gray level valueseffectively, the BPDFHE uses fuzzy statistics of digital images for their representation andprocessing. Image Contrast Enhancement for Preserving Mean Brightness without losingimage features [9] yields its thresholds by calculating its mean brightness and standarddeviation for each recursion level, which leads to an optimum PSNR. And there are alsomany other algorithms can be classified as multi-segments [1, 6, 11–13, 22].
These approaches can improve the performance of histogram equalization, but they are notso effective in some situations. The BBHE and the DSIHE cannot preserve the mean image-brightness well when the middle gray level is differing from the mean or average gray level.The RMSHE produced better results over the BBHE in mean image-brightness preservation,while if the recursion level is large, the effect of contrast enhancement will be reduced rapidly.The BPDFHE uses fuzzy-histograms to handle the inexactness of gray level values, but thismethod will also face the same problem as the RMSHE in crisp histogram if it has too manypeaks. The RLBHE uses a threshold calculated by Otsu’s method to separate the histograminto two parts, then a range limited method is employed to preserve the mean brightness ofeach part. Good results can be achieved with this approach, but in some conditions Otsu’smethod cannot separates the objects from the background strictly, the results are un-stabilized.
In this paper, a novel contrast enhancement method called Range Limited Peak- SeparateFuzzy Histogram Equalization (RLPSFHE) is proposed to enhance the contrast of an imagewith a good preservation of mean image-brightness and a natural contrast enhancement. Thismethod is a comprehensive and extension of the RLBHE and the BPDFHE. To achieve bettercontrast enhancement and avoid over enhancement, thresholds taken from peaks of the crispfuzzy histogram, for remapping the peaks will lead to perceivable changes in mean image-brightness [18]. But this method may reduce the equalization effect if there are too manypeaks. So we will restrict the number of thresholds by giving a threshold of region-size foreach sub-histogram; then an intensity factor is applied to control the intension of contrast
Multimed Tools Appl

enhancement when a limited range method [23] for contrast enhancement is employed for eachsub-histogram. Experimental results show that the proposed method can give a better perfor-mance than other state-of-the-art algorithms in the case of a wide range of natural digitalimages. The performance of the proposed method will be evaluated through qualitative andquantitative evaluations.
The rest of this paper is organized as follows; the GHE and the RLBHE for digital imagesare reviewed in Sections 2. The proposed method is presented in Section 3. Section 4 lists acomparison of the RLPSFHE with some other existing methods, and presents some mathe-matical analysis. Section 5 concludes this paper.
2 Rudimentary knowledge
This section covers the details regarding the GHE and the RLBHE as well as their mathemat-ical analysis in mean image-brightness preservation. This is basically a restatement of [20] and[23].
2.1 Global histogram equalization
Let’s suppose that X={X(i, j)} denotes a digital image, where X(i, j) denotes the graylevel of the pixel at (i, j). The total number of the image pixels is N, and the imageintensity is digitized into L levels that are {X0,X1,…,XL−1}. Suppose nk denotes thetotal number of pixels with gray level of Xk in the image, then the probability densityof Xk will be
p X kð Þ ¼ nk=N ; k ¼ 0; 1;…; L−1: ð1Þ
The relationship between p(Xk) and Xk is defined as the probability density function (PDF),and the graphical appearance of PDF is known as the histogram. Based on the image’s PDF, itscumulative distribution function (CDF) is defined as
c X kð Þ ¼Xi¼0
k
p X kð Þ; ð2Þ
where, k=0,1,…,L−1. It is obvious that c(XL−1)=1. Thus the transform function of histogramequalization can be defined as
f X kð Þ ¼ X 0 þ XL−1−X 0ð Þc X kð Þ; k ¼ 0; 1;…; L−1: ð3ÞSuppose Y={Y(i,j)} is a equalized image of X, then
Y ¼ f Xð Þ ¼ f X i; jð Þð Þ ∀X i; jð Þj ∈Xf g: ð4Þ
2.2 Range Limited Bi-Histogram Equalization
The RLBHE is an extension of the BBHE, it is defined in the following steps:
1) Choosing a proper threshold for histogram equalization.2) Determine the upper and the lower bounds for histogram equalization.3) Equalize each partition independently.
Multimed Tools Appl

2.2.1 Choosing a proper threshold for histogram equalization
As we have described above, the RLBHE is a two-segment based method. In the RLBHE,Otsu’s method is used to get the threshold.
σ2 XTð Þ ¼ WL E XLð Þ−E Xð Þð Þ2 þWU E XUð Þ−E Xð Þð Þ2: ð5Þwhere XT is the threshold for histogram separation, XL and XU are the sub-images partitionedby XT; E(XL) and E(XU) stand for the average brightness of the two sub-images respectively;WL and WU stand for the probability of each sub-images, which calculated by WL ¼ nL
N andWU ¼ nU
N , respectively.Thus the threshold XO can be calculated through the procedure of seeking the maximum of
the inter-classes:
XO ¼ arg maxXT
σ2 XTð Þ; T ¼ 0; 1; 2;…; L−1� �
: ð6Þ
2.2.2 Determine the upper and the lower bounds for histogram equalization
Although the threshold taken by Otsu’s method can effectively separate the objectsfrom the background, the mean brightness may not be strictly constrained. So theRLBHE proposed a novel method to constrain the mean image-brightness, the meanimage-brightness of the output image of bi-histogram equalization using XO is obtain-ed by Eq. (7).
E Yð Þ ¼ E Y X ≤XOjð Þp X ≤XOð Þ þ E Y X > XOjð Þp X > XOð Þ: ð7ÞFormula (7) can be decomposed to be
E Yð Þ ¼ 1
2X l þ XOð Þ
Xi¼l
O
p X ið Þ !
þ X u þ XO þ 1ð Þ 1−Xi¼l
O
p X ið Þ !" #
; ð8Þ
where, Xl and Xu are the lower and the upper bound of the input histogram. Theminimum Absolute Mean Brightness Error (AMBE) is applied to preserve the mean-brightness:
AMBE X0u;X
0l
� �¼ arg min
X0u;X
0l
E Yð Þ−E Xð Þj jf g; ð9Þ
where, E(X) denotes the original mean image-brightness, which can be defined as
E Xð Þ ¼ Xm ¼Xj¼l
u
X jp X j
� �: ð10Þ
Then the formula (9) can be simplified to be
AMBE X0u;X
0l
� �¼ arg min
X0u;X
0l
aX0l þ 1−að ÞX 0
u−b� �2�
; ð11Þ
Multimed Tools Appl
where, a ¼ ∑i¼l
O
p X ið Þ , b ¼ 2Xm−XO− 1−∑i¼l
O
p X ið Þ !
. Besides, some constraints should be
applied to Xl′ and Xu
′:
X l ≤X0l ≤XO
XO < X0u≤X u
�: ð12Þ
Then problem in Eq. (11), a unique global optimum can be guaranteed with these twoconstraints in Eq. (12). The optimal Xl
′ and Xu′ respectively minimize AMBE between the
equalized image and the original image.
2.2.3 Equalize each partition independently
The next step in the RLBHE is to equalize each sub-histogram independently; this is same withall bi-histogram equalization methods except for the mapping range, so we will not representhere, one can refer to [10].
3 The proposed algorithm
The RLPSFHE can be defined as follows:
1) Fuzzy histogram computation2) Choosing proper thresholds for histogram separation3) Determine the upper and the lower bounds of each sub-histogram for equalization under
the control of intensity factor4) Equalize each sub-histogram independently
Details of each step will be provided in the following Subsections.
3.1 Fuzzy histogram computation
Since the values of digital image’s gray level are inexactly, using fuzzy statistics of digitalimages for their representation and processing can enable the technique to handle thisdrawback in a better way, which will improve its performance.
Let us suppose that h(l)(l∈{0,1,…,L−1}) denotes the statistic numbers of each gray levelin a histogram, and a fuzzy histogram is a sequence of real numbers h(l). Considering X(i,j) as
a fuzzy number eX i; jð Þ , the fuzzy histogram can be calculated as:
h lð Þ←h lð Þ þXi
Xj
μX̃ i; jð Þl; k∈ a; b½ �; ð13Þ
where, k is the support domain of the membership function, and μX̃ i; jð Þl is the triangular fuzzy
membership function defined as
μX̃ i; jð Þl ¼ max 0; 1−
X i; jð Þ−lj j4
�: ð14Þ
Multimed Tools Appl

3.2 Choosing proper thresholds for histogram separation
The separation of histogram is based on the peaks of crisp fuzzy histogram.The local maxima in the fuzzy histogram are located by using the first and second
derivative of the fuzzy histogram [18]. Since the histogram is a discrete data sequence, thediscrete derivative can be defined as follow:
h̃ lð Þ ¼ dh lð Þdl
≜h l þ 1ð Þ−h l−1ð Þ
2; ð15Þ
where, h̃ lð Þ represents the first order derivative of the fuzzy histogram h(l), and the secondderivative can be computed through the first derivative as Eq. (16).
h̃˜ lð Þ ¼ dh̃ lð Þdl
¼ h l þ 1ð Þ−h lð Þð Þ− h lð Þ−h l−1ð Þð Þ1
¼ h l þ 1ð Þ−2h lð Þ þ h l−1ð Þ; ð16Þ
where, h̃̃ lð Þ represents the second order derivative of the fuzzy histogram h(l).From Eqs. (13)–(16), the peaks of a histogram can be obtained as (17) for those values of
each gray level where it is zero crossing of the first order derivative along with a negative valueof the second order derivative.
lmax ¼ ljl∈ h̃ l þ 1ð Þ⋅h̃ l−1ð Þ < 0; h̃˜ lð Þ < 0n on o
: ð17Þ
However, if there are too many peaks in a fuzzy histogram, the number of sub-histogramswill be large, which will reduce the equalization effect rapidly; such a problem has beenmentioned at the first section [4]. So we must restrict the number of sub-histograms. There is aparadox that is preserving the mean image-brightness along with increasing the effect ofequalization. The larger the number of sub-histogram is, the better preservation of meanimage-brightness will be, but the less effect of equalization will be too. However, the smallerthe number of sub-histogram is, the more effect of equalization will be, but simultaneously theworse preservation of mean image-brightness will be.
This paper reduces the numbers of sub-histograms to limit the size of each sub-histogram.Through Eq. (17), we can get a set of peaks:
p ¼ p1; p2;…; pnf g; ð18Þwhere, pi,i=1,2,…,n, are the gray levels of each peak. And p can be regarded as a set of pointsfor separation.
And the size of each sub-histogram is as:
Δ ¼ Δ1;Δ2;……;Δn
� �; ð19Þ
where, Δi,i=1,2,…,n, are the sizes each of sub-histogram.The maximum of set Δmax=max{Δ} is chosen as a threshold of restricting the number of
sub-histogram, the chosen procedure steps are as follows:
1) Calculate the size of each sub-histogram Δ={Δ1,Δ2,…,Δn}.2) Chose the maximum of Δ, named as Δmax.3) Compare with the first element ofΔ, ifΔ1<Δmax, then kick p2 out of p, and calculateΔ1
by p1 with p3. This procedure would not stop until Δ1≥Δmax, suppose the matched peakis p5.
Multimed Tools Appl

4) Put p1,p5,…pn into a new set p ′, and then compare the rest interval Δi of sub-histogramswith Δmax by the way of step 3.
5) Repeat step 3 and 4, until a limited number of thresholds p ′ is formed.
Remapping the peaks will lead to perceivable changes in mean image-brightness, but thismethod will reduce the equalization effect if there are too many peaks. So kicking some peaksout of pwill break the preservation of mean image-brightness to some extent, and that will leadto more enhancement of image contrast.
3.3 Determine the upper and the lower bounds of each sub-histogram for equalizationunder the control of intensity factor
Since, a limited number of sub-histograms can be calculated by section of 3.2. But if we onlyapply p ′ to equalize the sub-histogram independently without any further modification, it willchange the brightness of the input image significantly and cause undesirable artifacts. So eachsub-histogram needs to be modified further to preserve the mean image-brightness. Rangelimited equalization for each sub-histogram is proposed to keep the mean brightness [23]. Butunlike [23], in this paper, the mean brightness of each sub-histogram is used as a threshold todivide the input histogram into two independent sub-histograms. Furthermore, in order toachieve a good balance between mean-brightness preservation and contrast enhancement anintensity factor λ is employed to control the intension of brightness preservation.
λE Y ið Þ ¼ E X ið Þ; ð20Þ
The intensity factor λ is determined by mean-brightness of sub-histograms Xmi and theinput-image mean-brightness Xm. Suppose Yi is the output mean, Xi is the ith sub-histogram,and Xmi is the mean of Xi, then ΔEi (ΔEi=E(Yi)−E(Xi)) represents the amount of changesbetween the output mean and input mean.
So the factor λ has following properties:
1. When Xmi is near to Xm, that is, to keep the mean-brightness of the original image, then λwill be close to 1, and lim
Xmi→Xm
ΔEið Þ ¼ 0 .
2. When Xmi is away from Xm, that is, to increase the contrast enhancement, then λ will beaway from 1, and lim
Xmi→XL;XU
ΔEið Þ ¼ A , here A is a non-zero const.
The cure of ΔEi can be described as in Fig. 1.The algorithm assumes that the pixels of an image can be thresholded into two classes; one
is bright part and another dark part. More specifically, gray levels above the mean-brightnessXm are bright part, and the others are dark part. To easily identify the images, intra-classvariance of bright part and dark part should be minimized [23]. So we try to achieve that thebright part becomes brighter, and the dark part darker.
Now, let’s back to the attributes of intensity factor λ, it can be more specific:
1. When limXmi→Xm
λ ¼ 1 , then E(Yi)=E(Xi), and the algorithm can keep the mean-brightness
of the ith sub-histogram mostly.2. When lim
Xmi→XL
λ ¼ A1 , and A1∈(1,2); then E(Yi)<E(Xi), and the algorithm makes the dark
part darker.
Multimed Tools Appl

3. When limXmi→XU
λ ¼ A2 , and A2∈(0,1); then E(Yi)>E(Xi), and the algorithm makes the
bright part brighter.
In addition, these attributes must satisfy the equation Eq. (20). A1∈(1,2), because if factor λis too large, the algorithm can’t keep the mean-brightness well. So the size of A1 is suitable,and it’s the same with A2.
The cure of λ can be described as in Fig. 2.According to the definition and properties of intensity factor λ, it can be chosen as λ=g(Xmi−
Xm), here g(⋅) is a nonnegative monotonically decreasing function with g(0)=1, g(−∞)=2 andg(+∞)=0. And to achieve the goal of the RLPSFHE, which is acquiring a good trade-off between
Fig. 1 Curve of ΔE
Fig. 2 Intensity factor curve
Multimed Tools Appl

brightness preservation and contrast enhancement, the intensity factor function should be an S-function within the scope of (1, 2) (Fig. 2). So g(⋅) can be a Sigmoid-type function with adjustingsome parameters as (21).
g xð Þ ¼ 2
1þ ex; ð21Þ
where x=(Xmi−Xm)/a, a is normalization constant, and we take a=50 in our experiment.Now applying the intensity factor λ to the process of searching the upper and the lower
bounds of each sub-histogram, we have
λE Y ið Þ ¼ E Y i X 0i≤X i≤Xmijð ÞPr X 0i≤X i≤Xmið ÞþE Y i Xmi≤X i≤X L−1ð Þi
��� �Pr Xmi≤X i≤X L−1ð Þi� �
:ð22Þ
To maintain the mean brightness, we suppose:
λE Y ið Þ ≈ E X ið Þ ¼ Xmi: ð23ÞThen,
1
2λ X 0i þ Xmið Þ
Xi¼0i
mi
p X ið Þ þ Xmi þ 1þ XL−1ð Þ 1−Xi¼0i
mi
p X ið Þ !" #
≈ Xmi: ð24Þ
From Eq. (22), we can see that Xmi and p(Xi) are determined by the input image and λ iscalculated by function g(⋅). To satisfy Eq. (24), we must modify the range of equalized image,which will find a new bound of this sub-histogram. We replace the upper bound X(L−1)i and thelower bound X0i with two variables X ′ (L−1)i and X0i
′ , which are chosen to yield minimumAbsoluteMean Brightness Error (AMBE) between the equalized image and the original image:
X0L−1ð Þi;X
00i
� �¼ arg min
X0L−1ð Þi;X
00i
X 0i þ Xmið ÞXi¼0i
mi
p X ið Þ þ Xmi þ 1þ X L−1ð Þi� �
1−Xi¼0i
mi
p X ið Þ !" #�����
−2Xmi
λj: ð25Þ
Equation (23) can be simplified as:
X0L−1ð Þi;X
00i
� �¼ arg min
X0L−1ð Þi;X
00i
aX00i þ 1−að ÞX 0
L−1ð Þi−b� �2�
; ð26Þ
where, a ¼ ∑i¼0i
mi
p X ið Þ; b ¼ 2λ −1� �
Xmi− 1−að Þ . Besides, there are some other constraints can
be applied to X0i′ and X(L−1)i
′ [23]:
pi≤X00i≤Xmi
Xmi < X0L−1ð Þi≤piþ1
(; ð27Þ
where, pi and pi+1 are the ith and (i+1)th element of set of the peaks. These two constraints areobvious and the problem of Eq. (26) becomes to be an optimization problem and has a uniqueglobal optimum. And the Optimal X0i
′ and X(L−1)i′ minimize AMBE of the ith sub-histogram so
that guarantee best brightness preservation.
Multimed Tools Appl

3.4 Equalize each sub-histogram independently
After all sub-histograms go through the procedure of 3.3, the next step is to equalize each sub-histogram independently. This is similar to the RLBHE except that the threshold of each sub-histogram is the mean brightness. The final modulation function of ith sub-histogram is asfollows:
fLi¼ X
00i þ Xmi − X
00i
� �cLi X kð Þ; k ¼ 0i; 0iþ 1;…mi; ð28Þ
and
fUi
¼ Xmi þ 1þ X0L−1ð Þi− Xmi þ 1ð Þ
� �cUi X kð Þ; k ¼ miþ 1;miþ 2;… L−1ð Þi: ð29Þ
Note that Eqs. (26) and (27) are remapped to the ranges of [X0i′ ,Xmi] and [Xm+1,X(L−1)i
′ ].Suppose Y is the final output image, and n is the numbers of the thresholds, then Y can be
expressed as
Y ¼ Y i; jð Þf g ¼ YLi∪YUif gi ¼ f Li X Lið Þ∪ fUi
X Uið Þn o
i; i ¼ 1; 2;…n; ð30Þ
where,
YLi¼ f
LiXð Þ ¼ f X i; jð Þ ∀X i; jð Þ ∈ XLijð Þf g; ð31Þ
YUi
¼ fUi
Xð Þ ¼ f X i; jð Þ ∀j X i; jð Þ ∈ XUið Þf g: ð32ÞBased on the description of the ith sub-histogram above, the decomposed sub-image (i=1,
2,…,n) can be equalized independently and the compositions of the resulting equalized sub-images constitute the output of the RLPSFHE.
The flowchart of the proposed method can be summarized as shown in Fig. 3.
4 Experiments and analysis
In this section, the results from previous algorithms and the proposed algorithms aresimulated on various images, and will be compared by qualitative and quantitativeevaluation methods.
Fig. 3 Flowchart of RLPSFHE
Multimed Tools Appl

4.1 Analysis for the brightness preservation of the proposed algorithm
For each single sub-histogram, to keep the mean-brightness mostly, we have:
λE Y ið Þ ¼ E X ið Þ; ð33Þwhere λ is determined by the distance of mean of the sub-histograms and the originalhistogram (Eq. 21).
Without loss of generality, we suppose there are two peaks in the input histogramp={p1,p2}, and the input-image mean-brightness is located between p1 and p2. Wemake the mean-brightness as a pseudo-peak in practice (pm), then the set of peaksturns out to be p={p1,pm,p2}. So the formulation of the output mean-brightness is asfollows:
λE Yð Þ ¼ λ0E Y X 0≤X ≤X p1
��� �Pr X 0≤X ≤X p1
� �þλ1E Y X p1≤X ≤X pm
��� �Pr X p1≤X ≤X pm
� �þλ2E Y X pm≤X ≤X p2
��� �Pr X pm≤X ≤X p2
� �þλ3E Y X p2≤X ≤XL−1
��� �Pr X p2≤X ≤XL−1� � ; ð34Þ
where,
λ0 ¼ 2
1þ e Xm1−Xmð Þ=a
λ1 ¼ 2
1þ e Xm2−Xmð Þ=a
λ2 ¼ 2
1þ e Xm3−Xmð Þ=a
λ3 ¼ 2
1þ e Xm4−Xmð Þ=a
8>>>>>>>>><>>>>>>>>>:: ð35Þ
According to our assumptions, we have non-equality: Xm1<Xm2<Xm<Xm3<Xm4, then 1<λ1<λ0<2, 0<λ3<λ2<1.
There will be some corollaries can be got according to Eqs. (33), (32) and (34).
1. For sub-histogram of [X0,Xp1], we get E(Y1)<E(X1) and ΔE1<0, which means thealgorithm makes the dark part darker.
2. For sub-histogram of (Xp1,Xpm], we get E(Y2)<E(X2) and ΔE2<0, which means thealgorithm makes the dark part darker.
3. For sub-histogram of (Xpm,Xp2], we get E(Y3)>E(X3) and ΔE3>0, which means thealgorithm makes the bright part brighter.
4. For sub-histogram of (Xp2,XL−1], we get E(Y4)>E(X4) and ΔE4>0, which means thealgorithm makes the bright part brighter.
5. For the whole histogram, we get ΔE1<ΔE2<0 and 0<ΔE3<ΔE4, which means thechanges of mean-brightness (ΔE=ΔE1+ΔE2+ΔE3+ΔE4) would not big, but the con-trast enhancement still be increased.
Based on the analysis on 4 cases of the sub-histograms shown above, we can see that theRLPSFHE wants to get a balance between mean-brightness preservation and contrast en-hancement. To be more precise, the algorithm aims to enhance contrast along with a naturallook in the equalized image. And it is not difficult to generalize the algorithm when the numberof peaks is n.
Multimed Tools Appl

While the RLPSFHE sometimes can’t preserve the mean-brightness well, for the result ofAMBE is depended on the location of the input mean-brightness. When Xm is very large orsmall, the changes ofΔE will increase, but the contrast enhancement will be also increased. Inmost case, the RLPSFHE can be implemented effectively.
4.2 Measurement tools to assess image quality
In this subsection, we will apply some quantitative evaluation methods to assess the after-enhancement image quality.
4.2.1 Absolute mean brightness error
The absolute mean brightness error, as we have discussed above, is the absolute of meanbrightness between the input image and the equalized image. This of the AMBE is as:
AMBE ¼ μinput−μequalized
�� ��; ð36Þwhere, μinput is the mean of the input-image, μequalized is the mean of the equalized-image.
4.2.2 Mean structural similarity index
The mean structural similarity index (SSIM) is as bellow:
SSI x; yð Þ ¼2μxμy þ C1
� �2σxy þ C2
� �μ2x þ μ2
y þ C1
� �σ2x þ σ2
y þ C2
� �; ð37Þ
where, μx is the mean of image x, μy is the mean of image y, σx is the standard deviation ofimage x, σy is the standard deviation of image y, σxy is the square root of covariance of image xand y, and C1 and C2 are constants. The mean SSI is
MSSI X ; Yð Þ ¼ 1
M
Xi¼1
M
SSI xi; yið Þ; ð38Þ
where, X and Y are the reference and the reconstructed images, respectively; xi and yi are theimage contents at the ith local window; and M is the number of local windows of the image.
4.3 Experiment and discussion
In order to demonstrate the performance of the proposed method in the preserving andimproving the quality of input-images, we compare its performance with that of other art-to-date methods HE, BBHE, MMBEBHE, RMSHE, RLBHE and BPDFHE on some variousimages. We choose 5 groups of them shown as in Figs. 4, 5, 6, 7, and 8. And in order to assessthe quality of the equalized images, we use criteria based on AMBE and MSSI. Moreover, andthe results are given as in Tables 1 and 2.
In Fig. 4, we can easily observe that the proposed method (RLPSFHE) not only gets a goodpreservation of the overall brightness of the image, but also makes the equalized image looksbetter. From Fig. 4-(h) we can see that glosses on peppers look better than others. Moreover,the RLPSFHE can gain one of the best results in AMBE andMSSI shown as in Tables 1 and 2.Although the MMBEBHE and the RLBHE have the best result of AMBE, but the RLPSFHE
Multimed Tools Appl

has a good performance both in AMBE and MSSI. A good result in MSSI means a goodstructure protection during the processing of contrast enhancement.
In Figs. 5 and 6, the images of dollar and aerial are applied to process through HE, BBHE,MMBEBHE, RMSHE, RLBHE, BPDFHE and the proposed method. It seems theMMBEBHE (Fig. 5-(d)) get the best result in Fig. 5, but the equalized image looks muchdarker than the original one, which is unsuitable to consumer electronics. But if we enlarge theimage of Figs. 5 and 6, we can see that the RLPSFHE obtains a more natural enhancement onimages than others. The RLPSFHE manage to protect the main information of the original
(a) Original image of peppers. (b) Result of HE. (c) Result of BBHE.
(d) Result of MMBEBHE. (e) Result of RMSHE. (f) Result of RLBHE.
(g) Result of BPDFHE. (h) Result of RLPSFHE.
Fig. 4 Experimental results for a peppers image
Multimed Tools Appl

image along with increase the contrast enhancement. What’s more, the RLPSFHE also gainsone of the best results in AMBE and MSSI.
In Fig. 7, we can see that results of the RLPSFHE and the MMBEBHE show better qualityand more details than others, and from Table 1, the RLPSFHE has the best preservation ofmean brightness which gains the minimum AMBE of 4.4341. But it is still not small enoughcomparing with other experiments; the equalized image is much brighter than the original one.From result of the experiment, we can see that the original set of peaks is p={1,23,256},
(a) Original image of dollar. (b) Result of HE. (c) Result of BBHE.
(d) Result of MMBEBHE. (e) Result of RMSHE. (f) Result of RLBHE.
(g) Result of BPDFHE. (h) Result of RLPSFHE.
Fig. 5 Experimental results for a dollar image
Multimed Tools Appl

mean-brightness of the original image Xm=34, and after taking the procedure of limiting thenumber of sub-histogram in Section 4, the modified set of thresholds is p ′={1,34,256}. Thereare two sub-histograms, one is [1,34], the dark part, intensity factor λ0=1.1096; and another is(34,256], the bright part, intensity factor λ1=0.7087. |λ0−1|<|λ1−1| and area of bright part isbigger than dark part. So |ΔE1|<|ΔE2|, that makes the equalized image brighter than othersand AMBE isn’t small. Moreover, we can see that location of Xm is near to X0, Xm is so small
(a) Original image of aerial. (b) Result of HE. (c) Result of BBHE.
(d) Result of MMBEBHE. (e) Result of RMSHE. (f) Result of RLBHE.
(g) Result of BPDFHE. (h) Result of RLPSFHE.
Fig. 6 Experimental results for an aerial image
Multimed Tools Appl
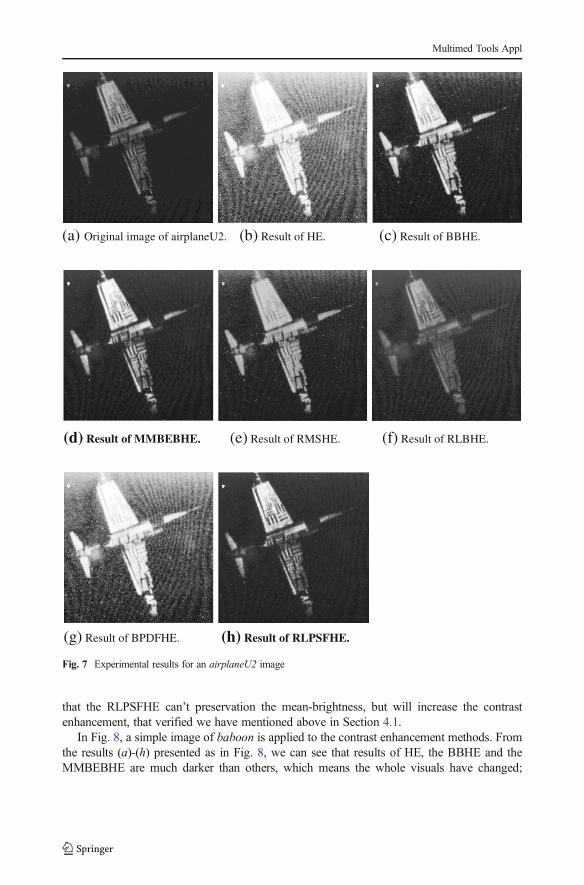
that the RLPSFHE can’t preservation the mean-brightness, but will increase the contrastenhancement, that verified we have mentioned above in Section 4.1.
In Fig. 8, a simple image of baboon is applied to the contrast enhancement methods. Fromthe results (a)-(h) presented as in Fig. 8, we can see that results of HE, the BBHE and theMMBEBHE are much darker than others, which means the whole visuals have changed;
(a) Original image of airplaneU2. (b) Result of HE. (c) Result of BBHE.
(d) Result of MMBEBHE. (e) Result of RMSHE. (f) Result of RLBHE.
(g) Result of BPDFHE. (h) Result of RLPSFHE.
Fig. 7 Experimental results for an airplaneU2 image
Multimed Tools Appl

results of the RMSHE and the RLBHE are almost the same, the enhancement is not enough; itseems that the BPDFHE and the RLPSFHE show the best result, while the RLPSFHE arebetter than the BPDFHE, since that face of (h) is brighter than (g), and (h) shows more glosseson baboon’s nose than (g). With Tables 1 and 2, we can tell that the RLPSFHE gains one of thebest results in AMBE, and the best result of MSSI.
(a) Original image of baboon. (b) Result of HE. (c) Result of BBHE.
(d) Result of MMBEBHE. (e) Result of RMSHE. (f) Result of RLBHE.
(g) Result of BPDFHE. (h) Result of RLPSFHE.
Fig. 8 Experimental results for a baboon image
Multimed Tools Appl

The RLPSFHE is quite differ from the MMBEBHE and the RLBHE, in which thealgorithms are aiming to achieve the minimum changes between the original and the equalizedimage, those methods can get the best result in AMBE, but the equalized image may looksunnatural. The RLPSFHE tries to enlarge the inter-class variance between the foreground andbackground, while keep the mean-brightness by controlling of the intensity factor λ. At thesame time, the RLPSFHE is also differ from the RMSHE and the BPDFHE, in which thealgorithms face the same problem if the recursion level is large, the equalization effect will bereduced rapidly. In the RLPSFHE, the recursion level has been modified.
5 Conclusions
In this paper, a new contrast enhancement algorithm referred as the Range Limited Peak-Separate Fuzzy Histogram Equalization (RLPSFHE) is proposed. The RLPSFHE is a gener-alization of the RLBHE and the BPDFHE in term of brightness preservation and contrastenhancement. The main idea of the RLPSFHE is to separate the fuzzy histogram by the peaksof the histogram, then to modify the set of peaks to break the preservation of brightness insome terms, which helps to increase the effect of equalization. After that an intensity factor isemployed to control the intension of brightness preservation during the process of contrastenhancement for each sub-histogram. The crucial features that led to the success of the
Table 2 Results of MSSI for methods of HE, BBHE, MMBEBHE, RMSHE, RLBHE, BPDFHE and RLPSFHE
HE BBHE MMBEBHE RMSHE RLBHE BPDFHE RLPSFHE
Peppers 0.9009 0.9137 0.9500 0.9382 0.9991 0.9545 0.9747
Dollar 0.6445 0.8710 0.8991 0.8903 0.8672 0.8977 0.9466
Aerial 0.5772 0.7560 0.9105 0.7927 0.9391 0.8163 0.9529
AirplaneU2 0.1568 0.6435 0.8230 0.6764 0.7634 0.2079 0.8987
Baboon 0.7260 0.7398 0.7376 0.8718 0.9223 0.8704 0.8985
Table 1 Results of AMBE for methods of HE, BBHE, MMBEBHE, RMSHE, RLBHE, BPDFHE andRLPSFHE
HE BBHE MMBEBHE RMSHE RLBHE BPDFHE RLPSFHE
Peppers 23.3145 14.0932 0.1595 6.7114 0.9854 1.9434 2.0128
Dollar 44.4363 5.4130 3.1315 8.9378 1.4284 3.4554 3.5017
Aerial 53.1860 10.7870 0.2645 7.4990 1.2664 12.6575 1.6118
AirplaneU2 94.9979 14.7586 6.8495 11.1190 7.6632 64.8990 4.4341
Baboon 0.2705 1.8671 0.5449 4.8089 0.8521 1.1304 1.3069
Multimed Tools Appl

RLPSFHE are good preservation of mean-brightness and structural information, and bettercontrast with low AMBE, high MSSI.
References
1. Abdullah AI, Wadud M, Kabir MH, Dewan MAA et al (2007) A dynamic histogram equalization for imagecontrast enhancement. IEEE Trans Consum Electron 53:593–600
2. Chen DL, Chen YQ, Xue DYet al (2012) Adaptive image enhancement based on fractional differential mask.In Proceedings of 24th Conference on Control and Decision, CCDC 2012, Xian, China, pp 1043–1047
3. Chen SD, Ramli AR (2003) Minimum mean brightness error bi-histogram equalization in contrast enhance-ment. IEEE Trans Consum Electron 49:1310–1319
4. Chen SD, Ramli AR (2003) Contrast enhancement using recursive mean-separate histogram equalization forscalable brightness preservation. IEEE Trans Consum Electron 49:1301–1309
5. Cheng HD, Chen YH, Jiang XH (2000) Thresholding using two-dimensional histogram and fuzzy entropyprinciple. IEEE Trans Image Process 9:732–735
6. Cheng HD, Shi XJ (2004) A simple and effective histogram equalization approach to image enhancement.Digit Signal Process 14:158–170
7. Cuesta E, Kirane M, Malik SA (2012) Image structure preserving denoising using generalized fractional timeintegral. Signal Process 92:553–563
8. Fu JC, Lien HC, Wong STC (2000) Wavelet-based histogram equalization enhancement of gastric sonogramimages. Comput Med Imaging Graph 24:59–68
9. Huang SC, Yeh CH (2013) Image contrast enhancement for preserving mean brightness without losingimage features. Eng Appl Artif Intell 26:1487–1492
10. Kim YT (1997) Contrast enhancement using brightness preserving bi-histogram equalization. IEEE TransConsum Electron 43:1–8
11. Kim M, Chung M (2008) Recursively separated and weighted histogram equalization for brightnesspreservation and contrast enhancement. IEEE Trans Consum Electron 51:1389–1397
12. Kim JY, Kim LS, Hwang SH (2001) An advanced contrast enhancement using partially overlapped sub-block histogram equalization. IEEE Trans Circ Syst Video Technol 11:475–484
13. Lbrahim H, Kong NSP (2007) Brightness preserving dynamic histogram equalization for image contrastenhancement. IEEE Trans Consum Electron 53:1752–1758
14. Lee YH, Kim SS, Park SII et al (2013) Extraction of enhanced evoked potentials using wavelet filtering.Multimedia Tools Appl 63:45–61
15. Otsu N (1979) A threshold selection method from gray-level histograms. IEEE Trans Syst Man Cybern 9:62–66
16. Pei SC, Zeng YC, Ding JJ (2006) Color images enhancement using weighted histogram separation. InProceedings of IEEE International Conference on Image Processing, ICIP 2006, Atlanta, USA, pp 2889–2892
17. Pu YF, Zhou JL, Yuan X (2010) Fractional differential mask: a fractional differential-based approach formultiscale texture enhancement. IEEE Trans Image Process 19:491–511
18. Sheet D, Garud H, Suveer A et al (2010) Brightness preserving dynamic fuzzy histogram equalization. IEEETrans Consum Electron 56:2475–2480
19. Tian YF, Wan QT, Wu FJ (2007) Local histogram equalization based on the minimum brightness error. InProceeding of 4th International Conference on Image and Graphics , ICIG 2007, Sichuan, China, pp 58–61
20. Umbaugh SE (1997) Computer vision and image processing. Prentice Hall, New Jersey21. Wang Y, Chen Q, Zhang BM (1999) Image enhancement based on equal area dualistic sub-image histogram
equalization method. IEEE Trans Consum Electron 45:68–7522. Wang CT, Yu HF (2012) High-capacity reversible data hiding based on multi-histogram modification.
Multimedia Tools Appl 61:299–31923. Zuo C, Chen Q, Sui XB (2013) Range Limited Bi-Histogram Equalization for image contrast enhancement.
Light Electron Opt 124:425–431
Multimed Tools Appl

Shangbo Zhou received the BSc degree from Gangxi National College in 1985, the MSc degree from SichuanUniversity in 1991, both in math, and PhD degree in circuit and system from Electronic Science and TechnologyUniversity. From 1991 to 2000, he was with the Chongqing aerospace electronic and mechanical technologydesign research institute. Since 2003, he has been with the department of computer science and engineering ofChongqing University, where he is now a professor. His current research interests include artificial neuralnetworks, physical engineering simulation, visual object tracking and nonlinear dynamical.
Fuping Zhang received the BSc degree from Chongqing University, Chongqing, China, in 2011. He is currentlypursuing the MSc degree in Chongqing University, Chongqing, China. His research interests include imageprocessing, multimedia retrieval and pattern recognition.
Multimed Tools Appl

Muhammad Abubakar Siddique received the BSc degree in Computer Science and Master in InformationTechnology (MIT) degree from Bahauddin Zakariya University, Multan-Pakistan in 2003 and 2005. He iscurrently pursuing the PhD degree from College of Computer Science, Chongqing University, P R China. Hisresearch interests include multimedia mining and pattern recognition.
Multimed Tools Appl