Rainier Valley Leadership Academy
12
2019-20 ANNUAL STUDENT ACADEMIC PERFORMANCE REPORT by Washington State Charter School Commission Rainier Valley Leadership Academy
Transcript of Rainier Valley Leadership Academy

2019-20 ANNUAL STUDENT ACADEMIC
PERFORMANCE REPORT
by Washington State Charter School Commission
Rainier Valley Leadership Academy

WASHINGTON STATE CHARTER SCHOOL COMMISSION Rainier Valley Leadership Academy Academic Performance Report 2019-20 | 2
SCHOOL OVERVIEW Rainier Valley Leadership Academy
a
Student Demographics STUDENT GROUPS RACE / ETHNICITY Special Education 18% American Indian / Alaskan Native N/A Limited English 21% Asian 2% Low Income 75% Black / African American 76% Hispanic / Latino of any race(s) 11% GENDER Native Hawaiian / Other Pacific Islander 1% Male 47% Two or More Races 8% Female 53% White 2%
6020 Rainier Avenue South, Seattle, WA 98118
School Contact Information 206-659-0956
School Website https://myrvla.org/
Neighborhood Location Seattle School District
Leadership Baionne Coleman
School Mission RVLA’s mission is to prepare students for high school, college, leadership and life by providing a small, college-preparatory program where all stakeholders actively engage in the education process.
Education Program Terms & Design Elements
• Teaching and Instruction: Students will experience effective teaching aligned to our teaching framework and multiple assessments to measure growth and inform instruction. College-going Culture: Students will experience college-going culture by participating in academic counseling, accessing college tours, and taking college preparatory core content.
• Eliminating Barriers to Learning: Students will access the academic intervention, counseling and clinical services as necessary to break down the barriers to learning.
• Promoting Leadership and Life Skills: Students will learn a broad set of tools to prepare them for college and beyond through student leadership opportunities, partnerships with community programs, and attending an Advisory program that will build students’ academic behaviors and college awareness.
Grades Served 6-10
First Year of Operation 2017-18
Total Student Enrollment 320

WASHINGTON STATE CHARTER SCHOOL COMMISSION Rainier Valley Leadership Academy Academic Performance Report 2019-20 | 3
INTRODUCTION Every year, the Washington State Charter School Commission (the Commission) produces an Annual Student Academic Performance Report for each charter school it oversees, for use by the school and other stakeholders.
The report summarizes the school's academic performance according to the most recent data available for the year in review. The report also provides an overview of the charter school's enrollment demographics for the year reviewed.
As a result of COVID-19 related school closures, 2019-20 state assessments were not administered and most if not all of the standard academic performance indicators cannot be evaluated. The report that follows presents all available accountability data.
PURPOSE OF REPORT The Washington State Charter School Commission is committed to promoting high-quality education for public school students in Washington. This Annual Performance Report is produced in order to:
1 Provide timely information to the charter school on its performance relative to the standards and expectations established by applicable federal and state law and the charter contract.
2 Identify the school’s strengths and any areas needing improvement.
3 Provide information that enables the community and the public to understand the school’s performance, including its fulfillment of public obligations.
ACADEMIC PERFORMANCE FRAMEWORK (APF)
The Academic Performance Framework (APF) includes measures that allow the Commission to evaluate charter school academic performance. A charter school that meets the standards in this area is implementing its academic program effectively, and student learning—the central purpose of every school—is taking place.
The APF contains measures that have been grouped according to:
1. STATE AND FEDERAL ACCOUNTABILITY RESULTS answering the question: Is the charter school meeting performance expectations based on the Washington School Improvement Framework? 2. GEOGRAPHIC COMPARISONS answering the question: How are charter school students performing compared to the traditional public schools that students would otherwise attend if they did not attend the charter school? 3. COMPARISON TO SCHOOLS SERVING SIMILAR STUDENTS answering the question: How are charter school students performing compared to schools serving similar students?
4. SCHOOL-SPECIFIC ACADEMIC GOALS answering the question: Did the school meet its school specific academic goals?

WASHINGTON STATE CHARTER SCHOOL COMMISSION Rainier Valley Leadership Academy Academic Performance Report 2019-20 | 4
INDICATOR MEASURE RATING WEIGHT (K-8/HS)
1. State Accountability
1a. WA School Improvement Framework
1a.1. All Students Framework Score
No Rating Applied
30% 30%
1a.2. Subgroup Framework Score 20% 20%
2. Geographic Comparisons
2a.1. Proficiency geographic comparison (ELA/Math/Science) 3% 2.5% 2a.2. Subgroup geographic comparison (ELA/Math/Science) 3% 2.5% 2b.1. All students’ growth geographic comparison (ELA/Math) 4.5% N/A 2b.2. Subgroup growth geographic comparison (ELA/Math) 4.5% N/A 2c.1. Graduation rate geographic comparison
No Rating Applied N/A 2.5%
2c.2. Graduation rate subgroup geographic comparison N/A 2.5% 2d.1. EL Progress
No Rating Applied 1.25% 1.25%
2d.2. Subgroup EL Progress 1.25% 1.25% 2e.1. Regular Attendance
No Rating Applied
1.25% 1.25% 2e.2. Subgroup Regular Attendance 1.25% 1.25% 2f.1. 9th Graders on Track N/A 1.25% 2f.2. Subgroup 9th Graders on Track N/A 1.25% 2g.1. Dual Credit N/A 1.25% 2g.2. Subgroup Dual Credit N/A 1.25%
3. Comparison to Schools Serving Similar Students (Regression)
3a. Proficiency comparison to schools serving similar students No Rating Applied 15% 7.5%
3b. Graduation rate comparison to schools serving similar students
No Rating Applied N/A 7.5%
4. School-Specific Goals
4a.1. School-Specific Goals 15% 15%
Due to COVID-19 impacts on data, ratings were not applied to results. NOTE: Measures 2a.1., 2a.2., 2b.1., 2b.2., and 3a. are weighted evenly by subject.
2019-20 Academic Performance Framework (APF) Data Availability The table below shows the indicators and measures included in the Academic Performance Framework, with the 2019-20 availability, given the lack of state assessment and accountability results.

WASHINGTON STATE CHARTER SCHOOL COMMISSION Rainier Valley Leadership Academy Academic Performance Report 2019-20 | 5
ACADEMIC PERFORMANCE FRAMEWORK INDICATORS 1. STATE ACCOUNTABILITY 1a.1. All Students WA School Improvement Framework Score Is the charter school meeting performance expectations based on the state accountability system? 1a.2. Subgroup WA School Improvement Framework Score Are students in subgroups in the charter school meeting performance expectations based on the state accountability system?
2. PROFICIENCY RATE 2a.1. Assigned School Comparison (ASC) How are charter school students performing on state assessments compared to the traditional public schools that students would otherwise attend if they did not attend the charter school? 2a.2. Subgroup Assigned School Comparison (ASC) How are charter school students in subgroups performing on state assessments compared to the traditional public schools that students would otherwise attend if they did not attend the charter school? 2b.1. All Students Growth Assigned School Comparison (ASC) How are charter school students meeting growth expectations compared to the traditional public schools that students would otherwise attend if they did not attend the charter school? (based on subgroup median growth percentiles (MGPs)) 2b.2. Subgroup Growth Assigned School Comparison (ASC) How are charter school student subgroups meeting growth expectations compared to the traditional public schools that students would otherwise attend if they did not attend the charter school? (based on subgroup median growth percentiles (MGPs))
GRADUATION RATE 2c.1. Graduation Rate Assigned School Comparison (ASC) How are charter school student high school cohort graduation rates compared to the traditional public schools that students would otherwise attend if they did not attend the charter school?
GROUP SCHOOL
PERFORMANCE ASC
PERFORMANCE RATING
All Students N/A N/A No Rating Applied
NOTES: Any results not shown suppressed due to n-sizes or grades served. Due to COVID-19 impacts on data, ratings were not applied to results.
E Exceeds Standard: Charter school graduation rate is 10 or more percentage points above the Assigned School Comparison average.
D Does Not Meet Standard: Charter school graduation rate is up to 9 percentage points below the Assigned School Comparison average.
M Meets Standard: Charter school graduation rate is equal to or up to 9 percentage points above the Assigned School Comparison average.
F Falls Far Below Standard: Charter school graduation rate is 10 or more percentage points below the Assigned School Comparison average.

WASHINGTON STATE CHARTER SCHOOL COMMISSION Rainier Valley Leadership Academy Academic Performance Report 2019-20 | 6
SCHOOL RESPONSE: Due to COVID-19 RVLA was restricted in available data due to the cancellation of state assessments. RVLA scholars based on MAP growth did show growth based on Fall to Winter assessments. While RVLA had plans to begin supporting interim assessments for the state assessment, the information from the NWEA MAP (Fall to Winter) was used to support scholar growth and strengths.

WASHINGTON STATE CHARTER SCHOOL COMMISSION Rainier Valley Leadership Academy Academic Performance Report 2019-20 | 7
GRADUATION RATE 2c.2. Graduation Rate Subgroup Assigned School Comparison (ASC) How are charter school student high school cohort graduation rates compared to the traditional public schools that students would otherwise attend if they did not attend the charter school?
GROUP SCHOOL PERFORMANCE
ASC PERFORMANCE RATING
American Indian / Alaskan Native N/A N/A
No Rating Applied
Asian N/A N/A
Black / African American N/A N/A
Hispanic / Latino of any race(s)
N/A N/A
Native Hawaiian / Other Pacific Islander N/A N/A
Two or More Races N/A N/A
White N/A N/A
Female N/A N/A
Male N/A N/A
Special Education N/A N/A
Limited English N/A N/A
Low Income N/A N/A
NOTES: Any results not shown suppressed due to n-sizes or grades served. Due to COVID-19 impacts on data, ratings were not applied to results. SCHOOL RESPONSE: For scholars and graduation rates, RVLA did not have 12th graders during the 19-20 school year to address graduation rates.
E Exceeds Standard: Charter school subgroup graduation rate is 10 or more percentage points above the Assigned School Comparison average.
D Does Not Meet Standard: Charter school subgroup graduation rate is up to 9 percentage points below the Assigned School Comparison average.
M Meets Standard: Charter school subgroup graduation rate equals or is up to 9 percentage points above the Assigned School Comparison average.
F Falls Far Below Standard: Charter school subgroup graduation rate is 10 or more percentage points below the Assigned School Comparison average.

WASHINGTON STATE CHARTER SCHOOL COMMISSION Rainier Valley Leadership Academy Academic Performance Report 2019-20 | 8
ADDITIONAL INDICATORS 2d.1, 2d.2. English Learner Progress Assigned School Comparison (ASC) 2e.1, 2e.2 Regular Attendance Assigned School Comparison (ASC) 2 f.1, 2 f.2 9th Graders on Track Assigned School Comparison (ASC) 2g.1, 2g.2. Dual Credit Assigned School Comparison (ASC) How are charter school students performing compared to traditional public schools that students would otherwise attend if they did not attend the charter school?
GROUP REGULAR ATTENDANCE 9TH GRADERS ON TRACK DUAL CREDIT
SCHOOL ASC RATING SCHOOL ASC RATING SCHOOL ASC RATING
All Students 72% 87%
No
Ratin
g Ap
plie
d
86% 73%
No
Ratin
gs p
plie
d
<10% 59%
No
Ratin
gs p
plie
d
American Indian / Alaskan Native N/A N/A N/A N/A N/A N/A
Asian N/A N/A N/A N/A N/A N/A Black / African American 69% 85% N/A* N/A <10% 54% Hispanic / Latino of any race(s) >89% 83% N/A N/A N/A N/A Native Hawaiian / Oth Pacific Isl N/A N/A N/A N/A N/A N/A
Two or More Races 78% 85% N/A N/A N/A N/A
White N/A N/A N/A N/A N/A N/A
Female 74% 88% >73% 77% <10% 61%
Male 71% 88% 76% 70% <12% 56%
Special Education 64% 81% N/A N/A <30% 34%
Limited English 79% 87% N/A N/A N/A N/A
Low Income 72% 84% N/A* N/A <10% 54%
NOTES: ASC results are presented only if corresponding charter results are available. Due to COVID-19 impacts on data, ratings were not applied to results. *Not available in OSPI data files due to cross-group suppression.
E Exceeds Standard: School performance is 10 or more percentage points above the Assigned School Comparison average.
D Does Not Meet Standard: School performance is up to 9 percentage points below the Assigned School Comparison average.
M Meets Standard: School performance is equal to or up to 9 percentage points above the Assigned School Comparison average.
F Falls Far Below Standard: School performance is 10 or more percentage points below the Assigned School Comparison average.
WASHINGTON STATE CHARTER SCHOOL COMMISSION Rainier Valley Leadership Academy Academic Performance Report 2019-20 | 9
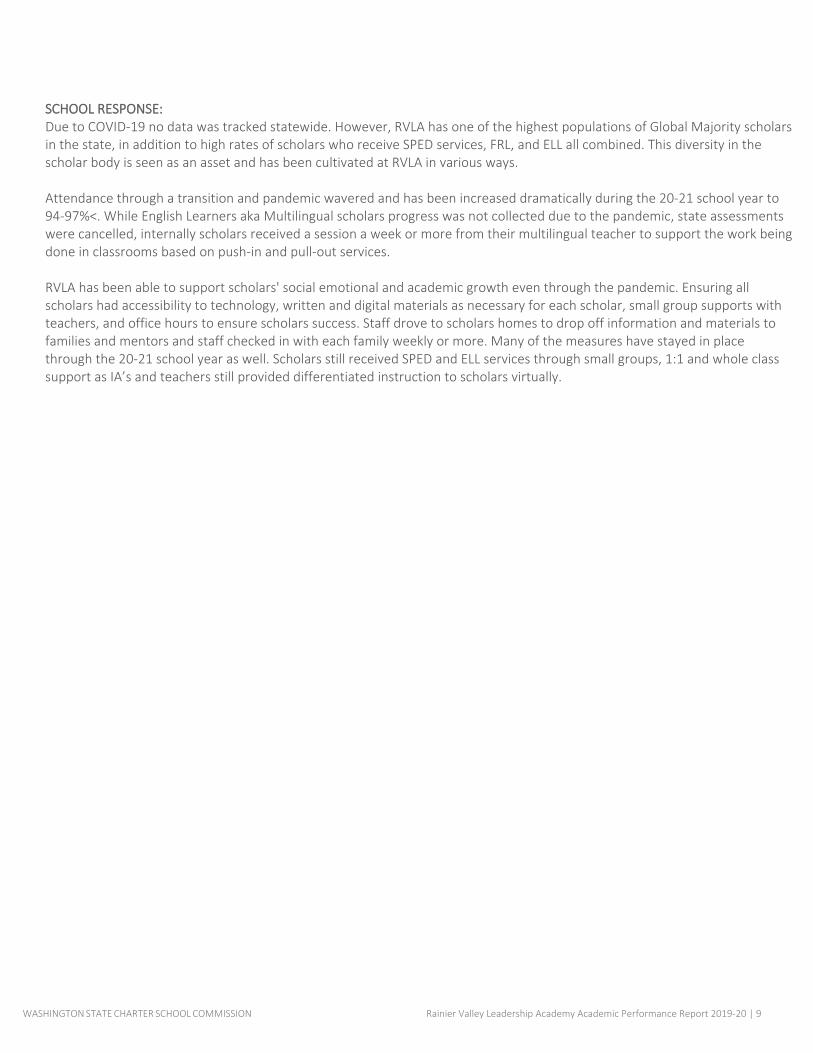
SCHOOL RESPONSE: Due to COVID-19 no data was tracked statewide. However, RVLA has one of the highest populations of Global Majority scholars in the state, in addition to high rates of scholars who receive SPED services, FRL, and ELL all combined. This diversity in the scholar body is seen as an asset and has been cultivated at RVLA in various ways. Attendance through a transition and pandemic wavered and has been increased dramatically during the 20-21 school year to 94-97%<. While English Learners aka Multilingual scholars progress was not collected due to the pandemic, state assessments were cancelled, internally scholars received a session a week or more from their multilingual teacher to support the work being done in classrooms based on push-in and pull-out services. RVLA has been able to support scholars' social emotional and academic growth even through the pandemic. Ensuring all scholars had accessibility to technology, written and digital materials as necessary for each scholar, small group supports with teachers, and office hours to ensure scholars success. Staff drove to scholars homes to drop off information and materials to families and mentors and staff checked in with each family weekly or more. Many of the measures have stayed in place through the 20-21 school year as well. Scholars still received SPED and ELL services through small groups, 1:1 and whole class support as IA’s and teachers still provided differentiated instruction to scholars virtually.

WASHINGTON STATE CHARTER SCHOOL COMMISSION Rainier Valley Leadership Academy Academic Performance Report 2019-20 | 10
3. COMPARISON TO SCHOOL SERVING SIMILAR STUDENTS 3a. Proficiency Comparison to Schools Serving Similar Students How are charter school students performing on state assessments compared to schools serving similar students? 3b. Graduation Rate Comparison to Schools Serving Similar Students How did the charter school high school cohort graduation rate compare to schools serving similar students statewide? Regression analysis is used to compare each school’s actual performance to its predicted performance, based on the enrollment of students eligible for free and reduced-price lunch (FRL) and students with disabilities (SWD). For more information, please refer to the Commission Academic Performance Framework Methodology .
ACTUAL
VALUE PREDICTED
VALUE EFFECT
SIZE RATING
Graduation Rate N/A N/A N/A No Rating Applied
NOTES: Any results not shown suppressed due to n-sizes. Due to COVID-19 impacts on data, ratings were not applied to results.
For information on rationale for effect size thresholds, see Statistical Power Analysis for the Behavioral Sciences, Cohen (1988).
SCHOOL RESPONSE: For scholars and graduation rates, RVLA did not have 12th graders during the 19-20 school year to address graduation rates. While there was no data statewide collected on the comparison to schools serving similar scholars (regression), RVLA internally collected data to iterate on programming through the pandemic to ensure scholars were still being served. An equitable grading policy was put into place, all staff received anti-racist training to ensure cultural competency and safety of scholars being provided for. Trainings were conducted around trauma informed practices, suicide prevention, universal design learning practices, and SIOP trainings for staff. In addition, a system of tracking learning through APEX was conducted on a weekly process to ensure scholars were progressing successfully with a check in and additional support offered to scholars who had some ground to make up. In short family feedback about our process of supporting scholars through the pandemic even through a transition was discussed in detail through our QSR’s and the WA state commission staff used the data we were collecting as a national example for what should be happening in a pandemic and long term for all schools nationally.Weekly content and GLT meetings were implemented to support teacher development and accountability to scholars ensuring scholars' needs were being met, pre and during pandemic measures.Teachers have undergone a extensive hiring process screening for anti-racist mindsets, and social emotional skills for adults in addtion to instructional practices and relationship based classroom management skills. Staff was also supported around relational classroom management skills through real-time coaching practices to support a sense of belonging and trust. Real-time coaching also increased scholar outcomes, and fidelity of turnaround practices for the school.
E Exceeds Standard: Charter school graduation rate exceeds expected performance (effect size .30 or greater). D
Does Not Meet Standard: Charter school graduation rate is lower than expected performance (effect size -0.01 to -.29).
M Meets Standard: Charter school graduation rate meets or slightly exceeds expected performance (effect size 0 to .29).
F Falls Far Below Standard: Charter school graduation rate falls far below expected performance (effect size -.30 or less).
WASHINGTON STATE CHARTER SCHOOL COMMISSION Rainier Valley Leadership Academy Academic Performance Report 2019-20 | 11
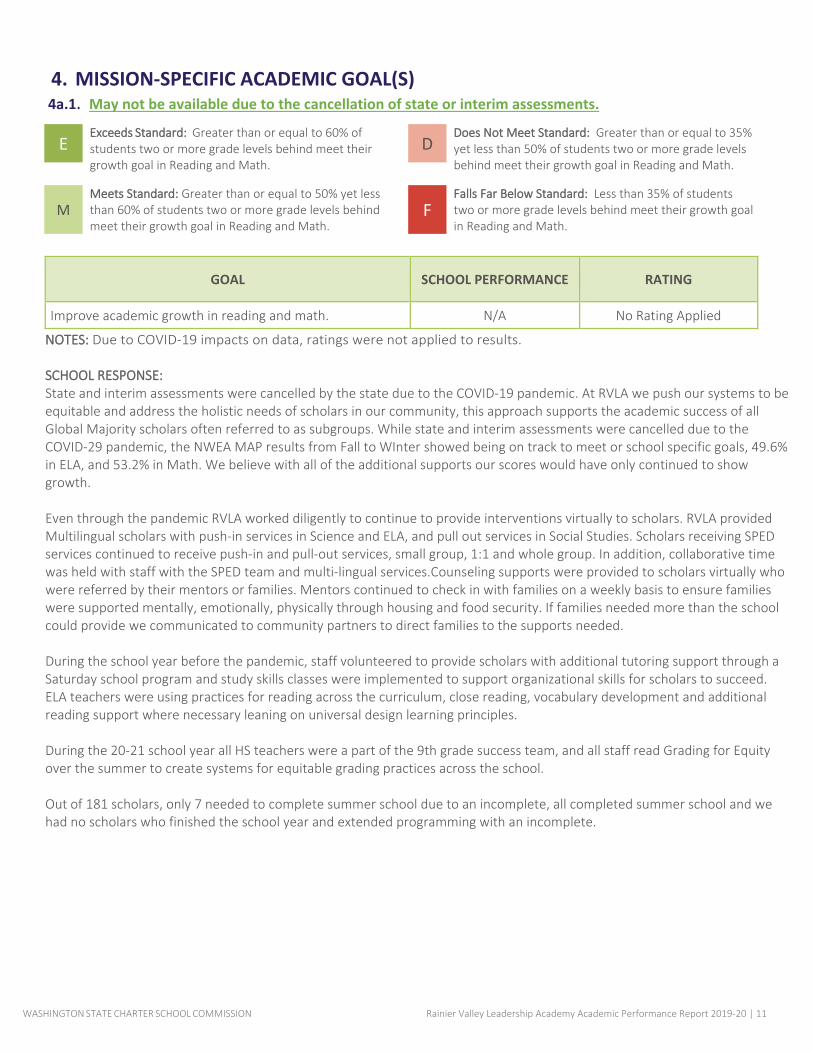
4. MISSION-SPECIFIC ACADEMIC GOAL(S) 4a.1. May not be available due to the cancellation of state or interim assessments.
GOAL SCHOOL PERFORMANCE RATING
Improve academic growth in reading and math. N/A No Rating Applied
NOTES: Due to COVID-19 impacts on data, ratings were not applied to results.
SCHOOL RESPONSE: State and interim assessments were cancelled by the state due to the COVID-19 pandemic. At RVLA we push our systems to be equitable and address the holistic needs of scholars in our community, this approach supports the academic success of all Global Majority scholars often referred to as subgroups. While state and interim assessments were cancelled due to the COVID-29 pandemic, the NWEA MAP results from Fall to WInter showed being on track to meet or school specific goals, 49.6% in ELA, and 53.2% in Math. We believe with all of the additional supports our scores would have only continued to show growth. Even through the pandemic RVLA worked diligently to continue to provide interventions virtually to scholars. RVLA provided Multilingual scholars with push-in services in Science and ELA, and pull out services in Social Studies. Scholars receiving SPED services continued to receive push-in and pull-out services, small group, 1:1 and whole group. In addition, collaborative time was held with staff with the SPED team and multi-lingual services.Counseling supports were provided to scholars virtually who were referred by their mentors or families. Mentors continued to check in with families on a weekly basis to ensure families were supported mentally, emotionally, physically through housing and food security. If families needed more than the school could provide we communicated to community partners to direct families to the supports needed. During the school year before the pandemic, staff volunteered to provide scholars with additional tutoring support through a Saturday school program and study skills classes were implemented to support organizational skills for scholars to succeed. ELA teachers were using practices for reading across the curriculum, close reading, vocabulary development and additional reading support where necessary leaning on universal design learning principles. During the 20-21 school year all HS teachers were a part of the 9th grade success team, and all staff read Grading for Equity over the summer to create systems for equitable grading practices across the school. Out of 181 scholars, only 7 needed to complete summer school due to an incomplete, all completed summer school and we had no scholars who finished the school year and extended programming with an incomplete.
E Exceeds Standard: Greater than or equal to 60% of students two or more grade levels behind meet their growth goal in Reading and Math.
D Does Not Meet Standard: Greater than or equal to 35% yet less than 50% of students two or more grade levels behind meet their growth goal in Reading and Math.
M Meets Standard: Greater than or equal to 50% yet less than 60% of students two or more grade levels behind meet their growth goal in Reading and Math.
F Falls Far Below Standard: Less than 35% of students two or more grade levels behind meet their growth goal in Reading and Math.

MAILING ADDRESS PHONE P.O. Box 40996, Olympia, WA 98504-0996 (360) 725-5511 STREET ADDRESS EMAIL 1068 Washington Street SE, Olympia, WA 98501 [email protected]
CHARTERSCHOOL.WA.GOV