Rainier Valley Leadership Academy - Wa
25
Rainier Valley Leadership Academy 2018–2019 ANNUAL STUDENT ACADEMIC PERFORMANCE REPORT by Washington State Charter School Commission
Transcript of Rainier Valley Leadership Academy - Wa
Rainier Valley Leadership Academy 2018–2019 ANNUAL STUDENT ACADEMIC PERFORMANCE REPORT by Washington State Charter School Commission
WASHINGTON STATE CHARTER SCHOOL COMMISSION RAINIER VALLEY LEADERSHIP ACADEMY ACADEMIC PERFORMANCE REPORT 2018-2019 | 2
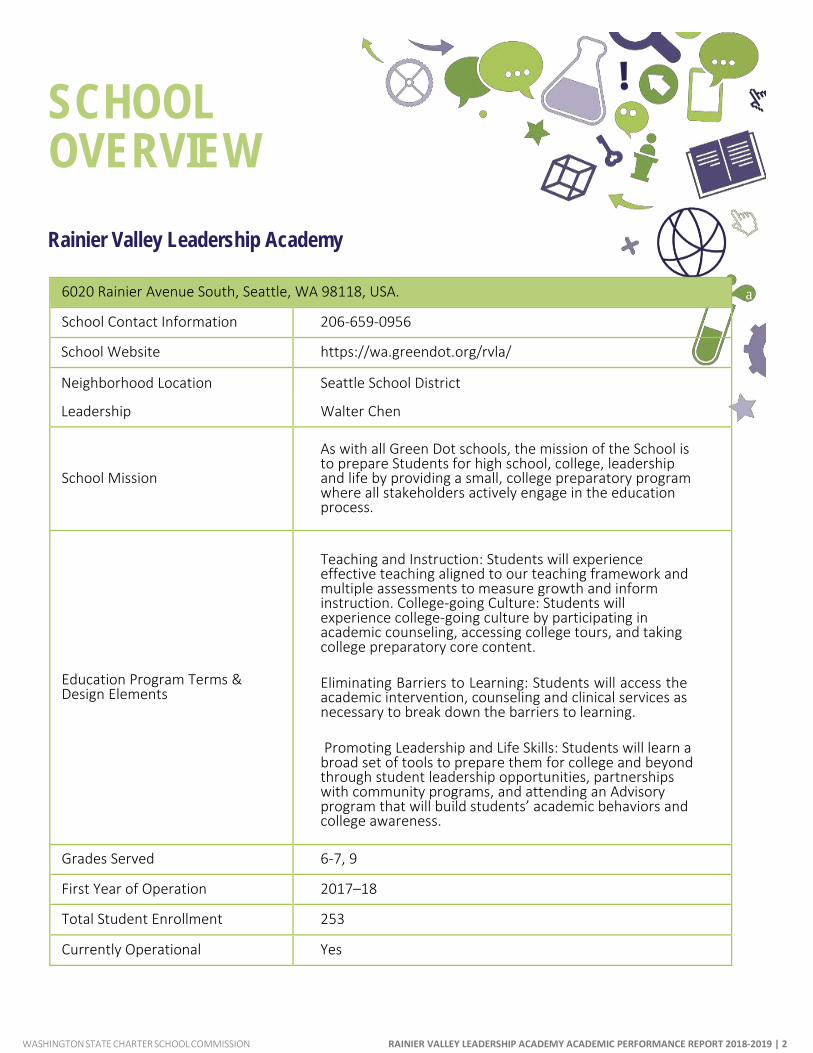
SCHOOL OVERVIEW
Rainier Valley Leadership Academy
a 6020 Rainier Avenue South, Seattle, WA 98118, USA.
School Contact Information 206-659-0956
School Website https://wa.greendot.org/rvla/
Neighborhood Location Seattle School District
Leadership Walter Chen
School Mission
As with all Green Dot schools, the mission of the School is to prepare Students for high school, college, leadership and life by providing a small, college preparatory program where all stakeholders actively engage in the education process.
Education Program Terms & Design Elements
Teaching and Instruction: Students will experience effective teaching aligned to our teaching framework and multiple assessments to measure growth and inform instruction. College-going Culture: Students will experience college-going culture by participating in academic counseling, accessing college tours, and taking college preparatory core content.
Eliminating Barriers to Learning: Students will access the academic intervention, counseling and clinical services as necessary to break down the barriers to learning.
Promoting Leadership and Life Skills: Students will learn a
broad set of tools to prepare them for college and beyond through student leadership opportunities, partnerships with community programs, and attending an Advisory program that will build students’ academic behaviors and college awareness.
Grades Served 6-7, 9
First Year of Operation 2017–18
Total Student Enrollment 253
Currently Operational Yes
WASHINGTON STATE CHARTER SCHOOL COMMISSION RAINIER VALLEY LEADERSHIP ACADEMY ACADEMIC PERFORMANCE REPORT 2018-2019 | 3
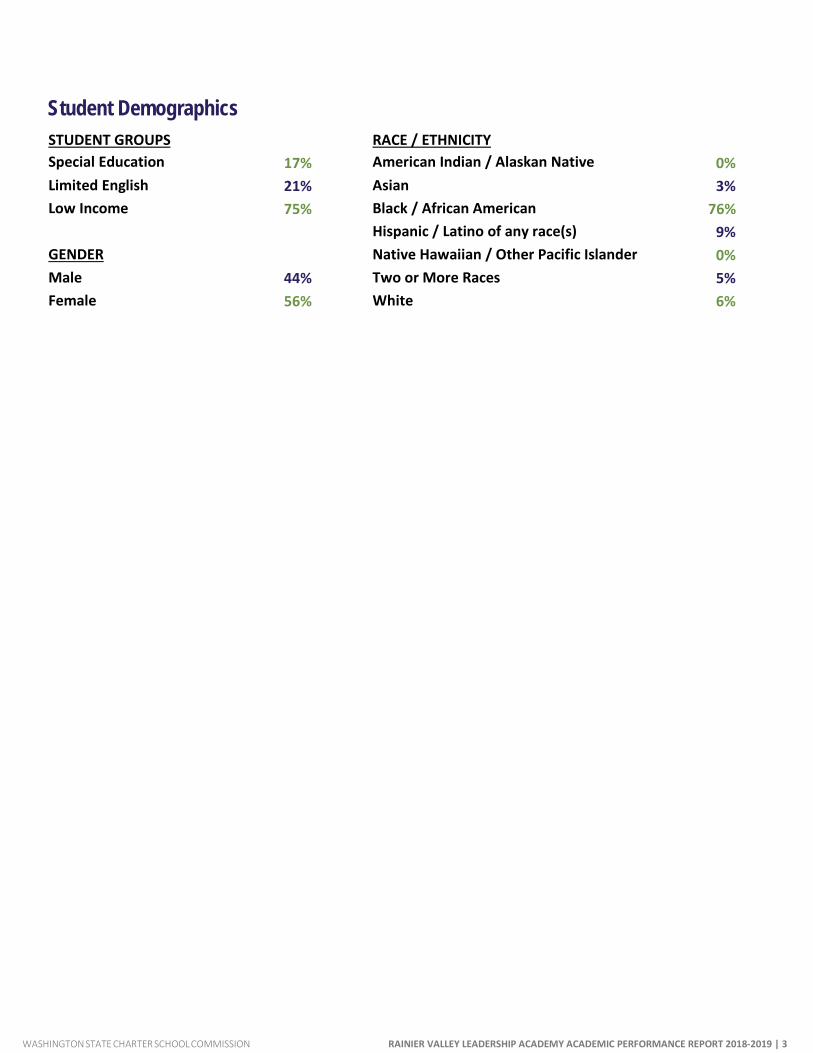
Student Demographics
STUDENT GROUPS RACE / ETHNICITY Special Education 17% American Indian / Alaskan Native 0% Limited English 21% Asian 3% Low Income 75% Black / African American 76%
Hispanic / Latino of any race(s) 9% GENDER Native Hawaiian / Other Pacific Islander 0% Male 44% Two or More Races 5% Female 56% White 6%
WASHINGTON STATE CHARTER SCHOOL COMMISSION RAINIER VALLEY LEADERSHIP ACADEMY ACADEMIC PERFORMANCE REPORT 2018-2019 | 4
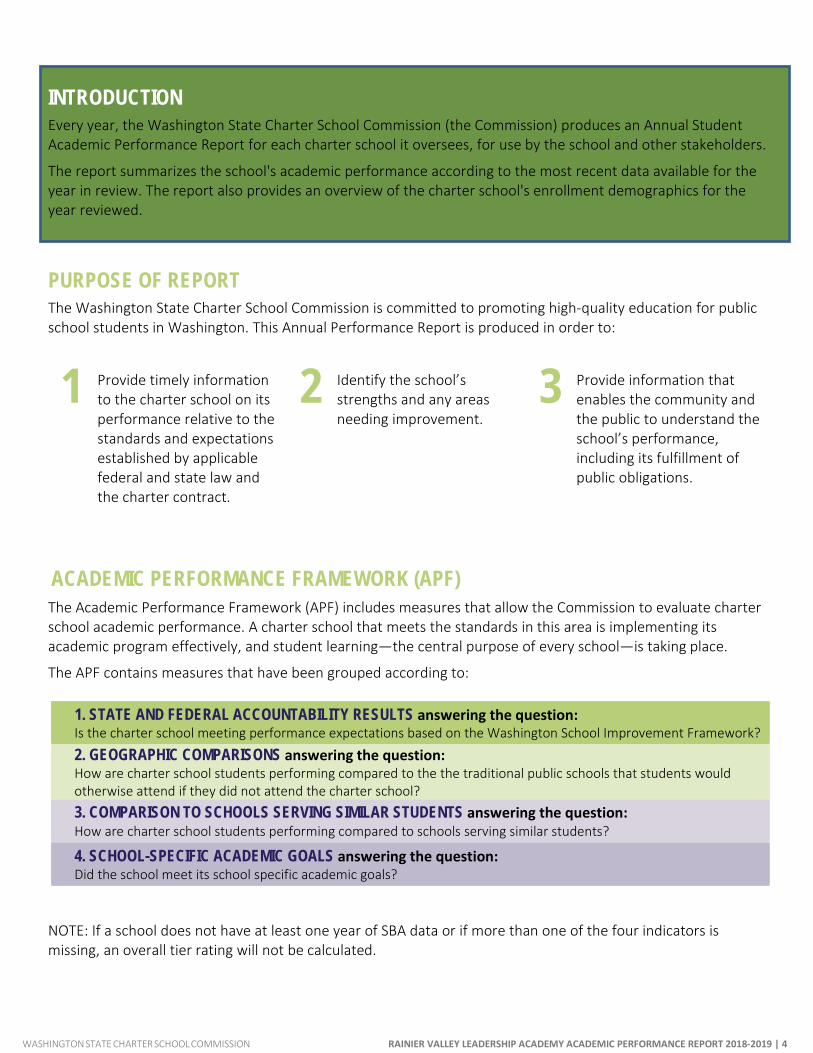
PURPOSE OF REPORT The Washington State Charter School Commission is committed to promoting high-quality education for public school students in Washington. This Annual Performance Report is produced in order to:
1 Provide timely information to the charter school on its performance relative to the standards and expectations established by applicable federal and state law and the charter contract.
2 Identify the school’s strengths and any areas needing improvement.
3 Provide information that enables the community and the public to understand the school’s performance, including its fulfillment of public obligations.
ACADEMIC PERFORMANCE FRAMEWORK (APF) The Academic Performance Framework (APF) includes measures that allow the Commission to evaluate charter school academic performance. A charter school that meets the standards in this area is implementing its academic program effectively, and student learning—the central purpose of every school—is taking place.
The APF contains measures that have been grouped according to:
1. STATE AND FEDERAL ACCOUNTABILITY RESULTS answering the question: Is the charter school meeting performance expectations based on the Washington School Improvement Framework?
2. GEOGRAPHIC COMPARISONS answering the question: How are charter school students performing compared to the the traditional public schools that students would otherwise attend if they did not attend the charter school? 3. COMPARISON TO SCHOOLS SERVING SIMILAR STUDENTS answering the question: How are charter school students performing compared to schools serving similar students?
4. SCHOOL-SPECIFIC ACADEMIC GOALS answering the question: Did the school meet its school specific academic goals?
NOTE: If a school does not have at least one year of SBA data or if more than one of the four indicators is missing, an overall tier rating will not be calculated.
INTRODUCTION Every year, the Washington State Charter School Commission (the Commission) produces an Annual Student Academic Performance Report for each charter school it oversees, for use by the school and other stakeholders.
The report summarizes the school's academic performance according to the most recent data available for the year in review. The report also provides an overview of the charter school's enrollment demographics for the year reviewed.
WASHINGTON STATE CHARTER SCHOOL COMMISSION RAINIER VALLEY LEADERSHIP ACADEMY ACADEMIC PERFORMANCE REPORT 2018-2019 | 5
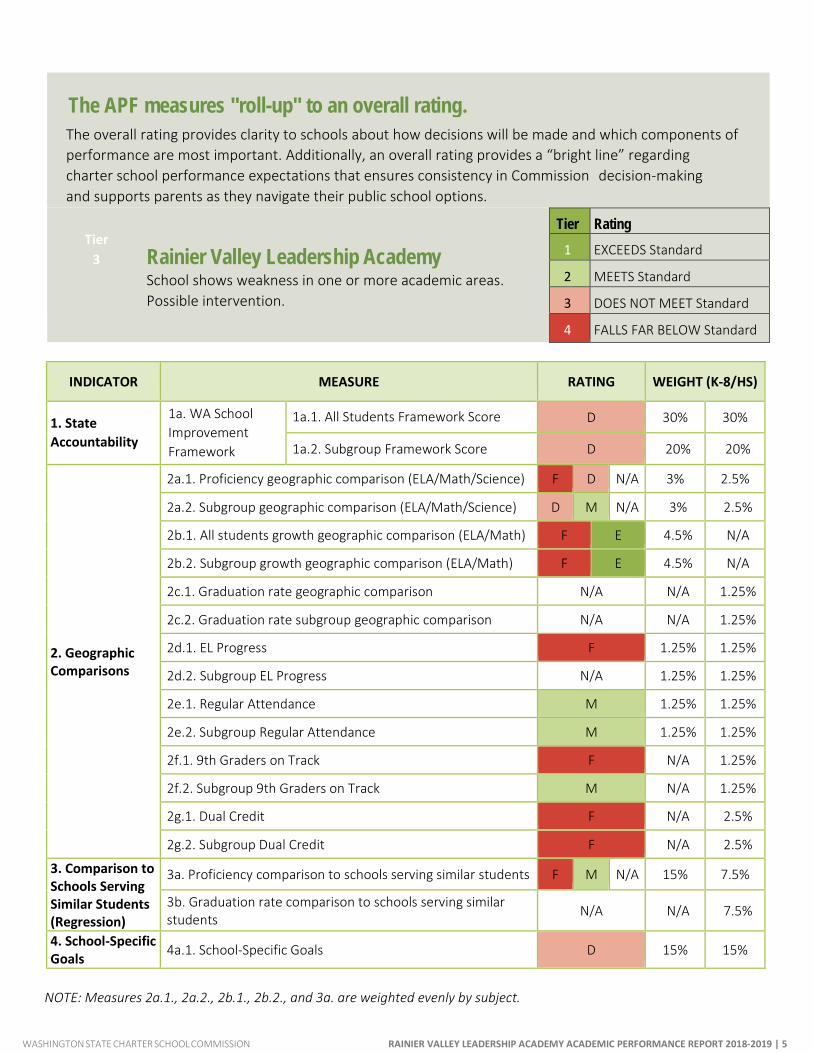
The APF measures "roll-up" to an overall rating. The overall rating provides clarity to schools about how decisions will be made and which components of performance are most important. Additionally, an overall rating provides a “bright line” regarding charter school performance expectations that ensures consistency in Commission decision-making and supports parents as they navigate their public school options.
Tier
3 Rainier Valley Leadership Academy School shows weakness in one or more academic areas. Possible intervention.
Tier Rating 1 EXCEEDS Standard
2 MEETS Standard
3 DOES NOT MEET Standard
4 FALLS FAR BELOW Standard
INDICATOR MEASURE RATING WEIGHT (K-8/HS)
1. State Accountability
1a. WA School Improvement Framework
1a.1. All Students Framework Score D 30% 30%
1a.2. Subgroup Framework Score D 20% 20%
2. Geographic Comparisons
2a.1. Proficiency geographic comparison (ELA/Math/Science) F D N/A 3% 2.5%
2a.2. Subgroup geographic comparison (ELA/Math/Science) D M N/A 3% 2.5%
2b.1. All students growth geographic comparison (ELA/Math) F E 4.5% N/A
2b.2. Subgroup growth geographic comparison (ELA/Math) F E 4.5% N/A
2c.1. Graduation rate geographic comparison N/A N/A 1.25%
2c.2. Graduation rate subgroup geographic comparison N/A N/A 1.25%
2d.1. EL Progress F 1.25% 1.25%
2d.2. Subgroup EL Progress N/A 1.25% 1.25%
2e.1. Regular Attendance M 1.25% 1.25%
2e.2. Subgroup Regular Attendance M 1.25% 1.25%
2f.1. 9th Graders on Track F N/A 1.25%
2f.2. Subgroup 9th Graders on Track M N/A 1.25%
2g.1. Dual Credit F N/A 2.5%
2g.2. Subgroup Dual Credit F N/A 2.5%
3. Comparison to Schools Serving Similar Students (Regression)
3a. Proficiency comparison to schools serving similar students F M N/A 15% 7.5%
3b. Graduation rate comparison to schools serving similar students N/A N/A 7.5%
4. School-Specific Goals 4a.1. School-Specific Goals D 15% 15%
NOTE: Measures 2a.1., 2a.2., 2b.1., 2b.2., and 3a. are weighted evenly by subject.
WASHINGTON STATE CHARTER SCHOOL COMMISSION RAINIER VALLEY LEADERSHIP ACADEMY ACADEMIC PERFORMANCE REPORT 2018-2019 | 6
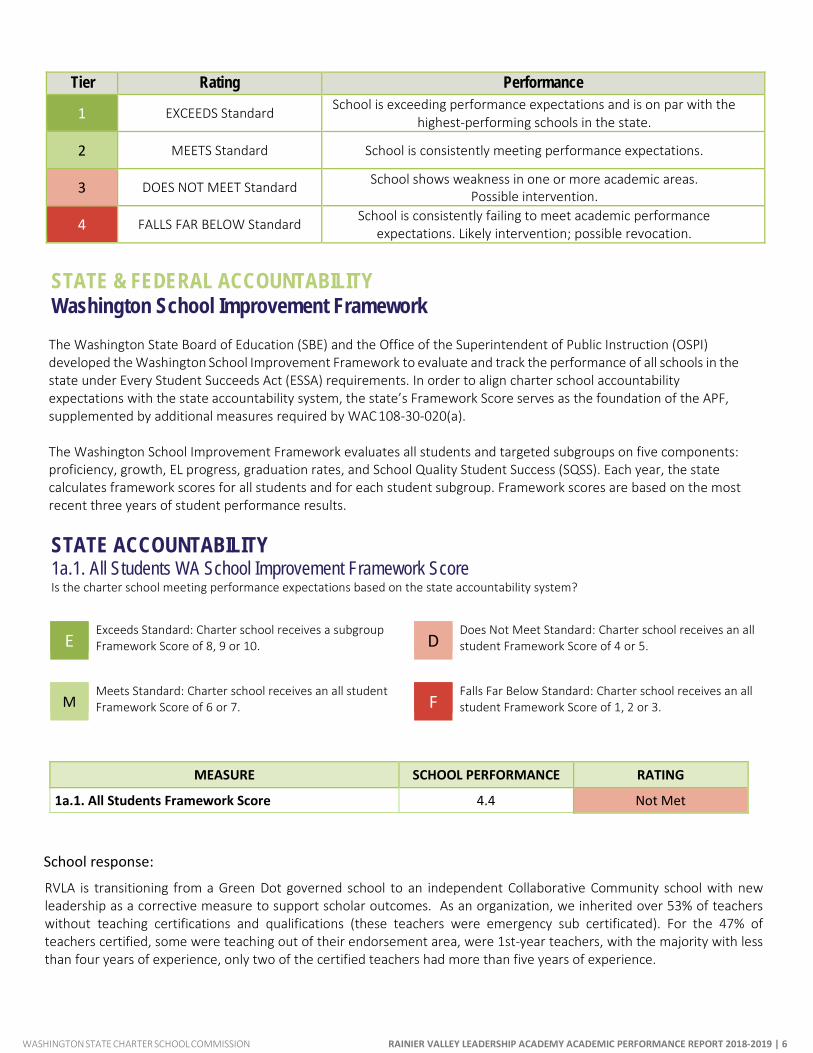
Tier Rating Performance
1 EXCEEDS Standard School is exceeding performance expectations and is on par with the highest-performing schools in the state.
2 MEETS Standard School is consistently meeting performance expectations.
3 DOES NOT MEET Standard School shows weakness in one or more academic areas. Possible intervention.
4 FALLS FAR BELOW Standard School is consistently failing to meet academic performance expectations. Likely intervention; possible revocation.
STATE & FEDERAL ACCOUNTABILITY Washington School Improvement Framework The Washington State Board of Education (SBE) and the Office of the Superintendent of Public Instruction (OSPI) developed the Washington School Improvement Framework to evaluate and track the performance of all schools in the state under Every Student Succeeds Act (ESSA) requirements. In order to align charter school accountability expectations with the state accountability system, the state’s Framework Score serves as the foundation of the APF, supplemented by additional measures required by WAC 108-30-020(a).
The Washington School Improvement Framework evaluates all students and targeted subgroups on five components: proficiency, growth, EL progress, graduation rates, and School Quality Student Success (SQSS). Each year, the state calculates framework scores for all students and for each student subgroup. Framework scores are based on the most recent three years of student performance results.
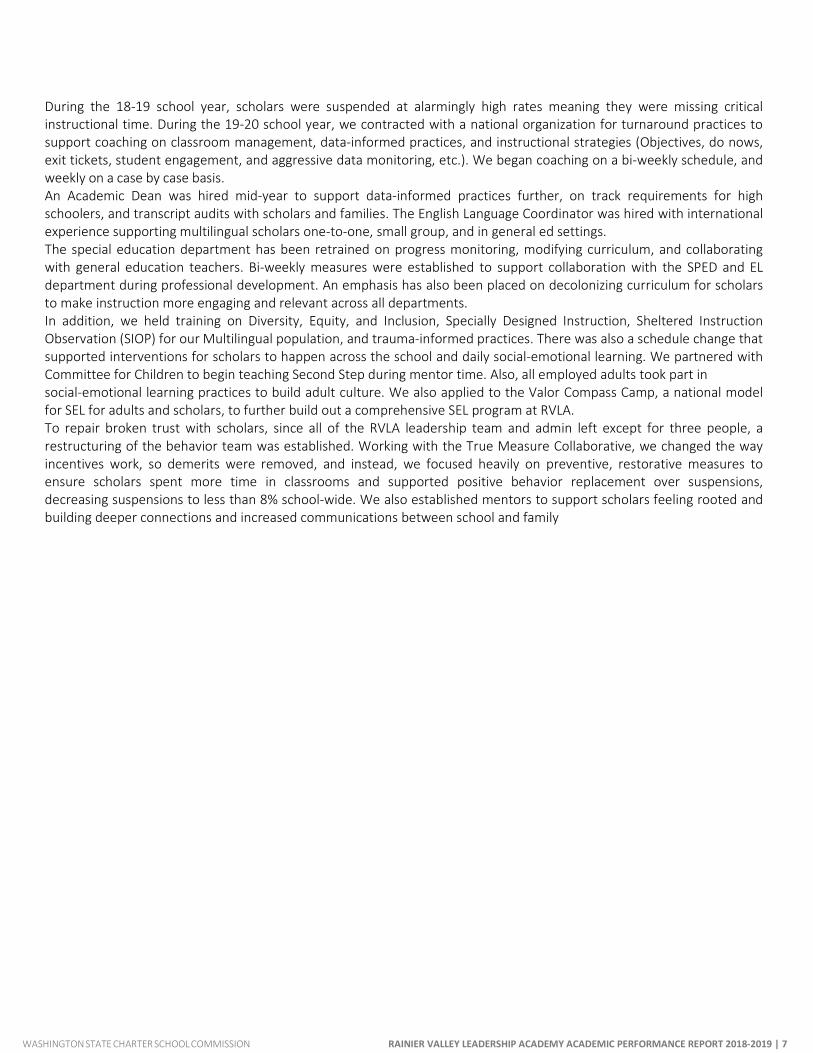
STATE ACCOUNTABILITY 1a.1. All Students WA School Improvement Framework Score Is the charter school meeting performance expectations based on the state accountability system?
E Exceeds Standard: Charter school receives a subgroup Framework Score of 8, 9 or 10. D
Does Not Meet Standard: Charter school receives an all student Framework Score of 4 or 5.
M Meets Standard: Charter school receives an all student Framework Score of 6 or 7. F
Falls Far Below Standard: Charter school receives an all student Framework Score of 1, 2 or 3.
MEASURE SCHOOL PERFORMANCE RATING
1a.1. All Students Framework Score 4.4 Not Met
School response:
RVLA is transitioning from a Green Dot governed school to an independent Collaborative Community school with new leadership as a corrective measure to support scholar outcomes. As an organization, we inherited over 53% of teachers without teaching certifications and qualifications (these teachers were emergency sub certificated). For the 47% of teachers certified, some were teaching out of their endorsement area, were 1st-year teachers, with the majority with less than four years of experience, only two of the certified teachers had more than five years of experience.
WASHINGTON STATE CHARTER SCHOOL COMMISSION RAINIER VALLEY LEADERSHIP ACADEMY ACADEMIC PERFORMANCE REPORT 2018-2019 | 7
During the 18-19 school year, scholars were suspended at alarmingly high rates meaning they were missing critical instructional time. During the 19-20 school year, we contracted with a national organization for turnaround practices to support coaching on classroom management, data-informed practices, and instructional strategies (Objectives, do nows, exit tickets, student engagement, and aggressive data monitoring, etc.). We began coaching on a bi-weekly schedule, and weekly on a case by case basis. An Academic Dean was hired mid-year to support data-informed practices further, on track requirements for high schoolers, and transcript audits with scholars and families. The English Language Coordinator was hired with international experience supporting multilingual scholars one-to-one, small group, and in general ed settings. The special education department has been retrained on progress monitoring, modifying curriculum, and collaborating with general education teachers. Bi-weekly measures were established to support collaboration with the SPED and EL department during professional development. An emphasis has also been placed on decolonizing curriculum for scholars to make instruction more engaging and relevant across all departments. In addition, we held training on Diversity, Equity, and Inclusion, Specially Designed Instruction, Sheltered Instruction Observation (SIOP) for our Multilingual population, and trauma-informed practices. There was also a schedule change that supported interventions for scholars to happen across the school and daily social-emotional learning. We partnered with Committee for Children to begin teaching Second Step during mentor time. Also, all employed adults took part in social-emotional learning practices to build adult culture. We also applied to the Valor Compass Camp, a national model for SEL for adults and scholars, to further build out a comprehensive SEL program at RVLA. To repair broken trust with scholars, since all of the RVLA leadership team and admin left except for three people, a restructuring of the behavior team was established. Working with the True Measure Collaborative, we changed the way incentives work, so demerits were removed, and instead, we focused heavily on preventive, restorative measures to ensure scholars spent more time in classrooms and supported positive behavior replacement over suspensions, decreasing suspensions to less than 8% school-wide. We also established mentors to support scholars feeling rooted and building deeper connections and increased communications between school and family
WASHINGTON STATE CHARTER SCHOOL COMMISSION RAINIER VALLEY LEADERSHIP ACADEMY ACADEMIC PERFORMANCE REPORT 2018-2019 | 8
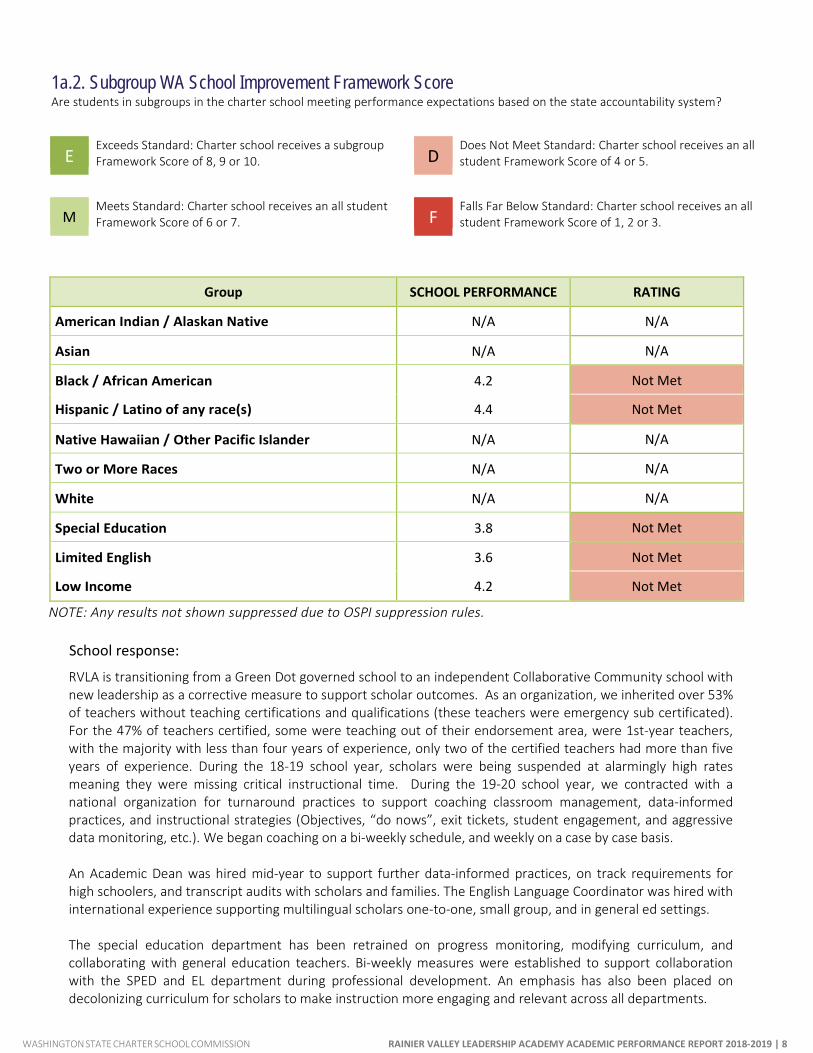
1a.2. Subgroup WA School Improvement Framework Score Are students in subgroups in the charter school meeting performance expectations based on the state accountability system?
E Exceeds Standard: Charter school receives a subgroup Framework Score of 8, 9 or 10. D
Does Not Meet Standard: Charter school receives an all student Framework Score of 4 or 5.
M Meets Standard: Charter school receives an all student Framework Score of 6 or 7. F
Falls Far Below Standard: Charter school receives an all student Framework Score of 1, 2 or 3.
Group SCHOOL PERFORMANCE RATING
American Indian / Alaskan Native N/A N/A
Asian N/A N/A
Black / African American 4.2 Not Met
Hispanic / Latino of any race(s) 4.4 Not Met
Native Hawaiian / Other Pacific Islander N/A N/A
Two or More Races N/A N/A
White N/A N/A
Special Education 3.8 Not Met
Limited English 3.6 Not Met
Low Income 4.2 Not Met
NOTE: Any results not shown suppressed due to OSPI suppression rules. School response:
RVLA is transitioning from a Green Dot governed school to an independent Collaborative Community school with new leadership as a corrective measure to support scholar outcomes. As an organization, we inherited over 53% of teachers without teaching certifications and qualifications (these teachers were emergency sub certificated). For the 47% of teachers certified, some were teaching out of their endorsement area, were 1st-year teachers, with the majority with less than four years of experience, only two of the certified teachers had more than five years of experience. During the 18-19 school year, scholars were being suspended at alarmingly high rates meaning they were missing critical instructional time. During the 19-20 school year, we contracted with a national organization for turnaround practices to support coaching classroom management, data-informed practices, and instructional strategies (Objectives, “do nows”, exit tickets, student engagement, and aggressive data monitoring, etc.). We began coaching on a bi-weekly schedule, and weekly on a case by case basis. An Academic Dean was hired mid-year to support further data-informed practices, on track requirements for high schoolers, and transcript audits with scholars and families. The English Language Coordinator was hired with international experience supporting multilingual scholars one-to-one, small group, and in general ed settings. The special education department has been retrained on progress monitoring, modifying curriculum, and collaborating with general education teachers. Bi-weekly measures were established to support collaboration with the SPED and EL department during professional development. An emphasis has also been placed on decolonizing curriculum for scholars to make instruction more engaging and relevant across all departments.
WASHINGTON STATE CHARTER SCHOOL COMMISSION RAINIER VALLEY LEADERSHIP ACADEMY ACADEMIC PERFORMANCE REPORT 2018-2019 | 9
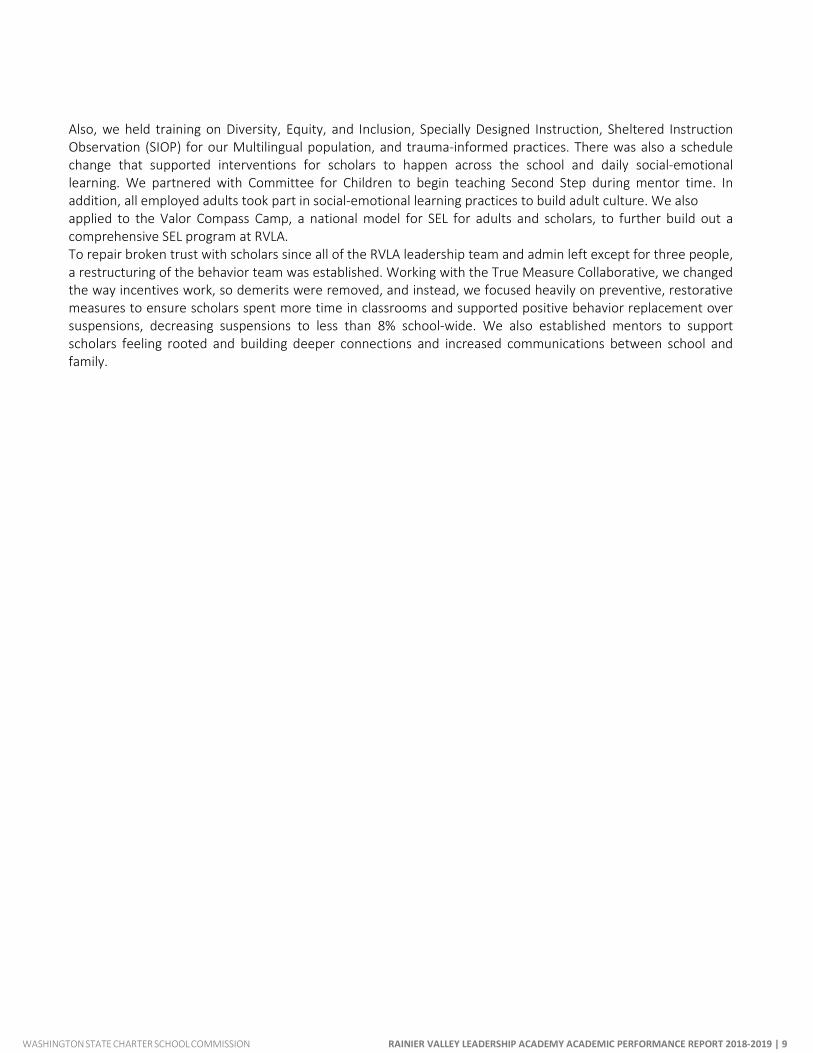
Also, we held training on Diversity, Equity, and Inclusion, Specially Designed Instruction, Sheltered Instruction Observation (SIOP) for our Multilingual population, and trauma-informed practices. There was also a schedule change that supported interventions for scholars to happen across the school and daily social-emotional learning. We partnered with Committee for Children to begin teaching Second Step during mentor time. In addition, all employed adults took part in social-emotional learning practices to build adult culture. We also applied to the Valor Compass Camp, a national model for SEL for adults and scholars, to further build out a comprehensive SEL program at RVLA. To repair broken trust with scholars since all of the RVLA leadership team and admin left except for three people, a restructuring of the behavior team was established. Working with the True Measure Collaborative, we changed the way incentives work, so demerits were removed, and instead, we focused heavily on preventive, restorative measures to ensure scholars spent more time in classrooms and supported positive behavior replacement over suspensions, decreasing suspensions to less than 8% school-wide. We also established mentors to support scholars feeling rooted and building deeper connections and increased communications between school and family.
WASHINGTON STATE CHARTER SCHOOL COMMISSION RAINIER VALLEY LEADERSHIP ACADEMY ACADEMIC PERFORMANCE REPORT 2018-2019 | 10
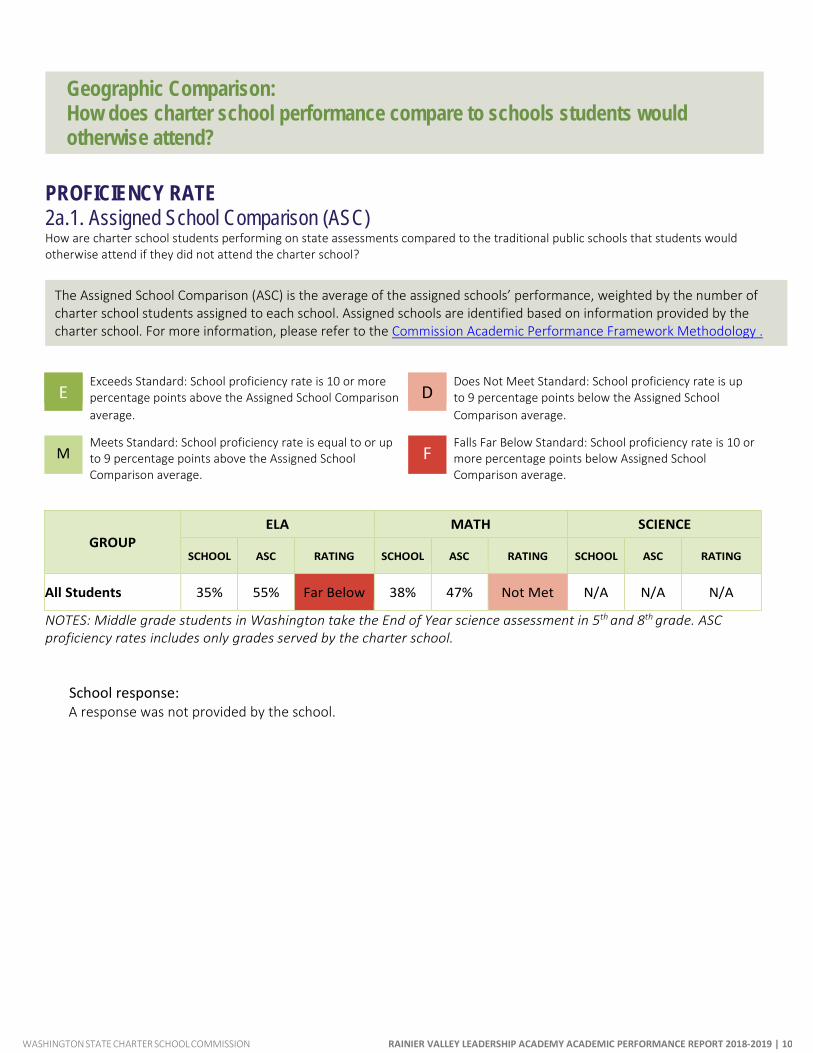
PROFICIENCY RATE 2a.1. Assigned School Comparison (ASC) How are charter school students performing on state assessments compared to the traditional public schools that students would otherwise attend if they did not attend the charter school?
E Exceeds Standard: School proficiency rate is 10 or more percentage points above the Assigned School Comparison D
Does Not Meet Standard: School proficiency rate is up to 9 percentage points below the Assigned School
average. Comparison average.
M Meets Standard: School proficiency rate is equal to or up to 9 percentage points above the Assigned School Comparison average.
F Falls Far Below Standard: School proficiency rate is 10 or more percentage points below Assigned School Comparison average.
GROUP
ELA MATH SCIENCE
SCHOOL ASC RATING SCHOOL ASC RATING SCHOOL ASC RATING
All Students 35% 55% Far Below 38% 47% Not Met N/A N/A N/A
NOTES: Middle grade students in Washington take the End of Year science assessment in 5th and 8th grade. ASC proficiency rates includes only grades served by the charter school.
School response: A response was not provided by the school.
Geographic Comparison: How does charter school performance compare to schools students would otherwise attend?
The Assigned School Comparison (ASC) is the average of the assigned schools’ performance, weighted by the number of charter school students assigned to each school. Assigned schools are identified based on information provided by the charter school. For more information, please refer to the Commission Academic Performance Framework Methodology .
WASHINGTON STATE CHARTER SCHOOL COMMISSION RAINIER VALLEY LEADERSHIP ACADEMY ACADEMIC PERFORMANCE REPORT 2018-2019 | 11
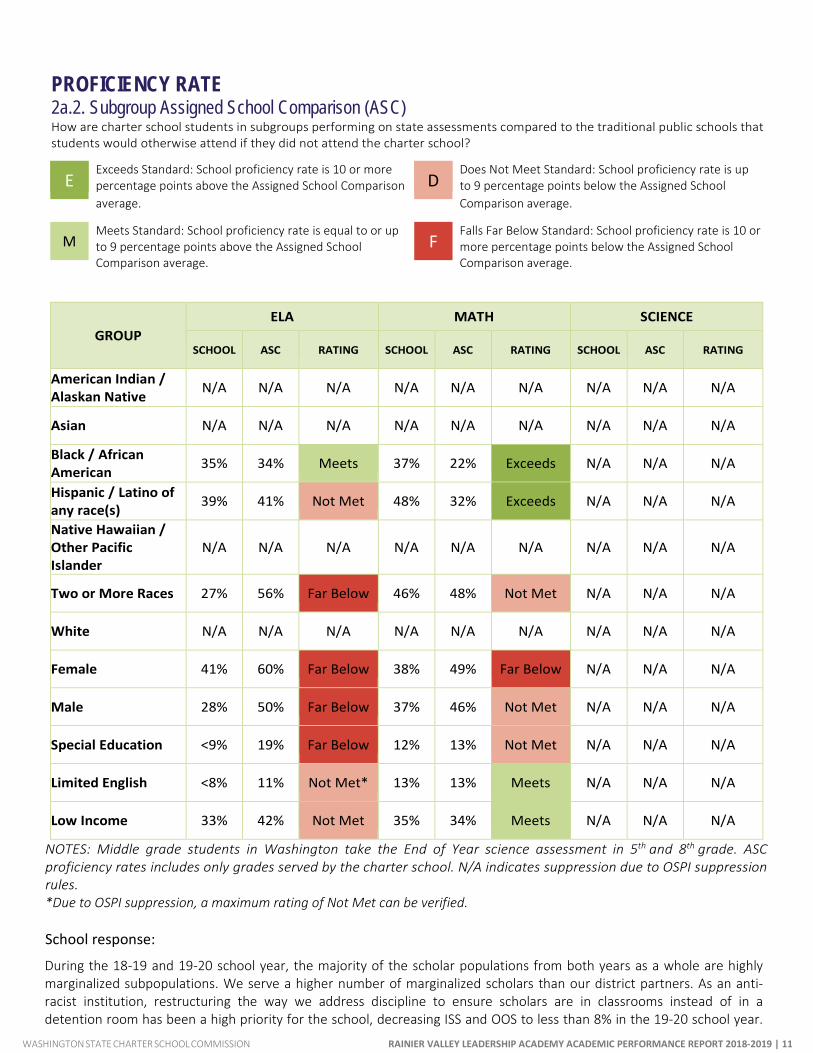
PROFICIENCY RATE 2a.2. Subgroup Assigned School Comparison (ASC) How are charter school students in subgroups performing on state assessments compared to the traditional public schools that students would otherwise attend if they did not attend the charter school?
E Exceeds Standard: School proficiency rate is 10 or more percentage points above the Assigned School Comparison D
Does Not Meet Standard: School proficiency rate is up to 9 percentage points below the Assigned School
average. Comparison average.
M Meets Standard: School proficiency rate is equal to or up to 9 percentage points above the Assigned School Comparison average.
F Falls Far Below Standard: School proficiency rate is 10 or more percentage points below the Assigned School Comparison average.
GROUP
ELA MATH SCIENCE
SCHOOL
ASC
RATING
SCHOOL
ASC
RATING
SCHOOL
ASC
RATING
American Indian / Alaskan Native N/A N/A N/A N/A N/A N/A N/A N/A N/A
Asian N/A N/A N/A N/A N/A N/A N/A N/A N/A
Black / African American 35% 34% Meets 37% 22% Exceeds N/A N/A N/A
Hispanic / Latino of any race(s) 39% 41% Not Met 48% 32% Exceeds N/A N/A N/A
Native Hawaiian / Other Pacific Islander
N/A
N/A
N/A
N/A
N/A
N/A
N/A
N/A
N/A
Two or More Races 27% 56% Far Below 46% 48% Not Met N/A N/A N/A
White N/A N/A N/A N/A N/A N/A N/A N/A N/A
Female 41% 60% Far Below 38% 49% Far Below N/A N/A N/A
Male 28% 50% Far Below 37% 46% Not Met N/A N/A N/A
Special Education <9% 19% Far Below 12% 13% Not Met N/A N/A N/A
Limited English <8% 11% Not Met* 13% 13% Meets N/A N/A N/A
Low Income 33% 42% Not Met 35% 34% Meets N/A N/A N/A
NOTES: Middle grade students in Washington take the End of Year science assessment in 5th and 8th grade. ASC proficiency rates includes only grades served by the charter school. N/A indicates suppression due to OSPI suppression rules. *Due to OSPI suppression, a maximum rating of Not Met can be verified. School response:
During the 18-19 and 19-20 school year, the majority of the scholar populations from both years as a whole are highly marginalized subpopulations. We serve a higher number of marginalized scholars than our district partners. As an anti-racist institution, restructuring the way we address discipline to ensure scholars are in classrooms instead of in a detention room has been a high priority for the school, decreasing ISS and OOS to less than 8% in the 19-20 school year.
WASHINGTON STATE CHARTER SCHOOL COMMISSION RAINIER VALLEY LEADERSHIP ACADEMY ACADEMIC PERFORMANCE REPORT 2018-2019 | 12
Also, addressing adult deficit-based thinking, and racial bias through professional development on DEI, and trauma-informed practices supported addressing adult mindsets that directly affect student outcomes. With increased coaching on data-informed practices, classroom management, adult mindset, and instructional practices, there will be a shift in scholar outcomes for the better. In addition, teachers are learned through professional development how to internalize the assessments given to scholars to support transferrable testing skills and support ELA outcomes.
WASHINGTON STATE CHARTER SCHOOL COMMISSION RAINIER VALLEY LEADERSHIP ACADEMY ACADEMIC PERFORMANCE REPORT 2018-2019 | 10
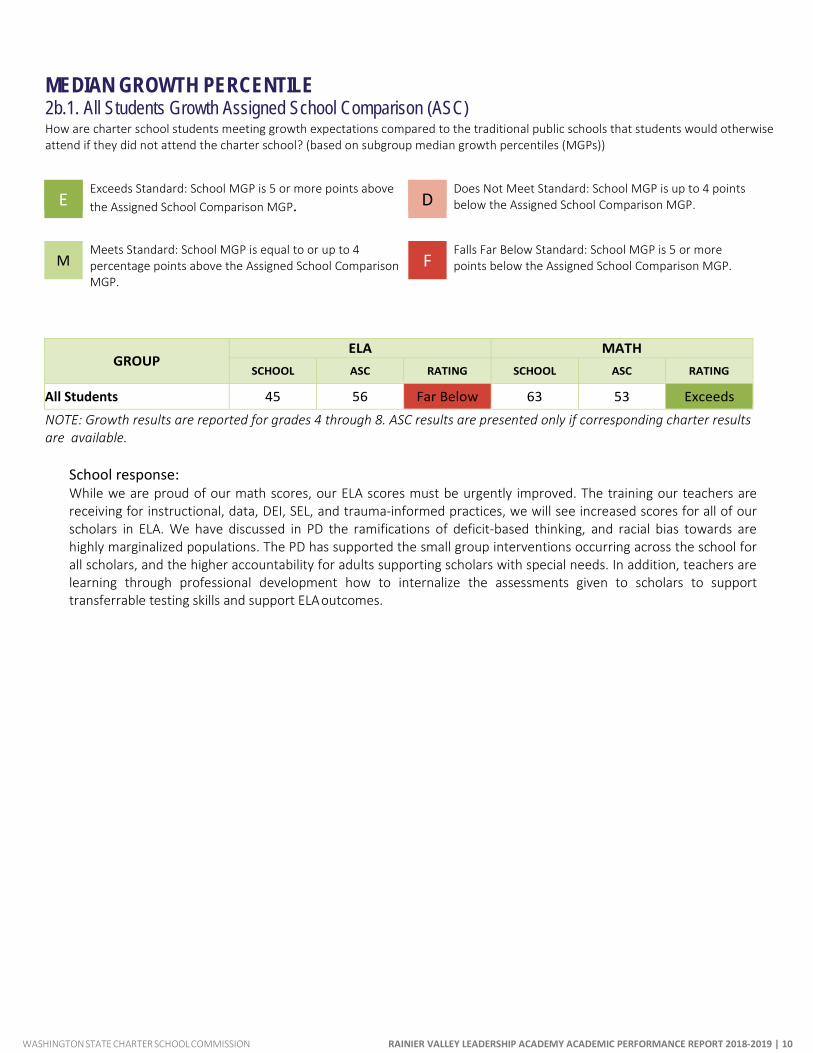
MEDIAN GROWTH PERCENTILE 2b.1. All Students Growth Assigned School Comparison (ASC) How are charter school students meeting growth expectations compared to the traditional public schools that students would otherwise attend if they did not attend the charter school? (based on subgroup median growth percentiles (MGPs))
E Exceeds Standard: School MGP is 5 or more points above the Assigned School Comparison MGP. D
Does Not Meet Standard: School MGP is up to 4 points below the Assigned School Comparison MGP.
M Meets Standard: School MGP is equal to or up to 4 percentage points above the Assigned School Comparison MGP.
F Falls Far Below Standard: School MGP is 5 or more points below the Assigned School Comparison MGP.
GROUP ELA MATH
SCHOOL ASC RATING SCHOOL ASC RATING
All Students 45 56 Far Below 63 53 Exceeds NOTE: Growth results are reported for grades 4 through 8. ASC results are presented only if corresponding charter results are available.
School response: While we are proud of our math scores, our ELA scores must be urgently improved. The training our teachers are receiving for instructional, data, DEI, SEL, and trauma-informed practices, we will see increased scores for all of our scholars in ELA. We have discussed in PD the ramifications of deficit-based thinking, and racial bias towards are highly marginalized populations. The PD has supported the small group interventions occurring across the school for all scholars, and the higher accountability for adults supporting scholars with special needs. In addition, teachers are learning through professional development how to internalize the assessments given to scholars to support transferrable testing skills and support ELA outcomes.
WASHINGTON STATE CHARTER SCHOOL COMMISSION RAINIER VALLEY LEADERSHIP ACADEMY ACADEMIC PERFORMANCE REPORT 2018-2019 | 11
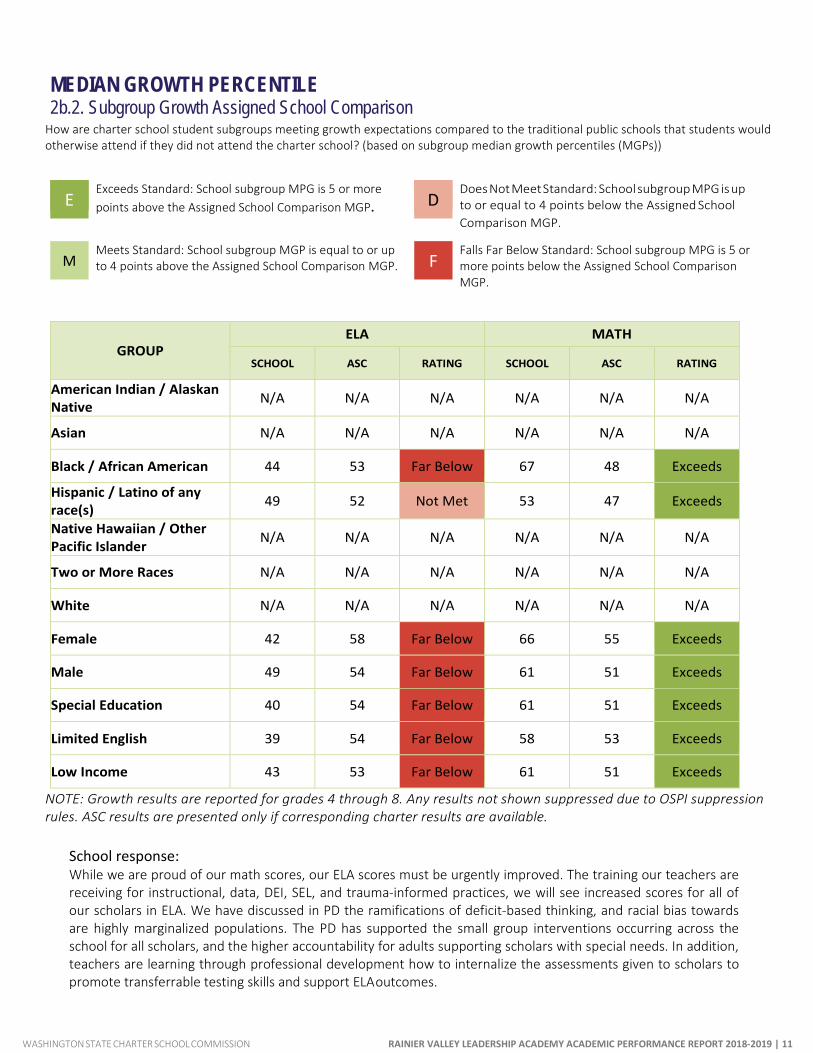
MEDIAN GROWTH PERCENTILE 2b.2. Subgroup Growth Assigned School Comparison
How are charter school student subgroups meeting growth expectations compared to the traditional public schools that students would otherwise attend if they did not attend the charter school? (based on subgroup median growth percentiles (MGPs))
E Exceeds Standard: School subgroup MPG is 5 or more points above the Assigned School Comparison MGP. D
Does Not Meet Standard: School subgroup MPG is up to or equal to 4 points below the Assigned School
Comparison MGP.
M Meets Standard: School subgroup MGP is equal to or up to 4 points above the Assigned School Comparison MGP. F
Falls Far Below Standard: School subgroup MPG is 5 or more points below the Assigned School Comparison MGP.
GROUP
ELA MATH
SCHOOL ASC RATING SCHOOL ASC RATING
American Indian / Alaskan Native N/A N/A N/A N/A N/A N/A
Asian N/A N/A N/A N/A N/A N/A
Black / African American 44 53 Far Below 67 48 Exceeds
Hispanic / Latino of any race(s) 49 52 Not Met 53 47 Exceeds
Native Hawaiian / Other Pacific Islander N/A N/A N/A N/A N/A N/A
Two or More Races N/A N/A N/A N/A N/A N/A
White N/A N/A N/A N/A N/A N/A
Female 42 58 Far Below 66 55 Exceeds
Male 49 54 Far Below 61 51 Exceeds
Special Education 40 54 Far Below 61 51 Exceeds
Limited English 39 54 Far Below 58 53 Exceeds
Low Income 43 53 Far Below 61 51 Exceeds
NOTE: Growth results are reported for grades 4 through 8. Any results not shown suppressed due to OSPI suppression rules. ASC results are presented only if corresponding charter results are available.
School response: While we are proud of our math scores, our ELA scores must be urgently improved. The training our teachers are receiving for instructional, data, DEI, SEL, and trauma-informed practices, we will see increased scores for all of our scholars in ELA. We have discussed in PD the ramifications of deficit-based thinking, and racial bias towards are highly marginalized populations. The PD has supported the small group interventions occurring across the school for all scholars, and the higher accountability for adults supporting scholars with special needs. In addition, teachers are learning through professional development how to internalize the assessments given to scholars to promote transferrable testing skills and support ELA outcomes.
WASHINGTON STATE CHARTER SCHOOL COMMISSION RAINIER VALLEY LEADERSHIP ACADEMY ACADEMIC PERFORMANCE REPORT 2018-2019 | 12
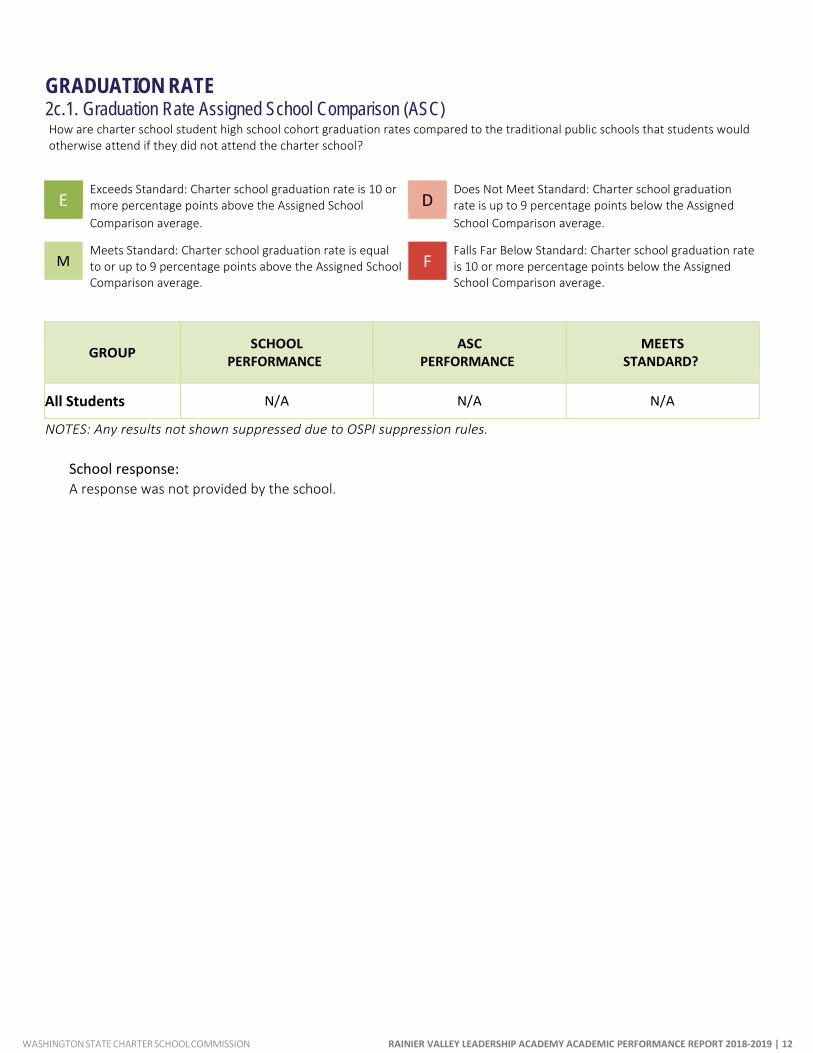
GRADUATION RATE 2c.1. Graduation Rate Assigned School Comparison (ASC) How are charter school student high school cohort graduation rates compared to the traditional public schools that students would otherwise attend if they did not attend the charter school?
E Exceeds Standard: Charter school graduation rate is 10 or more percentage points above the Assigned School D
Does Not Meet Standard: Charter school graduation rate is up to 9 percentage points below the Assigned
Comparison average. School Comparison average.
M Meets Standard: Charter school graduation rate is equal to or up to 9 percentage points above the Assigned School Comparison average.
F Falls Far Below Standard: Charter school graduation rate is 10 or more percentage points below the Assigned School Comparison average.
GROUP SCHOOL
PERFORMANCE ASC
PERFORMANCE MEETS
STANDARD?
All Students N/A N/A N/A
NOTES: Any results not shown suppressed due to OSPI suppression rules.
School response: A response was not provided by the school.
WASHINGTON STATE CHARTER SCHOOL COMMISSION RAINIER VALLEY LEADERSHIP ACADEMY ACADEMIC PERFORMANCE REPORT 2018-2019 | 13
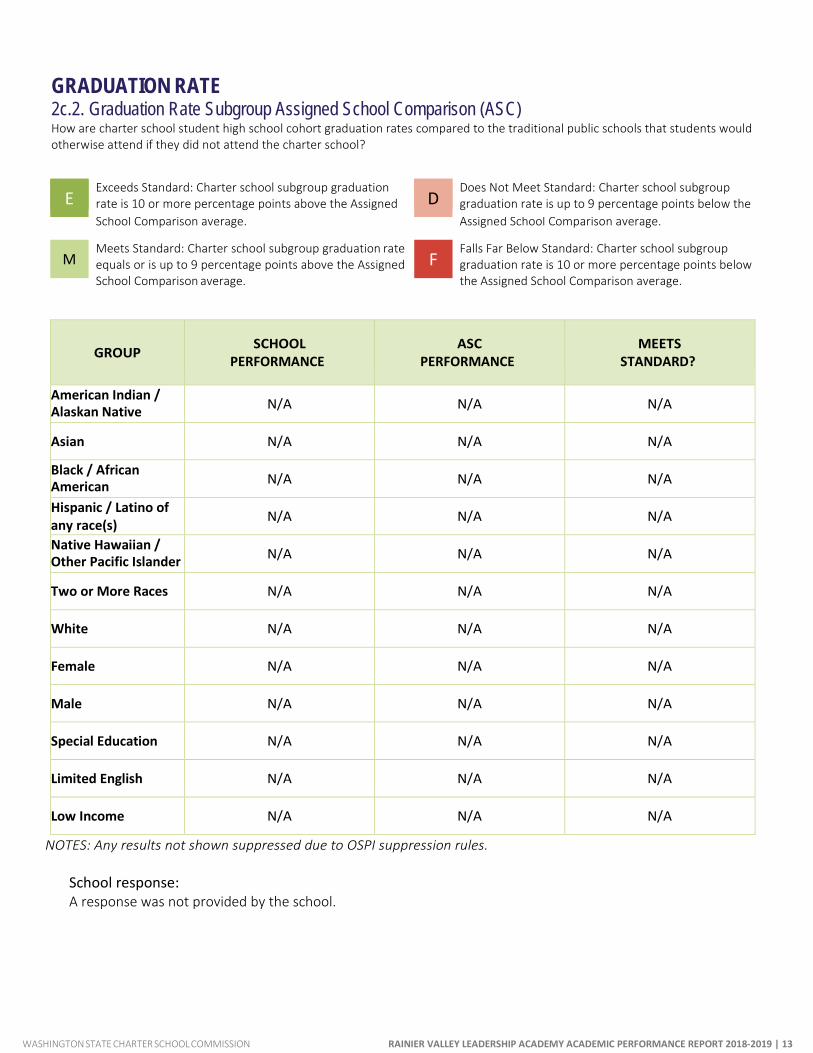
GRADUATION RATE 2c.2. Graduation Rate Subgroup Assigned School Comparison (ASC) How are charter school student high school cohort graduation rates compared to the traditional public schools that students would otherwise attend if they did not attend the charter school?
E Exceeds Standard: Charter school subgroup graduation rate is 10 or more percentage points above the Assigned D
Does Not Meet Standard: Charter school subgroup graduation rate is up to 9 percentage points below the
School Comparison average. Assigned School Comparison average.
M Meets Standard: Charter school subgroup graduation rate equals or is up to 9 percentage points above the Assigned School Comparison average.
F Falls Far Below Standard: Charter school subgroup graduation rate is 10 or more percentage points below the Assigned School Comparison average.
GROUP
SCHOOL
PERFORMANCE
ASC
PERFORMANCE
MEETS
STANDARD?
American Indian / Alaskan Native N/A N/A N/A
Asian N/A N/A N/A
Black / African American N/A N/A N/A
Hispanic / Latino of any race(s) N/A N/A N/A
Native Hawaiian / Other Pacific Islander N/A N/A N/A
Two or More Races N/A N/A N/A
White N/A N/A N/A
Female N/A N/A N/A
Male N/A N/A N/A
Special Education N/A N/A N/A
Limited English N/A N/A N/A
Low Income N/A N/A N/A
NOTES: Any results not shown suppressed due to OSPI suppression rules.
School response: A response was not provided by the school.
WASHINGTON STATE CHARTER SCHOOL COMMISSION RAINIER VALLEY LEADERSHIP ACADEMY ACADEMIC PERFORMANCE REPORT 2018-2019 | 14
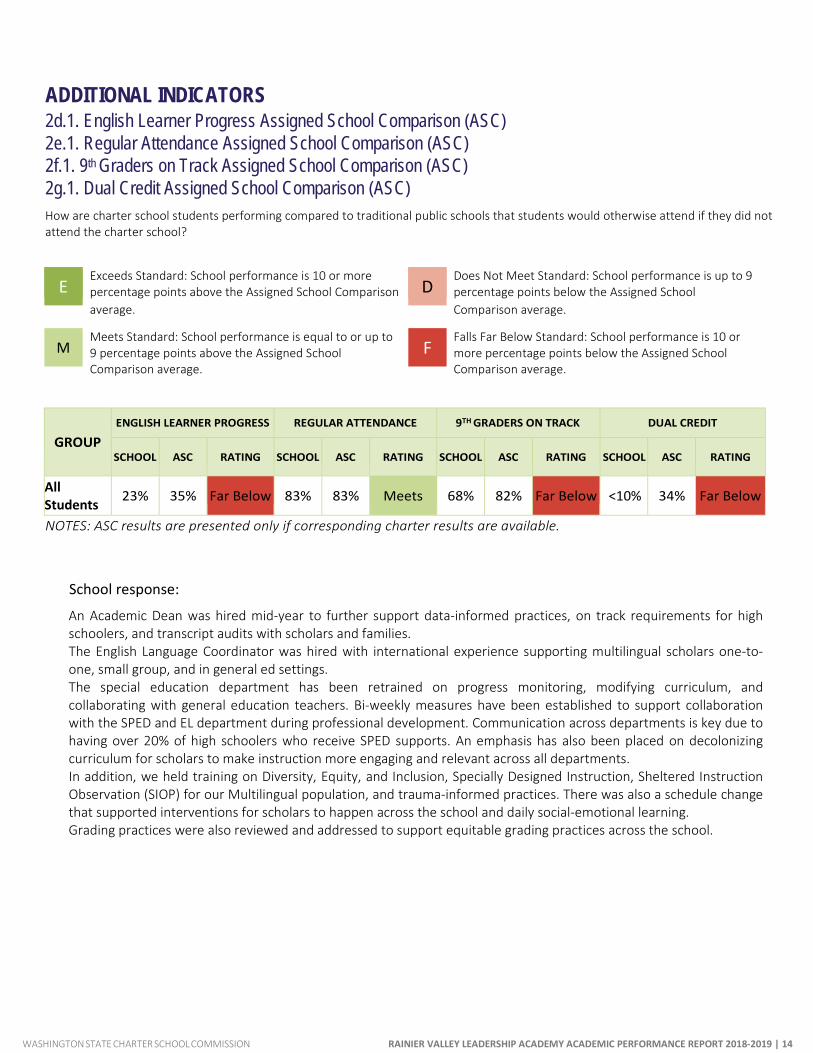
ADDITIONAL INDICATORS 2d.1. English Learner Progress Assigned School Comparison (ASC) 2e.1. Regular Attendance Assigned School Comparison (ASC) 2f.1. 9th Graders on Track Assigned School Comparison (ASC) 2g.1. Dual Credit Assigned School Comparison (ASC) How are charter school students performing compared to traditional public schools that students would otherwise attend if they did not attend the charter school?
E Exceeds Standard: School performance is 10 or more percentage points above the Assigned School Comparison D
Does Not Meet Standard: School performance is up to 9 percentage points below the Assigned School
average. Comparison average.
M Meets Standard: School performance is equal to or up to 9 percentage points above the Assigned School Comparison average.
F Falls Far Below Standard: School performance is 10 or more percentage points below the Assigned School Comparison average.
GROUP
ENGLISH LEARNER PROGRESS REGULAR ATTENDANCE 9TH GRADERS ON TRACK DUAL CREDIT
SCHOOL
ASC
RATING
SCHOOL
ASC
RATING
SCHOOL
ASC
RATING
SCHOOL
ASC
RATING
All Students 23% 35% Far Below 83% 83% Meets 68% 82% Far Below <10% 34% Far Below
NOTES: ASC results are presented only if corresponding charter results are available.
School response:
An Academic Dean was hired mid-year to further support data-informed practices, on track requirements for high schoolers, and transcript audits with scholars and families. The English Language Coordinator was hired with international experience supporting multilingual scholars one-to-one, small group, and in general ed settings. The special education department has been retrained on progress monitoring, modifying curriculum, and collaborating with general education teachers. Bi-weekly measures have been established to support collaboration with the SPED and EL department during professional development. Communication across departments is key due to having over 20% of high schoolers who receive SPED supports. An emphasis has also been placed on decolonizing curriculum for scholars to make instruction more engaging and relevant across all departments. In addition, we held training on Diversity, Equity, and Inclusion, Specially Designed Instruction, Sheltered Instruction Observation (SIOP) for our Multilingual population, and trauma-informed practices. There was also a schedule change that supported interventions for scholars to happen across the school and daily social-emotional learning. Grading practices were also reviewed and addressed to support equitable grading practices across the school.
WASHINGTON STATE CHARTER SCHOOL COMMISSION RAINIER VALLEY LEADERSHIP ACADEMY ACADEMIC PERFORMANCE REPORT 2018-2019 | 15
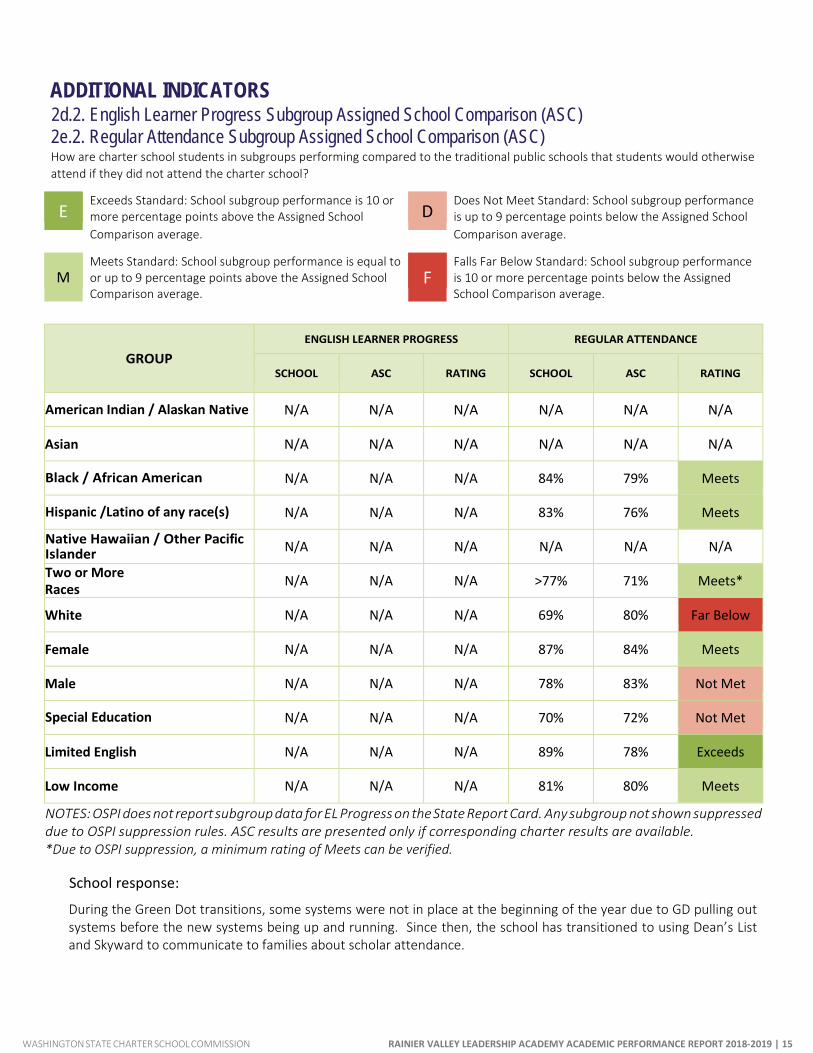
ADDITIONAL INDICATORS 2d.2. English Learner Progress Subgroup Assigned School Comparison (ASC) 2e.2. Regular Attendance Subgroup Assigned School Comparison (ASC) How are charter school students in subgroups performing compared to the traditional public schools that students would otherwise attend if they did not attend the charter school?
E Exceeds Standard: School subgroup performance is 10 or more percentage points above the Assigned School D
Does Not Meet Standard: School subgroup performance is up to 9 percentage points below the Assigned School
Comparison average. Comparison average.
M Meets Standard: School subgroup performance is equal to or up to 9 percentage points above the Assigned School Comparison average.
F Falls Far Below Standard: School subgroup performance is 10 or more percentage points below the Assigned School Comparison average.
GROUP ENGLISH LEARNER PROGRESS REGULAR ATTENDANCE
SCHOOL
ASC
RATING
SCHOOL
ASC
RATING
American Indian / Alaskan Native N/A N/A N/A N/A N/A N/A
Asian N/A N/A N/A N/A N/A N/A
Black / African American N/A N/A N/A 84% 79% Meets
Hispanic /Latino of any race(s) N/A N/A N/A 83% 76% Meets
Native Hawaiian / Other Pacific Islander N/A N/A N/A N/A N/A N/A
Two or More Races N/A N/A N/A >77% 71% Meets*
White N/A N/A N/A 69% 80% Far Below
Female N/A N/A N/A 87% 84% Meets
Male N/A N/A N/A 78% 83% Not Met
Special Education N/A N/A N/A 70% 72% Not Met
Limited English N/A N/A N/A 89% 78% Exceeds
Low Income N/A N/A N/A 81% 80% Meets
NOTES: OSPI does not report subgroup data for EL Progress on the State Report Card. Any subgroup not shown suppressed due to OSPI suppression rules. ASC results are presented only if corresponding charter results are available. *Due to OSPI suppression, a minimum rating of Meets can be verified.
School response:
During the Green Dot transitions, some systems were not in place at the beginning of the year due to GD pulling out systems before the new systems being up and running. Since then, the school has transitioned to using Dean’s List and Skyward to communicate to families about scholar attendance.
WASHINGTON STATE CHARTER SCHOOL COMMISSION RAINIER VALLEY LEADERSHIP ACADEMY ACADEMIC PERFORMANCE REPORT 2018-2019 | 16
While we have a low experience level for our educators for the 19-20 school year, and all of them are new to RVLA, we are focusing on trying to rebuild trust with scholars. The broken trust of scholars losing meaningful relationships has adversely affected attendance even with the systems being put in place later in the 19-20 school year. The increase of communication by mentors supports the relationship building with scholars. Relationship building is supported by the No-Nonsense Nurturer (NNN) approach to classroom management, where relationship building is prioritized across all classrooms to support scholars wanting to attend school. We coached specifically for classroom management and had a turnaround specialist come into train on the NNN training for all faculty, with online refresher courses through the 19-20 school year supported by real-time coaching.
WASHINGTON STATE CHARTER SCHOOL COMMISSION RAINIER VALLEY LEADERSHIP ACADEMY ACADEMIC PERFORMANCE REPORT 2018-2019 | 17
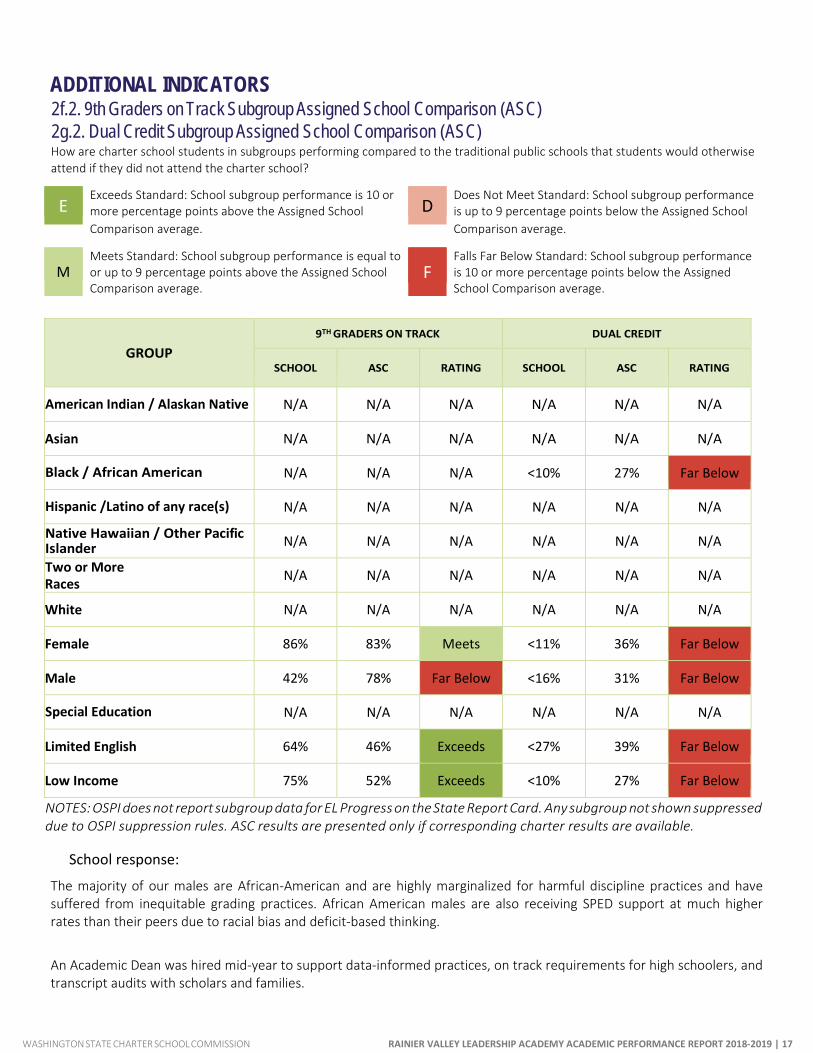
ADDITIONAL INDICATORS 2f.2. 9th Graders on Track Subgroup Assigned School Comparison (ASC) 2g.2. Dual Credit Subgroup Assigned School Comparison (ASC) How are charter school students in subgroups performing compared to the traditional public schools that students would otherwise attend if they did not attend the charter school?
E Exceeds Standard: School subgroup performance is 10 or more percentage points above the Assigned School D
Does Not Meet Standard: School subgroup performance is up to 9 percentage points below the Assigned School
Comparison average. Comparison average.
M Meets Standard: School subgroup performance is equal to or up to 9 percentage points above the Assigned School Comparison average.
F Falls Far Below Standard: School subgroup performance is 10 or more percentage points below the Assigned School Comparison average.
GROUP 9TH GRADERS ON TRACK DUAL CREDIT
SCHOOL
ASC
RATING
SCHOOL
ASC
RATING
American Indian / Alaskan Native N/A N/A N/A N/A N/A N/A
Asian N/A N/A N/A N/A N/A N/A
Black / African American N/A N/A N/A <10% 27% Far Below
Hispanic /Latino of any race(s) N/A N/A N/A N/A N/A N/A
Native Hawaiian / Other Pacific Islander N/A N/A N/A N/A N/A N/A
Two or More Races N/A N/A N/A N/A N/A N/A
White N/A N/A N/A N/A N/A N/A
Female 86% 83% Meets <11% 36% Far Below
Male 42% 78% Far Below <16% 31% Far Below
Special Education N/A N/A N/A N/A N/A N/A
Limited English 64% 46% Exceeds <27% 39% Far Below
Low Income 75% 52% Exceeds <10% 27% Far Below
NOTES: OSPI does not report subgroup data for EL Progress on the State Report Card. Any subgroup not shown suppressed due to OSPI suppression rules. ASC results are presented only if corresponding charter results are available.
School response:
The majority of our males are African-American and are highly marginalized for harmful discipline practices and have suffered from inequitable grading practices. African American males are also receiving SPED support at much higher rates than their peers due to racial bias and deficit-based thinking.
An Academic Dean was hired mid-year to support data-informed practices, on track requirements for high schoolers, and transcript audits with scholars and families.
WASHINGTON STATE CHARTER SCHOOL COMMISSION RAINIER VALLEY LEADERSHIP ACADEMY ACADEMIC PERFORMANCE REPORT 2018-2019 | 18
The special education department has been retrained on progress monitoring, modifying curriculum, and collaborating with general education teachers. Bi-weekly measures have been established to support collaboration with the SPED and EL department during professional development. Communication across departments is key due to having over 20% high schoolers who receive SPED supports. An emphasis has also been placed on decolonizing curriculum for scholars to make instruction more engaging and relevant across all departments. In addition, we held training on Diversity, Equity, and Inclusion, Specially Designed Instruction, Sheltered Instruction Observation (SIOP) for our Multilingual population, and trauma-informed practices. There was also a schedule change that supported interventions for scholars to happen across the school and daily social-emotional learning. Grading practices were also reviewed and addressed to support equitable grading practices across the school.
WASHINGTON STATE CHARTER SCHOOL COMMISSION RAINIER VALLEY LEADERSHIP ACADEMY ACADEMIC PERFORMANCE REPORT 2018-2019 | 19
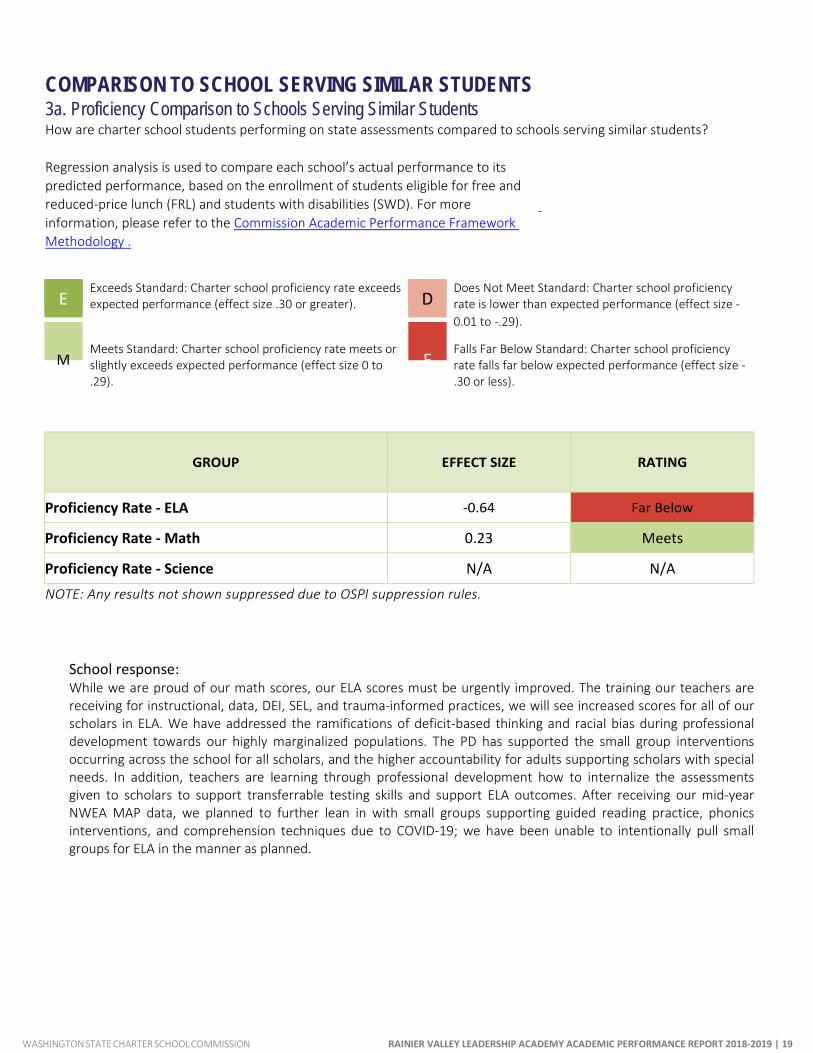
COMPARISON TO SCHOOL SERVING SIMILAR STUDENTS 3a. Proficiency Comparison to Schools Serving Similar Students How are charter school students performing on state assessments compared to schools serving similar students?
Regression analysis is used to compare each school’s actual performance to its predicted performance, based on the enrollment of students eligible for free and reduced-price lunch (FRL) and students with disabilities (SWD). For more information, please refer to the Commission Academic Performance Framework Methodology .
E Exceeds Standard: Charter school proficiency rate exceeds expected performance (effect size .30 or greater). D
Does Not Meet Standard: Charter school proficiency rate is lower than expected performance (effect size -
0.01 to -.29).
M Meets Standard: Charter school proficiency rate meets or slightly exceeds expected performance (effect size 0 to .29).
F Falls Far Below Standard: Charter school proficiency rate falls far below expected performance (effect size - .30 or less).
GROUP
EFFECT SIZE
RATING
Proficiency Rate - ELA -0.64 Far Below
Proficiency Rate - Math 0.23 Meets
Proficiency Rate - Science N/A N/A NOTE: Any results not shown suppressed due to OSPI suppression rules.
School response: While we are proud of our math scores, our ELA scores must be urgently improved. The training our teachers are receiving for instructional, data, DEI, SEL, and trauma-informed practices, we will see increased scores for all of our scholars in ELA. We have addressed the ramifications of deficit-based thinking and racial bias during professional development towards our highly marginalized populations. The PD has supported the small group interventions occurring across the school for all scholars, and the higher accountability for adults supporting scholars with special needs. In addition, teachers are learning through professional development how to internalize the assessments given to scholars to support transferrable testing skills and support ELA outcomes. After receiving our mid-year NWEA MAP data, we planned to further lean in with small groups supporting guided reading practice, phonics interventions, and comprehension techniques due to COVID-19; we have been unable to intentionally pull small groups for ELA in the manner as planned.
WASHINGTON STATE CHARTER SCHOOL COMMISSION RAINIER VALLEY LEADERSHIP ACADEMY ACADEMIC PERFORMANCE REPORT 2018-2019 | 20
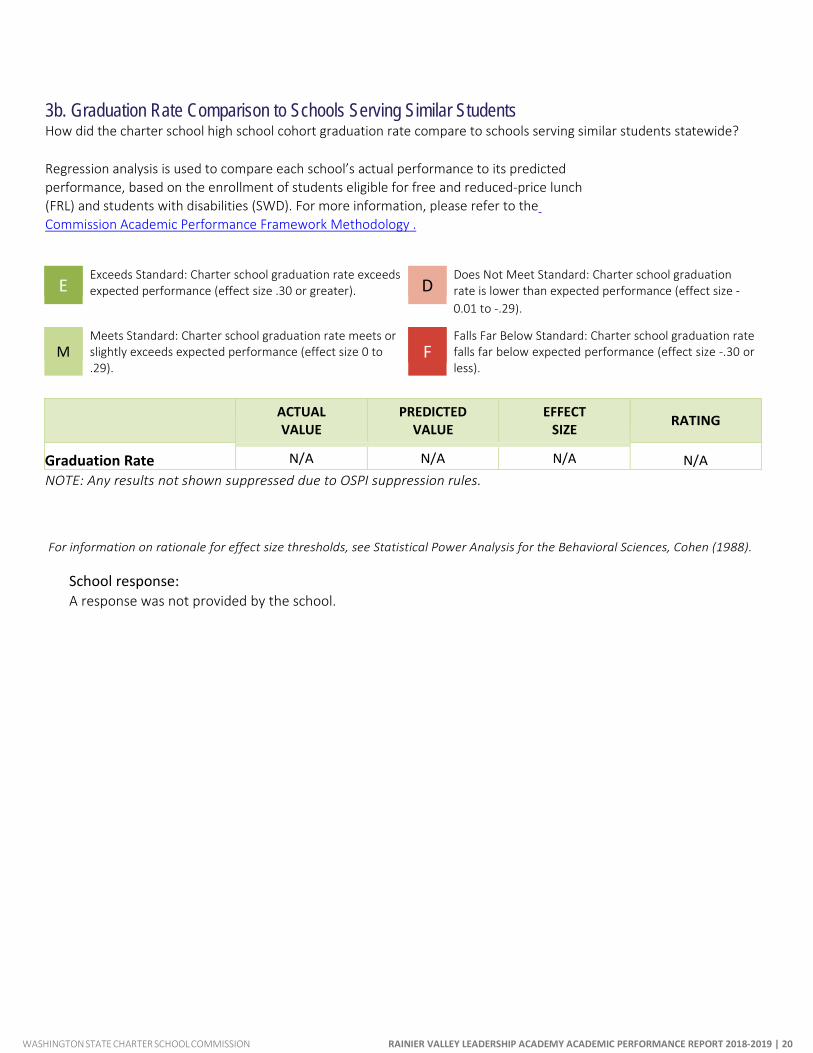
3b. Graduation Rate Comparison to Schools Serving Similar Students How did the charter school high school cohort graduation rate compare to schools serving similar students statewide?
Regression analysis is used to compare each school’s actual performance to its predicted performance, based on the enrollment of students eligible for free and reduced-price lunch (FRL) and students with disabilities (SWD). For more information, please refer to the Commission Academic Performance Framework Methodology .
E Exceeds Standard: Charter school graduation rate exceeds expected performance (effect size .30 or greater). D
Does Not Meet Standard: Charter school graduation rate is lower than expected performance (effect size -
0.01 to -.29).
M Meets Standard: Charter school graduation rate meets or slightly exceeds expected performance (effect size 0 to .29).
F Falls Far Below Standard: Charter school graduation rate falls far below expected performance (effect size -.30 or less).
ACTUAL
VALUE PREDICTED
VALUE EFFECT
SIZE RATING
Graduation Rate N/A N/A N/A N/A NOTE: Any results not shown suppressed due to OSPI suppression rules.
For information on rationale for effect size thresholds, see Statistical Power Analysis for the Behavioral Sciences, Cohen (1988).
School response: A response was not provided by the school.
WASHINGTON STATE CHARTER SCHOOL COMMISSION RAINIER VALLEY LEADERSHIP ACADEMY ACADEMIC PERFORMANCE REPORT 2018-2019 | 21
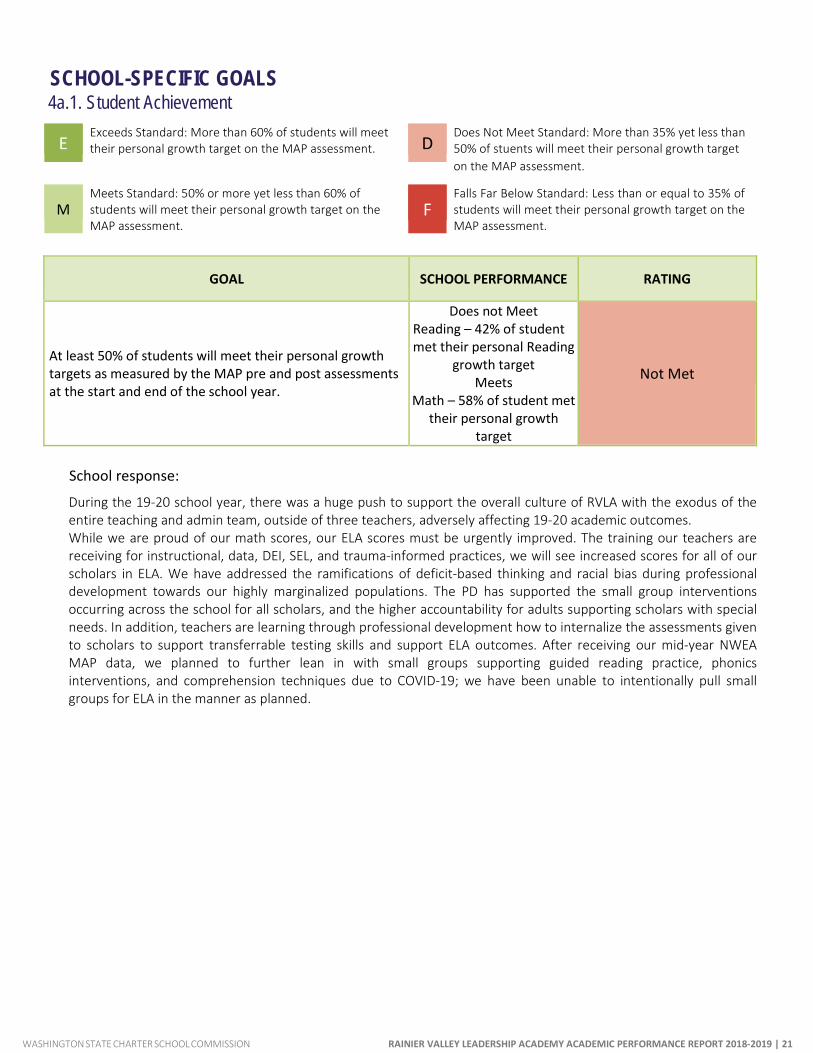
SCHOOL-SPECIFIC GOALS 4a.1. Student Achievement
E Exceeds Standard: More than 60% of students will meet their personal growth target on the MAP assessment. D
Does Not Meet Standard: More than 35% yet less than 50% of stuents will meet their personal growth target
on the MAP assessment.
M
Meets Standard: 50% or more yet less than 60% of students will meet their personal growth target on the MAP assessment.
F Falls Far Below Standard: Less than or equal to 35% of students will meet their personal growth target on the MAP assessment.
GOAL SCHOOL PERFORMANCE RATING
At least 50% of students will meet their personal growth targets as measured by the MAP pre and post assessments at the start and end of the school year.
Does not Meet Reading – 42% of student met their personal Reading
growth target Meets
Math – 58% of student met their personal growth
target
Not Met
School response:
During the 19-20 school year, there was a huge push to support the overall culture of RVLA with the exodus of the entire teaching and admin team, outside of three teachers, adversely affecting 19-20 academic outcomes. While we are proud of our math scores, our ELA scores must be urgently improved. The training our teachers are receiving for instructional, data, DEI, SEL, and trauma-informed practices, we will see increased scores for all of our scholars in ELA. We have addressed the ramifications of deficit-based thinking and racial bias during professional development towards our highly marginalized populations. The PD has supported the small group interventions occurring across the school for all scholars, and the higher accountability for adults supporting scholars with special needs. In addition, teachers are learning through professional development how to internalize the assessments given to scholars to support transferrable testing skills and support ELA outcomes. After receiving our mid-year NWEA MAP data, we planned to further lean in with small groups supporting guided reading practice, phonics interventions, and comprehension techniques due to COVID-19; we have been unable to intentionally pull small groups for ELA in the manner as planned.
MAILING ADDRESS PHONE P.O. Box 40996, Olympia, WA 98504-0996 (360) 725-5511
STREET ADDRESS EMAIL
1068 Washington Street SE, Olympia, WA 98501 [email protected]
CHARTERSCHOOL.WA.GOV