
Rafael Tezza , Antonio Cezar Bornia D´ebora Spenassato and ... · RAFAEL TEZZA, ANTONIO C. BORNIA,...
30
Pesquisa Operacional (2016) 36(3): 503-532 © 2016 Brazilian Operations Research Society Printed version ISSN 0101-7438 / Online version ISSN 1678-5142 www.scielo.br/pope doi: 10.1590/0101-7438.2016.036.03.0503 EMPIRICAL COMPARISON OF THE MULTIDIMENSIONAL MODELS OF ITEM RESPONSE THEORY IN E-COMMERCE Rafael Tezza 1* , Antonio Cezar Bornia 2 , D´ ebora Spenassato 3 and Andr´ ea Cristina Trierweiller 4 Received April 20, 2015 / Accepted October 20, 2016 ABSTRACT. The measurement of latent traits within the organizational field such as quality, effectiveness and learning has been conducted in several formats using a wide variety of quantitative methods, includ- ing Item Response Theory that consistently increased in organizational studies. The purpose of this article is to compare the hierarchical and non-hierarchical structures of three multidimensional models of Item Response Theory, based on the interface quality measurement in e-commerce sites. We compared the mul- tiple unidimensional, compensatory multidimensional and bifactorial models, and also elaborated and ap- plied 75 items in a sample of 441 e-commerce websites. As a result, we conducted a discussion of the latent construct, the quality in e-commerce and its multidimensional configuration to adjust and compare three multidimensional models. Keywords: multidimensional Item Response Theory, latent trait, measurement, websites, organizations. 1 INTRODUCTION The quality of websites is a complex matter and sometimes difficult to be measured directly. Multiple features should be discussed from various angles that exceed the simple to use inter- face technical questions, including issues related to aesthetics, reliability, interactivity and other factors that involve non-technical issues. According to Nielsen (2007), technical issues such as usability continue to be necessary, but not a sufficient condition that provides the quality de- manded for a website, in all contexts. *Corresponding author. 1 Centro de Ciˆ encias da Administrac ¸˜ ao e Socioeconˆ omicas, Universidade do Estado de Santa Catarina, Av. Madre Ben- venuta, 2037, 88035-001 Itacorub´ ı, Florian ´ opolis, SC, Brasil. E-mail: [email protected] 2 Departamento de Engenharia de Produc ¸˜ ao e Sistemas, Universidade Federal de Santa Catarina, Caixa Postal 476, Cam- pus Universit´ ario, 88010-970 Florian´ opolis, SC, Brasil. E-mail: [email protected] 3 Instituto de Matem´ atica, Estat´ ıstica e F´ ısica, Universidade Federal do Rio Grande, Campus Carreiros, Av. It´ alia Km 8, 96201-900 Rio Grande, RS, Brasil. E-mail: [email protected] 4 Departamento de Tecnologias da Informac ¸˜ ao e Comunicac ¸˜ ao, Universidade Federal de Santa Catarina, Rua Prefeito Walter Belinzoni, 219, 88900-017 Ararangu´ a, SC, Brasil. E-mail: [email protected]
Transcript of Rafael Tezza , Antonio Cezar Bornia D´ebora Spenassato and ... · RAFAEL TEZZA, ANTONIO C. BORNIA,...
�
�
“main” — 2017/1/2 — 16:14 — page 503 — #1�
�
�
�
�
�
Pesquisa Operacional (2016) 36(3): 503-532© 2016 Brazilian Operations Research SocietyPrinted version ISSN 0101-7438 / Online version ISSN 1678-5142www.scielo.br/popedoi: 10.1590/0101-7438.2016.036.03.0503
EMPIRICAL COMPARISON OF THE MULTIDIMENSIONAL MODELSOF ITEM RESPONSE THEORY IN E-COMMERCE
Rafael Tezza1*, Antonio Cezar Bornia2,Debora Spenassato3 and Andrea Cristina Trierweiller4
Received April 20, 2015 / Accepted October 20, 2016
ABSTRACT. The measurement of latent traits within the organizational field such as quality, effectiveness
and learning has been conducted in several formats using a wide variety of quantitative methods, includ-
ing Item Response Theory that consistently increased in organizational studies. The purpose of this article
is to compare the hierarchical and non-hierarchical structures of three multidimensional models of Item
Response Theory, based on the interface quality measurement in e-commerce sites. We compared the mul-
tiple unidimensional, compensatory multidimensional and bifactorial models, and also elaborated and ap-
plied 75 items in a sample of 441 e-commerce websites. As a result, we conducted a discussion of the latent
construct, the quality in e-commerce and its multidimensional configuration to adjust and compare three
multidimensional models.
Keywords: multidimensional Item Response Theory, latent trait, measurement, websites, organizations.
1 INTRODUCTION
The quality of websites is a complex matter and sometimes difficult to be measured directly.
Multiple features should be discussed from various angles that exceed the simple to use inter-face technical questions, including issues related to aesthetics, reliability, interactivity and otherfactors that involve non-technical issues. According to Nielsen (2007), technical issues such as
usability continue to be necessary, but not a sufficient condition that provides the quality de-manded for a website, in all contexts.
*Corresponding author.1Centro de Ciencias da Administracao e Socioeconomicas, Universidade do Estado de Santa Catarina, Av. Madre Ben-venuta, 2037, 88035-001 Itacorubı, Florianopolis, SC, Brasil. E-mail: [email protected] de Engenharia de Producao e Sistemas, Universidade Federal de Santa Catarina, Caixa Postal 476, Cam-pus Universitario, 88010-970 Florianopolis, SC, Brasil. E-mail: [email protected] de Matematica, Estatıstica e Fısica, Universidade Federal do Rio Grande, Campus Carreiros, Av. Italia Km 8,96201-900 Rio Grande, RS, Brasil. E-mail: [email protected] de Tecnologias da Informacao e Comunicacao, Universidade Federal de Santa Catarina, Rua PrefeitoWalter Belinzoni, 219, 88900-017 Ararangua, SC, Brasil. E-mail: [email protected]
�
�
“main” — 2017/1/2 — 16:14 — page 504 — #2�
�
�
�
�
�
504 MULTIDIMENSIONAL MODELS OF ITEM RESPONSE THEORY IN E-COMMERCE
A variety of scales using various dimensions were suggested to measure the quality of service
within electronic commerce (known as quality of e-service or e-quality). Many of them influ-enced the quality of the website itself (Bernado et al. 2012).
Existing studies discuss that website quality has a multidimensional construct, yet a consensushas not been reached on what dimensions are most relevant and what is the multidimensional
nature or configuration (Zeithaml et al., 2002; Parasuraman et al., 2005; Fassnacht & Koese,2006).
Item Response Theory (IRT) proceeds from the efforts to understand the relations between thedimensions and the creation of a comparable scale. IRT is composed of a set of probabilistic
models that relate the latent trait of a respondent (θ), something that cannot be directly measured,to the probability that this responds to an item within a certain category (Lord, 1980).
The application of IRT requires some initial presumptions such as the determination of IRTmodel that is suitable to the set of data to be analyzed and the objectives of the study. In general,
the selection of a satisfactory IRT model is based partially on how acceptable the model is tothe data. Whenever the data do not suit the model, the properties of IRT will not be assured,this could happen in a case of invariance of the parameters in a population study, for instance.
(Hambleton et al., 1991).
Choosing a specific multidimensional model depends mainly on the nature of the latent dimen-sions, the items and the how they are associated within the test. Different models of Multidimen-sional Item Response Theory (MIRT) assume different statistical relations between the latent
dimensions and the performance of the respondent (Hartig & Hohler, 2009). Furthermore, it isimportant to understand the multidimensional structures involved in an analysis, which are therelations between latent dimensions and the items and the relations between the latent dimen-
sions and the respondents.
From these structures, emerged the hierarchical multidimensional models that have a generalfactor and a specific factor to their superior dimension, and those that are not hierarchical, whichhave various dimensions that may or may not be correlated to clarify a general latent trait.
The purpose of this article is to compare three multidimensional models of IRT: hierarchic (bi-
factorial) and non-hierarchical (multiple unidimensional and compensatory multidimensional) tomeasure the quality of commercial websites. This approach is justified by the fact that the qualityof websites has been treated as a multidimensional issue and Item Response Theory, both in its
simple unidimensional modeling (e.g. Sijtsma, 2011; Tezza et al., 2001), and its more complexmultidimensional modeling (e.g. Bernini et al., 2014) are presented as capable tools of measur-ing latent traits, revealing the relations between respondents and the items of a study, to position
them in a single, comparable and valid scale for broader situations, to not depend directly fromthe group of respondents, resulting in a better understanding of the relationship between thedimensions and respondents.
Pesquisa Operacional, Vol. 36(3), 2016
�
�
“main” — 2017/1/2 — 16:14 — page 505 — #3�
�
�
�
�
�
RAFAEL TEZZA, ANTONIO C. BORNIA, DEBORA SPENASSATO and ANDREA C. TRIERWEILLER 505
2 THEORETICAL REFERENCES
2.1 Multidimensional Item Response Theory
The mathematical foundation of IRT is a function that relates the probability of a person re-sponding to an item in a specific manner to the standing of that person on trait that item ismeasuring (Ostini & Nering, 2006). One of the underlying assumptions of IRT is that examineesare all using the same skill or same composition of multiple skills to respond to each of the itemsin a test. When item response data do not satisfy the unidimensionality assumption, Multidi-mensional Item Response Theory (MIRT) should be used to model the item-examinee interac-tion. MIRT enables modeling the interaction of items that are capable of discriminating betweenlevels of several different abilities and examinees that vary in their proficiencies in these abilities(Ackerman, 1994; Reckase, 2009).
The use of MIRT models to handle measuring problems in large-scale educational evaluationhas been conducted since the early 1990s (Ackerman, 1992; Camilli, 1992; Embretson, 1991;Glas, 1992; Oshima & Miller, 1992; Reckase & McKinley, 1991). Nevertheless, according toAdams et al. (1997), Hartig & Hohler (2008), Rauch & Hartig (2010), the application of modelsin a practical test outside of the educational (e.g. Levy, 2011) and psychological (e.g. Reise etal., 2011; Wilson, 2013) fields are relatively rare. Within the organizational context, the appli-cation of IRT is recent, Tezza et al. (2011) applied the logistical model of two unidimensionalparameters, Birnbaum (1968) measured the usability in commercial websites, Trierweiller et al.(2013) applied the same model to propose a scale for measuring the disclosure of information ofenvironmental management practices in Brazilian industries, Bernini et al. (2014) used a multidi-mensional approach of IRT to investigate the heterogeneity in residents’ reaction to the tourismindustry. Tay et al. (2011) applied a mixed model that considers latent variables of variablesobserved to measure union citizenship behavior with years of work experience and gender ascovariates. Rivers et al. (2009) applied IRT to measure employees’ attitude in relation to thedirectorate of an organization and its overall communication with them. Other studies, such asCarter et al. (2011), LaHuis et al. (2011), Nye et al. (2010), Tay & Drasgow (2012) also appliedIRT in the organizational context and Soares (2005) implemented it in socio-economic statusindex, demonstrating the viability of this tool as well as its potential in this field.
Depending on the final objectives and the structure of the data, MIRT can be considered a specialcase of multi-varied statistical analysis, especially factorial analysis or modeling of structuralequations, or even, as an extension of the unidimensional IRT (Reckase, 2009).
Before presenting the models of MIRT, it is important to understand the multidimensional struc-tures involved in a test: First, the relationship between latent dimensions and the items andthen, the relationship between the latent dimensions and the respondents. As stated by Adamset al. (1997) and Hartig & Hohler (2009), the standard of relations between the dimensions andthe items can be defined by a loading matrix with a simple structure (multidimensionality be-tween the items) or by a structure of complex loading (multidimensionality between each item),and therefore it varies in complexity. Meanwhile, the standard of the relationship between thelatent dimensions and the ability of the respondent has a compensatory or non-compensatoryinteraction.
Pesquisa Operacional, Vol. 36(3), 2016
�
�
“main” — 2017/1/2 — 16:14 — page 506 — #4�
�
�
�
�
�
506 MULTIDIMENSIONAL MODELS OF ITEM RESPONSE THEORY IN E-COMMERCE
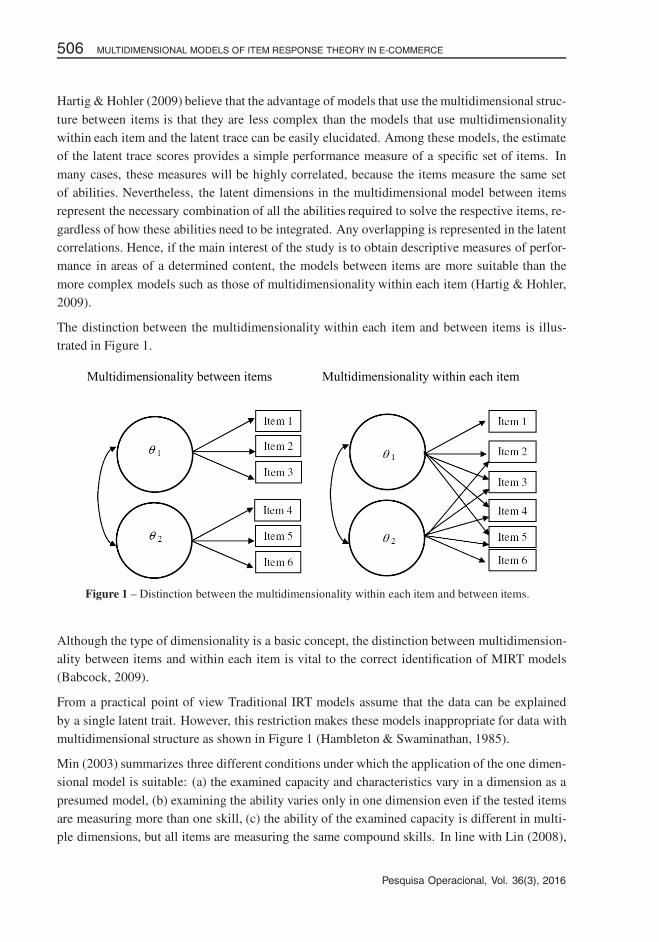
Hartig & Hohler (2009) believe that the advantage of models that use the multidimensional struc-
ture between items is that they are less complex than the models that use multidimensionalitywithin each item and the latent trace can be easily elucidated. Among these models, the estimateof the latent trace scores provides a simple performance measure of a specific set of items. In
many cases, these measures will be highly correlated, because the items measure the same setof abilities. Nevertheless, the latent dimensions in the multidimensional model between itemsrepresent the necessary combination of all the abilities required to solve the respective items, re-
gardless of how these abilities need to be integrated. Any overlapping is represented in the latentcorrelations. Hence, if the main interest of the study is to obtain descriptive measures of perfor-mance in areas of a determined content, the models between items are more suitable than the
more complex models such as those of multidimensionality within each item (Hartig & Hohler,2009).
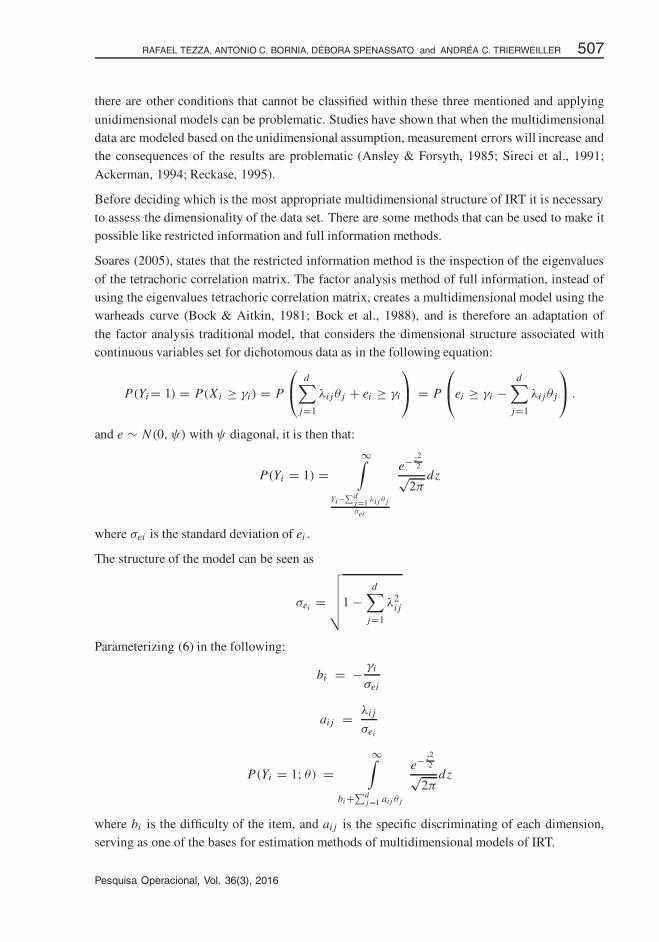
The distinction between the multidimensionality within each item and between items is illus-trated in Figure 1.
Multidimensionality between items Multidimensionality within each item
Figure 1 – Distinction between the multidimensionality within each item and between items.
Although the type of dimensionality is a basic concept, the distinction between multidimension-ality between items and within each item is vital to the correct identification of MIRT models(Babcock, 2009).
From a practical point of view Traditional IRT models assume that the data can be explained
by a single latent trait. However, this restriction makes these models inappropriate for data withmultidimensional structure as shown in Figure 1 (Hambleton & Swaminathan, 1985).
Min (2003) summarizes three different conditions under which the application of the one dimen-sional model is suitable: (a) the examined capacity and characteristics vary in a dimension as a
presumed model, (b) examining the ability varies only in one dimension even if the tested itemsare measuring more than one skill, (c) the ability of the examined capacity is different in multi-ple dimensions, but all items are measuring the same compound skills. In line with Lin (2008),
Pesquisa Operacional, Vol. 36(3), 2016
�
�
“main” — 2017/1/2 — 16:14 — page 507 — #5�
�
�
�
�
�
RAFAEL TEZZA, ANTONIO C. BORNIA, DEBORA SPENASSATO and ANDREA C. TRIERWEILLER 507
there are other conditions that cannot be classified within these three mentioned and applying
unidimensional models can be problematic. Studies have shown that when the multidimensionaldata are modeled based on the unidimensional assumption, measurement errors will increase andthe consequences of the results are problematic (Ansley & Forsyth, 1985; Sireci et al., 1991;
Ackerman, 1994; Reckase, 1995).
Before deciding which is the most appropriate multidimensional structure of IRT it is necessaryto assess the dimensionality of the data set. There are some methods that can be used to make itpossible like restricted information and full information methods.
Soares (2005), states that the restricted information method is the inspection of the eigenvalues
of the tetrachoric correlation matrix. The factor analysis method of full information, instead ofusing the eigenvalues tetrachoric correlation matrix, creates a multidimensional model using thewarheads curve (Bock & Aitkin, 1981; Bock et al., 1988), and is therefore an adaptation of
the factor analysis traditional model, that considers the dimensional structure associated withcontinuous variables set for dichotomous data as in the following equation:
P(Yi = 1) = P(Xi ≥ γi) = P
⎛⎝ d∑
j=1
λi jθ j + ei ≥ γi
⎞⎠ = P
⎛⎝ei ≥ γi −
d∑j=1
λi jθ j
⎞⎠ .
and e ∼ N(0, ψ) with ψ diagonal, it is then that:
P(Yi = 1) =∞∫
Yi −∑d
j=1 λi j θ jσei
e− z22√
2πdz
where σei is the standard deviation of ei .
The structure of the model can be seen as
σei =
√√√√√1 −d∑
j=1
λ2i j
Parameterizing (6) in the following:
bi = − γi
σei
ai j = λi j
σei
P(Yi = 1; θ) =∞∫
bi+∑dj=1 ai j θ j
e− z22√
2πdz
where bi is the difficulty of the item, and ai j is the specific discriminating of each dimension,serving as one of the bases for estimation methods of multidimensional models of IRT.
Pesquisa Operacional, Vol. 36(3), 2016
�
�
“main” — 2017/1/2 — 16:14 — page 508 — #6�
�
�
�
�
�
508 MULTIDIMENSIONAL MODELS OF ITEM RESPONSE THEORY IN E-COMMERCE
Reckase (1985) describes the compensatory multidimensional model of two parameters in the
following manner:
P(Ui j = 1|−→θ jk, di ,
−→aik) = e(
∑mk=1 aik θik +di)
1 + e(∑m
k=1 aik θik +di)(1)
where:
Ui j = response of the individual (or website) j to item i (0 or 1);aik = vector of the parameter of discrimination of the item i in the dimension k;θ jk = vector of the latent trait of the individual (or website) j in dimension m;
di = scale of the parameter of difficulty of item i.
The exponent of e in the model (1) can be expressed in the following manner:
m∑k=1
aikθik + di = ai1θ j1 + ai2θ j2 + . . .+ aikθ jk + di (2)
Equation (2) shows that the exponent is a linear function of elements of θ with parameter d as the
ordinate of the origin and the elements of vector a as the parameters of inclination/discrimination.One of the properties of this model is that the expression represented in the exponent defines aline in a space of k dimensions that can generate lines of equiprobability, meaning, this mul-
tidimensional form allows the existence of infinite linear combinations that result in the sameexponent, thus generating, the same probability of accuracy. This property confirms the modelof compensatory characteristic.
Gibbons & Hedeker (1992) developed general concepts based on the classic work of Holzinger
& Swineford (1937) and propose the Full-information Bifactorial (FI Bifactorial) model for di-chotomous data (Li & Rupp, 2011). This model consists of general factors and groups of factorsor of independent dimensions. The model FI Bifactorial assumes the place of a general factor
that involves all the items and two or more groups of factors (or dimensions) corresponding tospecific subgroups (Gibbons et al., 2007).
Mathematically, the FI Bifactorial model considers cases in which for n items, there is a solutionof s factors of which one of the factors is considered a general factor and s−1 is related to groups
or factors. The bifactorial solution restricts each item i to having a different load of zero ai1 overthe primary dimension and a second load (aik , k = 2, . . . s) and not more than one of the s − 1groups of factors. For four hypothetical items, the standard bifactorial matrix can be represented
in the following (Gibbons & Hedeker, 1992):
∝=
⎡⎢⎢⎢⎣
∝11 ∝12 0
∝21 ∝22 0∝31 0 ∝33
∝41 0 ∝43
⎤⎥⎥⎥⎦ (3)
where the first column of the matrix represents the main factor and the second and third columnsrepresent the group of specific factors.
Pesquisa Operacional, Vol. 36(3), 2016
�
�
“main” — 2017/1/2 — 16:14 — page 509 — #7�
�
�
�
�
�
RAFAEL TEZZA, ANTONIO C. BORNIA, DEBORA SPENASSATO and ANDREA C. TRIERWEILLER 509
As specified by Seo (2011), the dimensional structure in a bifactorial model is pre-determined
through previous information. Therefore, the bifactorial model is a confirmatory model. In theperspective of a confirmatory approach, the model allows each item to have loads in a singlegeneral factor and only one specific factor for the group. This particularity reduces the number of
parameters to be estimated and gives the model greater degrees of liberty. In addition, the bifac-torial model can avoid the problem of estimating inter-factorial correlations, because the generalfactor contributes directly to all items, and the factors secondary to the remaining residual infor-
mation after the calculation of the general factor are independent from each other. A particularquality of this model is the fact that the secondary factors are necessarily orthogonal betweeneach other and in relation to the general factor (Gibbons & Hedeker, 1992).
For two binaries, the bifactorial model can be defined as a particularization of the compensatory
multidimensional model presented in equation (1). In the case of the bifactorial model, the re-striction of loading the parameters of discrimination is inserted as it can be seen in equation (4).
P(Ui j = 1|θ j g, θ jesk
) = e[(aigθ j g+aiesk θ j esk )−di]
1 + e[(aigθ j g+aiesk θ j esk )−di] (4)
where θ j g is the ability of individual j in the general factor, θ jesk is the ability of the individualj in the specific factor k, aig represents the parameter of discrimination of item i in the general
factor and aiesk represents the parameter of discrimination of the item i in the specific factork and finally, di represents the scale of the parameter of difficulty of the item i referring tothe general dimension and to the specific dimension k. In this model, and in the compensatory
multidimensional model represented in equation (1), the responses are assumed to be statisticallyindependent.
Gibbons et al. (2007) believe that the FI Bifactorial model is relevant whenever the items share acommon characteristic. The presence of the subgroups of items typically introduces associations
relevant to the test that cannot be verified with total attribution of the loading parameter to thegeneral factor. In addition, according to the authors, this separation of factors improves the errorof the estimates.
Gibbons & Hedeker (1992) and Gibbons et al. (2009) believe that the restrictions of the bifacto-
rial model presented in matrix (3) lead to a greater simplification of the equations of probabilitybecause they require only the evaluation of the two integral dimensions, which (a) allow analyz-ing models with a larger number of factors (or dimensions), (b) allow a conditional dependency
between subgroups of identified items, and (c) in many cases provide a more parsimonious so-lution than the full information item factor analysis due to its lack of restrictions. Gibbons et al.(2007) extended the bifactorial model to cases of Polytomous Items Response Theory.
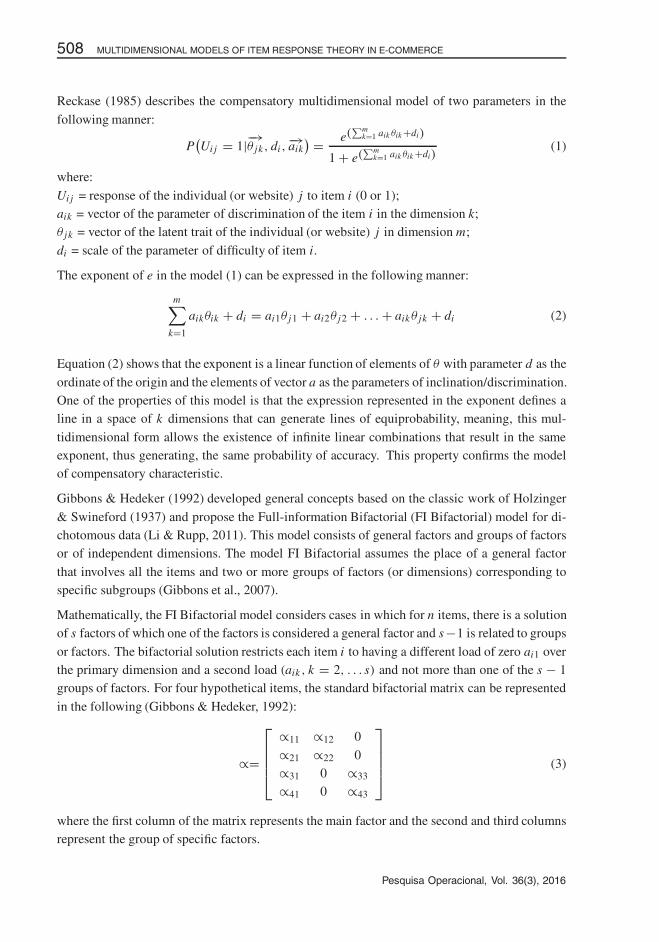
Figure 2 contextualizes the FI Bifactorial model within some multidimensional structures.
Model A is the standard unidimensional model in which the covariance between the responses
to the items is explained by a common factor. In model B, the matrix of data contains morethan a common dimension, although the dimensions are not correlated. This is a trivial case ofmultidimensionality and it is easy to solve, forming subscales and then separately adjusting to
Pesquisa Operacional, Vol. 36(3), 2016
�
�
“main” — 2017/1/2 — 16:14 — page 510 — #8�
�
�
�
�
�
510 MULTIDIMENSIONAL MODELS OF ITEM RESPONSE THEORY IN E-COMMERCE
the unidimensional models of IRT for each subscale. This is essentially equivalent to assuming
the dimensions as not correlated.
Model A Model B
Model C Model D
Figure 2 – Four possible structures of latent traits. Source: Reise et al. (2007).
Model C also has more than one common factor among the items, although the factors are cor-
related. This representation is characterized as a non-hierarchical multidimensional model.
Finally, model D is a bifactorial model, meaning, there is a general factor, which explains thecorrelations between items, but in addition, there are also the called “group” factors (on the right
side of the figure), which are trying to capture the covariance of the items that are independent ofthe covariance of the general factor. In other words, it is expressed in terms of quality measureof websites, it can suppose that the latent trait quality, considering its conceptual amplitude, rep-resents a general factor explained by other factors (for example, usability, aesthetic, architecture
of information, etc.), thus characterizing a suitability to model D (hierarchic multidimensional,etc.), therefore, the scope of this concept can lead to its dissolution into correlated subfactors –Model C (multidimensional non-hierarchical).
Pesquisa Operacional, Vol. 36(3), 2016
�
�
“main” — 2017/1/2 — 16:14 — page 511 — #9�
�
�
�
�
�
RAFAEL TEZZA, ANTONIO C. BORNIA, DEBORA SPENASSATO and ANDREA C. TRIERWEILLER 511
2.2 Quality on the web
Quality is not a new concept in management of information systems. Researchers and profes-sionals demonstrate that they are aware of the need to improve information systems to reactto external and internal pressure and face the critical challenges for their growth and survival(Aladwani, 1999; Aladwani & Palvia, 2002).
From the early 1980s until the late 1990s it was possible to find various studies that tried to con-ceptualize quality in information systems, demonstrating the concern among professionals andacademics to understand and improve these systems. These studies concentrate on conceptualiz-ing specific topics in this context, such as the quality of management of data (Kaplan et al., 1998;Wang et al., 1995), quality of information (King & Epstein, 1983; Haga & Zviram, 1994), qualityof software (ISO9126, 1992; Schneidewind, 1992; Kitchenham & Pfleege, 1996), global qualityof the system (Kettinger & Lee, 1994; Nelson, 1996), and others. These studies were much morefocused on the system evaluation, its performance and its relation with specific users.
Since the mid-1990s, with the development and popularization of the Internet, practices and re-searchers have strived to define quality in the context of the Internet (for example, Barnes &Vidgen, 2000; Day, 1997; Lindroos, 1997; Xie et al., 1998; Loiacono et al., 2002). Lindroos(1997) uses the perspective of software quality to discuss differences between web-based infor-mation systems and conventional information systems. Olsina et al. (1999), proposed a qualitymodel for university sites, called Website QEM based on user opinions. Barnes & Vidgen (2000),Loiacono et al. (2002), Parasuraman et al. (2005) and Ding et al. (2011) also developed similarmodels more focused on commercial sites. These and various other studies break the quality ofthe websites into several attributes. The creation of these models is based mainly on experiencesover many years in development and maintenance of information and web systems. The valida-tion of these models is made mainly by empiric studies, such as the analysis of data collectedin tests with users, satisfaction surveys and interviews. Nevertheless, different types of infor-mation systems can have different quality requirements (Worwa & Stanik, 2010). For example,commercial and personal websites are web-based information systems. However, their qualityrequirements are different, mainly in terms of information security and information searchingissues. Thus, any study about the quality issues on the web must have a clear delimitation of thelimits of the analysis given the large scope of the theme.
This study fits into the classification of Cristobal et al. (2007) as a study of website quality anddesign. Within this scope, website quality is understood as the quality of an information sys-tem, in which, according to Loiacono et al. (2002), focuses on information storage, processing,presentation and transfer.
As a result, the concept of website quality adopted is that of a set of technical and non-technicalcharacteristics, allowing the user to proceed to create their objectives on a website in an ac-cessible, efficient and pleasant manner. Technical characteristics are understood as the usabil-ity/navigability and presentation of information and the accessibility and interactivity of thesystem (focus of this study). Non-technical characteristics are understood as design, aesthetics,visual and commercial appeal, reliability, hedonism and empathy.
Pesquisa Operacional, Vol. 36(3), 2016
�
�
“main” — 2017/1/2 — 16:14 — page 512 — #10�
�
�
�
�
�
512 MULTIDIMENSIONAL MODELS OF ITEM RESPONSE THEORY IN E-COMMERCE
3 METHOD
The methodological procedure used in this work, involved the characterization of the study, thepreparation of the items, data collection and statistical methodology.
In terms of the characterization, the study is predominantly quantitative although it has a qual-
itative exploratory base with the objective of understanding the field of study about quality incommercial websites and serves as a base for the elaboration of the items in this study.
3.1 Instrument testing
The questionnaire (checklist) has 75 items linked to the quality of websites. The construction ofthe items was made by the association of concepts from the analysis of 191 articles collected in asystematic analysis of literature. For example, some of the recurring concepts were “information
content” associated with “credibility”, “accuracy”, “completeness”, “utility” which is reinforcedby Kim et al. (2005). These concepts associations support the following construction:
– Is there product basic information? (Information content + utility + credibility). The Appendixshows each item with its reference. The items had their content validated by three expert judges
in the area. These items, although they are objective response items independent from the userperception, were based on previous studies that used tests with users and or satisfaction studies.
3.2 Data collection
The sample definition used the intentional sampling method, in order to draw a low, medium
and high sample quality of the commercial sites used by Brazilian population. Accordingly, inaddition to sites with the most diverse genres of market products, there was a variety of designstyles, usability, aesthetics and layout contemplating from something relatively primary to overly
demanding, which does not necessarily imply high or low quality, only guarantees diversity, aprecondition of Item Response Theory. There is no consensus on the optimal sample size foruse of item response theory (Downing, 2003; Wongtada & Rice, 2008). The data collection was
conducted on 441 Brazilian commercial websites. 56 out of 75 items were collected manuallyand another 19 were collected automatically using the Achecker tool (http://achecker.ca/).
3.3 Analysis and discussion
The statistical analysis methodology primarily conducted the evaluation of the number of di-
mensions of the set of items followed by a verification of quality of each item and then a valida-tion of the dimensions and the verification of the suitability of Item Response Theory multipleunidimensional models; compensatory multidimensional and bifactorial IRT. The dimensional
analysis of the original data set (75 items) was made through factor analysis method of restrictedinformation and the method of factor analysis of full information. In the first method, the num-ber of dimensions observed was based on a tetrachoric correlation matrix and parallel analysis,
which was used to Psych Package (Revelle, 2012) implemented on software R (R Core Team,
Pesquisa Operacional, Vol. 36(3), 2016
�
�
“main” — 2017/1/2 — 16:14 — page 513 — #11�
�
�
�
�
�
RAFAEL TEZZA, ANTONIO C. BORNIA, DEBORA SPENASSATO and ANDREA C. TRIERWEILLER 513
2012), because of its dichotomous responses, the dimensionality of the total set was also verified
through the full information method. The approach used is described by Bock & Aitkin (1981)and Bock et al. (1988), in which the dichotomous items treatment and the estimation of the load-ing factor is achieved by the technique called factor analysis of full information, implemented
on software R (R Core Team, 2012) in MIRT package (Chalmers, 2012) and flexMIRT software(Cai, 2012). In this method, the number of dimensions was evaluated based on two informationcriteria, the Bayesian Information Criterion (BIC) (Schwarz, 1978) and the Akaike Information
(AIC) (Akaike, 1973). The use of this method for determining the number of dimensions isdiscussed by Bartolucci et al. (2012), Nylund et al. (2007) and Rost (1997) the suitability ofthe bi-factor model and compensatory model of MIRT was evaluated based on AIC and BIC
information criteria. Table 1 shows the flowchart of the analysis and targets.
Table 1 – Flowchart of the analysis and targets.
Analysis Target
Tetrachoric correlation matrix Evaluation of the number of dimensions
Parallel analysis Evaluation of the number of dimensions
Factor analysis method of restricted in-
formation
Evaluation of the number of dimensions and Analysis
dimensional structure
Factor analysis method of full informa-tion
Evaluation of the number of dimensions and Analysisdimensional structure
Unidimensional model of two parame-ters IRT
Assessment of the adequacy of the unidimensionalstructure and multiple unidimensional structure
Multidimensional model of two param-
eters compensatory MIRT
Assessment of the adequacy of the multidimensional
structure of IRT
Bifactorial model IRT Assessment of the adequacy of the Bifactorial model
IRT
4 RESULTS AND DISCUSSIONS
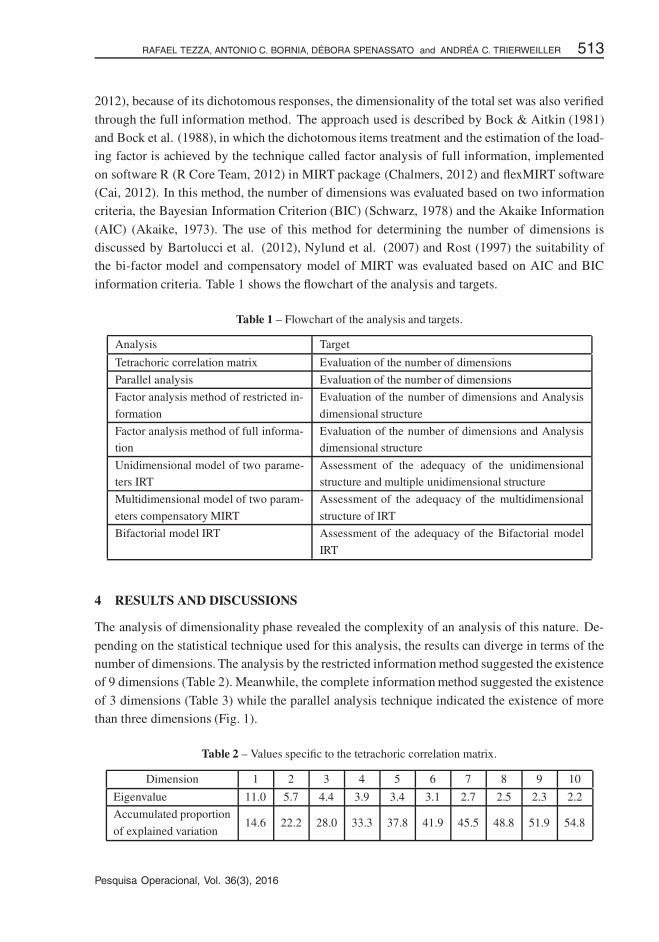
The analysis of dimensionality phase revealed the complexity of an analysis of this nature. De-
pending on the statistical technique used for this analysis, the results can diverge in terms of thenumber of dimensions. The analysis by the restricted information method suggested the existenceof 9 dimensions (Table 2). Meanwhile, the complete information method suggested the existence
of 3 dimensions (Table 3) while the parallel analysis technique indicated the existence of morethan three dimensions (Fig. 1).
Table 2 – Values specific to the tetrachoric correlation matrix.
Dimension 1 2 3 4 5 6 7 8 9 10
Eigenvalue 11.0 5.7 4.4 3.9 3.4 3.1 2.7 2.5 2.3 2.2
Accumulated proportion14.6 22.2 28.0 33.3 37.8 41.9 45.5 48.8 51.9 54.8
of explained variation
Pesquisa Operacional, Vol. 36(3), 2016
�
�
“main” — 2017/1/2 — 16:14 — page 514 — #12�
�
�
�
�
�
514 MULTIDIMENSIONAL MODELS OF ITEM RESPONSE THEORY IN E-COMMERCE
Table 2 indicates that the first eigenvalue is 11.0 which in a set of 75 items that represents 14.6%
of the total variations explained by the first factor or first dimension. This result brings evidencethat the construct should not be assumed to be unidimensional. In addition, if we use the criteriaof proportion of explained variance with > 50% we identify 9 dimensions. However, in the
IRT context, the percentage of variance accounted exceeds Reckase’s (1979) rule of 20% for anitem parameter to be considered stable. Taken together, it is reasonable to conclude that thereare at least two dominants factors; this is sufficient to satisfy the IRT assumption (Bortolotti
et al., 2013). Ventura et al. (2011) says that gold standard rules of thumb for deciding when aresponse matrix is “unidimensional enough” or multidimensional for IRT modeling do not exist(see Embretson & Reise, 2000), researchers generally seek a large ratio of the first to the next
eigenvalues (e.g. > 3 to 1). Thus, the ratio between the first and fifth eigenvalue have a value> 3. The important criterion is whether if a dominant general factor running through the itemsexists or not. The way of exploring this issue, as discussed by Reise et al. (2007) and others (e.g.,Immekus & Imbrie, 2008), is through an adequate bi-factor model and comparing the results with
the unidimensional or multidimensional models (Ventura et al., 2011).
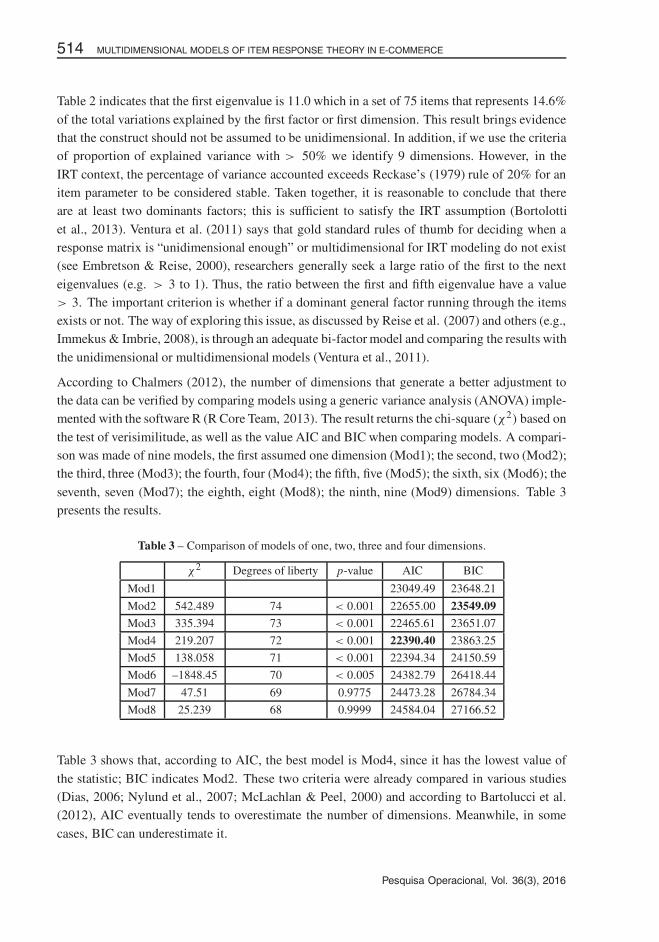
According to Chalmers (2012), the number of dimensions that generate a better adjustment tothe data can be verified by comparing models using a generic variance analysis (ANOVA) imple-mented with the software R (R Core Team, 2013). The result returns the chi-square (χ2) based on
the test of verisimilitude, as well as the value AIC and BIC when comparing models. A compari-son was made of nine models, the first assumed one dimension (Mod1); the second, two (Mod2);the third, three (Mod3); the fourth, four (Mod4); the fifth, five (Mod5); the sixth, six (Mod6); the
seventh, seven (Mod7); the eighth, eight (Mod8); the ninth, nine (Mod9) dimensions. Table 3presents the results.
Table 3 – Comparison of models of one, two, three and four dimensions.
χ2 Degrees of liberty p-value AIC BIC
Mod1 23049.49 23648.21
Mod2 542.489 74 < 0.001 22655.00 23549.09
Mod3 335.394 73 < 0.001 22465.61 23651.07
Mod4 219.207 72 < 0.001 22390.40 23863.25
Mod5 138.058 71 < 0.001 22394.34 24150.59
Mod6 –1848.45 70 < 0.005 24382.79 26418.44
Mod7 47.51 69 0.9775 24473.28 26784.34
Mod8 25.239 68 0.9999 24584.04 27166.52
Table 3 shows that, according to AIC, the best model is Mod4, since it has the lowest value of
the statistic; BIC indicates Mod2. These two criteria were already compared in various studies(Dias, 2006; Nylund et al., 2007; McLachlan & Peel, 2000) and according to Bartolucci et al.(2012), AIC eventually tends to overestimate the number of dimensions. Meanwhile, in some
cases, BIC can underestimate it.
Pesquisa Operacional, Vol. 36(3), 2016

�
�
“main” — 2017/1/2 — 16:14 — page 515 — #13�
�
�
�
�
�
RAFAEL TEZZA, ANTONIO C. BORNIA, DEBORA SPENASSATO and ANDREA C. TRIERWEILLER 515
The parallel analysis method indicates the existence of 24 dimensions. This conclusion can be
verified in Figure 3 where the dotted line refers to the set of simulated data and the full linerepresents the real data. Note that there are 24 eigenvalues above the dotted line.
Figure 3 – Result of the parallel analysis for the 75 items.
Thus, the equation for these diverging results was based on the empiric analysis of dimensionsand of the concepts of items associated to each one. Moreover, the number of dimensions defi-
nitions of the construct was based on the theoretical interpretation of each dimension in relationto the items associated to it, resulting in a four-dimensional structure. In this analysis, 31 itemswere identified that present commonality lower than 0.40 or factor loading less than 0.30; in all
dimensions, were assumed to be uninformative items to construct, therefore, they were excludedfrom the analysis, leaving 44 items.
From a statistical point of view, these items are not correlated with other items, implying thatif the goal is to measure quality of websites, these items theoretically are not associated with
this goal. From a practical point of view, it can be seen that, in case of item 01, as discussed byTezza et al. (2011), in which the same item was evaluated and discarded in a unidimensionalconstruct, it may not feature a cumulative item. That is, the possibility of a pop-up opening for
interaction with the website user is seen in the literature as bad for the quality and confuse theuser (Storey et al., 2002; Petre et al., 2006; Nielsen, 2006). However, this feature is complexbecause it involves commercial and technological maturity issues and it may indicate that this
feature purely evaluated as whether an opening pop-up window can or cannot evaluate linear orcumulatively with the quality of a website.
Theoretically, the four dimensions revealed themselves to be associated to concepts of naviga-bility or user conduction-orientation, accessibility and reliability of the system, interactivity and
presentation of information. These dimensions found in this work are related to the dimensionsmentioned most often in the literature and that are directly related with the definition of quality onwebsites, which is a set of technical and non-technical characteristics of a web system, allowing
Pesquisa Operacional, Vol. 36(3), 2016
�
�
“main” — 2017/1/2 — 16:14 — page 516 — #14�
�
�
�
�
�
516 MULTIDIMENSIONAL MODELS OF ITEM RESPONSE THEORY IN E-COMMERCE
the user to proceed to create their objectives on a website in an accessible, efficient and pleas-
ant manner. Technical characteristics are understood to be usability-navigability, presentation ofinformation, accessibility and interactivity of the system.
Based on the definition of a four-dimensional structure, an analysis of the multiple unidimen-sional, the compensatory multidimensional and the bifactorial models began based on Item Re-
sponse Theory. The multiple unidimensional analysis, which subdivides the general set of itemsinto unidimensional subsets based on the dimensions defined in the factorial analysis, proves tobe more suitable than simply considering the unidimensional construct as a whole.
The unidimensional approach has some advantages and disadvantages. One advantage of a uni-
dimensional approach or a multiple unidimensional approach is the ease of analysis and repre-sentation of the resulting scale. Nevertheless, one disadvantage of the supposition of unidimen-sionality in a multidimensional construct is the fact that the result will be a linear combination
of the dimensions, which may not represent the reality. In addition, Ackerman (1991) shows thatthe estimation of the parameters of IRT model using the unidimensional mode when the data aremultidimensional, tends to filter the dimensionality, that is, measuring a multidimensional ability
on a unidimensional scale tends to generate larger values of unidimensional discrimination. Onthe use of a multiple unidimensional structure there is the inconvenience of generating differentk scales that are theoretically not comparable in terms of parameters as media and standard devi-
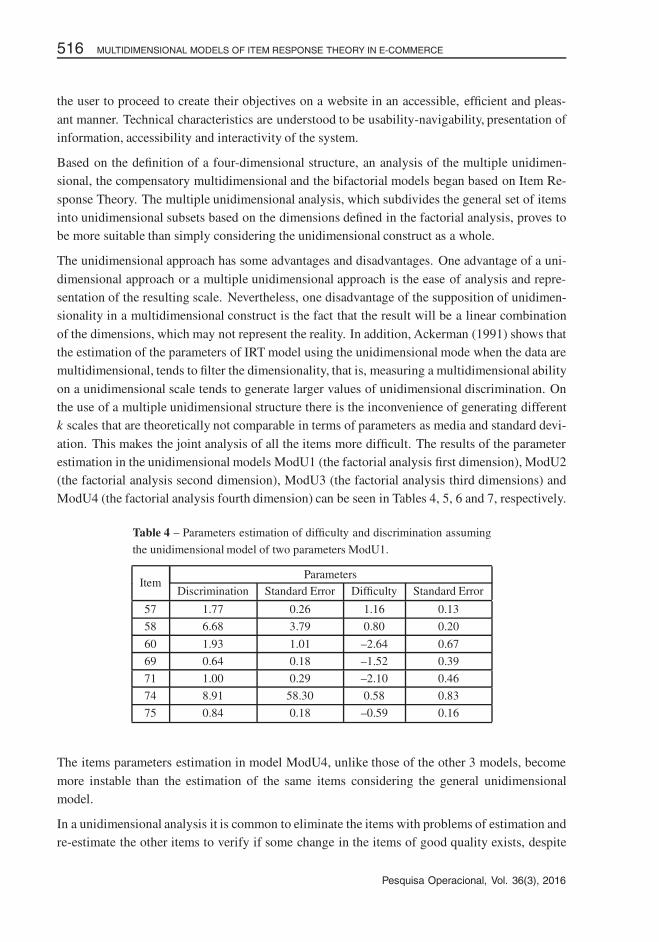
ation. This makes the joint analysis of all the items more difficult. The results of the parameterestimation in the unidimensional models ModU1 (the factorial analysis first dimension), ModU2(the factorial analysis second dimension), ModU3 (the factorial analysis third dimensions) andModU4 (the factorial analysis fourth dimension) can be seen in Tables 4, 5, 6 and 7, respectively.
Table 4 – Parameters estimation of difficulty and discrimination assuming
the unidimensional model of two parameters ModU1.
ItemParameters
Discrimination Standard Error Difficulty Standard Error
57 1.77 0.26 1.16 0.13
58 6.68 3.79 0.80 0.20
60 1.93 1.01 –2.64 0.67
69 0.64 0.18 –1.52 0.39
71 1.00 0.29 –2.10 0.46
74 8.91 58.30 0.58 0.83
75 0.84 0.18 –0.59 0.16
The items parameters estimation in model ModU4, unlike those of the other 3 models, become
more instable than the estimation of the same items considering the general unidimensionalmodel.
In a unidimensional analysis it is common to eliminate the items with problems of estimation andre-estimate the other items to verify if some change in the items of good quality exists, despite
Pesquisa Operacional, Vol. 36(3), 2016
�
�
“main” — 2017/1/2 — 16:14 — page 517 — #15�
�
�
�
�
�
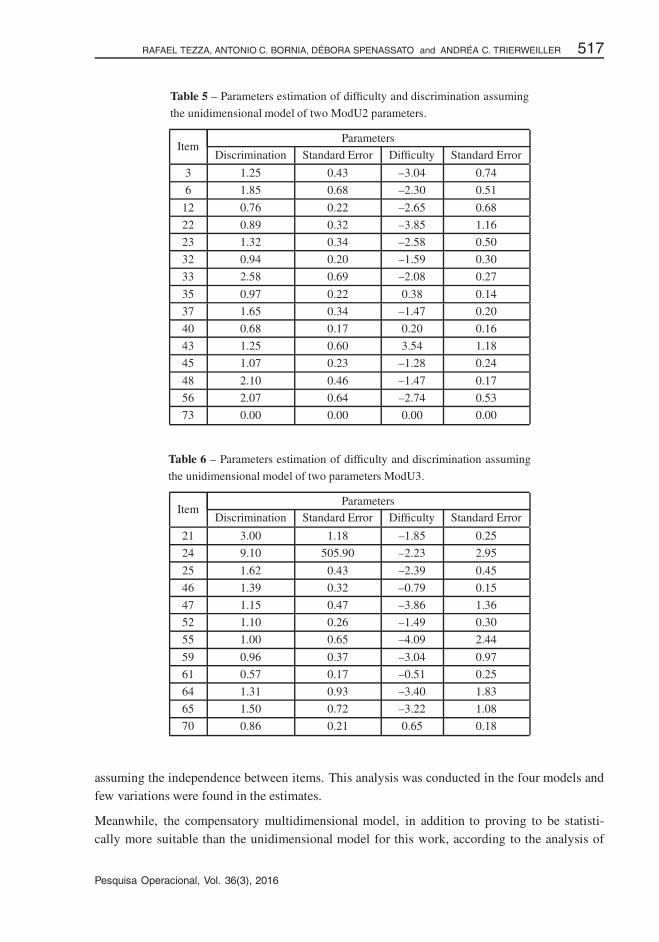
RAFAEL TEZZA, ANTONIO C. BORNIA, DEBORA SPENASSATO and ANDREA C. TRIERWEILLER 517
Table 5 – Parameters estimation of difficulty and discrimination assuming
the unidimensional model of two ModU2 parameters.
ItemParameters
Discrimination Standard Error Difficulty Standard Error
3 1.25 0.43 –3.04 0.74
6 1.85 0.68 –2.30 0.51
12 0.76 0.22 –2.65 0.68
22 0.89 0.32 –3.85 1.16
23 1.32 0.34 –2.58 0.50
32 0.94 0.20 –1.59 0.30
33 2.58 0.69 –2.08 0.27
35 0.97 0.22 0.38 0.14
37 1.65 0.34 –1.47 0.20
40 0.68 0.17 0.20 0.16
43 1.25 0.60 3.54 1.18
45 1.07 0.23 –1.28 0.24
48 2.10 0.46 –1.47 0.17
56 2.07 0.64 –2.74 0.53
73 0.00 0.00 0.00 0.00
Table 6 – Parameters estimation of difficulty and discrimination assuming
the unidimensional model of two parameters ModU3.
ItemParameters
Discrimination Standard Error Difficulty Standard Error
21 3.00 1.18 –1.85 0.25
24 9.10 505.90 –2.23 2.95
25 1.62 0.43 –2.39 0.45
46 1.39 0.32 –0.79 0.15
47 1.15 0.47 –3.86 1.36
52 1.10 0.26 –1.49 0.30
55 1.00 0.65 –4.09 2.44
59 0.96 0.37 –3.04 0.97
61 0.57 0.17 –0.51 0.25
64 1.31 0.93 –3.40 1.83
65 1.50 0.72 –3.22 1.08
70 0.86 0.21 0.65 0.18
assuming the independence between items. This analysis was conducted in the four models andfew variations were found in the estimates.
Meanwhile, the compensatory multidimensional model, in addition to proving to be statisti-cally more suitable than the unidimensional model for this work, according to the analysis of
Pesquisa Operacional, Vol. 36(3), 2016
�
�
“main” — 2017/1/2 — 16:14 — page 518 — #16�
�
�
�
�
�
518 MULTIDIMENSIONAL MODELS OF ITEM RESPONSE THEORY IN E-COMMERCE
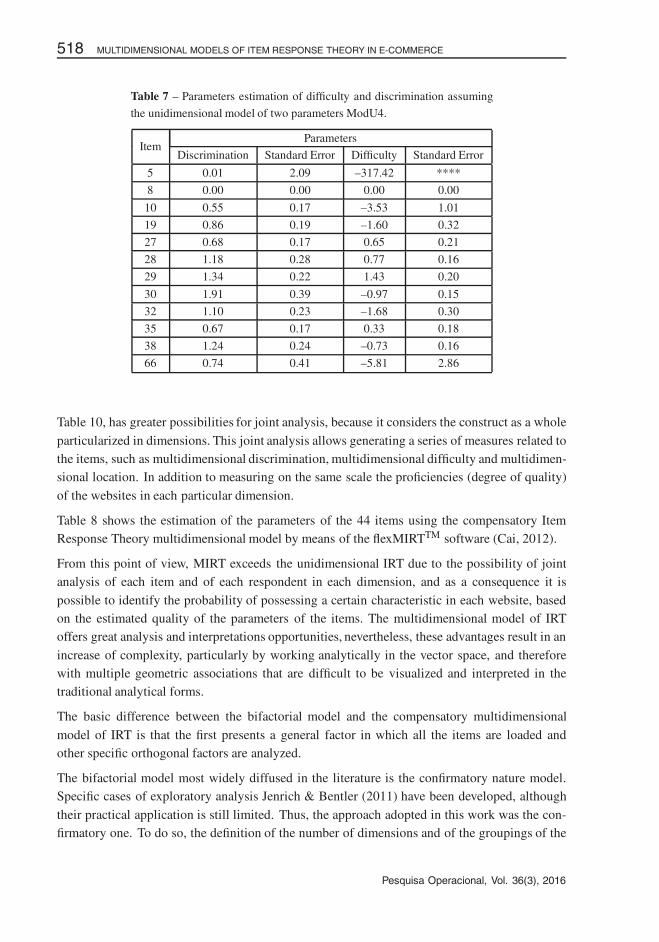
Table 7 – Parameters estimation of difficulty and discrimination assuming
the unidimensional model of two parameters ModU4.
ItemParameters
Discrimination Standard Error Difficulty Standard Error
5 0.01 2.09 –317.42 ****
8 0.00 0.00 0.00 0.00
10 0.55 0.17 –3.53 1.01
19 0.86 0.19 –1.60 0.32
27 0.68 0.17 0.65 0.21
28 1.18 0.28 0.77 0.16
29 1.34 0.22 1.43 0.20
30 1.91 0.39 –0.97 0.15
32 1.10 0.23 –1.68 0.30
35 0.67 0.17 0.33 0.18
38 1.24 0.24 –0.73 0.16
66 0.74 0.41 –5.81 2.86
Table 10, has greater possibilities for joint analysis, because it considers the construct as a whole
particularized in dimensions. This joint analysis allows generating a series of measures related tothe items, such as multidimensional discrimination, multidimensional difficulty and multidimen-sional location. In addition to measuring on the same scale the proficiencies (degree of quality)
of the websites in each particular dimension.
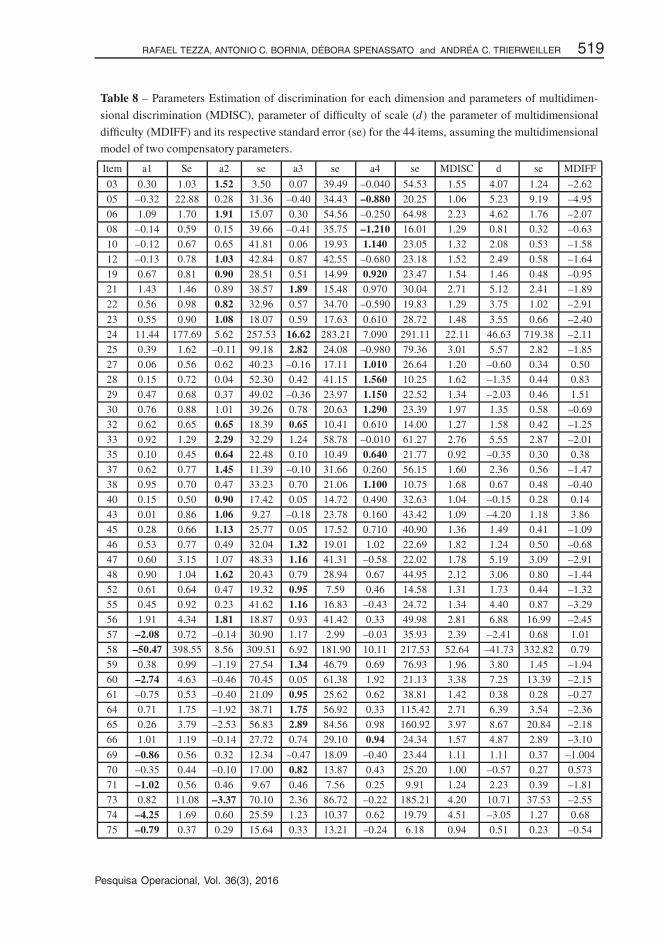
Table 8 shows the estimation of the parameters of the 44 items using the compensatory ItemResponse Theory multidimensional model by means of the flexMIRTTM software (Cai, 2012).
From this point of view, MIRT exceeds the unidimensional IRT due to the possibility of jointanalysis of each item and of each respondent in each dimension, and as a consequence it is
possible to identify the probability of possessing a certain characteristic in each website, basedon the estimated quality of the parameters of the items. The multidimensional model of IRToffers great analysis and interpretations opportunities, nevertheless, these advantages result in an
increase of complexity, particularly by working analytically in the vector space, and thereforewith multiple geometric associations that are difficult to be visualized and interpreted in thetraditional analytical forms.
The basic difference between the bifactorial model and the compensatory multidimensional
model of IRT is that the first presents a general factor in which all the items are loaded andother specific orthogonal factors are analyzed.
The bifactorial model most widely diffused in the literature is the confirmatory nature model.Specific cases of exploratory analysis Jenrich & Bentler (2011) have been developed, although
their practical application is still limited. Thus, the approach adopted in this work was the con-firmatory one. To do so, the definition of the number of dimensions and of the groupings of the
Pesquisa Operacional, Vol. 36(3), 2016
�
�
“main” — 2017/1/2 — 16:14 — page 519 — #17�
�
�
�
�
�
RAFAEL TEZZA, ANTONIO C. BORNIA, DEBORA SPENASSATO and ANDREA C. TRIERWEILLER 519
Table 8 – Parameters Estimation of discrimination for each dimension and parameters of multidimen-
sional discrimination (MDISC), parameter of difficulty of scale (d) the parameter of multidimensional
difficulty (MDIFF) and its respective standard error (se) for the 44 items, assuming the multidimensionalmodel of two compensatory parameters.
Item a1 Se a2 se a3 se a4 se MDISC d se MDIFF
03 0.30 1.03 1.52 3.50 0.07 39.49 –0.040 54.53 1.55 4.07 1.24 –2.62
05 –0.32 22.88 0.28 31.36 –0.40 34.43 –0.880 20.25 1.06 5.23 9.19 –4.95
06 1.09 1.70 1.91 15.07 0.30 54.56 –0.250 64.98 2.23 4.62 1.76 –2.07
08 –0.14 0.59 0.15 39.66 –0.41 35.75 –1.210 16.01 1.29 0.81 0.32 –0.63
10 –0.12 0.67 0.65 41.81 0.06 19.93 1.140 23.05 1.32 2.08 0.53 –1.58
12 –0.13 0.78 1.03 42.84 0.87 42.55 –0.680 23.18 1.52 2.49 0.58 –1.64
19 0.67 0.81 0.90 28.51 0.51 14.99 0.920 23.47 1.54 1.46 0.48 –0.95
21 1.43 1.46 0.89 38.57 1.89 15.48 0.970 30.04 2.71 5.12 2.41 –1.89
22 0.56 0.98 0.82 32.96 0.57 34.70 –0.590 19.83 1.29 3.75 1.02 –2.91
23 0.55 0.90 1.08 18.07 0.59 17.63 0.610 28.72 1.48 3.55 0.66 –2.40
24 11.44 177.69 5.62 257.53 16.62 283.21 7.090 291.11 22.11 46.63 719.38 –2.11
25 0.39 1.62 –0.11 99.18 2.82 24.08 –0.980 79.36 3.01 5.57 2.82 –1.85
27 0.06 0.56 0.62 40.23 –0.16 17.11 1.010 26.64 1.20 –0.60 0.34 0.50
28 0.15 0.72 0.04 52.30 0.42 41.15 1.560 10.25 1.62 –1.35 0.44 0.83
29 0.47 0.68 0.37 49.02 –0.36 23.97 1.150 22.52 1.34 –2.03 0.46 1.51
30 0.76 0.88 1.01 39.26 0.78 20.63 1.290 23.39 1.97 1.35 0.58 –0.69
32 0.62 0.65 0.65 18.39 0.65 10.41 0.610 14.00 1.27 1.58 0.42 –1.25
33 0.92 1.29 2.29 32.29 1.24 58.78 –0.010 61.27 2.76 5.55 2.87 –2.01
35 0.10 0.45 0.64 22.48 0.10 10.49 0.640 21.77 0.92 –0.35 0.30 0.38
37 0.62 0.77 1.45 11.39 –0.10 31.66 0.260 56.15 1.60 2.36 0.56 –1.47
38 0.95 0.70 0.47 33.23 0.70 21.06 1.100 10.75 1.68 0.67 0.48 –0.40
40 0.15 0.50 0.90 17.42 0.05 14.72 0.490 32.63 1.04 –0.15 0.28 0.14
43 0.01 0.86 1.06 9.27 –0.18 23.78 0.160 43.42 1.09 –4.20 1.18 3.86
45 0.28 0.66 1.13 25.77 0.05 17.52 0.710 40.90 1.36 1.49 0.41 –1.09
46 0.53 0.77 0.49 32.04 1.32 19.01 1.02 22.69 1.82 1.24 0.50 –0.68
47 0.60 3.15 1.07 48.33 1.16 41.31 –0.58 22.02 1.78 5.19 3.09 –2.91
48 0.90 1.04 1.62 20.43 0.79 28.94 0.67 44.95 2.12 3.06 0.80 –1.44
52 0.61 0.64 0.47 19.32 0.95 7.59 0.46 14.58 1.31 1.73 0.44 –1.32
55 0.45 0.92 0.23 41.62 1.16 16.83 –0.43 24.72 1.34 4.40 0.87 –3.29
56 1.91 4.34 1.81 18.87 0.93 41.42 0.33 49.98 2.81 6.88 16.99 –2.45
57 –2.08 0.72 –0.14 30.90 1.17 2.99 –0.03 35.93 2.39 –2.41 0.68 1.01
58 –50.47 398.55 8.56 309.51 6.92 181.90 10.11 217.53 52.64 –41.73 332.82 0.79
59 0.38 0.99 –1.19 27.54 1.34 46.79 0.69 76.93 1.96 3.80 1.45 –1.94
60 –2.74 4.63 –0.46 70.45 0.05 61.38 1.92 21.13 3.38 7.25 13.39 –2.15
61 –0.75 0.53 –0.40 21.09 0.95 25.62 0.62 38.81 1.42 0.38 0.28 –0.27
64 0.71 1.75 –1.92 38.71 1.75 56.92 0.33 115.42 2.71 6.39 3.54 –2.36
65 0.26 3.79 –2.53 56.83 2.89 84.56 0.98 160.92 3.97 8.67 20.84 –2.18
66 1.01 1.19 –0.14 27.72 0.74 29.10 0.94 24.34 1.57 4.87 2.89 –3.10
69 –0.86 0.56 0.32 12.34 –0.47 18.09 –0.40 23.44 1.11 1.11 0.37 –1.004
70 –0.35 0.44 –0.10 17.00 0.82 13.87 0.43 25.20 1.00 –0.57 0.27 0.573
71 –1.02 0.56 0.46 9.67 0.46 7.56 0.25 9.91 1.24 2.23 0.39 –1.81
73 0.82 11.08 –3.37 70.10 2.36 86.72 –0.22 185.21 4.20 10.71 37.53 –2.55
74 –4.25 1.69 0.60 25.59 1.23 10.37 0.62 19.79 4.51 –3.05 1.27 0.68
75 –0.79 0.37 0.29 15.64 0.33 13.21 –0.24 6.18 0.94 0.51 0.23 –0.54
Pesquisa Operacional, Vol. 36(3), 2016
�
�
“main” — 2017/1/2 — 16:14 — page 520 — #18�
�
�
�
�
�
520 MULTIDIMENSIONAL MODELS OF ITEM RESPONSE THEORY IN E-COMMERCE
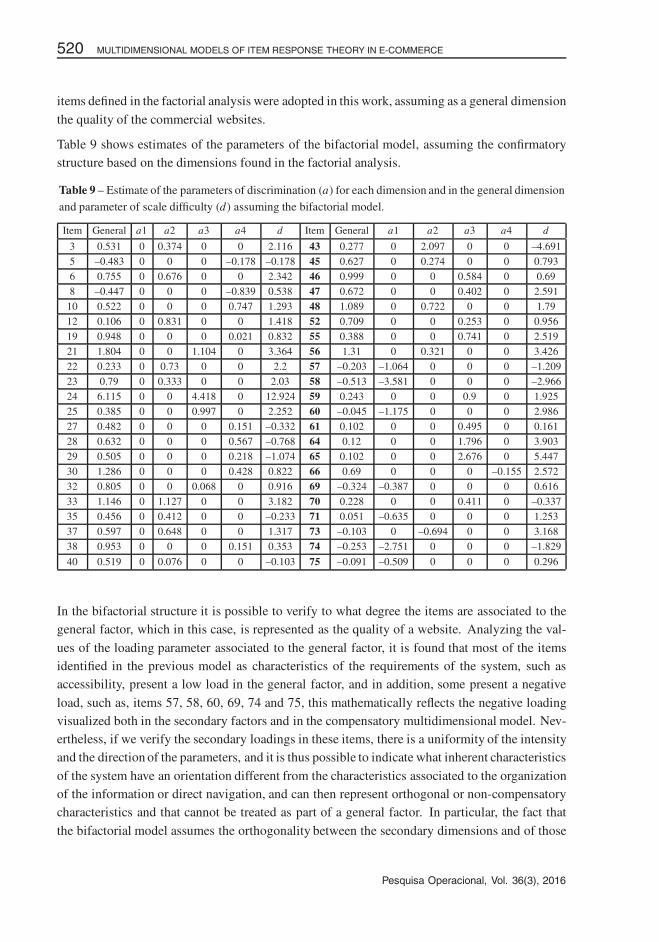
items defined in the factorial analysis were adopted in this work, assuming as a general dimension
the quality of the commercial websites.
Table 9 shows estimates of the parameters of the bifactorial model, assuming the confirmatorystructure based on the dimensions found in the factorial analysis.
Table 9 – Estimate of the parameters of discrimination (a) for each dimension and in the general dimensionand parameter of scale difficulty (d) assuming the bifactorial model.
Item General a1 a2 a3 a4 d Item General a1 a2 a3 a4 d
3 0.531 0 0.374 0 0 2.116 43 0.277 0 2.097 0 0 –4.691
5 –0.483 0 0 0 –0.178 –0.178 45 0.627 0 0.274 0 0 0.793
6 0.755 0 0.676 0 0 2.342 46 0.999 0 0 0.584 0 0.69
8 –0.447 0 0 0 –0.839 0.538 47 0.672 0 0 0.402 0 2.591
10 0.522 0 0 0 0.747 1.293 48 1.089 0 0.722 0 0 1.79
12 0.106 0 0.831 0 0 1.418 52 0.709 0 0 0.253 0 0.956
19 0.948 0 0 0 0.021 0.832 55 0.388 0 0 0.741 0 2.519
21 1.804 0 0 1.104 0 3.364 56 1.31 0 0.321 0 0 3.426
22 0.233 0 0.73 0 0 2.2 57 –0.203 –1.064 0 0 0 –1.209
23 0.79 0 0.333 0 0 2.03 58 –0.513 –3.581 0 0 0 –2.966
24 6.115 0 0 4.418 0 12.924 59 0.243 0 0 0.9 0 1.925
25 0.385 0 0 0.997 0 2.252 60 –0.045 –1.175 0 0 0 2.986
27 0.482 0 0 0 0.151 –0.332 61 0.102 0 0 0.495 0 0.161
28 0.632 0 0 0 0.567 –0.768 64 0.12 0 0 1.796 0 3.903
29 0.505 0 0 0 0.218 –1.074 65 0.102 0 0 2.676 0 5.447
30 1.286 0 0 0 0.428 0.822 66 0.69 0 0 0 –0.155 2.572
32 0.805 0 0 0.068 0 0.916 69 –0.324 –0.387 0 0 0 0.616
33 1.146 0 1.127 0 0 3.182 70 0.228 0 0 0.411 0 –0.337
35 0.456 0 0.412 0 0 –0.233 71 0.051 –0.635 0 0 0 1.253
37 0.597 0 0.648 0 0 1.317 73 –0.103 0 –0.694 0 0 3.168
38 0.953 0 0 0 0.151 0.353 74 –0.253 –2.751 0 0 0 –1.829
40 0.519 0 0.076 0 0 –0.103 75 –0.091 –0.509 0 0 0 0.296
In the bifactorial structure it is possible to verify to what degree the items are associated to thegeneral factor, which in this case, is represented as the quality of a website. Analyzing the val-
ues of the loading parameter associated to the general factor, it is found that most of the itemsidentified in the previous model as characteristics of the requirements of the system, such asaccessibility, present a low load in the general factor, and in addition, some present a negative
load, such as, items 57, 58, 60, 69, 74 and 75, this mathematically reflects the negative loadingvisualized both in the secondary factors and in the compensatory multidimensional model. Nev-ertheless, if we verify the secondary loadings in these items, there is a uniformity of the intensityand the direction of the parameters, and it is thus possible to indicate what inherent characteristics
of the system have an orientation different from the characteristics associated to the organizationof the information or direct navigation, and can then represent orthogonal or non-compensatorycharacteristics and that cannot be treated as part of a general factor. In particular, the fact that
the bifactorial model assumes the orthogonality between the secondary dimensions and of those
Pesquisa Operacional, Vol. 36(3), 2016
�
�
“main” — 2017/1/2 — 16:14 — page 521 — #19�
�
�
�
�
�
RAFAEL TEZZA, ANTONIO C. BORNIA, DEBORA SPENASSATO and ANDREA C. TRIERWEILLER 521
in relation to the general factor, limits the suitability of this model to the construct that clearly
possesses a general factor ortohgonal to the other subdimensions, which is not the case of theconstruct in question. Whereas, it is found that the quality of commercial websites is not a char-acteristic that can be represented by a general dimension orthogonal to the other subdimensions,
at least not for the construct developed in this study. Thus, the comparison of these three modelssuggests that quality of commercial websites is a non-unidimensional characteristic that can bedivided into four compensatory dimensions.
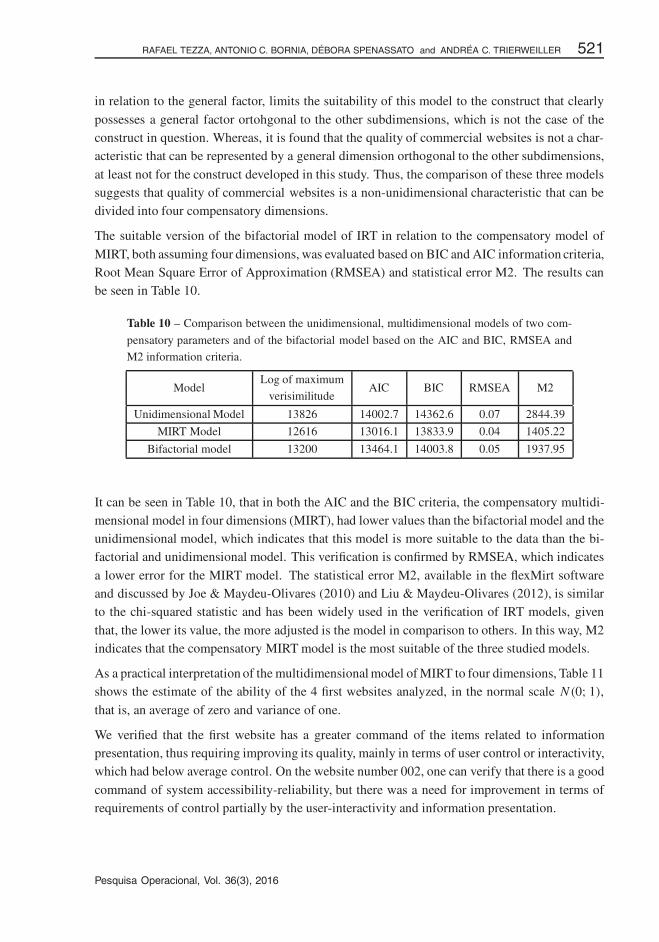
The suitable version of the bifactorial model of IRT in relation to the compensatory model of
MIRT, both assuming four dimensions, was evaluated based on BIC and AIC information criteria,Root Mean Square Error of Approximation (RMSEA) and statistical error M2. The results canbe seen in Table 10.
Table 10 – Comparison between the unidimensional, multidimensional models of two com-
pensatory parameters and of the bifactorial model based on the AIC and BIC, RMSEA andM2 information criteria.
ModelLog of maximum
AIC BIC RMSEA M2verisimilitude
Unidimensional Model 13826 14002.7 14362.6 0.07 2844.39
MIRT Model 12616 13016.1 13833.9 0.04 1405.22
Bifactorial model 13200 13464.1 14003.8 0.05 1937.95
It can be seen in Table 10, that in both the AIC and the BIC criteria, the compensatory multidi-mensional model in four dimensions (MIRT), had lower values than the bifactorial model and theunidimensional model, which indicates that this model is more suitable to the data than the bi-factorial and unidimensional model. This verification is confirmed by RMSEA, which indicates
a lower error for the MIRT model. The statistical error M2, available in the flexMirt softwareand discussed by Joe & Maydeu-Olivares (2010) and Liu & Maydeu-Olivares (2012), is similarto the chi-squared statistic and has been widely used in the verification of IRT models, given
that, the lower its value, the more adjusted is the model in comparison to others. In this way, M2indicates that the compensatory MIRT model is the most suitable of the three studied models.
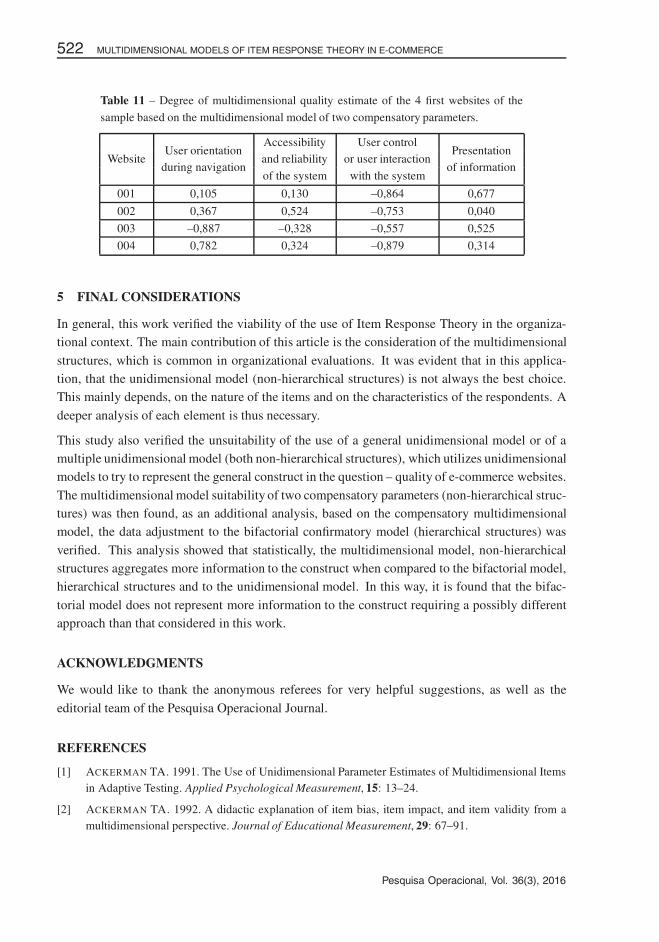
As a practical interpretation of the multidimensional model of MIRT to four dimensions, Table 11shows the estimate of the ability of the 4 first websites analyzed, in the normal scale N(0; 1),
that is, an average of zero and variance of one.
We verified that the first website has a greater command of the items related to informationpresentation, thus requiring improving its quality, mainly in terms of user control or interactivity,which had below average control. On the website number 002, one can verify that there is a good
command of system accessibility-reliability, but there was a need for improvement in terms ofrequirements of control partially by the user-interactivity and information presentation.
Pesquisa Operacional, Vol. 36(3), 2016
�
�
“main” — 2017/1/2 — 16:14 — page 522 — #20�
�
�
�
�
�
522 MULTIDIMENSIONAL MODELS OF ITEM RESPONSE THEORY IN E-COMMERCE
Table 11 – Degree of multidimensional quality estimate of the 4 first websites of the
sample based on the multidimensional model of two compensatory parameters.
WebsiteUser orientation
Accessibility User controlPresentation
during navigationand reliability or user interaction
of informationof the system with the system
001 0,105 0,130 –0,864 0,677
002 0,367 0,524 –0,753 0,040
003 –0,887 –0,328 –0,557 0,525
004 0,782 0,324 –0,879 0,314
5 FINAL CONSIDERATIONS
In general, this work verified the viability of the use of Item Response Theory in the organiza-tional context. The main contribution of this article is the consideration of the multidimensional
structures, which is common in organizational evaluations. It was evident that in this applica-tion, that the unidimensional model (non-hierarchical structures) is not always the best choice.This mainly depends, on the nature of the items and on the characteristics of the respondents. A
deeper analysis of each element is thus necessary.
This study also verified the unsuitability of the use of a general unidimensional model or of amultiple unidimensional model (both non-hierarchical structures), which utilizes unidimensionalmodels to try to represent the general construct in the question – quality of e-commerce websites.
The multidimensional model suitability of two compensatory parameters (non-hierarchical struc-tures) was then found, as an additional analysis, based on the compensatory multidimensionalmodel, the data adjustment to the bifactorial confirmatory model (hierarchical structures) was
verified. This analysis showed that statistically, the multidimensional model, non-hierarchicalstructures aggregates more information to the construct when compared to the bifactorial model,hierarchical structures and to the unidimensional model. In this way, it is found that the bifac-
torial model does not represent more information to the construct requiring a possibly differentapproach than that considered in this work.
ACKNOWLEDGMENTS
We would like to thank the anonymous referees for very helpful suggestions, as well as the
editorial team of the Pesquisa Operacional Journal.
REFERENCES
[1] ACKERMAN TA. 1991. The Use of Unidimensional Parameter Estimates of Multidimensional Itemsin Adaptive Testing. Applied Psychological Measurement, 15: 13–24.
[2] ACKERMAN TA. 1992. A didactic explanation of item bias, item impact, and item validity from amultidimensional perspective. Journal of Educational Measurement, 29: 67–91.
Pesquisa Operacional, Vol. 36(3), 2016
�
�
“main” — 2017/1/2 — 16:14 — page 523 — #21�
�
�
�
�
�
RAFAEL TEZZA, ANTONIO C. BORNIA, DEBORA SPENASSATO and ANDREA C. TRIERWEILLER 523
[3] ACKERMAN TA. 1994. Using multidimensional item response theory to understand what items andtests are measuring. Applied Measurement in Education, 7: 255–278.
[4] ADAMS RJ, WILSON M & WANG WC. 1997. The Multidimensional Random Coefficients Multino-mial Logit Model. Applied Psychological Measurement, 21: 1–23.
[5] AGNER L. 2012. Ergondesign e arquiterura de informacao: trabalhando com o usuario. Rio deJaneiro: Quartet, 3a. edicao.
[6] AKAIKE H. 1973. Maximum likelihood identification of Gaussian autoregressive moving averagemodels. Biometrika, 60: 255–265.
[7] ALADWANI AM. 1999. Implications of some of the recent improvement philosophies for the manage-ment of the information systems organization. Industrial Management & Data Systems, 99: 33–39.
[8] ALADWANI AM & PALVIA PC. 2002. Developing and validating an instrument for measuring user-perceived web quality. Information & Management, 39: 467–476.
[9] ANSLEY TN & FORSYTH RA. 1985. An examination of the characteristics of unidimensional IRTparameter estimates derived from two-dimensional data. Applied Psychological Measurement, 9:37–48.
[10] BARNES S & VIDGEN R. 2000. WebQual: an exploration of website quality. ECIS 2000 Proceedings,74.
[11] BARTOLUCCI F, MONTANARI G & PANDOLFI S. 2012. Dimensionality of the latent structure anditem selection via latent class multidimensional irt models. Psychometrika, 77: 782–802.
[12] BERNARDO M, MARIMON F & ALONSO-ALMEIDA MDM. 2012. Functional Quality And HedonicQuality: A Study Of The Dimensions Of E-Service Quality In Online Travel Agencies. Information& Management, 497: 342–347.
[13] BIRNBAUM A. 1968. Some Latent Trait Models and Their Use in Infering an Examiniee’s Ability. In:Lord FM & Novick MR. Statistical Theories of Mental Test Scores, MA: Addison-Wesley. goodnessof fit test for the Rasch model. Psychometrika, 38: 123–140.
[14] BERNINI C, MATTEUCCI M & MIGNANI S. 2015. Investigating heterogeneity in residents’ attitudestoward tourism with an IRT multidimensional approach. Quality & Quantity, 49: 805–826.
[15] BOCK RD & AITKIN M. 1981. Maginal maximum likelihood estimation of item parameters: Appli-cation of an EM algorithm. Psychometrika, 46: 43–445.
[16] BOCK RD, GIBBONS R & MURAKI E. 1988. Full information item factor analysis. Applied Psycho-logical Measurement, 12: 261–280.
[17] BORTOLOTTI SLV, TEZZA R, DE ANDRADE DF, BORNIA A C & DE SOUSA JUNIOR AF. 2013.Relevance and advantages of using the item response theory. Quality & Quantity, 47: 2341–2360.
[18] CAI L. 2012. flexMIRTTM version 1.86: A numerical engine for multilevel item factor analysis andtest scoring. [Computer software]. Seattle, WA: Vector Psychometric Group.
[19] CAI S & JUN M. 2003. Internet users’ perceptions of online service quality: a comparison of onlinebuyers and information searchers. Managing Service Quality, 13: 504–519.
[20] CAMILLI G. 1992. A conceptual analysis of differential item functioning in terms of a multidimen-sional item response model. Applied Psychological Measurement, 16: 129–147.
Pesquisa Operacional, Vol. 36(3), 2016
�
�
“main” — 2017/1/2 — 16:14 — page 524 — #22�
�
�
�
�
�
524 MULTIDIMENSIONAL MODELS OF ITEM RESPONSE THEORY IN E-COMMERCE
[21] CARTER NT, DALAL DK, LAKE CJ, LIN BC & ZICKAR MJ. 2011. Using mixed-model itemresponse theory to analyze organizational survey responses: An illustration using the job descriptiveindex. Organizational Research Methods, 14: 116–146.
[22] CYBIS W. 2007. Ergonomia e Usabilidade: conhecimentos, metodos e aplicacoes/Walter Cybis,Adriana Holtz Betiol, Richard Faust. Sao Paulo: Novatec Editora.
[23] CHALMERS RP. 2012. mirt: A Multidimensional Item Response Theory Package for the R Environ-ment. Journal of Statistical Software, 48: 1–29.
[24] CRISTOBAL E, FLAVIAN C & GUINALIU M. 2007. Perceived e-service quality PeSQ: measurementvalidation and effects on consumer satisfaction and web site loyalty. Managing Service Quality, 17:317–340.
[25] COLESCA SE. 2007. An Assessment of the Quality of the Romanian Urban Web Sites. InformaticaEconomica, 42: 26–33.
[26] DAY A. 1997. A model for monitoring Web site effectiveness. Internet Research: Electronic Net-working Applications and Policy, 7: 1–9.
[27] DIAS JG. 2006. Model selection for the binary latent class model: A Monte Carlo simulation. In:Data science and classification. Springer Berlin Heidelberg, p. 91–99.
[28] DING DX, HU PJ & SHENG ORL. 2011. e-SELFQUAL: A scale for measuring online self-servicequality. Journal of Business Research, 64: 508–515.
[29] DOWNING SM. 2003. Item response theory: Applications of modern test theory in medical Educa-tion. Medical Education, 37: 739–745.
[30] EMBRETSON SE. 1991. A multidimensional latent trait model for measuring learning and change.Psychometrika, 56: 495–515.
[31] EMBRETSON S & REISE SP. 2000. Item Response Theory for Psychologists. New Jersey: LawrenceErlbaum Associates, Inc. Publishers.
[32] FASSNACHT M & KOESE I. 2006. Quality of electronic services conceptualizing and testing a hier-archical model. Journal of service research, 9: 19–37.
[33] FERREIRA SBL & NUNES RR. 2008. e-Usabilidade, Rio de Janeiro: LTC.
[34] GIBBONS RD, RUSH AJ & IMMEKUS JC. 2009. On the psychometric validity of the domains of thePDSQ: An illustration of the bi-factor item response theory model. Journal of psychiatric research,43: 401–410.
[35] GIBBONS RD & HEDEKER DR. 1992. Full-information item bi-factor analysis. Psychometrika, 57:423–436.
[36] GIBBONS RD, BOCK RD, HEDEKER D, WEISS DJ, SEGAWA E, BHAUMIK DK & STOVER A.2007. Full-information item bifactor analysis of graded response data. Applied Psychological Mea-surement, 31: 4–19.
[37] GLAS CAW. 1992. A Rasch model with a multivariate distribution of ability. Objective measurement:Theory into practice, 1: 236–258.
[38] HAGA WJ & ZVIRAN M. 1994. Information systems effectiveness: research designs for causal in-ference. Information Systems Journal, 4: 141–166.
[39] HAMBLETON RK. 1991. Fundamentals of item response theory. Vol. 2. Sage publications.
Pesquisa Operacional, Vol. 36(3), 2016
�
�
“main” — 2017/1/2 — 16:14 — page 525 — #23�
�
�
�
�
�
RAFAEL TEZZA, ANTONIO C. BORNIA, DEBORA SPENASSATO and ANDREA C. TRIERWEILLER 525
[40] HAMBLETON RK & SWAMINATHAN H.. 1985, Item response theory: Principles and applications.Norwell, MA: Kluwer Academic Publishers.
[41] HARTIG J & HOHLER J. 2009. Multidimensional IRT models for the assessment of competencies.Studies in Educational Evaluation, 35: 57–63.
[42] HARTIG J & HOHLER J. 2008. Representation of competencies in multidimensional IRT mod-els with within-item and between-item multidimensionality. Zeitschrift fur Psychologie/Journal ofPsychology, 216: 89–101.
[43] HERNANDEZ B, JIMENEZ J & MARTIN MJ. 2009. Key website factors in e-business strategy. Inter-national Journal of Information Management, 29: 362–371.
[44] HOLZINGER KJ & SWINEFORD F. 1937. The bi-factor method. Psychometrika, 2: 41–54.
[45] HUNG W-H & MCQUEEN RJ. 2004. Developing an Evaluation Instrument for eCommerce WebSites from the First-Time Buyer’s Viewpoint. Electronic Journal of Information Systems Evaluation,7: 31–42.
[46] IBRAHIM EE, JOSEPH M & IBEH KI. 2006. Customers’ perception of electronic service delivery inthe UK retail banking sector. International Journal of Bank Marketing, 24: 475–493.
[47] INKPEN K, DEARMAN D & ARGUE R. 2006. Left-Handed Scrolling for Pen-Based Devices. Inter-national Journal of Human-Computer Interaction, 21: 91–108.
[48] JENNRICH RI & BENTLER PM. Exploratory bi-factor analysis. Psychometrika, 76: 537–549.
[49] ISO9126. 1992. Information Technology – Software Product Evaluation – Quality Characteristicsand Guidelines for Their Use, International Organisation for Standardization, Geneva.
[50] KAPLAN D, KRISHNAN R, PADMAN R & PETERS J. 1998. Assessing data quality in accountinginformation systems. Communications of the ACM, 41: 72–78.
[51] KETTINGER WJ & LEE CC. 1994. Perceived service quality and user satisfaction with the informa-tion services function. Decision sciences, 25: 737–766.
[52] KING WR & EPSTEIN BJ. 1983. Assessing information system value: An experimental study. De-cision Sciences, 14: 34–45.
[53] KIM DJ, SONG YI, BRAYNOV SB & RAO HR. 2005. A multidimensional trust formation modelin B-to-C e-commerce: a conceptual framework and content analyses of academia/ practitioner per-spectives. Decision Support Systems, 40: 143–165.
[54] KITCHENHAM B & PFLEEGER SL. 1996. Software quality: The elusive target. IEEE software, 13:12–21.
[55] LAHUIS DM, CLARK P & O’BRIEN E. 2011. An examination of item response theory item fitindices for the graded response model. Organizational Research Methods, 14: 10–23.
[56] LEVY R. 2011. Posterior predictive model checking for conjunctive multidimensionality in item re-sponse theory. Journal of Educational and Behavioral Statistics, 36: 672–694.
[57] LI Y & RUPP AA. 2011. Performance of the S – δ2 Statistic for Full-Information Bifactor Models.Educational and Psychological Measurement, 71: 1–20.
[58] LINDROOS K. 1997. Use quality and the world wide web. Information and Software Technology, 39:827–836.
[59] LIU CT, DU TC & TSAI H-H. 2009. A study of the service quality of general portals. Information& Management, 46: 52–56.
Pesquisa Operacional, Vol. 36(3), 2016
�
�
“main” — 2017/1/2 — 16:14 — page 526 — #24�
�
�
�
�
�
526 MULTIDIMENSIONAL MODELS OF ITEM RESPONSE THEORY IN E-COMMERCE
[60] LOIACONO ET, WATSON RT & GOODHUE DL. 2002. WebQual: A measure of website quality.Marketing theory and applications, 13: 432–438.
[61] LORD FM. 1980. Applications of item response theory to practical testing problems. Routledge.
[62] LONG M & MCMELLON C. 2004. Exploring the determinants of retail service quality on the internet.Journal of Services Marketing, 18: 78–90.
[63] MCLACHLAN GJ, BEAN RW & PEEL D. 2002. A mixture model-based approach to the clusteringof microarray expression data. Bioinformatics, 18: 413–422.
[64] MIN K-S. 2003 The Impact of Scale Dilation on the Quality of the Linking of Multidimensional ItemResponse Theory Calibrations. PhD Dissertation, Michigan State University, East Lansing, MI.
[65] NELSON KG. 1996. Global information systems quality: key issues and challenges. Journal ofGlobal Information Management, 4: 4–15.
[66] NIELSEN J. 2000. Projetando websites. Gulf Professional Publishing.
[67] NIELSEN J. 2007 Web 2.0 can be dangerous. Available from: <http://www.useit.com/alertbox/web-2.html>, acessado em 13/7/2012.
[68] NIELSEN J & LORANGER H. 2006. Prioritizing web usability. Pearson Education.
[69] NIELSEN J & TAHIR M. 2002. Homepage usability: 50 websites deconstructed. Indianapolis, In:New Riders.
[70] NYE CD, NEWMAN DA & JOSEPH DL. 2010. Never Say “Always”? Extreme Item Wording Effectson Scalar Invariance and Item Response Curves. Organizational Research Methods, 13: 806–830.
[71] NYLUND KL, ASPAROUHOV T & MUTHEN BO. 2007. Deciding on the number of classes in latentclass analysis and growth mixture modeling: A Monte Carlo simulation study. Structural equationmodeling, 14: 535–569.
[72] OLSINA L, GODOY D, LAFUENTE GJ & ROSSI G. 1999. Specifying Quality Characteristics andAttributes for Websites, in Proceedings of the First ICSE Workshop on Web Engineering, 16-17 MayLos Angeles, USA.
[73] OSHIMA TC & MILLER MD. 1992. Multidimensionality and item bias in item response theory.Applied Psychological Measurement, 16: 237–248.
[74] OSTINI R & NERING ML. 2006. Polytomous item response theory models. No. 144. Sage.
[75] PARASURAMAN A, ZEITHAML VA & MALHOTRA A. 2005. ES-QUAL a multiple-item scale forassessing electronic service quality. Journal of service research, 7: 213–233.
[76] PETRE M, MINOCHA S & ROBERTS D. 2006. Usability Beyond the Website: an EmpiricallyGrounded E-commerce Evaluation Instrument for the Total Customer Experience. Behaviour & In-formation Technology, 25: 189–203.
[77] R CORE TEAM. 2013. R: A Language and Environment for Statistical Computing. R Foundation forStatistical Computing, Vienna, Austria, http://www.R-project.org/.
[78] RAUCH D & HARTIG J. 2010. Multiple-choice versus open-ended response formats of reading testitems: A two-dimensional IRT analysis. Psychological Test and Assessment Modeling, 52: 354–379.
[79] RECKASE MD. 1985. The difficulty of test items that measure more than one ability. Applied Psy-chological Measurement, 9: 401–412.
Pesquisa Operacional, Vol. 36(3), 2016
�
�
“main” — 2017/1/2 — 16:14 — page 527 — #25�
�
�
�
�
�
RAFAEL TEZZA, ANTONIO C. BORNIA, DEBORA SPENASSATO and ANDREA C. TRIERWEILLER 527
[80] RECKASE MD & MCKINLEY RL. 1991. The discriminating power of items that measure more thanone dimension. Applied Psychological Measurement, 15: 361–373.
[81] RECKASE MD. 2009 Multidimensional Item Response Theory, Springer, New York – USA.
[82] REISE SP, MORIZOT J & HAYS RD. 2007. The role of the bifactor model in resolving dimensionalityissues in health outcomes measures. Quality of Life Research, 16: 19–31.
[83] REISE SP, VENTURA J, KEEFE RS, BAADE LE, GOLD JM, GREEN MF & BILDER R. 2011.Bifactor and item response theory analyses of interviewer report scales of cognitive impairment inschizophrenia. Psychological assessment, 23: 245–261.
[84] REVELLE W. 2012. Psych: Procedures for psychological, psychometric, and personality research. Rpackage version 1.1–10 Retrieved from http://personality-project.org/r/psych.manual.pdf.
[85] RIVERS DC, MEADE AW & FULLER WL. 2009. Examining question and context effects in organi-zation survey data using item response theory. Organizational Research Methods, 12: 529–553.
[86] ROST J. 1997. Logistic Mixture Models. In W.J. van der Linden and Hambleton (Ed.), Handbook ofModern Item Response Theory (pp. 449–463). New York: Springer.
[87] ROTH S, SCHMUTZ P, PAUWELS S, BARGAS-AVILA J & OPWIS K. 2010. Mental models for webobjects: where do users expect to find the most frequent objects in online shops, news portals, andcompany web pages? Interacting with Computers, 22: 140–15.
[88] SCHNEIDEWIND NF. 1992. Methodology for validating software metrics. IEEE Transaction SoftwareEngineering, 18: 410–422.
[89] SEO DG. 2011. Application of the Bifactor Model to Computerized Adaptive Testing, Ph.D. thesis.University of Minnesota.
[90] SIJTSMA K. 2011. Introduction to the measurement of psychological attributes. Measurement, 44:1209–1219.
[91] SIGNORE O. 2005. ‘A comprehensive model for Web sites quality’. Proc. of the Seventh IEEE Inter-national Symposium on Web Site Evolution (WSE’05), pp. 30–36.
[92] SOARES TM. 2005. Utilizacao da teoria da resposta ao item na producao de indicadores socio-economicos. Pesquisa Operacional, 25: 83–112.
[93] STOREY M-A, PHILLIPS B, MACZEWSKI M & WANG M. 2002. Evaluating the usability ofWeb-based learning tools. Educational Technology & Society, 5: 91–100.
[94] SCHWARZ G. 1978. Estimating the dimension of a model. The annals of statistics, 6: 461–464.
[95] TAY L, NEWMAN DA & VERMUNT JK. 2011. Using mixed-measurement item response theorywith covariates MM-IRT-C to ascertain observed and unobserved measurement equivalence. Organi-zational Research Methods, 14: 147–176.
[96] TAY L & DRASGOW F. 2012. Theoretical, Statistical, and Substantive Issues in the Assessmentof Construct Dimensionality Accounting for the Item Response Process. Organizational ResearchMethods, 15: 363–384.
[97] TEZZA R, BORNIA AC & ANDRADE DF. 2011. Measuring web usability using item response theory:Principles, features and opportunities. Interacting with Computers, 23: 167–175.
[98] TRIERWEILLER AC, PEIXE BCS, TEZZA R, BORNIA AC & CAMPOS LM. 2013. Measuring en-vironmental management disclosure in industries in Brazil with Item Response Theory. Journal ofCleaner Production, 47: 298–305.
Pesquisa Operacional, Vol. 36(3), 2016
�
�
“main” — 2017/1/2 — 16:14 — page 528 — #26�
�
�
�
�
�
528 MULTIDIMENSIONAL MODELS OF ITEM RESPONSE THEORY IN E-COMMERCE
[99] VAN DER MERWE R & BEKKER J. 2003. A framework and methodology for evaluating e-commerceWeb sites. Internet Research: Electronic Networking Applications and Policy, 13: 330–341.
[100] W3C. 2008. Web content accessibility guidelines (wcag) 2.0. W3C Recommendation. Disponıvelem: http://www.w3.org/TR/WCAG20/. Acessado em 25 de maio de 2015.
[101] WANG R & STOREY V. 1995. A. Firth, A framework for data quality research. IEEE Transactionson Knowledge and Data Engineering, 7: 623–640.
[102] WILSON M. 2013. Using the concept of a measurement system to characterize measurement modelsused in psychometrics. Measurement, 46: 3766–3774.
[103] WONGTADA N & RICE G. 2008. Multidimensional latent traits of perceived organizational innova-tion: Differences between Thai and Egyptian employees. Asia Pacific Journal of Management, 25:537–562.
[104] WORWA K & STANIK J. 2010. Quality of Web-based information systems. Journal of InternetBanking and Commerce, 15: 1–13.
[105] YOO B & DONTHU N. 2001. Developing a scale to measure the perceived quality of Internet shop-ping sites (SITEQUAL). Quarterly Journal of Electronic Commerce, 2: 31–47.
[106] XIE M, WANG H & GOH TN. 1998. Quality dimensions of Internet search engines. Journal ofInformation Science, 24: 365–372.
[107] ZEITHAML VA, PARASURAMAN A & MALHOTRA A. 2002. Service quality delivery through websites: a critical review of extant knowledge. Journal of the academy of marketing science, 30: 362–375.
[108] ZERFASS A & HARTMANN B. 2005. The usability factor: Improving the quality of E-content. In
E-Content (pp. 165–182). Springer Berlin Heidelberg.
Pesquisa Operacional, Vol. 36(3), 2016
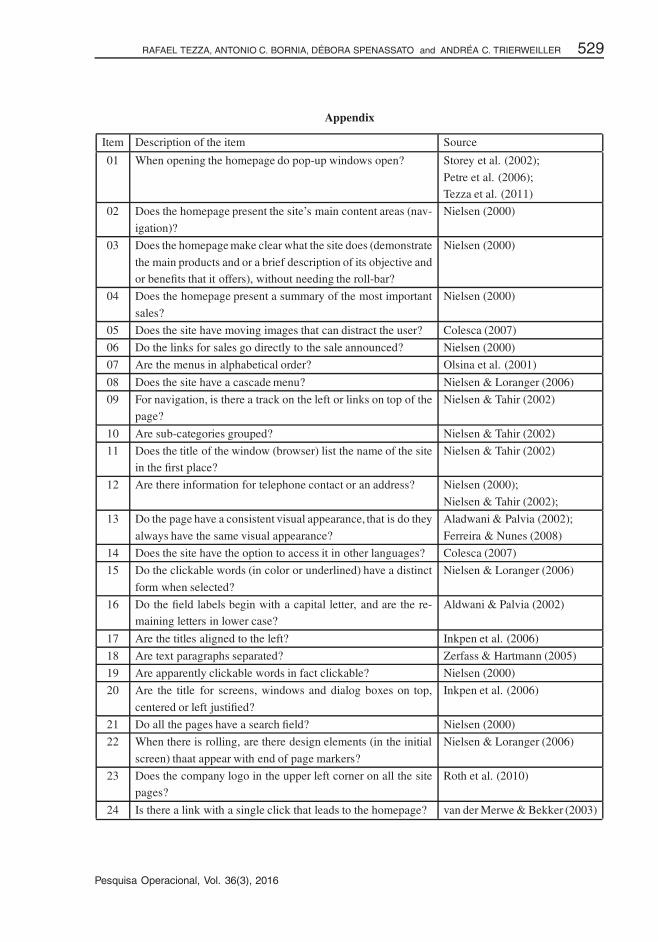
�
�
“main” — 2017/1/2 — 16:14 — page 529 — #27�
�
�
�
�
�
RAFAEL TEZZA, ANTONIO C. BORNIA, DEBORA SPENASSATO and ANDREA C. TRIERWEILLER 529
Appendix
Item Description of the item Source
01 When opening the homepage do pop-up windows open? Storey et al. (2002);
Petre et al. (2006);Tezza et al. (2011)
02 Does the homepage present the site’s main content areas (nav-
igation)?
Nielsen (2000)
03 Does the homepage make clear what the site does (demonstrate
the main products and or a brief description of its objective andor benefits that it offers), without needing the roll-bar?
Nielsen (2000)
04 Does the homepage present a summary of the most important
sales?
Nielsen (2000)
05 Does the site have moving images that can distract the user? Colesca (2007)
06 Do the links for sales go directly to the sale announced? Nielsen (2000)
07 Are the menus in alphabetical order? Olsina et al. (2001)
08 Does the site have a cascade menu? Nielsen & Loranger (2006)
09 For navigation, is there a track on the left or links on top of thepage?
Nielsen & Tahir (2002)
10 Are sub-categories grouped? Nielsen & Tahir (2002)
11 Does the title of the window (browser) list the name of the sitein the first place?
Nielsen & Tahir (2002)
12 Are there information for telephone contact or an address? Nielsen (2000);
Nielsen & Tahir (2002);
13 Do the page have a consistent visual appearance, that is do they
always have the same visual appearance?
Aladwani & Palvia (2002);
Ferreira & Nunes (2008)
14 Does the site have the option to access it in other languages? Colesca (2007)
15 Do the clickable words (in color or underlined) have a distinct
form when selected?
Nielsen & Loranger (2006)
16 Do the field labels begin with a capital letter, and are the re-maining letters in lower case?
Aldwani & Palvia (2002)
17 Are the titles aligned to the left? Inkpen et al. (2006)
18 Are text paragraphs separated? Zerfass & Hartmann (2005)
19 Are apparently clickable words in fact clickable? Nielsen (2000)
20 Are the title for screens, windows and dialog boxes on top,
centered or left justified?
Inkpen et al. (2006)
21 Do all the pages have a search field? Nielsen (2000)
22 When there is rolling, are there design elements (in the initial
screen) thaat appear with end of page markers?
Nielsen & Loranger (2006)
23 Does the company logo in the upper left corner on all the sitepages?
Roth et al. (2010)
24 Is there a link with a single click that leads to the homepage? van der Merwe & Bekker (2003)
Pesquisa Operacional, Vol. 36(3), 2016
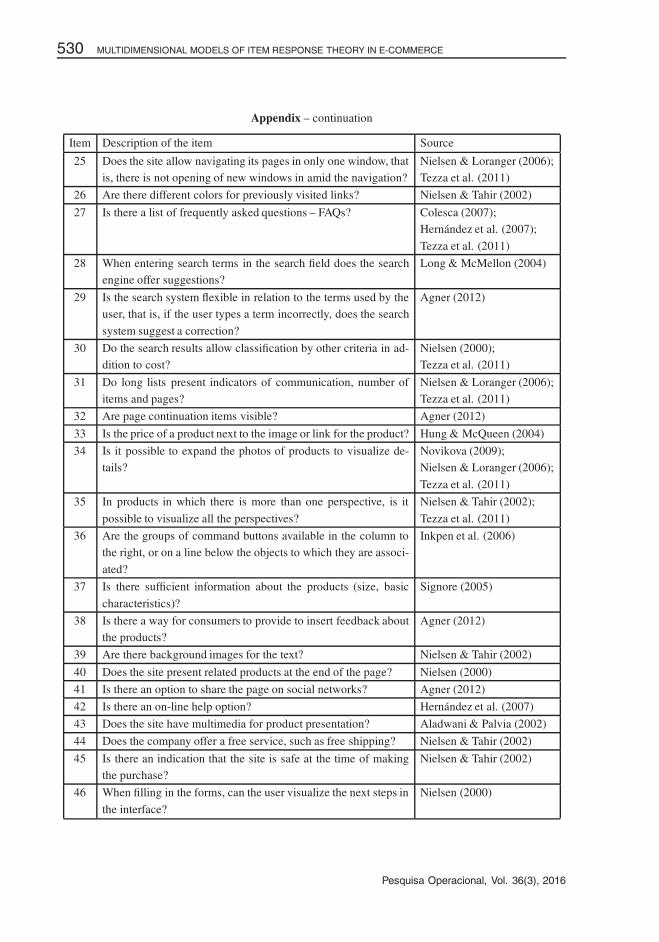
�
�
“main” — 2017/1/2 — 16:14 — page 530 — #28�
�
�
�
�
�
530 MULTIDIMENSIONAL MODELS OF ITEM RESPONSE THEORY IN E-COMMERCE
Appendix – continuation
Item Description of the item Source
25 Does the site allow navigating its pages in only one window, thatis, there is not opening of new windows in amid the navigation?
Nielsen & Loranger (2006);Tezza et al. (2011)
26 Are there different colors for previously visited links? Nielsen & Tahir (2002)
27 Is there a list of frequently asked questions – FAQs? Colesca (2007);Hernandez et al. (2007);
Tezza et al. (2011)
28 When entering search terms in the search field does the searchengine offer suggestions?
Long & McMellon (2004)
29 Is the search system flexible in relation to the terms used by theuser, that is, if the user types a term incorrectly, does the search
system suggest a correction?
Agner (2012)
30 Do the search results allow classification by other criteria in ad-dition to cost?
Nielsen (2000);Tezza et al. (2011)
31 Do long lists present indicators of communication, number ofitems and pages?
Nielsen & Loranger (2006);Tezza et al. (2011)
32 Are page continuation items visible? Agner (2012)
33 Is the price of a product next to the image or link for the product? Hung & McQueen (2004)
34 Is it possible to expand the photos of products to visualize de-tails?
Novikova (2009);Nielsen & Loranger (2006);
Tezza et al. (2011)
35 In products in which there is more than one perspective, is it
possible to visualize all the perspectives?
Nielsen & Tahir (2002);
Tezza et al. (2011)
36 Are the groups of command buttons available in the column tothe right, or on a line below the objects to which they are associ-
ated?
Inkpen et al. (2006)
37 Is there sufficient information about the products (size, basic
characteristics)?
Signore (2005)
38 Is there a way for consumers to provide to insert feedback aboutthe products?
Agner (2012)
39 Are there background images for the text? Nielsen & Tahir (2002)
40 Does the site present related products at the end of the page? Nielsen (2000)
41 Is there an option to share the page on social networks? Agner (2012)
42 Is there an on-line help option? Hernandez et al. (2007)
43 Does the site have multimedia for product presentation? Aladwani & Palvia (2002)
44 Does the company offer a free service, such as free shipping? Nielsen & Tahir (2002)
45 Is there an indication that the site is safe at the time of makingthe purchase?
Nielsen & Tahir (2002)
46 When filling in the forms, can the user visualize the next steps in
the interface?
Nielsen (2000)
Pesquisa Operacional, Vol. 36(3), 2016
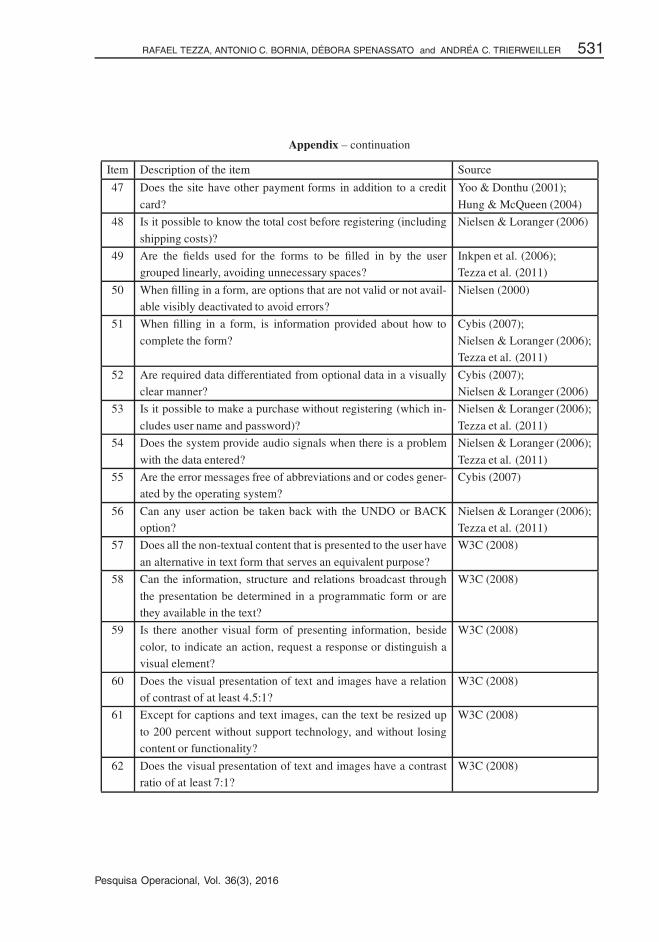
�
�
“main” — 2017/1/2 — 16:14 — page 531 — #29�
�
�
�
�
�
RAFAEL TEZZA, ANTONIO C. BORNIA, DEBORA SPENASSATO and ANDREA C. TRIERWEILLER 531
Appendix – continuation
Item Description of the item Source
47 Does the site have other payment forms in addition to a credit
card?
Yoo & Donthu (2001);
Hung & McQueen (2004)
48 Is it possible to know the total cost before registering (including
shipping costs)?
Nielsen & Loranger (2006)
49 Are the fields used for the forms to be filled in by the usergrouped linearly, avoiding unnecessary spaces?
Inkpen et al. (2006);Tezza et al. (2011)
50 When filling in a form, are options that are not valid or not avail-able visibly deactivated to avoid errors?
Nielsen (2000)
51 When filling in a form, is information provided about how to
complete the form?
Cybis (2007);
Nielsen & Loranger (2006);Tezza et al. (2011)
52 Are required data differentiated from optional data in a visuallyclear manner?
Cybis (2007);Nielsen & Loranger (2006)
53 Is it possible to make a purchase without registering (which in-
cludes user name and password)?
Nielsen & Loranger (2006);
Tezza et al. (2011)
54 Does the system provide audio signals when there is a problem
with the data entered?
Nielsen & Loranger (2006);
Tezza et al. (2011)
55 Are the error messages free of abbreviations and or codes gener-ated by the operating system?
Cybis (2007)
56 Can any user action be taken back with the UNDO or BACKoption?
Nielsen & Loranger (2006);Tezza et al. (2011)
57 Does all the non-textual content that is presented to the user have
an alternative in text form that serves an equivalent purpose?
W3C (2008)
58 Can the information, structure and relations broadcast through
the presentation be determined in a programmatic form or arethey available in the text?
W3C (2008)
59 Is there another visual form of presenting information, beside
color, to indicate an action, request a response or distinguish avisual element?
W3C (2008)
60 Does the visual presentation of text and images have a relationof contrast of at least 4.5:1?
W3C (2008)
61 Except for captions and text images, can the text be resized up
to 200 percent without support technology, and without losingcontent or functionality?
W3C (2008)
62 Does the visual presentation of text and images have a contrastratio of at least 7:1?
W3C (2008)
Pesquisa Operacional, Vol. 36(3), 2016
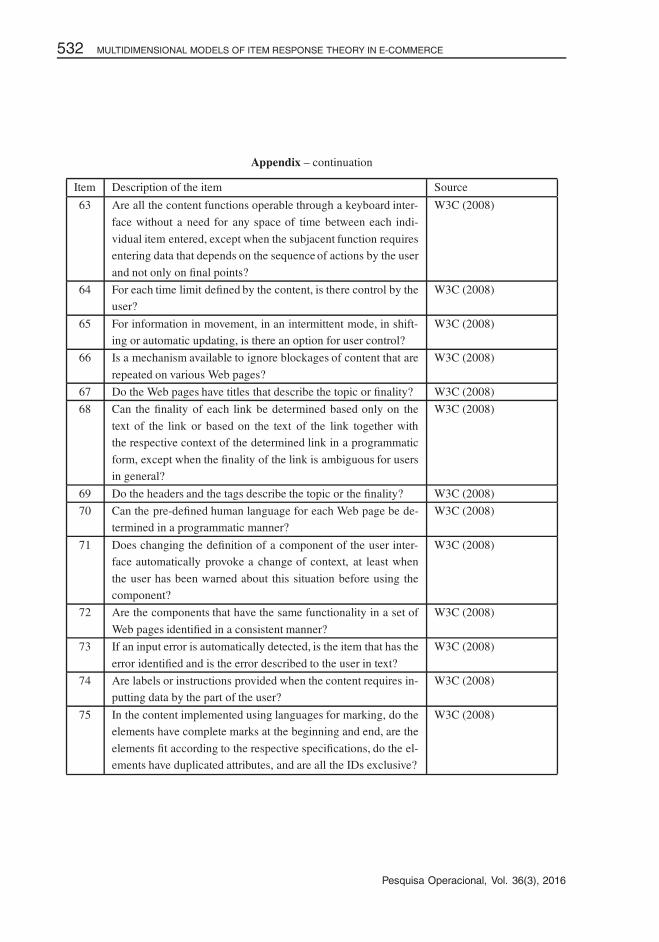
�
�
“main” — 2017/1/2 — 16:14 — page 532 — #30�
�
�
�
�
�
532 MULTIDIMENSIONAL MODELS OF ITEM RESPONSE THEORY IN E-COMMERCE
Appendix – continuation
Item Description of the item Source
63 Are all the content functions operable through a keyboard inter-
face without a need for any space of time between each indi-
vidual item entered, except when the subjacent function requiresentering data that depends on the sequence of actions by the user
and not only on final points?
W3C (2008)
64 For each time limit defined by the content, is there control by theuser?
W3C (2008)
65 For information in movement, in an intermittent mode, in shift-ing or automatic updating, is there an option for user control?
W3C (2008)
66 Is a mechanism available to ignore blockages of content that are
repeated on various Web pages?
W3C (2008)
67 Do the Web pages have titles that describe the topic or finality? W3C (2008)
68 Can the finality of each link be determined based only on the
text of the link or based on the text of the link together withthe respective context of the determined link in a programmatic
form, except when the finality of the link is ambiguous for usersin general?
W3C (2008)
69 Do the headers and the tags describe the topic or the finality? W3C (2008)
70 Can the pre-defined human language for each Web page be de-termined in a programmatic manner?
W3C (2008)
71 Does changing the definition of a component of the user inter-face automatically provoke a change of context, at least when
the user has been warned about this situation before using thecomponent?
W3C (2008)
72 Are the components that have the same functionality in a set of
Web pages identified in a consistent manner?
W3C (2008)
73 If an input error is automatically detected, is the item that has the
error identified and is the error described to the user in text?
W3C (2008)
74 Are labels or instructions provided when the content requires in-putting data by the part of the user?
W3C (2008)
75 In the content implemented using languages for marking, do theelements have complete marks at the beginning and end, are the
elements fit according to the respective specifications, do the el-ements have duplicated attributes, and are all the IDs exclusive?
W3C (2008)
Pesquisa Operacional, Vol. 36(3), 2016