Racial/Ethnic Minorities in Minnesota: Geographical Distribut
28
INFORMATION BRIEF Minnesota House of Representatives Research Department 600 State Office Building St. Paul, MN 55155 February 2001 Jim Cleary, Legislative Analyst 651-296-5053 Racial/Ethnic Minorities in Minnesota: Geographical Distribution Among the Counties This research report describes the geographic distribution of Minnesota’s racial/ethnic minority groups, defined by the U. S. Census Bureau and the Minnesota State Demographer as African American, Asian/Pacific Islander, Native American, and Hispanic. The data for this analysis consist of county-level estimates of 1999 populations developed by the Minnesota State Demographer, based on the 1990 U. S. Census and other information. Comparable data from the 2000 census will not be available until mid-2001, at the earliest. The quantitative analysis and description herein were performed by the House Research Department. Contents Page Data and Methods ............................................... 2 Findings ....................................................... 3 Appendix A ................................................... 17 Appendix B ................................................... 25 This publication can be made available in alternative formats upon request. Please call 651-296-6753 (voice); or the Minnesota State Relay Service at 1-800-627-3529 (TTY) for assistance. Many House Research Department publications are also available on the Internet at: www.house.leg.state.mn.us/hrd/hrd.htm.
Transcript of Racial/Ethnic Minorities in Minnesota: Geographical Distribut

INFORMATION BRIEFMinnesota House of RepresentativesResearch Department600 State Office BuildingSt. Paul, MN 55155 February 2001
Jim Cleary, Legislative Analyst651-296-5053
Racial/Ethnic Minorities in Minnesota:Geographical Distribution Among the Counties
This research report describes the geographic distribution of Minnesota’sracial/ethnic minority groups, defined by the U. S. Census Bureau and theMinnesota State Demographer as African American, Asian/Pacific Islander, NativeAmerican, and Hispanic.
The data for this analysis consist of county-level estimates of 1999 populations developed by the Minnesota State Demographer, based on the 1990 U. S. Censusand other information. Comparable data from the 2000 census will not be available until mid-2001, at the earliest. The quantitative analysis and descriptionherein were performed by the House Research Department.
Contents Page
Data and Methods . . . . . . . . . . . . . . . . . . . . . . . . . . . . . . . . . . . . . . . . . . . . . . . 2
Findings . . . . . . . . . . . . . . . . . . . . . . . . . . . . . . . . . . . . . . . . . . . . . . . . . . . . . . . 3
Appendix A . . . . . . . . . . . . . . . . . . . . . . . . . . . . . . . . . . . . . . . . . . . . . . . . . . . 17
Appendix B . . . . . . . . . . . . . . . . . . . . . . . . . . . . . . . . . . . . . . . . . . . . . . . . . . . 25
This publication can be made available in alternative formats upon request. Please call 651-296-6753 (voice);or the Minnesota State Relay Service at 1-800-627-3529 (TTY) for assistance. Many House ResearchDepartment publications are also available on the Internet at: www.house.leg.state.mn.us/hrd/hrd.htm.

House Research Department February 2001Minnesota’s Racial/Ethnic Groups Page 2
Data and Methods
Information Source
The information and summary analysis presented in this document were prepared by HouseResearch using data from the U.S. Census Bureau, as provided by the Minnesota StateDemographer. The demographer’s data consist of county level estimates of 1999 population foreach of following five racial/ethnic groups within each county:
• White (Caucasian and white-Hispanic);
• African American;
• Asian/Pacific Islander;
• Hispanic (excluding persons self-identifying as white-Hispanic); and
• Native American (American Indian/Alaska Native).
Note that the demographer’s estimates for the 1999 population are based on the 1990 census,since comparable data from the 2000 census (i.e., by county, broken down by race/ethnicity) willnot be available from the Census Bureau until sometime during the summer of 2001, at theearliest.
Also note that the state demographer’s data are county-level figures. Unfortunately, comparablepopulation estimates by racial/ethnic group are not available at the city level at this time.
Two comprehensive county-level data tables (see Tables A and B in the appendices) were createdfor this analysis using the census information and estimates provided by the state demographer. For complete information on any particular county, see those appendices. Shorter tablespresented within the text generally depict extracts or subsets of information from Tables A and B,and often involve further calculations, county sorting, etc.

House Research Department February 2001Minnesota’s Racial/Ethnic Groups Page 3
Findings
Minnesota’s Population: Racial/Ethnic Composition Statewide
According to the Minnesota State Demographer, Minnesota’s population in 1999 was comprisedas shown in Table 1 below (ordered by group size).
Table 1Minnesota’s Estimated 1999 Population
by Racial/Ethnic Group
Population Percent of Total Racial/Ethnic Group
4,868,097 100% Total of all groups
4,437,800 91.2% White (including white-Hispanic)
148,596 3.1% African American
130,537 2.7% Asian/Pacific Islander
92,589 1.9% Hispanic
58,575 1.2% Native American
(430,297) (8.8%) All racial/ethnic minorities combined
Source: Minnesota State Demographer’s estimates, based on the 1990 U.S. census.House Research Department
Thus, racial/ethnic minorities are estimated to make up 8.8 percent of Minnesota’s populationoverall, with the African American and Asian population groups being larger than the Hispanicand Native American population groups. The remainder of this report presents information aboutthe geographic distribution of Minnesota’s minority populations, first for all minority groupscombined, and then separately for African Americans, Asian/Pacific Islanders, Native Americans,and Hispanics. For each population group, data are presented for the top 20 counties for thegroup under consideration—selected first by the actual number of persons of that race/ethnicityresiding within the county (an absolute measure), and then by the percentage of the county’s totalpopulation that the group comprises (a relative measure).

House Research Department February 2001Minnesota’s Racial/Ethnic Groups Page 4
1 This fact is also reflected in the county proportion ratios presented in Table B of the Appendix. Calculatedfor all minority groups combined, those ratios are 1.88 and 2.18, respectively, for Hennepin and Ramsey Counties.
All Minority Groups Combined
When describing the distribution of Minnesota’s minority population groups, it is important:
1) to consider each group separately from the others; and2) to consider both the actual and relative size of each group within each county.
First, however, it is helpful to develop a general overview by considering all minority groupscombined.
The most populous counties in the state contain the greatest numbers of minority persons. Subsequent analysis will show that this is due primarily to the concentrations of Minnesota’sAfrican American and Asian populations within the metro area, particularly within Hennepin andRamsey Counties. Table 2 reveals that Minnesota’s five most populous countiesoverall—Hennepin, Ramsey, Dakota, Anoka, and Washington—contain the largest combinedminority populations as well, and in the same rank order. Together, these five counties accountfor 50.6 percent of the state’s total population and 77.2 percent of the state’s combined minoritypopulation.
In fact, Hennepin County alone, which contains 22.3 percent of the state’s total population,accounts for fully 41.9 percent of the state’s combined minority population. Similarly, RamseyCounty, which accounts for 10.4 percent of the state’s total population, accounts for 22.8 percent of the state’s minority population. Thus, Hennepin and Ramsey Counties each account forapproximately double their proportionate share of all of Minnesota’s minorities.1 By contrast, it isnoteworthy that not one of the remaining 18 of the 20 largest counties in the state contains aproportionate share of the state’s combined minority population.
On a percentage basis, however, many smaller counties have proportionately largerminority populations. The final column of Table 2 shows that when considering the combinedminority population as a percentage of total county population, many smaller counties come tothe fore. Later analysis will show that this is due primarily to the relative concentrations of NativeAmericans, and to a lesser extent Hispanics, in several small rural Minnesota counties.
Only six of Minnesota’s 87 counties have relative minority populations that exceed thestatewide figure of 8.8 percent. This is shown by the final column of data in Table 2. Of thesesix counties, only Hennepin and Ramsey—with 16.6 percent and 19.3 percent minority,respectively—are metro area counties. The others—Mahnomen, Beltrami, Cass, and Cook (with26.4 percent, 19.6 percent, 13.0 percent, and 9.3 percent minority populations, respectively)—aresmall rural counties. Three additional small rural counties— Clearwater, Becker, and Watonwon(with 8.7 percent, 8.6 percent, and 8.5 percent, respectively)—have essentially proportionateminority populations.

House Research Department February 2001Minnesota’s Racial/Ethnic Groups Page 5
The remaining sections of this report present separate data for each of the four identified minoritygroups.
Table 2
Top 20 Counties:Total Population, Minority Population, and Percentage Minority
Largest Total Population Largest Minority PopulationHighest Percentage
Minority
CountyTotalPop.
% ofStateTotal County
MinorityPop.
% ofState’s
Minorities CountyMinority
Pop.
% ofCountyTotal
1 Hennepin 1,087,241 22.3% Hennepin 180,315 41.9% Mahnomen 1,356 26.4%
2 Ramsey 508,001 10.4% Ramsey 98,031 22.8% Beltrami 7,752 19.6%
3 Dakota 357,579 7.3% Dakota 26,207 6.1% Ramsey 98,031 19.3%
4 Anoka 303,481 6.2% Anoka 15,419 3.6% Hennepin 180,315 16.6%
5 Washington 206,935 4.3% Washington 12,045 2.8% Cass 3,537 13.0%
6 St. Louis 194,921 4.0% Olmsted 9,228 2.1% Cook 444 9.3%
7 Stearns 131,008 2.7% St. Louis 8,687 2.0% Clearwater 714 8.7%
8 Olmsted 120,824 2.5% Beltrami 7,752 1.8% Becker 2,562 8.6%
9 Wright 88,484 1.8% Cass 3,537 0.8% Watonwan 1,057 8.5%
10 Scott 83,962 1.7% Clay 3,473 0.8% Olmsted 9,228 7.6%
11 Carver 67,599 1.4% Stearns 3,451 0.8% Polk 2,432 7.5%
12 Sherburne 63,985 1.3% Scott 3,406 0.8% Dakota 26,207 7.3%
13 Otter Tail 55,984 1.2% Kandiyohi 2,888 0.7% Swift 848 7.3%
14 Rice 55,964 1.1% Becker 2,562 0.6% Kandiyohi 2,888 6.7%
15 Blue Earth 54,648 1.1% Rice 2,559 0.6% Carlton 2,078 6.6%
16 Clay 53,636 1.1% Blue Earth 2,512 0.6% Clay 3,473 6.5%
17 Crow Wing 52,950 1.1% Polk 2,432 0.6% Pine 1,497 6.0%
18 Winona 48,335 1.0% Carlton 2,078 0.5% Freeborn 1,930 5.8%
19 Itasca 44,411 0.9% Itasca 2,057 0.5% Washington 12,045 5.8%
20 Goodhue 43,676 0.9% Carver 2,007 0.5% Nobles 1,135 5.8%
------------ ---------- ------------ ------------
Top 5 2,463,237 50.6% Top 5 332,017 77.2%
Top 10 3,082,436 63.2% Top 10 364,694 84.8%
Top 20 3,623,624 74.3% Top 20 390,646 90.8%
State Total 4,868,097 100% State Total 430,297 or 8.8% of the state’s total population
House Research Department

House Research Department February 2001Minnesota’s Racial/Ethnic Groups Page 6

House Research Department February 2001Minnesota’s Racial/Ethnic Groups Page 7
Analyzing Each Minority Group Separately
The remainder of this information brief presents separate analysis for each of the four identifiedminority groups of Minnesotans. They are:
• African Americans;
• Asian/Pacific Islanders;
• Hispanics (excluding persons self-identifying as White-Hispanic); and
• Native Americans (American Indian/Alaska Native).
House Research Department February 2001Minnesota’s Racial/Ethnic Groups Page 8
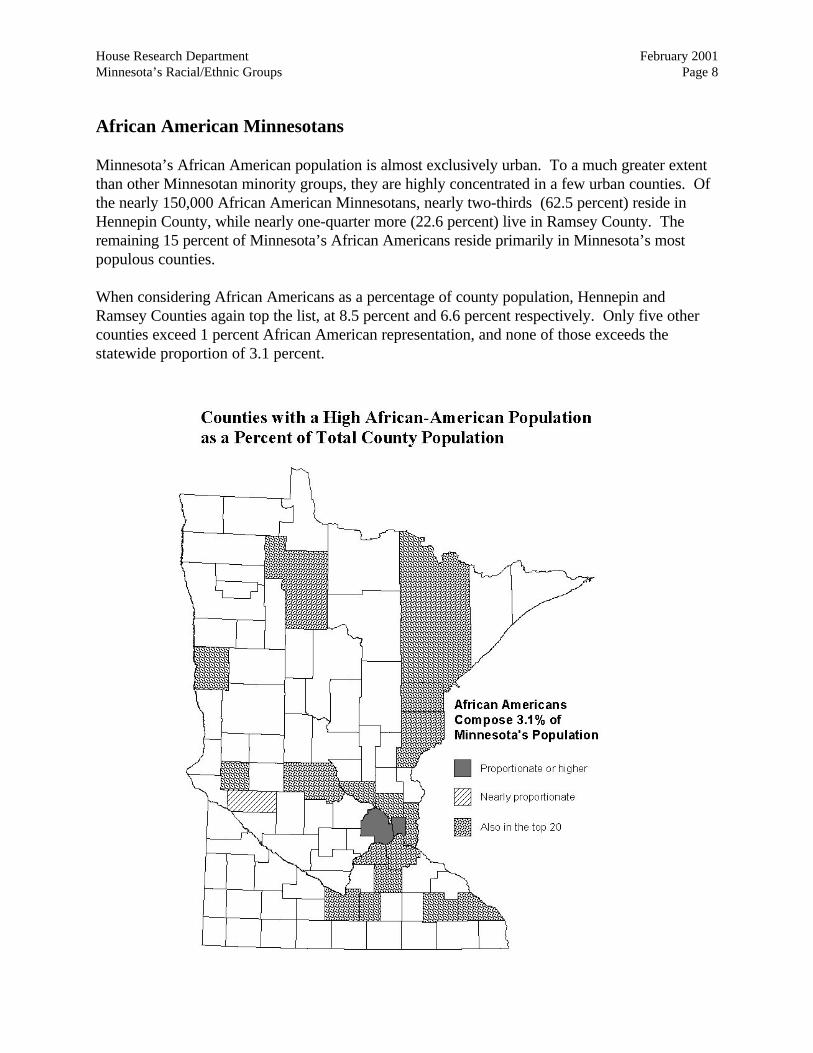
African American Minnesotans
Minnesota’s African American population is almost exclusively urban. To a much greater extentthan other Minnesotan minority groups, they are highly concentrated in a few urban counties. Ofthe nearly 150,000 African American Minnesotans, nearly two-thirds (62.5 percent) reside inHennepin County, while nearly one-quarter more (22.6 percent) live in Ramsey County. Theremaining 15 percent of Minnesota’s African Americans reside primarily in Minnesota’s mostpopulous counties.
When considering African Americans as a percentage of county population, Hennepin andRamsey Counties again top the list, at 8.5 percent and 6.6 percent respectively. Only five othercounties exceed 1 percent African American representation, and none of those exceeds thestatewide proportion of 3.1 percent.

House Research Department February 2001Minnesota’s Racial/Ethnic Groups Page 9
Table 3African American Population in Minnesota:
Top 20 Counties by Population Size and Percentage
Selected by Population Size Selected by County Percentage
County
AfricanAmericanPopulation
% of allAfrican
AmericanMinnesotans County
AfricanAmericanPopulation
% ofCounty
Population
1 Hennepin 92,839 62.5% 1 Hennepin 92,839 8.5%
2 Ramsey 33,649 22.6% 2 Ramsey 33,649 6.6%
3 Dakota 6,796 4.6% 3 Swift 352 3.0%
4 Washington 2,933 2.0% 4 Dakota 6,796 1.9%
5 Anoka 2,422 1.6% 5 Pine 366 1.5%
6 St. Louis 1,546 1.0% 6 Washington 2,933 1.4%
7 Olmsted 1,257 0.8% 7 Olmsted 1,257 1.0%
8 Stearns 686 0.5% 8 Anoka 2,422 0.8%
9 Scott 565 0.4% 9 St. Louis 1,546 0.8%
10 Rice 409 0.3% 10 Waseca 148 0.8%
11 Sherburne 378 0.3% 11 Stevens 76 0.8%
12 Blue Earth 370 0.2% 12 Rice 409 0.7%
13 Pine 366 0.2% 13 Blue Earth 370 0.7%
14 Swift 352 0.2% 14 Scott 565 0.7%
15 Winona 282 0.2% 15 Carlton 188 0.6%
16 Clay 264 0.2% 16 Sherburne 378 0.6%
17 Carver 240 0.2% 17 Winona 282 0.6%
18 Crow Wing 191 0.1% 18 Stearns 686 0.5%
19 Carlton 188 0.1% 19 Clay 264 0.5%
20 Beltrami 168 0.1% 20 Beltrami 168 0.4%
Minnesota 148,596 3.1%
House Research Department

House Research Department February 2001Minnesota’s Racial/Ethnic Groups Page 10
Asian/Pacific Islander Minnesotans
Minnesota’s approximately 130,000 Asians are also highly concentrated in the state’s major urbancounties, though with somewhat greater geographic distribution than for African Americans. Ofthis group, 37 percent reside in Hennepin County, 28.9 percent in Ramsey County, and theremaining 34 percent live elsewhere in the state
On a relative basis, in at least 20 counties Asians Minnesotans constitute 1 percent or more of thecounty’s population. However, in only five counties do Asians make up a proportion of thecounty’s population that equals or exceeds the statewide proportion of 2.7 percent—Ramsey,Olmsted, Hennepin, Nobles, and Dakota Counties (with 7.4 percent, 4.9 percent, 4.4 percent, 3.1percent, and 2.7 percent, respectively).
Many of Minnesota’s Asian residents are relatively recent immigrants, with Ramsey County beinghome to one of the nation’s largest concentrations of Hmong refugees (from Laos), and withmany other Minnesota communities having hosted Vietnamese refugee families following the endof Vietnam War in 1975. Others have originated from an array of other Asian nations, while stillother Minnesotan Asians have been American citizens for generations.

House Research Department February 2001Minnesota’s Racial/Ethnic Groups Page 11
Table 4Asian/Pacific Islander Population in Minnesota:
Top 20 Counties by Population Size and Percentage
Selected by Population Size Selected by County Percentage
CountyAsian
Population
% of AllAsian
Minnesotans CountyAsian
Population
% ofCounty
Population
1 Hennepin 48,325 37.0% 1 Ramsey 37,680 7.4%
2 Ramsey 37,680 28.9% 2 Olmsted 5,874 4.9%
3 Dakota 9,706 7.4% 3 Hennepin 48,325 4.4%
4 Anoka 5,906 4.5% 4 Nobles 608 3.1%
5 Olmsted 5,874 4.5% 5 Dakota 9,706 2.7%
6 Washington 3,776 2.9% 6 Jackson 262 2.3%
7 St. Louis 1,690 1.3% 7 Blue Earth 1,231 2.3%
8 Stearns 1,452 1.1% 8 Anoka 5,906 1.9%
9 Scott 1,276 1.0% 9 Washington 3,776 1.8%
10 Blue Earth 1,231 0.9% 10 Rice 986 1.8%
11 Carver 1,009 0.8% 11 Stevens 171 1.7%
12 Rice 986 0.8% 12 Winona 814 1.7%
13 Winona 814 0.6% 13 Scott 1,276 1.5%
14 Clay 645 0.5% 14 Carver 1,009 1.5%
15 Nobles 608 0.5% 15 Pipestone 127 1.3%
16 Wright 583 0.4% 16 Mower 472 1.3%
17 Sherburne 524 0.4% 17 Clay 645 1.2%
18 Mower 472 0.4% 18 Roseau 183 1.1%
19 Otter Tail 334 0.3% 19 Nicollet 334 1.1%
20 Nicollet 334 0.3% 20 Stearns 1,452 1.1%
Minnesota 130,537 2.7%
House Research Department

House Research Department February 2001Minnesota’s Racial/Ethnic Groups Page 12
Hispanic Minnesotans
Minnesota’s estimated 92,000 Hispanic residents are fairly concentrated in the Twin Cities metrocounties, with two-thirds (66.8 percent) living in the five largest counties. Ramsey County, withnearly 22,000 Hispanics, has more than double its proportionate share. Nevertheless, several non-metro counties, many of them agricultural counties, also contain significant Hispanic populations.
On a relative basis, 15 counties, many of them rural counties, have a higher proportion ofHispanic Minnesotans in their populations than the statewide average of 1.9 percent.

House Research Department February 2001Minnesota’s Racial/Ethnic Groups Page 13
Table 5Hispanic Population in Minnesota:
Top 20 Counties by Population Size and Percentage
Selected by Population Size Selected by County Percentage
County
HispanicAmericanPopulation
% ofall HispanicMinnesotans County
HispanicAmericanPopulation
% ofCounty
Population
1 Hennepin 22,822 24.6% 1 Watonwan 925 7.4%
2 Ramsey 21,747 23.5% 2 Kandiyohi 2,334 5.4%
3 Dakota 8,448 9.1% 3 Polk 1,737 5.3%
4 Anoka 4,533 4.9% 4 Freeborn 1,645 5.0%
5 Washington 4,329 4.7% 5 Ramsey 21,747 4.3%
6 Kandiyohi 2,334 2.5% 6 Clay 1,919 3.6%
7 Clay 1,919 2.1% 7 Faribault 485 2.9%
8 Olmsted 1,747 1.9% 8 Steele 947 2.9%
9 Polk 1,737 1.9% 9 Swift 290 2.5%
10 Freeborn 1,645 1.8% 10 Dakota 8,448 2.4%
11 St. Louis 1,488 1.6% 11 Hennepin 22,822 2.1%
12 Rice 976 1.1% 12 Washington 4,329 2.1%
13 Scott 968 1.0% 13 Pine 515 2.0%
14 Steele 947 1.0% 14 Nobles 387 2.0%
15 Stearns 927 1.0% 15 Renville 334 1.9%
16 Watonwan 925 1.0% 16 Meeker 406 1.8%
17 Blue Earth 774 0.8% 17 Dodge 310 1.8%
18 Sherburne 629 0.7% 18 Rice 976 1.7%
19 Wright 620 0.7% 19 Marshall 161 1.6%
20 Carver 576 0.6% 20 Red Lake 67 1.6%
Minnesota 92,589 1.9%
House Research Department

House Research Department February 2001Minnesota’s Racial/Ethnic Groups Page 14
Native American Minnesotans
Of the four minority groups studied, Minnesota’s 58,000 Native Americans are the leastconcentrated in the Twin Cities metro counties. Compared to their shares of the state’spopulation overall, Hennepin and Ramsey Counties have roughly proportional shares ofMinnesota’s Native American residents (27.9 percent and 8.5 percent, respectively). Theremaining metro area counties have disproportionately low shares of Native Americans in theirpopulations.
Instead, Native American Minnesotans are relatively concentrated in several mainly rural countieswhich, not surprisingly, contain most of Minnesota’s reservations. Tiny Mahnomen County, withonly an estimated 5,000 residents, is home to over 1,300 Native Americans, or 25.4 percent of thecounty’s population. Similarly, Native Americans make up 17.8 percent of the population ofBeltrami County which, with approximately 7,000 Native American residents, ranks second onlyto Hennepin County in the absolute size of this minority group. In 21 counties, the NativeAmerican population proportion equals or exceeds the statewide proportion of 1.2 percent.

House Research Department February 2001Minnesota’s Racial/Ethnic Groups Page 15
Table 6Native American Population in Minnesota:
Top 20 Counties by Population Size and Percentage
Selected by Population Size Selected by County Percentage
County
NativeAmericanPopulation
% of allNative
AmericanMinnesotans County
NativeAmericanPopulation
% ofCounty
Population
1 Hennepin 16,329 27.9% 1 Mahnomen 1,303 25.4%
2 Beltrami 7,008 12.0% 2 Beltrami 7,008 17.8%
3 Ramsey 4,955 8.5% 3 Cass 3,163 11.6%
4 St. Louis 3,963 6.8% 4 Clearwater 670 8.2%
5 Cass 3,163 5.4% 5 Cook 369 7.7%
6 Anoka 2,558 4.4% 6 Becker 2,145 7.2%
7 Becker 2,145 3.7% 7 Carlton 1,577 5.0%
8 Carlton 1,577 2.7% 8 Mille Lacs 769 3.6%
9 Itasca 1,559 2.7% 9 Itasca 1,559 3.5%
10 Mahnomen 1,303 2.2% 10 Traverse 124 3.0%
11 Dakota 1,257 2.1% 11 Koochiching 437 2.9%
12 Washington 1,007 1.7% 12 St. Louis 3,963 2.0%
13 Mille Lacs 769 1.3% 13 Hubbard 329 1.9%
14 Clearwater 670 1.1% 14 Pine 460 1.8%
15 Clay 645 1.1% 15 Redwood 295 1.8%
16 Scott 597 1.0% 16 Aitkin 237 1.7%
17 Pine 460 0.8% 17 Hennepin 16,329 1.5%
18 Koochiching 437 0.7% 18 Pipestone 150 1.5%
19 Polk 425 0.7% 19 Polk 425 1.3%
20 Crow Wing 404 0.7% 20 Clay 645 1.2%
Minnesota 58,575 1.2%
House Research Department


House Research Department February 2001Minnesota’s Racial/Ethnic Groups Page 17
Appendix A
The comprehensive county-level data tables in these appendices were created for this analysis byHouse Research using the census information and estimates provided by the state demographer. Shorter tables presented above depict extracts or subsets of information from Tables A and B, andoften involve further calculations, county sorts, etc.
Table A: 1999 Population Estimates by Racial Group
Table A contains all of the basic data for this analysis, listed alphabetically by county name. Itlists for each of Minnesota’s 87 counties three pieces of information for each of the fiveracial/ethnic groups used by the 1990 census:
• the population size of the group;
• the percentage that number composes of the county’s total population; and
• the percentage that number composes of the state’s total population for that ethnic group.
For example, the data line for Anoka County (listed second in alphabetical order) shows:
• [in the first two columns] an estimated total county population of 303,481, which composes[100 percent of the county’s total population—an implied column, not shown], and 6.2percent of the state’s total population;
• [in the next three columns] a white population of 288,062, which composes 94.9 percent ofthe county’s total population, and 6.5 percent of the state’s total white population;
• [in the next three columns] a total minority population of 15,419, which composes 5.1 percentof the county’s total population, and 3.6 percent of the state’s total minority population;
and so on for each of the remaining racial/ethnic groups.
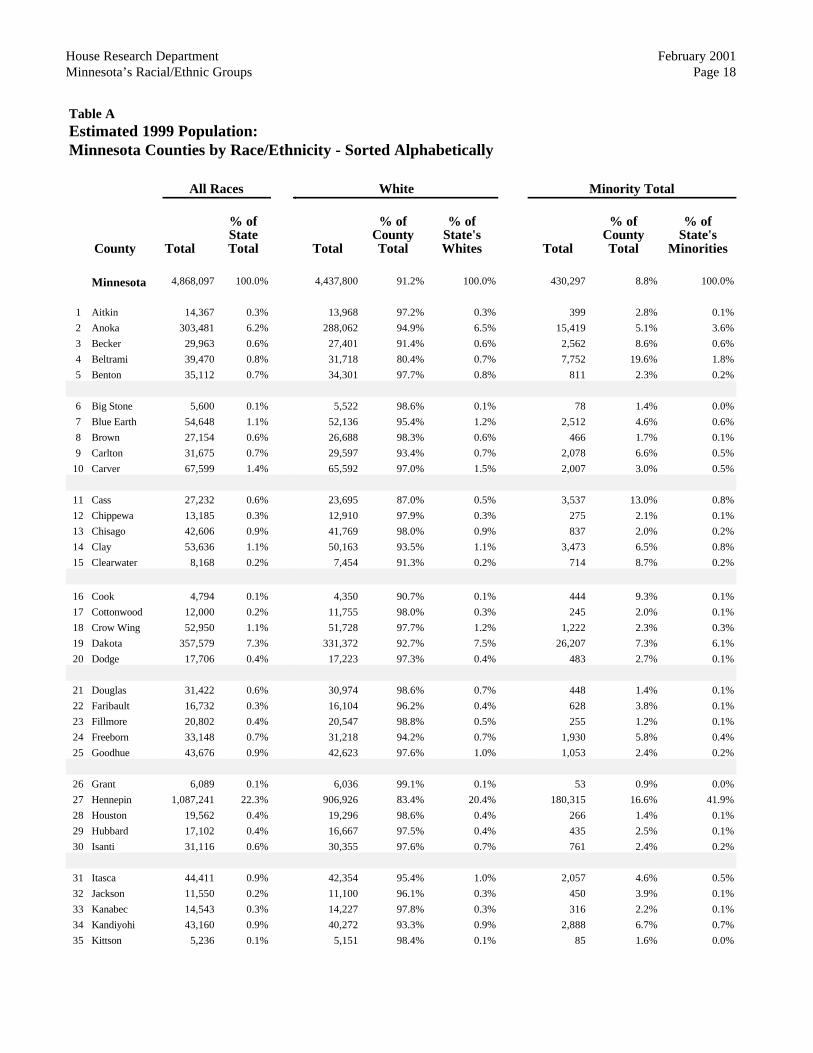
House Research Department February 2001Minnesota’s Racial/Ethnic Groups Page 18
Table AEstimated 1999 Population: Minnesota Counties by Race/Ethnicity - Sorted Alphabetically
County
All Races White Minority Total
Total
% ofStateTotal Total
% ofCountyTotal
% ofState'sWhites Total
% ofCountyTotal
% ofState's
Minorities
Minnesota 4,868,097 100.0% 4,437,800 91.2% 100.0% 430,297 8.8% 100.0%
1 Aitkin 14,367 0.3% 13,968 97.2% 0.3% 399 2.8% 0.1%
2 Anoka 303,481 6.2% 288,062 94.9% 6.5% 15,419 5.1% 3.6%
3 Becker 29,963 0.6% 27,401 91.4% 0.6% 2,562 8.6% 0.6%
4 Beltrami 39,470 0.8% 31,718 80.4% 0.7% 7,752 19.6% 1.8%
5 Benton 35,112 0.7% 34,301 97.7% 0.8% 811 2.3% 0.2%
6 Big Stone 5,600 0.1% 5,522 98.6% 0.1% 78 1.4% 0.0%
7 Blue Earth 54,648 1.1% 52,136 95.4% 1.2% 2,512 4.6% 0.6%
8 Brown 27,154 0.6% 26,688 98.3% 0.6% 466 1.7% 0.1%
9 Carlton 31,675 0.7% 29,597 93.4% 0.7% 2,078 6.6% 0.5%
10 Carver 67,599 1.4% 65,592 97.0% 1.5% 2,007 3.0% 0.5%
11 Cass 27,232 0.6% 23,695 87.0% 0.5% 3,537 13.0% 0.8%
12 Chippewa 13,185 0.3% 12,910 97.9% 0.3% 275 2.1% 0.1%
13 Chisago 42,606 0.9% 41,769 98.0% 0.9% 837 2.0% 0.2%
14 Clay 53,636 1.1% 50,163 93.5% 1.1% 3,473 6.5% 0.8%
15 Clearwater 8,168 0.2% 7,454 91.3% 0.2% 714 8.7% 0.2%
16 Cook 4,794 0.1% 4,350 90.7% 0.1% 444 9.3% 0.1%
17 Cottonwood 12,000 0.2% 11,755 98.0% 0.3% 245 2.0% 0.1%
18 Crow Wing 52,950 1.1% 51,728 97.7% 1.2% 1,222 2.3% 0.3%
19 Dakota 357,579 7.3% 331,372 92.7% 7.5% 26,207 7.3% 6.1%
20 Dodge 17,706 0.4% 17,223 97.3% 0.4% 483 2.7% 0.1%
21 Douglas 31,422 0.6% 30,974 98.6% 0.7% 448 1.4% 0.1%
22 Faribault 16,732 0.3% 16,104 96.2% 0.4% 628 3.8% 0.1%
23 Fillmore 20,802 0.4% 20,547 98.8% 0.5% 255 1.2% 0.1%
24 Freeborn 33,148 0.7% 31,218 94.2% 0.7% 1,930 5.8% 0.4%
25 Goodhue 43,676 0.9% 42,623 97.6% 1.0% 1,053 2.4% 0.2%
26 Grant 6,089 0.1% 6,036 99.1% 0.1% 53 0.9% 0.0%
27 Hennepin 1,087,241 22.3% 906,926 83.4% 20.4% 180,315 16.6% 41.9%
28 Houston 19,562 0.4% 19,296 98.6% 0.4% 266 1.4% 0.1%
29 Hubbard 17,102 0.4% 16,667 97.5% 0.4% 435 2.5% 0.1%
30 Isanti 31,116 0.6% 30,355 97.6% 0.7% 761 2.4% 0.2%
31 Itasca 44,411 0.9% 42,354 95.4% 1.0% 2,057 4.6% 0.5%
32 Jackson 11,550 0.2% 11,100 96.1% 0.3% 450 3.9% 0.1%
33 Kanabec 14,543 0.3% 14,227 97.8% 0.3% 316 2.2% 0.1%
34 Kandiyohi 43,160 0.9% 40,272 93.3% 0.9% 2,888 6.7% 0.7%
35 Kittson 5,236 0.1% 5,151 98.4% 0.1% 85 1.6% 0.0%

House Research Department February 2001Minnesota’s Racial/Ethnic Groups Page 19
African American Native American Asian Hispanic
Total
% ofCountyTotal
% ofState'sAf.Am. Total
% ofCountyTotal
% ofState's
Nat.Am. Total
% ofCountyTotal
% ofState'sAsians Total
% ofCountyTotal
% ofState's
Hispanics
148,596 3.1% 100.0% 58,575 1.2% 100.0% 130,537 2.7% 100.0% 92,589 1.9% 100.0%
26 0.2% 0.0% 237 1.6% 0.4% 62 0.4% 0.0% 74 0.5% 0.1%
2,422 0.8% 1.6% 2,558 0.8% 4.4% 5,906 1.9% 4.5% 4,533 1.5% 4.9%
29 0.1% 0.0% 2,145 7.2% 3.7% 182 0.6% 0.1% 206 0.7% 0.2%
168 0.4% 0.1% 7,008 17.8% 12.0% 316 0.8% 0.2% 260 0.7% 0.3%
117 0.3% 0.1% 161 0.5% 0.3% 253 0.7% 0.2% 280 0.8% 0.3%
5 0.1% 0.0% 23 0.4% 0.0% 21 0.4% 0.0% 29 0.5% 0.0%
370 0.7% 0.2% 137 0.3% 0.2% 1,231 2.3% 0.9% 774 1.4% 0.8%
23 0.1% 0.0% 19 0.1% 0.0% 173 0.6% 0.1% 251 0.9% 0.3%
188 0.6% 0.1% 1,577 5.0% 2.7% 130 0.4% 0.1% 183 0.6% 0.2%
240 0.4% 0.2% 182 0.3% 0.3% 1,009 1.5% 0.8% 576 0.9% 0.6%
76 0.3% 0.1% 3,163 11.6% 5.4% 108 0.4% 0.1% 190 0.7% 0.2%
14 0.1% 0.0% 30 0.2% 0.1% 74 0.6% 0.1% 157 1.2% 0.2%
146 0.3% 0.1% 178 0.4% 0.3% 209 0.5% 0.2% 304 0.7% 0.3%
264 0.5% 0.2% 645 1.2% 1.1% 645 1.2% 0.5% 1,919 3.6% 2.1%
7 0.1% 0.0% 670 8.2% 1.1% 15 0.2% 0.0% 22 0.3% 0.0%
12 0.3% 0.0% 369 7.7% 0.6% 41 0.9% 0.0% 22 0.5% 0.0%
17 0.1% 0.0% 10 0.1% 0.0% 126 1.0% 0.1% 92 0.8% 0.1%
191 0.4% 0.1% 404 0.8% 0.7% 285 0.5% 0.2% 342 0.6% 0.4%
6,796 1.9% 4.6% 1,257 0.4% 2.1% 9,706 2.7% 7.4% 8,448 2.4% 9.1%
22 0.1% 0.0% 44 0.2% 0.1% 107 0.6% 0.1% 310 1.8% 0.3%
26 0.1% 0.0% 96 0.3% 0.2% 178 0.6% 0.1% 148 0.5% 0.2%
18 0.1% 0.0% 32 0.2% 0.1% 93 0.6% 0.1% 485 2.9% 0.5%
14 0.1% 0.0% 47 0.2% 0.1% 80 0.4% 0.1% 114 0.5% 0.1%
20 0.1% 0.0% 66 0.2% 0.1% 199 0.6% 0.2% 1,645 5.0% 1.8%
118 0.3% 0.1% 322 0.7% 0.5% 304 0.7% 0.2% 309 0.7% 0.3%
6 0.1% 0.0% 16 0.3% 0.0% 19 0.3% 0.0% 12 0.2% 0.0%
92,839 8.5% 62.5% 16,329 1.5% 27.9% 48,325 4.4% 37.0% 22,822 2.1% 24.6%
45 0.2% 0.0% 55 0.3% 0.1% 93 0.5% 0.1% 73 0.4% 0.1%
6 0.0% 0.0% 329 1.9% 0.6% 29 0.2% 0.0% 71 0.4% 0.1%
124 0.4% 0.1% 192 0.6% 0.3% 216 0.7% 0.2% 229 0.7% 0.2%
89 0.2% 0.1% 1,559 3.5% 2.7% 152 0.3% 0.1% 257 0.6% 0.3%
2 0.0% 0.0% 14 0.1% 0.0% 262 2.3% 0.2% 172 1.5% 0.2%
38 0.3% 0.0% 74 0.5% 0.1% 88 0.6% 0.1% 116 0.8% 0.1%
153 0.4% 0.1% 198 0.5% 0.3% 203 0.5% 0.2% 2,334 5.4% 2.5%
0 0.0% 0.0% 8 0.2% 0.0% 16 0.3% 0.0% 61 1.2% 0.1%

House Research Department February 2001Minnesota’s Racial/Ethnic Groups Page 20
Table A (continued)Estimated 1999 Population: Minnesota Counties by Race/Ethnicity - Sorted Alphabetically
County
All Races White Minority Total
Total
% ofStateTotal Total
% ofCountyTotal
% ofState'sWhites Total
% ofCountyTotal
% ofState's
Minorities
36 Koochiching 15,129 0.3% 14,340 94.8% 0.3% 789 5.2% 0.2%
37 Lac qui Parle 7,843 0.2% 7,747 98.8% 0.2% 96 1.2% 0.0%
38 Lake 10,827 0.2% 10,664 98.5% 0.2% 163 1.5% 0.0%
39 Lake of Woods 4,675 0.1% 4,572 97.8% 0.1% 103 2.2% 0.0%
40 Le Sueur 25,700 0.5% 25,266 98.3% 0.6% 434 1.7% 0.1%
41 Lincoln 6,455 0.1% 6,401 99.2% 0.1% 54 0.8% 0.0%
42 Lyon 24,613 0.5% 23,903 97.1% 0.5% 710 2.9% 0.2%
43 Mahnomen 5,136 0.1% 3,780 73.6% 0.1% 1,356 26.4% 0.3%
44 Marshall 10,255 0.2% 10,024 97.7% 0.2% 231 2.3% 0.1%
45 Martin 21,999 0.5% 21,611 98.2% 0.5% 388 1.8% 0.1%
46 McLeod 35,054 0.7% 34,178 97.5% 0.8% 876 2.5% 0.2%
47 Meeker 22,169 0.5% 21,525 97.1% 0.5% 644 2.9% 0.1%
48 Mille Lacs 21,513 0.4% 20,458 95.1% 0.5% 1,055 4.9% 0.2%
49 Morrison 30,692 0.6% 30,298 98.7% 0.7% 394 1.3% 0.1%
50 Mower 37,551 0.8% 36,523 97.3% 0.8% 1,028 2.7% 0.2%
51 Murray 9,554 0.2% 9,487 99.3% 0.2% 67 0.7% 0.0%
52 Nicollet 29,624 0.6% 28,765 97.1% 0.6% 859 2.9% 0.2%
53 Nobles 19,500 0.4% 18,365 94.2% 0.4% 1,135 5.8% 0.3%
54 Norman 7,620 0.2% 7,409 97.2% 0.2% 211 2.8% 0.0%
55 Olmsted 120,824 2.5% 111,596 92.4% 2.5% 9,228 7.6% 2.1%
56 Otter Tail 55,984 1.2% 54,903 98.1% 1.2% 1,081 1.9% 0.3%
57 Pennington 13,737 0.3% 13,351 97.2% 0.3% 386 2.8% 0.1%
58 Pine 25,131 0.5% 23,634 94.0% 0.5% 1,497 6.0% 0.3%
59 Pipestone 10,060 0.2% 9,709 96.5% 0.2% 351 3.5% 0.1%
60 Polk 32,524 0.7% 30,092 92.5% 0.7% 2,432 7.5% 0.6%
61 Pope 10,900 0.2% 10,830 99.4% 0.2% 70 0.6% 0.0%
62 Ramsey 508,001 10.4% 409,970 80.7% 9.2% 98,031 19.3% 22.8%
63 Red Lake 4,269 0.1% 4,183 98.0% 0.1% 86 2.0% 0.0%
64 Redwood 16,558 0.3% 16,048 96.9% 0.4% 510 3.1% 0.1%
65 Renville 17,142 0.4% 16,658 97.2% 0.4% 484 2.8% 0.1%
66 Rice 55,964 1.2% 53,405 95.4% 1.2% 2,559 4.6% 0.6%
67 Rock 9,669 0.2% 9,538 98.6% 0.2% 131 1.4% 0.0%
68 Roseau 16,134 0.3% 15,723 97.5% 0.4% 411 2.5% 0.1%
69 St. Louis 194,921 4.0% 186,234 95.5% 4.2% 8,687 4.5% 2.0%
70 Scott 83,962 1.7% 80,556 95.9% 1.8% 3,406 4.1% 0.8%

House Research Department February 2001Minnesota’s Racial/Ethnic Groups Page 21
African American Native American Asian Hispanic
Total
% ofCountyTotal
% ofState'sAf.Am. Total
% ofCountyTotal
% ofState's
Nat.Am. Total
% ofCountyTotal
% ofState'sAsians Total
% ofCountyTotal
% ofState's
Hispanics
49 0.3% 0.0% 437 2.9% 0.7% 69 0.5% 0.1% 234 1.5% 0.3%
17 0.2% 0.0% 13 0.2% 0.0% 36 0.5% 0.0% 30 0.4% 0.0%
9 0.1% 0.0% 62 0.6% 0.1% 30 0.3% 0.0% 62 0.6% 0.1%
2 0.0% 0.0% 25 0.5% 0.0% 22 0.5% 0.0% 54 1.2% 0.1%
26 0.1% 0.0% 58 0.2% 0.1% 114 0.4% 0.1% 236 0.9% 0.3%
2 0.0% 0.0% 10 0.2% 0.0% 11 0.2% 0.0% 31 0.5% 0.0%
101 0.4% 0.1% 76 0.3% 0.1% 176 0.7% 0.1% 357 1.5% 0.4%
1 0.0% 0.0% 1,303 25.4% 2.2% 7 0.1% 0.0% 45 0.9% 0.0%
3 0.0% 0.0% 47 0.5% 0.1% 20 0.2% 0.0% 161 1.6% 0.2%
13 0.1% 0.0% 36 0.2% 0.1% 132 0.6% 0.1% 207 0.9% 0.2%
61 0.2% 0.0% 62 0.2% 0.1% 251 0.7% 0.2% 502 1.4% 0.5%
50 0.2% 0.0% 33 0.1% 0.1% 155 0.7% 0.1% 406 1.8% 0.4%
52 0.2% 0.0% 769 3.6% 1.3% 71 0.3% 0.1% 163 0.8% 0.2%
57 0.2% 0.0% 91 0.3% 0.2% 76 0.2% 0.1% 170 0.6% 0.2%
104 0.3% 0.1% 53 0.1% 0.1% 472 1.3% 0.4% 399 1.1% 0.4%
0 0.0% 0.0% 4 0.0% 0.0% 28 0.3% 0.0% 35 0.4% 0.0%
112 0.4% 0.1% 61 0.2% 0.1% 334 1.1% 0.3% 352 1.2% 0.4%
59 0.3% 0.0% 81 0.4% 0.1% 608 3.1% 0.5% 387 2.0% 0.4%
4 0.1% 0.0% 78 1.0% 0.1% 26 0.3% 0.0% 103 1.4% 0.1%
1,257 1.0% 0.8% 350 0.3% 0.6% 5,874 4.9% 4.5% 1,747 1.4% 1.9%
57 0.1% 0.0% 289 0.5% 0.5% 334 0.6% 0.3% 401 0.7% 0.4%
18 0.1% 0.0% 108 0.8% 0.2% 80 0.6% 0.1% 180 1.3% 0.2%
366 1.5% 0.2% 460 1.8% 0.8% 156 0.6% 0.1% 515 2.0% 0.6%
7 0.1% 0.0% 150 1.5% 0.3% 127 1.3% 0.1% 67 0.7% 0.1%
128 0.4% 0.1% 425 1.3% 0.7% 142 0.4% 0.1% 1,737 5.3% 1.9%
9 0.1% 0.0% 25 0.2% 0.0% 22 0.2% 0.0% 14 0.1% 0.0%
33,649 6.6% 22.6% 4,955 1.0% 8.5% 37,680 7.4% 28.9% 21,747 4.3% 23.5%
3 0.1% 0.0% 12 0.3% 0.0% 4 0.1% 0.0% 67 1.6% 0.1%
31 0.2% 0.0% 295 1.8% 0.5% 47 0.3% 0.0% 137 0.8% 0.1%
10 0.1% 0.0% 63 0.4% 0.1% 77 0.4% 0.1% 334 1.9% 0.4%
409 0.7% 0.3% 188 0.3% 0.3% 986 1.8% 0.8% 976 1.7% 1.1%
18 0.2% 0.0% 34 0.4% 0.1% 29 0.3% 0.0% 50 0.5% 0.1%
4 0.0% 0.0% 175 1.1% 0.3% 183 1.1% 0.1% 49 0.3% 0.1%
1,546 0.8% 1.0% 3,963 2.0% 6.8% 1,690 0.9% 1.3% 1,488 0.8% 1.6%
565 0.7% 0.4% 597 0.7% 1.0% 1,276 1.5% 1.0% 968 1.2% 1.0%

House Research Department February 2001Minnesota’s Racial/Ethnic Groups Page 22
Table A (continued)Estimated 1999 Population: Minnesota Counties by Race/Ethnicity - Sorted Alphabetically
County
All Races White Minority Total
Total
% ofStateTotal Total
% ofCountyTotal
% ofState'sWhites Total
% ofCountyTotal
% ofState's
Minorities
71 Sherburne 63,985 1.3% 62,153 97.1% 1.4% 1,832 2.9% 0.4%
72 Sibley 14,997 0.3% 14,691 98.0% 0.3% 306 2.0% 0.1%
73 Stearns 131,008 2.7% 127,557 97.4% 2.9% 3,451 2.6% 0.8%
74 Steele 33,008 0.7% 31,650 95.9% 0.7% 1,358 4.1% 0.3%
75 Stevens 10,052 0.2% 9,677 96.3% 0.2% 375 3.7% 0.1%
76 Swift 11,634 0.2% 10,786 92.7% 0.2% 848 7.3% 0.2%
77 Todd 24,347 0.5% 24,075 98.9% 0.5% 272 1.1% 0.1%
78 Traverse 4,177 0.1% 4,021 96.3% 0.1% 156 3.7% 0.0%
79 Wabasha 21,289 0.4% 20,916 98.2% 0.5% 373 1.8% 0.1%
80 Wadena 13,324 0.3% 13,085 98.2% 0.3% 239 1.8% 0.1%
81 Waseca 18,834 0.4% 18,186 96.6% 0.4% 648 3.4% 0.2%
82 Washington 206,935 4.3% 194,890 94.2% 4.4% 12,045 5.8% 2.8%
83 Watonwan 12,473 0.3% 11,416 91.5% 0.3% 1,057 8.5% 0.2%
84 Wilkin 7,360 0.2% 7,198 97.8% 0.2% 162 2.2% 0.0%
85 Winona 48,335 1.0% 46,571 96.4% 1.0% 1,764 3.6% 0.4%
86 Wright 88,484 1.8% 86,777 98.1% 2.0% 1,707 1.9% 0.4%
87 Yellow Med. 11,451 0.2% 11,151 97.4% 0.3% 300 2.6% 0.1%
Source: Population Estimates Program, Population Division, U.S. Census Bureau, Washington, D.C. Internet Release Date: August 30, 2000.Local Source: Minnesota State Demographer, December 1, 2000.
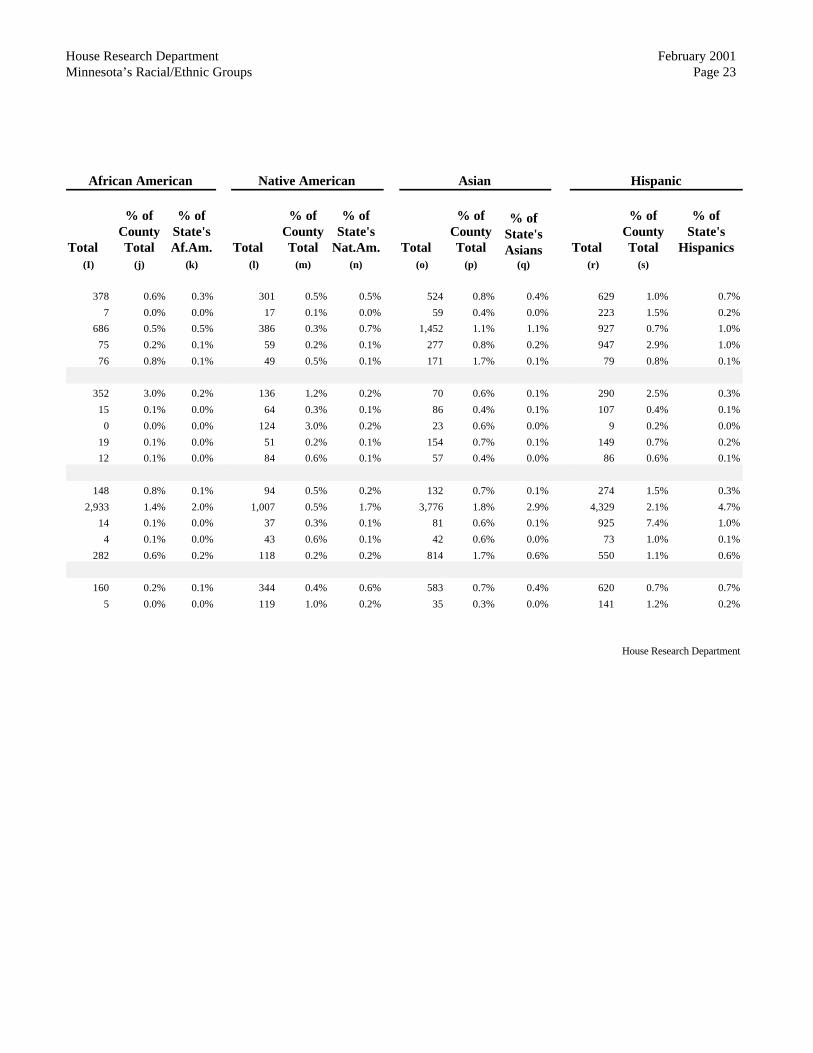
House Research Department February 2001Minnesota’s Racial/Ethnic Groups Page 23
African American Native American Asian Hispanic
Total
% ofCountyTotal
% ofState'sAf.Am. Total
% ofCountyTotal
% ofState's
Nat.Am. Total
% ofCountyTotal
% ofState'sAsians Total
% ofCountyTotal
% ofState's
Hispanics(I) (j) (k) (l) (m) (n) (o) (p) (q) (r) (s)
378 0.6% 0.3% 301 0.5% 0.5% 524 0.8% 0.4% 629 1.0% 0.7%
7 0.0% 0.0% 17 0.1% 0.0% 59 0.4% 0.0% 223 1.5% 0.2%
686 0.5% 0.5% 386 0.3% 0.7% 1,452 1.1% 1.1% 927 0.7% 1.0%
75 0.2% 0.1% 59 0.2% 0.1% 277 0.8% 0.2% 947 2.9% 1.0%
76 0.8% 0.1% 49 0.5% 0.1% 171 1.7% 0.1% 79 0.8% 0.1%
352 3.0% 0.2% 136 1.2% 0.2% 70 0.6% 0.1% 290 2.5% 0.3%
15 0.1% 0.0% 64 0.3% 0.1% 86 0.4% 0.1% 107 0.4% 0.1%
0 0.0% 0.0% 124 3.0% 0.2% 23 0.6% 0.0% 9 0.2% 0.0%
19 0.1% 0.0% 51 0.2% 0.1% 154 0.7% 0.1% 149 0.7% 0.2%
12 0.1% 0.0% 84 0.6% 0.1% 57 0.4% 0.0% 86 0.6% 0.1%
148 0.8% 0.1% 94 0.5% 0.2% 132 0.7% 0.1% 274 1.5% 0.3%
2,933 1.4% 2.0% 1,007 0.5% 1.7% 3,776 1.8% 2.9% 4,329 2.1% 4.7%
14 0.1% 0.0% 37 0.3% 0.1% 81 0.6% 0.1% 925 7.4% 1.0%
4 0.1% 0.0% 43 0.6% 0.1% 42 0.6% 0.0% 73 1.0% 0.1%
282 0.6% 0.2% 118 0.2% 0.2% 814 1.7% 0.6% 550 1.1% 0.6%
160 0.2% 0.1% 344 0.4% 0.6% 583 0.7% 0.4% 620 0.7% 0.7%
5 0.0% 0.0% 119 1.0% 0.2% 35 0.3% 0.0% 141 1.2% 0.2%
House Research Department


House Research Department February 2001Minnesota’s Racial/Ethnic Groups Page 25
Appendix B
Two comprehensive county-level data tables—presented in these appendices—were created forthis analysis by House Research using the census information and estimates provided by the statedemographer. Shorter tables within the text generally depict extracts or subsets of informationfrom Tables A and B, and often involve further calculations, county sorts, and so on.
Table B: County Proportion Ratios
These ratios provide a shorthand method for quickly determining whether a county’s share of anygiven racial/ethnic group is proportionate to its share of the state’s population, or whether it isdisproportionately high or low. A ratio of 1.0 for a given racial group within a county indicatesthat the county’s “share” of the corresponding racial group is proportionate to its share of thestate population. A ration greater or lower than 1.0 would indicate a disproportionately higher orlower share, respectively, of that racial group residing within the county.
For example, one would interpret Becker County’s ratios as follows:
• whites, at a ratio of 1.0, indicates that a proportionate share of whites reside in BeckerCounty, compared to that county’s share of the total state population;
• African Americans, at a ratio of 0.0, indicates that a very disproportionately low proportion ofAfrican American Minnesotans reside in Becker County (Table A reveals that only 29 AfricanAmericans live in Becker County);
• Native Americans, at a ratio of 5.9, indicates that the proportion of Becker County’s NativeAmerican population is nearly six times greater than the proportion of the statewidepopulation that is Native American;
• Asian, at a ratio of 0.2, and Hispanic, at 0.4, reflects that these groups are proportionatelyvery under-represented in Becker County, compared to their statewide representation.

House Research Department February 2001Minnesota’s Racial/Ethnic Groups Page 26
Table BCounty Proportion Ratios
[ Ratio of the County's Share of a Racial Group to the County's Share of Total State Population ][ =1.0 reflects a proportionate share; <1.0 reflects a less than proportionate share; >1.0 reflects a greater thanproportionate share; a 2.0 reflects a double share; etc. ]
County WhiteAll
MinoritiesAfrican
AmericanNative
American Asian Hispanic
1 Aitkin 1.07 0.31 0.06 1.37 0.16 0.272 Anoka 1.04 0.57 0.26 0.70 0.73 0.793 Becker 1.00 0.97 0.03 5.95 0.23 0.364 Beltrami 0.88 2.22 0.14 14.76 0.30 0.355 Benton 1.07 0.26 0.11 0.38 0.27 0.426 Big Stone 1.08 0.16 0.03 0.34 0.14 0.27
7 Blue Earth 1.05 0.52 0.22 0.21 0.84 0.748 Brown 1.08 0.19 0.03 0.06 0.24 0.499 Carlton 1.02 0.74 0.19 4.14 0.15 0.30
10 Carver 1.06 0.34 0.12 0.22 0.56 0.4511 Cass 0.95 1.47 0.09 9.65 0.15 0.3712 Chippewa 1.07 0.24 0.03 0.19 0.21 0.63
13 Chisago 1.08 0.22 0.11 0.35 0.18 0.3814 Clay 1.03 0.73 0.16 1.00 0.45 1.8815 Clearwater 1.00 0.99 0.03 6.82 0.07 0.1416 Cook 1.00 1.05 0.08 6.40 0.32 0.2417 Cottonwood 1.07 0.23 0.05 0.07 0.39 0.4018 Crow Wing 1.07 0.26 0.12 0.63 0.20 0.34
19 Dakota 1.02 0.83 0.62 0.29 1.01 1.2420 Dodge 1.07 0.31 0.04 0.21 0.23 0.9221 Douglas 1.08 0.16 0.03 0.25 0.21 0.2522 Faribault 1.06 0.42 0.04 0.16 0.21 1.5223 Fillmore 1.08 0.14 0.02 0.19 0.14 0.2924 Freeborn 1.03 0.66 0.02 0.17 0.22 2.61
25 Goodhue 1.07 0.27 0.09 0.61 0.26 0.3726 Grant 1.09 0.10 0.03 0.22 0.12 0.1027 Hennepin 0.92 1.88 2.80 1.25 1.66 1.1028 Houston 1.08 0.15 0.08 0.23 0.18 0.2029 Hubbard 1.07 0.29 0.01 1.60 0.06 0.2230 Isanti 1.07 0.28 0.13 0.51 0.26 0.39
31 Itasca 1.05 0.52 0.07 2.92 0.13 0.3032 Jackson 1.05 0.44 0.01 0.10 0.85 0.7833 Kanabec 1.07 0.25 0.09 0.42 0.23 0.4234 Kandiyohi 1.02 0.76 0.12 0.38 0.18 2.8435 Kittson 1.08 0.18 0.00 0.13 0.11 0.6136 Koochiching 1.04 0.59 0.11 2.40 0.17 0.81

House Research Department February 2001Minnesota’s Racial/Ethnic Groups Page 27
County WhiteAll
MinoritiesAfrican
AmericanNative
American Asian Hispanic
37 Lac qui Parle 1.08 0.14 0.07 0.14 0.17 0.2038 Lake 1.08 0.17 0.03 0.48 0.10 0.3039 Lake of the Woods 1.07 0.25 0.01 0.44 0.18 0.6140 Le Sueur 1.08 0.19 0.03 0.19 0.17 0.4841 Lincoln 1.09 0.09 0.01 0.13 0.06 0.2542 Lyon 1.07 0.33 0.13 0.26 0.27 0.76
43 Mahnomen 0.81 2.99 0.01 21.08 0.05 0.4644 Marshall 1.07 0.25 0.01 0.38 0.07 0.8345 Martin 1.08 0.20 0.02 0.14 0.22 0.4946 McLeod 1.07 0.28 0.06 0.15 0.27 0.7547 Meeker 1.07 0.33 0.07 0.12 0.26 0.9648 Mille Lacs 1.04 0.55 0.08 2.97 0.12 0.40
49 Morrison 1.08 0.15 0.06 0.25 0.09 0.2950 Mower 1.07 0.31 0.09 0.12 0.47 0.5651 Murray 1.09 0.08 0.00 0.03 0.11 0.1952 Nicollet 1.07 0.33 0.12 0.17 0.42 0.6253 Nobles 1.03 0.66 0.10 0.35 1.16 1.0454 Norman 1.07 0.31 0.02 0.85 0.13 0.71
55 Olmsted 1.01 0.86 0.34 0.24 1.81 0.7656 Otter Tail 1.08 0.22 0.03 0.43 0.22 0.3857 Pennington 1.07 0.32 0.04 0.65 0.22 0.6958 Pine 1.03 0.67 0.48 1.52 0.23 1.0859 Pipestone 1.06 0.39 0.02 1.24 0.47 0.3560 Polk 1.01 0.85 0.13 1.09 0.16 2.81
61 Pope 1.09 0.07 0.03 0.19 0.08 0.0762 Ramsey 0.89 2.18 2.17 0.81 2.77 2.2563 Red Lake 1.07 0.23 0.02 0.23 0.03 0.8364 Redwood 1.06 0.35 0.06 1.48 0.11 0.4465 Renville 1.07 0.32 0.02 0.31 0.17 1.0266 Rice 1.05 0.52 0.24 0.28 0.66 0.92
67 Rock 1.08 0.15 0.06 0.29 0.11 0.2768 Roseau 1.07 0.29 0.01 0.90 0.42 0.1669 St. Louis 1.05 0.50 0.26 1.69 0.32 0.4070 Scott 1.05 0.46 0.22 0.59 0.57 0.6171 Sherburne 1.07 0.32 0.19 0.39 0.31 0.5272 Sibley 1.07 0.23 0.02 0.09 0.15 0.78
73 Stearns 1.07 0.30 0.17 0.24 0.41 0.3774 Steele 1.05 0.47 0.07 0.15 0.31 1.5175 Stevens 1.06 0.42 0.25 0.41 0.63 0.4176 Swift 1.02 0.82 0.99 0.97 0.22 1.3177 Todd 1.08 0.13 0.02 0.22 0.13 0.2378 Traverse 1.06 0.42 0.00 2.47 0.21 0.11

House Research Department February 2001Minnesota’s Racial/Ethnic Groups Page 28
County WhiteAll
MinoritiesAfrican
AmericanNative
American Asian Hispanic
79 Wabasha 1.08 0.20 0.03 0.20 0.27 0.3780 Wadena 1.08 0.20 0.03 0.52 0.16 0.3481 Waseca 1.06 0.39 0.26 0.41 0.26 0.7682 Washington 1.03 0.66 0.46 0.40 0.68 1.1083 Watonwan 1.00 0.96 0.04 0.25 0.24 3.9084 Wilkin 1.07 0.25 0.02 0.49 0.21 0.52
85 Winona 1.06 0.41 0.19 0.20 0.63 0.6086 Wright 1.08 0.22 0.06 0.32 0.25 0.3787 Yellow Med. 1.07 0.30 0.01 0.86 0.11 0.65
Source: Population Estimates Program, Population Division, U.S. Census Bureau, Washington, D.C.Internet Release Date: August 30, 2000. Local Source: Minnesota State Demographer, December 1, 2000.
House Research Department