Race as a Moderator Variable in the Prediction of Grade ... more information, please contact...
60
Western Kentucky University TopSCHOLAR® Masters eses & Specialist Projects Graduate School 5-1976 Race as a Moderator Variable in the Prediction of Grade Point Average from ACT Scores: Implications for Course Placement Guidelines Robert Ungarean Follow this and additional works at: hp://digitalcommons.wku.edu/theses Part of the African American Studies Commons , Psychology Commons , and the Race and Ethnicity Commons is esis is brought to you for free and open access by TopSCHOLAR®. It has been accepted for inclusion in Masters eses & Specialist Projects by an authorized administrator of TopSCHOLAR®. For more information, please contact [email protected]. Recommended Citation Ungarean, Robert, "Race as a Moderator Variable in the Prediction of Grade Point Average from ACT Scores: Implications for Course Placement Guidelines" (1976). Masters eses & Specialist Projects. Paper 1827. hp://digitalcommons.wku.edu/theses/1827
Transcript of Race as a Moderator Variable in the Prediction of Grade ... more information, please contact...
Western Kentucky UniversityTopSCHOLAR®
Masters Theses & Specialist Projects Graduate School
5-1976
Race as a Moderator Variable in the Prediction ofGrade Point Average from ACT Scores:Implications for Course Placement GuidelinesRobert Ungarean
Follow this and additional works at: http://digitalcommons.wku.edu/theses
Part of the African American Studies Commons, Psychology Commons, and the Race andEthnicity Commons
This Thesis is brought to you for free and open access by TopSCHOLAR®. It has been accepted for inclusion in Masters Theses & Specialist Projects byan authorized administrator of TopSCHOLAR®. For more information, please contact [email protected].
Recommended CitationUngarean, Robert, "Race as a Moderator Variable in the Prediction of Grade Point Average from ACT Scores: Implications for CoursePlacement Guidelines" (1976). Masters Theses & Specialist Projects. Paper 1827.http://digitalcommons.wku.edu/theses/1827
RACE AS A MODERATOR VARIABLE I N THE PREDICTION OF GRADE
POINT AVERAGE FROM ACT SCORES: IMPLICATIONS FOR COURSE
PLACEMENT GU!DELINES
A Thesis
Presented to
the Faculty 0f the Department of Psychology
Western Kentucky Un iver s ity
Bowling Green , Kentucky
In Partial Fulfillment
of the Requirements for the Oegree
Master of Arts
by
Robert A. Ungarean
May 1976
RACE AS A \IODERATOR VARIABLE I N TilE rnEl1 ICTI ON OF GRADE
POINT AVERAGE FRm! ACT SCORES; I)!PLI CAT I ONS Fon COU RSE
PLACE~IE :IT GUIDE LINES
Recomme nded ( 1.( .' I f ,I, I-
A " / -'. >. > .:j I . '".", /, /// ...... < ! e '"
Director of Th es is
Approved. __ ~/_.~. -_, ~;_' __ ~~~'~&~ ____ __
Acknowledgements
A specia l and sincere thanks goes to Dr. Raymond M.
Mendel, chairman of my thesis committee . His persistent
effort and guidance has bep.n grea tly appreciated.
Thanks and appreciation is also extended to Dr.
John O'Connor and Dr. Ronald Adams, also members of my
thesis committee. Their c ritiq u~ and s uggestions were
instrumentQl in the final revision of this thesis.
A specia l note of thanks goes to Dr. Steven House.
His s'Jpport and cooperation made this study possibJ e .
I would a lso like to thank Faye Abbott for putting
forth the time and effort in typing the final copy of this
thesis.
Finally, and most important, I would like to share my
love and appreciation for the two persons for whom this
thesis is dedicated, Victor and Rose Ungarean. Their
pa tience , understanding, support, and encouragement has
influenced me in many ways.

Acknowledgements
Lis t of Tables
I\bstract ..
Introduc tion
Tabl e o f Contents
L5terature Review and Statemen t of the Problem
Nethod . . . . . . . .
Results and Discussion
Summary and Implica tions
Appendix A
References
iv
Page
iii
v
v i
1
3
19
22
39
41
47
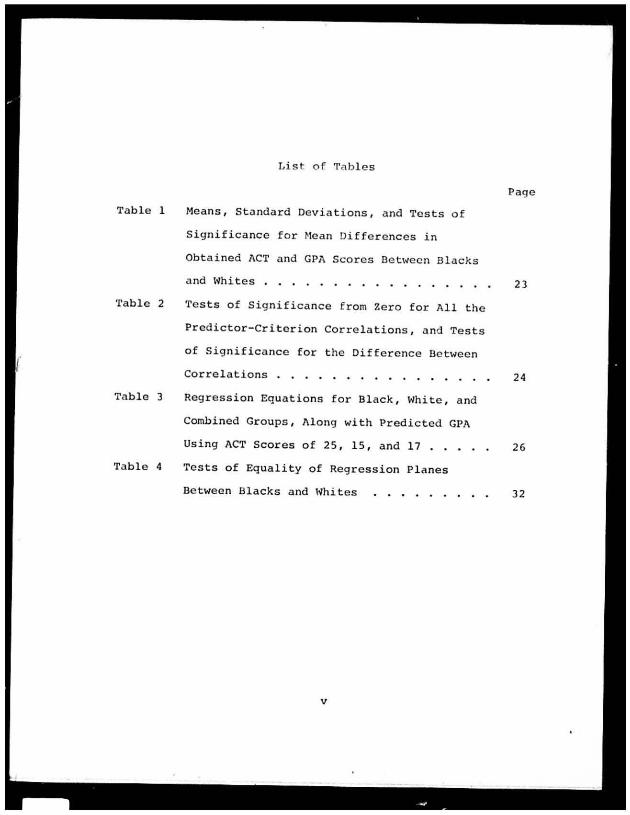
Table I
'l'able 2
Table 3
Table 4
J .. i st of Ta bles
Heans, Standard Deviations, and Tests of
Significance for 1>1ean Differ ences in
Obtained ACT and GPA Scores Between Blacks
and h'hi tes .
Tests of Significance from Ze r o for All the
Predictor-Cr iterion Correlations, and Tests
of Significance for the Difference Be tween
Correlations . . . .
Regression Equations for Black, White, a nd
Combined Gro ups, Along with Predicted GPA
Using ACT Scores of 25, 15, and 17 •.
Tests of Equality of Regress i on Planes
Be twe en Blacks and lihites
v
Page
2 3
24
26
32
RACE AS A MODERATOR VARIABLE IN THE PREDICTION OF' GRJ\DE POI NT AVERAGE FRON ACT SCORES : 1'EST BIAS, DISCRIMINATION ,
AND VALIDITY DIFFERENCES AND THE EFFECT ON PLJ\CEMENT GUIDELINES
Robert A. Ungarea n May 1976 52 pages
Directed by: Raymond H. Ne nde l, J . O ' Connor , a nd R. Adams
Department of Psychology \vestern Kentucky Unive l."sity
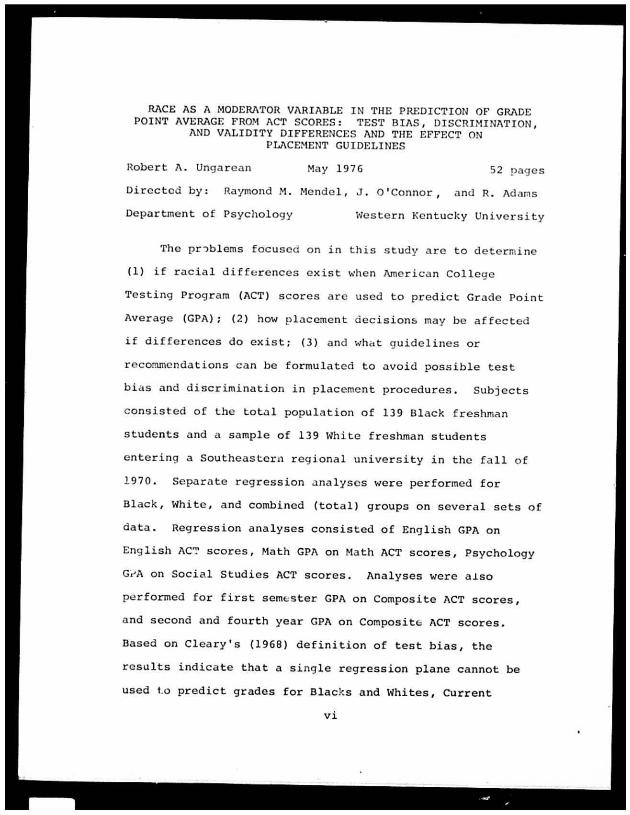
The pr~blems focused on in th is study are to dete rmine
(1) if racia l diff~rences exis t when l\mcrican Col l ege
Test i ng Program (ACT) scores are used to predict Grade Point
Average (GPA); (2 ) how placemen t dec isions may be a ffect ed
i f dif fere nces do exist; (3) and wh .. t guidelines or
recommenda t ions can be formulated to avoid possible test
bias and disc rimi nation in p l acement pr ocedures. Subjects
consisted of the totoJl populat ion of 139 Black freshman
students and a sample of 139 l"1h ite freshman students
e ntering a Southeastern regional univers ity in the fa l l o f
1970 . Separate reg r ession a nalyses were performed for
Black, White, a nd combined (tot a l) groups on several sets of
da t a . Regression ana l yses c onsis ted of En9 l i s h GPA on
Eng lish AC;- scores , ,.la th GPA on Math ACT scores, Psychology
G~A on Social Studies ACT scores. Analyse s were a l so
performed fo r first semes ter GPA on Composite ACT scores,
a nd second and fourth year GPJ\ on CompositE ACT scores .
Based on Cleary ' s (1968) definition of t es t bias, the
r e sults indicate that a sing l e r egression plane cannot be
used t.o predict grades for Blacks and Whites, Current
vi

University placement guidelines were found to place Blacks
in courses where their probabilities of s uccess are lower
than that ot their h'hite counterparts . It is recommended
that a more flexible pl~cement policy be instituted in
order to avoid challenges c.f bias and/or discriminatory
placem~nt practices. It is recommended that individua l
students d~cide whether or not to enroll in a particular
course. This decision is to be aided by updated University
placement guidelines (based on regression equations ) issued
to faculty advisors, a l ong with reference to updated
expectancy tables .
"If you have a n ACT English s t a ndard score of 25 o r
above , you will receive three semester hours of c r edi t i n
English 101 and shou ld r egi ste r for Engli sh 102 ."
"If you e nter the Unive r s ity \Y' ith a high school basic
subject average be low 2 .0, as calcu l ated in the Off ice of
Admissions, and a n ACT compos ite score below 17, you are
required to r egis t er for El emen t ary Education 90 ."
"If your ACT math score i s l ess thar. 15, we strongly
r ecommend that you t r.:. '';' no ma th during yo ur fi rs t semes t er ."
'rhis advice i s c'l.l rren tly being g ive n to beginning
studen t s a t a Southeastern r egional univ€: r sity . Curre nt
guide l i nes rely on the assumed pred ictive va lidity of the
Amer ican College Tes ting Program (ACT) scores (Le nning ,
1975) . These gu ide line s do not , howe ve r, take into
considerat ion the possibility of racial differe nces in the
meaning of these t es t scores as they r e l ate to performance ,
or gr ade point aver age (GPA).
Many e ducational institutions use the technique of
grouping s tuden ts for cour se sectioning on the basis of
r e lati ve ly homogenous abilities , frequen tly measured by
ap titude t e sts (ACT, 1974). A number of factors , howeve r,
may l e ad to the misuse of these tests (differences in mean
predictor and crit" rion scores , \"alidity coefficients ,
1
standard erro r of estimates , slopes and intercepts). I t
May be erroneously assumed that if a test is determined
valid for an entire population, it is also perforce valid
for each subgroup in the population .
Universities use ACT English, Math, Social Studies ,
Natural Science a nd Composite scores for selection a nd
course placement recommendations to students (ACT Technical
Report, 1973). This study is directed toward the deter
mination of the need for differential interpretation of ACT
scores, GPA, and/or validity coefficients, and the impli
cations for p) -:' : ement recommendations. Awareness of the
existence or no nex i stence of racial differences would
facilitate placement r econunendaticns through a correct
interpretation of ACT scores.
2

Litera ture Review
Se l ection dnd placement decisions based on the use of
tests leads to a number of controversial issue~ when
se l ecting and placing both minority a nd nonminority g r oup
members . The major issue, beside \vhe the r or not tests
should be used at a ll, appear s to be whether the same o r
different tests and/or t es t s tanda rds (cutoffs) can or
shou ld be used for minority and nonminority g roup members
(O.;>.c, l, Gr an t, & Ritchie , 1975). Tit l e seve n of the Civil
Right ~ Act of. 1964 foc uses on fair emp loymen t practices
thcough the establishme nt of procedure s to ens ure eq ual
opportunities for individuals r egardless of r ace, Color,
religion, sex, and na tional origin . These fair employment
practices focus primarily on the fair use of tests for
se lection and placement decisions (Ash, 1965 ) . The emphasis
on the fair use of tests for minority and nonminority group
members has given eise to a number of models for assessing
t es t fairness. A d~scription of these models is presented
in the following discussion.
Six conceptual models for assessing test fairness will
be presented. Cleary's (1968) definition of test bias,
which is the prototype for the remaining five models, will
3
be discussed first. An a lternate definition of test fair
ness advance d by Tho rndike (197 1) along with the divergent
i mplications of the two models will be discussed next.
De f i nitio ns and exampl es of the last four models will a l so
be presented in an effort t o emphas iz e th e vari a bility and
conflict wi t hin the di fferen t cont::eptua l mode l s of test
bias. Fina lly, the re will be s u pport and discu~ s ion of
the particular model used for the evaluation of da t a in
this s tudy .
Traditiona lly, Cleary 's (1968) def inition of t e st
bias/(u irness, or some minor v <lrian t of it , has been U":
most widely accepted d e finition within a predict i ve conte~ t
(Li nn, 197 3: Schm .1dt (, lIunter, 197 4). Cl eary' s def initio n
sta t es that:
A t e st is biased for me mbers of a s ubg roup of t he
populat~on if, in the prediction of a criterion
for which the test was desi gned, consistent non
zero e rrors of prediction a rc made for members of
the subgroup. In othe r words, the test is biased
if the criterion score predic ted from the common
regression line i s consiste ntly too hig h or too
low for membe rs of the subgroup. With the
def i nition of bia s, there may be a connotation
of "unfair," particularly if the use of the test
prod'lces a prediction that is too low. If the
4
test is used for selection, members of a subgroup
may be rejected when they were capable of adequate
performance. (p. 115)
Linn (1973) st.1tcs that this definition is consistent with
the conceptualizations of Bartlett and O 'Leary (1969).
Einhorn olnd Bass (l971). Guion (1966), and Linn a nd Nerts
(1971). 1\150, it has served as a theoretical basis for
other empirical studies such as Pfeifer and Sedlacek (1971),
and Temp (1971).
Thorndike (1971) has advanced an al ternate definition
of test bias, o r its compliment. test fairness. A test is
considered fair only if, for any given criterion of success,
the test admits or selects the same proportion of minority
applicants that would be admitted or selected by selection
on the cri terion i tsel f, or on a perfectly valid test. (1 t
shou ld be noted that tests do not admit or select. It is
the way in which tests are used that is refe rred to here.)
If 50 % of group A arc s uccessful and 80t of group Bare
successful, the proportion of group A members sel ected to
those from group B should match the 50:80 success ratio.
Schmid t and Hunter (1 974) have analyzed the divergent
implications of the Cleary and Thorndike definitions.
Cleary's definition is more advantageous for selection
from the institutional point of view. Selecting institu
tions are assured of the selection of those applicants
with the highest predicted criterion scores on the basis
5
of a vailable predictor variables . Thorndike ' s mode l , on the
other hanrl , proposes a kind of fair ness appropriate from
the applicant' s viewpoint. As stated by Schmidt a nd Hu nter
(19 74 ) :
'rhe Cl eary defi nition insures tha t the average
performance l eve l of se l ectees will be maximized.
College students , workers or. management t rainees
selected under the Cleary definition will , on
the average , show h igher l W'e l s of performa nce
than Lho se se l ec t ed using th e Thorndike definition.
Conversely , use of the Thornd ike def ini tiop ~eans
I:hat certain majority app l icants wi l l be r ejected
in favor of minority app licant s with lowe r statisti
cal p roba bilities of s uccess on t h e criterion -
a situa tion that would be considered reverse
d isc rimination by many . (p. 6)
Another mode l of se 1~c tion bias is the quota mode l
(Col e , 1972). This mode l simply st3 tes a priori, "that
fairness lies in some specified proportiona l represe ntation
(p. 1)." As an example , the quota might r equi re that the
p roportion of minority group employed match the proportion
of minority members in the popUlation. The dis tinction
b e tween the Thorndike and q uota model is that when using
the Thorndike mode l onl y the pe rce ntage successful from
each group a re admitted. When using the q uota model , the
percentage of minority members desi r able is determined , a nd
6
selec tion i s the n based o n t hi s propor tion. Thi s mode l
may admit pot entially uns ucces sful mi nority g roup members
at the expense of exc luding potent i a lly s uccess ful ma j ori t y
group member s .
A fourth mode l is offered by Da rlington (1971), which
is comprised of four separate definiti ons . The f irst two
para lle l the Clea ry and Thorndike definitions . The third
definition utilizes a combi nation of the r egress ion mode l
(Cleary I 5 def inition) a nd socially detenll : ned va lue judge
ments made in the qU.Jta mode l (Co l e , 1972). For examp l e ,
.: popula t ion consists of 20 t minority g roup members . Thp
quo ta then reql1i r cs that 20 \ of the work force be made up
of the minority grou~ . Based on a r eg ression equation, the
top 20% of mi nority applicants wou l d be chosen , even thoug h
not al l indiv i dua l s would be predicted to be successful
(meet requir(~d .:utoffs). The third definition, howe ver,
has a conc eptual problem which involves the causal r e l a tions
among ethnic group membership, ~Li lity (test score), a nd
performance (c riterion score). The definition requires
that performance be assessed at a later time than when the
interaction of ethnic g roup membership and ability is
assessed. Thus, later performance would be caused by
caLlier variables of ability and e thnic group membership.
The interactions of all three var iables should be assessed
at the same t ime . This definition has received little
attention in the literature due to this conceptual problem
7

(Schmidt & Hunter, 1974). Dolrlington's I tlst defi niti o n
s tipulates that a t cst i s fair only if it shows no mean
predictor score differences be tween population s ubg roups
(Cole , 1972; Linn , 1973).
Col e (1972) a l so me ntions t he emp l oyers mode l wh ich
utilizes Guion ' s (1966 ) definition of t~st bias. A dis
tinction betwee n fair and unf a ir test discrimination foe
sel e ction purposes i s made . "Un fl ir discrimina tio n ex ists
wheh persons with equal probabilities of s ucc ~ss o n the
job have unequa l proba bl.lities of being hired for: the job ."
Fai": i iscrimination exists whe n individuals with l ower
probabil l~ ties of s~ccess o n the job have lowe r probabili ties
o f being sel ected for t he job .
8
A sixth and l as t conceptual model, t he equal opportunity
model , is consider ed next . \'lhen the distribution of a
predictor a nd a criterion of success are known through
pas t expe ri e nce , the probability that a potentially success
ful applicant has of be ing 3elected given a fixed s election
procedure can be computed. Unfairness i s then eliminated
by giv ing members of differe nt groups who achieve a pre
dicted cri te rion score above a criterion cutoff equal
probabilities of selection. If a predictor cutoff is set
so that the probability of being selected when potentially
s uccessful is de fined as .80 for one group, then the pre-
d~ c tor cutoff f(lr the other subgroup must be set to give
the samc conditional probability (Cole , 1972).

The main contribution made by the f ormula tions of
Cleary (l~ 68 ), Col e (1972). Darlington (1971) , Guion (1966),
and Thorndike (1 971) i s to emphasize that there is more
th~ n one reasonabl e definition of test bias/fairness a nd
that the s e defini tions a r e in confl ict (Linn , 1973). The
quota and Da rling t on models p l ace va lue j udgements (based
on social values) favoring some g roup in the popu l a ti on,
above the importa nce of performance on the criterion. If
socia l pressure dictates that mote minority membe r s be
selec t ed . t ile req uired quo t a of mi nority group members lTlay
be changed accordingly. If the populat ion c0 "1 5i"il~s of 20 i
minority group members, the quota model may r equire that
9
20\ of the work force be compri sed of minority g roup membe rs.
This procedure may admit all minority members until th e
q uota has been filled . The Darlington mod e l admits 20 \ of
the highest scoring individua l s, based upon the r eg r ession
equation. Both procedures may admit low scoring minority
group membe rs e xcluding higher scoring majority group
members.
The Thorndike and equal opportunity models require the
specification of predictor cutoffs. The Thorndike model
r equires that the percentage successful for two groups,
above a predictor cutoff, be selected on the basis of the
established success ratio . The equal opportunity model
spe(:ifics that equa l proportions of successful individuals
from both g roups above a predictor cutoff be selected.
In both cases, bias may occur as a resu lt of the establish
ment of predictor cutoffs. Typically, minorities scor e
l ower on the test and therefore may have a n unequal oppor
tunity in selection (ACT , 1972).
The employer ' s a nd regression mode l s a re concer ned
primarily with s uccess on the crite riv n . The former model
a llows the employe r to set the l evel of ri~k assumed in
selection. Based on t he regression equation, only those
individuals who achieve scores ahove a certain l evel of
10
risk (cutoff) are selected. Minori t y groups may be adversely
.t ffected because of lower obt aine d predictor scores. The
regression model , however, establishes separate equations
for subgroup~ when necess a ry (equations significant l y
different) a nd establ ishes diffe rent predi ctor cutoffs to
predict equa l l evels of success on the criterion. This
mode l s e l ec ts the most potentially successful from each
subgroup.
Cole (1972) and Humphreys (1973) conclude tha t the
most c ommonly used selection procedure is the regression
mode l. The r eg r ess ion model applied to placement decisions
based on ACT scores wou l d maximize the number of correct
p l acement decisions by e liminating errors in the interpre
tation of t es t scores. The flexibility of this procedure
enables predictor a nd criterion cutoffs to be established
50 that similar information can be derived between predictor
and c rite rion relationships for both subgroups. Tests of
11
the signi ficance of the differences in slopes , intercepts ,
a nd standard error of estimates determines if the same
pred i ctor score has the same meaning for two groups (Campbell,
Pike , & Faugher, 1969). For example , is the predicted
c ri te rion score from identica l predictor scores t he same
for Blacks a nd whites? Testing for s tatistically signifi
cant differences between slopes of the regression lines
indicates if the tests predicts equal l y well for two ethnic
groups (Campbell, et a l. , 1969). Differences i n .;ntercepts
would indicate r acial differences on the criterion (Blacks
or Whitc~ pcor ing higher ) . Testing the s tandard error of
es timate~ indicates if there are differences in the average
error in prC!oicting GPA for 8lacks and h'hites.
When inter preting tests for selection a nd / or placement
purposes , the concept of test discriminat ion must also be
considered. The distinction betHeen t est bias/fairness and
discr imina tion is that t est bias r efers to some Clla r ac t e r
istic (culture-bound) of the t est itself, while discrimina
tion refe r s to the way in which the t est is used. Test
discrimina tion, however, has incorrectly been cha rged solely
on the basis of systematic (mean) differences in test scores
between c l early defined g roups (Einhorn' Bass , 1971).
Anastasi (2968) pointed out tha t this de finition is un
satisfactor y because a ny variable is likely to show some
differences between ulmos t any specified groups. Also,
s uch evidence does not necessarily imply test discrimination,
12
but rather that d ifferent underly ing factor s (cu ltural back-
ground , educat j .... n .' ~ .Jl-portunitie s , a ttitudes) may be .. . " responsibl e for s c ore differences between g roups . An as t as i
(196 8) , and Kirk pa tr ic , Et.;e n, Ba rre tt, and Katzell, (1 968 )
offer definitions of t est discrimination which are s imila r
to each othe r. Test discriminat ion is (~efi n~d as consistent
over o r undcrpredic t ion of criterion meas ures . Tes t
discrimination refers to cases i n which c riterion score!:i
are inappropr iate l y or incorrectly predicted by tests for
members of a pa rticular group. Tes t discrimination ca ll
then be said to r efer to the way in which tests are used
(or misused) in dec i sions , rather than to some c harac t er-
istic of the t es t itself (Einhorn & Bass , 1971).
It may a ppear that this discus s ion is similar to the
discuss ion involving the regression model . The diffe rence
lies in the fact that the regression model is applied in
the determination of t es t bias. Discrimination refers to
the way in which t ests (biased-unbiased) are used. A tes t
can be biased but still used correctly.
The concepts of bias/fairness, and discrimination also
appl y to the c riterion measure itself, quite apart from any
questions concerning the legitimacy of tests which might be
used to predict the performance criterion. Of major concern
to test validation research is the appropriateness or
relevance (contains elements of true performance and excludes
irrelevant e l ement.s) of the criterion measure.
13
Consideration of this issue in a n educa tiona l setting forces
us to examine the snurces of variance in g r ades assigned by
instructors. Instructors may diffe rentially grade members
of subgroups (or reasons other than achievement of different
levels of performance. Subjectivity of the criterion
(grades) may include a number of factors such as type of
t es t (essay vs multiple choice) , type of instructor (au to
cratic, democratic) , type of instruction (lecture , discus
sian), type of student (dependent, indepe nj ent), and r ace
of either professor 0r student . Studies indicate that the
1 ~ .. , of subjective criteria l eads to a meaningless ana l ysi~
oC tefi t fairness and/or test va l idi ty when the question of
criterion va lidity i e not addressed (Boehm , 1972: Bray &
~toses, 1972; Cleary , 1968; Guion, 1966; Kirchner, 1975; Temp,
1971; Thorndike, 1971). Boehm (1 972) and Fincher (1975)
suggest that more careful attention be given to the choice
and development of the criterion.
The relevancy of grades as a criterion measure can be
deduced from the rationale that if performa nce is a function
of ability , and ability is commonly measured by aptitude
tests, then scores on these tests relect the level of
performance expected from individuals. Cleary (1968),
Kendrick and Thomas (1970) I Linn and Werts f197l), and
Stanley (1970 as cited in Borgen, 1972) reflect the relevancy
of grades by showing that aptitude measures could predict
grades for Blacks in predominantly white and black colleges
14
as well as they do for h'hit cs . In some instances over
prediction instead of the anticipated undcrprediction of
actual grades occurred. It s hould be noted , howe ver, that
this situation may indica t e that both predictor and criterion
are equa lly biased.
Once the relevance of the criterion has been estab
lished , attention s hould focus o n the usefulnl.!ss of the
predic tor. In the present con t ext , support for the ACT
scores as a valid predictor of GP~ j~ presented by Lenning
(1973, 1975) , a.ld Pete rs and Plog (1961). Their studies
sho\';ed that the J\CT tests were at least as efficient pre
dictors o f college overal l r,PA as other apt i tude meas ures .
Zimmerman (1974 j found that final grades in an introductory
psychol ogy course correlated significantly with ACT scores.
Munday (1964) found tha t grades for socially disadvantaged
s tude ntR ace generally as predictable as grades for other
students us ing standardized measures of academic ability.
Tests may be culture-bound but still are useful predictors
whe n interpre t ed correctly .
Although numerous studies ind icate that for some
criteria the same predictors are valid for Blacks and Whites
(e . g. Kendrick & Thomas, 1970; Linn & lV'erts, 1971; Pfeifer
~ Sedlacek, 1971), other studies indicate that these pre
dictor criterion relati("'nships may become clearer if

differential prediction , o n the basis of race, is utilized
(e . g . Borgen, 1972: Cleary , 1968 : Lopez , 1966 : Pfeifer &
Sed l acek , 1971 ; Temp , 197 1) .
15
Bar tlett and O'Leary (1969) have presented cleven
diffe r e nt models representing the inte r action be t "/een raci a l
g r oups and v ~,lidity. Some of the above mode ls pr esent
situations whe r e ciffe r e nces in mea n predictor or c riterion
sco~es exist fo r two groups, but no diffe rence e xists in
the valid ity coef ficient s . 1'\..'0 g roups may have equal
va lidity coef fi c i ents and equa l predictor (cutoff) sco r es ,
but have significa ntly diffe r. ent c riter ion s cores . l\n
e xamp l e of thi s si tuation is whe n both groups obtain mea n
l\CT Ma th scores of 15 and equal va lidity coef ficients of
.38, but GPA pe r formanc e is 1.5 fo r one group and 2.2 fo r
the other. According to Univers ity guidelines it would be
recommended to all students that no math be taken during
the first semester . As can be seen, a score of 15 has
d ifferent predicted performance leve l s for the two g roups
and thu s , use o f the scores in this manner would be
consider ed discriminatory. Diffe rent predictor cutoffs
should be used in order to obtain equal predicted levels of
performance on the criterion.
Another possibility which may occur i s where the
validity coefficients and criterion scores a re similar, but
Significant differences between the predictor scores are
found. An example of this situation would be whcl.'e eq ual
16
validity coefficients of .30 and equal mean GPA scores of
3.0 are obtained by both groups I but one group has a me an l\C'r
English score of 21 and the other 25. !\ccording to Univer
s ity guidelines , only the group tha t obta ins 25 will "receive
three semester hours cred it for English 101 and can s~<Jn up
for English 102." I\s can be seen , different l\CT scores arc
related to the same level of performa nce. The group with a
mean 1\C1' English score of 21 should also receive credit for
English 101 and r ~giste r for English 102. Doth of the a bove
situations indicate a need for differential prediction.
Another situation described b~' the Bartlett-O'Leary
models is that of differentia l va lidity. Differential
validity refers to the situation where validity coefficients
for two groups are significant ly different from each other,
and both coefficients are nonzero. Even though mean CPA
and ACT scores may be equal for Blacks and \<lhi tes, a
significant difference between correlation coefficients
indicates a need for differential prediction on the bas is
of race. The test could be used as a good predictor for
both groups if these differences are taken into consider
a tion . This si tuation can occur due to real differences in
correlations or due to the presence of statistical arti
facts (small sample size, large differences between s~mple
sizer subjective criteria). The problem is to decide which
situation exists and how it affects findings of differential
validity.

Doelun (1972) and Schmidt , Dre ner , a nd lIunter (197)
dJstinguish sing l e-g r o up validity f r om different ial
valid ity . Si ng l e - g r oup va l idity refer s t o the s itua t ion
where the va lid ity coeff i cient for one g roup i s signif i
cantly differ e n t f r om zero but not significantly different
f r om the va l idity coefficient of the second g roup. 'rhis
s itua tion can a l so occur due to cQal d i ffe r e nces found in
the corre l a tions or due t o the presence of statistical
artifacts. Aga in, the p:·oblem is to decide which s ituation
e xists a nd what i nflue nce it ha s upon findings of single
g roup validity.
Hi t h the publi ccl tion of the Lopez (1966) study , which
was the f irs t solid demonstration of differenti a l v a l idity ,
researchers in t he area shifted thei r attenti on to the
es tablishment of the existe nce or non - e xistence of dif
ferenti a l validity . Some studies indica t e that the
e xistence of differential validity is a r ea l occurrence
(Fox & Le fkowitz, 1974; Lefkowitz , 1972; Ruda & Albrig ht,
1968; Toole , Gavin, Murdy, & Sells, 1972) . Other s tudies
indicate that findings of differential validity are only
artifacts of smal l sample size , large differences b e tween
sample sizes, and use of subjective criteria (Boe hm, 1972;
Grant & Bray, 1970; Kirchner , 1975: Temp, 1971). If the
effec ts o f these artifacts are taken into consideration in
t h e statistical analysis of research findings , more
instances of s ingle- g roup validity, and fewe r cases of
17
differentia l validity are likely to occur (Boehm, 1972;
Fincher, 1975; Temp, 1971) . However, the existence of
true single- group va l idity is questioned by O' Connor,
\iexley, and Alexander (1975) and Schmidt et al., (1973).
Their results demonstrate that single- group validity may
also be an artifact of sample size.
18
'l'emp (1971) suggests that assumptions about differential
validity or l ack of it for Blacks and Whites shou l d be
routine l y studied at individual institutions . Al so the
possibility of test bias, discrimination, and validity
differences should be '-·::msidel:ed when evaluating tests.
The problems focused on in this study are: (1) to determine
if racial differences do exist when ACT sc ores are used to
predict GPA ; (2 ) how placement decisions may be affected
if differences do occur ; (3) and what g uidelines or
recommendations can be formulated to avoid possible test
bias and discrL~ination i n placement procedures.
Method
Subjects were the total population of 139 Black
freshman and a sample of 139 randomly selected \V'hite
freshman entering a Southeastern regional univer s ity in the
fall of 1970. Forty-one percent of the Black popu l ation
and fifty-two percent of the \-.'hi te sample consisted of
males.
Predictor measures from each s ubject consisted of
Eng } . sh , fola l-h , Social Science, Natual Science. and Composi te
ACT scor·os. These measures were typically obtained through
administration of the t e st, by gu ida nce counselors, to
students in their l as t semester of high school. The
reliability of the tests range from .85 to .96 (ACT, 1973).
Reliabilities were computed on samples from regular national
test centers. The sample sizes range from 981 to 1,001
(ACT, 1973).
Criterion measures consisted of entry level course
g rades for English, Hath, and Psychology. First semester,
second and fourth year GPl\ were also included as criterion
measures. All of the above data were obtained through the
regis~rar's office.
l\nalysis
Separate regression equations were computed for Blacks
and Whites, along with the combined regression equations,
19
on several sets of data. The reg ression ana l yses consisted
of English CPA on English ACT; Math CPA on Math ACT;
Psychology CPA on Social Studies Ae'l'. Equations were also
obtained for first semester CPA on Composite ACT , second
20
year CPA on Composite ACT, and fourth year CPA on Composite
ACT . 1\11 analyses were perfor med \V'ith the us e of the
StatisticQl Packa~c for the Social Sciences (SPSS) reg ression
program (Nie , Hull, Jenkins, Steinbrenner, ~ Bent, 1975).
Corre l ation coefficients were tested for significance
from zero, indicating the direction and magnitude of
r e l ationships between predictor a nd criterion measures for
.:: .~~h s ubgro up. Determination of the existence of dif
fer tmtia l validity was performed by direct comparison of
L o~ rela tion s in Black and White groups (Humphreys , 1973).
Direct comparisons were made using a method indica ted in
Snedecor and Cochran (1967, p. 186). This method converts
each correlation to a Z score , then the test of significance
of the di fference is between the two ZI S • The test i s
completed by calculating the ratio of the difference of the
Z' s to the standard error of this difference. The dif
ferences in me an p~edictor and criterion scores between
groups was, in each case, tested by the t-test for indepen
dent groups. In order to investigate if a single regression
plane can be used to predict GPA for both subgroups, the

slopes intercepts, and standard e rror of es timates were
sequentially tested f or s ignifica nce (Ke rlinger & Pe dhazur,
1973. pp. 233-239) .
21

Results ~nd Discussion
Tabl e 1 shows the means, standa rd deviations , a nd tests
o f s i gnificance fo r mean differences in obtained GPA and
ACT scores between Blacks and \<Jh ites. The mean differences
in GPA and AC'l' scores indica t e Lhat \oJhites obtain s i gn ifi
cantly higher scores than Blacks o n bot h va riables.
Typica lly , Blacks a r e expec t ed to score l ower on tes ts but
pr. rform equa lly we ll on the criterion measur e (ACT , 1972).
As Anastas i (1968) po inted ou t , however, these differ ences
may occur as a res ult of different underlying factors such
a~ cu I tura l background, educa tiona l opportuni ties, ':lIld
att itudes . 1\11 of the diffe ren ces between Bl acks and Nhites
o n obtained mean GPA and ACT scores are s i gnificantly
different from each othe r. The test shows systematic
ACT- GPA r c l ationzh ips fo r bo th groups. The t es t would,
therefore , be a useful instrume nt for the se l ection and
p l acemen t of Black and l'lhite students if diffe rences in
GPA and ACT scores are taken into consideration. Precise l y
how these d i ffe r ences ought to be used is considered l a ter.
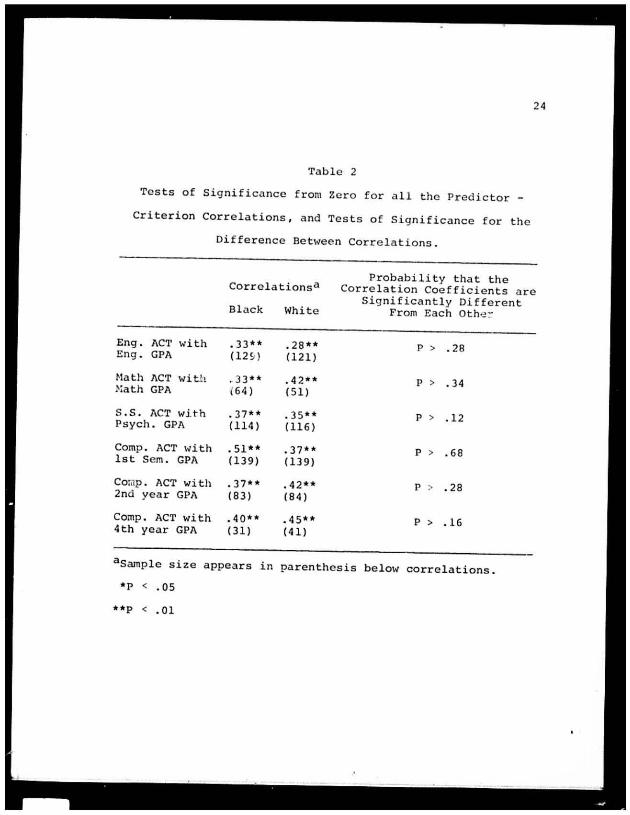
Tabl e 2 shows the tests of significance from zero for
a ll the obtained predictor crite rion corre lations for both
g roups, and the tests of significance for the difference
be tween corre lations. All of the correlations for both
22
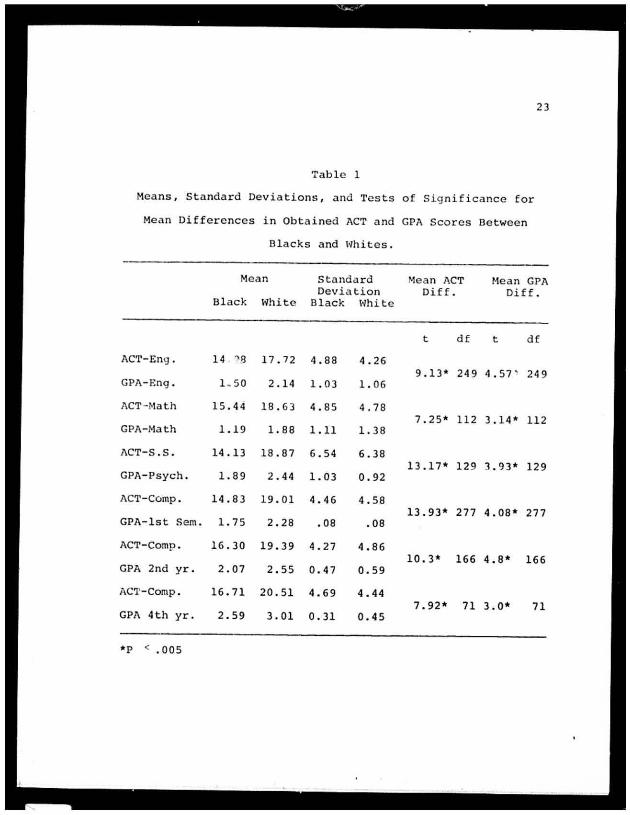
Table 1
Mea ns, Standard Deviations, and Tests of Sig ni f icance for
Mean Differences in Obtained ACT and CPA Scores Between
Blacks and 11hites .
Mean Standard Mean AC T Mean CPA Deviation Diff. Dif f .
Black \ihitc Black White
t df t df
ACT-Eng . 14 . "',9 17 . 72 4.88 4.26 9.13* 249 4.57 ' 249
CPA-Eng. 1 .. 50 2 .14 1. 03 1. 06
ACT - Math 15.4' 18. 63 4.8 5 4.78 7.25* 112 3.14* 112
GPA-~!ath 1.19 1. 88 loll 1. 38
ACT- S . S . 14 .13 18.87 6.5 4 6.38 13.17' 12 9 3 . 93* 129
GPA - Psych. 1. 89 2.44 1. 03 0.92
ACT - Comp . 14 .83 19 . 01 4.46 4.58 13.93 • 277 4.08* 277
GPA-1st Sem. 1. 75 2.28 .08 .08
ACT-Camp. 16.30 19.39 4.27 4.86 10.3* 166 4.8* 166
GPA 2nd yr . 2.07 2.55 0.47 0 . 59
ACT-Camp . 16.71 20.51 4.69 4 .4 4 7.92' 71 3.0* 71
GPA 4th yr . 2.59 3.01 0.31 0.45
'p < .005
24
'rable 2
Tests of Significance from Zero for all the Predictor _
Criterion Correlations, and Tests of Significance for the
Eng. AC1' """ith Eng. GPA
f>tath ACT with ~:ath GPA
5 .5. ACT with Psych. GPA
Compo ACT ,.,.ith 1st Scm . GPA
COr.1p . ACT with 2nd year GPA
Compo ACT with 4th year GPJ\.
Difference Between Correlations.
Correlationsa
Black White
.33** . 28** (12~) (121)
.33** .42** (64 ) (51)
.37** .35** (114) (116)
.51** . 37** (139) (139)
.37** .42** (83) (84)
.40** . 45** (31) (41)
Probability that the Correlation Coefficients are
Significantly Different From Each Oth~=
P > .28
P > .34
p > .12
P > .68
P > .28
P > .16
aSamp1e size appear s in parenthesis belo, ... correlations.
*p < .05
**p < .01
25
Black and White g roups are signi ficant ly different from
zero. Tlli s finding can be appl ied to the r esearch on t he
support or nonsupport of the existence of single- group
validity. 'rhe defini tion of s ing l e - g r o up validity s tates
that the validity coe ffi c i e n t fo r o ne group is signi fi cantly
di ff e r en t from zero but not significantly differen t from
the validi t y coefficient of the second g roup (Boehm , 1972;
Schmidt e t a1., 1973). As can be seen then , the ex i s t ence
of sing l e - group validi t y is not suppor ted in these datn
since a ll correlations are significantly c iffe r ent from
zero. These f ind ings ' -e con~jstent with those of O' Connor
e t a1. (197 5) and Schm.'Ld t t~ t a l. (1973).
The t e sts of signific~nce for the differe nce between
corre lations can be applied to the findings on differential
validity. Differential validity requi res that the va l id ity
coefficients for Blacks and White s be s i gn i fica ntly d if
ferent from each o the r (Ba rtlet t £. O'Leary, 1969). Table 2
i ndicates that none of the coeff icients are significantly
different f rom eac h other. The da ta does not support the
ex~stence of differentia l validity. These findings are
consiste nt with the r esults of Boehm (1972), Fincher (1975),
Grant a nd Bray (1970), lIumphreys (1973), Kirchner (1975),
and Temp (1971).
Tabl e 3 pre sents the obtained regression equations
for Blacks, \<Ihites, and combined g roups on English, Hath,
Psychology , fi r st semester, seco nd and fourth year GPA's.

Table 3
Regression Equations for Black, White, a nd ,:ombined Groups, along with Pr edicted GPA Usi ng ACT Sc ores of 2 5 , 15 , and 17.
R2 5 t. e rro r F P Predic t ed ACT of es t . GPA Score
Eng- GPA Black yE . 45+.07(ACT Eng . ) .11 0.98 1 5.78 . 01 2.20 Cow ined y= .45+. 08(ACT Eng.) .13 1. 02 38 .4 8 .01 2 .45 25 White y= .90+ . 07 (ACT Eng. ) .08 , . 02 10.29 .01 2.65
Math GPA Black y= .01+.08(ACT I'.a t h) .11 LaG 7. 68 .01 1. 21 Combined Y=- .3 3+.11(ACT Math) .18 1.16 25.26 . 01 1. 32 15 White y = .3 9+.1 2(ACT t1ath) . 18 1. 26 1 0.70 .01 2.19
Psycho l ogy GPA Black Y=1. 06+ . 06 (ACT 5.5.) .14 .96 18 . 00 .01 2 . 08 Combined Y=1.14+. 06 (ACT 5. 5 . ) .18 .92 49.54 .01 2. 16 17 White Y~ 1. 50+.05 (T.CT 5.S. ) .12 .8 6 16.28 .01 2.35
1st Semester CPA Black ¥= .46+ . 09(ACT Com? ) .2 6 .66 47.50 .01 1. 99 Combi ned ¥= .55+.09(ACT Comp) .26 . 73 95 .1 9 . 01 2.08 17 White Y= .95+.07(ACT Comp) . 14 .80 22 . 34 . 01 2.14
2nd Year GPA Black Y=1.42+ . 04 (ACT Comp ) . 14 .44 12.63 . 0 1 2 .1 0 Combined Y=1. 28+.06(ACT Comp) .23 .52 48.26 .01 2 .30 17 White Y=1. 56+.05 (ACT Comp ) . 18 .54 17 . 51 . 01 2.41
4th Year CPA Black Y=2.14+.03!ACT compl .16 .29 5 . 58 .05 2.65 COIflbined Y=1.ga+'8~ ACT comg .~8 :IS 2~.75 ' 81 ~. 7 8 17 Whl.te Y=2. +. ACT Com • 0 .70 . 1 .76 ~
'"

Also, t he predicted GPA's from the r egress i on equations fo r
al l groups a rc r eported . It shou l d be noted here that the
combined regression equa tions are mis l ead ing because they
are based on equa l number s of Blacks and Nhites . Of the
total enrollment, approx i matel y seven and one half percen t
are Black, a nd of a ll the students e nteri ng the University
i n the fall of 197 0, only s ix percent were Black. If
cun:ent placement guide lines arc based on the t otal g roup
per formance , a nd the majority of the total group is t\Thite,
then the total (combined) group eq ua t ion would essent iall y
be the same as the White equa tion. 'fherefore , i n the
fol l m·dng discussion , differences between BlaCk and Nhite
~qua tions will be addressed in order to illustrate any
racial differences in l\CT-GPA relationships .
A current guideline indica tes that "al l students who
obtain an ACT English score of 25 or above \tIill receive
three semester hours c redi t in Eng lish 101 and should
register for English 102." It should be noted tha t the
cutoffs us ed in the p lacement guide lines \'lere determined
27
by separate d~partments within the University. Specific
depar~lental procedures for determining cu t offs could not
be obtained. \'1hen the English ACT score of 25 is inserted
in the r egres:iion equations for Blacks and l'lhites, different
grades nrc predicted for each group. Nhites are predicted
to obtain a 2.65 and Blacks are predicted to obtain a 2.20.
Blacks must then obtain an Eng lish ACT score of 31 in order

to have a predic ted Eng lish g r ade equiva l ent to that of the
ma jority group (2.65). As can be seen , substantial over
prediction of grades for Blacks occurs. Whe n fo llowing
current guide lines , Blacks obtaining F.nglish ACT scor es
be tween 25 and 30 would be p l aced in udvanced English
courses but expec t ed tv perform more poorly than \V'hites.
Based on Cleary ' s (1968 ) de finition of tes t bias,
which states that a "test is bia sed i f the criterion sCOre
predic ted from the cornmon r eg ression line i s consistently
too high or too l ow fo r member~ of the subg r oup ," the ACT
would be considerer. biased when predic ting g rades for
Blacks when us ing tile same r CCJression equation. The t es t
systematically overprcdicts g r ades for Blucks, a finding
which r ef lects che need for periodic eva lua tion of current
University placement guide lines .
28
The above situation is the converse of what is normally
expected . Typically , Blacks would be expec ted to SCOre
lowe r on the test but perform about as well as other groups
on the criterion (ACT , 1972) . This study indicates, however,
that Blacks need to score higher on the ACT so their
probability of s uccessfully compl et ing the course will be
equal to the probability of the majority group. In other
words , the current pJacement po licies are placing Blacks in
courses wher e they have significantly lower chances of
succes s than their White counterpart.
The second p l acement guideline requires en r ol l ment
"in El ementa r y Ed uca tion 90 i f a n ind i vidual has a h i gh
school GPJ\ be l ow 2 . 0 a nd an J\CT Composite score bclmv 17."
J\n evaluation of this g uideline ca n be approached by
exami ning differences in predicted GPJ\ a t the e nd of the
first semester. l\n ACT Con,posite score of 17 p redic t s
a firs t semester GPl\ of 2.14 for \ ... h ites and a 1 . 99 for
Blacks. In order to have a p redicted GPl\ equa l to that
o f the majority g roup (2.14), Bla cks must obtain an ACT
Composite scor e of 18. Aga in, ove r predic tjon of grades
occurs for Blacks. Th; ~ findh.q indicates that if Bl ack s
are p l aced in advanced Cour ~;es their success rates may be
l ower than that of Nhites . The test can be cons i dered
biased , and if used following current gu i delines may
unfa irly discriminate against Blacks . Althoug h it should
be noted t ha t the differences jn p r ed icted GPA her e are
r e l ative l y small and , t hus , the d iscriminatory impact
relativel y minor.
A third placement g uide line denies e nrollment "in
rna t ll courses the first semester if the obtained ACT Math
scor e is below I S . " Based on the regression equations in
Tabl e 3 , an ACT !-tath score o f 1 5 p redicts a math grade of
2.19 foe Whites and a 1.21 for Blacks. Blacks must obta in
a Ha th ACT score of 27 if a math GPA of 2.19 is to be
p redicted from this score. It can be seen that the same
test score does not predict the same grade for both groups .
29
Ovcr p r edic ti o n of grades a l so occu rs when u s ing t h i s guide
l ine . It should be noted thc1t t he dif f erence in p r cc'iictNl
GP~ for the t wo groups is fai rl y l a r ge , and t hat t he
poss ibi l i t y of test bias a nd discr i minat i o n is s tro ng l y
i nd ica t ed he r e .
Th ese t re nds are also supported in the rema in i ng sets
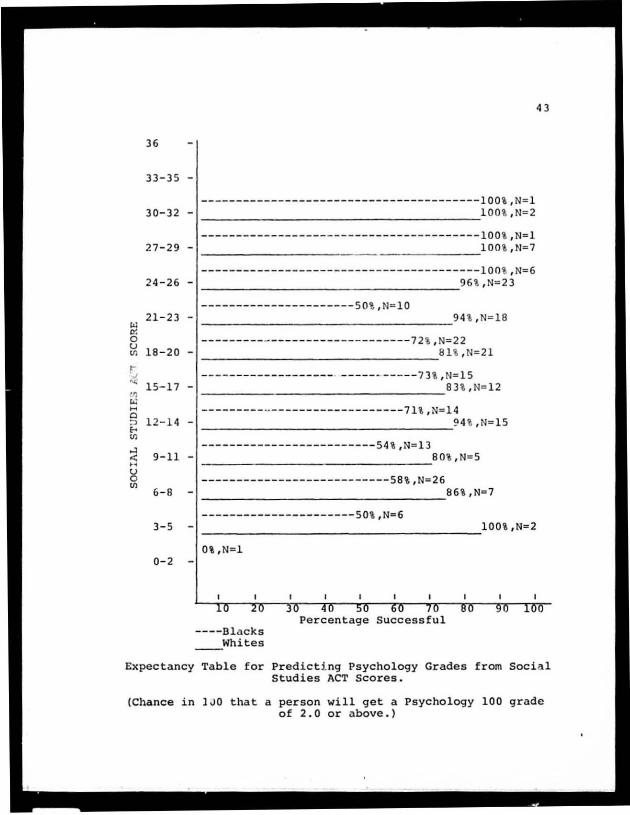
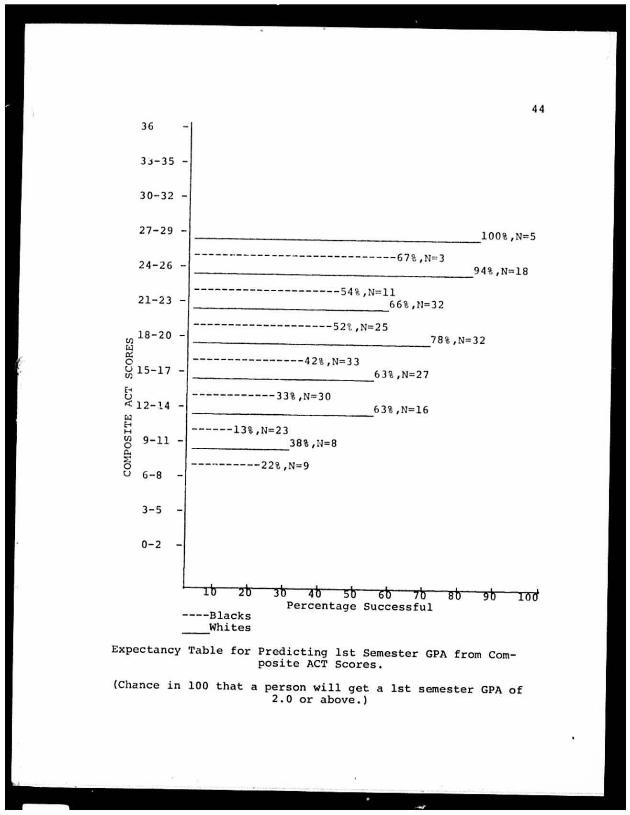
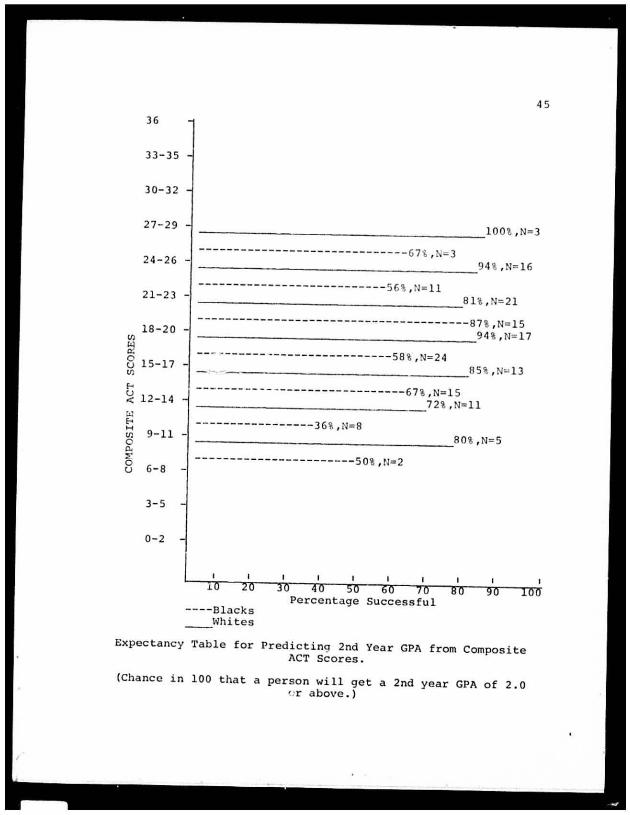
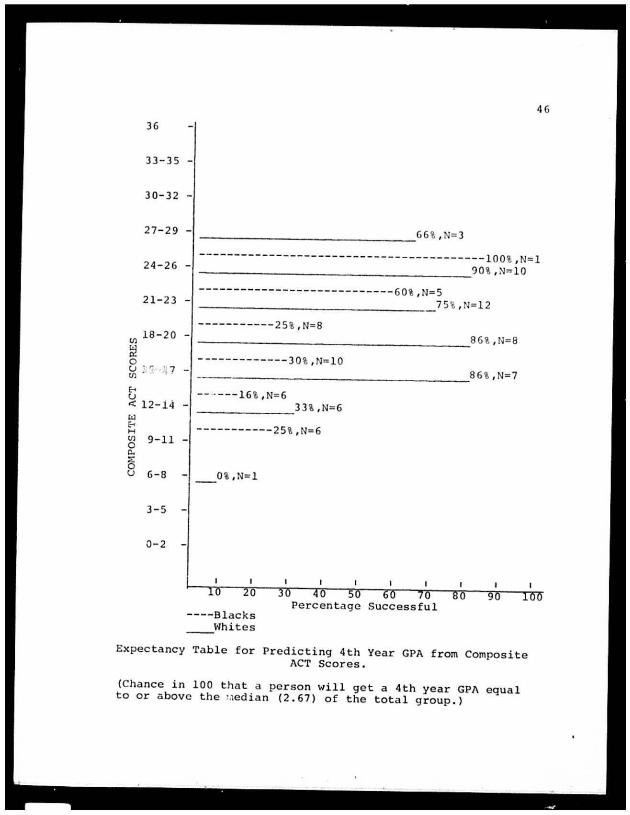
o f dat a. Predic t ing f i rst cou r se psychology grades f r om
AC'f So c i a l S tudies scor es , a nd predic ting second a nd fou r th
yea r GPA f r om ~CT Composite scores -esul ts i n a gene r a l
o v e rpre d ic tior. of c riteri o n measures fo r Bl acks . I\ n ACT
So:: i a l Studie s sco r e of 17 p r edic t s a psychol ogy gracte of
2 .3 5 for \vh ites and a 2 .08 f o r Bl acks . Blacks would have
to obtain a n I\:T Soc i a l Stud i es sco r e of 22 i n o r de r t o
ha ve a pr edic t ed psy c hology g r ade o f 2 .35. The Ac'r Com
posite scor e of 17 a l so p r ed i c t s d ifferences in seco nd a nd
fourth year GPA. Nh i t es a r e p redicted to o b t ain GPA's of
2 .41 a nd 2.76 respective ly . Blacks a r e predic t e d to obt a in
GPJ\ ' s o f 2 .10 a nd 2.65 . ACT Composite scores of 25 a nd 21
would predict , for Blacks, GPA' l'> equal to tha t o f the \'1hi te
g roup . Ag a i n , ovcrpre diction o f g r ad e s occurs for Blacks .
30
lvhe n a na ly z ing the above r e sults , howeve r, the obtained
R2 should a lso b e considered. As can be seen from Ta ble 3 ,
t he mo s t v a ria nce a ccounte d for in any of the equations is
2 8 percen t; thus, 72 p e rcent or more of the total variance
i s una ccount ed for. This finding limit s the generalizability
of future recomme ndations a nd also places some reservations
31
on the practical interpretation of results . As a so lution ,
instructors may be cautioned to 100.; for other variables
that may a id i n the prediction of s tud e nt success. One s uch
variable , which is the best single predictor of grades in
college , is hig h school GPh (ACT, 1973). Inclusion of this
variable wou l d li ke ly raise the n 2 and increase the
applicability of results co placement d~cisions.
Table 4 r epo rts the tests of equality of the obtained
regression planes. (Re fcr to T3blc 3 for actual slopes,
interceptj, a nd standard error of es timates .) It can be
seen that a s ing le regression plane is not tenab l e fo r any o f
the se ts of data. Separate regress ion equations for Blacks
a nd ~"'hite f-; a r e needed . None of the slopes are s i gnifica ntly
different f rom each other, indicating that the test predicts
equ a lly well for both groups . The intercepts, however,
are s i gnificantly different for five out of the six
51 tuations. ~"'hites obtain significantly higher cr iter ion
scores than Blacks. Testing the s t andard er ror of estimate
indicates if there are differences in the average er ror in
predicting GPA for Blacks and Nhites. A significant dif
ference would indicate t hat more error is associated in the
prediction of grades for one group than the other . It may
appe ar that the test of significance for slopes and standa rd
error of estimate a r e essentially the same. However, the
significance test bet· .... een slopes indicates whether the test
predicts equally well (or poorly) for both groups . The

Eng . GPA with Eng. ACT
Math GPA with Math ACT
Psych. GPA with 5.5. ACT
1st Sem. GPA with Compo .~CT
2nd Year GPA with Compo ACT
4th Year GPA with Compo ACT
.p < . 05
•• p < . 01
Ta ble 4
Tests o f Equa l ity of Regr essio n Pl anes Be twe e n Bl acks and Whites
on slo pe s on lnterce pts
F dt F d£
13.33** (1/ 247)
.05 (2/112) 4.28* (1 / 112)
.01 (3 / 226) 5.31* (1 / 227)
.01 (3/ 274) 3.85 (1/ 27 5 )
.01 (2 / 164) 17.5** (1 / 164)
.02 (2 / 69) 8 . 89*· (1/ 69 )
o n e rror of es timat~ -F
F dt
1. 09 (11 9/127)
1. 43 (4 9/62 )
1. 24 (11 2/114 )
1.46* (137 / 1 3 7)
1.54* (8 2/8 7)
1.95** ( 39/ 29)
l S a s ~ng le r eg r esslo n pl a ne t e nab l e ?
No
No
No
No
No
No
w
'"
test may predict equally well for both gr.oups but more
error may be assl")ciated in the prediction for one g roup .
'resting the s t a ndard e rror of estimate , thus, addresses a
different question. Table 4 indica t es that in three of
the six instances more error is associated in predicting
scores for Blacks. Table 4 also l enus support to the t est
as a good predictor for both groups, if prediction is
based on separate regression equations for Blacks and
~"hi tes.
In sum, the data sugges t a consistent pattern of less
t han ot' timal, if not outright misuse of ACT scores f o r
placemen t purposes. ~"hen placement decisions arc based on
CUl"rent University guidelines, Blacks are consis t e ntly
counseled into courses in which they have l ower prob
abi l ities of s uccessfully completing the course. Aside
from any effects of incorrect pla cement decisions, however,
it would seem that, in general, Blacks do have lower prob
abilities of success when compared to their White counter
pa rt. Compound this by placing Black students in Courses
where their probabilities of SUccess are lower than that of
"'hites seems to be even more of an injustice than initially
considered . The importance of appropriate placement guide
:ines based on differential prediction should be readily
apparent .
33
The purpcs~ of using the ACT is to correctly place
students in advanced or remedial courses so that al l students
have an equal probability of s uccess . Using current guide
lines results in adve r se impact for the Black g rou9 by
placing them in courses where they are more likely to fail .
" worthwhile solution to the problem "'lQuld be to establish
diffe r ent guide lines for Blacks a nd \'lhites on the basis of
obtained r egress ion equations. Cont inua lly updating these
guide lines would supply r e l e vant refe rence groups for
incoming classes. It is suggested that the student be
counse led on the basis of these updated guidelines, but
that the individual student decide whether or not to e nroll
in it particular course. In t' \s way the University c an
34
avoid any possibi lity of c har,,!cs of discriminatory practices .
Caution should be exerci sed in the usc of any rigid
placement policy based on ~CT scores. ACT scores shou ld be
used principally for counseling purposes rather than for
strict placement decisions. Suppose a Black challenges the
University on the basis of discriminatory placement prac
tices. The University must then be able to defend their
established pl a cement policy. On the other hand, if the
student i~ responsible for deciding to enroll in a particular
course , the Univerqity would be free of any possible lega l
ramifications that may arise as a result of strict place
ment guidelin~s.
Deciding which course to enroll in, however, can be
somewhat of a frustrating situation to the individual
student. One a id in this decision making process would be

to use updated Unive rsity placement guidelines i ss ued to
fac ulty advisors . Another \<lay of estimating a students
pot en tial fo r successful pCJ:formance in a course is through
the use of expecta ncy tables.
Expectancy tables divide the r ange of pr edictor scor es
into score inte r vals. The numbe r of pe r sons obtaining
35
scor es wi t hin a particular i nterva l are then counted . Afte r
establishing a pe r fo r mance cutoff , the percentage of success
fu l individua ls within an interva l can be deterlt'ined by
dividing the total number o f indiv i d ua l s within the interval
into t .. ·· numbe,' who s ur passed the performance c utof f . This
procedure i s done for eac h i nterval. Appendix A consists
of expectanr:: y tables for Blacks and whites . The pe rformance
cutoff (GPA of 2 .0 o r above) i s used for predicting Eng l is h
grades from Eng lish ACT scores , Na th g rades f rom Math ACT
scores , Psychol ogy gr ~des from Social Studies ACT scores ,
a nd fi rst semeste r a nd second yea r GPA from Composi t e ACT
scor es. The median of the total g roup {GPA = 2.6 7} is
u~ed a s the success cutoff in the prediction of fourth year
GPA from ACT Composite scores. The median is used in the
last case since a ll students who g r aduate obtained a GPJ\ of
at least 2.0. If expectancy tables of the form shown were
made avai lable to all faculty advisors, more specific and
mor e accurate counsel could be a pplied to incoming students.
It should be emphAsi zed that it is encouraging to find
that the J\CT is a use ful predictor of g rades for Blacks and

36
Nilites, and that the Unive r s ity c a n use the ACT for place
ment purpose s if curre nt guideline s are upda t ed. l\ fl ex ible
policy with c ontinua l upda ti~g of guide lines based on s tud i e s
such a s the present one, would a voi d implica tions of test
bias and discriminat ion a nd opt im ize the qualicy o f c oun se l
offered s tudent R.
Another finding not addressed in the mai n sub ject
matter of this paper , but that moly be of importa nce t o the
Univ e rsi ty , is t he percentage o f Black:; a nd \-Ih i t es th a t a r e
graduating at th(: e nd of fo ur years. "h i s s t udy found t ha t
out of the r a ndom sample o f 139 \~hi te studen ts who bega n in
the f a ll of 1970, only 20 pe rce nt g r adua ted; a nd only 19 .1)
p..:! r cent of the entire Dl ac k popul a tion graduated wjthin this
time pe riod. The s e low s uccess r a te s . howeve r, c ould be
accounted for by the fact tha t all students, who a pply. are
admitted to the Unive rsity without any type of prior selec
tion. Attrition from the first s errtester to the second ye ar
of school was from 139 to 84 for \ihites, and from 139 to 83
for Blacks. Thus, only about 60 percent of the students ~ho
enrolled in 1970 were still enrolled at the e nd of the
second year. Attrition from the second to the fourth year
of school was from 84 to 41 for Whites, and from 83 to 31
for Blacks. Twenty-nine percent of the whites and twenty
two perce nt of the Blacks remained enrolled the full four
years of college. However, not all students graduate at
the end of four years, which accounts for the equal success
rate s but diffe ring a ttrition r a tes for both groups . As
can be s ecn, the l arge number of s tude nt s los t within the
first two years o f s chool may indicate the need for better
placement guidelin~s ; especially s ince all stude nts who
apply arc accepted, r ega rdless of their pr obabilities of
s uccessful pe rforma nce. Placing st udents in course ::; whe r e
all stude nts have the same probabi lit jes of s uccess ful
performance may reduce the high attrition r a te by giving
students a be tter base for c ontinu i ng his/he r education.
There are several possibil i ties of futur e res ea rch
37
in this area that may help improve the quality of counsel
of f e r ed s tudent s . One such poss ibility may include the
investiga tio n of diffe rences on the basis of sex. Dif
fere nces between and within Blacks and Whites, on the bas is
of s e x, could be investigated through the same procedure
used in the present study. If differenc es do occur, then
the e ff ects o f s ex should be considered when predicting GPA
from ACT scores. Investigation of how predictor variables
combine to optimally predict the criterion might also be
desic able. This could be limited to the combination of only
Lhe suutests of the ACT or expanded to include other
variables such as high school GPA, geographic location,
involvement in extra curricular activities, socio- economic
background, and type of educational setting . Another
desirable area of research would be to investigate the
variability between ACT scores of successful (i.e. GPA of
38
2.0) and unsuccessful students. For exampl e , is more
variance associated with the scores of success ful or un
successful students? Finally, consideration should be given
to the ways in which current placement guidelines we r e
established, and to the possible need for r evision and
constant updating of eXisting guidelines .
Summary a nd I mpli ca t ions
The major findings o f the s tudy are : (1 ) ACT scor es
do show systema t ic ACT-CPA relationships for both Bl acks
and Whites . (2) Raci a l differences do e xist when ACT sco r e s
a re used to predict CPA . (3) The existence of di ffe renti a l
or single-g roup validity is not supportcd in these data .
(4) The data sugges t a consi s t ent patte rn of less theln
optimal, if not outright mis use of ACT scores for p lac ement
purposes . ! ';' ) As a res ult of curren t p l acement guideli nes ,
Blacks a r e ucing pl ac ed in courses whe r e their probabilities
of s uccess are lower t han that nf the ir l1hite coun t e rpart.
These results reinforce t he need for continual upda ting
(r esea rch) of eXist ing guidelines and the use of upda ted
t!x!Jt!c.:tam:y t ablt!s in order to improve the quali ty o f counsel
oCfer ed s tudents by f aculty adv isors . Based upon these
updated p l acemen t guide lines and expectancy t ables, it is
recommended that individua l students be l e ft to decide
whether or not to enroll in a particular course . The
possihillty of legal r amifica tions as a result of biased
placement practices can be substantially reduced in this
manner . The prima ry recommendation from t his study would
be to consider the effects of racial differ ences on the
prediction of CPA from ACT scores . Since high school CPA
39
40
has been found to be the best sing l e pred i c tor: of S UCCCSH
in college (ACT, 1973) , it is r ecommend e d that t hi.s varjab l c
also be considered in the prediction of GPA f r om ACT sco r es
for placement purposes.
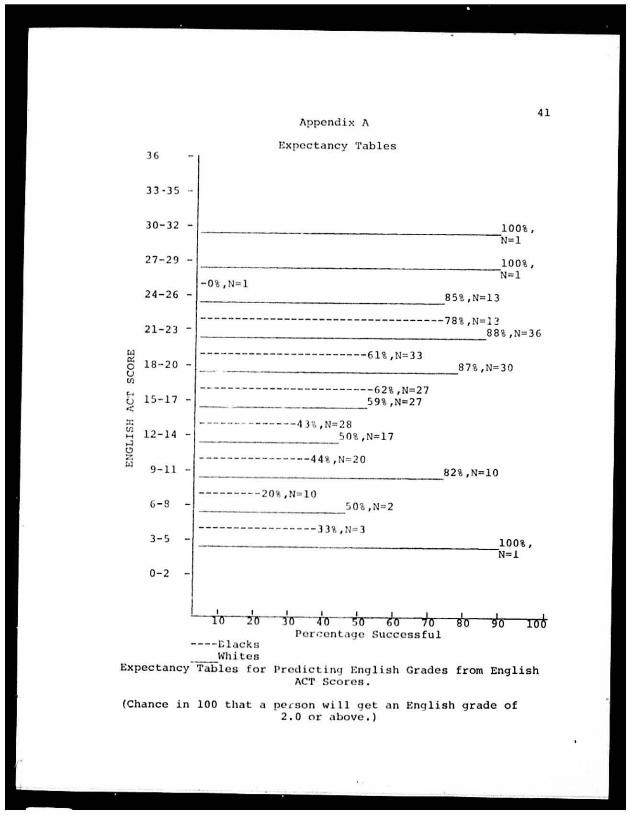
41 Appendix l\
36 Expe cta ncy Tables
33 -3 5 --
30-32 - _ _____________________________________ 100%,
N= 1
27-29 - 1 _______________________________________ 100%,
N=1 -O l , N=l
24-26 - SS %. N=ll
- ----- - -- - - ------------------------78 %, N=11 21-23 - 88 %, N=36
~ --- - ---- - - - - ----- ----- --6 1 \ , N= 33 g; 18 - 20 -u
'" t; 15- 17
"' '" ~ 12-14 -,., C> Z
'" 9- 11 -
6 - 9
3-~
0- 2
_________________________________ ,87 %, N= JO
- ---- - - -- --- - -- - -- - ----- -62%, N=2 7 59 %,N=27 ---------
- ----- - - -- - - - -4 3 ~ / N= 2 8 ____________________ 50 %, N=17
---- - - - - - - - --- --44 %, N= 20 __________________________________ 82 %, N= 1 0
--- - - ----2 0 ~ .N~ l O ______________________ 5 0%, N=2
-- - - - - - ---- - ---- -33 %, N=3 _____________________________________ 100\,
N=1
'---li w,--iI • vrr--I ~~lr v --in 50 6' 0 }o go 9'''-0 --~lnorl!A
--- - ClllCku l~h i teB
Po rr.cntag c Suc c e ssful
Expectancy Tabl es f o r Pr.e dicti.ng Eng l ish Grades from English J\CT Sco rcs .
(Chance in 100 that a pe e son wi II g et a n Eng lish grade of 2.0 or above.)
4 2
36
33-35 -
30-32 -1 _____________________________________ 100 \ ' N= 4
----- - ------------------ - -- -- - -- - 80%, N=S 27-7.9 - _____________________________________ 87 ~ , N= 1 4
24-26 ---- ------ - --------- ---- --- -- --7S ' ,N~ 4
___________________________ 78% , No lo!
21 - 23 ---------------- - ---- - ----- - ---- -7 8%,N=9 _________________________ 7 n , N= 1 5
18-20 ------------ - --------- -- --69 \ , N= 1 3
___________________ 65 \ , N=26
-----------4 0 \ ,N= 38 ~ 15-17 - ____________ 42 \ , N= 22
8 '" .. 12-14 -
-------------43%, N= 14 ______________ 54 \ , N=1 3
u <
9-11 ---- - 09 %,N=6 __________ 20 \ ,N= 5
6-8
3-5
0-2
---- - ---17%,N= 6
Ot ,N=3 ----------20\,N=5
O%,N=2 O\,N=2
----Blacks Whites
Percentage Successful
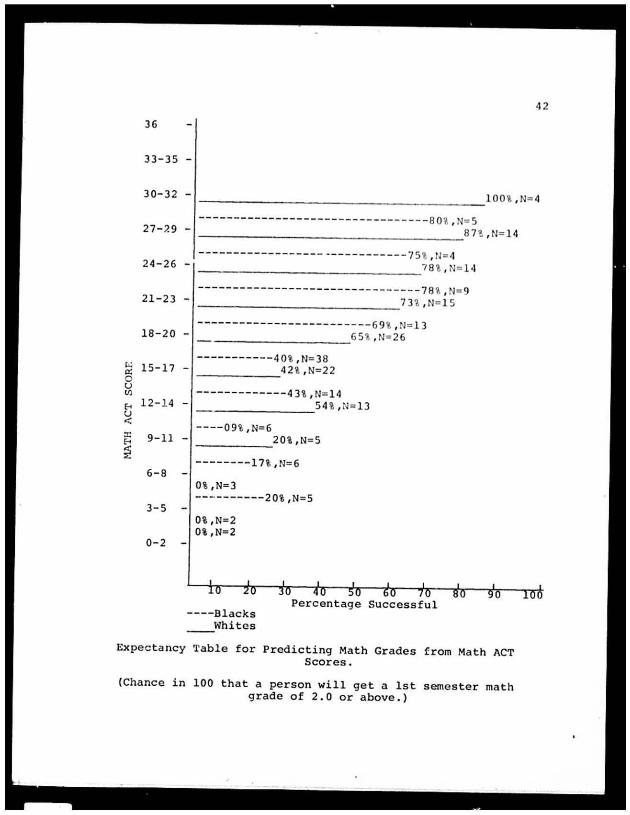
Expe cta ncy 'l'able for Predicting Math Grades from Math ACT Scores.
(Chance in 100 that a person will get a 1st semester math grade of 2 .0 or above.)
36
33-3 5 -
-- ----------------------- - ------- -------lOO\ ,N=l 30-32 - 100% ,N=2
--------------------------------- -------lOOt ,N=l 27 -29 - 100% , N= 7
-------------------- --- - ------------- - - -l OO %,N=6 24-26 - 96 \ ,N=23
"' '" o
21 - 23 -
~ 18-20 -~ .~
,< 1S-17 -m "' H
§: 12-14 -.. '"
------------------ - - - -50 %, N= 10 ___________________________________ 94 %, N=18
---------- ---------- ---------- 72 \ , N=22 _________________________________ 8 1 %, N= 21
- ------------------. ------ -----73 % , N= lS ________________________________ 83 %, N= 12
- ------- - - - - - ----------------71%,N=14 ___________________________________ 94%,N= 15
------------------------- 54' , N~ 13 9- 11 - 80\ ,N=5
---------------------------58% , N=26 6- 8 86\ ,N=7
----------------------SO \ ,N= 6 3-5 _______________________________________ 100%,N=2
Ot,N=l 0-2
43
.LU ~u .JU qU :.u t)u IU !:IU ~u .lUU
----Blacks whites
Percentage Successful
Expectancy Table for Predict i ng Psychology Grades from Socia l Studies ACT Scores.
(Chance in lJO that a person will get a Psychology 100 grade of 2.0 or above.)
44
36
3>-35 -
30-32 -
27-29 - _____________________ 100%, N=5
------ - ------------ ------- - --67 %, N=3 24- 26 - 94 %, N=18
---------------------5 4%, N= 11 21-23 - 66 %,N=32
Vl 18- 2 0 - _________________ 78 %, N=32
'"
------------- --- - --- 52 t , N=25
'" o ~ 15-17
----------------42%,N= 33 __________ __ 63 %, N=27
t ------------33 \ , N= 30 0< 12-14 -
'" ... ... :g 9- 11 -.. 8 u 6-8
3-5
0- 2
__________ _ 63 % , N=16
------13%, N=23 ________ 3 8 % , H= 8
--- - ---- - -22 %, N=9
<U <u 30 .u ou 60 IU ou 90 100
----Blacks White s
Percentage Successful
Expec tancy Table for Predicting 1st Semester CPA from Composi te ACT Scores.
(Cha nce in 100 that a person will get a 1st semester GPA of 2 • 0 or above.)
I
4 5
36
33-35
30-)2
27-29 ------_______________________________ 100%,N=3
------ ------ - -- - --- ----------- 67 t , N= 3 24-26 - ----___________________________________ 94 %,N= 16
21-23 -- ------ ------ -- - -- ------ --- 56' , N= 11 --___________________________________ Sl%, N= 21
l S-20 to
l;l 0 15-17 -u Ul
- ----- - --------------------------------87 %, N=15 ------_________________________________ 94%, N= 17
---- ------------- - --------- - 5S %, N= 24 . _______________________________ 0 5%, N= 13
... u 12-14 '" ------- - -·- - ------------- - - --- 67 %,N=lS
72%, N= ll
'" ... - - -- - ------------36 %, N= 0 ::ri 9-11-o c..
----________________________________ SO%, N= 5
~ - - ------------ - --- - - -- - SOt ,N=2 8 6-0
3-5
0- 2
J.
----Blacks ____ t'l'hi tes
Percentage Successful
Expectancy Table for Predicting 2nd Year GPA from Composite ACT Scores.
(Chance in 100 t ha t a person will get a 2nd year GPA o f 2 . 0 o r above .)
4 6
36
33-35 -
30-32 -
27- 29 - 66 %, N=3
-------------------------------- ---------lO O\ , N=l 24-26 - 90 %,N=10
----------------------- --- - - GO %, N=5 21-23 - 7S%,N=12
- ----------25 %, N=8 til 18-20 - __________________ 86 % , N=8
~ ------- - ----- 30%, N= 1 0 ~ :< ')1 7 - ____________________ 86 \ , N=7
~ -- - ---1 6%, N=6 ~ 1 2-14 - 33 \ ,N=6
'" ~ H til 9-11-~
-----------25%, N=6
8 6-8
3-5
0-2
__ Ol , N= l
LU < u JU ou 'U OU IU 8u .u LUU
----Blacks __ Whi tes
Pe rcen t age Successful
Expectancy Table fo r Predic ting 4th Year GPA from Composite ACT Scores.
(Chance in 100 that a per son will ge t a 4th y e ar GPA equa l to or above the l,lcdia n (2.67) o f the total g roup . )

Re f e r e nces
Ame r i c an College Testing Program . As s essi ng s tud e nts on the
way to college . Iowa City: Iowa . 1 . 2 , 1973.
American College Testing Program. Us ing ACT on th~ campu s .
Iowa City: Iowa , 1974 - 75 .
Anastasi, A. Psychologica l testing . (3rd ed.) New York:
Macmillan, 1968.
Ash, P. The implications of the c ivil rig hts act of 1964
f .·,·~ psycholog ical assessment in industry . Am e rica n
psycholog i st . 19 66 . 797-803.
Ba rtlett, r. . J. ~ O'Lea ry, B. S . A differential p r e dic tion
model to moderate th e effects of heterogeneous groups
in personnel se l ect ion and c lassificat ion. Personnel
Psychology, 1969, ~, 1-17.
Borgen, F. H. Different ia l expectations? Predicting grades
for black students in f ive types of colleges.
Heasurement and Eva lua tion in Guidance, 1972, !!Q,
206-212.
Bray , D. W. & Moses, J. L. Personnel selection. Annual
Review of Psychology, 1972, ~, 545-576.
Campbe ll. J. T ., Pike , L. W., & Faugher, R. L. Prediction
of job per formance for negro and white medical
technicians. A regression a nalysis of potential test
47
bias predicting job knowl edge scores f rom an aptitude
batte ry. Educationa l TestinCj Servicc , Princcton ,
New J e rsey , 1969 .
Cl eary , T. 1\ . Test bias . Pred i c tion of grades of negro
a nd white students in integ rated colleges . Journ a l
of Educa tional t1easureme nt, 1968 , ~ , 115-124.
Cole , N. S. Bias in se l ect i on. Jourr.al of Ed uc~tiona l
!>1easur eme n t , 1973, 10(4), 237 - 255.
Da rling ton, R. B. Another l ook at "cu ltural fairness ."
Journa l of Educationa l Measurement , 1971 , ~, 71-82.
Einb'Jrn, If . J. &- Bass , 1\. R. Hethodological consic1er<"ltions
relevant t o discr imina tion in employment testing .
Psyc hologica l Bulletin, 1971, ~, 261-269.
48
F incher , C. Diffe r entia l valid i ty a nd t es t bias . Personne l
Psychology, 1975, ~, 481-500 .
Fox, II. & Le fkowitz, J . Differen t ia l validi ty: Ethnic
groups as a moderato r in predicting job performance .
Personne l Psychology, 19 74, 27 , 209 - 22) .
Gae l, S . , Grant, D. L., & Ritchie, R. J. Emp loymen t te s t
validation for minority and nonminority t e l ephon e
operators. Journal of Applied Psychology , 1975, 60,
411-419 .
/';rant, D. L. & Bray, D. N. Validation of emp loyment tests
for telephone company ins tallation and repair
occupa tion ~ Journal o f Applied Psychology, 1970 , ~,
7-14 .

,
Guion, R. Employment tests a nd discriminatory hiri ng .
Industria l Relations, 1966 , ~, 20-37 .
Humphreys, L. G. Statist i ca l definitions of test validity
for minority groups. Journal of l\pplied Psychology,
1973, 58, 1-4.
Kendrick , S . 1\.. & Thomas, C . L. Transition from school to
col l ege . Re view of Educat i ona l Research, 1970 , ~,
151-179.
Kerlinger, F . N. & Pedhazur, E. J. Multipl e regression~
behavioral r esearch. Holt Rinehart \-linston, New York,
1973.
Kirchner, \<1. h . Some questions about It Di~fcrent ia l
Validity": Bthnic 1rouP as a moderator in predicting
job performance. Personnel Psychology, 1 975, 28,
341-343.
Kirkpatric, J. J., Ewen, R. B., Barrett , R. 5. , & Katzell ,
R. A. Testing and fair empl oyment . New York: New
York Un i vers ity Press, 1968 .
Lefkowitz , J. Differential validity: Ethnic group as a
moderator in predicting tenure. Personnel Psychology,
1972, ~1, 31-41.
Lenning, O. T. & Maxey, J. E. ACT vs SAT prediction for
presen t day colleges and students. Educational a nd
Psychological Measurement, 1973, 33(2), 397-406.
Linn, R. L. Fair t es t use in selection. Review of EdUca
t i onal Research, 19 7 3 , il, 139-161.
49
Linn, R. L. & \'Io r ts , C. E. Considerations for s tudies o f
t es t bias. Journal of Educationa l teasurcmcnt , 1971,
~, 1- 4.
50
Lopez , F. M., J r. Current probl ems i n tes t perfo r ma nce of
job applicants. Personnel Psychology , 1966 , 19, 10-18.
}lunday, L. Pred icting college g r ades in predominantly ney r o
colleges . American College Tcstinq Program , 1964.
Nic , N. II., Hull, C. H., Jenkins , J. G., St einbre nne r, K. ,
& Be nt, D. U. spss: St at i stical oackage for the socia l
sciences. (2nd cd.). W:Grm4 lIill, Co . 1975 .
o I Connor , , ... . J ., :'lcx1ey , K. N., f, Alexande r, R. A. Si n91e
group validi ty: Fact or f a llacy . Journal of Appli ed
Psychology , 1975, 60, 35~- 3S S.
P~tcrs, F. R. & Plog , E . L. The effective ness of the ACT
f o r selection a nd p l acement i.. t the Ohio St a te Unive r
sity . Educational ~csearch Bul l etin , 1961, ~, 232-241.
Pfe i fe r, H. C., J r . & Sedlacek , \'I. E. 'rhe v~lidity of
ac ademic predictors for black and white students at a
predominantly white univers ity . Journal of Educational
Heasurement, 1971, !i.!L, 253-261.
Pfei.fer , C. H., Jr. & Sedla cek , \'I. E. Pr edicti ng black
student grades with non intel l ectual measures. Journal
of Neg r o Educat i on , 1974, 43(1), 67 -76.
Ruda, E. & Albright, L. E. Racial differ e nces on selection
instruments related to s ubs equent job performance.
Personnel Psychology, 1968, 21 , 31- 41.

51
Schmidt, F. L., Brener, J. G., & Hunter, J. E . Racial
differences in validity of empl oyment tests: reality
or illustion. Journal of Applied Psychology , 1973, ~,
5-9 .
Schmidt, F. L. & Hunter, J. E. Ra cial a nd e thnic bias in
psychological tests. Divergent implications of two
definitions of test bias. l\mer i can Psychologist, 1974 ,
Jan, 1-8.
Snedecor, G. W. " Cochran, W. G. Statistical Method s
(6th ed .). Ames, Iowa: The Iowa S tate Unive r sity
Pres!': 1967.
S t an ley, J . C. Predicting college success of educationally
disadvantaged s tudents. John Hopkins Center for the
Study of Social Organization of Schools, Research
Report No. 79. 1970.
Temp, G. Validi ty of thp. SAT for blacks and \ ... hi tes in
thirteen integrated institutions. Journal of Educa
tional Measurement, 1971, 8(4}, 245-251.
Thorndike, R. L. Concepts of culture fairness. Journal of
EdUcational Measurement, 1971, 8, 63 -70 .
'roole , D. L., Gavin, J. F., Murdy, Lib., & Sells, S. B.
The differential validity of personality, personal
history, and aptitude data for minority and nonminority
employees. Personnel Psychology, 1972, 25, 661-671.

Zimmerman, R. R., Wise , L., & Smith, o . N. Narly detection
~f final performance in an introductory cou rse in
gene ra l psychology. Psychologica l Reports , 1974 , ~,
620-622 .
52