,!r HOUSE • • • • • No. 5955
21
1. - - - ---------,,-- .... ,.-- ,. I.. ,!r HOUSE • • • • • • • No. 5955 F (CommonweaUb of :fIfassatbusetts LEGISLATIVE RESEARCH COUNCIL Report Relative to CRIME ON PUBLIC TRANSPORTATION SYSTEMS L FOR SUMMARY, SEE TEXT IN BOLD FA CE TYPE February 13, 1980 ... 1\ II ... i \ If you have issues viewing or accessing this file contact us at NCJRS.gov.
Transcript of ,!r HOUSE • • • • • No. 5955

1.
- - - ---------,,--....,.--
,.
I.. ,!r
HOUSE • • • • • • • No. 5955
F
~be (CommonweaUb of :fIfassatbusetts
LEGISLATIVE RESEARCH COUNCIL
Report Relative to
CRIME ON PUBLIC TRANSPORTATION SYSTEMS
L
FOR SUMMARY, SEE TEXT IN BOLD FA CE TYPE
February 13, 1980
.-~-----... -----..,-------~-
1\
II
... i \
If you have issues viewing or accessing this file contact us at NCJRS.gov.

'( 1
2 HOUSE - No. 5955 [February
~bt «:ommonhttaUb of :fflassacbusttts
ORDER AUTHORIZING STUDY
(House, No. 6625 of 1979)
Order~d, That t.he Legislative Research Council is directed to conduct an investigation and study relative to crimes committed on public transportation systems and on related facilities. Said Council shall report the results of its study by filing a copy thereof with the Clerk of the House of Representatives on or before the second Wednesday of February in the year nineteen' hundred and eighty. ,.. 1',
Adopted:
Bv the House of'Representatives, . . July 12, )979
By the Senate, in concurrence, July 17, 1979
U.S. Department of Justice National Institute of Justice
77169
This document has been reproduced exactly as received from the person or organization originating il. Points of view or opinions stated in this document are those of the authors and do not necessarily represent the official position or policies of the National Institute of Justice. •
Permission to reproduce this copyrighted material has been granted by
Daniel M. O'Sullivan
to the National Criminal Justice Reference Service (NCJRS).
Further reproduction outside of the NCJRS system requires permission of the copyright owner.
-~-~-~.-~-. -----;.~---...,........-~--~-----
1980] HOUSE - No. 5955
CONTENTS
Order Authorizing Study ..... Letter of Transmittal to the Senate and House of
Representatives .....
Letter of Transmittal to the Legislative R~sea~ch Cou·ncil Summary of Report
CHAPTER I.
Origin of Study Scope of Study
INTRODUCTION
CHAPTER II. MASSACHUSETTS PUBLIC TRANSPORTATION SYSTEMS . . .
Str~cture of the Massachusetts Bay Transportation Authority . . . . . . . . . . . .
Sub~idized Commuter Railroad and Bus Company Services RegIOnal Transit Authorities . . . . . . .
CHAPTER III. CRIME AND VANDALISM ON PUBLIC TRANSPORTATION
Definition of Crime Indexing .of Crime Causes of Crime MBTA Crime Statistics MBTA Vandalism Costs . . . . Crime Experience-Commuter Bus Companies
CHAPTER IV. TRANSPORTATION POLICE & RELA TED SECURITY EMPLOYEES
MBTA Police MBT A Starters Railroad Police Recommended Action
j
", .. ~. . {" IV • It'" •
3
2
5 6 7
10
10 10
. 12
12 15 18
20
20 22 22 24 29 31
32

4 HOUSE - No. 5955
CHAPTER v. ELSEWHERE
SECURITY PROCEDURES
Transit System Usage External Security Devices Federal Assistance
TABLES 1. Voting Strength of MBTA Communities 2. M BT A Service Activity :. 3. Summary-Classification of CrImes 4. Criminal Activity by Sex and Race . 5. Average Age of Selected Crime Offenders , 6. Line Totals of MBTA Incidents by Type of Offense 7. Estimated MBTA Vandalism Costs, 1971-1978
[February
· 36
· 36 37
· 39
13 • 14
20 23 24 '25
. 30
C"'·· . , ,
--------' -------------
1980]
~-----,------ -. _.-
. HOUSE - No. 5955
Utbe QL:ommonb:Jealtb of :fRassacbusttts
LETTER OF TRANSMITTAL TO THE SENATE AND HOUSE OF REPRESENTATIVES
To the Honorable Senate and House of Representatives:
5
LADIES AND GENTLEMEN:- In compliance with the legislative directive in House,' No. 6625 of 1979, the Legislative Research CounCil submits herewith a report prepared by the Legislative Research Bureau relative to crime on public transportation systems.
The Legislative Research Bureau is restricted by statute to "statistical research and fact-finding." Hence, this report contains only factual material without recommendations or legislative proposals by that Bureau. It does not necessarily reflect the opinions of the undersigned members of the Legislative Research Council.
Respectfully submitted,
:MEM.BERS OF THE LEGISLATIVE RESEARCH COUNCIL
Sen. ANNA P. BUCKLEY of Plymouth, Chairman Rep. MICHAEL J: LOMBARDI of Cambridge, House Chairman Sen. JOSEPH B. WALSH, of Suffolk Sen. JOHN F. PARKER of Bristol Sen. ROBERT A. HALL of Worcester Rep. ARTHUR M. KHOURY of Lawrence Rep. WILLIAM P. NAGLE, Jr., of Northampton Rep. WILLIAM Q. MacLEAN, Jr., of Fairhaven Rep. IRIS K. HOLLAND of Longmeadow Rep. SHERMAN W. SALTMARSH, Jr., of Winchester Rep. BRUCE N. FREEMAN of Chelmsford Rep. CHARLES N. DECAS of Wareham

6 HOUSE - No. 5955
Qr;fJt (tCommonwtaltfJ of ~a55acbu5ttt5
LETTER OF TRANSMITTAL TO THE LEGISLATIVE RESEARCH COUNCIL
To the Memhers oj'the Legislative Research Council:
[February,
LADIES AND GENTLEMEN:- House, No. 6625 of 1979 directed the Legislative Research Council to make a study and investigation relative to crimes committed on public transportation systems and
related facilities. The Legislative Research Bureau submits herewith a report i~ ac
cordance with the above directive. Its scope and content are restrIcted to fact-finding data only, without recommendations or legislative
proposals. This report was the primary responsibility of Anthony L. Ventresca
of the Research Bureau staff.
Resprectfully submitted,
'''', --=------~-
DANIEL M. O'SULLIVAN, Director Legislative Research Bureau
-.'
~----~--~-------~------.• - -
~----
--~--'\; I~
1980] HOUSE - No. 5955 7
Qr;fJt (tCommonwtaltb of m1155acbU5ttt5
CRIME ON PUBLIC TRANSPORTATION SYSTEMS
,. SUMMARY OF REPORT
Study Directive -This report by the Legislative Research Council is submitted in
_ conformity with a joint order adopted by both branches of the General Court in 1979 (House, No. 6625). That order, proposed by Representative Michael J. Lombardi of Cambridge, House Chairman of the Council, required the Council to make a study and investigation ofthe incidence of crime on public transportation systems within the Commonwealth.
The Massachusetts Transportation System The transportation system includes both public and private trans
portation companies. The public companies are created by statute and are political subdivisions of the state. They are financially supported ·through passenger fares, real property taxes, nonproperty excises, state aid, and. grants from the Federal Department of Transportation.
The largest carrier is the l\rlassachusetts Bay Transportati(m Authority (MBTA) whose district is comprised of79 cities and tow.os, the great majority being in the Greater Boston area. It operates a transit network that dates back to the Boston Elevated Railway Company. The MBTA operates about 1,500 vehicles daily, including commuter rail trains (under a contract with the Boston & Maine Railroad), buses, trackless trollies, and rapid transit cars. Annual MBT A ridership is estimated at 151,400,000 persons who provided the Authority with $67,670,093 in revenue in 1978. The agency has a .work force of approximately 6,500 persons. Established by statute in 1964, the Authority is subject to the terms and conditions contained in Chapter 161A of the General Laws. Administered by a five-member Board of Directors appointed by the governor, the MBTA is governed in part by the decisions of an Advisory Board which is composed of officials from the 79 member communities. The most important power resident in the Advisory Board relates to the approval of the Authority's budget.

8 HOUSE - No. 5955 [February
In addition to the MBTA, there are 10 statutory regiqnal transit authorities which serve 95 additional cities and towns. Aggregate annual ridership for the 10 districts reached 1.9 million persons in . 1979. Providing bus service only, theseregiQnal authorities are chartered under Chapter 161B of the Massachusetts General Laws.
Private transportation companies are licensed by the Departm.ent of Public Utilities and are limited in Massachusetts to the operatIOn of buses. Currently, over 50 private companies with 640 buses operate within the Commonwealth. Annual ridership is estimated at 22.5 million persons.
Crime on the Massachusets Transportation System Generally, crimes are divided into felonies and misdemeanor~, ~e
pending upon the severity of the punishment accorded. In most Jurlsdictions misdemeanors ar,e offenses for which the maximum punishment is ~onfinement for one year while felonies call for a state prison sentence for more than a year.
The causes of crime according to experts, involve influences that , . include defects of personality, socio-economic conditions, biological defects, age, a'nd race. The Massachusets Commission on Probation, in a study involving 5,000 court cases from 1975 to 1978, observed that persons between the ages of 17 and 25 from poor socio-economic backgrounds and neighborhoods accounted for the highest percentage of convictions for crimes against property. Tabulations compiled by the MDT A and other carriers further support the impact of social hlf1uences as a cause of crime. The highest levels of criminal activity, according to these sources, occur in Boston neighborhoods which can be identified as blighted~ densely populated and socially depressed.
For the period of January to June 1979, the MBTA recorded 5,816 incidents of criminal behavior. However, some law enforcement authorities challenge the validity of the data. The type and level of criminal activity includes crimes against the person such as rape, sex offenses, robbery, aggravated assault, and larceny. Property crimes include vandalism, breaking and entering, purse snatching and pickpocketing, among others. While the MBTA has insisted that the level of crime has risen at an alarming rate, an analysis of statistical tabuhdions indicates that criminal activity on the system is less than the crime rate in, Boston proper.
Cl'~,"',' , v
, .~.
1980J HOUSE - No. 5955
9
From 197] to ]978, the MBTA incurred over $4 million in damage due to vandalism. Private transportation companies report costs of $345,000 in 1978 and $492,000 in 1979 as vandalism damage. Both public and private transportation systems indicate that the common vandalism targets are windows, seats, passenger supports, in addition to graffiti.
Passenger Safety and Protection
While private transportation companies rely upon local police agencies for crime prevention and protection, the MBTA functions through its 0lYn police department which was created in 1968 through a legislative act (C. 664). Only patro)'men are covered by Civil Service. They have authority to act as police officers in the 79 cities and towns of the MBT A district but are limited in their activities to Boston. Security effort is augmented by MBT A starters who act as special police officers.
Several groups among the MBTA personnel and elected officials argue that the MBT A Police Department should be increased to 200 members and provided with sufficient equipment to allow for modernization. Criticism that it is inefficient and ineffective is frequently uttered. Currently, the department is sparsely equipped with only portable radios and police cars. Average response time with current manpower and equipment is estimated at 15-20 minutes per call, which could be reduced through the establishment of substations, particularly in areas with a high crime rate. The MBT A Police Department receives no direct federal aid; however, it has been provided limited
, funds through the federal grants for equipment. - Transportation authorities in other states such as New York, Chicago and New Jersey appear to have taken greater steps than the MBT A to insure patron safety. Such approaches as TV surveillance in stations, !wo-way ra~io systems in buses, uniformed passengers, audio recordmg, and hehcopers have been used elsewhere with much Success.

~--~ ----.-~-----~---------
10 HOUSE - No. 5955 [February
~be Q!:ommonwealtb of ~assatbusttts
CRI ME ON PUBLIC TRANSPORTATION SYSTEMS
CHAPTER I. INTRODUCTION
Origin of S(U(~V •.
This report is submitted by the Legislative Research Councli pur~u-ant to House, No. 6625 of 1979, which was filed by Representatlve Michael J. Lombardi of Cambridge, House Chairman of the Legislative Research Council. That legislative directive, reprinted on the inside cover of this report, required the Council to investigate crime on the public transportation system and related facilities within t,he state. The intent of this directive, therefore, is to determine the level~ type and impact of crime on public transportation.
Stope qI'S{lU/l' To properly achieve the goal of the legislative directive, it is neces-
sary, due to the nature of the subject, to separate what has been determined to be factual from corresponding data alleged to be factu-
al. Volumes of statistical tabulations, media accounts, and public de-
bates concerning crime on public transportation have fostered a perception among the citizens that violent crimes and vandalism occur unchecked throughout the transportation system. A recent public opinion poll conducted by the Massachusetts Bay Transportation Authority (M BT A), in which 750 Bostonians were surveyed, indicat.ed that three out of five persons believe that the M BT A subway system has a higher crime rate than Boston proper. Since it may be assumed that those polled were not privey to official police crime statistics, it would appear that their opinions were drawn from mass media accounts, word of mouth, or simply emotional evidence. Because many individuals will always believe that the opinions held in common by a majority of people comprise an acceptable criterion of truth, the report examines the relationship between the statistical tabulations on crime published by the M BTA and the interpretation of those figures by the
media.
~
(;
t)!;, II '1
II
!,
'(
'[
t
~ ~ , ,
;!:
r " 'j
,
!
1 'I
I'
~
(, jI
f.:
-.."
1980] HOUSE - No. 5955 II
While statistical data compiled by the M BTA indicates an increase in crime in most areas of pub,lic transportation under its jurisdiction, the lack of a clear explanation of those tabulations has sparked uncertainty as to the reliability of the data.
Public transportation includes all companies which are engaged in the transport of people. Thus, the report includes the operational
\ ~': activity of those bus companies which provide daily commuter and ~I passenger service, contract lines, Boston and Maine Railroad, and the
M BT A system. It is noteworthy, however, that no crimes'against the person have been recorded in B&M records since 1976 and that only one incident of that na,ture has been reported by private bus companies in 1978.
The investigation of-crime requires a review as to the cause of crime. While obvious boundaries have been placed upon this section of the report, the document nonetheless reviews the connection between specific crime rates, the location of the highest crime rates, and the causes of crime.
Determining the legal definition and the classification of different criminal acts is the key to deciphering many of the statistical tabulations which are the basic building blocks of crime reporting. Methods, procedures, and activities of transportation sYfltems in: other states pr~vide good comparative examples when reviewing local developments.
Criminal activity and incidents result in financial hardship to both the public and private sector. I n this regard the document discusses the cost of vandalism to the tra.nsportation industry. It must be understood, however, that no accurate accounting is available due to the fact that not all acts of vandalism are reported as such, and because those costs which are reported are usually estimates based upon current replacement or repair costs.
To develop pertinent data for this study the Legislative Research ;rr~\i Bureau conferred or corresponded with management officials and em-1,J)! ployees of (a) the MBTA, (b) the Boston and Maine' Railroad, and
(c) private bus companies; the Boston Bureau of the FBI, Boston police, and local police departments. On the national level, information was so~ght from the Chicago Rapid Transit Police Department, the New YorkTransit Authority,and other sources relative to passenger security.
L H ;1 II ,! il :1 , I
! 1

12 HOUSE - No. 5955 [February
CHAPTER II. MASSACHUSETTS PUBLIC TRA.NSPORTATION SYSTEM
Structure ot'the Massachusetts Bay Transportation Authority . .
General Powers. The Massachusetts Bay Transportation Authority was esta blished in 1964 by Chapter 161 A of the Massachusetts General Laws. This statute represents an evolution from the Metropolitan Transit A'uthority Act of 1947 which provided for the acquisition ofthe facilities and interests of the privately owned Boston Elevated Railway Company. The MBT A is a body politic and corporate and a polit~cal subdivision of the state, consisting of 79 cities and towns. A flvemember Board of Directors appointed by the governor for a term coterminous with the governor is responsible for the general management and control of the Authority. The Board appoints key personnel, determines the character and extent of Authority transportation services, approves Authority borrowing and contracts, and exercises other managerial powers within the framework and criteria of the MBT A law. However, the consent of the MBTA Advisory Board is required in relation to the action of the Board of Directors in (a) appointing a General Manager for the Authority, (b) establishing and changing transit system fares, (c) adopting an annual budget, (d) adopting and revising a program for mass transportation within t~e area constit}lting the Authority, and (e) authorizing certain capital improvements. I
Advisorv Board. The M BT A Advisory Board is composed of the city manager of each MBT A city having a council-manager form of government, the elected mayor of each other MBTA city, and the chairman of the Board of Selectmen of each M BT A town. Each member munici pality has one vote in proceedings of the Advisory Board, plus additional full or fractional votes (see following table) determined by multiplying (a) I ~% times the total number of MBTA members municipalities by (b) that community'S percentage share of all MBT A assessments as determined annually by the State Treasurer under MBTA law. Action by the Advisory Board requires a majority vote under that weighted voting system. 1
IG.L. c. 161A, 5S. 3-5.
\
"" -"
~ I !
I !""" j" '
f
It I~ I'~ [1
\ .~
1 ' \ • J
\ )' 1, I ' I : I i I '
! l ! 11 II 11 II 11
Ii 1;
1 i j;
"
,,'1, '\
1 i 1 i
1\ tl I;
L I ) f i I . r
~,
: '1\ ~
"G') -:.:; .
1980] HOUSE - No. 5955 13
Table 1. Voting Strength of MBTA Communities
No. of No. of No. of Municipality I Votes Municipality I Votes Municipalityl Votes
Arlington 3.2027 Lincoln I. "93 Reading 1.5848 Ashland 1.1452 LYNN 3.0858 REVERE 3.0073 Bedford 1.2078 Lynnfield 1.1961 Rockland 1.2439 Belmont 2.2121 MALDEN 3.6979 SALEM 1.9447 BEVERLY 1.6558 Manchester 1.0978 Saugus 1.7099 BOSTON 55.1194 Marblehead 1.4934 Scituate 1.2138 Braintree 1.9268 Marshfield 1.1491 Sharon 1.2279 Brookline 4.4880 Maynard 1.1594 Sherborn 1.0489 Burlington 1.3976 Medfield 1.1141 SOMERVILLE 5.4298 CAMBRIDGE 8.0922 MEDFORD 4.1694 Stoneham 1.3938 Canton 1.2881 MELROSE 1.8432 Sudbury 1.1882 CHELSEA 2.5725 Middleton 1.0749 Swampscott 1.4406 Cohasset 1.1014 Millis 1.0816 Topsfield 1.0752 Concord 1.2881 Milton 2.1854 Wakefield 1.6401 Danvers 1.4919 Nahant 1.1277 Walpole 1.2849 Dedham 1.7180 Natick 1.5753 WALTHAM 2.1353 Dover 1.0806 Needham 1.6030 Watertown 2.4738 Duxbury 1.0704 NEWTON 3.5045 Wayland 1.2459 EVERETT 3.3523 Norfolk 1.0638 Wellesley 1.5145 Framingham 1.7480 North Reading 1.2084 Wenham 1.0623 Hamilton 1.121 I NorwelI 1.1 /03 Weston 1.l539 Hanover 1.1527 Norwood 1.6012 Westwood 1.2808 Hingham 1.3633 PEABODY 1.7544 Weymouth 2.1528 Holbrook 1.3570 Pembroke 1.1308 Wilmington 1.3293 Hull 1.1486 QUINCY 3.9355 Winchester 1.5910 Lexington 1.7739 Randolph 1.6714 Winthrop 1.4939
WOBURN 1.8035
ICities appear in capital letters.
Source: G.l. c. 161A, SS. I and 7 and Chairman of MBTA Advisory Board.
Physical Description of M BTA. The popUlation of the 79 communi-ties which comprise the MBT A district is 2,763,41 D.' Within the confines of that district the MBT A operates about 1,500 vehicles2
which travel about 150,000 miles each day. The following table itemizes the routes, numbers of vehicles, pas-
senger miles of track, revenue miles, and other operations within the MBT A district.
~!-
1)970 U.S. Census.
21ncludes ~Ieased" buses.
14 HOUSE - No. 5955
Table 2. MBTA Service Activity
Number of Routes Bus Street car Rapid Transit Trackless trolley Commuter Rail (North & Socth)
Number of Vehicles' Bus Street car Rapid Transit
[February
176 5 3 4
10
Trackless trolley -'. . Rail Vehicles (36 lo.comotives; 89 coaches, 92 raIl dIesels)
1,08.1 308 333
50 217
Ridership Weekday (estimated) Annual (estimated)
Number of Stations Rapid Transit . Commuter Rail (North & Soutli)
Miles of Track In subway Bridges, elevated or surface Rapid Transit (one way) Commuter Rail (one way) (North & South)
Revenue Miles Bus Rapid Transit Street car Trackless trolley Commuter Rail (North & South)
Source: 1978 MBTAAnnual Report.
506,000 151,400,000
72 84
30 90
38.9 .259
22,367,682 9,669,877 5,093,884
360,367 5,231,788
r 't>
'-"'------'-----p 11
1980] HOUSE - No. 5955 15
Subsidized Commuter Railroad and Bus Company Services Under its basic statute, the MBTA is authorized to contract with
governmenEtl agencies, private transportation companies, and railroads for construction, operation, and use of any mass transportation facility and equipment held or later acquired by the Authority or for the joint or cooperative operation of equipment of any mass transportation facility with another party or for the whole or part of any operation of mass transit. Any such agreement with a private company must include service standards established by the Authority, if that service i3 to be subsidized or leased, and if any part of the cost is to be financed by the Authority. Mass transportation services operated directly by the Authority, or by parties under contracts with it, are not subject to the jurisdiction and control of the State Department 'of Public Utilities, except as to the safety of equipment and operations.
.Those services by private carriers are also exempt from local licensing requirements other than local common carrier permits specified for private transportation companies operating over local stt:eets. The MBTA is totally exempt from local licensing requirements in the operation of its own direct services.
Commuter Rail Service. Since 1964, commuter railroad service has been maintained by the railroads on certain of the Boston area lines, between downtown Bosto'n railroad terminals and outlining suburbs under contracts negotiated with the MBTA.
The original MBTA law of 1964 allowed the Commonwealth to contract with the MBT A to pay up to $5 million (but not over 50%) of the Authority'S cost of its commuter railroad service agreements. In 1967 the General Court incr~ased the state's contract assistance to 90% and in ] 972 to 100% of the commuter rail service being provided by the ·Boston and Maine Railroad to Northern localities and by the Penn Central on the South line, both under MBTA administrative control.
Currently, the MBTA commuter rail lines provide service to the following 37 North line communities, with cities identified by capital letters:
Acton BEVERLY GLOUCESTER Andover Billerica Hamilton Arlington BOSTON HAVERHILL Ayer CAMBRIDGE Ipswich Bedford Concord LAWRENCE
fJ ti 11 ~ jf d

16
Lexington Lincoln Littleton LOWELL LYNN MALDEN Manchester MEDFORD
o HOUSE - No. 5955
MELROSE NEWBURYPORT North Andover Reading Rockport SALEM Swampscott Wakefield
[February
WALTHAM Wenham Weston Wilmington Winchester WOBURN
. . h 0 uth and west of Boston receiving similar rail Localitles to t e so
service include:
ATTLEBORO BOSTON Canton Dedham Framingham Franklin
Mansfield Natick Needham NEWTON Norfolk . Norwood
Stoughton SPRINGFIELD 0
Walpole Wellesley Westwood WORCESTER
Foxborough Sharon 0 •
. 1 1918 ublic policy m Massachu-M BT A Funding. Smce July f' e;:ork in Greater Boston is a
setts has been that the tr~~sp~r~.l~~:alS businesses, and government public service of such bene ltto ill IVI f ' pays the difference between that the public through real est~te ta~a .lOn . d of operatmg servICe. l
mcome a11: ~xpe~ses. nte-d when five public trustees began That publIc polIcy was Impleme. (the "El") under the
. El vated RaIlway Company o operatmg ~~e Boston ; bOlic Control Act passed by the legislature on lease conditIOns of the u, d. after the Boston Elevated
22 1918 This occurre SIX years May,· . f t deficit amounting to $429,000. In Railway Company report~~~~ ~~ and th~re were small surpluses in 1913, the Company lost . 1917 there was a loss of $118,000. In the 1914, 1915 and 191~, b~~ l~El" was still under private control, losses first half of 1918 w en ~ . t ce was being deferred while the amounted to $572,000 .an mam enan ent! a large public invest-
company a waited PdubhC tda~~~~:~i~tO;::;~e fir~~ 12 months of p~blic ment had to be ma e an control was $3.1 million. 0 • ortation in Boston and
In 52 of the 60 years since 1918, public transp 1 1922 ' . Th . ht yea"s of surp us were . ,
vicinity has incurred a defiCIt. e elg 1.
I. MBTA Annual Report, '1978.
f [ I
--------
1980] HOUSE - No. 5955 17
1923, 1927,1928,1929,1942 and 1943. The Massahusetts Bay Transportation Authority, when it took control of the .;ystem from the Metropolitan Transit Authority in 1964, inherited a deficit of approxi-
ornately $6.9 million. The sources of funding for public transit, primarily passenger rev
enue and local taxation, were expanded to include the federal gover.nment with the passage of the Urban Mass Transportation Act of 1974. In 1977 the Authority became eligible for additional assistance in the funding of commuter rail operations. For the year ending December 31, 1979, the Authority received $36,500,000 in Federal operating grants.
Total income in 1978 (principally from fares) amounted to '$67,6'70,039 and total current expenses were $266,590,235, leaving a cost of service in excess of income of $199,920,196. Currently the MBT A employs 6,554 persons who receive a total of $121 ,425,860.87 In wages.
Municipal Assessment Procedures. All 79 cities and towns in the MBT A district pay a share of the MBT A yearly deficit or net cost of service. The assessment formulas for sharing the deficit were originally spelled out in the 1964 legislation creating the MBTA but they have been amended from time to time by the legislature to make the assessment more fair and equitable.
Assessments are governed by two basic types of M BT A service, "express" service and local service. Express service refers to rapid transit service on controlled rights of ways, while local service refers to MBT A buses, trackless trolleys, and street cars on local streets. The net cost of providing each of these types of service is calculated separately and allocated by a different formula. A ·large portion (75%) of the express service deficit is distributed among a11 cities and towns while the remaining 25% is a~sessed to those municipalities with rapid transit and rail service only. The shortfall in local service is assessed at 50% to the 79 cities and towns, with the remaining 50% additionally assessed to localities which have bus service outside the district.
To determine the operating loss incurred in each community, costs are first identified with a mode of service: bus, trackless trolley, and street car. All direct costs are identified directly with the appropriate mode, and indirect costs are allocated to modes largely based upon the direct charges to each mode each month. Costs by mode are then allocated to specific routes by means of one of six indices depending upon the type of expense involved. Direct costs of operation of each
:1
ri oj
q fi Ii if
i,

18 HOUSE ~'No. 5955 [February
rating station (depot) are charged to routes origin~tin~ ~rom that rating station. For example, costs of operating and maI~taInIng ro~tes from the Quincy garage are allocated only to routes In the QUIncy rating station. .
Fare box revenue is sampled on each route four times yearly, and the difference between operating cost and annual revenue determines the yearly profit or loss for each route. This profit. or loss is a~located to each city or town on the route, on the basis of mIleage. If a CIty 0: town elects to have no local service, buses then make no stops In the community and the profit or loss from routes passing through that town is distributed among the other localities on the route. For all cities and towns with local M BT A service, the losses and profits from the community are totaled. Half of the M BT A's local service assessment is then based on the percentage of local service operating losses incurred in each municipality. .
The M BT A assessment procedures are designed to reach two obJectives. The first objective is to recognize that the cities and towns in the M BT A district comprise an integrated transportation district, that all municipalities benefit by the system, and therefore all must s~are some of the deficit. The second objective is to assess a greater portIOn of the cost of operating the M BT A on those cities and towns that get a greater degree of service.
The M BT A's net assessable cost of service to the 79 cities and towns, which was assessed to them in November, 197~, was $146,289,972. Total income in 1978 amounted to $67,670,039 and total expenses were $266.540,235, leaving a cost of service in excess of income of $198,920,196. The difference between the cost of service in excess of income and the net assessable cost of service resulted from st,ate reimbursements of $24,696,562 for the M BT A debt service; additional state aid of $1,305,265 for the commuter railroad service outside the M BT A district and federal operating assistance of $26,628,398.
Regional Transit Authorities .. The Regional Transit and Transportation AuthorIty EnablIng Act
of 1973 (c. 1741) added a new Chapter 161B to the Gene.ral La~s: Chapter 161 B provided for two types of t~ansport~t~on entItles
outside the M BT A district: (I) ten regional transIt authOrItIes centered on standard metropolitan area statistical districts, whose basic territo-
~~~ ---- - --~-- ~---
t 1
~
':.ll)
" , J
1980] ~\~
HOUSE - No. 5955 19
ries are defined by Chapter 161 Band (2) regional transportatioI1 authorities whose municipal members are not enumerated by statute, and which may be created only in areas not included in a regional transit authority district or in the M BT A district. Thus, Chapter 161 B created ten regional transit authorities having an aggregate membership of 95 cities and towns. To date all ten authorities have been established as indicated in the following description:
(I) The Southeastern Regional Transit Authority includes: FALL RIVER, NEW BEDFORD, Acushnet, Dartmouth, Fairhaven, Freetown, Somerset, Swansea, and Westport.
(2) The Greater Attleboro-Taunton Regional Transit Authority includes: ATTLEBORO, TA UNTON, Berkley, Dighton. Mansfield, Norton, North Attleboro, Raynham, Rehoboth, and Seekonk.
(3) The Brockton Area Transit Authority includes: BROCKTON, Abington, Avon, Bridgewater, East Bridgewater, Easton, Hanson, Stoughton, West Bridgewater, and Whitman.
(4) The Massachusetts Regional Transportation Authority includes: GARDNER, FITCHBURG, LEOMINSTER, Lunenburg, and Westminster.
(5) The Merrimac Valley Regional Transportation Authority includes: HAVERHILL, LAWRENCE, Andover, Groveland, Merrimac, Methuen, and North Andover.
(6) The Lowell Regional Transportation Authority Includes: LOWELL, Billerica. Chelmsford, Dracut, Tewksbury, Tyngsboro, and Westford.
(7) The Berkshire Regional Transit Authority includes: PITTSFIELD, Dalton, Lanesborough, Lee, Lennox, Hinsdale. and Richmond.
(8) The Lower Pioneer Valley Regional Transportation Authority includes: CHICOPEE, HOLYOKE, NORTHAMPTON. SPRINGFIELD, WESTFIELD, Agawan, Amherst, East Longmeadow, Easthampton, Hadley, Longmeadow, Ludlow, Souih Hadley, West Springfield, and Wilbraham.
(9) The Worcester Regional Transportation Authority includes: WORCESTER, Auburn, Boylston, Grafton, Holden, Leicester, Millbury, Paxton, Shrewsbury, and West Boylston.
(10) The Cape Cod Regional Transit Authority includes: Barnstable, Bourne, Brewster, Chatham, Dennis, Eastham, Falmouth,
I' "
i ii
20 HOUSE - No. 5955 [February
Harwich, Mashpee, Orleans, Provincetown, Sandwich, Truro, Well
fleet and Yarmouth. The aggregate number of passengers served within all.1O ?istrict.s on
an annual basis is an estimated 1.9 million persons. SerVIce IS provIded
by buses only. Other transit authorities in operation include the recently estab-
lished Cape Ann Transit Authority (Gloucester, Ipswich, and Rockport) and the Greensfield-Montague Transit Authority (Acts of 1920,
c. 599). •
CHAPTER III. CRIME AND VANDALISM ON PUBLIC TRANSPORTATION
Definition (~r Crime .' There are many definitions and classifications of CrIme, depend 109
upon the individual's intended purpose and the precise statutory language. Crimes are generally divided into felonies and misde~e~n~rs according to the severity of the punishment accorded. In mostJUrISdlCtions misdemeanors are offenses for which the maximum period of confinement is one year, while felonies generally call for a State Prison sentence of more than a year. There is, however, considerable differences among the courts which have authority to place acts in either of
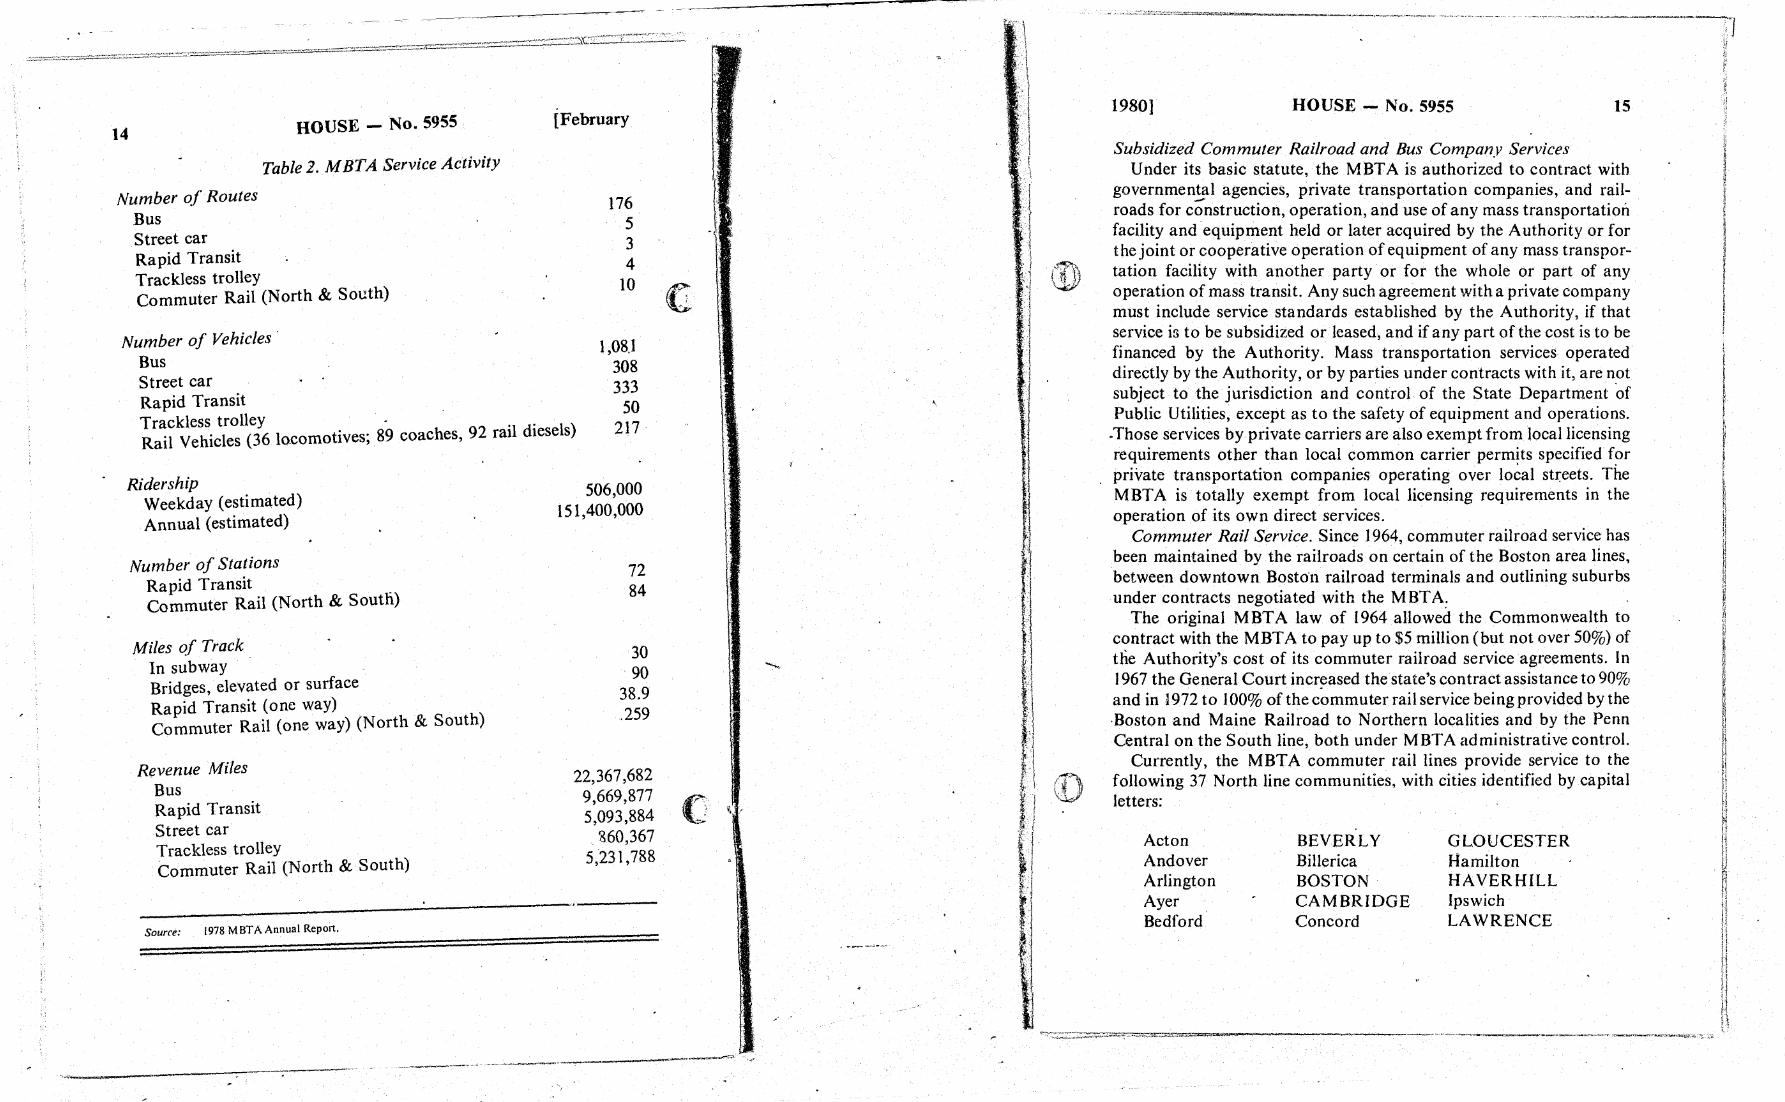
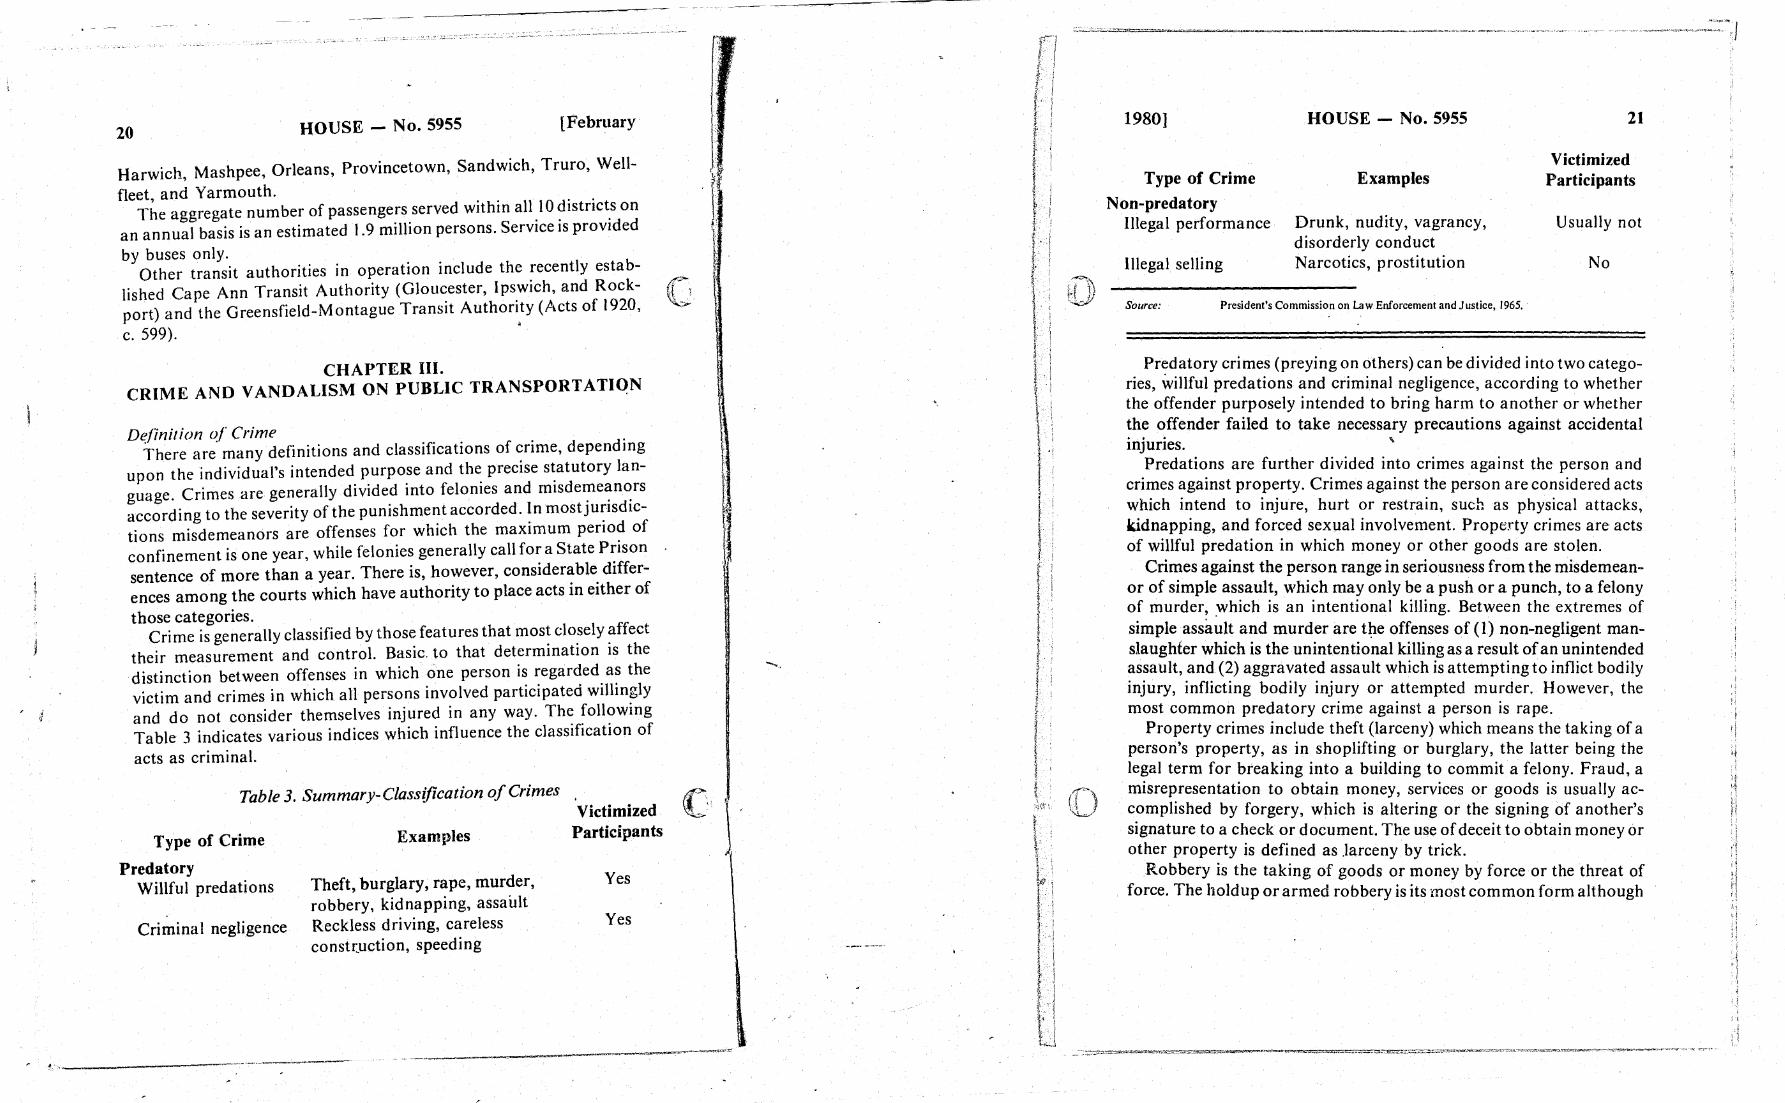
those categories. Crime is generally classified by those features that most closely affect
their measurement and control. Basic. to that determination is the distinction between offenses in which one person is regarded as the victim and crimes in which all persons involved participated willingly and do not consider themselves injured in any way. The following Table 3 indicates various indices which influence the classification of
acts as criminal.
Table 3. Summary-Classification of Crimes
Type of Crime
Predatory Willful predations
Criminal negligence
Examples
Theft, burglary, rape, murder, robbery, kidnapping, assault Reckless driving, careless constr:.uction, speeding
Victimized Participants
Yes
Yes
-- ------~~----------
r~ , " , -
(0(' "
1980]
Type of Crime
Non-predatory Illegal performance
Illegal selling
•
HOUSE - No. 5955
Examples
Drunk, nudity, vagrancy, disorderly conduct Narcotics, prostitution
Source: President's Commission on Law Enforcement and Justice, 1965.
21
Victimized Participants
Usually not
No
Pr~datory crimes (preying on others) can be divided into two categories, willful predations and criminal negligence, according to whether the offender purposely intended to bring harm to another or whether the offender failed to take necessary precautions against accidental injuries. "
Predations are further divided into crimes against the person and crimes against property. Crimes against the person are considered acts which intend to injure, hurt or restrain, such as physical attacks, kidnapping, and forced sexual involvement. Property crimes are acts of willful predation in which money or other goods are stolen.
Crimes against the person range in seriousness from the misdemeanor of simple assault, which may only be a push or a punch, to a felony of murder, ~hich is an intentional killing. Between the extremes of simple assault and murder are t~e offenses of (1) non-negligent manslaughter which is the unintentional killing as a result of an unintended assault, and (2) aggravated assault which is attempting to inflict bodily injury, inflicting bodily injury or attempted murder. However, the most common predatory crime against a person is rape.
Property crimes include theft (larceny) which means the taking of a person's property, as in shoplifting or burglary, the latter being the legal term for breaking into a building to commit a felony. Fraud, a misrepresentation to obtain money, services or goods is usually accomplished by forgery, which is altering or the signing of another's signature to a check or document. The use of deceit to obtain money or other property is defined as .larceny by trick.
Robbery is the taking of goods or money by force or the threat of force. The holdup or armed robbery is its most common form although
1,
"
" ,
J
! l

22 HOUSE - No. 5955 [February
unarmed robbery through·violent assault (mugging) causes more injuries to victims than does armed robbery.
Most tables in the FBI's annual crime register list murder, non-negligent manslaughter, aggravated assault, rape, and robbery as violent crimes while listing property crimes as nonviolent.
Indexing of Crime . In 1927, the International Association of Chiefs of Police established
a plan for the reporting, tabulation, a(ld classification of all crimes. With the financial and technical assistance of the Federal Bureau of Investigation, some 32 states had established crime indexing systems by 1978. The main 0 bjective of a crime indexing system is to establish lists of criminals who would most likely be responsible for current unsolved crimes, and for criminal acts likely to occur. There are currently seven indexed crimes which are reported into the Massachusetts indexing system: murder, non-negligent homicide, larceny-theft, aggravated assault, forceable rape, robbery, and burglary.
One method employed by many police agencies to establish criminal statistics is the recording of criminal acts through reports by victims. \Vhile this procedure may be considered an accurate listing of known crimes, it fails to consider those criminal acts which are victimless such as vandalism to private and public property. Acts of vandalism against public and private property are difficult to assess due to the factors associated with the commission of the act. Vandalism usually occurs during a time period when witnesses are not normally available, such as late evening or early morning hours, ·or in areas where citizens are least likely to pass by, such as deserted factories, bus or freight yards.
Causes of Crime Sociologists have established models in which environmental and
economic conditions are said to influence the level, type, and characteristics of crime and the criminal. Blighted, densely populated neighborhoods teeming with urban decay, unemployment, racism, inadequate housing, and social labeling produce, according to one model analysis, a greater amount of criminal activity than neighborhoods in which the quality of life is supported by a stable family oriented environment and relatively free from serious socioeconomic impairment. Adding some credibility to this analysis, the Massachusetts
... ,
•
19801 HOUSE - No. 5955 23
Commission on Probation, in review of 5,000 cases in district and superior courts from 1975 to 1978, concluded that persons between the ages of 17 and 25 and residing in identified socially, economically depressed neighborhoods represent the highest percentage of persons convicted of malicious destructi on of property. Of those persons convicted for vandalism, the report indicated that 81 percent had a record of one to three prior offenses involving crime against property and of these, 83 percent had previous criminal juvenile records. While all cri~inal activities cannot be traced to persons who hail from deprived envIronments, that circumstance, in combination with other factors such as age, sex and race, must be weighed in identifying people with potential criminal propensities.
The following table identifies by percentage the sex of those who have committed crimes in 1978 in the Commonwealth, based on each group of 100 arrests for the identified offenses.
. TABLE 4. Criminal Activity by Sex and Race
Type of Crime Men Women Whites Blacks Other Minority
Petty theft-larceny 89 83 43 54 2 Disorderly cond uct 85 76 38 60 2
Assault 49 5 41 57 2 Robbery II I 37 61 2 Burglary 17 4 39 60 I
Source: Boston Police Department Data Center{criminal activity-period of Januury to June 1978),
and Federal Bureau of Investigation, Uniform Crime Repurts, 1978 (race).
The data reveals that men and women are almost equally res ponsible for criminal activity in the area of larceny and disorderly conduct, an indication that such offenses are frequently committed with accomplices.
An analysis of offenses by age using the same categories of crime indicate that young persons of the age classes below are most frequently involved in criminal activities than persons over 30.
Ii "

----- -----~----...,,---
24 HOUSE - No. 5955 [February
TA BLE 5. A verage Age of Selected Crime qffenders
Type of Crime Men/Age Women/Age
Petty theft-larceny 18 16 Disorderly conduct 17 17 Assault 24 21 Robbery 22 28 Burglary 23 29
SourC'e: Federal Law Enforcement Assistance Administmtion News/eller. MarC'h /979.
In the light of the above documentation it would appear that males between the ages of 18 and 30 commit crimes more frequently than all other age groups.
In addition to the above influences on criminal behavior, some clinical psychotherapists ascribe cri~e. to defects of personality, which they attribute to inadequate resolution of childhood emotional problems. But these specialists offer diverse theories on the particular kinds of early experience that cause later misconduct. Also, there are those who have chosen illegal behavior, due to biological factors as a life's ambition. '
Finally spontaneous criminal acts are those acts which occur when the offender has an available target which carries with it a minimal amount of risk such as windows on a deserted building or buses in an unlit storage yard.
M BT A Crime Statistics Tabulations compiled by the Authority documenting various forms
of ~rime committed on MBTA property are used primarily to provide " polIce and public officials with sufficient information to maintain prope~ police protection of passengers and equipment. The following table IS a tally of reported incidents on all MBTA lines which are ~onnected, such as the subway routes and connecting bus and surface ~mes. SOI:ne law ~nforcement officers question the validity of the data. III reflectmg the mcidence of crime on the MBT A. An examination of
L
r •
p
ff) ( .... ~
(J ;
i
1980] HOUSE - No. 5955 25
the file on Authority premises by the author of this Council report indicates that there are many flaws in the reporting and recording practices.
TABLE 6. Line Totals on MBTA Incidents by Type of Offense
(January through June 1979)
Red Blue Orange Green High Line Line Line Line Bus Speed General
Robbery II 15 136 25 13 4 I . Sex Offenses 8 II 10 I 3 Police Response 320 114 407 333 110 57 36 Motor Vehicles 7 39 43 4 24 3 6 Missiles 76 35 49 10 157 46 36 Vandalism 35 40 28 38 67 23 27 Missing Property 31 7 35 244 56 18 Larceny 20 9 102 114 72 7 17 Larceny from the Person
Drugs I 4 I Disorderly 319 108 681 525 58 31 18 Drunk 109 24 194 219 42 5 15 Bomb Threat 14 II I I 4 12 Breaking &
Entering 10 15 31 20 3 I 4 Assault -1L .1.L. --1L ..iL li- I 10
Total 994 427 1,803 1,588 618 182 204 -- -- --
Source: M BT A Police Department
Grand Total
205 33
1,377 126 409 258 391 341
6 1,740
608 43
84 195
5,816
While the tabulation indicates compatability with "known" high crime neighborhoods, there is serious question as to the reliability of the data due" to a lack of specific definitions for listed offenses. For example, the category "ro bbery" includes both those incidents which satisfy the legal definition and other related offenses. The MBT A comparison crime statistics for 1975, 1976, and 1977 combine armed and unarmed robbery. The Massachusetts General Laws clearly differentiate between armed and unarmed robbery. Chapter 265, 17
I I!
j I

26 HOUSE - No. 5955 [February
defines armed robbery as "whoever, being armed with a dangerous weapon, assaults another or robs, steals or takes from his person money or other property which may be the subject oflarceny, shall be punished by imprisonment in the state prison for life or for any term of years: provided, however, that any person who commits any offense described herein while masked ordisguised or while having his features artificially distorted shall, for the first offense be sentenced to imprisonment for not less than five years and for any subsequent offense for not less than ten years." Unarmed robbery is defined in Chapter 265, section 19 as "whoever, not being armed with a dangerous weapon, by force and violence, or by assault and putting in fear, robs, steals, and takes from the person of another, money or other property which may be the subject of larceny shall be punished by imprisonment in the state prison for life or for any term of years." It is quite clear that the statutory definitions of armed robbery and unarmed robbery represent two different offenses, and warrant separate identification in a statistical tabulation.
A more detailed review of the MBTAchartsindicatesfurtherdiscrep-ancies. Sex offenses are listed without explanation as to category or definition. The Massachusetts General Laws categorize "sex offenses" in two main areas: crimes against the person (Chapter 265 and specifically sections 13F, 22, 22A, 23, 24, and 24B) and crimes against chastity, morality, decency and good order (Chapter 272 and specifically sections 2, 3, 4, 14, 17, 18,35, 35A, 53, 59, and 63).
Since the sex offenses are not clearly outlined it is difficult to establish the impact and the severity of those incidents. The general ridership of the MBTA, when confronted with the term "sex offense", perceives the phrase in such a way as to assume a physical sexual attack has occurred. When asked for a definition of "sex offense", however, M BT A spokesman H ugh Findlay responded that "all known or reported sex offenses are placed into that category".
Perhaps the least identifiable statistic recorded by the MBT A is the term "Police Response". While generally understood to mean that the M BT A police have responded to a call for help or to investigate a ~isturbance or potential disturbance, this category, according to the M BT A Research Director, Hugh Findlay, includes special duties, assignments, shifts in assignments to cover sick days and vacation, and general security assignments. Given this factor, it would appear that
,i
1980] HOUSE - No. 5955 27
the conclusion drawn (1,377 police responses from January to June 1979 result in an average of 229.5 responses per month or 3.825 per month for each of the 60 patrolmen) is debatable.
Motor Vehicle violations were found to be supported by specific complaints issued by Registry of Motor Vehicle officers rather than by MBTA police. These violations were usually incidents in which accidents have occurred or when cars of trucks became stalled or disabled , thereby disrupting service on surface vehicle lines.
Any object hurled in the direction of passenger or MBTA vehicles is placed into the "missiles" category. While no objection is raised with that definition, it should be explained that, according to M BT A officials, this includes everything from "snowballs to rubberbands".
Vandalism is a catch-all column. It includes known acts of vandalism in which an arrest is made, to discovered acts of vandalism and any damage to vehicles or stations which cannot be otherwise accounted for.
Since "mIssing property" is a verifiable two party situation in which a person reports that personal property has been lost, and the report is received and recorded, there is little reason to doubt that the figures represent actual occurrences. What is noteworthy, however, is that the MBT A maintains no files to indicate whether such property is returned to the owner upon recovery. Accurate record keeping would insure MBTA personnel against exposure to unfounded complaints ofmisappropriation in sllch instances.
'. Larceny statisti~s a~d the recordin.g thereof are subject to question m two areas. The fIrst IS concerned WIth the Authority'S interpretation of :he sta.tutory definition of the offense. Chapter 266, section 25 defmes l~rceny as "stealing from the person of another" and Chapter 266, sectIOn 30 covers the intent to defraud by false pretense and the theft of money, property and other objects. However, the MBTA Police Department lumps in this category known thefts, as defined by the Massachusetts General Laws, and any theft which is assumed to be larceny such as an unverified .report of a hand bag snatchi ng. While there is no disagreement with the intent of the MBT A in recording these crimes, its ~eporting classification in this area severely limits any clear understandmg as to the level of thefts actuaIly occurring.
The categories of drugs, disorderly, drunk, and bomb threat are considered to be the most reliable areas in which statistical tabulations
'j
f f

28 HOUSE - No. 5955 [February
have been recorded. No explanation exists for this conclusion other than the material reviewed was supported by more than one other sourre.
Breaking and entering (B&E) incidents are recorded without followup, and in some cases, without investigation. Buses, other vehicles, buildings, and booths which have been broken into are usually discovered by MBTA employees. Some reports, however, indicated a probability that some occurrences should be listed as employee destruction and theft rather than B&E. Since records concerning this area are not allowed public perusal, actual tabulations cannot be verified.
The last category of criminal offense is assault. Chapter 265 of the General Laws defines acts which may constitute various forms of assa ult such as assault and battery (s. 13A), indecent assault and battery (s. 136), assault and battery to collect money (s. 13C), assault and battery upon certain public officers or employees (s. 130), assault with intent to murder or maim (s. 15), assault and battery with a dangerous weapon (s. 15A), assault with a dangerous weapon (s. 15B), armed assault (s. 18B), unarmed assault (s. 20), assault with intent to rape (s. 24), and assault with intent to commit felony (s. 29). Since no specific sections are cited with regard to reports of the type of assault, there is serious difficulty in attempting to determine the actual severity of reported tabulations of assault incidents occurring on Authority property and equipment.
Despite the cited irregularities, crime aboard the M BT A, in certain areas, may be less than the average crime rate for the City of Boston. During the period of January to June ~979, II robbery incidents took place on the Red Line (Quincy / AshmlOnt to Harvard), 15 on the Blue Line (Wonderland to Bowdoin), and 136 on the Orange Line (Oak Grove to Forest Hills). During this period the Red Line serviced 14,064,120 passengers, the Blue Line 12,311,880 passengers and the Orange Line 10,905,840 patrons. Thus, on the Red Line one robbery incident took place for every 1,278,556 passengers, for every 820,792 passengers on the Blue Line and for every 80, 190 riders on the Orange Line.
Total incidents for the Red, Blue and Orange Lines were 3,224 which when compared to a total ridership of 37,281,840 passengers translates' into one incident for every 11,576 passengers. However, it should be
-----~~ --.--~--~--------- ---------~--------~----
"
, '
1980] HOUSE - No. 5955 29
remembered that most offenses listed in the table are not crimes against the person. Crimes against the person (robbery, sex offenses, larceny and assault) for the six month period totaled 437 which means that one incident against the person occurred for every 85,313 passengers.
M BTA Vandalism Costs The estimated cost of destruction and damage to equipment and
property of the M BT A is established through an accounting of employee hours and the cost of materials needed for repair. For the years 1971 to 1978 inclusive, the Authority incurred costs of approximately $4.3 ,million to repair or replace equipment or plant property damaged by vandalism.
Labor Hours. Labor hours represent the actual "clocked" time employees worked on jobs which are related to the repair of equipment and property. It is not clear, however, whether all hours clocked for repairs are actually hours worked on repairs related to vandalism. Other factors such as provisions in union contracts whereby employees are assigned to specific jobs for definite periods of time and the requirement that certain employees who have specific job ratings must await the arrival of other rated employees to perform tasks not covered by their immediate job title add hours to the number of hours required to effect repairs. The total number of employee hours, therefore, includes a variety of factors that are not directly related to the actual amount of work performed.
Salary increases on a yearly basis ha ve also added to the cost of repairs insofar as labor is concerned. Moreover, as union contracts become more sophisticated, so does the difficulty in assessing actual labor costs for repairs.
Materials. Fueled by inflation, the cost of materials has placed a heavy burden on the MBTA budget. The steady increase in such expenditures, except for 1974 for which no explanation exists, is second only to labor costs. In the main, replacement tbaterial includes windows, seat material, carpentry products, and tires. While the MBTA maintains an adequate surplus of most parts, it is difficult to project which parts will be needed in greater quantity.
Other Services. This category includes contractual agreements with private contractors for repairs, consultants' fees for assessing repairs
I , Ij , '

Table 7. Estimated MBTA Vandalism Costs, 1971-1978 1971 1972 1973 1974 1975 1976
Lanor Hours 30.4S7.7 30,480.6 36,753.3 43.247.3 53.528.6 M,540.2
Lanor CostS $18l:L915.51 $205.538.30 5264.046.6H $338,409.11 5423.553.J~ 5510.512.98 Materials 54'!D4.97 77.628.48 77.714.60 63,653.12 95.779.93 121,400.20 Other Services 12,397.10 3.189.52 49.620.91 27,637.21 19.966.H9 27.420.18 Sub-Total $256.147.58 $2S6,256.30 5391.3!!2.19 S429.699.44 $539.300.14 $659.333.36
Rr.~tiluti()n . Salvage 2S6.53 269.28 377.S0 27.00 2.787.S8 2,425.27
Total $255.861.05 $285,987.0 S391,004.39 $429,672.44. $536.512.26 $656,90S.09
Grand Total $4,273.591. 70
Source: Massachusetts Bay Transportation Authority
1977
73.520.1
$596,983.21 131.425.3 I
11.247.21 $739.655.73
348.29 $739,307.44
/
--~-- ------ -....,.----- ----------
1978
H1.510.1 :: 0
S7H2.775.iHl L: 162,335.20 rJJ
~ 34.420.18 $979.531.18 I
Z 1.191.20 0 .
S978,33X.98 U'I ~ U'I U'I
/.
; .. ,'.-1 0' •• 1 , I
r •
II I' 1\
~I.·:·l •.. : - 0
,
.'
1980] HOUSE ~ No. 5955 31
and, in some cases, overtime for M BTA police who investigate certain' damage caused by vandals. .
Restitution/ Salvage. This item represents the amount of salvageable Il)aterial or court ordered restitution paid by persons arrested and convicted of vandalism.
Financial Impact. Since the assessment formula requires that most general expenditures are assessed on all 79 cities and towns within the district, the total cost for vandalism from 1971 to 1978 means that each of the member communities were charged approximately $52,562.76.
The cost of vandalism is, by any measurement, expensive. The factors involved in calculating those costs are equally expensive. Union contracts which determine the am.ount of employees working a specific task add untold man hours which cannot be divided into actual hours per man per job. Work shifts in which the repair job was done can add to labor cost if the job was performed by night shift personnel who receive a differential rate higher than day employees. Inflation adds approximately 10% per year to materials cost. Damage to new equipment is often more expensive than damage to old equipment as the sophisticated parts to an L R V are by far more costly than parts of older vehicles. Beyond these considerations is the fact that the M BT A policy on repairs, and related records, does not distinguish damage incurred, which cannot otherwise be accounted for. As a consequence, employee damage is often attributed to vandalism. The M BT A offers no explanation for this except the statement made by Chairman Robert N. Foster during the course of this study that "the cost of vandalism is, without doubt, riddled with the costs of employee damage and we have not yet separated the two into a clear statement of fact".
Crime Experience-Commuter Bus Companies In an attempt to secure data relative to crime and vandalism expe
rienced by private bus lines, the Legislative Research Bureau through a form questionnaire sought information from 50 bus companies on the following points:
I. Number of Buses or Other Transportation Vehicles Currently in Use.
2. Approximate Number of Cities and Towns Served. 3. Principal County of Operation. 4. Approximate Number of Passengers Served Daily and Month
ly.

----~- -- --~-~ ---
32 HOUSE - No. 5955 [February
5. Damage to Vehicles. 6. Peak Ho~rs of Vandalism. if'/
7. Day of Week in which Vandalism is Most Likely to Occur. 8. Approximate Cost to Repair Damage Caused by Vandals. 9. Criminal Acts Committed aboard Transportation Vehicles in
Last Three Years. 10. What Steps, If Any, Should the Commonwealth Take to Curb rr;
Acts of Vandalism and Crime aboard Public Transportation ~ Vehicles?
Of the 20 companies'
which responded, 15 reported no crimes against the person.2 Four had crimes against the person such as pickpockets and purse snatching and one companyJ a robbery. All respondents reported acts of vandalism against equipment and vehicles. The approximate number of passengers served by the companies is 18,000,000 persons annually who rode on 350 buses within 169 cities and towns.
The total dollar value of vandalism damage reported by the 20 companies was $345,000 in 1978 and $492,000 as of October 1979'. The more common targets of vandalism were windows, seat and passenger supports. Damage attributable to graffiti was very frequently mentioned. All reporting companies agreed that more stringent laws against vandalism and added local police protection would help in curbing acts of crime and vandalism.
CHAPTER IV. TRANSPORTATION POLICE & RELATED SECURITY
EMPLOYEES
M BT A Po/ice Prior to March 1965, any reported criminal activities on M BT A
properties ~waited the response of members of local law enforcement
'ABC Inc. (Plymouth): Almeida Bus Lines (New Bedford): Bane Bus Co. (Rutland); Bay Stat~ Bus Corp. (Brockton): Bettencourt Bus Co. (Milford); Birmingham Bus Co. (M ilfnrd); Bos~on Commuter L~nes (Haver- ~ hill); Brander Bus Line (Rehobotb): Canton & Blue Hills Bus Line (Medford); FItchburg & l.eomlnster Street ~ Railway (Fitchburg): Michaud Bus Cr;. (Salem); Natick Bus Co. (Natick); New England Bus Co. (Acushnet); Northside Bus Co. (Barnstable): Petr,r Pan Bus Lines (Springfield); Picrce Transit Co. (Dracut); Plymouth, & Brockton Street Railw"y CG. (Plymouth); Rapid Transit Inc. (Winthrop); Trombly Motor Coach ServIce
(North Andover); and Tr:ivel Time Inc. (Oxford).
~A review of police rcport~ in four cities serviced by one of the 15 bus companics which reportcd that no crimes against the persoll oC('urred revealed tlwt :1 total of ! I incidents took place in 1979. There appears to hc a reluctance bv bus companies to report incidcnts which may endanger ridership. insurance rates, school bus service cont;aets and. as 1I consequence. cast dispcrsions (lv..:r the company's ability to protect its passcngers,
lTrombly Motor Coach Sen'ice (North Andovcr).
. I
------~-.
1980] HOUSE - No. 5955 33
agencies. The response was generally inadequate, being primarily due to the priority of local community commitments.ln view of this fact, the general escalation of crime and the Authority's realization that pu'blic perception of the system's safety record was affecting ridership, the Board of Directors voted to create an M BT A Poli,ce Department. During the planning stages, from March 1965 to January 1966, it was necessary to hire Boston police on a paid detail basis to protect various rapid transit stations. In January of 1966, the Boston Police Department assigned a 35-man force (known as U nit B) to provide this service. This unit was paid for by the Authority and functioned primarily during the day. Special detail men were assigned for night duty. This. practice continued· until late 1968. In 1968, legislation was passed authorizing the creation of an MBTA police force subject to Civil Service provisions (G.L. c. 31).1 The police force was formed on December 9, 1968, with the hiring of 30 men, certified by Civil Service and authorized to exercise police powers in the 79 cities and towns of the MBTA district.
The new MBT A police officers were primarily assigned to ride buses in the Roxbury area, and to patrol the rapid transit system. This effort was supplemented as needed by the Boston Police Department in the form of paid details. After the Authority conducted a cost and value analysis of the special paid units, it was determined that a more practical c~st-effective approach would be to discontinue the Boston Police details and substitute them with full-time MBT A policemen. Consequently, in 1971, the MBTA Police Department was expanded to its present compliment of 63 patrolmen.
The MBT A Police Department underwent some administrative operational changes during 1978. The command structure was revised with the assignment of a lieutenant to serve as assistant to the chief, and later in the year another lieutenant position was established. The assignmel)t of one lieutenant to day duty and the other to the night shift simplified the chain of command with three sergeants reporting to each of the lieutenants. Two new staff members were added, a manager of planning and research and a new administrative assistant - both with backgrounds in police planning and administration. By the end of 1978, a police communications system was in operation through the use of mobile and ponable two-way radios that established commlmication from MBT A police headquarters at the Cabot Center to aU
IActs of 1968, c. 664.
i;
}
.. ~
, ,

"
34 HOUSE - No. 5955 [February
officers on the system, between officers anywhere in the system and with other police departments, through the Boston Area Police Net (8apern). In 1979 the M BT A Board of Directors appointed Mr. John Dow a retired Boston Police Captain, as chief of police. Since his , . appointment Chief Dow has established "CARE", the commumty area response effort, to develop close contact with residents of MBTA neil7hborhoods in order to establish priorities to prevent and deter
=>
crIme.
MBTA Starters MBTA starters are management employees who supervise the oper-
ation and scheduling of subway trains, buses, trackless trolleys, and light rail vehicles. Usually located within the MBT A stations, starters are available to advise operators of operational decisions and changes in scheduling or routing due to accidents, emergencies or other events.
In addition to these duties, some starters are authorized to act under special assign'ment as security personnel. Given special police powers by the City of Boston upon written request of the MBT A, starters may act as police officers upon the premises and vehicles under control of the M BT A. Generally, starters enforce the rules and regulations relative to passengers such as smoking bans, littering, and loitering. They are further responsible for preventing any breach of peace or other criminal acts which occur in their presence.
Railroad Police Boston and Main Railroad police are organized under Chapter 22,
section 9L of the General Laws which reads as follows:
Upon the petition of a railroad corporation, or of a railway company or the Boston Terminal Corporation, or of a railway express agency or a common carrier of passengers by water for hire having a usual place of receiving or discharging p.assengers within the Commonwealth; may from time to time, appoint as police officers as many of the persons designated as it may deem proper, for the purposes and the powers set forth. Any personnel appointed as a police officer upon the petition ofa railroad corporation mayactasa police officer upon the premises and vehicles of any corporation tran~porting passengers or property by motor vehicle under the joint control and management of said corporation and said railroad corporation.
1980] HOUSE - No. 5955 35
Petitions by railroad corporations on behalf of employees to be' appointed as police officers are made to the Department of Public Safety.
The Boston and Maine Railroad police are currently responsible for 189 miles of track, 135 buildings and structures, 200 vehicles, and 42 substations within the state.
In addition to providing protection to the public against the more frequently committed "common law" and statutory crimes, the M BT A and railroad police are responsible for the enforcment of a host of statutes dealing with a wide variety of acts such as loitering, vandalism and interference with the operation of rolling stock. Provisions governing such offenses are found principally in Chapters 160and 161 of the General Laws.
Recommended Action h~terviews by Bureau staff \"Iith various transit employees, such as
MBT A policemen and starters, and members of the M BT A Advisory Board indicate a dissatisfaction with current passenger security methods. Generally, those interviewed regarded the MBTA Police Department as inefficient. Criticisms, however, were not directed toward individual employees, but Upon the methods of operation and the ability of the department to meet security needs. There is apparent unanimity among those interviewed in the following areas:
I. The M BT A Police Department is too small to be effective. 2. Communication equipment is not sufficient. 3. The M BT A Police Department lacks a crime prevention pro
gram. Other criticisms involved general operation methods such as shift assignments, overtime, training, public relations, and police visibility.
The following text summarizes the recommendations made in interviews to correct the apparent deficiencies.
The MBT A Police Department should be expanded to a staff of200 patrolmen, each to be trained at the State Police Academy. Shift assignments would include: 50 patrolmen assigned to the 8-5 pm shift, 100 patrolmen to the 4- I :00 pm shift, with the remaining 50 assigned to revolving shifts. The command staff should be augmented to include two more lieutenants and two sergeants who would act as shift supervisors, and two captains, one of whom would act as shift commander on the 4"; 1 :00 pm shift and the second would supervise the 50 revolving policemen.
--~~------
, , I
II
, , ! I' i
I!

36 HOUSE - No. 5955 [February
It is also suggested that the department be vested with greater autonomy, thus freeing it from compliance with MBTA administrative directives, which often include reassignment of personnel to stations as a result of passenger complaints which are often not properly screened.
Equipment in the form of electronic surveilance devices such as TV monitors and station "call for help" buttons should be purchased for the department. M BT A police substations should be located at central line locations such as Egleston Station, Fields Corner, North Station and Boylston; Critics contend that the use of substations would reduce response time by policemen and would provide a visible deterrent.
Public relations should be stepped up with visits by M BT A police employees to schools, community centers, and neighborhood civic meetings.
Although, as has been indicated, these proposed courses of action originated from several sources, none of the advocates furnished any cost estimates of implementation, or references to funding sources.
Chief John Dow of the department indicates that the department has some difficulties but, as of the time of this report, he has not proposed any formal recommendations for changes either in policy areas or the structure of the police unit.
CHAPTER V. SECURITY PROCEDURES ELSEWHERE
Transit System Usage Today, in the United States, there is no urban public transit system
which can be considered a serious competitor of the private automobile for commuter preference except perhaps in New York City where driving is so difficult and parking costs so prohibitive. According to the 1978 report of the American Public Transit Association (APT A), the combination of bus,1 street car, urban rail, and commuter rail accounts for only 5.5 percent of the commuter trip miles. During the 1965-1975 decade, while urban automobile usage increased 74 percent in passenger miles traveied, bus usage dropped 26 percent and commuter rail 8.5 percent. Since 1975, with the massive infusion of public funds, the downward trend in transit use has been arrested. However, patronage continues to remain at a low ebb because urban transit systems have not offered a service which attracts people away from their automobiles. A factor contributing to the negative response to public transit is
Iincludcs trolley-bus but excludes school bus.
----~-----~---------
• r
\
1980] HOUSE - No. 5955 37
the notoriety given to criminal actions committed on the systems which cultivates an impression on the part of the public that one travels "at your own risk."
External Security Devices From the viewpoint of a traveler, personal security is a very impor
tant service feature of any public transportation system. Protection of the system from vandalism and property damage is of less direct concern to the average rider, except that the steps taken to curb vandalism may impinge on the kind of service offered.
For obvious reasons, most transit companies will not reveal the details of security systems currently in use. Hence, the following text treats the physical improvements implemented in Montreal, New Jersey, L'"ls Angeles, New York City, Chicago, Philadelphia, and other selected cities in which data were obtainable.
The question of passenger security begins when the passenger enters the vehicles or premises of the carrier. Clearly the larger security problem is the walk through city streets on the way to a station or vehicle, but this is beyond the responsibility of the system operator.
In many cities closed circuit television survei!lance of the station platform is frequently used. Elevators to the stations and station platforms are an effective crime deterrent. The Montreal transit system is consideri.ng the use of video surveillance on board trains which travel late at night when personnel is at a minimum. Massive lighting programs have been undertaken in New York, Los Angeles, and Philadelphia: "Call for Help" buttons are currently being installed as an experiment in New York and Los Angeles. A passenger would, if threaten~d, push a "call" button which would notify security personnel on patrol that a passenger is in danger. Fines and penalties for misuse of the system by pranksters are the same as for the offense of false fire alarms, a maximum fine of $1 0,000 or imprisonment for a minimum of five years, or both.
More and more carriers are demanding that passengers have the exact fare, and locked fare boxes are considered a strong deterrent against theft and robbery. Transport of New Jersey (TNJ) equips its vehicles with hazard lights which, when flashing, indicate a need for police assistance. Moreover, all new buses that TN] is acquiring are equipped with unbreakable windows and broken glass windows will be repl~ced with this material.
, , ,

38 HO USE - No. 5955 [February
Other systems and techniques tried by other carriers include:
I. Two-way voice communication. Radios installed in buses permit operators to talk to dispatchers in a central location at any time.
2. Tele-camera. Such cameras have been placed in ~uses in San Diego and recording is made when activated by the operator.
3. Security force. The Baltimore Mass Transit Authority has its own private security force which responds to emergencies when impractical for local police to do so. 4. Uniformed passengers. The Southeastern Pennsylvania
Transportation Authority (SEPTA) encourages uniformed persons to ride their buses free of fare as a psychological deterrent. 5. Audio recording. The Bi-State Transit Authority in St.
Louis records telephone and radio conservations for future administrative and legal uses.
6. Helicopter Patrol. The Newark division of the ErieLackawanna Railroad uses a helicopter to patrol the tracks within a 16-mile radius. The main objective of the helicopter patrol is to increase the effectiveness and mobility of the railroad police. Railroad helicopter patrols are presently operating in Philadelphia and New York City.
The Chicago Transit Authority (CT A) employs, either through direct employment, temporary employment or contractual agreement about 1,200 persons who are involved in transportation security and passenger safety. The Authority's security structure includes a police force, station guards, decoy passengers on buses, investigation uhits, and police planning and research personnel.
In 1978, the CT A recorded 11,000 1 incidents of crime and vandalism. Of those incidents, over 9,000 related to acts of vandalism, 1,000 involved crimes against the person such as robbery, assault and sex offenses, and the remainder involved offenses against property such as
I Rounded to the nearest 1,(lOO.
-~-~-----
.... ~
f ,-:1
! \
1 t I \ ! !
i I , l j
l ! I'
Ii , ) I I [I I-Ii r J i f i ,/1
11 , !
11 j: 1 '
I
I
I f
j , l LJ
I , I
~'" \I Y ,,~
(
•
19801 HO USE - No. 5955 39
larceny, pickpocketing and handbag snatching. Of those crimes' against the person, 409 involved CT A employees such as trainmen and bus dri~ers who were robbed or assaulted. Crimes against property largely Involved passengers; however, CT A notes an increase in stolen employee property, such as wallets and handbags.
The CT A has given priorty to patron security and the reduction of vandalism as the main focus of its crime prevention efforts. This security effort inCludes:
I. Vehicle radio system. This system is monitored by the radio dispatcher's office. 2. Closed circuit TV surveillance of stations, platforms
and buildings. 3. K-9 patrols, particularly in stations where high inci
dence of crime occur. 4. Community education programs. CTA employees visit
schools and community organizations to inform citizens of s.ecurity procedures and provide information on crime.
Federal Assistance
While no direct funds are available for security under Department of Transportation grants, transit systems have utilized federal money to serve a dual purpose for security and equipment improvement and maintenance. The design of physical property such as stations and terminals to include adequate lighting, communication facilities and passenger safety devices, such as "help" buttons and emergency phones, have helped transit officials in Chicago, California and New York in combating crime. Choosing alternative materials for windows, such as nonbreakable plastics and vehicle seats made from hard plastics, has proven to be cost efficient and a deterrent to vandals.
To date, it appears that the M BT A has used federal grants to underwrite only one security-related development, namely the purchase of portable radios for police department use. Since the MBTA has been criticized for the lack of a clear policy relative to combating crime within its jurisdiction, it is difficult to assess the prOjected use ot federal transportation grants for the security needs of the M BT A.
This Document Has Been Printed On 100% Recycled Paper.
!,
i I'
i ~ (
) i ~ ~
, ' i l , , i
- ~ ) ;
! 1 I
•
'1 1
1 ,