Quid Pro Quo - b.3cdn.net · Quid Pro Quo 2 Executive summary Banks are fundamentally different...
88
Quid Pro Quo Redressing the privileges of the banking industry
Transcript of Quid Pro Quo - b.3cdn.net · Quid Pro Quo 2 Executive summary Banks are fundamentally different...
Quid Pro Quo Redressing the privileges of the banking industry

nef programme areas:
Finance and Business
Climate Change and Energy
Natural Economies
Connected Economies
Social Policy Valuing What Matters
Well-being
Democracy and Participation
nef is an independent think-and-do tank that inspires and demonstrates real economic well-being.
We aim to improve quality of life by promoting innovative solutions that challenge mainstream thinking on economic, environmental and social issues. We work in partnership and put people and the planet fi rst.
nef (the new economics foundation) is a registered charity founded in 1986 by the leaders of The Other Economic Summit (TOES), which forced issues such as international debt onto the agenda of the G8 summit meetings. It has taken a lead in helping establish new coalitions and organisations such as the Jubilee 2000 debt campaign; the Ethical Trading Initiative; the UK Social Investment Forum; and new ways to measure social and economic well-being.

Executive summary 2
Introduction 4
1. Have banks always been so profitable? 6
2. Do banks operate in efficient markets? 16
3. The too-big-to-fail subsidy 36
4. Have banks fully paid for deposit and liquidity insurance? 42
5. The right to create money 44
6. Are banks under-taxed? 50
7. Is the government taking action to rectify the problems raised in this report? 59
8. Conclusions 69
Appendix A 72
Appendix B 73
Endnotes 77
Contents
Quid Pro Quo 2Quid Pro Quo 2
Executive summary
Banks are fundamentally different from other companies and regulators are letting the industry exploit its unique status to realise excessive profits. This is apparent in its relationships both with the state and with customers. The proposals in the interim report of the Independent Commission on Banking (ICB) do not go far enough to achieve a fair deal for either taxpayers or consumers.
A fair deal for taxpayers?Banks occupy a unique position in our economy and enjoy privileges that other industries can never hope for. This is most obvious in the way that major banks – Northern Rock, Royal Bank of Scotland, and Lloyds TSB – were bailed out by the government during the financial crisis, moves that have prompted a great deal of public concern.
But these bail-outs were just the tip of the iceberg. All the large banks also benefit from an implicit subsidy from taxpayers; because they will be bailed out, if necessary, markets view lending to them as low risk. This report quantifies this ‘too big to fail’ (TBTF) subsidy using methodology developed by the Bank of England. We found that while the TBTF subsidy has fallen from its mid-2009 peak, the ‘big five’ UK banks still enjoyed a combined TBTF subsidy of £46 billion in 2010. The TBTF subsidy in the UK is 62 per cent higher than in Germany, despite the latter having a significantly larger economy.
Barclays, Lloyds, RBS, HSBC, and Nationwide enjoyed subsidies from the state of £10 billion, £15 billion, £13 billion, £7 billion, and £1 billion respectively. Whilst the government does not transfer these funds directly to the banks, it does pay for the subsidy indirectly through its own borrowing costs, which increase to reflect the additional risk it is taking on board.
This is not all, banks benefit from further special treatment:
• No VAT. Banks and other financial services enjoy exemption from VAT which likely saves them billions of pounds each year.
• Subsidised deposit insurance. In addition to bailing out a number of banks, taxpayers bailed out the UK’s deposit guarantee scheme to the tune of £19 billion during the financial crisis. The government does not promise to pay the debts of non-financial companies when they fail.
• Access to the Bank of England as lender-of-last-resort. Banks can borrow from the central bank when other banks will not lend to them. There is no such lender of last resort for other industries.
• Privatised gains and socialised losses. Taxpayers are deeply out of pocket not just for the bank bail-out, but also £5 billion per year in ongoing financing charges for these schemes. This is not helped by corporation tax cuts, which are likely to cancel out revenue brought in by the recently introduced Bank Levy.
The ICB’s primary prescription for tackling the TBTF issue is to ring-fence retail banking from investment banking activities. Yet the Commission admits that ring-fencing will only reduce and not eliminate the subsidy.
Quid Pro Quo 3Quid Pro Quo 3
The size of the benefits extended to the banks compares unfavourably with the tax received in return. For example, a report by PricewaterhouseCoopers (PwC) calculates a total amount of taxes borne by banks for the year to April 2010 to be £15.4 billion. If the government is to avoid subsidising the profits and pay of major banks and their staff, and achieve a fair deal for taxpayers, it needs to claw back the subsidies the banking industry enjoys by ensuring it pays its fair share of tax. This is one of the major arguments of those calling for a so-called Robin Hood Tax on financial transactions.
A fair deal for customers?The governance of banking is suffering from a public-interest deficit. Market power is concentrated in the hands of a small number of very large banks and significant barriers prevent new entrants coming into the market to challenge the status quo.
In addition, banks are able to take advantage of their greater access to market information and economically ‘irrational’ customer behaviour – such as the tendency of customers to underestimate how much they will need their credit cards – to increase their profits. In particular, the complex, uncertain, and long-term nature of many financial products makes the exercise of customer choice ineffective in ensuring that the interests of customers and the public in general are upheld.
The ICB’s proposals to help improve competition in UK banking are disappointing. The Commission touches on the key issues but appears reluctant to tackle them. Instead, it latches on to easy prescriptions, such as selling off additional branches of Lloyds, which our analysis suggests will not bring about effective reform.
A proposal to create a new challenger is unlikely to significantly improve competition. Instead, the main emphasis should be on protecting consumers, ensuring that consumers understand the products that they are being sold, and that banks explicitly provide all the information that their customers need in order to make good decisions. The interests of bank executives, owners, customers, taxpayers, and citizens are out of kilter and need to be brought into alignment.
A fresh start?A unique industry requires unique regulation.
Banking is indispensible to our economy and more akin to a public utility than a free competitive marketplace. It is totally unlike other industries because it acts as the operating system for the whole economy;– when they crash, it affects everything. Banks create 97 per cent of the money in our economy, and the amount of money flow to businesses and consumers remains dependent on the mood swings of bankers. Banks operate the everyday payments system on which almost all economic transactions depend.
Consequently, the stability and conduct of banks are a matter of public interest far beyond that of other companies.
As this report demonstrates, private interest and competition alone cannot be relied on to serve customers well at reasonable cost, or to support economic prosperity and social progress. Despite this, banks have been given an inappropriate level of freedom, and have been allowed to profit at the expense of taxpayers and customers alike. It is time to bring an end to the bankers’ private welfare state.

Quid Pro Quo 4
Introduction
In recent years, Britain seems to have added a new event to its calendar of festivals: the annual bankers’ bonus round. Bankers apparently indulge in an orgy of financial excess while the media feast on superlatives, and politicians chorus in harmonious outrage. Meanwhile the public grumpily and powerlessly fumes over the sheer ingratitude of a bailed-out industry lavishing itself with sums of money beyond most workers’ wildest aspirations.
Is this justifiable outrage at a genuine unfairness, or merely the politics of envy?
We suggest that outrage over bankers’ pay is a symptom. Here, we seek to shed light on the underlying condition – there is a combination of factors that give banks a privileged economic position in relation to their customers and to other industries, and this allows banks to make excessive profits. Such excessive profits are not always visible; they can be absorbed into billion-pound bonus payouts and cost inefficiency. There are two sides to this. First, in normal times, banks enjoy a level of profitability that is out of kilter with the social and economic value they create. Secondly, in times of economic stress and financial crisis, it is the taxpayer that ends up bearing the loss. This is a system that combines private profits with public losses.
It is not easy to define excessive profitability. Cross-industry comparisons of profit margins and return on capital are not valid because the nature of banking, its balance sheets, and its revenue streams, are so different to productive, extractive, retailing, and service industries. But there is some evidence we can review. Recent decades have seen banks’ levels of profitability increase significantly over historical norms. Levels of total pay in banking enjoy a persistent and significant premium over other sectors. Banks have been able to earn high returns on equity even as customer satisfaction ratings sink, and few firms have either entered or left the market as economic theory suggests they should. The banking bail-out has revealed a range of ways in which banks benefit financially from state support.
Some argue that bankers really are more intelligent and hard-working than other people in the economy. Other lines of defence focus on the notion that banks are key ‘wealth creators’, and that they should be suitably rewarded for providing such a valuable service.
However, such arguments sit uncomfortably with the traditional idea that banks are simply intermediaries that facilitate the allocation of capital between borrowers and savers. Does it make sense that efficient intermediaries would earn significantly more than many of the industries that they supposedly serve? Instead, might the banks’ unprecedented levels of profitability in recent decades actually be acting like a tax on UK citizens and businesses? Is wealth being created or merely accumulated in the hands of a privileged few?
Whilst this report cannot provide a comprehensive analysis of these issues, it aims to probe some of the key problems with banking today and shine a light on some of the advantages enjoyed by the banking sector from which other sectors of the economy are excluded. In this light, the proposals put forward by the Independent Commission on Banking (ICB), which is advising the UK government on banking reform, are examined to see whether its prescriptions are likely to bring about the sorely needed changes the sector requires.

Quid Pro Quo 5
The report is structured as follows. To set the scene, Section 1 provides a brief history of commercial banking, and looks at how size, profits, risk, and influence have varied over the years. Section 2 explores whether or not banks currently operate in efficient and competitive markets, and asks whether profits may stem from market failure. Section 3 introduces and quantifies the ‘too-big-to-fail subsidy’ for all the large UK, French, and German banks. Section 4 queries whether or not the financial sector has fully paid for deposit insurance, a scheme which is supposedly fully funded by the industry. Section 5 explains how banks create money as result of fractional reserve banking. Section 6 investigates whether the banking sector is under-taxed. We consider the impact and merits of excluding financial services from VAT, and examine the banks’ progress on reimbursing the taxpayer for support extended during the ongoing-financial crisis. Finally, Section 7 looks at proposals under consideration by the ICB, and asks if they are likely to resolve many of the issues raised in the report.
Quid Pro Quo 6
The development of banking institutionsBanking has existed for thousands of years. For example, in ancient Greece bankers took in deposits, which were either put aside for safe-keeping, in exchange for a fee, or, with permission, were subsequently loaned out. Furthermore, ‘giro transfers’, i.e. instructions ordering the transfer of funds between accounts, which thus enable cashless exchange, were developed in Ptolemaic Egypt.1
However, retail banking institutions are a more recent phenomenon; they’ve only been around for approximately 350 years. Moreover, the services offered by such banks have varied significantly over this time.
The first banking corporations (or ‘joint-stock banks’) were established in the latter half of the seventeenth century. For example, Stockholm’s Banco, which would later give way to the Riksbank, was founded in 1656, and was followed by the Bank of England in 1694. The latter was granted a charter in exchange for extending a line of credit of £1.2 million to the British government, to enable investment in the navy following France’s triumph over the English fleet at the Battle of Beachy Head. This was a significant milestone in the history of banking, which had hitherto concentrated on relatively short-term lending.
Although these early banking institutions were the forerunners of today’s central banks, they were not yet charged with central banking duties – such as influencing the money supply and acting as the lender of last resort – that they now perform. They were instead private, profit-maximising banks that took in deposits, facilitated transfer payments, offered loans, and issued bank notes.
Whilst the Bank of England was the first British institution to be granted a charter to engage in banking activities, and enjoyed a monopoly on joint-stock banking for over 150 years, it was not the first bank in the UK. In fact, private banks – which differed from chartered banks in that they were run by a small group of partners rather than subscribed to by a large number of investors who all purchase shares – preceded the Bank of England by approximately 50 years.2 However, these private banks did not have the resources that were at the Bank of England’s disposal, and, consequently, struggled to compete with the latter. In particular, they were not able to take advantage of limited liability, which protects investors from being personally liable for the debts incurred by their companies. As a result, the extent to which a private bank could grow was frequently severely restricted.
However, as the UK government increasingly began to raise capital by issuing government bonds, its reliance on loans from the Bank of England waned, and the latter’s influence thus decreased. Furthermore, waves of crises in the private banking sector in the late eighteenth and early nineteenth centuries raised doubts as to whether private banks had sufficient capital to be stable institutions. Critics pointed to Scotland, which had many joint-stock banks that had proved to be relatively robust throughout these crises. As a result of these factors, the Bank of England lost its monopoly on joint-stock banking in 1826.3
1. Have banks always been so profitable?
Quid Pro Quo 7
The relaxation was initially only partial, as new joint-stock banks were not permitted in or around London. However, in 1836 the latter restriction was also removed.
Banking consolidation, crises, and regulationThe introduction of new chartered banks signified the start of formal banking regulation in the UK, as charters generally stipulated a set of conditions that banks had to abide by, such as minimum equity levels, in order to be permitted to practice. However, as more and more new banks sought charters, it no longer seemed sensible to continue granting permission on a case-by-case basis. Instead, Britain’s first banking code was passed in 1844, which set out the conditions banks had to fulfil in order to qualify for charters. It was repealed in 1857, however, when it was deemed that banks should simply be subject to corporation law. This remained true until the 1900s.
The rise of these new, better capitalised banks, in addition to the failure of many banks in the latter half of the 1830s, brought about a boom in mergers, whereby many joint-stock banks bought up traditional private banks.4 The late nineteenth and early twentieth century also saw a wave of bank mergers in the UK. This trend is generally believed to have been sparked by legislative changes in 1862 (the Companies Act) that meant that shareholders were no longer liable for their company’s liabilities.5 Furthermore, in the low interest rate environment of the 1880s, many bank managers saw mergers as a relatively profitable activity. As time progressed, and more and more banks enjoyed the economies of scale that arose from being larger enterprises, smaller banks then rushed to merge to be able to compete. These merged, larger banks were significantly more profitable than their smaller un-merged counterparts. Moreover, some researchers have ascribed this increased profitability to banks enjoying levels of scale that directly impinged upon their efficiency as simple intermediaries between those looking to invest capital and those hoping to borrow.6 By 1920, the five largest banks held well over three-quarters of all the deposits in England.7
Consolidation in search of ever higher returns is one key feature of the development of the industry, but arguably of greater impact has been successive episodes of bank failures and the response of regulators. Banking crises are far from being a recent phenomenon. For example, in 1866 an extremely prominent bank called Overend, Gurney, and Company was refused assistance by the Bank of England and subsequently collapsed, causing other banks to also go under. Prior to the Northern Rock crisis in 2007, this was in fact the last ‘run’ on a British bank. This experience prompted the adoption of a new role by the Bank of England – the lender of last resort – to prevent banks failing for lack of liquidity. The new doctrine was tested later in the nineteenth century, for example, when Baring Brothers became overexposed to South American governments’ debt which had rapidly depreciated in value when these countries became embroiled in their own financial crises. In 1890, the Bank of England and the British government extended loans to Baring Brothers and went on to arrange a syndicate of private firms to guarantee that the firm’s liabilities would be honoured even if the necessary funds couldn’t be raised by liquidating the bank. The banking bail-out was born.
Whilst states actively participated in earlier bail-outs, the direct recapitalising of banks by governments buying their shares was not prevalent until the Great Depression.8 In the 1920s, many Americans were encouraged by brokers to borrow money to invest in the stock market. Frequently, people were borrowing as much as two-thirds of the price of a stock,9 and as more and more people bought into this trend, speculation started to push up prices. On 24 October 1929 (Black Thursday), fears of a bubble in the US stock market were realised, and shares plummeted, marking the start of a free-fall that would last until 13 November. Unfortunately, this proved to only be the eye of the storm, as the stock market continued its decline in the spring of 1930. Between 3 September 1929 and 8 July 1930, the Dow Jones Industrial Average, the main benchmark American stock market index, fell by 89 per cent. This Great Crash is widely considered to be a significant factor in bringing about the Great Depression, a period of devastating global economic decline that lasted until the onset of World War II.
Quid Pro Quo 8
The fallout from the Great Crash of 1929 provoked a critical volte-face in banking regulation. The laissez-faire approach was deemed to have unequivocally failed, and reforms were thus significant and widespread. For example, in the USA, the Banking Act of 1933, otherwise known as the Glass-Steagall Act, introduced national deposit insurance and banned universal banks (Box 1), which risked destabilising the retail banking system. Many argued that the primary investment banking functions of insuring share and bond issues, along with facilitating trading in such securities, were inherently more risky than the lending undertaken by retail banks. Universal banks were also believed to suffer from dangerous conflicts of interest. As a result, those who extended loans and dealt with public deposits were no longer permitted to underwrite and promote shares. However, only a few countries followed suit.
As the twentieth century progressed, the USA began to question whether the forced separation of retail and investment banking had been unnecessarily draconian. The banking lobby argued that universal banks offered myriad benefits stemming from economies of scale and diversification. Furthermore, they maintained that in the new highly globalised world, their banks would struggle to compete with banks in countries that allowed universal banking. Others still strongly maintained that universal banks were inherently unstable, and that the vast scale of such enterprises would result in undue market power which would lead to banks becoming inefficient intermediaries. Neoliberal arguments prevailed, and the Glass-Steagall Act was eventually repealed in 1999.
After the Great Depression, many OECD countries also introduced restrictions to ban high interest rates on loans and deposits. Such regulation held for three decades; however, as interest rates began to rise in the 1960s and 1970s, interest rate caps started to eat into the profits earned by both depositors and lenders. This prompted a search for higher-yielding investments, and the fledgling market for short-term debt securities subsequently flourished, as it was not subject to any interest rate restrictions.10 As depositors pulled their money out of banks so that they could invest in such paper, banks stepped up their pressure on governments to abolish interest rate caps. Simultaneously, the interbank lending market took-off, as this too was exempt. Finally, many argued that strict regulation was undermining competition in the banking sector. In response to all of the above, the UK deregulated interest rates in 1981.
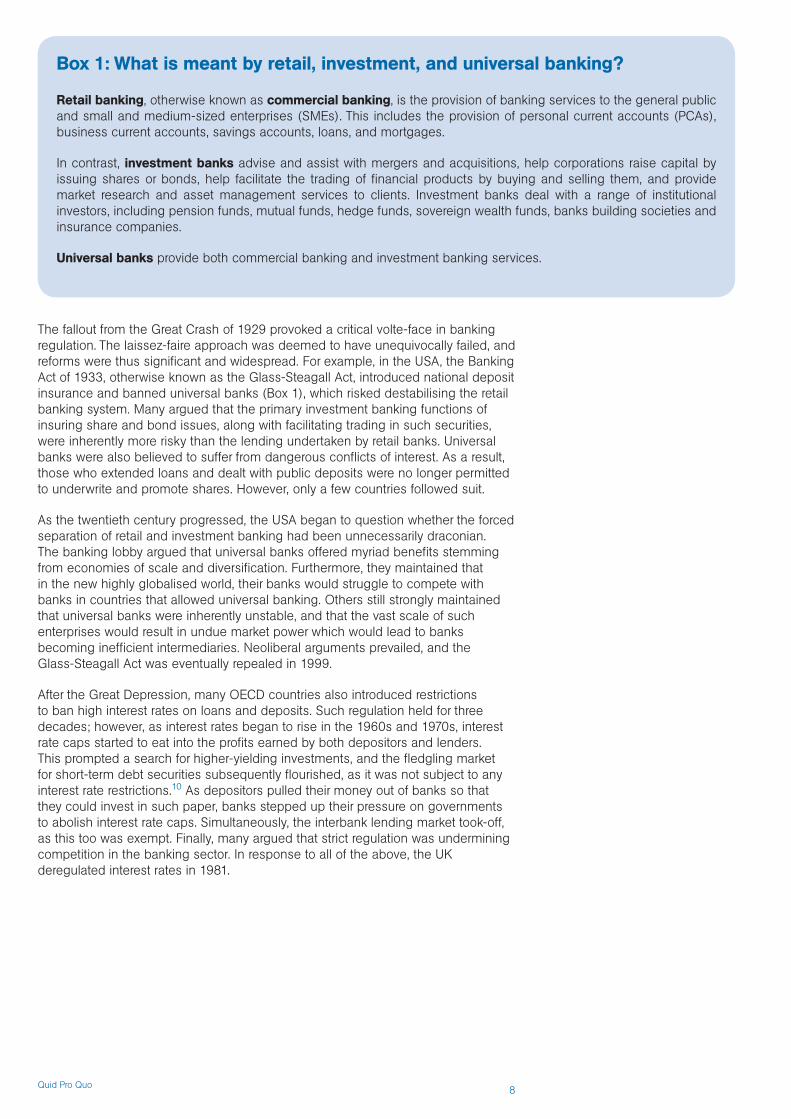
Box 1: What is meant by retail, investment, and universal banking?
Retail banking, otherwise known as commercial banking, is the provision of banking services to the general public and small and medium-sized enterprises (SMEs). This includes the provision of personal current accounts (PCAs), business current accounts, savings accounts, loans, and mortgages.
In contrast, investment banks advise and assist with mergers and acquisitions, help corporations raise capital by issuing shares or bonds, help facilitate the trading of financial products by buying and selling them, and provide market research and asset management services to clients. Investment banks deal with a range of institutional investors, including pension funds, mutual funds, hedge funds, sovereign wealth funds, banks building societies and insurance companies.
Universal banks provide both commercial banking and investment banking services.

Quid Pro Quo 9
Investment banking in the UK was also deregulated in the 1980s, in the reforms known as ‘Big Bang’. Prior to deregulation, any given firm could only provide one of the following services: broking, market making, or underwriting (Box 2), due to perceived conflicts of interest. The separation between brokers and market-makers was considered to be particularly important; because brokers did not trade on their own account they would not tempted to pitch deals to clients purely to benefit their own trading position. The London Stock Exchange (LSE) also had strict rules on how different firms could interact. For example, underwriters could liaise with companies issuing shares and brokers, but could not reach out to market-makers or investors, as brokers had to do this for them. After Big Bang, a single firm could offer all of these services.
What prompted Big Bang? The British government wanted to see the emergence of domestic securities trading firms that could compete with the likes of Merrill Lynch, and Goldman Sachs in the USA.11 British market-makers had hitherto struggled to make a profit, as they were not sufficiently capitalised,12 and so, as they stood, were in no position to compete with American investment banks that had already benefitted from years of deregulation. Furthermore, the LSE had come under pressure from the Office of Fair Trading (OFT), which had criticised the LSE’s rules for being restrictive.13 As a result, the LSE abolished fixed commissions on broking. This put pressure on brokers’ profit margins, and there was concern that many brokerage firms would not survive unless they were allowed to branch into other areas of banking. The government was also concerned that if the LSE was not opened up to outside membership, then overseas securities firms would instead establish a rival European financial centre.
In the new competitive world, many doubted that brokerage and market making firms would be able to survive on their own. In addition, the partners in such firms saw the Big Bang as an opportunity to sell their stakes in their companies and thus cash in.
Retail banks, such as Barclays, had already branched into traditional ‘merchant banking’ activities, such as underwriting and advisory work, for example, on mergers and acquisitions. However, they were yet to make much of an impact in these markets. These banks now saw that they had an opportunity to buy brokers, which they believed had the client relationships that would help them in this regard. For example, the CEO of Barclays said:
Now we have the chance to crack right into the middle of the merchant banking business. If we choose, we can actually buy a broker and a jobber and form a real American-style investment bank – not an old style merchant bank.14
All the UK retail banks, except Lloyds, pursued this strategy. Lloyds was more cautious and instead decided to bide its time before attempting such a transition.
Box 2: Brokers, market-makers, and underwriters
Brokers match up buyers and sellers of financial products and charge a commission for this service.
Market-makers buy, hold, and sell securities themselves. They hope to buy products at a lower price than where they sell them, and, thus, profit from this spread. Prior to the Big Bang, market-makers were called Jobbers.
When a company issues shares, underwriters agree to buy up any shares that investors do not want to buy. Thus, the underwriter effectively provides insurance for a company when it is issuing shares
Quid Pro Quo 10
Underwriters were concerned that broking firms that had been bought up by other underwriters would no longer be willing to promote shares underwritten by rival institutions. Having an in-house broker would also mean that underwriters would have more market power than isolated underwriters. This would help British underwriters compete with American investment banks.
All UK players wanted to move fast to prevent falling behind their competition. As a result, it became standard to buy existing brokers and jobbers rather than start up such subsidiaries from scratch.
As globalisation was on the rise, foreign banks, including those from America, were also keen to take advantage of this opportunity to expand into Europe. American retail banks generally chose to buy into the UK market, whereas American investment banks typically preferred to expand their existing businesses into London believing their own expertise to be better suited than that of local firms to the new world post Big Bang.15
Some see the wave of bank mergers in the 1980s and 1990s as a response to banking crises and, in fact, many governments even promoted mergers as such.16 However, a report from the G-10 concluded that enhanced returns through economies of scale, increased market power and product diversification were factors behind this trend.17 Technological improvements also helped expedite the process, as did the EU’s single market and currency. The report goes on to note that these mergers have increased the complexity of financial institutions, making it more difficult to wind them down in the case of failure, and have coincided with increased interdependencies between banks. Finally, the report warns of an increased risk of ‘moral hazard’ as a result of consolidation in the banking sector, i.e. that large, systemically important institutions are incentivised to take on more risk than they would do if they solely bore the consequences of any poor investment decisions.
Assessing the relative economic power of the UK banking industry over timeAs banking has evolved over time, the UK economy’s reliance on banking has noticeably escalated. For example, Figure 1 shows how the ratio of banks’ assets to UK GDP (Box 3) dramatically began to increase in the early 1970s as the financial liberalisation began both in the UK and internationally, and has grown at a staggering pace ever since. This ratio had remained steady at approximately 50 per cent throughout the late nineteenth and up to the middle of the twentieth century, but by the early 1980s it has risen to over 100 per cent and by 2006 it exceeded 550 per cent.
Moreover, the UK’s exposure to the banking sector is exceptionally high, not just by historical standards, but also in comparison to other countries. For example, in 2009, the ratio of domestic banking assets to GDP was higher in the UK than in the USA, Japan, France, Germany, Canada, Australia, Italy, Spain, and South Korea.18 This is further reflected by the fact that during the financial crisis the UK had to pledge more support to the financial services industry (as a percentage of GDP) than the majority of other advanced economies. As is shown in Figure 2, the UK pledged 101 per cent of UK GDP in support of the banking sector, in comparison to the USA’s 42 per cent of GDP, Germany’s 27 per cent of GDP, and Japan’s 21 per cent of GDP. Moreover, the G-20 average was only 22 per cent of GDP.19 These amounts were not necessarily paid out to banks by their respective governments, as not all of the various bail-out schemes had to be called on. Nevertheless, these figures give a good indication of the level of financial risk that was transferred from the banking sector to the government, and ultimately to all citizens.

Quid Pro Quo 11
Box 3: Why are we looking at the ratio of assets to GDP?
Assets are the economic resources owned by a firm at a given point in time. They are an example of what economists call stock.
GDP is a measure of the value of all the goods and services produced in an economy over a given period of time, usually one year. As it is a measure of stock per unit of time, economists classify it as flow.
Whilst is in invalid to compare stock with flow, one can look at the ratio of stock to flow, as this will produce a figure that is measured in units of time. For example, we regularly read economic commentary about the debt to GDP ratio, which is measured in years, and is, thus, generally taken to be a crude measure of how long it would take an economy to repay the national debt, if all GDP were put towards this goal. (Note that this is a very rough measure as it ignores interest rates.)
Consequently, the ratio of banks’ assets to GDP gives an indication of how many years it would take an economy to buy its banks’ assets, if all GDP were put towards this goal. Whilst this is not what a bail-out involves and, thus, an economy would never in reality be required to do this, the ratio does provide a good indication of the scale of the banking industry in comparison to the rest of the economy. For example, many would argue that if it would hypothetically take the entire UK economy approximately five-and-a-half years to buy all banking sector assets (in 2006 the banks’ assets to GDP ratio was 550 per cent), then the sector has clearly been allowed to become too big.
1880
1886
1892
1898
1904
1910
1916
1922
1928
1934
1940
1946
1952
1958
1964
1970
1976
1982
1988
1994
2000
2006
0
100
200
300
400
500
600
Per
cent
age
(%)
Year
Figure 1. UK banking sector assets as % of GDP
Source: Alessandri and Haldane.20 Reproduced with permission.

Quid Pro Quo 12
The sizes of individual banks have also skyrocketed in comparison to firms in other industries. For example, Table 1 documents the total assets in 2010-11 of the four largest firms (by market value) in a variety of UK business sectors, and expresses this as a percentage of UK GDP. We can see that banking is a clear anomaly, even when compared with general financial services firms and insurance providers. This, of course, reflects the very different nature of banking – which effectively shows its products on its balance sheet – to other productive, trading, or service industries. But in relative terms, the UK banking seems to be in a league of its own and the sizes of individual British banks are extremely large by international standards. For example, immediately prior to their bail-outs, the ratio of RBS’s assets to UK GDP was 99 per cent, whereas the ratio of Citigroup’s assets to US GDP was only 16 per cent.22 This reinforces the point illustrated by the bank bail-out comparisons above; the UK is uniquely exposed to its very large banks.
120
Italy Australia Korea Japan France Canada Germany US UK
100
80
60
40
20
0
Per
cent
age
(%)
Figure 2. Support pledged to the banking sector, as % of GDP (2009)
Source: IMF (2010).21
Source: Financial Times (2011).23
Table 1. Assets of largest four firms in sector as a % of UK GDP
Sector Assets of largest 4 firms as % of UK GDP
Banks 301%
Life Insurance 78%
Oil & Gas Producers 29%
Mining 15%
Mobile Telecommunications 11%
Gas, Water & Multiutilities 6%
Financial Services 6%
Food & Drug Retailers 5%
Food Producers 3%
Media 3%
Aerospace & Defence 3%
Fixed Line Telecommunications 2%
Quid Pro Quo 13
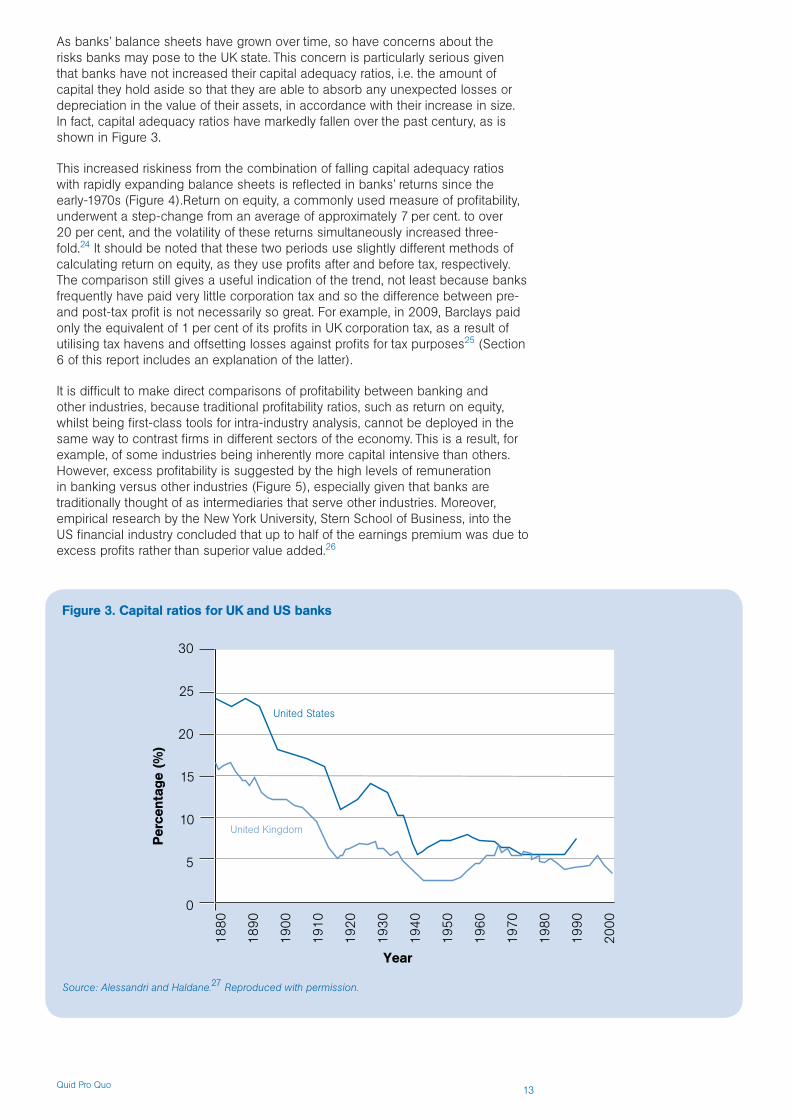
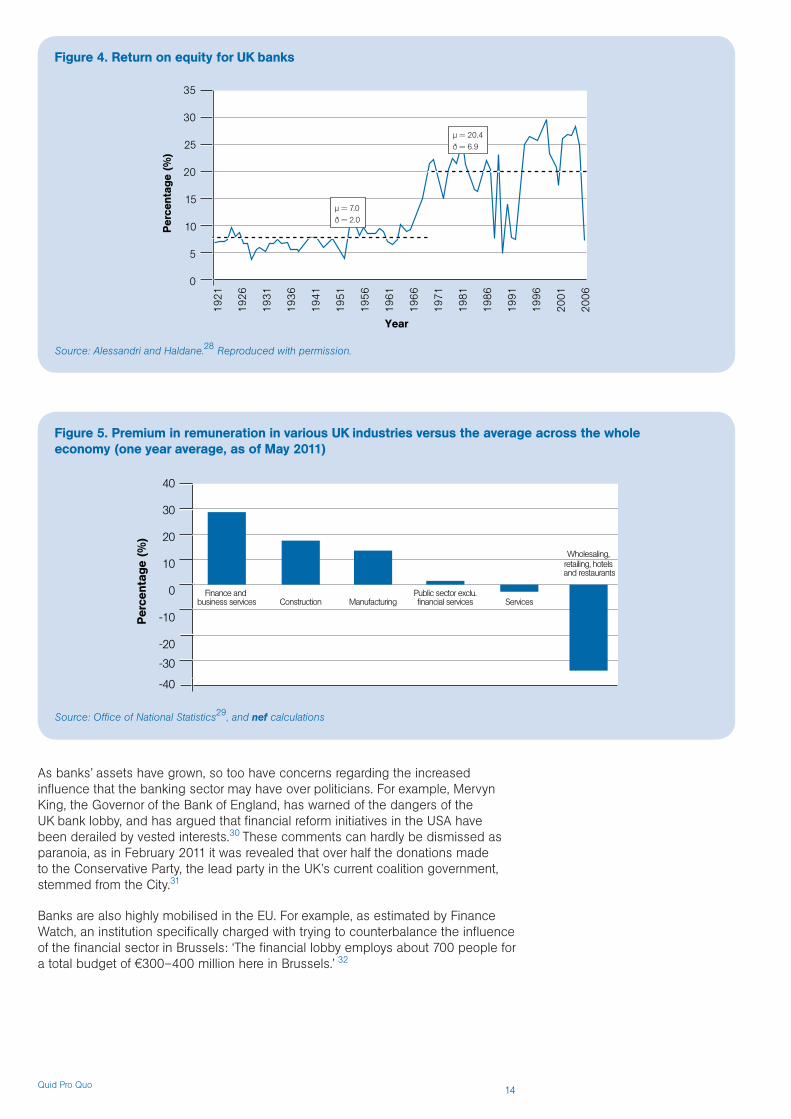
As banks’ balance sheets have grown over time, so have concerns about the risks banks may pose to the UK state. This concern is particularly serious given that banks have not increased their capital adequacy ratios, i.e. the amount of capital they hold aside so that they are able to absorb any unexpected losses or depreciation in the value of their assets, in accordance with their increase in size. In fact, capital adequacy ratios have markedly fallen over the past century, as is shown in Figure 3.
This increased riskiness from the combination of falling capital adequacy ratios with rapidly expanding balance sheets is reflected in banks’ returns since the early-1970s (Figure 4).Return on equity, a commonly used measure of profitability, underwent a step-change from an average of approximately 7 per cent. to over 20 per cent, and the volatility of these returns simultaneously increased three-fold.24 It should be noted that these two periods use slightly different methods of calculating return on equity, as they use profits after and before tax, respectively. The comparison still gives a useful indication of the trend, not least because banks frequently have paid very little corporation tax and so the difference between pre- and post-tax profit is not necessarily so great. For example, in 2009, Barclays paid only the equivalent of 1 per cent of its profits in UK corporation tax, as a result of utilising tax havens and offsetting losses against profits for tax purposes25 (Section 6 of this report includes an explanation of the latter).
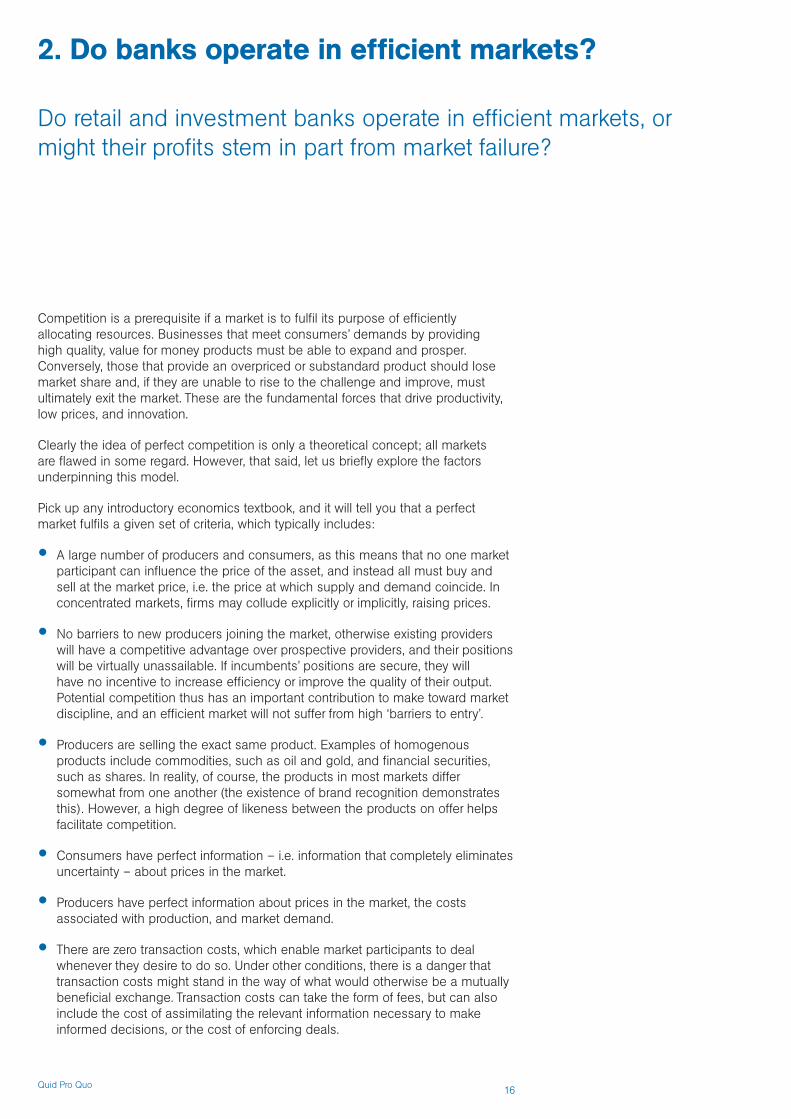
It is difficult to make direct comparisons of profitability between banking and other industries, because traditional profitability ratios, such as return on equity, whilst being first-class tools for intra-industry analysis, cannot be deployed in the same way to contrast firms in different sectors of the economy. This is a result, for example, of some industries being inherently more capital intensive than others. However, excess profitability is suggested by the high levels of remuneration in banking versus other industries (Figure 5), especially given that banks are traditionally thought of as intermediaries that serve other industries. Moreover, empirical research by the New York University, Stern School of Business, into the US financial industry concluded that up to half of the earnings premium was due to excess profits rather than superior value added.26
1880
1890
1900
1910
1920
1930
United States
United Kingdom
1940
1950
1960
1970
1980
1990
2000
0
5
10
15
20
25
30
Per
cent
age
(%)
Year
Figure 3. Capital ratios for UK and US banks
Source: Alessandri and Haldane.27 Reproduced with permission.
Quid Pro Quo 14
As banks’ assets have grown, so too have concerns regarding the increased influence that the banking sector may have over politicians. For example, Mervyn King, the Governor of the Bank of England, has warned of the dangers of the UK bank lobby, and has argued that financial reform initiatives in the USA have been derailed by vested interests.30 These comments can hardly be dismissed as paranoia, as in February 2011 it was revealed that over half the donations made to the Conservative Party, the lead party in the UK’s current coalition government, stemmed from the City.31
Banks are also highly mobilised in the EU. For example, as estimated by Finance Watch, an institution specifically charged with trying to counterbalance the influence of the financial sector in Brussels: ‘The financial lobby employs about 700 people for a total budget of €300–400 million here in Brussels.’ 32
1921
1926
1931
1936
1941
1951
1956
1961
1966
1971
1981
1986
1991
1996
2001
2006
0
5
10
15
20
25
35
30
Per
cent
age
(%)
Year
40
Finance and business services
30
20
10
0
-10
-20
-30
-40
Per
cent
age
(%)
Construction ManufacturingPublic sector exclu.financial services Services
Wholesaling, retailing, hotels and restaurants
Figure 4. Return on equity for UK banks
Figure 5. Premium in remuneration in various UK industries versus the average across the whole economy (one year average, as of May 2011)
Source: Alessandri and Haldane.28 Reproduced with permission.
Source: Office of National Statistics29, and nef calculations
µ = 20.4ð = 6.9
µ = 7.0ð = 2.0

Quid Pro Quo 15
There is also evidence that bank lobbying has successfully influenced legislation. For example, in a 2009 report by the IMF, direct links are drawn between financial lobbying and failure to pass legislation in the USA that may have prevented the recent subprime mortgage crisis:
We found that lobbying expenditures by the US financial industry were directly associated with how legislators voted on key bills in the years before the crisis … The more intense the lobbying, the more likely legislators were to vote for deregulation.33
Furthermore, the report finds evidence to suggest that the financial institutions that are the most persistent lobbyists are also the ones that engaged in some of the worst practices:
We found that lenders that lobbied heavily between 2000 and 2006 tended to engage in risky lending practices more often than other institutions over the same period and suffered worse outcomes during the crisis.34
Whilst a thorough investigation into the influence of bank lobbyists is beyond the scope of this study, and indeed merits a separate report, we can confidently state that the sheer size of the banking sector today puts the industry in a position of significant power. Moreover, there is a wealth of anecdotal evidence, in addition to some empirical studies, that strongly suggests that banks frequently influence legislative processes to further their own interests.
Before we move on, let us briefly recap what we have learnt so far. Commercial banks have evolved dramatically over the past 350 years, from private institutions that offered a limited number of traditional services, such as deposit taking and lending, to public,universal banks that engage in the full spectrum of financial activities. This process has been accompanied by multiple waves of mergers and deregulation, which have seen the assets of individual banks grow to the extent that they now exceed the GDP of nearly every country in the world. Simultaneously, the banking sector as a whole has increased in size in relation to the economy, with total assets rising from a steady 50 per cent of UK GDP to over 550 per cent immediately prior to the 2007 financial crisis. In addition, as regulation has been relaxed, banks have sought higher returns by lowering their capital buffers. This has resulted in both higher on average, but also more volatile returns. These higher returns have caused many to question the efficiency of banks as intermediaries , which has supposedly always been their ultimate purpose in the economy, and research suggests that up to 50 per cent of remuneration in the banking sector may reflect ability to extract extra returns from market power rather than value added. Furthermore, the increased size and riskiness of UK banks legitimately raises fears around the impact of banking instability on the UK economy, and the increased probability of instability due to moral hazard. These concerns were overtly realised in the recent financial crisis. Finally, the sheer size of the banking sector has ignited interest in the influence of this enormously wealthy industry on political processes and legislation, and evidence from the IMF strongly suggests that such misgivings are not unfounded.
Quid Pro Quo 16
2. Do banks operate in efficient markets?
Do retail and investment banks operate in efficient markets, or might their profits stem in part from market failure?
Competition is a prerequisite if a market is to fulfil its purpose of efficiently allocating resources. Businesses that meet consumers’ demands by providing high quality, value for money products must be able to expand and prosper. Conversely, those that provide an overpriced or substandard product should lose market share and, if they are unable to rise to the challenge and improve, must ultimately exit the market. These are the fundamental forces that drive productivity, low prices, and innovation.
Clearly the idea of perfect competition is only a theoretical concept; all markets are flawed in some regard. However, that said, let us briefly explore the factors underpinning this model.
Pick up any introductory economics textbook, and it will tell you that a perfect market fulfils a given set of criteria, which typically includes:
• A large number of producers and consumers, as this means that no one market participant can influence the price of the asset, and instead all must buy and sell at the market price, i.e. the price at which supply and demand coincide. In concentrated markets, firms may collude explicitly or implicitly, raising prices.
• No barriers to new producers joining the market, otherwise existing providers will have a competitive advantage over prospective providers, and their positions will be virtually unassailable. If incumbents’ positions are secure, they will have no incentive to increase efficiency or improve the quality of their output. Potential competition thus has an important contribution to make toward market discipline, and an efficient market will not suffer from high ‘barriers to entry’.
• Producers are selling the exact same product. Examples of homogenous products include commodities, such as oil and gold, and financial securities, such as shares. In reality, of course, the products in most markets differ somewhat from one another (the existence of brand recognition demonstrates this). However, a high degree of likeness between the products on offer helps facilitate competition.
• Consumers have perfect information – i.e. information that completely eliminates uncertainty – about prices in the market.
• Producers have perfect information about prices in the market, the costs associated with production, and market demand.
• There are zero transaction costs, which enable market participants to deal whenever they desire to do so. Under other conditions, there is a danger that transaction costs might stand in the way of what would otherwise be a mutually beneficial exchange. Transaction costs can take the form of fees, but can also include the cost of assimilating the relevant information necessary to make informed decisions, or the cost of enforcing deals.
Quid Pro Quo 17
If such conditions are satisfied, then a market is deemed to be ‘competitive’, which is itself essential to the efficient allocation of resources (in the specific sense of a market that allocates resources so that no further exchange can make someone better off without making someone else worse off). If a market fails to operate efficiently, then it is possible for outside involvement (e.g. by government) to result in an allocation of goods that makes someone better off without making anyone else worse off. In other words, outcomes can be improved by intervening in the market.
Despite perfect competition being a purely theoretical concept, these criteria serve as a useful and widely accepted framework for analysing how and why markets can end up working against consumers.
Let us now explore how banking markets match-up to this benchmark. A detailed analysis of the markets for all the services that banks provide is beyond the scope of this study. Instead, let us consider two markets as case studies, and see if any general themes start to emerge. First, let us examine the market for the most widely used retail banking product: personal current accounts. We will then go on to look at a major investment banking service: underwriting rights issues.
Personal current accounts (PCAs)Personal current accounts (PCAs) are the most widely used retail banking product, with approximately 93 per cent of adults in the UK having opened such an account.35 PCAs are arguably the most important of banking services because they often act as a gateway to customers accessing other retail banking products, such as savings accounts, personal loans, and credit cards. For example, 88 per cent of the UK public has a savings account open with the same bank that provides their current account.36 Thus, in addition to the level of competition in the current account market being important in and of itself, the level of competition in this market may impact on the level of competition in other retail banking markets.
A large number of producers and consumersThere are a large number of PCA consumers. This should go without saying, and certainly doesn’t merit any further comment.
However, whether there are a sufficient number of suppliers of current accounts is a far more contentious issue, and one that has received a lot of attention from both the press and competition enquiries.
In evidence submitted to the Treasury Select Committee’s enquiry into competition and choice in retail banking, Barclays acknowledged that concentration in UK retail banking had increased recently, but maintained that ‘despite these changes, the landscape remains competitive and dynamic with the emergence of new competitors, products and consumer propositions’.37 This was a recurring theme in the large banks’ submissions to this enquiry. For example, Lloyds noted that there were 30, 60, and 80 providers of current accounts, savings accounts, and mortgages respectively in the UK. In contrast, the CEO of Virgin Money, a new entrant to the UK retail banking market, has branded the large UK banks an ‘effective oligopoly’.38
Which of these opposing claims is correct? Or are they both gross exaggerations?
Of course, exercise of market power depends less on the number of providers and more on how the market is shared between these providers. Thus, the latter will be the focus of our attention. Table 2 gives a breakdown of how PCA market share is split between the different providers. We can see that a small number of banks dominate the market, with the largest four and five providers holding 73 per cent and 85 per cent of the market share, respectively. However, should one be concerned by this level of concentration?

Quid Pro Quo 18
The Herfindahl-Hirschman Index (HHI) is a widely used measure of market concentration. It is calculated by summing the squares of the percentage of the market held by each of the largest 50 firms, and then multiplying this figure by 1000. Scores are generally compared to a given set of thresholds, with an HHI score of more than 1500 being indicative of a concentrated market, and an HHI score of more than 2500 being associated with a highly concentrated market.
Table 3 details HHI scores across a range of retail banking markets. We can see that only three markets – PCAs, credit cards and the SME market – can be classified as ‘concentrated’, and no retail banking industries can be classified as ‘highly concentrated’.
In 2010, the PCA market had an HHI score of 1736; however, in 1998 the PCA market had an HHI score of 1330.41 Thus, whilst the current level of concentration does not appear to be problematic per se, the recent rate of increase in concentration does raise concerns.
It is often argued that the prodigious sizes of banks lead to economies of scale (Box 4) that allow them to offer their retail customers a lower cost and higher-quality service.
Source: Office of Fair Trading (2010) 39
Source: Office of Fair Trading (2010) 40 and nef calculations.
Table 2. 2010 PCA market share.
Personal Current Accounts (PCAs): 2010 Market share
Llyods 30%
RBS 16%
HSBC 14%
Barclays 13%
Santander 12%
Nationwide 7%
Co-operative Bank 3%
National Australia Group Europe 2%
Others 3%
Table 3. HHI – a measure of market concentration.
Herfindahl-Hirschman Index (HHI): A measure of market concentration
Market: Personal Current Accounts
(2010)
Savings Accounts
(2010)
Unsecured Personal Loans
(2009)
New Mortgage Lending (2009)
Credit Cards (2010)
SME Market Share (2008)
HHI Score: 1736 1083 1050 1354 2144 1604
Quid Pro Quo 19
However, economies of scale can also increase the concentration of a market by acting as a barrier to new producers successfully competing with, or even attempting to compete with, existing providers. This is because newer firms are likely to be small, and thus may struggle to take on the larger existing firms that enjoy economies of scale and, consequently, in the presence of a new entrant, are able to offer goods and services at below market prices, in order to undercut and thus drive the latter out of the market. As a result, very large economies of scale can create the barriers to entry that give rise to monopolies or oligopolies. (An oligopoly occurs when a market is controlled by a small number of firms.)
No retail banking market is currently so concentrated that it could be technically classified as an oligopoly. Nevertheless, the fundamental point to appreciate here is that there is a careful balance to be struck between enjoying the efficiencies associated with economies of scale, and ensuring that large firms do not grow to such an extent that they acquire significant market power.
Some academics disagree with the premise that a high degree of concentration automatically undermines the efficiency of a market. For example, they note that a concentrated market can be highly contestable provided there is a credible threat of entry from potential competitors. Nevertheless, we argue that the level of concentration in banking remains a useful barometer, because, as has been articulated by the Independent Commission on Banking, ‘empirical evidence suggests that more concentrated markets lead to worse outcomes for consumers’. 42 Moreover, given the high barriers to entry in banking, we should seriously question whether the threat of potential new entrants to this market is credible.
Thus, the increase in market concentration over forthcoming years should be monitored closely by regulators, and not allowed to increase at the pace it has over the past 12 years. Importantly, given the high barriers to entry and the fact that the market is already classified as ‘concentrated’, we should be sceptical of any claims by banks that further concentration is merited due to additional economies of scale. We do not need to capture a third of the market in order to enjoy such efficiencies.
However, having criticised the recent increase in concentration, it is nonetheless important to emphasise that the current level of concentration is unlikely to be the only or indeed the most significant cause of any deficiencies in the PCA market.
Box 4: What is meant by economies of scale?
The phrase ‘economies of scale’ is used to describe a situation whereby the cost of producing each additional good decreases as the number of goods produced increases.
For example, if a bank had only 100 customers, high IT and technology costs inherent to banking would have to be split amongst and charged to only 100 people. However, if the bank instead had 1 million customers, then those same costs (as once you have the IT system in place it is not significantly more expensive to have 1 million rather than 100 entries in the system) could now be split among 1 million people, resulting in a much lower charge per person. The reduced cost associated with buying in bulk is another classic example of economies of scale.
Thus, economies of scale increase the efficiency of a company which, in a competitive market, will drive down the prices paid by consumers. However, in an uncompetitive market, banks will have no incentive to pass on any reduced costs arising from economies of scale to their customers.
The opposite of economies of scale are termed diseconomies of scale – these are disadvantages of scale and are often harder to measure or even discern as they concern non-financial factors such as creativity, innovation, quality of customer and employee relationships, speed and efficiency of information flows, responsiveness to changes in market conditions, and the impact on good corporate governance of the distancing of managers from owners.
Quid Pro Quo 20
Barriers to entryThere are many significant barriers that hinder entry to the PCA market. These include:
• Starting up a new bank is extremely expensive. High start-up costs are a significant barrier to entry, first because of the financial hurdle that must be overcome in order to compete in this market, but also, more importantly, because even those with the capacity to compete may be dissuaded from entering, as the high start-up costs will be ‘sunk’ in the event that they do not successfully make an impact on the market.
• First, banking is information intensive, and significant up-front investment in costly; high-capacity IT systems are a necessity. Furthermore, a prospective bank must be able to demonstrate the robustness of its computer system to the Financial Services Agency (FSA) before it is allowed to provide current and savings accounts to the UK public.43 This outlay should not be trivialised, as research suggests that procuring adequate IT systems generally makes up two-thirds of the total costs of starting up a bank, and that this is generally is at least tens of millions if not hundreds of millions.44 A similar set of requirements also has to be satisfied to meet money laundering regulations and to connect to interbank credit reporting information channels, which give banks the information to determine the riskiness of retail customers and small and medium-sized enterprises (SMEs).
• In addition, despite the rise in Internet banking, the majority of the public will not consider banking with a provider that does not have an extensive branch network. A survey conducted in July 2010, found that 77 per cent of the UK public will not consider opening a current account with a bank without branches, and that the location of the branches is one of the key considerations taken into account when selecting a bank.45 Thus, whilst branches may be expensive to open and maintain, an extensive network appears to be essential if a new entrant is to make a meaningful competitive impact in the UK retail banking market.
• UK citizens very rarely change their current accounts. For example, in the UK in 2010, only 13 per cent of current account holders switched accounts.46 We explore the reasons behind this in the later sections on imperfect information and transaction fees. The impact of these low levels of switching is that new providers may be reluctant to enter the market as they will struggle to win business, even if they are offering a superior service.
• Brand recognition is very important to retail banking customers. A survey conducted in 2010 found that 81 per cent of the UK public would not consider opening a current account with a bank that had only been in the market for six months or less. Furthermore, even new entrants to the market with well-known brands from other industries appear to be mistrusted by the British public. For example, only 23 per cent of the survey respondents said that they would consider banking with Tesco Bank. The need to establish a reputation for banking will act as a further deterrent to market entrants, as they will struggle to win business until they have a recognised name, even if they are offering a higher quality service than existing providers. This concern is particularly pertinent given that marketing is very expensive. For example, in 2009, over £62 million was spent on promoting current accounts.47
In short, there are numerous significant barriers to new participants entering the PCA market, which is worrying, as both realised and potential new entrants have an important role to play in fostering competition.
Quid Pro Quo 21
Comparability and perfect informationAs we have seen, switching in the PCA market is not a common phenomenon. Low switching levels are not automatically indicative of market failure if, for example, consumers are fully satisfied that no other provider can offer them a better deal. However, if switching levels are low because the public is ill-informed about how their current account provision compares to other options in the market, then such low levels would give rise to concern.
First, we should note that comparison between different current accounts is often made difficult by banks bundling current accounts up with other services. Many banks may provide current accounts that also come with mobile phone insurance, travel insurance, and other services. Unless the banks bundle together exactly the same services, which is very rarely the case, it then becomes very difficult to compare the monthly premiums. As well as impeding competition, these packaged accounts make it more difficult for consumers to work out whether or not they are getting a good deal from any provider. The FSA has warned that many consumers would be better off avoiding bundled accounts,48 and if there was a higher degree of likeness between the products on offer, switching rates would perhaps be higher.
Unfortunately, the extent to which consumers are not perfectly informed – i.e. have enough information to reduce uncertainty but not eliminate it – does not end here. Information asymmetries (one party enjoying an information advantage over the other) are pervasive throughout the banking industry, as finance is a complicated discipline, and banks have substantial expertise in this area that consumers often severely lack. This means that the British public will often struggle to understand its needs and to determine which provider can offer the best service. This problem is compounded because, as banking products are not purchased very frequently, consumers have limited opportunity to learn from their mistakes, which starkly contrasts with many other markets, such as those for food and drink. Thus, consumers may often struggle to assess the different products on offer and make rational choices. Crucially, for our purposes, so-called free current accounts provide a classic example of how the public fundamentally misunderstand some of the banking products on offer (Box 5).
In this light, we can see that the PCA market suffers from both comparability deficiencies and imperfect information. It is therefore highly probable that consumers will fail to make the best possible decisions, which will interfere with the competitive forces that discipline a market.
Quid Pro Quo 22
Transaction costsOpening a current account is free but if switching accounts were an expensive or arduous process, then this market would suffer from high transaction costs.
Let us first examine how problematic a process the public perceive switching to be. Table 4 details what percentage of the British public believes that switching would be difficult across a range of different industries. We can see that although switching a PCA is perceived to be more exacting than switching other accounts, such as a gym membership, car insurance or electricity provider, a large majority (90 per cent) of those sampled do not imagine that the process would be unduly troublesome.
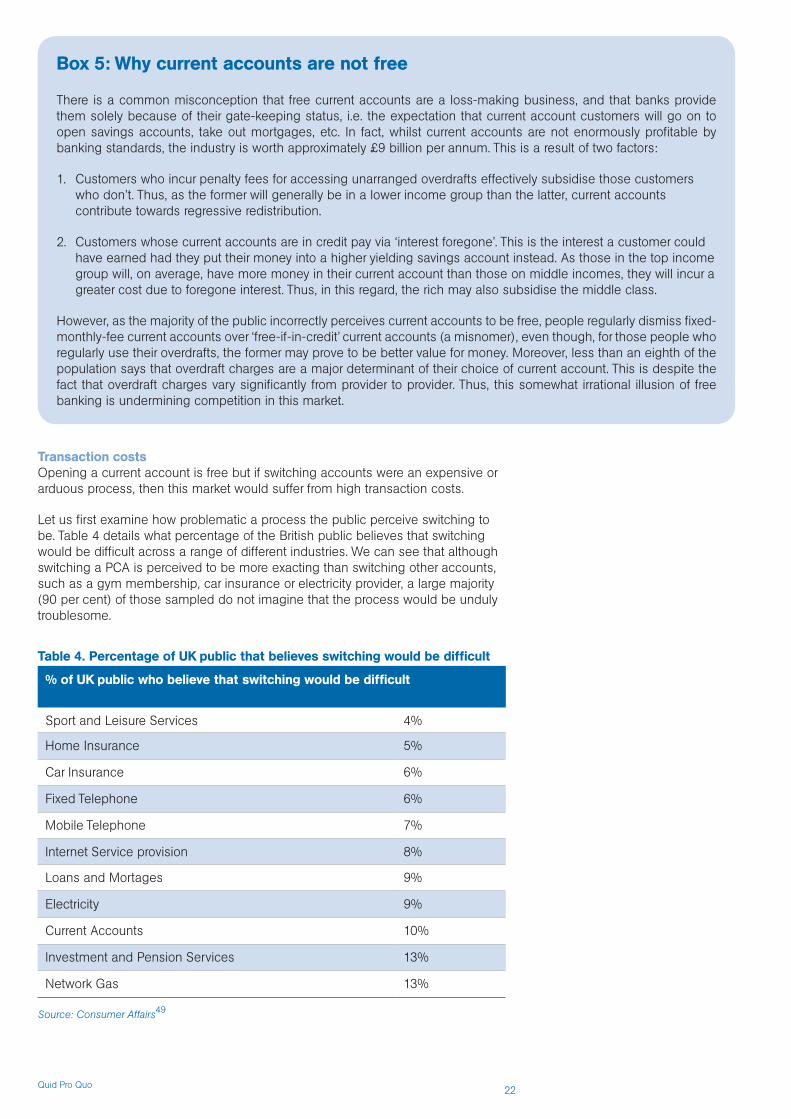
Box 5: Why current accounts are not free
There is a common misconception that free current accounts are a loss-making business, and that banks provide them solely because of their gate-keeping status, i.e. the expectation that current account customers will go on to open savings accounts, take out mortgages, etc. In fact, whilst current accounts are not enormously profitable by banking standards, the industry is worth approximately £9 billion per annum. This is a result of two factors:
1. Customers who incur penalty fees for accessing unarranged overdrafts effectively subsidise those customers who don’t. Thus, as the former will generally be in a lower income group than the latter, current accounts contribute towards regressive redistribution.
2. Customers whose current accounts are in credit pay via ‘interest foregone’. This is the interest a customer could have earned had they put their money into a higher yielding savings account instead. As those in the top income group will, on average, have more money in their current account than those on middle incomes, they will incur a greater cost due to foregone interest. Thus, in this regard, the rich may also subsidise the middle class.
However, as the majority of the public incorrectly perceives current accounts to be free, people regularly dismiss fixed-monthly-fee current accounts over ‘free-if-in-credit’ current accounts (a misnomer), even though, for those people who regularly use their overdrafts, the former may prove to be better value for money. Moreover, less than an eighth of the population says that overdraft charges are a major determinant of their choice of current account. This is despite the fact that overdraft charges vary significantly from provider to provider. Thus, this somewhat irrational illusion of free banking is undermining competition in this market.
Source: Consumer Affairs49
Table 4. Percentage of UK public that believes switching would be difficult
% of UK public who believe that switching would be difficult
Sport and Leisure Services 4%
Home Insurance 5%
Car Insurance 6%
Fixed Telephone 6%
Mobile Telephone 7%
Internet Service provision 8%
Loans and Mortages 9%
Electricity 9%
Current Accounts 10%
Investment and Pension Services 13%
Network Gas 13%

Quid Pro Quo 23
However, it is important to appreciate that in reality switching is not necessarily a free process. For example, problems can arise with regards to transferring direct debit instructions from one bank to another. The latter can result in a customer getting fined for a direct debit payment being taken out of their old account after all the funds in it have been moved to the new account. This concern should not be trivialised, as according to a Which? survey, 40 per cent of the UK public who have switched their current account had problems getting their direct debits transferred.50 Similarly, incoming payments, such as salaries, could get sent to the old account after it has been closed, which might result in them getting lost. At the very least, rectifying this problem would be stressful and a significant inconvenience. These problems could easily be avoided if people could transfer their current account number in the same way that they can keep their phone number when switching mobile phone provider. Unfortunately, portability is not currently a feature of the banking industry.
Whilst switching may incur a fee, the vast majority of the public appears unaware of this fact, and thus it seems unlikely that this problem is significantly inhibiting transactions. A more subtle factor is whether low switching rates reflect a belief among dissatisfied bank customers that they would not find significantly better service at any other bank so there is little point in making the effort to switch.
Is the PCA market competitive?Given the preceding analysis, it is clear that the PCA market is concentrated, but not necessarily to a problematic degree, and transaction costs are not significantly undermining mutually beneficial exchange. However, in other respects, the market appears to fall far short of the model for perfect competition. Whilst all markets will do so to a certain extent, the PCA market performs particularly poorly in several areas.
In particular, barriers to entry are considerable, which will interfere with the disciplining force of the market as they impede potential competitors. Furthermore, comparability is often difficult and consumers are far from being perfectly informed about the products on offer. Thus, we have good cause to be sceptical about the efficiency of this market.
This conclusion is backed up by survey data. For example, a 2010 Which? survey found that only 53 per cent of people who have current accounts with the big five providers were ‘satisfied’ with the service they were getting.51 Interestingly, smaller banks such as First Direct, Virgin Bank, and the Co-operative Bank received much more positive feedback, with satisfaction levels of 88 per cent, 88 per cent, and 86 per cent, respectively.
This is consistent with the comparative lack of innovation within UK banks compared to other parts of the developed world. Returns on investment in innovation of customer services and products are low when customers are unlikely to move banks. By contrast in North America, Australia and the Far East banks are focussing innovation on providing their customers with easier ways to access their data and manage their money.
Consequently, we feel confident in concluding that competition is substandard in the PCA market. It does not seem unreasonable to suspect that banks will have been exploiting this in order to realise unduly high profits.
Underwriting rights issuesTurning from retail to investment banking, equity underwriting (an umbrella term that includes underwriting for both initial public offerings (IPOs) and rights issues; Boxes 6 and 7) is a highly lucrative industry and, in the UK alone, banks are estimated to have made £2 billion in this area in 2009.52 For example, the recent IPO of Glencore, the largest commodities trader in the world, on the London Stock Exchange is estimated to have been worth £165 million in fees to its underwriters.53 But how competitive is this important market?

Quid Pro Quo 24
A large number of producers and consumersLet us briefly take a look at concentration in the equity underwriting market.
Table 5 details how the market for underwriting FTSE 350 companies’ share issues in 2010 was captured. The market has an HHI of 1100, and its HHI in 2000 was 1006, so neither the current level of concentration nor the pace of the increase in concentration over recent years should give rise to concern.
Box 6: What is a rights issue?
If a company is looking to raise funds it could do so through a variety of methods:
• It could approach a bank and ask for a traditional bank loan.
• It could borrow money from investors on the capital markets by issuing bonds. Bonds can be thought of as tradable loans.
• It could issue shares. This e ffectively means that it sells property rights in the company.
If a company is issuing shares for the first time, this is called an Initial Public Offering (IPO). If a company has already had an IPO, but needs to raise more capital by issuing more shares, then this is called a rights Issue. It is this latter process that shall be the focus of our attention.
Box 7: What is equity underwriting?
A company seeking to raise capital is keen to ensure that it raises a given amount of funds. It does not want to be in the situation where its new shares fail to sell at the required price because its current share price has fallen to a level whereby it is no longer rational for investors to buy the new shares at the desired price.
The share price could fall for a variety of reasons, many of which would not be due to the company per se. For example, the share price could fall because of new regulation announced by the government which affects the entire industry in which the company operates, or the entire stock market could fall due to poor GDP data. Most significantly, the stock price could fall if the market’s appetite for the rights issue is overestimated.
To guard against such risks, the company will approach an underwriter who agrees to buy up any shares that investors do not subscribe to. Thus, the underwriter insures the rights issue in exchange for a fixed fee. Large investment banks, such as Barclays Capital and J P Morgan, typically provide such services.
Source: OFT (2011)54
Table 5. FTSE 350 equity underwriting market share (2010)
FTSE 350 Equity Underwriting Market Share (2010)
Bank of America 17.5%
Deutsche Bank 12.5%
Morgan Stanley 12.5%
Barclays Capital 12.5%
RBC Capital Markets 12.5%
JP Morgan Cazenove 7.5%
Goldman Sachs 7.5%
UBS 7.5%
Quid Pro Quo 25
Barriers to entryThe equity underwriting business suffers from many of the same barriers to entry as the retail banking market. These include:
• It is enormously expensive to start-up a new underwriting business, as an underwriter is obliged to buy all the shares issued if they can’t be placed with investors. Thus, a very large balance sheet is needed in order to make such a commitment, even for a relatively small-scale rights issue.
• Furthermore, track-record rather than value-for-money holds sway in the underwriting market. This is because the primary concern for executive directors in the company is that the rights issue is successful, i.e. that investors subscribe to all the new shares on offer. Although underwriting reassures the company it will receive the funds it needs, a failed share issue will send a poor signal to the market about investors’ confidence in the company, which may cause the company’s share price to fall. Consequently, underwriters must have a reputation for getting deals done. One can see that this introduces a classic catch-22 dilemma: a firm is not able to win deals until it has a reputation; however, it will not be able to establish said reputation without first winning deals. Thus, new underwriters generally arise from mergers and acquisitions, rather than arrive in the form of brand new competition.55
• Levels of switching are low. For example, from 2009 to 2010 only 16 per cent of firms switched at least one of their corporate brokers , the investment bank named by a company as its ongoing stock market adviser.56 These low levels of switching mean that new providers may be reluctant to enter the market, as, even if brand recognition had only minimal influence, they would still struggle to win business.
Thus, there are numerous significant barriers to new participants entering the rights issue market, which is concerning, as both realised and potential new entrants have an important role to play in fostering competition.
Comparability and perfect informationThe underwriting market is plagued with information asymmetries.
Whilst financial firms may have existing expertise they can utilise when raising capital, non-financial companies are frequently ignorant of such issues and so are far less likely to know whether or not they are being offered a value-for-money service. Furthermore, share issues are not a regular occurrence for most companies, and consequently company directors do not have an opportunity to learn from prior mistakes.
In addition, underwriting fees are typically bundled together with other fees, such as those for sub-underwriting (Box 8), general advice, working with the UK Listing Authority (UKLA), due-diligence (e.g. producing the FSA-required prospectus). This makes it even more difficult for companies to determine whether or not they are getting a good deal, as they have to be able to calculate the fair value of each component of the fee, in order to assess the total fee they have been quoted. If the fee was instead explicitly broken down into its individual components, then companies might at least have sufficient expertise to be able to assess whether a few of the individual quotes seemed reasonable.

Quid Pro Quo 26
Is the rights issue market competitive?Whilst the level of concentration in this market is not a problem, extensive barriers to entry and information asymmetries are very likely to severely undermine competitive forces. Furthermore, the market additionally seems to suffer from multiple principal-agent problems. A principal-agent problem describes the conflicts of interest that can arise when an agent acts on someone else’s behalf (the principal). The motivations, incentives and information held by the agent may be different to that of the principal. As a result, even when the agent attempts to act in the best possible interests of the client, it may in fact be influenced in its actions by its own best interests, perhaps subconsciously.
For example, when a corporation is trying to raise capital, it will appoint a corporate broker, who will advise the company throughout the capital-raising process and market the issue to investors. However, most corporate brokers are part of investment banks, and have large underwriting departments. This situation is ripe for conflicts of interest, as the corporate broker will advise the company on when and how it should raise capital, and an in-house underwriting division stands to profit from such an undertaking.
Whilst investment banks maintain that they are vigilant against the threat of conflicts of interest and have internal mechanisms in place to guard against such problems, the fact remains that for many companies their corporate broker is also their underwriter. For example, the OFT reports that:
We examined 85 rights issues from the start of 2000 to the end of 2009 and, using data from Hemscott, we found that in 82 [96%] of the issues, corporate brokers were involved in the transactions as underwriters.57
Furthermore, it goes on to add:
…there appears to be relatively limited competition for equity underwriting appointments, and competition between investment banks instead appears to be focussed on securing roles as corporate brokers which enhance their ability to secure equity underwriting and other transactional work (such as mergers and acquisitions) in the future... Out of the 48 companies that responded to our survey, only three said that they used formal competitive tendering mechanisms... when selecting equity underwriters.
Moreover, banks frequently are willing to supply broking services at below their breakeven price, which corroborates the link between broking mandates and subsequent lucrative underwriting deals.58
On one hand, corporate brokers are intimately familiar with the companies they serve, which means that they already have the knowledge needed to value the risk associated with underwriting the deal, which should thus reduce the fee charged for underwriting. Furthermore, banks may be reluctant to underwrite rights issues if they are not also in charge of marketing the deal, as they may not trust an external corporate broker to tackle the task with the same level of zeal and competence. In this sense, stable client relationships and the ability to offer an integrated service might improve efficiency and service to the corporate customer.
Box 8: What is sub-underwriting?
Sub-underwriting is the process whereby underwriters pass on some of the underwritten risk to other underwriters. Thus, underwriting is insurance for the company trying to raise capital, and sub-underwriting is insurance for the original underwriter. Generally institutional investors such as life assurance and fund management companies will agree to sub-underwrite share issues in exchange for a fee, as they are natural holders of such securities in the normal course of their business.

Quid Pro Quo 27
On the other hand, this practice also opens the door to investment banks competing aggressively for corporate broking mandates, knowing that they will almost certainly be appointed as an underwriter. The way is then clear to overcharge for underwriting services knowing that there will be little competition once appointed and that the underwriting fee will be bundled together with other charges. This is a very pertinent concern given that the corporate broker/underwriter also advises the company on what underwriting fees are appropriate because, given the aforementioned information asymmetries, companies struggle to assess this independently.
This is not the only principal-agent problem that this market suffers from. The ultimate consumers in this market are the shareholders who own the companies raising capital. These shareholders would like capital to be raised successfully, but would like underwriting costs to be kept to a minimum. However, the ‘agent’ they appoint to run this process is the company itself or, specifically, its executive directors. As previously explained, if not all of the new shares issued are subscribed to by investors, then this sends a negative message to the market, which will reflect poorly on the company’s directors. Thus, the primary concern for executive directors is that the rights issue is successful and they will not be so concerned by how much of their shareholders funds disappears in investment banking fees.
Consequently, this results in the unfortunate situation whereby the client is motivated by the underwriter’s reputation for getting deals done, rather than by which underwriter is offering the best value-for-money service. As a result, investment banks have little incentive to compete over price. Moreover, the Institutional Investor Council (IIC) has expressed concern that ‘issuers interpret low fees as a sign of low quality’.59 Regarding competition in the market, the IIC remarks: ‘There is little compelling evidence of sufficient price tension at both primary and sub-underwriting level. Indeed the inherent conflicts suggest that all the incentives work to increase the cost of the issue.’ Similarly, the OFT found that only 19 per cent of companies consider charges to be ‘very important’ when choosing their underwriter.60
To compound these issues, the fee is generally only agreed upon immediately before the rights issue takes place, when the amount of risk that the underwriter is taking on has become more certain.61 Thus, if a company feels it is being overcharged by its underwriter, its only option would be to pull the deal at the last minute, which would inevitably rattle the market.
There is a similar lack of competition in the process by which sub-underwriters are chosen. Sub-underwriters, who are frequently existing shareholders in the company, and are therefore keen to see that share issues are successful, are merely made an offer by the underwriter which they can either accept or refuse. The investment bank acting as lead underwriter has sole control over what percentage of the deal it sub-underwrites and what percentage of the fee is passed on to sub-underwriters. For example, the IIC reports that:
We were told by many respondents, and not just by shareholders, that it was wrong for just half of the fee in a typical issue to be passed to the sub-underwriters. We were also told that the primary underwriters (given their risk mitigation techniques) should not receive more than one-third of the aggregate underwriting commission…. We were told by both existing and potential shareholders of issuers that they had requested sub-underwriting or additional sub-underwriting. These requests were turned down despite the bank retaining a significant outright underwriting position on its balance sheet. We were also told of instances when shareholders have asked for more participation than originally offered (or at a lower fee) and been refused, indicating further evidence of mispricing.62
Furthermore, the company raising capital will usually be completely in the dark about what proportion of the deal has been sub-underwritten, and who the sub-underwriters are. A competitive tendering process could help drive down sub-underwriting fees.

Quid Pro Quo 28
All these issues substantially lower the probability that this is an efficient market that works well for the consumer. Moreover, there is a wealth of evidence that corroborates this suspicion. For example, we can look at how discounting (Box 9) has varied over time.
The extent to which shares were offered at a discount to their fair value price increased dramatically during the recent financial crisis.63 This was to be expected, as raising capital was extremely difficult during such turbulent times and so underwriters were required to take on more risk. However, the extent of discounting has not fallen despite a long time having elapsed since the peak of the crisis. Underwriters are taking less risk yet underwriting fees still remain high.64 For example, the IIC reports that underwriting fees were 2 per cent prior to 1999 but have been approximately 3.4 per cent since 2007.65 This is despite the fact that shares were issued at 10–15 per cent below fair value prior to 1999, but have been issued at a 30–40 per cent discount to fair value since 2007. In 2010, underwriting fees were around 2.75 per cent, i.e. over a third more expensive than prior to 1999, despite the level of discounting being around 35 per cent, i.e. nearly 2–3 times greater than pre–1999.
The OFT also agreed that there has been a recent inflation of fees in comparison to the risk borne by underwriters:
While such increases can be explained, at least in part, by the increase in volatility and risk in this period, our analysis suggests that fees and discounts have been slow to fall in line with subsequent reductions in risk, in particular from lower stock market volatility. In addition, while there was significant variation in fees and discounts for most of the last 10 years (which is likely to reflect variations in the risk of individual transactions), in 2009 there was significant clustering of fees and discounts.66
This last point is very important. If underwriting fees and discount levels really reflect the risk that an underwriter is taking on, then they should vary significantly between deals according to the riskiness of the specific rights issue. Thus, a clustering suggests that many banks instead charge a standard fee and utilise a standard discount rate, rather than customise ones dependent upon the risk of the deal.
Other factors have also brought about a reduction in risk, including the fact that underwriters now generally reach out to investors prior to the rights issue in order to gauge how many takers there will be, and, thus, what the price of the issue should be; this process is called ‘pre-marketing’. For example, IIC reports that:
We learned that the underwriting agreement between the issuer and the bank that acts as lead underwriter is often not signed until the bank has near certainty that a large proportion of the issue has been sub –underwritten.67
There are a number of other factors that indicate that this market is failing. For example, it is always automatically assumed that the entire deal must be underwritten, or that the deal should not be underwritten at all. Clearly this is not sensible; a whole spectrum of choice in this regard should be available.
Box 9: What is discounting?
New shares are often offered to existing shareholders at a discount to their prevailing market value (or estimated value in the case of IPOs, where the securities are not yet traded). This is to encourage shareholders to buy up the new stock. However, discounting also lowers the risk that underwriters are required to shoulder, as the lower the price of the new shares, the greater the probability that they will all be subscribed to.
Quid Pro Quo 29
We conclude that there is ample evidence to suggest that this market is operating far from smoothly. This was also acknowledged in a recent enquiry by the OFT. However, the OFT interestingly points the finger at institutional investors, for not applying sufficient pressure on banks to lower their fees, and does not blame the banks themselves,68 and thus did not to refer the industry to the Competition Commission. Unsurprisingly, investors strongly rejected this conclusion. For example, the Head of Regional Corporate Governance at Aviva, one of the largest UK-based asset managers, said:
We do recognise there is a problem, but without transparency [on fees] it is very hard for us to be pragmatic and effective in tackling the problem.69
From considering all the issues raised in this report, we are inclined to disagree with the OFT, and instead suggest that the true culprits are the information asymmetries that are pervasive throughout this market. There is no inherent reason why some of these could not be tackled, for example, if the banks unbundled underwriting fees.
Nevertheless, regardless of how the blame should be apportioned between different factors and players, the fact remains that this is a poor market for consumers, and that there is a very strong case that this manifests itself in excessive profits for banks.
Other banking products and servicesWe have examined two of the largest banking markets, the market for current accounts and the market for underwriting rights issues, and found both to display serious deficiencies relating to competitiveness. Moreover, some key themes have emerged:
• Barriers to entry are high in both markets.
• Information asymmetries are present in both markets, whereby the banks have much more information and expertise about products and appropriate pricing than their customers do. This is likely to be compounded by behavioural biases on behalf of consumers. For example, there is evidence that current account customers assume that they will not need to access their overdrafts, even if, in actual fact, they are very likely to. This often results in them not comparing overdraft charges when choosing their current account provider.
• Principal-agent problems are not uncommon.
Of course, we could argue that the two markets considered are anomalies, and that the markets for other banking products and services are fair and efficient. As previously stated, a comprehensive investigation into this is far beyond the scope of this study. Nevertheless, let us briefly explore three of the aforementioned themes in a little more detail.
Information asymmetriesFirst, let us discuss information asymmetries, and whether this problem is likely to be pervasive throughout many more of the markets for banking products and services.
Hitherto, we have ignored another key role undertaken by investment banks, that of market making ( Box 10). It is widely acknowledged that banks can take advantage of information asymmetries whilst providing this service. For example, over-the-counter (OTC) trading, where customers trade with banks over the phone or via an electronic messaging service, is frequently criticised in comparison to exchange trading. One reason for this is because OTC markets generally lack transparency, as customers have far less information about prices and liquidity. For example, a report by the Financial Stability Board states that:

Quid Pro Quo 30
The OTC derivatives markets are currently relatively opaque due to their privately negotiated, bilateral nature and the limited availability of transaction data such as prices and volumes… This opacity also may make valuing transactions more difficult… Exchanges and electronic trading platforms (collectively referred to in this report as ‘organised platforms’ ) often provide higher levels of transparency than OTC derivatives trading. This transparency includes both publication of quotes and orders for transactions (pre-trade transparency) and reporting to regulators and to the public of completed transaction details (post-trade transparency)… Pre- and post-trade transparency can affect the liquidity of markets in ways that may be beneficial to some market participants by improving the quality of prices. A properly designed transparency regime (which, amongst other factors, takes into consideration the individual specifics of the market and its participants), may deliver price formation benefits and in turn wider market efficiency benefits.70
The lack of standardisation in most OTC products means that, on one hand, clients can have products tailored to suit their individual needs, but, on the other hand, this fragmentation exacerbates the transparency problems inherent to OTC trading.
When investors are unsure what price a given product should be trading at, market-makers are able to exploit this by increasing their bid-offer spread, and thus increasing their profits. This concern is particularly pertinent when dealing with very complicated ‘exotic’ derivatives products, where there may only be a couple of market-makers who are willing to quote prices for such products at all, and pricing the product may take hours or even more than a day.
For further evidence of banks taking advantage of information asymmetries, one need only look at the scandal surrounding Payment Protection Insurance (Box 11).
In short, in light of these examples, it is highly unlikely that market failures arising from information asymmetries are restricted to just the markets for personal current accounts and rights issues.
Box 10: What is a market-maker?
A market-maker states the prices at which they will buy (‘bid’) or sell (‘offer’) a given stock, bond, commodity, derivative, or any other financial product, and this facilitates the trading of such securities. They hope to buy products at a lower price than where they sell them, and, thus, profit from this bid-offer spread.
A market-maker differs from a broker because they actually buy, hold, and sell securities themselves, whereas a broker simply matches up buyers and sellers and charges a commission for this service.

Quid Pro Quo 31
Behavioural biases Let us now move on to explore behavioural biases (Box 12), and whether there is evidence to suggest that banks turn this to their advantage.
Box 11: The payment protection insurance (PPI) scandal
PPI provided insurance against missing loan, mortgage, or credit-card repayments as a result of loss of income. However:
• Costs associated with such schemes were not fully and clearly disclosed by the banks prior to sale.
• Many consumers reported that the banks intimated to them that they wouldn’t qualify for loans unless they took out PPI, or that PPI was automatically included in lending agreements, without it being made clear that they could opt-out of the scheme.
• In many cases, PPI fees were included as part of a loan, which meant that borrowers were paying interest on the cost of their PPI as well as on their loan itself.
• PPI frequently did not provide as broad coverage as many people had assumed. For example, many PPI schemes did not pay out in the event of a loss-of-earnings due to mental health problems.
• PPI was sold to the self-employed, despite the fact that many claims made by the latter would automatically be rejected.
In May 2011, the large UK banks announced that, as a ‘gesture of goodwill’, they were abandoning their legal battle against FSA’s instructions that they should pay out approximately £9 billion in compensation for mis-selling PPI to thousands of customers since 2005.
Box 12: What is behavioural economics?
Behavioural economics, which tries to incorporate psychology into economic theory, is now a major field of research. According to this relatively new discipline, economic agents suffer from behavioural biases, which can make their behaviour appear irrational and can introduce systematic biases into traditional economic models. Common behavioural biases include:
• Framing: A consumer’s decision can be influenced by the way in which the options are presented. For example, consumers are often biased towards choosing the first option in a list.
• Hyperbolic discounting: Consumers disproportionately value the present over the future.
• Herd instinct: Consumers’ choices can be influenced by the behaviour of others. For example, many argue that traders jumping on band-wagons are a primary factor behind market bubbles and crashes.
• Over-optimism: Consumers are often excessively positive when assessing the likely outcome of a prospective choice.
• Default bias: Consumers will often accept the default option presented to them rather than choose to opt-out.
• Choice-supportive bias: Consumers are often biased when they come to assess how successful their past decisions have been.
• Endowment effect: Consumers value objects that they own over identical ones that they do not own.
• The paradox of choice: If consumers are offered too many choices, they will often make a bad decision or fail to make any decision at all.
Quid Pro Quo 32
There are plenty of examples of consumers making financial decisions that do not appear to be in their best interests. We have already met one: consumers who regularly access their overdraft not comparing overdraft charges when choosing their current account provider. Other examples include:
• Consumers underestimate the extent to which they will use their credit cards, which results in providers being able to charge interest rates that greatly exceed the costs they incur for extending this credit (this is discussed in more detail later).71 This over-optimism is similar to the underestimation of overdraft usage described earlier. Health clubs provide another good example, as consumers greatly overestimate how frequently they will go to the gym and, consequently, choose to pay a fixed monthly fee rather than pay per visit, despite the fact that the latter would be cheaper for most consumers.72
• Consumers learn from incurring credit card fees, such as those arising from exceeding credit limits; i.e. consumers who incurred a fee last month are significantly less likely to incur a fee this month, as many will adapt their spending patterns to avoid triggering a fee. However, consumers gradually forget this lesson over time.73 For example, incurring a fee a year ago has much less of an impact on the probability that a consumer will incur a fee this month. Such dynamics are not consistent with traditional economic models.
• When consumers use online price comparison sites that do not automatically rank the relevant options in price order, consumers’ purchasing choices are affected by the order in which the options appear. For example, one research paper finds: ‘Firms lose about 15% of their business for every competitor listed above them on the screen.’74
• Consumers have been found to be highly susceptible to ‘drip pricing’ , a technique whereby charges are broken down and revealed to the consumer in stages, rather than all at once.75
• Consumers are much more willing to spend a given sum of money if their money exists in small denominations. For example, if you give consumers five 20p coins or one £1 coin, they are significantly more likely to spend the former.76
Behavioural economics can throw up other causes of market failure. This point has been recognised by the OFT, which has released a paper that explores how behavioural biases impact on competition policy.77 For example, the OFT notes that:
Such consumer biases are not simply relevant to understanding how consumers act in a market; they also have a bearing on firms’ behaviour. Where such biases exist, firms can act to exacerbate and exploit them, at every stage in the decision-making process.78
Whilst some behavioural biases can be corrected over time by consumers learning from their mistakes, this is unlikely to happen in many banking markets, as products and services are generally purchased very infrequently.
Significantly, there is evidence to suggest that banks and other firms actively exploit such behavioural biases in order to maximise their own profits. For example, a research paper from the University of California, Berkeley notes that:
…the typical credit card contract features a low interest rate for an introductory period of typically six months, followed by a high interest rate for the subsequent period. The renewal after the introductory period is automatic. The heavily back-loaded structure of the charges is consistent with consumers underestimating renewal past the introductory period. Empirical evidence on consumer behavior confirms this interpretation. In a field experiment with randomized credit card offers, consumers appear to overrespond to introductory interest rates relative to postintroductory rates...79

Quid Pro Quo 33
In addition, research in the American Economic Review on the failure of competition in the credit card market also came to this conclusion:
The facts of the market appear to be inconsistent with the predominance of well-informed consumers who are attempting to minimise their borrowing costs. There is no evidence that consumers are generally offered competitive interest rates on bank card balances, nor that most consumers respond to lower interest rates when they are offered.80
Moreover, where banks do take advantage of behavioural biases, this often results in profits that many consider to be tantamount to daylight robbery. For an example of this, Box 13 for details of the OFT’s battle against excessive overdraft fees.
It is also interesting to note that consultants have explicitly urged banks to utilise behavioural techniques in order to undermine competition. For example, one research brief advises banks to ensure that it uses a complex pricing structure that is different from other banks to prevent customers easily shopping around for the best deal:
The likelihood that banks continually try to undersell one another is greater if their price structures make it easy for customers to compare offers. In order to prevent easy comparisons, a bank should create price structures that are clearly distinguishable from those of its rivals. Price systems with several price components are especially effective.81
In short, it is highly unlikely that only the market for current accounts suffers from behavioural biases; markets may be inefficient across most financial products for the same reasons. Moreover, there is evidence to suggest that banks cynically exploit behavioural biases, and that this has proved to be an extremely profitable activity for banks in the past.
Box 13: The Office of Fair Trading vs overdraft fees
In 2007, the OFT took the largest British banks to court claiming that their overdraft charges were wholly disproportionate, as they brought in £2.6 billion per year to the banks. Its lawyers argued that if overdraft fees are greater than the costs that banks incur as a result of customers dipping into their overdrafts, then ‘the charges will amount to penalties, which are unenforceable’.
This conjecture seems highly probable given that there are stories of people being charged £660 for being £60 overdrawn. Moreover, the OFT found that current accounts cost the average person £152 each year. In a similar vein, a BBC whistle-blower claimed that a bouncing cheque costs a bank approximately £2, yet customer charges sometimes amount to £39.
However, in 2009, the Supreme Court deemed that it didn’t have the power to determine whether or not overdraft charges are fair and, thus, consumers found that they were unable to claim compensation. Consumer groups reacted angrily to this ruling. For example, the Chief Executive of Which? said that this gave banks ‘licence to charge what they like for unauthorised overdrafts’.
Quid Pro Quo 34
Principal-agent problemsWe have hitherto neglected a key service offered by investment banks: asset or investment management (Box 14).
Asset management is an industry that is potentially fraught with principal-agent problems. For example, an empirical analysis of the industry in the Journal of Finance found that:
Mutual fund managers claim that expenses and turnover do not reduce performance, since investors are paying for the quality of the manager’s information, and because managers trade only to increase expected returns net of transaction costs. Thus, expenses and turnover should not have a direct negative effect on performance… I find that expense ratios, portfolio turnover, and load fees are significantly and negatively related to performance.82
This indicates that the more actively managed a fund is, the poorer its performance is likely to be, as a result of associated increased fees.
A further set of studies suggest that actively managed funds do not actually add value at all over passively managed funds. For example, a study conducted by the University of Chicago concluded that ‘even the ‘best’ mutual fund managers do not have stock picking skills.’83
Similarly, a report from Harvard Business School finds that:
The evidence on mutual fund performance discussed above indicates not only that these 115 mutual funds were on average not able to predict security prices well enough to outperform a buy-the-market-and-hold policy, but also that there is very little evidence that any individual fund was able to do significantly better than that which we expected from mere random chance. It is also important to note that these conclusions hold even when we measure the fund returns gross of management expenses (that is assume their bookkeeping, research, and other expenses except brokerage commissions were obtained free). Thus on average the funds apparently were not quite successful enough in their trading activities to recoup even their brokerage expenses.84
However, despite such findings, over 96 per cent of American mutual funds are ‘active’.85
Thus, the market for rights issues is clearly not the only banking market to suffer from principal-agent problems.
Box 14: What is investment management?
Investment management is the service of investing money on behalf of clients and usually includes carrying out the associated administration required. Clients can be individuals or collective funds, such as pension and insurance funds, which comprise the savings of many individuals. Investment management services can be ‘active’, where the investment manager takes decisions on which securities and other assets to invest in, or ‘passive’ where they carry out the buying and selling of assets according to predefined rules, usually tracking an investment index such as the FTSE 100 index of the shares of leading UK companies. Some large insurance and pension companies manage their own investments, and others appoint external investment managers.

Quid Pro Quo 35
Do banks operate in efficient markets?The list of enquiries into competition within the UK banking industry is long and distinguished. We have not attempted to add another report to this list. Instead, we have reviewed a range of factors, inherent to the nature of banking, that explain why banks appear to be so profitable, despite poor reported levels of customer satisfaction.
By taking two key case studies, the markets for PCAs and rights issues, and using the orthodox framework of competition, we have discovered that concentration in the banking sector, an issue that has received a lot of attention from both the press and competition enquiries, is the least of this industry’s problems. Instead, barriers to entry, information asymmetries, behavioural biases, and principal-agent issues, need to be tackled by authorities if the extent to which banks can work against their customers is to be limited.
Moreover, we have shown that we have every reason to believe that the aforementioned issues are not idiosyncratic features of the markets for PCAs and rights issues. Instead, such obstacles appear to undermine effective competition in many of the markets for banking products and services, and, as we have seen with overdraft fees and payment protection insurance, this opens the door to banks extracting excessive profits that do not reflect value added.
Quid Pro Quo 36
3. The too-big-to-fail subsidy
Large banks are able to borrow at lower interest rates than they would be able to if they operated in a truly free market. This is because there is an implicit (and now in some cases explicit) understanding that the government will step in and bail out bond holders if a large bank defaults on its debt payments.
This directly results from the vast scale of these enterprises (as discussed in Section 1 of this report), and the extreme degree to which they are intertwined with the rest of the British economy.
In addition to unfairly inflating their profits, this ‘too-big-to-fail’ (TBTF) subsidy gives large banks a huge commercial advantage over their smaller counterparts, and it exacerbates the barriers that new, smaller firms face when trying to enter the market. Moreover, even ignoring the financial value of this subsidy, whilst a sense that the government would intervene exists, risks will not be fully borne by the risk-takers. As a result, one will not be able to rely on market discipline – a consequence being excessive risk-taking.
Calculating the TBTF subsidyAndrew Haldane, the Executive Director of Financial Stability at the Bank of England, put an estimate on the value of the TBTF subsidy in a paper released in 2010.86 His methodology utilises the fact that Moody’s, a prominent credit rating agency that rates firms and governments according to the likelihood of them not being able to repay their debts, helpfully provides two separate ratings for banks: one that reflects the true riskiness of the bank, given its assets, liabilities and strategy (the Financial Strength Rating ), and another that reflects the riskiness of buying senior bonds issued by the bank, given that it enjoys government support (the Senior Unsecured Rating ). Merrill Lynch helpfully provides a range of indexes that demonstrate how banks’ costs of funding have varied over time.87 A separate index is provided for each rating level; thus, by looking at how a bank’s rate of funding differs depending on whether we use its unsecured or financial strength rating, we can estimate to what extent the TBTF subsidy lowers the interest rate that each bank pays to service its debt. Moreover, by looking through banks’ annual reports to find the total monetary value of all of a bank’s liabilities with interest rates that would be affected by the bank’s credit rating, we can calculate the monetary value of the TBTF subsidy for each bank.
Haldane’s results are shown in Table 6. First, we can see that the TBTF subsidy is far from trivial. Whilst the extremely large numbers from mid-2009 are clearly a product of the extraordinarily difficult market conditions found at that time, the figures prior to the peak of the crisis are also very substantial. For example, in 2008 the TBTF subsidy was worth £52 billion to the five largest banks, which is larger than the 2009/2010 spending of each UK government department, excluding health, education, and the Department for Work and Pensions.88 Furthermore, the TBTF subsidy was worth £9 billion to the five largest banks in 2007, which is larger than the 2009/2010 spending enjoyed by each of the following: the Department for International Development, the Department of Energy and Climate Change, the Department for Environment, Food and Rural Affairs, the Department for Culture, Media and Sport, and the Foreign and Commonwealth Office.

Quid Pro Quo 37
It is important to recognise that the TBTF subsidy should not be thought of as a physical transfer of these funds from the Treasury to the banks. This only occurs if a bank is actually in need of explicit support – in other words a bail-out. The TBTF subsidy should instead be looked at as a reduction in the interest rate demanded by investors when lending to the banks, as a result of the implicit government support for the industry, i.e. the general understanding that the government will reimburse bond holders if the bank gets into trouble. In this way, a bank such as Barclays has enjoyed reduced funding costs without directly taking public money. Consequently, the above comparison with government departments is simply to help us appreciate just how valuable the TBTF subsidy is, and how truly privileged the banking industry is to benefit from it. It is not meant to suggest that in 2007 the government spent more on the banks than it did on trying to tackle energy and climate change.
However, it is equally important to recognise that whilst the TBTF subsidy does not involve the direct transfer of funds from the Treasury to the banks, it may involve an indirect transfer, as the interest rate at which investors will lend to the government may increase to reflect the additional risk the government is taking on board in effectively underwriting its banks’ balance sheets
Haldane’s figures provide an interesting foundation from which to analyse the TBTF subsidy; however, they do not provide the level of detail we would ideally like. For example, the results quoted are for the largest five banks as a group. It would instead be far more interesting to know what the TBTF subsidy was for each individual bank, and so we calculated these numbers for ourselves by following Haldane’s methodology. First, we wanted to ensure that our understanding of the methodology was correct, so we checked to see if our results tied in with Haldane’s (Table 7).
Source: Haldane (2010)89
Source: nef’s calculations and Haldane, A. (2010)90
Table 6. TBTF subsidy to the largest five UK banks
2007 2008 Mid 2009
Total Average Total Average Total Average
TBTF Subsidy to the largest five UK banks (which Haldane takes to be Barclays, Lloyds, HSBC, RBS and Nationwide)
£9bn £2bn £52bn £10bn £103bn £26bn
Table 7. Comparison of Haldane and nef TBTF calculations
2007 2008 Mid 2009
Total Average Total Average Total Average
Haldane’s TBTF Subsidy to the largest five UK banks £9bn £2bn £52bn £10bn £103bn £26bn
nef’s TBTF subsidy to the largest five UK banks £10bn £2bn £51bn £10bn £107bn £21bn
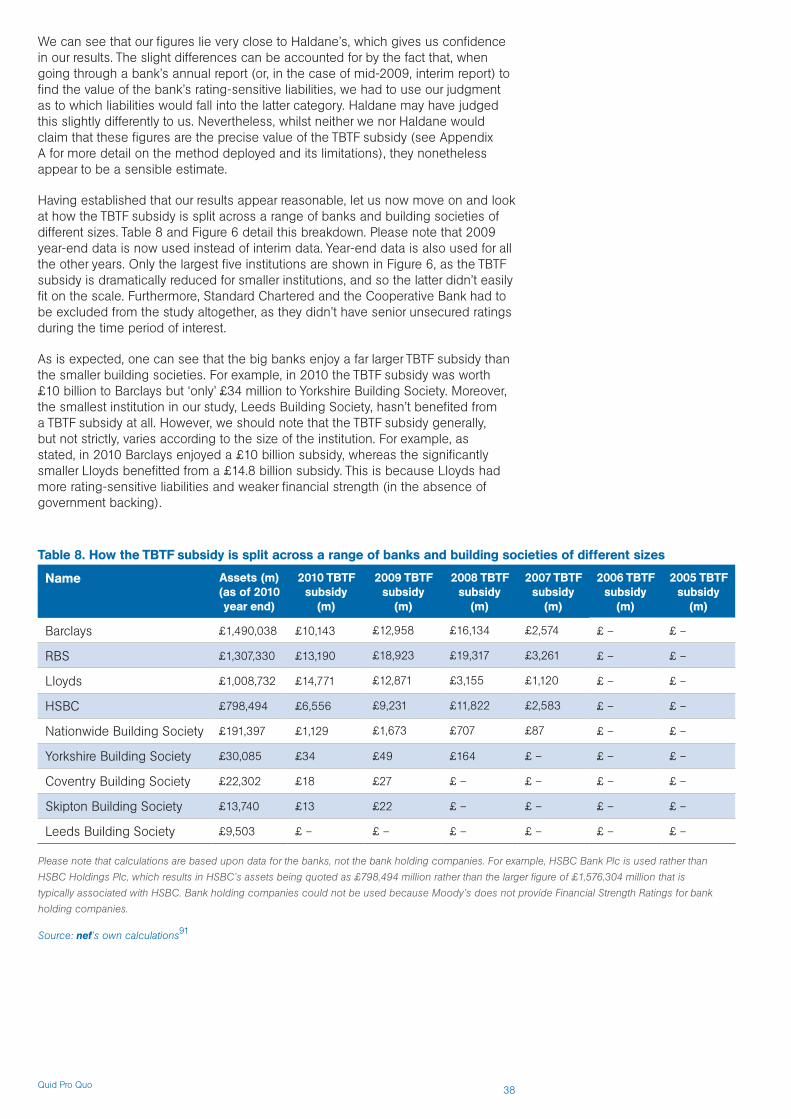
Quid Pro Quo 38
We can see that our figures lie very close to Haldane’s, which gives us confidence in our results. The slight differences can be accounted for by the fact that, when going through a bank’s annual report (or, in the case of mid-2009, interim report) to find the value of the bank’s rating-sensitive liabilities, we had to use our judgment as to which liabilities would fall into the latter category. Haldane may have judged this slightly differently to us. Nevertheless, whilst neither we nor Haldane would claim that these figures are the precise value of the TBTF subsidy (see Appendix A for more detail on the method deployed and its limitations), they nonetheless appear to be a sensible estimate.
Having established that our results appear reasonable, let us now move on and look at how the TBTF subsidy is split across a range of banks and building societies of different sizes. Table 8 and Figure 6 detail this breakdown. Please note that 2009 year-end data is now used instead of interim data. Year-end data is also used for all the other years. Only the largest five institutions are shown in Figure 6, as the TBTF subsidy is dramatically reduced for smaller institutions, and so the latter didn’t easily fit on the scale. Furthermore, Standard Chartered and the Cooperative Bank had to be excluded from the study altogether, as they didn’t have senior unsecured ratings during the time period of interest.
As is expected, one can see that the big banks enjoy a far larger TBTF subsidy than the smaller building societies. For example, in 2010 the TBTF subsidy was worth £10 billion to Barclays but ‘only’ £34 million to Yorkshire Building Society. Moreover, the smallest institution in our study, Leeds Building Society, hasn’t benefited from a TBTF subsidy at all. However, we should note that the TBTF subsidy generally, but not strictly, varies according to the size of the institution. For example, as stated, in 2010 Barclays enjoyed a £10 billion subsidy, whereas the significantly smaller Lloyds benefitted from a £14.8 billion subsidy. This is because Lloyds had more rating-sensitive liabilities and weaker financial strength (in the absence of government backing).
Source: nef’s own calculations91
Please note that calculations are based upon data for the banks, not the bank holding companies. For example, HSBC Bank Plc is used rather than
HSBC Holdings Plc, which results in HSBC’s assets being quoted as £798,494 million rather than the larger figure of £1,576,304 million that is
typically associated with HSBC. Bank holding companies could not be used because Moody’s does not provide Financial Strength Ratings for bank
holding companies.
Table 8. How the TBTF subsidy is split across a range of banks and building societies of different sizes
Name Assets (m) (as of 2010 year end)
2010 TBTF subsidy
(m)
2009 TBTF subsidy
(m)
2008 TBTF subsidy
(m)
2007 TBTF subsidy
(m)
2006 TBTF subsidy
(m)
2005 TBTF subsidy
(m)
Barclays £1,490,038 £10,143 £12,958 £16,134 £2,574 £ – £ –
RBS £1,307,330 £13,190 £18,923 £19,317 £3,261 £ – £ –
Lloyds £1,008,732 £14,771 £12,871 £3,155 £1,120 £ – £ –
HSBC £798,494 £6,556 £9,231 £11,822 £2,583 £ – £ –
Nationwide Building Society £191,397 £1,129 £1,673 £707 £87 £ – £ –
Yorkshire Building Society £30,085 £34 £49 £164 £ – £ – £ –
Coventry Building Society £22,302 £18 £27 £ – £ – £ – £ –
Skipton Building Society £13,740 £13 £22 £ – £ – £ – £ –
Leeds Building Society £9,503 £ – £ – £ – £ – £ – £ –

Quid Pro Quo 39
A further point of interest is that, according to this methodology, no institution enjoyed a TBTF subsidy prior to 2007. This conclusion comes about because, for all the institutions examined, their financial strength ratings were the same as their senior unsecured ratings until the financial crisis. This observation reflects poorly on Moody’s, for not having picked up on the inherent instability in the banks’ business models prior to the financial crisis. This is consistent with the widespread criticism the credit rating industry has been exposed to recently, and accusations that despite the responsibility that comes with being part of this influential oligopoly, the three major rating agencies regularly fail to accurately rate governments and companies.
Comparing the TBTF subsidy with other countries and industriesHow does the TBTF subsidy in the UK compare to those in other countries? Table 9 gives a breakdown of the TBTF subsidy in 2010 for the four largest banks (by assets) in the UK, France and Germany. Whilst the total TBTF subsidy for the four largest banks is significantly smaller in Germany than in the UK, in France it is only marginally so. This is because one French bank, BPCE, receives a very large TBTF subsidy, which thus inflates the French average and total. Interestingly, BPCE and RBS have the same Financial Strength and Senior Unsecured ratings. Furthermore, the two banks have approximately the same amount of rating sensitive liabilities. BPCE’s enormous TBTF subsidy instead arises from the difference in funding rates between being a highly rated and poorly rated entity in the Eurozone. Surprisingly, this arises due to well rated entities in the Eurozone enjoying a particularly low rate of funding (as 31 December 2010).
31/1
2/05
31/1
2/06
31/1
2/07
31/1
2/08
31/1
2/09
31/1
2/10
Barclays
RBS
Lloyds
HSBC
Nationwide Building Society
£ –
£5,000
£10,000
£15,000
£20,000
£25,000
£35,000
£40,000
£45,000
£30,000
TBTF
Sub
sidy
(m
illio
ns)
Year
Figure 6. UK Banks’ TBTF Subsidies
Source: nef’s own calculations92
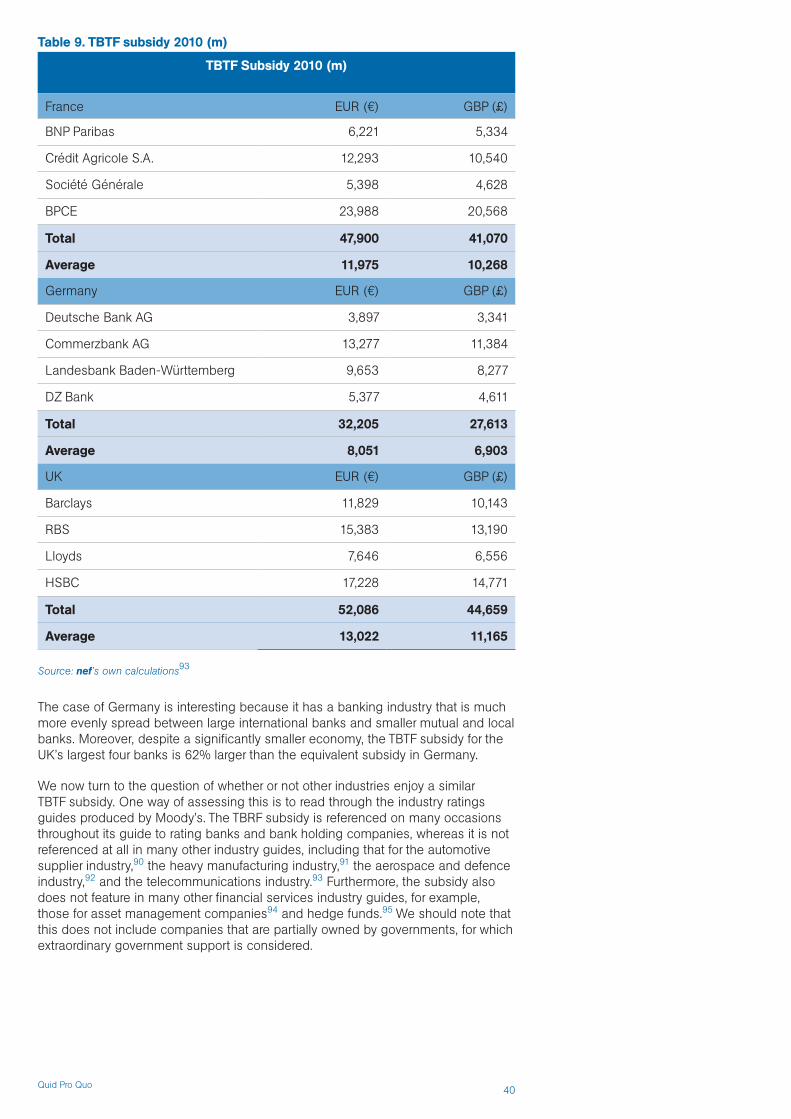
Quid Pro Quo 40
The case of Germany is interesting because it has a banking industry that is much more evenly spread between large international banks and smaller mutual and local banks. Moreover, despite a significantly smaller economy, the TBTF subsidy for the UK’s largest four banks is 62% larger than the equivalent subsidy in Germany.
We now turn to the question of whether or not other industries enjoy a similar TBTF subsidy. One way of assessing this is to read through the industry ratings guides produced by Moody’s. The TBRF subsidy is referenced on many occasions throughout its guide to rating banks and bank holding companies, whereas it is not referenced at all in many other industry guides, including that for the automotive supplier industry,90 the heavy manufacturing industry,91 the aerospace and defence industry,92 and the telecommunications industry.93 Furthermore, the subsidy also does not feature in many other financial services industry guides, for example, those for asset management companies94 and hedge funds.95 We should note that this does not include companies that are partially owned by governments, for which extraordinary government support is considered.
Source: nef’s own calculations93
Table 9. TBTF subsidy 2010 (m)
TBTF Subsidy 2010 (m)
France EUR (€) GBP (£)
BNP Paribas 6,221 5,334
Crédit Agricole S.A. 12,293 10,540
Société Générale 5,398 4,628
BPCE 23,988 20,568
Total 47,900 41,070
Average 11,975 10,268
Germany EUR (€) GBP (£)
Deutsche Bank AG 3,897 3,341
Commerzbank AG 13,277 11,384
Landesbank Baden-Württemberg 9,653 8,277
DZ Bank 5,377 4,611
Total 32,205 27,613
Average 8,051 6,903
UK EUR (€) GBP (£)
Barclays 11,829 10,143
RBS 15,383 13,190
Lloyds 7,646 6,556
HSBC 17,228 14,771
Total 52,086 44,659
Average 13,022 11,165
Quid Pro Quo 41
We should also draw attention to the insurance industry, as, given the 2008 bail-out of AIG, the large American insurance company, this industry might also have been considered too-big-to-fail and, thus, it may also enjoy artificially low funding rates. However, Moody’s rating guide for Property and Casualty Insurers states:
While we saw several cases of government support provided to insurance companies during the global financial crisis of 2008/2009, Moody’s financial strength ratings do not systematically consider systemic support. Moody’s does not believe that future government support is assured to the industry.100
Furthermore, its guide to evaluating reinsurers (companies that insure insurance companies) states:
Moody’s does not ascribe a meaningful level of implicit support to reinsurance companies from their governments. Indeed, past history has shown that reinsurers – even large ones – have been allowed by local and national governments to fail without intervention.101
As Moody’s does not price implicit government support into insurance companies’ ratings, they will not benefit from lower interest rates when borrowing. Whilst many large financial institutions have their own credit departments to independently assess the risk of companies, rating agencies nonetheless remain very influential players. This is demonstrated by the fact that the market clearly responds, often dramatically so, to credit rating agencies downgrading companies and governments.
Hence we conclude that there is strong evidence that the TBTF subsidy is not enjoyed by any other sector of the economy.
In short, banks enjoy very generous TBTF subsidies, which may come indirectly at the expense of the UK taxpayer, and which no other industries appear to have access to. The size of the benefits extended to the banks compares unfavourably with the tax received in return. For example, a report by PricewaterhouseCoopers (PwC) calculates a total amount of taxes borne by banks for the year to April 2010 to be £15.4 billion. Moreover, the structure and size of UK banks means that they enjoy a higher level of subsidy than their counterparts in France and Germany. There is no compelling economic rationale that can justify such a subsidy.
Quid Pro Quo 42
4. Have banks fully paid for deposit and liquidity insurance?
The UK’s deposit guarantee scheme (Box 15), called the Financial Services Compensation Scheme (FSCS), is funded by an annual levy on all firms regulated by the FSA.
The levy that an institution is charged depends on the type of funds they are insuring, so there are separate rates for deposits, insurance, and other investments. The levy also takes into account the size of an institution. A crucial failing of the FSCS is that its levies do not take into account the riskiness of individual institutions. Thus, private and public incentives are not necessarily aligned.102
Box 15: What is deposit insurance?
As will be explained in section 5, the stability of a fractional reserve banking system is reliant on only a small fraction of depositors choosing to withdraw their money at any given time. If a large number of customers seek to withdraw their deposits at the same time, the bank will quickly run out of funds to pay out. Such a ‘run’ on a bank may result in the bank becoming insolvent.
As banks are highly interconnected with each other and the rest of the economy, there are legitimate concerns of contagion effects following a bank crisis. As a result, to prevent bank runs, depositors’ funds are generally guaranteed up to a given level. For example, in the UK, a depositor’s first £85 000 of deposits is protected. Deposit insurance also exists to protect the public from their lack of financial expertise. The idea here is that most depositors would not be able to ascertain and monitor the riskiness of a given bank, and thus are essentially going in blind.
Many critics argue that deposit insurance introduces moral hazard into the economy. This is because banks do not need to worry about depositors becoming concerned about the level of risk that a bank is taking on. Consequently, deposit insurance encourages banks to take on more risk than they would do in a truly free market. This is called moral hazard.
There are thus two opposing arguments to consider when policymakers are deciding upon the threshold below which people’s savings are guaranteed. On one hand, if savings are not wholly guaranteed, depositors may still believe that they are, or believe that the government would step in to guarantee any deposits not covered by the deposit insurance scheme. In such a situation, the insurance premium that banks pay to fund the deposit guarantee scheme will not adequately cover the cost of protecting people’s savings. The taxpayer will thus pick up the remainder of the bill in the event of a crisis. Alternatively, a low level of guarantee may increase the probability of a run on a bank. On the other hand, as more and more savings are explicitly guaranteed, this will exacerbate the moral hazard problem and, thus, increase the instability of the banking system.
Quid Pro Quo 43
Furthermore, questions have arisen as to whether or not the premiums currently paid are high enough to cover the full costs of the scheme. During the Northern Rock crisis, the level of deposits guaranteed was not high enough to prevent a run on the bank, so the government was forced to intervene and guarantee all Northern Rock deposits not covered by the FSCS.103 Throughout the financial crisis, the government loaned a total of £19.07 billion to the FSCS, and received £520 million as a fee for this extension of credit. It is expected that the government will ultimately recoup all the money lent; however it may take ‘many years’.104 The Icelandic banking crisis, during which the UK government was required to pay £3 billion to guarantee the deposits of British savers in failed Icelandic banks, because the Icelandic Deposit Guarantee Fund was not sufficiently capitalised,105 also illustrates how deposit guarantee schemes can fail.106
The financial crisis revealed the UK’s deposit guarantee scheme to be insufficiently capitalised by the industry, and, once again, taxpayers were required to step in. Consequently, we can see that there are very real weaknesses in the UK’s current fee system, and that such problems need to be addressed immediately; otherwise the financial services industry will continue to benefit from a subsidy that it does not fully pay for.
A further advantage enjoyed by banks is liquidity insurance, extended via the Bank of England in its role as the lender of last resort. This effective guarantee that emergency funds will always be supplied to banks that request them has been criticised by some for introducing moral hazard into the banking system. If you know that ultimately the central bank is required to lend you money if you need it, you are likely to behave less prudently. No other industries enjoy access to such a lender of last resort.
Quid Pro Quo 44
5. The right to create money
Banks are generally perceived to be intermediaries, i.e. institutions that facilitate the flow of capital from investors to borrowers. This function improves the efficiency of an economy, as, for example, those who wish to lend money do not have to spend time searching for borrowers, and do not need to assimilate the information necessary to make wise investment decisions.
In this model, banks profit from lending at a higher interest rate to that at which they borrow: the interest rate spread. However, this picture ignores the fact that banks are able to lend out money that they have not actually sourced and borrowed. This is a consequence of fractional reserve banking (Box 16), a system driven by the assumption that only a small percentage of depositors will request their money back at any one time. Whilst many people are aware of the latter, very few realise that fractional reserve banking has a critical implication: banks can and do create new money.
The money creation processMany economics textbooks explain fractional reserve banking through the ‘money multiplier’ model. In such a model, banks are constrained as to the amount of money they can create as loans by a compulsory reserve ratio. So for example, a 10 per cent compulsory reserve ratio would mean a bank with a £100 deposit would be able to lend out £90; which when placed with a second bank allows it to lend out a further £81, and so on, until eventually £1000 of new money is created from the £100 deposit. The model of banking implies that banks need depositors to start the money creation process. The reality, however, is that when a bank makes a loan, it does not require anyone else’s money to do so. Banks do not wait for deposits in order to make loans. As described in a previous nef report:
Box 16: What is fractional reserve banking?
Fractional reserve banking is a system whereby the value of all the deposits (a bank’s liabilities or what it owes to customers) in a bank exceeds the value of all the cash reserves actually held in that bank.
Fractional reserve banking emerged in the UK in the late eighteenth century when people took to entrusting London goldsmiths with their precious metals and coins. Coins and gold were given to a banker in exchange for a receipt that acknowledged that the bank held a given amount of assets on behalf of a certain person. In such times, if people wanted to enter into a transaction, they first had to pay a visit to the bank to withdraw the necessary funds. However, as time went on and banking became more developed and commonplace, these paper deposit receipts (the bank’s liabilities) began to be viewed themselves as a medium of exchange. Merchants began to accept bank receipts, and not just traditional coins, as payment for goods. As this practice became more established, bankers realised that only a fraction of their deposit receipts would be cashed in at any one time and so they started to give out more receipts than were actually backed by their holdings of coins. Thus, fractional reserve banking was born.

Quid Pro Quo 45
When a bank makes a ‘loan’ it simply types in to its account that the borrower owes it a sum of money – this is the bank’s asset. It also types into the customer’s account that he has a bank deposit of the same amount – this is the bank’s liability. No other customers’ deposits are altered in any way. The borrower then spends that loan somewhere else. The bank has thus created new purchasing power without removing purchasing power from anyone else. After the loan has been spent, it ends up in another (or even the same) bank as a deposit.107
Bank deposits are created by banks on the basis purely of their own confidence in the capacity of the borrower to repay the loan. As the Deputy Governor of the Bank England puts it:
Subject only but crucially to confidence in their soundness, banks extend credit by simply increasing the borrowing customer’s current account, which can be paid away to wherever the borrower wants by the bank ‘writing a cheque on itself’. That is, banks extend credit by creating money.108
In other words, banks create new money simply by typing numbers into a database.
Thus, not all pound sterling is created by the Royal Mint and the Bank of England. In fact, only a very small percentage of it is (approximately 3 per cent).109 This stems from the fact that the vast majority of sterling in the economy exists in an electronic format, rather than as banknotes or coins. The ratio of electronic bank money to physical money and central bank reserves has grown over time as technological developments have shifted the primary medium of exchange away from cash and cheques and towards electronic currency.110
Influencing bank’s money creation In the UK, there is currently no direct compulsory cash-reserve requirements placed on banks or building societies to restrict their lending, although the FSA is currently reviewing this.111 This means that the Bank of England cannot control bank money creation through adjusting the amount of central bank reserves that banks must hold, as is implied in the multiplier model. Instead, it influences demand for loans (and hence the creation of money) by exerting control over interest rates, as explained below. The main constraint on UK commercial banks and building societies is the need to hold enough reserves and cash to meet their everyday demand for payments in the intra-bank market.112
In the UK, the Central Bank claims to be able to influence the money supply indirectly with the main tool being adjustments to the rate of interest at which commercial banks borrow central bank reserves (the Bank rate). Although there is no compulsory reserve ratio, commercial banks still need central bank reserves in order to make intra-bank payments. If this Bank rate is raised, it is argued, it should discourage bank lending. Similarly, by conducting open market operations (e.g. selling government bonds, which decreases the reserves held by commercial banks in the Central Bank), a central bank could, in theory, discourage bank lending.
However, the effectiveness of this monetary transmission mechanism is mixed in the aftermath of banking crises. In the UK, for example, , the central bank’s programme of ‘quantitative easing’ during 2009-10 injected £200 billion of new reserves into the banking system and interest rates have been held at a record low for almost two years but banks’ lending remains subdued. A similar pattern occurred in Japan’s ‘lost decade’ (Box 17).
It should now be apparent that the amount of money in our economy is very strongly determined by banks’ lending decisions. If banks lend more, then the amount of money in the economy increases, which can lead to an economic boom. Conversely, if banks stop lending, then the rate at which new money enters the economy slows, and the economy may fall into a recession. Consequently, the popular misconception, that banks can be thought of as neutral financial intermediaries, should be dispelled.

Quid Pro Quo 46
The relationship between money and debtThere is a further consequence of the role that banks play in the money creation process. In order for the money supply in the UK economy to expand, the UK must become more indebted. This is a direct result of money being created during the lending process, and can easily be seen in Figure 7, which shows how debt owed by the public has increased along with the broad money supply. Furthermore, as money is created in the form of debt, which demands repayment with interest, it can be argued that the money supply,must continually increase if this interest is to be repaid. The nature of this relationship is a live debate in economics, and a full investigation is beyond the scope of this report. What is more relevant here is the extent to which the role of banks in the creation of the money supply confers particular privileges or profits on the industry.
Box 17: What was Japan’s ‘lost decade’?
In the late 1980s, credit was too cheaply available in Japan, and consequently a bubble formed as investors poured money into the stock market and into property, and companies swiftly became highly indebted. When the Japanese Treasury raised interest rates in 1989, the stock market crashed and many firms defaulted on their debts, which, in turn, led to a banking crisis. As with the current global financial crisis, this led to the credit markets seizing up, as banks refused to lend to one another.
By 1991, the Japanese Central Bank began to cut interest rates in a bid to support the faltering economy, and by 1995, interest rates had been cut to 0.5 per cent. However, even this failed to stimulate the economy, and interest rates remained at this level until 2001, when they were cut to near zero. The economy finally started to recover in 2003.
Throughout the 1990s, Japan consequently suffered a decade of high unemployment and stagnant economic growth, which has been called Japan’s lost decade. Despite Japan having enjoyed a modest return to growth over the past ten years, the legacy of the 1990s still lingers, as Japanese interest rates have remained below 1 per cent since 1995.
1969
1971
1973
1977
1979
1981
1983
1987
1989
1991
1993
1995
1997
1999
2007
2001
2003
2005
2009
Year
£ –
£500
£1,000
£1,500
£2,000
£2,500
£3,000
£ bi
llion
s
Debt Owed by the Publice (M4Lending)
Broad Money Suppy (M4)
Figure 7. UK Money Supply and Debt
Source: Bank of England Interactive Statistical Database, figures for M4 and M4 lending.113
Quid Pro Quo 47
Assessing the value of money creationFractional reserve banking was and remains a business model quite different from normal market-based activities.114 For most businesses there is a direct relationship between revenue and the provision of goods and services and hence costs, usually at a declining rate. And in true intermediary banking activity, for example the loaning of time deposits (savings which must be held for a fixed duration), profits are limited by the interest rate spread mentioned earlier.
But by lending at interest through fractional reserve banking, the revenue stream for the banking system in aggregate can rise exponentially with minimal additional costs. A bank can charge compound interest on its loan, whereby interest incurred is added to the principal loan and further interest charged on both the principal and the additional interest on an ongoing basis.115 For example, at a fixed interest rate of 7 per cent, the borrower of a £100,000 interest-only mortgage will have to pay back a total of £200,966 at the end of ten years.116 The bank has not paid any equivalent interest to any saver in order to create the loan – it has simply created a highly profitable stream of income backed by nothing more than the perceived ability of the borrower to repay the loan or the collateral owned by the borrower (in this case their home). The only limits are regulation, and the ability of the bank to maintain liquidity by accessing sufficient funds through the inter-bank markets to meet the request of depositors when they wish to withdraw money from their accounts.
When you or I or any normal enterprise lend out money, we suffer an ‘opportunity cost’ because we could have done something else with that money. The origins of interest lie in compensating this opportunity cost.117 But in the case of fractional reserve banking there is no loss of resource by the bank when it makes a loan – no money is being taken from anywhere else. To illustrate the difference between true lending and borrowing and fractional reserve banking, imagine that I lend you my car. While you are driving it, I no longer have access to it. Your use of the car is exactly matched by my loss of the use of the car. When a bank lends money to a customer, it does not take any money from anyone else’s account. The borrower now has a car, but the lender also still has their car. The bank has effectively produced a new car out of nothing.118
Box 18: Are there any alternatives to fractional reserve banking?
An alternative banking model, such as full reserve banking, would mean that the amount of credit in the economy would not be dependent on banks’ propensity to lend. Moreover, funds that the public want to be 100 per cent safe could be kept in banks for safe keeping (in exchange for a fee, obviously), and not lent out. Thus, it would render distortive subsidies, such as deposit insurance, obsolete. In full reserve banking, separate institutions would exist where the public could deposit funds that they are happy to be lent out. An individual could decide what level of risk they are happy to take on, and would be compensated with an appropriate level of interest. It would not be guaranteed that they would get all their money back.
In such a scenario, banks would be lending out money that has been deposited with them, which is what most people believe banks currently do. They would no longer be creating new money when lending; they would finally truly be intermediaries.
As banks would no longer control the amount of money in the UK economy, this privilege could then exclusively lie with the Bank of England. Instead of indirectly influencing the money supply by raising or lowering interest rates, the Bank of England could directly increase or decrease the money supply, by injecting or withdrawing funds from the economy. For example, by adding any new money created to the government’s public spending pot. The Bank of England could choose to exert more direct control over which parts of the economy these new funds are injected into. This contrasts starkly with the current system, whereby banks have directed new money into the types of lending that are most profitable from their perspective, such as mortgage lending. Banks are biased towards the latter because such lending is secured, i.e. the bank will take possession of the house if the borrower defaults on their loan repayments, and the Basel rules require them to set less capital against mortgages than business loans. Conversely loans to small businesses are both unsecured and more costly to make, resulting in an inbuilt bias away from productive lending towards speculative lending, and reinforcing bubbles in the housing market and other asset markets.

Quid Pro Quo 48
None of this is to say that the bank has not provided a valuable service to the borrower by extending credit, and so therefore some profit is justified by the increased liquidity risk that the bank runs as a result of the additional credit. The bank still needs to ensure it is managing its balance sheet prudently and that everyone has access to cash when they need it.
However, because of the inherent fragility of fractional reserve banking – caused by the fact that at any one time depositors might have a collective loss of faith in a bank’s solvency and all withdraw their deposits at the same time – governments have been forced to put in place a very special kind of insurance that considerably lowers the above liquidity risk. Deposit insurance – currently at £85 000 in the UK – encourages banks to take on more risk than they would do in a truly free market. Moreover, they are able to offer depositors a very low interest rate as depositors know that, regardless of how a bank invests its money, deposits are essentially risk-free. This dramatically lowers the cost of funding for banks. In addition, as we have seen from the recent financial crisis, banks do not currently pay the full cost of deposit insurance even though in the UK this scheme is supposedly funded entirely by the financial services industry. This issue was explored in more detail in Section 4 of this report.
Moreover, the fact that banks are allowed to create new money when lending, means that banks are profiting from the issuance of pound sterling, as they charge interest on any new money created. In other words, a very large majority of the proceeds from creating our national currency have gone to banks, rather than to the government, which could have used this new money to help fund public spending or reduce taxes. The surplus that arises on issuing new currency is usually referred to as seigniorage. In the case of the Bank of England this is simply calculated as the difference between the face value of notes and the cost of printing them. In the years 2000 and 2009, the amount accruing to the UK Treasury in this way amounted to nearly £18 billion.
But how much do the banks make from creating money? Calculating such a figure is an exercise fraught with conceptual difficulty, not least because we are trying to compare the existing system with a hypothetical alternative system. A rough calculation undertaken in 1999, estimated that seigniorage in the UK was worth £21 billion a year to the banking industry.119 Furthermore, it was calculated that the Treasury forfeited approximately £47 billion per year by essentially handing this privilege over to the private sector. Whilst the method to calculate these numbers was relatively simplistic and, thus, these figures should not be interpreted as precise estimates, they nonetheless provide an indication of the order of magnitude that we are dealing with here.
Commercial banks have unique properties in being able to create new money as credit with little opportunity cost and also know that it is effectively underwritten by the taxpayer. In this context the charging of high rates of interest and compounding interest can be seen as extraordinarily profitable tools.
The crucial point is that the extising system is not inevitable, but a matter of choice. The system for creating and managing the nation’s money supply have varied over time, and various alternatives to the current system have been proposed (Box 18).
Questioning fractional reserve bankingWe are not alone in our criticism of fractional-reserve banking. For example, Mervyn King, the Governor of the Bank of England, has said:
Eliminating fractional reserve banking explicitly recognises that the pretence that risk-free deposits can be supported by risky assets is alchemy. If there is a need for genuinely safe deposits the only way they can be provided, while ensuring costs and benefits are fully aligned, is to insist such deposits do not coexist with risky assets.120

Quid Pro Quo 49
Similarly, Martin Wolf, the Chief Economics Commentator at the Financial Times, has stated that:
The essence of the contemporary monetary system is creation of money, out of nothing, by private banks’ often foolish lending. Why is the privatisation of a public function right and proper, but action by the central bank, to meet pressing public need, a road to catastrophe?121
A more detailed discussion of the monetary system is beyond the scope of this report. However, those who would like further information on this important issue are encouraged to read a joint submission to the Independent Commission on Banking by nef (the new economics foundation), Positive Money and the Centre for Banking, Finance and Sustainable Development at the University of Southampton122, and the forthcoming nef publication Where does money come from? A guide to the UK monetary and banking system.123
The important message to take away from this discussion is that creating pound sterling is a lucrative business for banks, and that the financial benefits should arguably be enjoyed by society as a whole. As is articulated in a previous nef report on this subject:
In effect it has become a subsidy to the private banking sector – a nice little earner, but one that should always have been for public benefit rather than private gain.124
Moreover, this is a source of revenue that other UK industries will never have access to. Thus, once again we see that, as a result of its unique position at the centre of the contemporary monetary system, banking is a privileged business that differs fundamentally from other sectors of the economy.
Quid Pro Quo 50
6. Are banks under-taxed?
Why is the financial services sector excluded from VAT?The majority of, but not all, financial services are exempt from VAT (Box 19). For example, financial advice is subject to VAT, but lending, holding deposits, insurance services, and cross-currency transactions are not. This is not just true in the UK; in fact, the majority of EU and OECD countries also implement this policy. This is not surprising: VAT is an EU-driven law and there is a high degree of consistency in it across Europe. In fact, the UK adopted it in 1973 as a condition of joining the EU at that time.
A question then immediately springs to mind: Why is the financial services industry given the same VAT privileges, i.e. exemption, as the charity, health, and education sectors?
The government argues that the value-added by a financial firm cannot be confidently calculated. For example, if a bank extends a loan to a small business at a very high rate, does this mean that the bank is making an enormous profit (which would be subject to VAT), or does the high interest rate accurately reflect the risk that the bank has taking on in lending to this business? If it is the latter, then the interest rate spread would count as a cost associated with providing the lending service, and thus VAT would not be payable. How does one determine what percentage of the interest rate spread (between the interest rate the bank pays on deposits and the interest rate it lends out at) represents risk and what percentage represents pure profit? Similar arguments can be applied to trading bonds, stocks, foreign exchange and other financial products. What percentage of the difference between the fair value of an asset and the value at which it was sold represents the cost associated with the trader having to subsequently ‘hedge’ their trading book position in the market (i.e. the cost of putting on an offsetting trade if they do not want to keep the position open) and what percentage represents profit taking? Whilst traders are fully aware of the breakdown, it is very difficult for tax authorities to independently verify their claims.
The fact that this industry is exempt from VAT has interesting consequences with regard to what businesses and individuals pay for financial services. It can be argued that, because VAT is not added to the cost of financial services, individuals pay less than they would do otherwise and businesses pay more. This is because VAT-registered businesses are able to reclaim from the government the VAT they have suffered on their purchases of goods and services. So if banks charged VAT on all their services, including loans, their business customers would be able to reclaim this. Meanwhile, the banks themselves would be able to reclaim more VAT on their own purchases, and overall their costs would fall. They might pass some of these cost savings on to customers, but in the case of individuals the imposition of VAT at 20 per cent would far outweigh this.

Quid Pro Quo 51
Box 19: What is VAT?
VAT is a tax on the ‘value added’ at each stage in a sales supply chain, i.e. it is a tax on the price at which a given good or service is sold minus the VAT the registered trader has already paid on any necessary inputs. The intention is that the charge should only fall on the end consumer and on unregistered businesses. No VAT is charged on exports; however, it is charged on imports.
VAT is generally implemented as follows: a business will charge a customer VAT on the full sales price of a good or service, but then may only hand over a percentage of this to HM Revenue and Customs (HMRC), so that the business is compensated for having already paid VAT when it bought the goods or services necessary for production of its own good or service. For example, if a furniture company sold a table for £100 and VAT is 20 per cent, then it would charge its customer £120 for the table. However, if it had purchased the wood that the table was made out of from another firm for £12, then it would have already paid £2 of VAT when it bought the wood (as 20 per cent of £10 is £2, so the wood company would have charged the firm £10 + £2 = £12). Thus, the furniture company would only remit £20 - £2 = £18 to HMRC. If the taxes paid on supplies had been greater than the taxes collected on sales, the company could have claimed the difference back from the government.
Many economists believe that VAT is a regressive tax, as those in lower income brackets generally spend a much larger proportion of their income on consumable goods than those in higher income brackets. This is because the rich are more likely to save. As a consequence of this, many essential items are subject to a 0 per cent VAT. For example, in the UK, the following goods and services are examples of zero-rated items:
•Food – but not meals in restaurants or hot takeaways
•Books and newspapers
•Children’s clothes and shoes
•Public transport
Nevertheless, despite these concessions, many economists still argue that VAT remains regressive.
Some goods are exempt from VAT altogether. The difference between zero-rated and exempt goods is that with zero-rated goods a seller can claim VAT back from the government on any VAT they paid whilst buying supplies. This is not the case with exempt goods. Businesses supplying exempt services have to treat the VAT charged to them as a cost of doing business. However, they do get income tax or corporation tax relief on this expense. In the UK, the following goods and services are exempt from VAT:
•Financial services and insurance
•Providing credit
•Most education and training, but subject to certain conditions being met
•Fundraising events by charities, if certain conditions are met
•Membership subscriptions, if certain conditions are met
•Most medical services
•Funerals

Quid Pro Quo 52
So is it not a good thing that individuals are spared the cost of VAT on their financial services? Not necessarily. If we assume that the government has to raise a certain amount of tax revenue overall, the question then simply becomes a question of allocation – where will the tax burden fall? We discuss who would pay in some detail further on, but there are also economic distortions caused by the VAT exemption for financial services.
At least three distortions occur in the economy as a result of this VAT exemption. First, businesses would be incentivised to spend a smaller proportion of their income on financial services than on goods that are not exempt, as the VAT exemption will make the former more expensive relative to the latter. The exact opposite will be true for individuals. As a result, it can be argued that applying VAT to some goods and services but not to others disrupts the efficient allocation of resources in an economy. Whilst this might be justifiable as an explicit social policy in the case of food and children’s clothing, which are essential items rather than luxuries, the bias seems less defensible when one is dealing with financial services. Moreover, as VAT constitutes approximately 17 per cent of all tax revenues received by HM Treasury,125 these distortions are far from insignificant.
The second distortion actually disadvantages domestic UK banks over some overseas competitors. Because of the UK’s VAT arrangements on finance, businesses currently have an incentive to source their financial services from outside the UK, from banks in countries where the industry is not VAT exempt or where there is no VAT at all.126 This usually means that a tax haven is favoured.
Finally, the VAT exemption also encourages vertical integration , a process whereby banks are keen to source all their financial services inputs in-house to avoid having to pay VAT on their inputs (which they are unable to reclaim and so would have to pass on to their customers).127 This regulatory bias to large integrated banking groups reinforces the problems of concentration and barriers to entry examined earlier in Section 1.
So what would be the effect of subjecting the financial services industry to VAT? Would more VAT be claimed back from the government on input costs than brought into the Treasury on value added? Would the Treasury make or lose money if the financial services industry was no longer VAT exempt?
Many academic studies have probed such questions. For example, an investigation conducted in 2011 for the European Commission concluded that VAT on financial services would be worth €18 billion to the EU, and that: ‘Higher VAT on households more than offsets lower VAT on businesses.’128 Moreover, whilst the €18 billion estimate is for the entire EU, given the UK economy’s bias towards financial services, it is safe to assume that a substantial proportion of this sum would be raised in the UK. Thus, introducing VAT on the financial services industry could bring in a significant amount of new tax revenue for the Treasury. This conjecture is supported by last year’s Mirrlees Review, which estimated that such action in the UK would bring in approximately £10 billion per year.129 However, it is worth noting the significant discrepancy in these estimates; no one can be sure which is right.
How would VAT on financial services affect banks’ profits? VAT is designed to be paid by the consumer at the end of a supply chain. However, in reality, VAT, like any other tax on a corporation, will be paid by some mixture of its customers, employees, suppliers, and shareholders. Let’s take the worst case scenario, and assume that VAT would be passed on in full to banks’ customers. It is somewhat difficult to determine what the net effect of this would be on the demand for financial services; removing the VAT exemption would increase the demand from businesses, but decrease the demand from individuals. As most estimates conclude that VAT would rise overall, it would be rational to expect overall price levels to rise, and therefore for the demand for financial services in general, and credit in particular, to fall.
This would very likely lead to a net decline in financial transactions, which would thus eat into banks’ profit both in terms of profit margins and profit in absolute terms.

Quid Pro Quo 53
A comprehensive investigation into how VAT could practically be extended to include the financial services industry is beyond the scope of this study. A variety of propositions have been put forward; for example, a so-called cash-flow method has been proposed, whereby all cash inflows are classified as sales, and thus should be subject to VAT, whereas all cash outflows are classified as input costs, and thus banks should be able to claim back VAT on them.131 A large range of other options have been suggested, and are summarised in a comprehensive report from the International Tax Program at the University of Toronto.132 However, very few countries have actually adopted any of these measures as policy, and concerns about the practicality of such solutions linger.
But this is somewhat of a digression as, regardless of whether or not this problem can easily be rectified, the fact remains that the VAT exemption on financial services has introduced distortions into the UK economy, and that banks’ profits have very likely been inflated as a result. Furthermore, this suggests that other taxes, such as financial transactions taxes, should possibly be explored in case they can be used to help correct this under-taxation relative to other industries.
Have banks reimbursed the state for the support they received during the crisis?
How much support have taxpayers extended to the banks?The financial crisis resulted in an unprecedented level of UK government support for the banking sector. Various bail-out initiatives have been implemented, and taxpayers’ maximum potential losses via these schemes are detailed in Table 10.
For a description of these schemes, and information on how we arrived at the figures shown in Table 10, please see Appendix B. Please also note that we have not included quantitative easing (QE) in this table, as this was a monetary policy decision, rather than a bail-out of the financial sector per se. Of course, banks profited disproportionately from this policy; however, a full exploration of this is beyond the scope of this report.
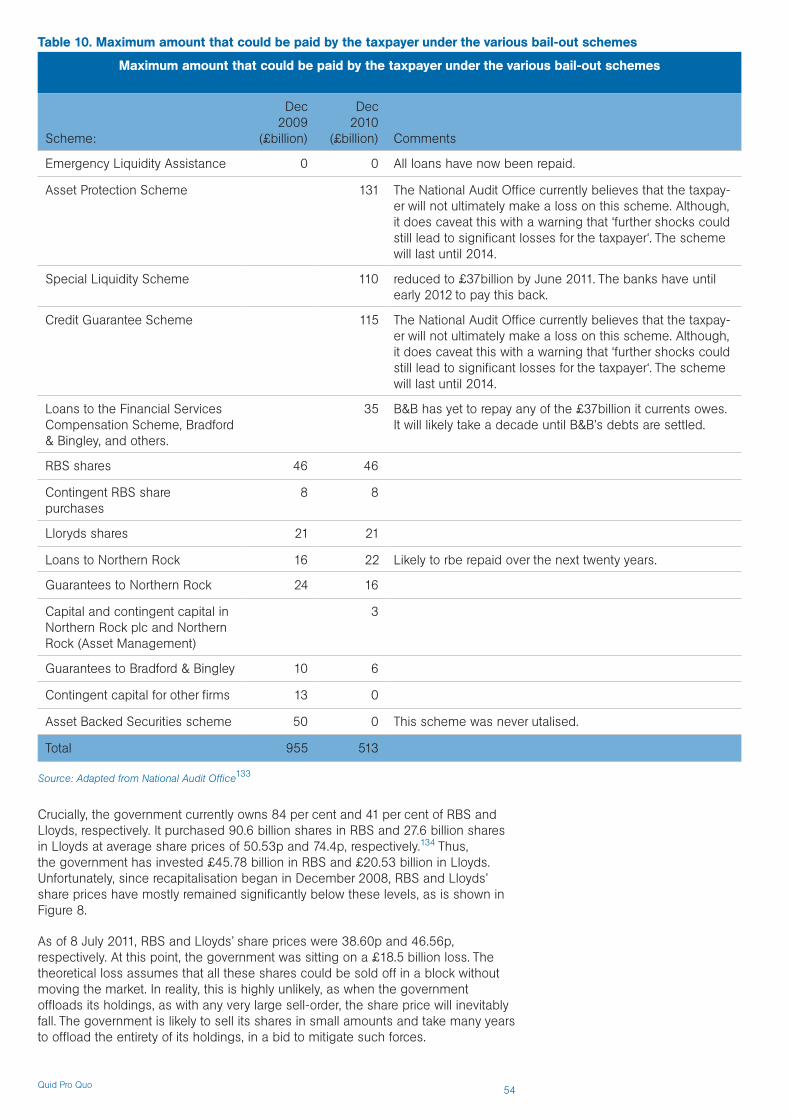
Quid Pro Quo 54
Crucially, the government currently owns 84 per cent and 41 per cent of RBS and Lloyds, respectively. It purchased 90.6 billion shares in RBS and 27.6 billion shares in Lloyds at average share prices of 50.53p and 74.4p, respectively.134 Thus, the government has invested £45.78 billion in RBS and £20.53 billion in Lloyds. Unfortunately, since recapitalisation began in December 2008, RBS and Lloyds’ share prices have mostly remained significantly below these levels, as is shown in Figure 8.
As of 8 July 2011, RBS and Lloyds’ share prices were 38.60p and 46.56p, respectively. At this point, the government was sitting on a £18.5 billion loss. The theoretical loss assumes that all these shares could be sold off in a block without moving the market. In reality, this is highly unlikely, as when the government offloads its holdings, as with any very large sell-order, the share price will inevitably fall. The government is likely to sell its shares in small amounts and take many years to offload the entirety of its holdings, in a bid to mitigate such forces.
Source: Adapted from National Audit Office133
Table 10. Maximum amount that could be paid by the taxpayer under the various bail-out schemes
Maximum amount that could be paid by the taxpayer under the various bail-out schemes
Scheme:
Dec2009
(£billion)
Dec2010
(£billion) Comments
Emergency Liquidity Assistance 0 0 All loans have now been repaid.
Asset Protection Scheme 131 The National Audit Office currently believes that the taxpay-er will not ultimately make a loss on this scheme. Although, it does caveat this with a warning that ‘further shocks could still lead to significant losses for the taxpayer‘. The scheme will last until 2014.
Special Liquidity Scheme 110 reduced to £37billion by June 2011. The banks have until early 2012 to pay this back.
Credit Guarantee Scheme 115 The National Audit Office currently believes that the taxpay-er will not ultimately make a loss on this scheme. Although, it does caveat this with a warning that ‘further shocks could still lead to significant losses for the taxpayer‘. The scheme will last until 2014.
Loans to the Financial Services Compensation Scheme, Bradford & Bingley, and others.
35 B&B has yet to repay any of the £37billion it currents owes. It will likely take a decade until B&B’s debts are settled.
RBS shares 46 46
Contingent RBS share purchases
8 8
Lloryds shares 21 21
Loans to Northern Rock 16 22 Likely to rbe repaid over the next twenty years.
Guarantees to Northern Rock 24 16
Capital and contingent capital in Northern Rock plc and Northern Rock (Asset Management)
3
Guarantees to Bradford & Bingley 10 6
Contingent capital for other firms 13 0
Asset Backed Securities scheme 50 0 This scheme was never utalised.
Total 955 513

Quid Pro Quo 55
Of course, the government also owns part of Northern Rock, in addition to Bradford & Bingley’s mortgages and loans book. The values of all these bank holdings are detailed in Table 11. For information on where the Northern Rock and Bradford & Bingley figures come from, please see Appendix B.
Purchase ofB shares
Conversion ofpreferenceshares
Initialrecapitalisation
Average share priceat which the UKgovernment bought shares
2008 2009 2010 2011Apr Apr Apr
20
30
40
50
60
70
80
90
Jul Jul JulOct Oct
RBS’ Share Price
Rights IssueConversion ofpreferenceshares
Initialrecapitalisation
Average share priceat which the UKgovernment bought shares
2008 2009 2010 2011Apr Apr Apr
40
60
80
100
120
140
160
180
200
220
Jul Jul JulOct Oct
Lloyds’ Share Price
Figure 8. Market prices of shares in Lloyds and RBS since recapitalisation
Source: Yahoo! Finance135, adapted from NAO (2010)
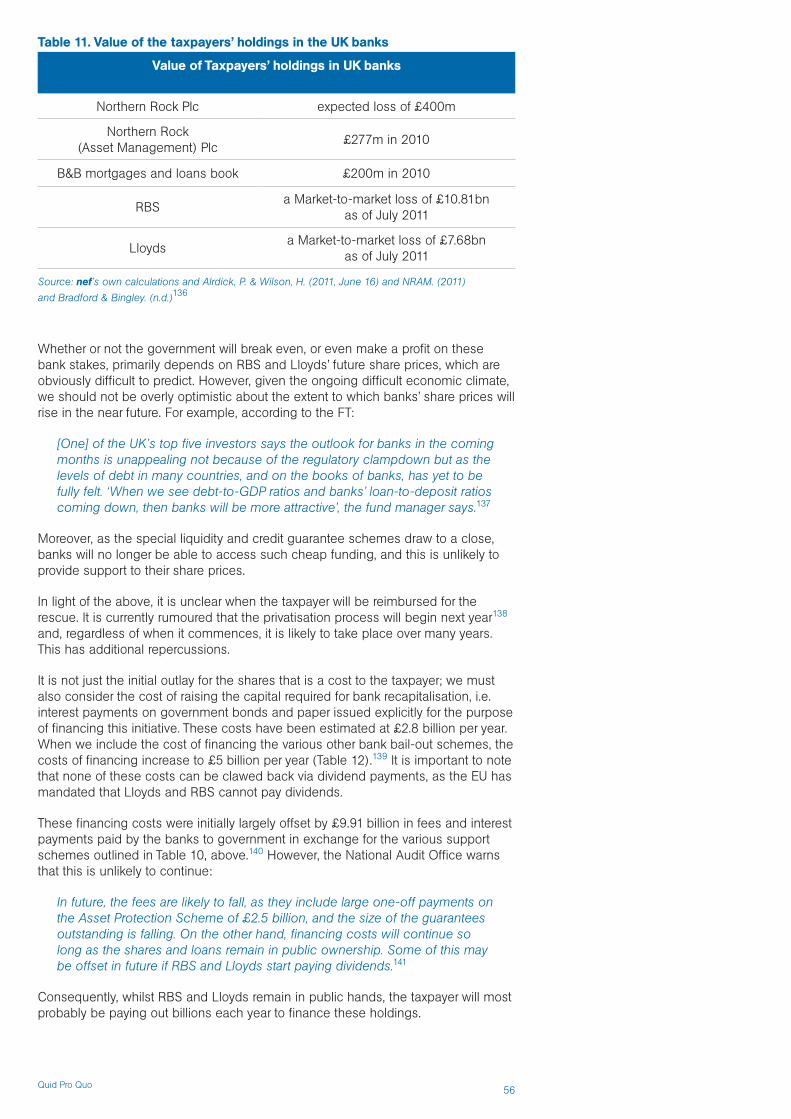
Quid Pro Quo 56
Whether or not the government will break even, or even make a profit on these bank stakes, primarily depends on RBS and Lloyds’ future share prices, which are obviously difficult to predict. However, given the ongoing difficult economic climate, we should not be overly optimistic about the extent to which banks’ share prices will rise in the near future. For example, according to the FT:
[One] of the UK’s top five investors says the outlook for banks in the coming months is unappealing not because of the regulatory clampdown but as the levels of debt in many countries, and on the books of banks, has yet to be fully felt. ‘When we see debt-to-GDP ratios and banks’ loan-to-deposit ratios coming down, then banks will be more attractive’, the fund manager says.137
Moreover, as the special liquidity and credit guarantee schemes draw to a close, banks will no longer be able to access such cheap funding, and this is unlikely to provide support to their share prices.
In light of the above, it is unclear when the taxpayer will be reimbursed for the rescue. It is currently rumoured that the privatisation process will begin next year138 and, regardless of when it commences, it is likely to take place over many years. This has additional repercussions.
It is not just the initial outlay for the shares that is a cost to the taxpayer; we must also consider the cost of raising the capital required for bank recapitalisation, i.e. interest payments on government bonds and paper issued explicitly for the purpose of financing this initiative. These costs have been estimated at £2.8 billion per year. When we include the cost of financing the various other bank bail-out schemes, the costs of financing increase to £5 billion per year (Table 12).139 It is important to note that none of these costs can be clawed back via dividend payments, as the EU has mandated that Lloyds and RBS cannot pay dividends.
These financing costs were initially largely offset by £9.91 billion in fees and interest payments paid by the banks to government in exchange for the various support schemes outlined in Table 10, above.140 However, the National Audit Office warns that this is unlikely to continue:
In future, the fees are likely to fall, as they include large one-off payments on the Asset Protection Scheme of £2.5 billion, and the size of the guarantees outstanding is falling. On the other hand, financing costs will continue so long as the shares and loans remain in public ownership. Some of this may be offset in future if RBS and Lloyds start paying dividends.141
Consequently, whilst RBS and Lloyds remain in public hands, the taxpayer will most probably be paying out billions each year to finance these holdings.
Source: nef’s own calculations and Alrdick, P. & Wilson, H. (2011, June 16) and NRAM. (2011)
and Bradford & Bingley. (n.d.)136
Table 11. Value of the taxpayers’ holdings in the UK banks
Value of Taxpayers’ holdings in UK banks
Northern Rock Plc expected loss of £400m
Northern Rock (Asset Management) Plc
£277m in 2010
B&B mortgages and loans book £200m in 2010
RBSa Market-to-market loss of £10.81bn
as of July 2011
Lloydsa Market-to-market loss of £7.68bn
as of July 2011
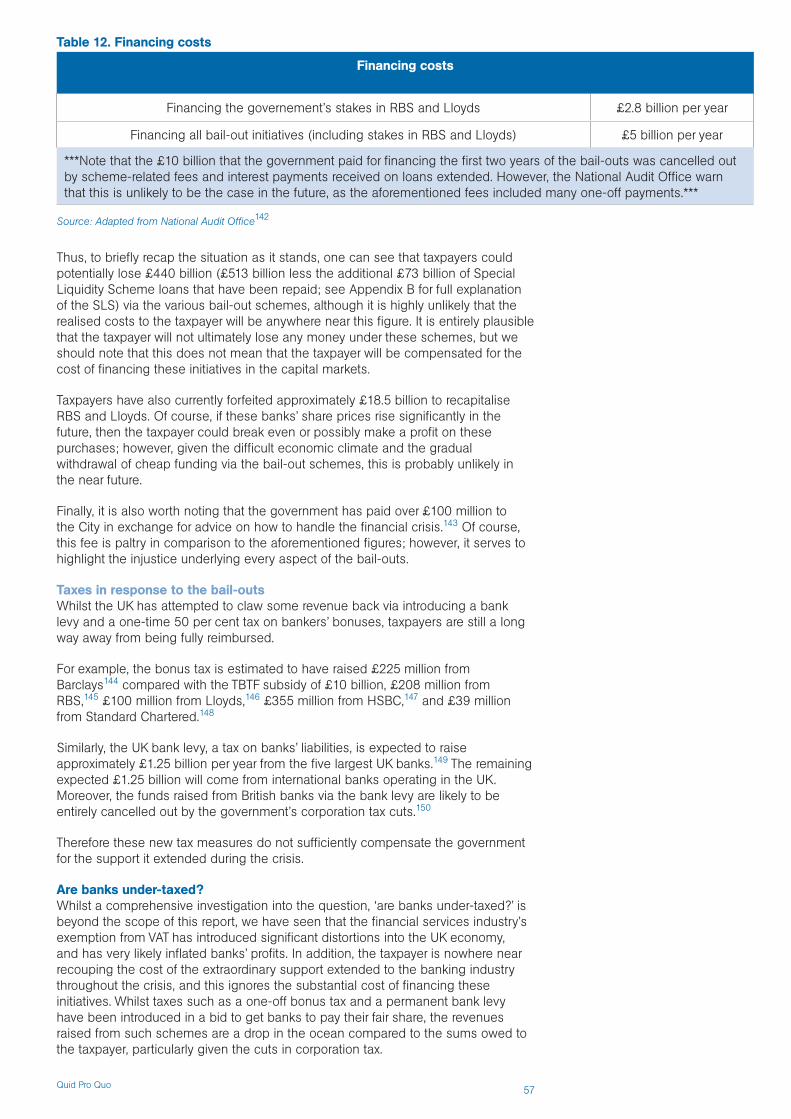
Quid Pro Quo 57
Thus, to briefly recap the situation as it stands, one can see that taxpayers could potentially lose £440 billion (£513 billion less the additional £73 billion of Special Liquidity Scheme loans that have been repaid; see Appendix B for full explanation of the SLS) via the various bail-out schemes, although it is highly unlikely that the realised costs to the taxpayer will be anywhere near this figure. It is entirely plausible that the taxpayer will not ultimately lose any money under these schemes, but we should note that this does not mean that the taxpayer will be compensated for the cost of financing these initiatives in the capital markets.
Taxpayers have also currently forfeited approximately £18.5 billion to recapitalise RBS and Lloyds. Of course, if these banks’ share prices rise significantly in the future, then the taxpayer could break even or possibly make a profit on these purchases; however, given the difficult economic climate and the gradual withdrawal of cheap funding via the bail-out schemes, this is probably unlikely in the near future.
Finally, it is also worth noting that the government has paid over £100 million to the City in exchange for advice on how to handle the financial crisis.143 Of course, this fee is paltry in comparison to the aforementioned figures; however, it serves to highlight the injustice underlying every aspect of the bail-outs.
Taxes in response to the bail-outsWhilst the UK has attempted to claw some revenue back via introducing a bank levy and a one-time 50 per cent tax on bankers’ bonuses, taxpayers are still a long way away from being fully reimbursed.
For example, the bonus tax is estimated to have raised £225 million from Barclays144 compared with the TBTF subsidy of £10 billion, £208 million from RBS,145 £100 million from Lloyds,146 £355 million from HSBC,147 and £39 million from Standard Chartered.148
Similarly, the UK bank levy, a tax on banks’ liabilities, is expected to raise approximately £1.25 billion per year from the five largest UK banks.149 The remaining expected £1.25 billion will come from international banks operating in the UK. Moreover, the funds raised from British banks via the bank levy are likely to be entirely cancelled out by the government’s corporation tax cuts.150
Therefore these new tax measures do not sufficiently compensate the government for the support it extended during the crisis.
Are banks under-taxed?Whilst a comprehensive investigation into the question, ‘are banks under-taxed?’ is beyond the scope of this report, we have seen that the financial services industry’s exemption from VAT has introduced significant distortions into the UK economy, and has very likely inflated banks’ profits. In addition, the taxpayer is nowhere near recouping the cost of the extraordinary support extended to the banking industry throughout the crisis, and this ignores the substantial cost of financing these initiatives. Whilst taxes such as a one-off bonus tax and a permanent bank levy have been introduced in a bid to get banks to pay their fair share, the revenues raised from such schemes are a drop in the ocean compared to the sums owed to the taxpayer, particularly given the cuts in corporation tax.
Source: Adapted from National Audit Office142
Table 12. Financing costs
Financing costs
Financing the governement’s stakes in RBS and Lloyds £2.8 billion per year
Financing all bail-out initiatives (including stakes in RBS and Lloyds) £5 billion per year
***Note that the £10 billion that the government paid for financing the first two years of the bail-outs was cancelled out by scheme-related fees and interest payments received on loans extended. However, the National Audit Office warn that this is unlikely to be the case in the future, as the aforementioned fees included many one-off payments.***

Quid Pro Quo 58
Furthermore, we have hitherto completely ignored the output that the UK lost as a result of the financial crisis, and whether or not the banks have made steps towards reimbursing the country for such losses. It is worth briefly noting the Governor of the Bank of England, Mervyn King’s, analysis of the situation:
The principle that the ‘polluter pays’ for the costs they impose on others is an old one, going back at least to Pigou in the 1920s… The loss of world output from the financial crisis is enormous, even though such a crisis might be considered a once in a generation, or even once in a century, event. It is not difficult to see that a crisis that reduces output by between 5% and 10% for a number of years, and occurs once every fifty years, amounts to an annual cost several multiples of the revenue that will be generated by the UK bank levy.151
This suggests that other taxes, such as financial transaction taxes, should potentially be explored in case they can be used to help correct both the under-taxation in relation to other industries, and to reflect the particularly high risk posed to the taxpayer and the economy by the financial sector. Alternatively, some argue that the financial services industry should not be allowed to offset losses against future tax liabilities, which they currently are entitled to do, at the very least until they have reimbursed the taxpayer for the support they received during the crisis.

Quid Pro Quo 59
7. Is the government taking action to rectify the problems raised in this report?
The government’s main banking reform initiative was to establish the ICB (otherwise known as the Vickers Commission), in June 2010, and give it the dual mandate of investigating how competition and stability in UK banking could be improved.
The Commission held a public consultation before it released its interim report in April 2011. Another public consultation was subsequently held, and the Commission is currently reviewing the responses prior to releasing its final report in September 2011.
CompetitionWhen it comes to practical recommendations, the Commission primarily focuses on market concentration, specifically on the upcoming divesture of Lloyds’ branches. The Commission’s analysis of competition is interesting because, while it details the HHIs of the markets for various banking products, it does not explain that the current levels are not the primary cause for concern. This is a puzzling omission, as anyone familiar with the concept of HHI must also surely be aware that by this measure the industry is not considered above the threshold for ‘high concentration’. However, this may partly explain why the Commission relies on selling off more branches of Lloyds as its chief competition recommendation.
The Commission also highlights the difficulties that consumers may face when trying to switch current accounts, and suggests improving the switching process ‘by mandating a set time period within which banks would guarantee that the switch would be completed’ , and pushing for portability of accounts.
While we support all attempts to decrease concentration in UK retail banking and improve the PCA switching process, the analysis presented earlier in this report indicates that these issues are far from being the most significant problems undermining competition in UK banking. In this light, it is disappointing that the Commission does not put forward practical solutions to address more pressing concerns.
The Commission touches on many of these issues. For example, barriers to entry, including the need for a branch network and a well-known name, are discussed. The interim report also comments on behavioural biases. For example, it notes that:
…few consumers actively monitor the relative competitiveness of their accounts.152
Low levels of switching on their own may not be a concern if it is the case that many consumers are able and willing to switch quickly when differences between firms’ products or prices occur. However, there appears to have been persistent price dispersion over the past decade for PCAs. This suggests that in this market, customers have tended not to switch to better deals that have existed.153

Quid Pro Quo 60
In addition, the report discusses information asymmetries. For example, it notes that:
…many consumers are not familiar with the key fees associated with their PCA, and that they have difficulty understanding and calculating these fees’.154
However, while the Commission acknowledges that ‘the question arises of whether pricing patterns should therefore be regulated’, having raised this question, it is subsequently not fully explored. Instead, references are made to the fact that prices for UK retail banking products and services do not seem to differ significantly from those in other countries. We would argue that this is skirting around the issue, particularly in light of the Commission’s later observation that:
There are also concerns in other countries about consumers not understanding price structures and overpaying for banking products.155
Moreover, it is disappointing that the commission highlights interest forgone rather than overdraft charges, which we believe to be a far bigger problem with regard to transparency, as the interest foregone on most current accounts is minimal (particularly in the prevailing low interest rate environment following the financial crash). This omission may be why the Commission does not emphasise resolving information asymmetries when making its primary recommendations.
In short, while the key problems are outlined, concrete recommendations to help resolve them are not actually put forward. Instead, we are presented with vague suggestions that these issues merit further consideration, such as:
The Commission received evidence that access to branches for cash handling was important for many small businesses, and that some smaller banks struggle to provide the infrastructure to serve this need…. it should be investigated further whether there are arrangements that could improve smaller banks’ ability to serve business customers, perhaps through improving the Post Office service or sharing cash-handling services with branches of larger banks.156
While this statement is true, the Commission charged with reforming UK banking should be going further than this.
Moreover, the Commission appears to pass the buck to the Financial Conduct Authority (FCA) on the more difficult issues. This is extremely disappointing, given that it is the ICB, not the FCA, that has been given a specific mandate to ‘consider structural and related non-structural reforms to the UK banking sector to promote financial stability and competition’. For example, the Commission argues that:
One issue that might merit investigation by the FCA, charged with a duty to promote competition, is price discrimination.157
The Commission is referring to the fact that banks make a profit from ‘free-if-in-credit’ current accounts, due to large overdraft charges, and it goes on to refer to the OFT’s ill-fated attempt to take legal action against the latter. Not only is the ICB apparently passing the buck on this important issue to the FCA, it also appears to actually condone such practices:
General hostility to price discrimination would not be a sensible policy approach. Many costs in banking service provision are joint and incapable of being allocated to individual services. Some forms of price discrimination are an efficient way to cover fixed costs and can even be pro-competitive, and there are obvious dangers of unduly detailed regulation.158
It is also important to note that, although the Commission was asked to investigate competition in UK banking generally, rather than only UK retail banking, the Commission has not put forward any recommendations to improve competition in UK investment banking. For example, when commenting on equity underwriting, the interim report notes many of the observations we too have drawn upon, such as:159
Quid Pro Quo 61
It is clear that there is a lack of price transparency in this market and that for some products and services prices are very high. The remuneration levels of employees involved in providing some of these services do not give confidence that competition is working well for customers.
…companies are generally not focussed on the cost of equity underwriting services and some may also lack regular experience of raising equity capital, making it difficult to hold investment banks to account on costs.
Competition between banks does not appear in all cases to focus strongly on price, with services being selected as much on the basis of establishing relationships, provider reputation and non-price (i.e. quality or capacity) elements.
However, the Commission then goes on to state that it will not probe these further as
…due to the global nature of some of these markets and the absence of strong representations from customers, the Commission’s current view is that there may be limited scope for action by the UK authorities at this time.160
Let us address each of these arguments separately. First, while there is undoubtedly a global market for equity underwriting, it is hard to believe that the UK government does not have any control over the underwriting process for companies that, for example, list on the LSE. The British government must surely be able to specify that, say, underwriters providing services to companies listed on the LSE must break down their fees into their individual components, rather than bundle all their charges together in one single opaque fee. Secondly, this report has highlighted the principal-agent problems that have led to firms not choosing their underwriter based on price. As managers are primarily concerned with rights issues being a success rather than finding a good, value-for-money service, it is not surprising that firms have not complained about banks overcharging for underwriting services. However, as it is primarily companies’ shareholders, many of whom may be UK pension funds, who ultimately lose out, the Commission still has a duty to address such problems.
Finally, it is crucial to highlight the fact that the Commission’s goal to improve competition in UK banking, is undermined by the recommendations it makes with regards to tackling the TBTF subsidy, i.e. the fact that the Commission does not appear resolved to truly tackle this subsidy (more on this in the subsequent section). This is despite the Commission admitting that TBTF subsidies undermine competition.
The too-big-to-fail subsidy (TBTF)In its interim report, the Commission explained that it believes that there are two separate ways to achieve a stable banking system. Firstly, it argues, one could introduce a Glass-Steagall split of retail and investment banking. Secondly, one could legislate to ensure that banks have a very high capital base, i.e. that a large amount of capital is held aside in case of unexpected losses. The Commission ultimately concludes that the best approach would be a mixture of these two measures.
For example, the commission advocates “ring-fencing” retail banking and investment banking subsidiaries within a universal bank, over outright separation of the two. Currently, there is no limit to capital being transferred between investment banking and retail banking activities in a universal bank (and vice versa). Ring-fencing would still allow such transfers, but only so long as the capital level in the retail banking subsidiary is not run down below a given threshold. In the Commission’s own words:
“It should aim to shift probabilities so that different parts of the bank can still save each other, but with less chance that they will sink each other.”
Quid Pro Quo 62
The Commission argues that ring-fencing will help facilitate the “resolution”, i.e. the orderly wind-down, of a large failed bank, as having retail and investment banking compartmentalised in different subsidiaries will make it easier to separate and sell-off the different parts of a universal bank in the event of the bank failing. This, in turn, it is argued, will reduce the chances of taxpayers’ support being necessary in order to wind down the institution, which should reduce the TBTF subsidy priced in by the market.
In addition, the Commission argues that all systemically important institutions and retail banks (and subsidiaries) should be subject to a 10 per cent capital requirement, instead of the 7 per cent specified in the recently agreed upon Basel III capital regulations. This 10 per cent is unfortunately far below the 19 per cent level that Switzerland has made mandatory. Moreover, the Commission will not push for investment banks to abide by the 10 per cent requirement, even though they believe it would be desirable, unless one sees international agreement on this. This is despite the fact that Mervyn King, the Governor of the Bank of England, has warned that the 7 per cent requirement is nowhere near what is required:
“Lauded as a new standard, Basel III is seen by some as the answer to the failure of regulation to prevent the financial crisis. It is certainly a step in the right direction, an improvement on both Basel I and the ill-fated Basel II, and we should all welcome it. But if it is a giant leap for the regulators of the world, it is only a small step for mankind… the new levels of capital are insufficient to prevent another crisis. Calibrating required capital by reference to the losses incurred during the recent crisis takes inadequate account of the benefits to banks of massive government intervention and the implicit guarantee… As the IMF have pointed out differences in capital ratios failed to predict which financial institutions would be vulnerable in the crisis. Only very much higher levels of capital – levels that would be seen by the industry as wildly excessive most of the time – would prevent such a crisis… the Basel approach calculates the amount of capital required by using a measure of “risk-weighted” assets. Those risk weights are computed from past experience. Yet the circumstances in which capital needs to be available to absorb potential losses are precisely those when earlier judgements about the risk of different assets and their correlation are shown to be wrong.”161
Interestingly, the Commission makes a similar observation:
“recent history suggests that risk weights have done a poor job of assessing how much capital should be held against assets. Certain assets that had very low risk-weightings suffered large unexpected losses.”
In order to determine the optimum level for capital adequacy requirements, which the Commission ultimately concludes to be 7 – 20 per cent of risk weighted assets, the ICB focuses on maximising GDP. This is despite the fact that the Commission admits that “welfare, as distinct from GDP, may be maximised at a different, probably higher, level of capital.” We have long argued that GDP is a poor measure of the wealth of a nation, and so, whilst it is pleasing to see the Commission touch on this issue, it is disappointing that the capital requirements that it ultimately recommends lie towards the bottom end of its GDP-focused range. Moreover, even the Commission acknowledges that “a 7 per cent ratio is likely to be too low” for a wide variety of reasons, including because:
“7% is generated using an extremely conservative estimate of the costs of a crisis (a present value cost of 19% of GDP). The figure for future crises could plausibly be five or more times larger.”

Quid Pro Quo 63
Moreover, many economists argue that having separate capital adequacy requirements for systemically and non-systemically important financial institutions may cause more harm than good. For example, Mervyn King has issued the following warning:
“identifying in advance a group of financial institutions whose failure would be intolerable, and so are ‘too important to fail’, is a hazardous undertaking. In itself it would simply increase the subsidy by making it explicit. And it is hard to see why institutions whose failure cannot be contemplated should be in the private sector in the first place.”162
Similarly, with ring-fencing there is a danger that the retail part of a bank may benefit from an increased TBTF subsidy, as this is the part of the bank that the government will have explicitly acknowledged as being indispensible to the UK economy.
The ICB places great importance on ensuring that London remains competitive, so that its status as a global financial centre is not jeopardised. This is one of the main reasons why the Commission does not put forward recommendations stronger than ring-fencing. However, this hesitance is interesting given that, in the Commission’s own words:
“improved financial stability should be good, not bad, for the competitiveness both of the financial and non-financial sectors. The costs and consequences (including for taxation) of financial crises make countries that suffer them less attractive places for international business to locate. More resilient banks are therefore central to maintaining London’s position as a leading global financial centre, not a threat to it... Reducing the probability of large bail-outs of UK banks should, all else being equal, reduce the potential tax burden on the rest of the financial sector and help maintain London’s position as a leading financial centre. Tax is the most obvious of these effects, but financial crises also lead to increased regulation and a public and political backlash which affects the City generally. Targeted reforms which reduce the probability and/or impact of future crises should therefore enhance City competitiveness.”
Moreover, the Commission acknowledges that ring-fencing alone may not eliminate too-big-to-fail subsidies and difficulties surrounding the resolution of large banks. For example, the Commission cite the “disorderly failure” of Lehman Brothers, which did not engage in retail banking at all, and note that even if the investment banking and retail banking parts of a universal bank are in separate subsidiaries, this does not necessary imply that resolution will be straightforward:
“a ring-fence can curtail government guarantees to the extent that the benefit of expected government support is lower for wholesale/investment banks – even if that benefit is not reduced to zero.”
The Commission goes on to argue that “other measures in progress or proposed alongside a retail ring-fence will address some of the other issues highlighted by Lehman Brothers… the move towards central clearing of derivatives, the development of ‘bail-in-able’ debt, and strength limits on interbank exposures are important in this regard. “ It is concerning that the Commission are relying on such initiatives to fully resolve the TBTF subsidy, given that there are widely acknowledged problems with many of the aforementioned schemes.

Quid Pro Quo 64
For example, financial analysts have expressed concern that breaching the conversion threshold for convertible or bail-in debt may acquire a stigma similar to that associated with tapping a central bank’s lender of last resort facilities. In other words, once a bank’s contingent capital has been triggered, would the bank then suffer from a lack of liquidity, as other banks might refuse to lend to a bank that is so obviously in dire straits? There is also extensive debate around how the appropriate trigger levels would be determined, and what investors’ incentives would be when the trigger point looks like it may soon be breached. For example, would shareholders dump their stakes before they get diluted as convertible debt is converted into equity, which might hasten the bank’s decline in a so-called “death-spiral”, despite the fact that this is exactly what convertible debt aims to prevent?
Others are worried that convertible debt may increase the probability of contagion, as if the trigger is breached for one bank, holders of convertible debt issued by other banks may then rush to dump their holdings.163 For this reason, the CEO of UBS has called convertible debt “a very dangerous instrument.”164 There is also the important question of who would buy convertible debt. Clearly bonds that could one day turn into equity are wholly inappropriate for many investors. Some are also suggesting that banks should not be able to buy convertible debt issued by other banks, if one is trying to decrease the volatility of banks’ assets. For example, Adair Turner, the chairman of the FSA, has argued that: “[convertible debt] will have to be owned not by banks or other liquidity transforming and leveraged institutions.”165 While there appears to be investor appetite for such debt, for example, there was high demand for the convertible debt issued by Credit Suisse earlier this year,166 this is not necessarily a good thing. Interestingly, the ICB also acknowledges some of these problems in an appendix of its interim report.
Centralised clearing of over-the-counter products through central counterparties (CCPs) is also controversial. Central counterparties would sit in the middle of every trade, thus becoming ‘the buyer to every seller and the seller to every buyer’. While this may lead to ‘netting’, i.e. opposite trades cancelling each other out, thus, reducing overall exposure, and may increase the amount of collateral being posted between counterparties, there is a very real risk that, for obvious reasons, CCPs may become the ultimate too-big-to-fail institutions.167 As CCPs are private firms that will be competing for business, moral hazard may lead to a ‘race-to-the-bottom’ in standards.168 There are also concerns that regulators may push CCPs to sit in between trades that they don’t fully understand how to price.169 As a result of all these factors, it is by no means guaranteed that CCPs will increase financial stability.
The Commission acknowledges that the size of a bank appears to be a very approximate determinant of the scale of the TBTF subsidy that it receives, as our own analysis confirms. However, the ICB rejects imposing size limits as a viable reform option, due to concerns around how the appropriate limit could be determined, how such a limit would reduce large banks’ appetites for competing for new business, and the legal challenges posed by retrospective legislation.
We do not find the first of these objections to be compelling, as surely even a rough guess at the appropriate size limit would be better than the current situation, where only very minor restrictions are put on the extent to which banks can expand their balance sheets (and we have all felt the consequences of this). With regards to the second argument that the ICB puts forward, while banks that had reached their maximum size limit would undoubtedly lack incentives to compete for new business, they could still seek improved profitability by focusing on products, services and sectors where they feel they have the best to offer. Alternatively, demerging businesses into separate constituent parts has long been a way of seeking to enhance shareholder value, and increase management focus on its customers. Why should this not be a valuable counterweight to the ‘urge to merge’ that has led to the relentless consolidation of the banking industry over many decades. Finally, the third argument that the Commission puts forward is definitely the most convincing. However, are not the same legal challenges posed by ring-fences being imposed retrospectively, which is what the Commission itself recommends?

Quid Pro Quo 65
However, most concerning of all is the ICB’s final words on the topic:
“The Commission considers that the financial stability motivations for introducing limits on bank size or market share are adequately satisfied by other measures proposed in this interim report.”
In other words, the Commission is relying on ring-fencing and controversial reforms, such as convertible debt and central counterparties, to indirectly bring about the same effect as size limits directly might. We would urge the ICB to reconsider size limits instead of going round the houses.
The Commission acknowledges that ring-fencing alone will not bring about the desired results. Instead, the Commission argues that ring-fencing is just one component of a package of measures, including contingent/bail in capital, clearing through central counterparties (CCPs) and resolution mechanisms that together will help ensure that taxpayers will never have to bailout the banks again. We find the Commission’s reliance on such measures to be concerning given that many of these proposals are controversial in their own right, and may introduce fresh problems into the financial system.
It is one thing for taxpayers to be subsidising retail banks via TBTF subsidies and deposit insurance, it is quite another for taxpayers to be subsidising investment banking, which cannot be thought of as a public utility as retail banking could be argued to be. As ring-fencing will still permit transfers between retail and investment banking up to a point, the taxpayer will thus still be to a certain extent underwriting investment banking activities.
In short, the Commission still is nowhere near truly resolving the TBTF problem, and needs to urgently address the shortcomings of the proposals that it put forward in its interim report if it is serious about improving stability in UK banking and addressing the unfair advantage enjoyed by bankers of having their highly remunerative activities underwritten by the state.
Will the Commission address the problems surrounding deposit insurance?The Commission acknowledges that there are problems with deposit insurance. It also discusses a prospective solution: ranking depositors above other senior unsecured creditors. The current situation, where depositors and other senior unsecured creditors are ranked equally, means that during the wind-down of a failed bank, senior unsecured creditors cannot be forced to accept losses, without also forcing these losses on depositors. This situation is not fair, as senior unsecured creditors are capable of independently assessing the creditworthiness of a range of banks, whereas most retail depositors are not. Retail depositors, therefore, should be granted a higher level of protection. Thus, in addition to being unfair, the status quo also increases the burden on the taxpayer, as the government’s reluctance to impose losses on depositors will mean that senior unsecured creditors will also be granted a reprieve.
The Commission concludes that:
Depositor preference would subordinate the claims of other senior unsecured creditors to those of depositors, better aligning the incentive to discipline banks with the ability to do so. It would also create a bigger buffer that would absorb losses prior to depositors, making banks easier to resolve, in particular where there is a political imperative to avoid losses for retail depositors.170
This is all very true, and our analysis of the information symmetries and principal-agent problems that beset banking provides support for the Commission’s call for depositor preference. The Commission also adds:
There may be a case for extending preference to a wider range of deposits than those that are FSCS-insured.171

Quid Pro Quo 66
This is a crucial reform and it is disappointing that the Commission appears reluctant to fully endorse it. The run on Northern Rock demonstrated that insuring deposits only up to a given level is not sufficient if bank runs are to be prevented. If the government and the FSCS do not recognise this, then banks will continue to receive a subsidy via what is effectively government subsidised deposit insurance.
The Commission does not discuss the fees currently imposed by the FSCS or give any recommendations in this regard. This is disappointing, as the current fee structure, which does not take the riskiness of an institution into account, means that public and private incentives may not be fully aligned – it introduces moral hazard.
However, we should note that it is unlikely that moral hazard can ever be truly eliminated from deposit insurance. Regulators have proven time and time again, the latest financial crisis being just one example, that they struggle to accurately determine the riskiness of an institution. Riskiness always appears to be underestimated, and so deposit insurance is likely to always be at least partially subsidised, either by the government or by other financial institutions.
The only way to completely remove such a subsidy would be to abolish deposit insurance, which would likely necessitate a move to a different financial system, for example, full reserve banking instead of fractional reserve banking.
Will the Commission tackle the banks’ right to create money?The Commission’s interim report does not acknowledge the significance of the money creation process. Neither the unique source of profits this bequeaths to banks, nor the impact of fractional reserve banking on financial stability, are given due attention. Given the Commission’s mandate to make recommendations to promote financial stability, the latter is a particularly noticeable omission. As nef has articulated in a joint submission to the Commission in response to its Interim Report:
It is unlikely that we could ever achieve economic or financial stability when we have delegated control of the money supply to people who are unaware of the impact of their actions, have asymmetric incentives and no mechanism to receive and act upon feedback from the wider economy.172
It is also concerning to note that the Commission does not appear to describe the money creation process accurately. For example, the Commission makes the following observation in its interim report:
…banks do not take deposits simply to provide safety for the savings of the public. They use funds that are deposited with them to provide loans to businesses to allow them to undertake productive economic activities, and also to consumers…173

Quid Pro Quo 67
First, banks do not have to wait for deposits before they lend. Instead, they are able to create new deposits through providing credit. Secondly, the Commission is ignoring the fact that banks are not incentivised to lend according to which projects would be productive, but rather lend so as to maximise their own profits. The latter has, so far, not been conducive to the former, as Adair Turner, the Chairman of the FSA, has acknowledged:
In many debates about credit extension, and about the impact of new prudential regulations which may restrict it, it is assumed that credit contracts primarily perform the function of linking savers with businesses investing in productive assets... But it is also important to understand that only a minority of credit extension in the UK and other rich developed economies now performs this economic function. Whereas in 1964 a mental model in which the UK banks took household deposits and lent them on to business captured much of the reality, over the last 40 years, loans to the household sector and in particular residential mortgages have become dominant.174
The Commission goes on to argue that:
Like narrow banking, a complete move from fractional to full reserve banking would drastically curtail the lending capacity of the UK banking system, reducing the amount of credit available to households and businesses and destroying intermediation synergies.175
However, the Commission does not provide any evidence to back up this claim and we disagree with its analysis. A move away from fractional reserve banking would hand control of the money supply over to the Bank of England, which would be able to ensure that the flow of new money into the economy was appropriate for economic conditions. Leaving this to be determined by the aggregate effect of banks’ individual lending decisions has not been a success; the poor lending decisions taken by banks over the past decade resulted in a credit crunch that has dramatically curtailed the amount of credit available in the economy.
The Commission also maintains that there is no need for 100 per cent safe deposit accounts, as options such as safety deposit boxes already exists. However, this misses the key point, which has been articulated many times by Mervyn King. Current accounts are the main means of accessing our country’s payment systems, and attempting to combine 100 per cent safe deposits with lending is alchemy. Safety deposit boxes do not provide access to the payment systems, and cannot be considered a viable alternative to guaranteed deposits.
In addition, the ICB states that instead of attempting to eliminate deposit insurance and the moral hazard and distortions it introduces, we should instead keep it and this renders full reserve banking redundant. However, as articulated in nef’s recent joint submission to the Commission:
The point is rather that full-reserve banking makes deposit insurance unnecessary, rather than the other way round. The advantage of full-reserve banking is that deposit insurance and all state-support for the UK banking sector, can be withdrawn. It is difficult to see why the Commission believes that the banking sector should benefit from taxpayer support that no other industry receives.176
In short, the Commission is generally dismissive of criticisms of fractional reserve banking, and has, so far, displayed no appetite for tackling the banks’ right to create money. In the wake of the worst financial crises since the Great Depression, it is disappointing to not even investigate this issue with any degree of rigour.

Quid Pro Quo 68
Will the Commission address taxation of the banking sector?Taxation is not in the Commission’s mandate and so we would not expect it to comment on this subject. (Indeed, in its interim report, taxation is not discussed.)
Unfortunately, since the introduction of the bank levy, the government has appeared to have shelved any further discussion of bank taxes. The UK government has explicitly rejected exploring financial transaction taxes. Furthermore, although the government has expressed support for a financial activities tax, i.e. a tax on banks’ profits and remuneration, after the IMF recommended such an initiative, the government will not implement it unilaterally. It does not appear to be making any effort to promote the tax internationally, despite George Osborne’s claims that he would ‘work with international partners to secure agreement’ on implementing a financial activities tax’.
In short, all signs point towards the UK banking sector remaining under-taxed.
Quid Pro Quo 69
8. Conclusions
We like to think of banking as something quite straightforward. Banks provide convenient ways to look after our cash and to make payments when we need to. We earn interest on our surplus savings, and banks provide credit to carefully chosen businesses and individuals. Their investment banking arms advise and raise money for large companies. All these are essential functions in the economy.
As customers we should be able to vote with our wallets if we are not happy with the service we are getting, and so like any other industry such as making cars or selling clothes, as long as banks have to compete for our custom, the market should work well to balance a fair financial return for the banks with a good deal for customers.
All this is true to an extent, but it captures only part of the reality. Look deeper and we discover that the banking industry enjoys a serious of unusual privileges that set it apart from all others.
It is difficult to make direct comparisons of profitability between banking and other industries because banking is such a fundamentally different activity from extractive, manufacturing, or retail. However, the premium in banking earnings suggest excess profitability, and particularly in bonus payments, over other sectors of the economy. Academic research into the US financial industry concluded that up to half of the earnings premium was due to excess profits rather than superior value added.
We can identify that banking is a lucrative business, and that it became particularly lucrative during the period of financial liberalisation over the four decades up to the financial crises of 2007/2008. At the same time, their earnings became more volatile, and this increased the overall risk within the financial system. Banking poses a disproportionate risk and cost to the state during financial crises, and the UK economy is more exposed that any other major economy. The riskiest banks also tend to make the most extensive use of political lobbying.
Furthermore, we can identify several factors that mean that, compared with other industries, banking has unfair advantages that allow it to make more profits in good economic times and that protect it from its own follies during the bad.
In this report we have examined these key aspects of banking, and found that:
• Although important, free market competition is not sufficient to serve customer interests and prevent excessive profits.
• Banks enjoy a unique form of subsidy from the state, when they become too big to fail, worth £45.8 billion in 2010.
• Deposit insurance provided by the state is also effectively subsidised by the taxpayer, and was given state bail-out of £19 billion.
Quid Pro Quo 70
• Further advantages, in the order of tens of millions, accrue from the banks’ privileged role in creating the money supply.
• Banks are under-taxed and oversized as an sector of the economy as a result of exemption from VAT.
• They are also under-taxed in relation to the direct cost of banking bail-outs and the ongoing £5 billion cost a year of simply financing this state support. If we include the wider economic costs of lost output and jobs resulting from the credit crunch, the financial deficit to society becomes even greater.
The nature of banking is unique. This has profound consequences for how we ensure that the banking industry serves the public interest – how we ensure that we are getting a fair deal from our banking sector.
A fair deal for taxpayers?It is argued by the banking industry that it already provides a very significant tax contribution to the UK government. Indeed, this is used as an argument against attempting any regulatory reform lest we kill the goose that lays the golden egg. Such arguments largely miss the point. Of course, an industry that makes large profits and pays high wages would be expected to pay large amounts of corporation and payroll taxes. But such taxes are levied on all industries. The findings of this report lend support for a distinctive taxation regime for a very distinctive industry. Furthermore, the various subsidies and costs to the taxpayer of the banking sector in good times as well as bad seriously call into question whether the tax paid by banks is even sufficient to outweigh them.
There are many different figures that have been stated for banks’ taxes. Let us take as a credible example a study commissioned by the City of London177 (and therefore unlikely to err on the side of underplaying the contribution of financial services), and carried out by PwC, one of the world’s largest accountancy firms. This report calculates a total amount of taxes borne by the financial services sector for the year to April 2010 to be £22.9 billion of which 67.1 per cent, or £15.4 billion, is from banks and the rest from insurance and other financial service companies. This includes corporation tax, employment taxes, irrecoverable VAT, and other taxes borne by the companies.
This is a substantial figure, but does not compare favourably with the unique taxpayer costs examined in this report, in particular the TBTF subsidy and the cost of the banking bail-out. The banking levy, which is an additional tax on banks, is a welcome endorsement by the government of the case for additional taxation of the banking sector. However, the £2.5 billion expected from this tax does not go far enough, and the £1.2 billion proportion raised from UK-based banks is likely to be offset by planned cuts in corporation tax in any case.
As we set out in the preceding section, the main process of banking reform, the Vickers Commission, has not yet succeeded in addressing these issues, not least because of its limited terms of reference excluding examination of new options for taxation.
A fair deal for taxpayers remains out of reach until serious consideration is given to imposing further additional taxes on the banking sector.
A fair deal for customers?Defining whether any company or industry is making excessive profits, ultimately at the expense of its customers, is no easy calculation. However, we can make use of the conceptual framework of perfect competition to assess whether it is likely that customers are getting a fair deal.

Quid Pro Quo 71
We conclude that the concentration of the industry into a small number of dominant firms is certainly an important issue. However, there are other problems that are arguably more significant, namely;
• high barriers to entry protecting incumbent firms from competition;
• asymmetry of information between banks and their customers;
• the improbability of rational behaviour by consumers in choosing financial products; and
• principal-agent problems.
Many of these factors are not unique to banking, and the elegant and tidy theories of Neoclassical economics never quite hold true in the untidy and inelegant real world. However, it is of fundamental importance to assess for any given market the extent to which competition can be relied on to impose market discipline on suppliers and ensure a fair financial return in return for good customer service.
This report raises serious doubts that we can rely on competition alone to do this, because of the fundamental nature of banking services. Consequently, the primary focus of the Vickers Commission on increasing the number of large banks within the industry by forcing Lloyds to sell additional branches does not begin to effectively address the question of delivering a fair deal for customers.
A fresh start?Banking is indispensible to our economy. It is totally unlike other industries because it acts as the operating system for the whole economy – when it crashes, it affects everything.
Consequently, the stability and conduct of banks are a matter of public interest far beyond that of other companies.
As this report demonstrates, private interest and competition alone cannot be relied on to serve customers well at reasonable cost, or to support economic prosperity and social progress. Despite this, banks have been given an inappropriate level of freedom, and have been allowed to profit at the expense of taxpayers and customers alike. It is time to bring an end to the bankers’ private welfare state.
A unique industry requires unique regulation, and a taxation regime that is tailored to fit.

Quid Pro Quo 72
Appendix A
It is important to acknowledge the limitations of Haldane’s method for estimating TBTF subsidies.
The main approximation made is to assume that all of a bank’s liabilities affected by the bank’s credit rating are funded at the interest rates indicated by Merrill Lynch’s bond indices. In reality, this is unlikely to be the case. For example, the indices use bonds with maturities of approximately 7–10 years, when the actual maturities of many liabilities are likely to be shorter.178 The effect of using shorter maturity credit is to reduce the amount of TBTF subsidies.
On the other hand, Haldane’s method does not take into account the cheap, taxpayer subsidised deposit insurance that banks enjoy. So, in this regard, we will have underestimated the size of the subsidy to the banks.
Finally, we should also note that Haldane’s method relies heavily on credit rating agencies, whose judgements have frequently been called into question. For example, S&P gave Lehman Brothers an ‘A’ rating immediately prior to the bank collapsing. Furthermore, prior to 2007, Moody’s asserted that banks’ financial strength ratings were the same as their senior unsecured ratings. This observation reflects poorly on Moody’s, for not having picked up on the inherent instability in the banks’ business models prior to the financial crisis.

Quid Pro Quo 73
Appendix B
Let us briefly remind ourselves of the extensive support that British banks received from the UK government during the recent financial crisis.
Northern RockGovernment intervention began in September 2007, when Northern Rock was forced to turn to the Bank of England for an emergency loan. As this news became public knowledge, account holders began to fear that they might lose their savings. This panic rapidly spiralled into the first run on a British bank in over 140 years, and depositors withdrew around £1 billion in just one day.179 This prompted the then Chancellor of the Exchequer, Alistair Darling, to fully underwrite all the bank’s deposits. By February the following year, Northern Rock owed approximately £25 billion to the Bank of England.
The UK’s deposit guarantee scheme – the Financial Services Compensation Scheme – which is in theory fully funded by the financial services industry, did not have sufficient capital to cover this guarantee, so the UK government extended a loan to it. The deposit guarantee scheme was further expanded throughout the financial crisis, and in total the government lent the FSCS £19.07 billion, and charged it £520 million in fees.180 The National Audit Office believes that the government will ultimately recoup this money, but that this may take ‘many years’.
In February 2008, the Northern Rock was nationalised. Thus, the bank’s £25 billion debt to the Bank of England, its £55 billion mortgage book and £30 billion worth of deposit and liabilities guarantees extended by the government were all added to the public debt. Northern Rock’s shares were deemed worthless, and, thus, the government was not required to compensate exiting shareholders.
In January 2010, the bank was split into two parts: Northern Rock Plc, which continued to operate as a retail bank, and held ‘good’ mortgages, and Northern Rock (Asset Management) Plc, which held all ‘bad’ mortgage assets. To fund this split, the government injected £1.4 billion of capital into Northern Rock Plc, and promised £1.6 billion to Northern Rock (Asset Management) Plc that it could call upon in needed.181
In February 2010, the bank was considered stable enough for the government’s 100 per cent deposit guarantee to be withdrawn, but guarantees are still currently worth £16 billion.182 However, as of the 2010 year end, Northern Rock still owed £21.7 billion to the government, having only paid down £1.1 billion in 2010. Thus, if loan repayments continue at this rate, it could take the better part of the next two decades for this debt to be fully repaid. Northern Rock is planning to sell off parts of its mortgage portfolio in a bid to accelerate repayment; however, in January 2010, Gary Hoffman, the then CEO of Northern Rock Asset Management, warned that it could take as long as 20 years before the treasury if fully reimbursed.183
As of December 2010, the government had received £610 million in fees for the loans and guarantees extended to Northern Rock Plc and Northern Rock (Asset Management) Plc.184

Quid Pro Quo 74
In June 2011, it was announced that the Treasury planned to sell Northern Rock Plc to a private buyer for approximately £1 billion.185 Furthermore, it was estimated that this deal would most likely be complete by the end of the year. However, as the government had injected £1.4 billion of equity into the bank, any such sale may actually represent a loss for the taxpayer.
However, the £44 billion mortgage book held in Northern Rock (Asset Management) Plc, which the government is retaining ownership of, actually generated a £277.4 million profit (before tax) for the UK government in 2010.186 Moreover, as 87 per cent of borrowers are up-to-date with their mortgage payments, some argue that there is every reason to believe that these assets could continue to bring in revenue for the government in the years ahead. However, the following passage taken from the NRAM 2010 annual report paints a somewhat less rosy picture:
The current low level of the Bank of England base rate means that loan repayments remain affordable for many... The level of loan impairments remains largely driven by the performance of the economy and, in particular, the rates of unemployment and households’ disposable incomes. We expect that dealing with arrears and poor performing loans will remain a significant focus of our activities during the coming year given the uncertain economic outlook... The impact of higher taxation and increases in unemployment combined with the prospect of higher interest rates and higher inflation, is likely to mean that more customers will fall into arrears during 2011.187
Thus, given the continued turbulence in the global financial system and sweeping UK public spending cuts, it is debatable whether or not this portfolio will continue to turn a profit. The head of UK Asset Resolution (UKAR), the government entity that owns Northern Rock (Asset Management) Plc and Bradford & Bingley Plc, recently reiterated the risk of a ‘tsunami’ of repossessions once we see a tightening in monetary policy.188
In short, it appears that Northern Rock’s debt to the UK taxpayer will be slowly repaid over the next 20 years. Whilst profits from Northern Rock (Asset Management) may shorten this schedule, these remain highly dependent on the economic environment, and thus are by no means guaranteed.
Bradford & BingleyOn 19 September 2008, B&B’s mortgages and loans book was placed under government control, and a deal was struck to sell off its 200 branches and £20 billion deposits to Santander. The latter brought in approximately £400 million for the UK government.189 Once again, the government did not have to pay off existing shareholders; however, it did have to extend an £18.4 billion loan to B&B to stabilise the bank.190
As of 31 December 2010, B&B had yet to repay even part of this loan. Furthermore, as a result of subsequent borrowing, the total amount outstanding to the UK government is actually approximately £27 billion.191 Executives at UK Asset Resolution (UKAR), the government entity that owns Northern Rock (Asset Management) Plc and Bradford & Bingley Plc, estimate that it will take approximately ten years for B&B to repay this sum.192
As of December 2010, Bradford & Bingley had paid £610 million in fees to the government for the various loans and guarantees it had been extended.193
As with Northern Rock, the B&B mortgages and loans book is currently generating a profit for the government. For example, profits before tax in 2010 were £200.1 million.194 Whilst 91 per cent of the people who have borrowed from B&B were up-to-date with repayments, as of the end of 2010, the default rate may rise if the economic climate deteriorates, or when interest rates rise. Thus, the ultimate profit or loss the government should expect to receive from the portfolio is difficult to determine.
Quid Pro Quo 75
Emergency Liquidity Assistance (ELA)In accordance with its office as Lender of Last Resort, in October 2008 the Bank of England was forced to extend loans worth £62 billion to HBOS (which is now part of Lloyds) and RBS, and allowed mortgage-based securities to be posted as collateral.195 HBOS and RBS borrowed £25.2 billion and £36.6 billion, respectively.
However, within four months, all funds had been repaid.196 Furthermore, the banks were charged £18 million as a penalty for accessing these loans.197
Special Liquidity Scheme (SLS)In April 2009, in a bid to unfreeze the money markets, i.e. encourage interbank short-term lending, the Bank of England launched a Special Liquidity Scheme (SLS). The SLS allowed UK banks, for a fee, to borrow short-term UK government bonds from the Bank of England in exchange for posting mortgage-backed securities as collateral, i.e. it gave banks the opportunity to exchange, for up to three years, illiquid ‘toxic’ assets for liquid ones. To protect the taxpayer, due to the uncertainty surrounding the value of mortgage-backed securities, the Bank of England imposed a ‘haircut’ on the collateral. This meant that the banks had to post a significantly higher value of mortgage-backed securities than they received back in government bonds. The window during which banks could borrow from the Bank of England was originally only open for six months, but was then extended for an additional three months due to high demand from the banks and continuing poor interbank lending (and, unofficially, to help facilitate the Lloyds-HBOS merger).
As of June 2011, the banks had paid back £148 billion of the £185 billion they had borrowed, which puts them ahead of the agreed upon repayment schedule.198 The banks have until early 2012 to pay back the remaining £37 billion. As of December 2010, the banks had paid £240 million in fees. The National Audit Office currently believes that the taxpayer will not ultimately make a loss on this scheme.199
Bank Recapitalisation Fund (the nationalisation of RBS and Lloyds)In October 2008, the government announced that it would buy £37 billion worth of newly issued RBS and Lloyds shares in an attempt to recapitalise these ailing banks. However, this initial cash injection proved to be insufficient, and in 2009 the government agreed to redeem its preference shares, so that the banks would no longer be required to pay annual interest payments to the Treasury. The government instead bought newly issued ordinary stock, and the taxpayers’ stake in RBS increased as a result. In addition, the government subsequently bought so-called B shares, i.e shares without voting rights, in RBS, which injected yet further funds into the bank. Meanwhile, towards the end of 2009, Lloyds decided that rather than participate in the Asset Protection Scheme (more on this later), the bank would issue a further round of shares. The government participated in this rights issue so as to prevent its 43 per cent stake in the bank from being diluted. However, when Lloyds issued more shares in February 2010, the government chose to abstain, and its holdings were thus reduced to 41 per cent.
As of December 2010, the government had received £890 million and £610 million in recapitalisation-related fees from RBS and Lloyds respectively.200
Credit Guarantee SchemeIn October 2008, the government set up the Credit Guarantee Scheme to help recapitalise banks and thus encourage lending. The scheme allowed banks to pay a fee to have the government guarantee newly issued bonds for up to three years. However, due to pressure from the banking sector, in December 2008 the Treasury cut the fee that banks had to pay to use the scheme, and extended the guarantee to up to five years.
Under this scheme, £125 billion of debt was guaranteed.201 Lloyds alone guaranteed £49 billion of new debt, and accordingly paid £498 million in fees.202 In June 2011, the government announced that, as the banking sector was recovering, banks would be able to buy back any bonds issued under the scheme before the scheme expires in 2014. The aim here is to allow banks to start weaning themselves off cheap, subsidised funding, and banks will be charged a cancellation fee. As of December 2010, the government’s potential exposure under this scheme

Quid Pro Quo 76
was £115 billion, and the banks had paid a total of £2.53 billion in fees.203
Given that none of the banks have actually defaulted on their debts, the government has not had to pay out any money under this scheme to honour banks’ liabilities. However, as with the TBTF subsidy, this guarantee will have dramatically lowered and increased the banks and government’s funding costs respectively. In theory, the fee that the banks had to pay to access the scheme could have compensated the government for this. However, the National Audit Office conducted an investigation into the scheme and concluded that the banks had been undercharged for accessing the scheme, and thus has received a £1 billion subsidy from the state. Nevertheless, the National Audit Office currently believes that the taxpayer will not ultimately make a loss on this scheme.204 Although, it does caveat this with a warning that ‘further shocks could still lead to significant losses for the taxpayer’.
Asset-Backed Securities Guarantee SchemeIn January 2009, in a bid to ease banks’ funding problems (as prior to the financial crisis many banks had relied on issuing mortgage-backed securities in order to fund themselves), the government announced the Asset-Backed Securities Guarantee Scheme, which, for a fee, guaranteed, for up to five years, high-rate securities issued by banks that were based on residential mortgages. The government said it would guarantee up to £50 billion worth of such products, but no banks chose to take advantage of the scheme.205 Thus, as the scheme was not utilised, nothing is owed to the taxpayer here.
Asset Protection SchemeIn January 2009, the government introduced the Asset Protection Scheme, which helped mitigate the losses the bailed-out banks could incur on a given set of assets, including mortgage-backed securities (many of which had been subject to large write downs). In exchange for a fee, Lloyds and RBS agreed to shoulder the first £25 billion and £60 billion of losses, respectively, but once this threshold was passed, the government would reimburse these banks for 90 per cent of any further losses. This arrangement will stand until 2014.
RBS pays £700 million annually towards the schemes; however, Lloyds felt that the scheme did not represent value for money, and instead chose to pay a £2.5 billion penalty fee to withdraw from it.206 RBS’s losses have not yet fallen below the threshold, so the government has not had to pay out under this scheme so far. Moreover, analysts estimate that RBS’ applicable losses will peak at £45 billion, and thus the government will most likely never be called upon to pay up.207
The government is currently potentially liable for £131 billion under the scheme.208 However, the National Audit Office currently believes that the taxpayer will ultimately not make a loss on this scheme.209 Although, it also caveats this with a warning that ‘further shocks could still lead to significant losses for the taxpayer’.
Asset Purchase Facility (APF)In January 2009, the government established an Asset Purchase Facility that would allow the Bank of England to buy £50 billion of commercial paper and asset-backed securities. This programme did not constitute quantitative easing (QE), as it was fully funded by issuing treasury bills (very short-term government debt); however, the APF’s remit was later expanded to include QE. As a result, ‘only’ £985 million worth of commercial paper was purchased before the APF embarked upon the latter.210 As of 30 June 2011, the APF still had £285 million outstanding on its books (excluding all QE purchases).211

Quid Pro Quo 77
Endnotes
1 For further detail on the history of money and banking, see chapter 2 of Ryan-Collins, J., Greenhan, T., Jackson, A. & Werner, R. (2011). Where does money come from? London: nef.
2 Cameron, R. (1967). Banking in the early stages of industrialisation: a study in comparative economic history. New York: Oxford University Press.
3 Grossman, R. S. (2010). Unsettled Account: The Evolution of Banking in the Industrialised World since 1800. Princeton University Press. Princeton and Oxford.
4 Sykes, J. (1926). The Amalgamation Movement in English Banking, 1825 – 1924. London: P. S. King and Son, Ltd.
5 Ibid.6 Grossman, R. S. (1999). Rearranging Deck Chairs on the Titanic: English Banking Concentration and
Efficiency, 1870 – 1914. European Review of Economic History, 3(3): 323–349.7 Capie, F. & Rodrik-Bali, G. (1982). Concentration in British Banking, 1870–1920. British History,
24(3): 280–292.8 Grossman, R. S. (2010). Unsettled Account: The Evolution of Banking in the Industrialised World
Since 1800. Princeton University Press. Princeton and Oxford.9 Lambert, R. (2008, July 19) Crashes and bangs. Financial Times. Retrieved from http://www.ft.com/
cms/s/0/7173bb6a-552a-11dd-ae9c-000077b07658.html#axzz1QfGICjIk 10 Grossman, R. S. (2010). Unsettled Account: The Evolution of Banking in the Industrialised World
since 1800. Princeton and Oxford: Princeton University Press.11 Augar, P. (2000). The Death of Gentlemanly Capitalism. London: Penguin Books.12 Ibid.13 Ibid.14 Ibid.15 Ibid.16 Grossman, R. S. (2010). Unsettled Account: The Evolution of Banking in the Industrialised World
since 1800. Princeton and Oxford: Princeton University Press..17 G-10. (2001). Report on consolidation in the financial sector. Basel: Bank for International
Settlements (BIS).18 PWC. (2011). Banking in 2050. Retrieved from: http://www.pwc.com/gx/en/banking-capital-markets/
assets/PwC_Banking_in_2050.pdf19 IMF. (2010). A Fair and Substantial Contribution by the Financial Sector: Final report for the G-20.
Retrieved from http://www.imf.org/external/np/g20/pdf/062710b.pdf20 Alessandri, P. & Haldane, A. (2009). Banking on the State. London: Bank of England.21 IMF. (2010). A Fair and Substantial Contribution by the Financial Sector. Retrieved from
http://www.imf.org/external/np/g20/pdf/062710b.pdf 22 ICB. (2010). Interim Report - Consultation on Reform Options. Retrieved from
http://bankingcommission.independent.gov.uk/ 23 Financial Times (2011). UK 500 2011: Companies ranked by Sector [webpage]. Retrieved from
http://media.ft.com/cms/35a3d070-98d4-11e0-bd66-00144feab49a.pdf
24 Alessandri, P. & Haldane, A. (2009). Banking on the State. London: Bank of England.25 Treanor, J. (2011, February 18). Barclays bank forced to admit it paid just £113m in corporation tax
in 2009. The Guardian. Retrieved from http://www.guardian.co.uk/business/2011/feb/18/barclays-bank-113m-corporation-tax?CMP=twt_gu
26 Philippon, T. & Reshef, A. (2008). Wages and Human Capital in the U.S. Financial Industry: 1909–2006. http://pages.stern.nyu.edu/~tphilipp/papers/pr_rev15.pdf
27 Alessandri, P. & Haldane, A. (2009). Banking on the State. London: Bank of England.28 Ibid.29 Office for National Statistics, Monthly Wages and Salaries Survey30 Allen, P. (2010, July 28). UK Must Resist US-Style Bank Lobbying: BoE’s King [webpage]. Retrieved
from http://www.cnbc.com/id/38357700/UK_Must_Resist_US_Style_Bank_Lobbying_BoE_s_King
Quid Pro Quo 78
31 Spencer, M. (2011, February 8). City bankrolled Tory election campaign. The Guardian. http://www.guardian.co.uk/politics/2011/feb/08/city-conervative-party-election-campaign-funding?INTCMP=SRCH
32 Finance Watch (2011, June 30) “Our best estimate : The financial lobby employs about 700 people
for a total budget between € 300 m and 400 m here in Brussels”. Retreived from https://twitter.com/#!/forfinancewatch
33 Igan, D. & Mishra, P. (2011). Making Friends. Finance & Development, June 2011, Vol. 48, No. 2.34 Igan, D., Mishra, P. & Tressel, T. (2009). A Fistful of Dollars: Lobbying and the Financial Crisis. Paper
presented at the 10th Jacques Polak Annual Research Conference hosted by the International Monetary Fund, Washington, DC, November 5–6. Retrieved from http://www-bcc.imf.org/external/np/res/seminars/2009/arc/pdf/igan.pdf
35 Datamonitor. (2010). What consumers want: current accounts and savings in the uk [webpage]. Retrieved from http://www.datamonitor.com/store/Product/what_consumers_want_current_accounts_and_savings_in_the_uk?productid=DMFS2534
36 Mintel Financial Intelligence. (2010). Current, packaged, and premium accounts. Retrieved from http://oxygen.mintel.com/sinatra/oxygen/display/id=480790
37 House of Commons Treasury Committee. (2011). Competition and Choice in Retail Banking. Ninth Report of Session 2010-11. Retrieved from http://www.publications.parliament.uk/pa/cm201011/cmselect/cmtreasy/612/612i.pdf
38 Wilson, H. (2011, January18). Big banks running an oligopoly, says Virgin Money chief. The Telegraph. Retrieved from http://www.telegraph.co.uk/finance/newsbysector/banksandfinance/8266582/Big-banks-running-an-oligopoly-says-Virgin-Money-chief.html
39 Office of Fair Trading. (2010, November). Review of barriers to entry, expansion and exit in retail banking. Retrieved from http://www.oft.gov.uk/shared_oft/personal-current-accounts/oft1282
40 Cruickshank, D. (2000, March). Competition in UK Banking: A Report to the Chancellor of the Exchequer. London: Stationery Office Books.
41 Ibid.42 ICB. (2010). Interim Report - Consultation on Reform Options. Paragraph 2.88. Retrieved from http://
bankingcommission.independent.gov.uk/43 FSA. (n.d.) FSA Handbook. Retrieved from http://fsahandbook.info/FSA/html/handbook/ 44 Office of Fair Trading. (2010). Review of barriers to entry, expansion and exit in retail banking.
Retrieved from http://www.oft.gov.uk/shared_oft/personal-current-accounts/oft128245 Ibid.46 European Commission. (n.d.) Consumer Satisfaction [webpage]. Retrieved from http://ec.europa.eu/
consumers/strategy/cons_satisfaction_en.htm47 Mintel Financial Intelligence. (2010). Current, packaged, and premium accounts. Retrieved from
http://oxygen.mintel.com/sinatra/oxygen/display/id=480790 48 FSA. (2010). Financial Risk Outlook. Retrieved from http://www.fsa.gov.uk/pages/library/corporate/
outlook/fro_2010.shtml49 Consumer Affairs. (2010). Consumer Market Monitoring Survey. Retrieved from http://ec.europa.eu/
consumers/strategy/cons_satisfaction_en.htm 50 House of Commons Treasury Committee. (2011). Competition and Choice in Retail Banking. Ninth
Report of Session 2010-11. Retrieved from http://www.publications.parliament.uk/pa/cm201011/cmselect/cmtreasy/612/612i.pdf
51 Which? (2010). The 2010 Which? Current Account Survey. Retrieved from http://www.which.co.uk/news/2011/07/revealed-the-best-and-worst-current-account-providers-259631/
52 Wachman, R. (2010, June 10). Investment banks face scrutiny over soaring cost of share issues. The Guardian. Retrieved from http://www.guardian.co.uk/business/2010/jun/10/investment-banks-underwriting-fees-probe?INTCMP=SRCH
53 Goodley, S. (2011, May 4). Glencore float to make boss a £6bn fortune. The Guardian. Retrieved from http://www.guardian.co.uk/business/2011/may/04/glencore-float-to-make-boss-a-6bn-fortune?INTCMP=SRCH
54 OFT. (2011). Equity underwriting and associated services: an OFT market study. Retrieved from http://www.oft.gov.uk/shared_oft/market-studies/OFT1303.pdf
55 Ibid.56 Ibid.57 Ibid.58 Ibid.

Quid Pro Quo 79
59 Institutional Investor Council. (2010, December). Rights Issue Fees Inquiry. Investment Management Association and Association of British Insurers.
60 OFT. (2011). Equity underwriting and associated services: an OFT market study. Retrieved from http://www.oft.gov.uk/shared_oft/market-studies/OFT1303.pdf
61 Ibid.62 Institutional Investor Council. (2010, December). Rights Issue Fees Inquiry. Investment Management
Association and Association of British Insurers.63 Ibid.64 Ibid.65 Ibid.66 OFT. (2011). Equity underwriting and associated services: an OFT market study. Retrieved from
http://www.oft.gov.uk/shared_oft/market-studies/OFT1303.pdf67 Institutional Investor Council. (2010, December). Rights Issue Fees Inquiry. Investment Management
Association and Association of British Insurers.68 OFT. (2011). Equity underwriting and associated services: an OFT market study. Retrieved from
http://www.oft.gov.uk/shared_oft/market-studies/OFT1303.pdf69 Johnson, M. & Murphy, M. (2011, January 27) OFT draws critics over rights fees. The Financial
Times. Retrievable from http://www.ft.com/cms/s/0/5340f578-29f2-11e0-997c-00144feab49a.html70 FSB. (2010). Implementing OTC Derivatives Market Reforms. Retrieved from http://www.
financialstabilityboard.org/publications/r_101025.pdf71 Ausubel, L. (1991). The Failure of Competition in the Credit Card Market. The American Economic
Review, 18(1), 50-91. Retrieved from http://socsci2.ucsd.edu/~aronatas/project/academic/ausubel%20on%20cc%20monopoly.pdf
72 DellaVigna, S. & Malmendier, U. (2005). Paying Not to Go to the Gym. Retrieved from http://www.econ.berkeley.edu/~sdellavi/wp/gymemp05-04-20.pdf
73 Agarwal, S., Driscoll, J.C., Gabaix, X. & Laibson, D. (2007). Learning in the Credit Card Market. Retrieved from http://www.aeaweb.org/annual_mtg_papers/2008/2008_650.pdf
74 Baye, M. R., Gatti, J. R. J., Kattuman, P. & Morgan, J. (2004). Estimating Firm-Level Demand at a Price Comparison Site: Accounting for Shoppers and the Number of Competitors. Retrieved from http://emlab.berkeley.edu/users/webfac/farrell/e221_s05/Shoppers.pdf
75 Ahmetoglu, G., Fried, S., Dawes, J. & Furnham, A. (2010). Pricing Practices: Their Effects on Consumer Behaviour and Welfare. Mountainview Learning, prepared for the OFT.
76 Joffe-Walt, C. (2009, May12). Why We Spend Coins Faster than Bills [webpage]. Retrieved from http://www.npr.org/templates/story/story.php?storyId=104063298
77 Office of Fair Trading. (2010). What does behavioural economics mean for competition policy? Retrieved from http://www.oft.gov.uk/shared_oft/economic_research/oft1224.pdf
78 Ibid.79 Dellavigna, S. & Malmendier, U. (2004). Contract Design and Self-Control: Theory and Evidence.
The Quarterly Journal of Economics, CXIX(2), 353-402. Retrieved from http://elsa.berkeley.edu/~sdellavi/wp/ContractDesignQJE04.pdf
80 Ausubel, L. (1991). The Failure of Competition in the Credit Card Market. The American Economic Review, 18(1), 50-91. Retrieved from http://socsci2.ucsd.edu/~aronatas/project/academic/ausubel%20on%20cc%20monopoly.pdf
81 Wuebker, G. & Baumgarten, J. (n.d.). Strategies against Price Wars in the Financial Service Industry. Bonn and London: Simon-Kucher and Partners.
82 Carhart, M. (1997). On persistance in mutual fund perfomance. Journal of Finance, 52(1), 57-82. Retrieved from http://www.seligson.fi/resource/carhart.pdf
83 Kruger, A. A. (2007). Persistence in Mutual Fund Performance: Analysis of Holdings Returns. Retrieved from http://faculty.chicagobooth.edu/john.cochrane/teaching/35150_advanced_investments/Kruger_Mutual_Fund_Persistence_6_8_07.pdf
84 Jensen, M. (1967).The performance of mutual funds in the period 1945-1964. Journal of Finance, Vol. 23, No. 2 (1967) 389-416. http://citeseerx.ist.psu.edu/viewdoc/download?doi=10.1.1.139.6166&rep=rep1&type=pdf
85 Stevenson, D. (2011). Financial Times Guide to Exchange Traded Funds and Index Funds: How to Use Tracker Funds in Your Investment Portfolio (1st ed.). FT Guides. Financial Times/ Prentice Hall
86 Haldane, A. (2010). The $100 billion question [speech]. Retrieved from http://www.bankofengland.co.uk/publications/speeches/2010/speech433.pdf
Quid Pro Quo 80
87 Merrill Lynch. (n.d.) Available from http://www.mlindex.ml.com/GISPublic/bin/MLIndex.asp 88 Rogers, S. (2010, October18). Government spending by department, 2009-10: get the data.
The Guardian. http://www.guardian.co.uk/news/datablog/2010/oct/18/government-spending-department-2009-10#data
89 Haldane, A. (2010). The $100 billion question [speech]. Retrieved from http://www.bankofengland.co.uk/publications/speeches/2010/speech433.pdf
90 nef’s calculations and Haldane, A. (2010). The $100 billion question [speech]. Retrieved from http://www.bankofengland.co.uk/publications/speeches/2010/speech433.pdf
91 nef’s calculations92 nef’s calculations93 nef’s calculations94 Moody’s. (2009, January). Rating Methodology: Global Automotive Supplier Industry.
Moody’s Investors Service. Pass protected, retrieved from http://www.moodys.com/researchdocumentcontentpage.aspx?docid=PBC_113885
95 Moody’s. (2009). Global Heavy Manufacturing Rating Methodology. Moody’s Global Corporate Finance. Retrieved from http://v2.moodys.com/cust/content/content.ashx?source=StaticContent/Free+Pages/Products+and+Services/Downloadable+Files/Global+Heavy+Manufacturing+Rating+Methodology.pdf
96 Moody’s. (2010, June 20). Global Aerospace and Defense. Moody’s Investors Service. Retrieved from http://v2.moodys.com/cust/content/content.ashx?source=StaticContent/Free%20Pages/Products%20and%20Services/Downloadable%20Files/Global%20Aerospace%20n%20Defense.pdf
97 Moody’s. (2010, 28 December). Rating Methodology: Global Telecommunications Industry. Moody’s Investors Service. Pass protected, retrieved from http://www.moodys.com/researchdocumentcontentpage.aspx?docid=PBC_129659.
98 Moody’s (2007, October). Moody’s Global Rating Methodology for Asset Management Firms. Pass protected, retrieved from http://www.moodys.com/researchdocumentcontentpage.aspx?docid=PBC_104923
99 Moody’s (2007, April). Rating Methodology: Assigning Unsecured Credit Ratings to Hedge Funds. Moody’s Investors Service. Pass protected, retrieved from http://www.moodys.com/researchdocumentcontentpage.aspx?docid=PBC_102552.
100 Moody’s. (2010, May). Moody’s Global Rating Methodology for Property and Casualty Insurers. Pass protected, retrieved from http://www.moodys.com/researchdocumentcontentpage.aspx?docid=PBC_121761
101 Moody’s. (2008, July). Moody’s Global Rating Methodology for Reinsurers. Pass protected, retrieved from http://www.moodys.com/researchdocumentcontentpage.aspx?docid=PBC_108883
102 Haldane, A. (2009). Banking on the state. Retrieved from http://www.bis.org/review/r091111e.pdf 103 Brignall, M. (2007, September 22). FSA admits new compensation scheme needed. The Guardian.
Retrieved from http://www.guardian.co.uk/money/2007/sep/22/moneysupplement.currentaccounts2 104 National Audit Office. (2010). Maintaining the financial stability of UK banks. Retrieved from http://
www.nao.org.uk/publications/1011/support_for_banks.aspx105 Anon. (2008, October 12). UK freezes £4bn of Icelandic assets. The Telegraph. Retrieved from
http://www.telegraph.co.uk/finance/businesslatestnews/3185190/UK-freezes-4bn-of-Icelandic-assets.html
106 Sigurdartóttir, J. (2011, April 13). The Icesave referendum has been oversimplified. The Guardian. Retrieved from http://www.guardian.co.uk/commentisfree/2011/apr/13/icesave-referendum-uk-payments?INTCMP=SRCH
107 nef (the new economics foundation) and Compass. (2011). Good Banking. London: nef. Retrieved from http://www.neweconomics.org/sites/neweconomics.org/files/Good_Banking.pdf
108 Tucker, P. (2007, December 13). Speech at the Monetary Policy and the Markets Conference, London. Retrieved from http://www.bankofengland.co.uk/publications/speeches/2007/speech331.pdf
109 Bank of England statistics for the M4 measure of broad money supply. Calculated by removing Notes & Coins from M4 and calculating the ratio.
110 Huber, J. & Robertson, J. (2000). Creating New Money: A monetary reform for the information age. London: nef.
111 The Financial Services Authority is currently bringing in legislation that will require Banks to hold an amount determined by ‘stress testing’ the potential for 100 per cent outflows of liabilities over a two-week period – see Financial Services Authority, October 2009, PS09/16: Strengthening liquidity standards including feedback on CP08/22, CP09/13, CP09/14. Retrieved from http://www.fsa.gov.uk/pages/Library/Policy/Policy/2009/09_16.shtml
Quid Pro Quo 81
112 In many other countries this is not the case. In the United States, for example, there is still a 10 per cent liquidity reserve ratio on certain deposits and in China the government actively changes its liquidity reserve ratio in an attempt to restrain credit creation in order to fight inflation – at the time of writing it stood at 20.5 per cent (having been raised for the fourth time in 2011 - see Financial Times, ‘China raises bank reserve requirements’, 17th April 2011. The reserve requirement tool notwithstanding, the most important monetary policy tool in China remains its direct quota system for the quantity of credit creation, known as ‘window guidance’.
113 Bank of England statistics for the M4 measure of broad money supply. Calculated by removing Notes & Coins from M4 and calculating the ratio.
114 Werner, R. (2005). New Paradigm in Macroeconomics, Basingstoke: Palgrave Macmillan, p168115 El Diwany, T. (2003). The problem with interest, 2nd ed., London: Kreatoc, pp. 8-10 116 Werner, R. (2005). New Paradigm in Macroeconomics, Basingstoke: Palgrave Macmillan, p168.117 For a useful guide to the historical use of interest see Pettifor, A. (2006). The Coming First World
Debt Crisis. Basingstoke: Palgrave Macmillan, Chapter 5, p120-144118 For more detail on how fractional reserve banking operates, see Ryan-Collins, J., Greenhan, T.,
Jackson, A. & Werner, R. (2011). Where does money come from? London: nef.119 Huber, J. & Robertson, J. (2000). Creating New Money: A monetary reform for the information age.
London: nef.120 King, M. (2010, October 25). Banking: From Bagehot to Basel, and Back Again [speech]. The
Second Bagehot Lecture Buttonwood Gathering, New York City. Retrieved from http://www.bankofengland.co.uk/publications/speeches/2010/speech455.pdf
121 Wolf, M. ( 2010, November 9) The Fed is right to turn on the tap. Financial Times. Retrieved from http://www.ft.com/cms/s/0/93c4e11e-ec39-11df-9e11-00144feab49a.html#ixzz14yZBSY8z
122 Dyson, B., Greenham, T., Ryan-Collins, J. & Werner, A. (2011). Towards a twenty-first century banking and monetary system: Submission to the Independent Commission on Banking. Centre for Banking, Finance and Sustainable Development University of Southampton, School of Management; nef (the new economics foundation); Positive Money. Retrieved from http://www.neweconomics.org/sites/neweconomics.org/files/Submission-ICB-Positive-Money-nef-Soton-Uni.pdf
123 Ryan-Collins, J., Greenhan, T., Jackson, A. & Werner, R. (2011). Where does money come from? London: nef.
124 Robertson, J. & Huber, J. (2000) Creating New Money: A monetary reform for the information age. London: nef.
125 Crawford, I., Keen, M., and Smith, S. (2010). ‘Value Added Tax and Excises’, in J. Mirrlees, S. Adam, T. Besley, R. Blundell, S. Bond, R. Chote, M. Gammie, P. Johnson, G. Myles, and J. Poterba (eds), Dimensions of Tax Design: The Mirrlees Review, Oxford: Oxford University Press for Institute for Fiscal Studies. Retrieved from http://www.ifs.org.uk/mirrleesreview/dimensions/ch4.pdf
126 Huizinga, H. (2002). A European VAT on financial services? Economic Policy, 17(35), 497–534.127 Mirrlees, J., Adam, S., Besley, T., Blundell, R., Bond, S., Chote, R., Gammie, M., Johnson, P.,Myles, G.,
& Poterba J. (eds), (2010) Dimensions of Tax Design: The Mirrlees Review, Oxford: Oxford University Press for Institute for Fiscal Studies. Retrieved from http://www.ifs.org.uk/mirrleesreview/design/ch8.pdf
128 Huizinga, H. (2011). Is the financial sector under taxed? [presentation slides]. Brussels Tax Forum, March 28-29. Retrieved from http://ec.europa.eu/taxation_customs/resources/documents/taxation/gen_info/conferences/taxforum2011/huizinga_ppt.pdf
129 Mirrlees, J., Adam, S., Besley, T., Blundell, R., Bond, S., Chote, R., Gammie, M., Johnson, P.,Myles, G., & Poterba J. (eds), (2010)
130 Dimensions of Tax Design: The Mirrlees Review, Oxford: Oxford University Press for Institute for Fiscal Studies. Retrieved from http://www.ifs.org.uk/mirrleesreview/design/ch8.pdf
131 Gendron, P-P. (2007).Value Added Tax Treatment of Financial Services: An Assessment and Policy Proposal for Developing Countries. International Tax Program Papers 0701, International Tax Program, Institute for International Business, Joseph L. Rotman School of Management, University of Toronto..
132 Ibid.133 National Audit Office. (2010). Maintaining the financial stability of UK banks. Retrieved from http://
www.nao.org.uk/publications/1011/support_for_banks.aspx134 Ibid.135 Uses data from Yahoo! Finance. Retrieved from http://uk.finance.yahoo.com
Quid Pro Quo 82
136 nef’s own calculations and Alrdick, P. & Wilson, H. (2011, June 16). Osborne plans £1bn privatisation of Northern Rock. The Telegraph. Retrieved from http://www.telegraph.co.uk/finance/economics/8578263/Osborne-plans-1bn-privatisation-of-Northern-Rock.html and NRAM. (2011). Northern Rock (Asset Management) Plc Annual Results 2010. Retrievable from http://www.n-ram.co.uk/en/company-information/corporate-communications/newsroom/newsroom-2011/2011-03-31.aspx and Bradford & Bingley. (n.d.). Bradford & Bingley Plc. Annual Report and Accounts 2010. Retrievable from http://corporate.bbg.co.uk/~/media/Files/B/Bradford-And-Bingley-Corporate/pdf/results-andpublications/year-2010/financial-results/2010-annual-report.pdf
137 Milne, R. & Jenkins, P. (2011, June 29). Bank stock falls spark Eurozone value hunt. The Financial Times. Retrieved from http://www.ft.com/cms/s/0/272003d8-a267-11e0-9760-00144feabdc0.html#axzz1RpNk6nRo
138 Treanor, J. (2011, June 24). Eurozone ‘mess’ is a risk to UK banks, Bank of England governor admits. The Guardian. Retrieved from http://www.guardian.co.uk/business/2011/jun/24/eurozone-mess-risk-to-uk-banking-mervyn-king
139 National Audit Office. (2010). Maintaining the financial stability of UK banks. Retrieved from http://www.nao.org.uk/publications/1011/support_for_banks.aspx
140 Ibid.141 National Audit Office. (2010). Maintaining the financial stability of UK banks. Retrieved from http://
www.nao.org.uk/publications/1011/support_for_banks.aspx142 Ibid.143 National Audit Office. (2010). Maintaining the financial stability of UK banks. Retrieved from http://
www.nao.org.uk/publications/1011/support_for_banks.aspx144 Grice, A. (2009, December 4). £850bn: official cost of the bank bailout. The Telegraph. Retrieved
from http://www.independent.co.uk/news/uk/politics/163850bn-official-cost-of-the-bank-bailout-1833830.html
145 Aldrick, P. (2010, March 28). Barclay’s raids pensions to offset bonuses tax. The Telegraph. Retrieved from http://www.telegraph.co.uk/finance/newsbysector/banksandfinance/7533046/Barclays-raids-pensions-to-offset-bonuses-tax.html
146 Treanor, J. (2010, February 25). RBS posts a loss of £3.6bn but defends £1.3bn bonus pay out. The Guardian. Retrieved from http://www.guardian.co.uk/business/2010/feb/25/rbs-3bn-loss-defends-bonuses
147 Heath, A. & Hellier, D. (2009, December 15). Lloyds poised to pay £100m in bonus tax. CITY A.M. Retrieved from http://www.google.co.uk/url?sa=t&source=web&cd=3&ved=0CC0QFjAC&url=http%3A%2F%2Fwww.cityam.com%2Fnews-and-analysis%2Flloyds-poised-pay-%25C2%25A3100m-bonus-tax&rct=j&q=Lloyds%20UK%20bonus%20tax&ei=IVrxTeXiNtSXhQfmx9hF&usg=AFQjCNFTBrJXCmSaX5LawiU1hn5nt_9AhA&cad=rja
148 Wilson, H. (2010, March 1). HBSC Chief Executive gives bonus to charity. The Telegraph. Retrieved from http://www.google.co.uk/url?sa=t&source=web&cd=2&ved=0CCUQFjAB&url=http%3A%2F%2Fwww.telegraph.co.uk%2Ffinance%2Fnewsbysector%2Fbanksandfinance%2F7344327%2FHSBC-chief-executive-gives-bonus-to-charity.html&rct=j&q=HSBC%20UK%20bonus%20tax&ei=FFvxTf7UF4bDhAeO3qwX&usg=AFQjCNHup4tFsn4YIzecW2EslN2w_b1KiQ&cad=rja
149 Moore, J. (2010, March 4). Record profits at Standard Charter but bad debts rise. The Independent. Retrievable from http://www.independent.co.uk/news/business/news/record-profits-at-standard-chartered-but-bad-debts-rise-1915782.html
150 Patrick, M. (n.d.) UK bank levy to raise £2.5 billion from 2012. Down Jones Newswires. Retrievable from http://www.advfn.com/lse/ShareNews.asp?sharenews=LLOY&article=45582303&headline=uk-bank-levy-to-raise-gbp2-5-billion-from-2012
151 Treanor, J. (2011, March 23). Budget 2011: Cut in corporation tax will be net neutral for the banks. The Guardian. Retrievable from http://www.guardian.co.uk/uk/2011/mar/23/budget-2011-corporation-tax-cut-offset-bank-levy?INTCMP=SRCH
152 King, M. (2010). Banking: From Bagehot to Basel, and Back Again. The Second Bagehot Lecture, Buttonwood Gathering, New York. Retrievable from City http://www.bankofengland.co.uk/publications/speeches/2010/speech455.pdf
153 ICB. (2010) Interim report. Retrieved from http://bankingcommission.independent.gov.uk/154 Ibid.155 Ibid.156 Ibid.157 Ibid.158 Ibid.159 Ibid.160 Ibid.
Quid Pro Quo 83
161 King, M. (2010, 25 October). Banking: From Bagehot to Basel, and Back Again [Speech transcript]. Retrieved from http://www.bankofengland.co.uk/publications/speeches/2010/speech455.pdf
162 Ibid.163 Sakoui, A. & Jenkins, P. (2009, 6 November) Stability concerns over CoCo bonds. Financial
Times. Retrieved from http://www.ft.com/cms/s/0/7982578c-ca75-11de-a3a3-00144feabdc0.html#axzz1WTX8POA3
164 Jenkins, P. (2011, 5 March). Bankers fear cocos are another crisis in the making. Financial Times. Retrieved from http://www.ft.com/cms/s/0/31a0f202-46a2-11e0-967a-00144feab49a.html#axzz1WTX8POA3
165 Ibid.166 Ibid.167 Van Duyn, A. (2011, 29 March). IMF queries derivatives reform effectiveness. Financial
Times. Retrieved from http://www.ft.com/cms/s/0/9511df26-5a2b-11e0-86d3-00144feab49a.html#axzz1WTX8POA3.
168 Grant, J. (2010, 16 April). LCH.Clearnet warns of loose standards. Financial Times. Retrieved from http://www.ft.com/cms/s/0/0458dc94-48ef-11df-8af4-00144feab49a.html#axzz1WTX8POA3.
169 Grant, J. (2009, 17 December). Britain signals rift in OTC derivatives regulation. Financial Times. Retrieved from http://www.ft.com/cms/s/0/4c7ef9c2-eaad-11de-a9f5-00144feab49a.html#axzz1WTX8POA3.
170 Ibid.171 Ibid.172 Dyson, B., Greenham, T., Ryan-Collins, J. & Werner, A. (2011). Towards a twenty-first century banking
and monetary system: Submission to the Independent Commission on Banking. Centre for Banking, Finance and Sustainable Development University of Southampton, School of Management; nef (the new economics foundation); Positive Money. Retrieved from http://www.neweconomics.org/sites/neweconomics.org/files/Submission-ICB-Positive-Money-nef-Soton-Uni.pdf
173 ICB. (2010) Interim report. Retrieved from http://bankingcommission.independent.gov.uk/ 174 Turner, A. (2010, 14 July). The Future of Finance [speech transcript]. Retrieved from http://www.fsa.
gov.uk/pages/Library/Communication/Speeches/2010/0714_at.shtml.175 ICB. (2010) Interim report. Retrieved from http://bankingcommission.independent.gov.uk/176 Dyson, B., Greenham, T., Ryan-Collins, J. & Werner, A. (2011). Towards a twenty-first century banking
and monetary system: Submission to the Independent Commission on Banking. Centre for Banking, Finance and Sustainable Development University of Southampton, School of Management; nef (the new economics foundation); Positive Money. Retrieved from http://www.neweconomics.org/sites/neweconomics.org/files/Submission-ICB-Positive-Money-nef-Soton-Uni.pdf
177 PwC. (2010). The Total Tax Contribution of UK Financial Services .Third Edition. Report prepared for the City of London Corporation. Retrieved from http://217.154.230.218/NR/rdonlyres/68F49A7E-8255-415B-99A8-1A8273D568D9/0/TotalTax3_FinalForWeb.pdf
178 ICB. (2010) Interim report. Retrieved from http://bankingcommission.independent.gov.uk/179 Anon. (2007, September 15). Rush on Northern Rock continues. BBB News. Retrieved from http://
news.bbc.co.uk/1/hi/business/6996136.stm 180 National Audit Office. (2010). Maintaining the financial stability of UK banks. Retrieved from http://
www.nao.org.uk/publications/1011/support_for_banks.aspx181 Ibid. 182 Ibid. 183 Thomas, P. (2010, January 13). Northen Rock says it could take 20 years to repay Govt loan.
Moneymarketing. Retrieved from http:\\www.moneymarketing.co.uk\\mortgages\\northern-rock-says-it-could-take-20-years-to-repay-govt-loan\\1004839.article”
184 National Audit Office. (2010). Maintaining the financial stability of UK banks. Retrieved from http://www.nao.org.uk/publications/1011/support_for_banks.aspx
185 Alrdick, P. & Wilson, H. (2011, June 16). Osborne plans £1bn privatisation of Northern Rock. The Telegraph. Retrieved from http://www.telegraph.co.uk/finance/economics/8578263/Osborne-plans-1bn-privatisation-of-Northern-Rock.html
186 NRAM. (2011). Northern Rock (Asset Management) Plc Annual Results 2010. Retrievable from http://www.n-ram.co.uk/en/company-information/corporate-communications/newsroom/newsroom-2011/2011-03-31.aspx
187 NRAM. (2011). Northern Rock (Asset Management) Plc Annual Report and Accounts 2010. Retrievable from http://www.n-ram.co.uk/~/media/Files/N/N-RAM/content/results-presentations/2010-annual-report-accounts.pdf?

Quid Pro Quo 84
188 Treanor, J. (2011, June 27). Bank chief warns of waves of home repossessions if rates rise. The Guardian. Retrievable from http://www.guardian.co.uk/business/2011/jun/27/house-repossessions-wave-interest-rates-rise
189 Anon. (2008) Bradford & Bingley nationalised. The Financial Times. Retrievable from http://www.ft.com/cms/s/3/87e19524-8e01-11dd-8089-0000779fd18c.html
190 Anon. (2009, October 26), Bradford & Bingley to split good and bad assets to pay back £18.4bn load. The Telegraph. Retrieved from http://www.telegraph.co.uk/finance/newsbysector/banksandfinance/6434274/Bradford-and-Bingley-to-split-good-and-bad-assets-to-pay-back-18.4bn-loan.html
191 NRAM. (2011). Northern Rock (Asset Management) Plc Annual Report and Accounts 2010. Retrievable from http://www.n-ram.co.uk/~/media/Files/N/N-RAM/content/results-presentations/2010-annual-report-accounts.pdf?
192 Farndon, L. (2011, January 27). Bradford & Bingley bailout could yield £1billion profit. The Daily Mail. Retrieved from http://www.dailymail.co.uk/money/article-1351239/Bradford--Bingley-bailout-yield-1billion-profit.html
193 National Audit Office. (2010). Maintaining the financial stability of UK banks. Retrieved from http://www.nao.org.uk/publications/1011/support_for_banks.aspx
194 Bradford & Bingley. (n.d.). Bradford & Bingley Plc. Annual Report and Accounts 2010. Retrievable from http://corporate.bbg.co.uk/~/media/Files/B/Bradford-And-Bingley-Corporate/pdf/results-and-publications/year-2010/financial-results/2010-annual-report.pdf
195 Weir, K. (2009, November 24). BoE lent banks more than 60 million pounds last year. Reuters. Retrieved from http://uk.reuters.com/article/2009/11/24/britain-banks-emergency-idUKGEE5AN1KE20091124
196 Bank of England. (2009). Additional information provide to the Treasury Committee by the Bank of England. Retrievable from http://www.bankofengland.co.uk/publications/other/treasurycommittee/financialstability/ela091124.pdf
197 Pickard, J. (2009, November 25). Banks: Don’t treat us how we treat you. Retrievable from http://blogs.ft.com/westminster/2009/11/banks-dont-treat-us-how-we-treat-you/
198 Cohen, N. (2011, June 13). Banks speed repayments but costs take toll. The Financial Times. Retrievable from http://www.ft.com/cms/s/0/ea39720a-952e-11e0-a648-00144feab49a.html#axzz1Qw4jFuls
199 Cotterill, J. (n.d.) H.M. banks and infinitum. Retrievable from http://ftalphaville.ft.com/blog/2010/12/15/437441/hm-banks-ad-infinitum/
200 National Audit Office. (2010). Maintaining the financial stability of UK banks. Retrieved from http://www.nao.org.uk/publications/1011/support_for_banks.aspx
201 DMO. (n.d.) 2008 Credit Guarantee Scheme. Retrievable from http://www.dmo.gov.uk/documentview.aspx?docname=cgs/press/pr20100419.pdf&page=
202 Treanor, J. (2010, February 26). Bad week for the part-nationalised banks dashes hopes for quick sell-off. The Guardian. Retrievable from http://www.guardian.co.uk/business/2010/feb/26/government-banking-share-selloff-postponed?INTCMP=SRCH
203 National Audit Office. (2010). Maintaining the financial stability of UK banks. Retrieved from http://www.nao.org.uk/publications/1011/support_for_banks.aspx
204 Cotterill, J. (n.d.) H.M. banks and infinitum. Retrievable from http://ftalphaville.ft.com/blog/2010/12/15/437441/hm-banks-ad-infinitum/
205 National Audit Office. (2010). Maintaining the financial stability of UK banks. Retrieved from http://www.nao.org.uk/publications/1011/support_for_banks.aspx
206 Press Association. (2010, August 31). Government could earn £30 bn profit from bailout scheme. The Guardian. Retrievable from http://www.guardian.co.uk/business/2010/aug/31/banks-bailout-banker-profit?INTCMP=SRCH
207 Jenkins, P. (2011, July 14) RBS forecasts losses to be less severe. The Financial Times. Retrievable from http://www.ft.com/cms/s/0/be0c610c-ad6a-11e0-bc4f-00144feabdc0.html#axzz1Sp4DlfPx
208 National Audit Office. (2010). Maintaining the financial stability of UK banks. Retrieved from http://www.nao.org.uk/publications/1011/support_for_banks.aspx
209 Cotterill, J. (n.d.) H.M. banks and infinitum. Retrievable from http://ftalphaville.ft.com/blog/2010/12/15/437441/hm-banks-ad-infinitum/
210 Bank of England. (2009). Asset Purchase Facility Q1. Retrievable from http://www.bankofengland.co.uk/publications/other/markets/apf/apfquarterlyreport0904.pdf
211 Bank of England. (n.d.). Asset Purchase Facility Results. Retrievable from http://www.bankofengland.co.uk/markets/apf/results.htm

The Great Transition is a growing movement finding new ways for everyone to survive and thrive through financial crises, recession, climate change and the end of the oil age.
The Great Transition
Securing the Great Transition is at the heart of all of nef’s work. But meeting the challenges we have identified needs new approaches. The Great Transition is a growing movement of individuals and organisations who recognise that creating a different world is necessary, desirable and possible.
At its heart is an emerging new economy built on well-being, social justice and the inescapable need to learn to live within our available biosphere. This calls for experiment, innovation and bold action by government, business and civil society. By working together to make change happen we believe we can make the Great Transition.
For more information please call 020 7820 6300
Phot
o: J
oel S
tern
feld

new economics foundation3 Jonathan StreetLondon SE11 5NHUnited Kingdom
Telephone: +44 (0)20 7820 6300
Facsimile: +44 (0)20 7820 6301
E-mail: [email protected]
Website: www.neweconomics.org
Registered charity number 1055254© September 2011 nef (the new economics foundation)
ISBN 978-1-908506-06-1
This work is licensed under the Creative Commons Attribution-NonCommercial-NoDerivs 3.0 Unported License. To view a copy of this license, visit http://creativecommons.org/licenses/by-nc-nd/3.0/ and www.neweconomics.org/publications
The Good Banking Forum includes a unique range of leading figures from academia, finance, politics, the law, trade unions, consumer and civil society groups that are demanding real reform of the banking sector. The Forum challenges the limited scope of the Independent Commission on Banking, will mobilise public pressure for ‘Good Banking’, and is campaigning to break-up the banks as a necessary first step.
This document has been produced with the financial assistance of the European Union. The contents of this document are the sole responsibility of nef (the new economics foundation) and can under no circumstances be regarded as reflecting the position of the European Union.
Author: Lydia Prieg, Tony Greenham and Josh Ryan-Collins
With thanks to: Richard Gower, Richard Murphy, Ruth Potts and Andrew Simms
Edited by: Tony Greenham
Design by: bwa-communication.co.uk
Cover image: ©Istockphoto/nobeastsofierce
ACKNOWLEDGEMENT
With thanks to Stamp Out Poverty for their support in the production of this piece of work.