Quarterly Review - xbma.org
22
The views expressed herein reflect only the views of XBMA’s editorial staff individually and not those of any of XBMA’s founders, academic partners, advisory board members, or others. XBMA Quarterly Review Q3 2013 Raaj Narayan & Francis Stapleton, Editors
Transcript of Quarterly Review - xbma.org

The views expressed herein reflect only the views of XBMA’s editorial staff individually and not those of any of XBMA’s founders, academic partners, advisory board members, or others.
XBMA Quarterly Review Q3 2013
Raaj Narayan & Francis Stapleton, Editors

– XBMA –
1,069
724534 550
763497 495
1,590
974
479 580
703
659 529
1,006
862
488
711
575
572 717
980
547
666
752574
858
0
500
1,000
1,500
2,000
2,500
3,000
3,500
4,000
4,500
5,000
2007 2008 2009 2010 2011 2012 2013
US
$ b
illi
ons
Deal Volume by Quarter
Quarter 4
Quarter 3
Quarter 2
Quarter 1
4,646
2,615
3,106
2,166
2,585
1,7 41
2,594
Global M&A Volume: Q3 Snapshot
Deal activity was relatively strong in Q3, with global M&A volume of US$717 billion, marking the second strongest quarter of the past two calendar years.
Strong Q3 performance was driven in part by Verizon’s $130 billion acquisition of Vodafone’s 45% interest in Verizon Wireless, the third largest deal in history. Excluding Verizon/Vodafone, Q3 deal activity showed modest gains over Q2.
Cross-border M&A volume in 2013 is on pace to account for just over 30% of global M&A volume, down 6% as compared to 2012.
Telecommunications dominated deal volume as a result of the Verizon/Vodafone transaction. The Energy & Power and Real Estate sectors also turned in strong quarters.
Source: Thomson
All figures are inflation-adjusted to 2013 dollars. Data in this report does not include spin-offs announced in 2013 that have not been completed.
1

– XBMA – 2
Global M&A Volume: 1996 – 2013
Global M&A activity in 2013 is on track to reach US$2.3 trillion, slightly lower than the annual average volume over the last three years.
Private equity deal activity in Q3 maintained pace with Q2 volume. Private equity deals accounted for 14% of global M&A volume in the first three quarters of 2013, an increase of 16% over the corresponding period in 2012.
Source: Thomson
All figures are inflation-adjusted to 2013 dollars. 2013 data is annualized.
0.0
0.5
1.0
1.5
2.0
2.5
3.0
3.5
4.0
4.5
5.0
Global M&A Volume

– XBMA – 3
Cross-Border M&A Volume: 2006 – 2013
Cross-border M&A transactions are defined as those in which the parties are headquartered/based in different countries. All figures are inflation-adjusted to 2013 dollars. 2013 data is annualized.
Of the 10 largest deals in Q3, half involved acquirers and targets from different countries.
At an annualized volume of US$710 billion, cross-border deal activity is on pace to account for just over 30% of global M&A volume in 2013, a 6% decline from 2012 levels.
Transactions involving an emerging market acquirer or target accounted for 27% of global deal activity in the first three quarters of 2013, on par with the same period in 2012.
Transactions involving a developed market acquirer and emerging market target reached a relative low since 2009.
Source: Thomson
1.40
2.09
1.19 0.59
0.98 0.92 0.93 0.71
2.77
2.55
1.91
1.58
1.62 1.70 1.65 1.62
4.17
4.65
3.11
2.17
2.59 2.61 2.59 2.33
0
1
2
3
4
5
2006 2007 2008 2009 2010 2011 2012 2013
US$
trill
ions
Deal Volume
Cross-Border M&ADomestic M&A

– XBMA – 4
Medium and Large M&A Deals: 2005 – 2013
2013 data is annualized.
Q3 had five “mega deals” over US$10 billion, with two deals – both cross-border – over US$15 billion (Verizon/Vodafone and Publicis/Omnicom).
The top 10 global deals in Q3 accounted for US$223 billion in deal volume compared to $93 billion in Q2. Excluding Verizon/Vodafone, the 10 largest deals in Q3 accounted for approximately the same volume as the 10 largest deals in Q2.
Source: Thomson
319 424
649
376
200
365 370 373 279
525
676
756
494
385
538 520 509
499
844
1100
1405
870
585
903 890 882 777
250
500
750
1000
1250
1500
2005 2006 2007 2008 2009 2010 2011 2012 2013
Number of Deals > US$500 million
Domestic M&A
Cross-Border M&A

– XBMA – 5
M&A Volume by Target’s Region
The United States accounted for more than half of global M&A volume in Q3, a sharp increase compared to recent historical levels, with U.S. participation in seven of the 10 largest deals of Q3.
European deal volume increased by 3.5% on the back of strong French deal volume, which increased by 115% in Q3 and included two of the five largest deals. Combined U.S. and European deal volume was 73%, exceeding their recent historical average by approximately 6%.
Asian-Pacific deal-making slowed in Q3, with China, Japan and Australia each experiencing notable declines compared to Q2 volumes. Despite the quarterly decline, however, Chinese volume remained above recent historical levels.
Represents share of global M&A volume based on target’s headquarters. All figures are inflation-adjusted to 2013 dollars.
Source: Thomson
Q3 2013
Ja pa n2.49%
Ca n a da4.17%
Sou t h A m erica2.53%
A frica /Middle
Ea st 1.93%
In dia 0.33% Mexico
0.75%
Ch in a8.01%
Eu rope22.49%
A u st ra lia /NZ2.07%
Cen t ra l A sia4.52%
Un it ed St a t es50.61%
Cen t ra l A m erica0.11%
2008 - 2012Cen t ra l A m erica
0.10%
Mexico1.08%
In dia1.16%
Ch in a6.47%
Cen t ra l A sia4.55%
A u st ra lia /NZ 5.32%
Ja pa n3.66%
Sou t h A m erica 4.53%
Un it ed St a t es37.48%
A frica /Middle Ea st
2.03%Ca n a da
4.70%
Eu rope 29.92%

– XBMA – 6
GDP and M&A Volume by Target’s Region
The United States continues to contribute a substantially higher share of global M&A volume than world GDP. In Europe, the spread between share of world GDP and global M&A volume narrowed as deal activity rebounded somewhat.
Outside of the United States and Canada, share of world GDP outpaces share of global M&A volume, with particularly stark differences in Europe, Japan, China and Africa/Middle East.
China’s share of global M&A in Q3 declined relative to its share of world GDP, accounting for 8% of global M&A activity in Q3 and approximately 13% of world GDP.
Source: Thomson, IMF
Region 2012 GDP (US$ trillions)
2012 Per Capita GDP (US$)
Europe 20.8 25,473
United States 15.7 49,922
China 9.0 6,474
Japan 6.0 46,735
India 1.8 1,492
World 71.7 10,332
% o
f 20
12 W
orld
GD
P
%
of Q
3 20
13 G
loba
l M&
A
2012 GDP figures are IMF estimates; 2013 data not yet available.
GDP, M&A, and Debt by Region
0%
10%
20%
30%
40%
50%
60%
Eur
ope
Uni
ted
Stat
es
Japa
n
Chi
naC
entr
al A
sia
Afr
ica/
Mid
dle
Eas
tSo
uth
Am
eric
a
Can
ada
Cen
tral
Am
eric
a
Indi
aA
ustr
alia
/NZ
Mex
ico
0%
50%
100%
150%
200%
250%
Gov
ern
men
t Deb
t as
% o
f GD
P

– XBMA – 7
Trends in M&A Volume by Target’s Region: 2009 – 2013
North American deal volume increased by approximately $139 billion (or 58%) compared to Q2 levels, reaching its second-highest level since 2009.
European M&A volume also rebounded sharply in Q3, increasing by $49 billion, or 50%, over Q2 levels.
Asian-Pacific (ex-Japan) M&A volume declined modestly by 6%, led by declines in Chinese and Australian deal activity.
Source: Thomson
All figures are inflation-adjusted to 2013 dollars.
0
100
200
300
400
500
600
700
800
900
1,000
2009 2010 2011 2012 2013
US$
bil
lion
s
Asia-Pacific (ex-Japan) Europe North America Global Japan
– XBMA – 8
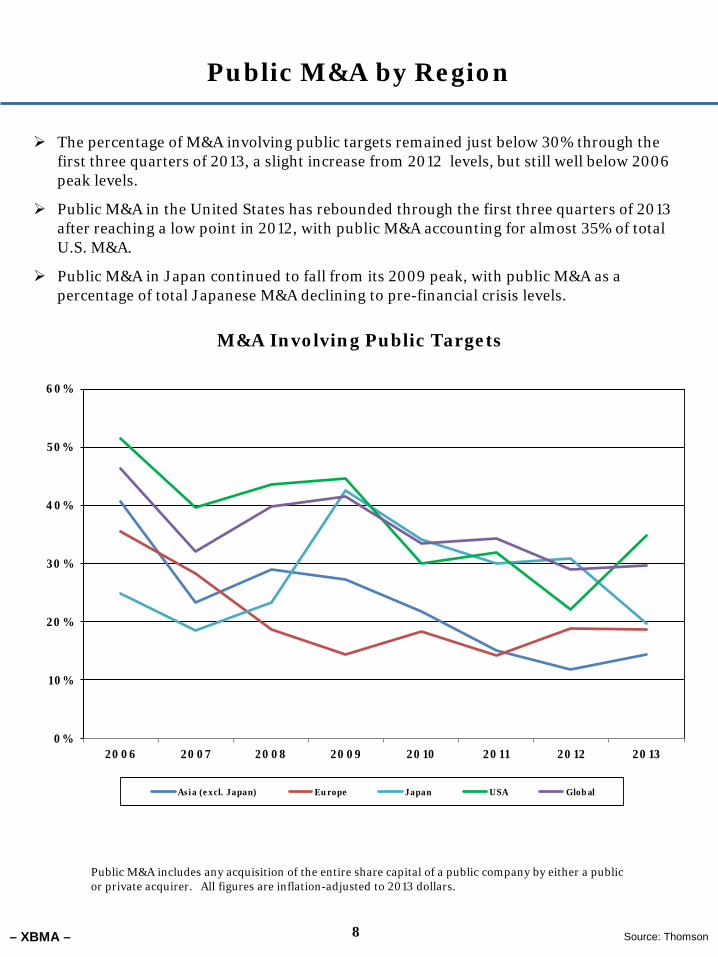
Public M&A by Region
Public M&A includes any acquisition of the entire share capital of a public company by either a public or private acquirer. All figures are inflation-adjusted to 2013 dollars.
The percentage of M&A involving public targets remained just below 30% through the first three quarters of 2013, a slight increase from 2012 levels, but still well below 2006 peak levels.
Public M&A in the United States has rebounded through the first three quarters of 2013 after reaching a low point in 2012, with public M&A accounting for almost 35% of total U.S. M&A.
Public M&A in Japan continued to fall from its 2009 peak, with public M&A as a percentage of total Japanese M&A declining to pre-financial crisis levels.
0%
10%
20%
30%
40%
50%
60%
2006 2007 2008 2009 2010 2011 2012 2013
Asia (excl. Japan) Europe Japan USA Global
Source: Thomson
M&A Involving Public Targets

– XBMA – 9
Distressed Deals: 1988 – 2013
Distressed deal volume in Q3 was approximately US$3.5 billion, the lowest since 2010.
At an annualized volume of US$27 billion, distressed deal volume in 2013 will have declined 19.5% from 2012 levels, representing the third consecutive annual drop as the global economic climate continues to improve.
Source: Thomson
All figures are inflation-adjusted to 2013 dollars. 2013 data is annualized. Distressed transactions include those in which the target entity is undergoing restructuring or has reduced the debt on its balance sheet through a bankruptcy sale, a tender offer or an exchange offer for existing debt securities, or a loan modification. An entity is considered to be undergoing restructuring if it has publicly confirmed retention of a restructuring advisor, plans to restructure its debt, has filed for bankruptcy or has defaulted on its debt, has received an S&P or Moody’s rating of CCC+/Caa1 or below before or in reaction to the announcement of a transaction, or its credit facility or debt securities carry a yield of 1,000 bps above that of U.S. Treasuries.
0
25
50
75
100
125
150
175
US$
bil
lion
s
Volume of Distressed Deals

– XBMA – 10
Global M&A by Sector: Last 12 Months
Energy & Power continued to lead overall and cross-border deal activity over the last 12 months, followed by Financials, Real Estate and Telecommunications.
Industrials, Financials and Consumer Staples also experienced significant cross-border volume over the past 12 months.
Source: Thomson
M&A Volume by Sector
0
100
200
300
400
500
Ene
rgy
& P
ower
Mat
eria
ls
Fin
anci
als
Indu
stri
als
Hea
lthc
are
Rea
l Est
ate
Hig
h T
echn
olog
yC
onsu
mer
Sta
ples
Med
ia/E
nter
tain
men
tTe
leco
mm
uni
cati
ons
Con
sum
er P
rodu
cts
and
Serv
ices
Ret
ail
US
$ b
illi
on
s
Global M&A*
Cross-Border M&A
*Includes both domestic and cross-border transactions.

– XBMA – 11
Trends in Global M&A by Sector: Last Four Quarters
The Telecommunications sector led deal volume in Q3, with almost 70% of the sector’s volume resulting from the Verizon/Vodafone deal.
After Telecommunications, Real Estate saw the largest quarter-over-quarter increase, reversing two consecutive quarters of decline. Healthcare experienced the largest overall quarterly decline.
Cross-border M&A activity in Industrials, Healthcare and Retail each had a strong performances relative to recent quarters, while overall volume in those sectors showed only modest gains or declined. Overall, 10 of 12 sectors experienced an increase in cross-border volume in Q3.
Source: Thomson
0
40
80
120
160
200
US$
bil
lions
Domestic and Cross-Border M&A
Q4 2012 Q1 2013 Q2 2013 Q3 2013
0
10
20
30
40
50
60
US
$ b
illi
ons
Cross-Border M&A
Q4 2012 Q1 2013 Q2 2013 Q3 2013

– XBMA – 12
Top 10 Global Deals Announced in Q3 2013
Source: Thomson
Acquirer* Target* Target Industry
Value of Deal
(US$mil)
Date Announced
Verizon Communications Inc (United States)
Vodafone’s Interest in Verizon Wireless Inc (United Kingdom)
Telecom 130,100 2 Sep 2013
Publicis Groupe SA/Omnicom Group Inc** (France & United States)
Publicis Groupe SA/Omnicom Group Inc (France & United States)
Advertising Services 19,331 28 Jul 2013
Government of France (France)
Groupe Caisse des Dépôts & Consignations (50% Interest in SME Financing JV) (France)
Credit Institutions 13,712 12 Jul 2013
George Weston Ltd (Canada)
Shoppers Drug Mart Corp (Canada)
Miscellaneous Retail Trade 13,025 15 Jul 2013
Telefonica SA (Spain)
E-Plus Mobilfunk GmbH & Co KG (Germany)
Telecom 11,435 23 Jul 2013
Community Health Systems Inc (United States)
Health Management Associates Inc (United States)
Health Services 7,669 30 Jul 2013
Microsoft Corp (United States)
Nokia Oyj (Devices & Services Business) (Finland)
Communications Equipment 7,165 3 Sep 2013
Applied Materials Inc (United States)
Tokyo Electron Ltd (Japan)
Machinery 6,987 24 Sep 2013
Koch Industries Inc (United States)
Molex Inc (United States)
Electronic and Electrical
Equipment 6,711 9 Sep 2013
Perrigo Co (United States)
Elan Corp plc (Ireland)
Drugs 6,534 29 Jul 2013
*Company nationality determined by location of headquarters or by location of target assets. **The transaction was a merger of equals.

– XBMA –
Acquirer** Target** Target Industry
Value of Deal (US$mil)
Date Announced
Bank of Tokyo-Mitsubishi UFJ (Japan)
Bank of Ayudhya PCL (Thailand)
Commercial Banks, Bank
Holding Companies
5,736 2 Jul 2013
Albedo Ltd (Singapore)
Reflection Oasis Inc (Malaysia)
Investment & Commodity
Firms, Dealers, Exchanges
2,099 20 Sep 2013
Rising Vast Ltd (Hong Kong)
Shi Yi Investments Limited (China)
Metal and Metal Products 1,289 19 Aug 2013
Eutelsat Communications SA (France)
Satmex (Mexico)
Telecom 1,142 31 Jul 2013
American Tower Corporation (United States)
NII Holdings (Tower Assets) (Brazil & Mexico)
Telecom 811 9 Aug 2013
China Public Procurement Ltd (Hong Kong)
Fortress Paradise Limited (China)
Business Services 773 22 Jul 2013
L’Oreal SA (France)
Magic Holdings International Ltd (China)
Soap, Cosmetics, and Personal-Care
Products
685 15 Aug 2013
Whirlpool Corporation (United States)
Hefei Rongshida Sanyo Electric Co Ltd (China)
Electronic and Electrical
Equipment 555 13 Aug 2013
Grunenthal GmbH (Germany)
Laboratorios Andromaco SA (Chile)
Drugs 441 9 Aug 2013
Perenco SA (France)
Petrobras Colombia Ltd (Colombia)
Oil and Gas; Petroleum Refining
380 13 Sep 2013
13
Top 10 Deals from Developed into Emerging Economies* Announced in Q3 2013
*Developed/Emerging economies are defined by IMF classification, available at http://www.imf.org/external/pubs/ft/weo/2010/01/weodata/groups.htm. **Company nationality determined by location of headquarters or by location of target assets.
Source: Thomson
Aggregate Value of Deals from Developed into Emerging Economies
All figures are inflation-adjusted to 2013 dollars.
050
100150200250300
2004 2005 2006 2007 2008 2009 2010 2011 2012 2013
US
$ b
illi
ons Quarter 4
Quarter 3
Quarter 2
Quarter 1

– XBMA –
Top 10 Deals from Emerging into Developed Economies* Announced in Q3 2013
Source: Thomson
Acquirer** Target** Target Industry
Value of Deal (US$mil)
Date Announced
Pacific Rubiales Energy Corp (Colombia)
Petrominerales Ltd (Canada)
Oil and Gas; Petroleum Refining
1,557 29 Sep 2013
China Molybdenum Co, Ltd (China)
Rio Tinto Group (Northeparkes Mine) (Australia)
Mining 820 29 Jul 2013
Abu Dhabi Investment Authority (United Arab Emirates)
Tourism Asset Holdings Limited (Australia)
Hotels and Casinos 745 10 Sep 2013
Haitong Securities Co, Ltd (China)
UT Capital Group Co, Limited (Hong Kong)
Credit Institutions 715 25 Sept 2013
State Oil Company of Azerbaijan Republic (Azerbaijan)
National Natural Gas System Operator SA (Greece)
Electric, Gas, and Water
Distribution 528 1 Aug 2013
Gold Fields Limited (South Africa)
Barrick Gold Corporation (Yilgarn) (Australia)
Mining 301 22 Aug 2013
Investor Group (China)
Huafeng Group Holdings Limited (Hong Kong)
Textile and Apparel
Products 219 5 Aug 2013
Polski Koncern Naftowy ORLEN (Poland)
TriOil Resources Ltd (Canada)
Oil and Gas; Petroleum Refining
178 16 Sep 2013
Aspen Pharmacare Holdings Limited (South Africa)
GlaxoSmithKline plc (NDB site) (France)
Drugs 154 30 Sep 2013
Saudi Industrial Paints Co Ltd (Bahrain)
Tyrrells Potato Chips Ltd (United Kingdom)
Food and Kindred Products
152 1 Aug 2013
*Developed/Emerging economies are defined by IMF classification, available at http://www.imf.org/external/pubs/ft/weo/2010/01/weodata/groups.htm. **Company nationality determined by location of headquarters or by location of target assets.
14
Aggregate Value of Deals from Emerging into Developed Economies
All figures are inflation-adjusted to 2013 dollars.
0
50
100
150
200
2004 2005 2006 2007 2008 2009 2010 2011 2012 2013
US$
bil
lion
s Quarter 4
Quarter 3
Quarter 2
Quarter 1

– XBMA –
Acquirer* Target* Target Industry
Value of Deal (US$mil)
Date Announced
Verizon Communications Inc (United States)
Vodafone’s Interest in Verizon Wireless Inc (United Kingdom)
Telecom 130,100 2 Sep 2013
Publicis Groupe SA/Omnicom Group Inc** (France & United States)
Publicis Groupe SA/Omnicom Group Inc (France & United States)
Advertising Services 19,331 28 Jul 2013
George Weston Ltd (Canada)
Shoppers Drug Mart Corp (Canada)
Miscellaneous Retail Trade 13,025 15 Jul 2013
Community Health Systems Inc (United States)
Health Management Associates Inc (United States)
Health Services 7,669 30 Jul 2013
Koch Industries Inc (United States)
Molex Inc (United States)
Electronic and Electrical
Equipment 6,711 9 Sep 2013
Investor Group (United States & Canada)
Neiman Marcus Group Inc (United States)
Retail Trade – General
Merchandise and Apparel
6,000 9 Sep 2013
Vivendi SA (United States)
Activision Blizzard Inc (United States)
Prepackaged Software 5,834 25 Jul 2013
Brookfield Asset Management Inc (United States)
Brookfield Office Properties Inc (United States)
Real Estate; Mortgage
Bankers and Brokers
4,934 30 Sep 2013
American Tower Corp (United States)
MIP Tower Holdings LLC (United States)
Investment & Commodity
Firms, Dealers, Exchanges
4,800 6 Sep 2013
Hellman & Friedman LLC (United States)
Hub International Ltd (United States)
Insurance 4,400 5 Aug 2013
15
Top 10 North American* Deals Announced in Q3 2013
Source: Thomson
*Deal location determined by location of target; company nationality determined by location of headquarters or location of target assets.
**The transaction was a merger of equals. Aggregate Value of North American Deals
All figures are inflation-adjusted to 2013 dollars.
0
500
1000
1500
2000
2004 2005 2006 2007 2008 2009 2010 2011 2012 2013
US
$ b
illi
ons Quarter 4
Quarter 3
Quarter 2
Quarter 1

– XBMA –
Acquirer* Target* Target Industry
Value of Deal (US$mil)
Date Announced
Applied Materials (United States)
Tokyo Electron Ltd (Japan)
Machinery 6,987 24 Sep 2013
Mitsubishi UFJ Financial Group Inc (Japan)
Bank of Ayudhya PCL (Thailand)
Commercial Banks, Bank
Holding Companies
5,737 2 Jul 2013
CNPC (China)
Kashagan Oilfield (Kazakhstan)
Oil and Gas; Petroleum Refining
5,000 7 Sep 2013
Beijing Zhongchuang Telecom Test Co Ltd (China)
Beijing Xinwei Telecom Technology Co Ltd (China)
Communications Equipment 4,318 27 Sep 2013
Albedo Ltd (Singapore)
Reflections Oasis Inc (Malaysia)
Investment & Commodity
Firms, Dealers, Exchanges
2,098 20 Sep 2013
Baidu Inc (China)
91 Wireless Websoft Limited (China)
Prepackaged Software 1,850 16 Jul 2013
KKR & Co LP (United States)
Panasonic Healthcare Co Ltd (Japan)
Measuring, Medical, Photo
Equipment; Clocks
1,680 27 Sep 2013
MBK Partners Ltd (South Korea)
ING Life Insurance Korea Ltd (South Korea)
Insurance 1,654 26 Aug 2013
BOE Technology Group Co Ltd (China)
Beijing Boe Display Technology Co Ltd (China)
Electronic and Electrical
Equipment 1,391 25 Jul 2013
Bank of Ayudhya PCL (Thailand)
Bank of Tokyo-Mitsubishi (Thailand)
Commercial Banks, Bank
Holding Companies
1,382 18 Sep 2013
16
Top 10 Asian-Pacific* Deals Announced in Q3 2013
Source: Thomson
*Deal location determined by location of target; company nationality determined by location of headquarters or location of target assets.
Aggregate Value of Asian-Pacific Deals
All figures are inflation-adjusted to 2013 dollars.
0
200
400
600
800
2004 2005 2006 2007 2008 2009 2010 2011 2012 2013
US
$ b
illi
ons Quarter 4
Quarter 3
Quarter 2
Quarter 1

– XBMA – 17
Top 10 European* Deals Announced in Q2 2013
*Deal location determined by location of target; company nationality determined by location of headquarters or location of target assets.
Source: Thomson
Acquirer* Target* Target Industry
Value of Deal (US$mil)
Date Announced
Government of France (France)
Groupe Caisse des Depots & Consignations (SME Financing Business) (France)
Credit Institutions 13,712 12 Jul 2013
Telefonica SA (Spain)
E-Plus Mobilfunk GmbH & Co KG (Germany)
Telecom 11,435 23 Jul 2013
Perrigo Co (United States)
Elan Corp plc (Ireland)
Drugs 6,534 29 Jul 2013
Microsoft Corp (United States)
Nokia Oyj (Devices & Services Business) (Finland)
Communications Equipment 7,165 3 Sep 2013
Schneider Electric SA (France)
Invensys plc (United Kingdom)
Measuring, Medical, Photo
Equipment; Clocks
5,012 11 Jul 2013
Fresenius SE & Co KGaA (Germany)
Rhoen Klinikum AG (43 Hospitals) (Germany)
Health Services 4,082 13 Sep 2013
Investor Group (Japan)
Grohe AG (Germany)
Rubber and Miscellaneous
Plastic Products 3,898 26 Sep 2013
OMV AG (Austria)
Statoil ASA (Oilfield Assets) (Norway)
Oil and Gas; Petroleum Refining
3,150 19 Aug 2013
Gazprom (Russian Federation)
MOEK (Russian Federation)
Electric, Gas, and Water
Distribution 2,971 13 Aug 2013
Rosneft (Russian Federation)
Itera (Russian Federation)
Oil and Gas; Petroleum Refining
2,900 2 Jul 2013
Aggregate Value of European Deals
All figures are inflation-adjusted to 2013 dollars.
0
500
1000
1500
2000
2004 2005 2006 2007 2008 2009 2010 2011 2012 2013
US
$ b
illi
ons Quarter 4
Quarter 3
Quarter 2
Quarter 1

– XBMA – 18
Top 10 Inbound Chinese Deals Announced in Q3 2013
Acquirer* Target* Target Industry
Value of Deal (US$mil)
Date Announced
SCA Svenska Cellulosa Aktiebolaget (Sweden)
Vinda International Holdings Ltd (Hong Kong)
Paper and Allied Products 1,284 9 Aug 2013
Fortune REIT (Singapore)
Tin Shui Wai Development Limited (China)
Real Estate; Mortgage
Bankers and Brokers
754 30 Jul 2013
L'Oreal SA (France)
Magic Holdings International Limited (China)
Soaps, Cosmetics, and Personal-Care
Products
685 15 Aug 2013
Whirlpool Corporation (United States)
Hefei Rongshida Sanyo Electric Co Ltd (China)
Electronic and Electrical
Equipment 555 13 Aug 2013
PT Indofood CBP Sukses Makmur Tbk (Indonesia)
China Minzhong Food Corporation Limited (China)
Food and Kindred Products
360 2 Sep 2013
CapitaLand Limited (Singapore)
Hua Kun Business Investment Management Co, Ltd (China)
Real Estate; Mortgage
Bankers and Brokers
297 15 Jul 2013
Pteris Global Limited (Singapore)
Techman (HongKong) Limited (Hong Kong)
Investment & Commodity
Firms, Dealers, Exchanges
103 7 Feb 2013
Samoa Guangxun Co Ltd (American Samoa)
Nanjing Youzhi Technology Co (China)
Business Services 74 30 Sep 2013
Blooming Progress Ltd (Taiwan)
Qunkang Technologies (Shenzen) Co Ltd (China)
Electronic and Electrical
Equipment 66 30 Aug 2013
CapitaLand Limited (Singapore)
Super Plus Limited (China)
Real Estate; Mortgage
Bankers and Brokers
60 1 Aug 2013
*Company nationality determined by location of headquarters or location of target assets.
Source: Thomson
Aggregate Value of Inbound Chinese Deals
*All figures are inflation-adjusted to 2013 dollars.
0
10
20
30
40
2004 2005 2006 2007 2008 2009 2010 2011 2012 2013
US$
bil
lion
s Quarter 4
Quarter 3
Quarter 2
Quarter 1

– XBMA – 19
Top 10 Outbound Chinese Deals Announced in Q3 2013
*Company nationality determined by location of headquarters or location of target assets.
Source: Thomson
Acquirer* Target* Target Industry
Value of Deal (US$mil)
Date Announced
CNPC (China)
Kashagan Oilfield (Kazakhstan)
Oil and Gas; Petroleum Refining
5,000 7 Sep 2013
Sinopec Group (China)
Apache Corporation (Egypt)
Oil and Gas; Petroleum Refining
3,100 29 Aug 2013
China Investment Corporation (China)
Uralkali (Russian Federation)
Chemicals and Allied Products 2,000 9 Nov 2013
Sinochem Group (China)
Parque das Conchas BC-10 (Brazil)
Oil and Gas; Petroleum Refining
1,540 16 Aug 2013
Investor Group (Hong Kong)
KK daVinci Holdings (Japan)
Real Estate; Mortgage
Bankers and Brokers
1,203 20 Aug 2013
China Molybdenum Co Ltd (China)
Northparkes (Australia)
Mining 820 31 Jul 2013
CLP Holdings Ltd (Hong Kong)
Delta Electricity (Australia)
Electric, Gas, and Water
Distribution 439 23 Jul 2013
Yanchang Petroleum International Ltd (Hong Kong)
Novus Energy Inc (Canada)
Oil and Gas; Petroleum Refining
290 3 Sep 2013
Affinity Equity Partners (Hong Kong)
LOEN Entertainment (South Korea)
Electronic and Electrical
Equipment 237 18 Jul 2013
Meidu Holding Co Ltd (China)
Woodbine Acquisition LLC (United States)
Oil and Gas; Petroleum Refining
135 12 Jul 2013
Aggregate Value of Outbound Chinese Deals
*All figures are inflation-adjusted to 2013 dollars.
0
20
40
60
80
2004 2005 2006 2007 2008 2009 2010 2011 2012 2013
US
$ b
illi
ons Quarter 4
Quarter 3
Quarter 2
Quarter 1

– XBMA – 20
Top 10 Inbound Indian Deals Announced in Q3 2013
Source: Thomson
Acquirer* Target* Target Industry
Value of Deal (US$mil)
Date Announced
Baring Private Equity Partners (United Kingdom)
Hexaware Technologies Limited (India)
Business Services 267 23 Aug 2013
Toshiba Corporation (Japan)
Vijai Electricals Limited- T&D Bus (India)
Electronic and Electrical
Equipment 200 10 Sep 2013
Endurance International Group, Inc (United States)
Directi Web Technology Private Limited (India)
Prepackaged Software 110 9 Sep 2013
Omori Machinery Co Ltd (Japan)
Multi Pack Systems Private Limited (India)
Machinery 32 23 Sep 2013
Francisco Partners Management LLC (United States)
Four Soft Ltd-New Technology (India)
Business Services 23 10 Aug 2013
Denso Corporation (Japan)
DENSO India Limited (India)
Machinery 11 26 Aug 2013
Kokuyo Co, Ltd (Japan)
Riddhi Enterprises (India)
Paper and Allied Products 9 9 Sep 2013
Pan Global Corporation (United States)
Indian Corporation (India)
Electric, Gas, and Water
Distribution 7 9 Sep 2013
WDFC UK Limited (United Kingdom)
Nahar Credits Private Limited (India)
Credit Institutions 5 5 Sep 2013
Cross Marketing Inc (Japan)
Markelytics Solutions Ltd (India)
Business Services 4 24 Jul 2013
*Company nationality determined by location of headquarters or location of target assets.
Aggregate Value of Inbound Indian Deals
*All figures are inflation-adjusted to 2013 dollars.
0
10
20
30
40
2004 2005 2006 2007 2008 2009 2010 2011 2012 2013
US$
bil
lion
s Quarter 4
Quarter 3
Quarter 2
Quarter 1
– XBMA – 21
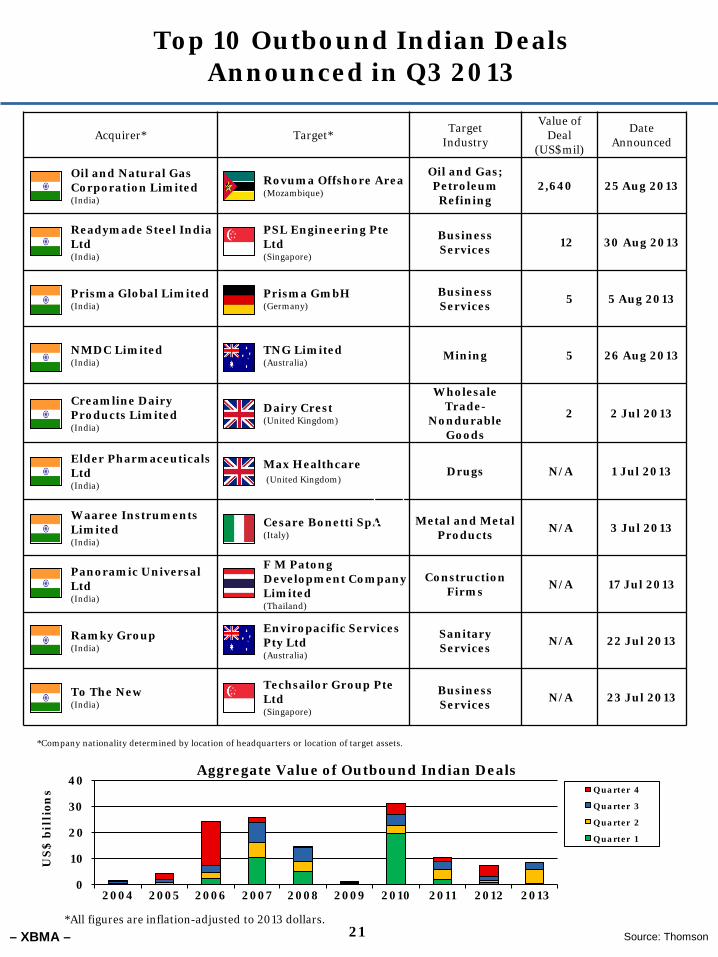
Top 10 Outbound Indian Deals Announced in Q3 2013
*Company nationality determined by location of headquarters or location of target assets.
Source: Thomson
Acquirer* Target* Target Industry
Value of Deal
(US$mil)
Date Announced
Oil and Natural Gas Corporation Limited (India)
Rovuma Offshore Area (Mozambique)
Oil and Gas; Petroleum Refining
2,640 25 Aug 2013
Readymade Steel India Ltd (India)
PSL Engineering Pte Ltd (Singapore)
Business Services 12 30 Aug 2013
Prisma Global Limited (India)
Prisma GmbH (Germany)
Business Services 5 5 Aug 2013
NMDC Limited (India)
TNG Limited (Australia)
Mining 5 26 Aug 2013
Creamline Dairy Products Limited (India)
Dairy Crest (United Kingdom)
Wholesale Trade-
Nondurable Goods
2 2 Jul 2013
Elder Pharmaceuticals Ltd (India)
Max Healthcare (United Kingdom)
Drugs N/A 1 Jul 2013
Waaree Instruments Limited (India)
Cesare Bonetti SpA (Italy)
Metal and Metal Products N/A 3 Jul 2013
Panoramic Universal Ltd (India)
F M Patong Development Company Limited (Thailand)
Construction Firms N/A 17 Jul 2013
Ramky Group (India)
Enviropacific Services Pty Ltd (Australia)
Sanitary Services N/A 22 Jul 2013
To The New (India)
Techsailor Group Pte Ltd (Singapore)
Business Services N/A 23 Jul 2013
Aggregate Value of Outbound Indian Deals
*All figures are inflation-adjusted to 2013 dollars.
0
10
20
30
40
2004 2005 2006 2007 2008 2009 2010 2011 2012 2013
US
$ b
illi
ons Quarter 4
Quarter 3
Quarter 2
Quarter 1