Quarterly report on the global and the spanish economy Q3 2016 Círculo de Empresarios
50
Quarterly report on the global and the Spanish economy Q3 2016 Círculo de Empresarios Madrid, November 2016
-
Upload
circulo-de-empresarios -
Category
Economy & Finance
-
view
42 -
download
0
Transcript of Quarterly report on the global and the spanish economy Q3 2016 Círculo de Empresarios

Quarterly report on the global
and the Spanish economyQ3 2016
Círculo de Empresarios
Madrid, November 2016


2016 GDP projections
Source: Círculo de Empresarios based on IMF (October), 2016
2016 2017
Global
3.1 3.4(3.2 previous) (3.5 previous)
-3,3
-1,8
-0,8
US
Argentina
Brazil
Eurozone Russia
India
Nigeria
-1,8
-0,8
1,7
1,8
UK
-3,3
1,6
-3,3
-1,7
6,6
7,6
2,9 Australia
0,5
Japan
China
3

Steady and moderate growth in an uncertainty global
environment (I)
In economic terms...
• Contagion effect
• Impact on the UE
• FED doubts
• FED’s credibility at risk
• Private debt problem
• Overcapacity
BREXITPAUSE IN RATE
HIKES
THE ECONOMIC DESACELERATION
CONTINUES
Source: Círculo de Empresarios, 2016
Risks
4

In geopolitical terms...
Political risk events calendar
2016 COUNTRY EVENT
8 November US General election
4 December Italy Constitutionalreferendum
4 December Austria Re-run of PresidentialElection
2017 COUNTRY EVENT
March UK Article 50
March Netherlands General election
April-May France Presidential election
September Germany General election
November China 19th National Party Congress
Source: Círculo de Empresarios, 2016
Steady and moderate growth in an uncertainty
global environment (II)
A growing level of protectionism and political climate that stalls structural reforms
5

Higher growth in emerging markets...
After 5 consecutive years of declining economic activity, growth in emerging markets is
expected to strengthen in 2016
Source: Círculo de Empresarios based on IMF (October), 2016
Economic sentiment has
improved:
Lower interest
rates in advanced
economies
Higher
commodity
prices
Due to
Recovery in capital flows
Currency appreciation
Therefore
8,58
5,77
2,88
7,46
6,27
5,314,96
4,574,02 4,17
4,6
-1
0
1
2
3
4
5
6
7
8
9
10
2007 2008 2009 2010 2011 2012 2013 2014 2015 2016 2017
Real GDP growth %
Emerging Global
Forecast
6

...Yet growth remains fragile in advanced
economies
Growth forecast revised down by 5 percentage points for 2016
2016 GDP projections
* July’s forecast: 1,8%
Source: Círculo de Empresarios based on IMF (October), 2016
1.6%
0.8%
1.7%
1.3%1.8%
0.5%
2,7
0,1
-3,4
3,1
1,71,2 1,2
1,9 2,1 1,6 1,8
5,7
3,0
-0,3
5,4
4,23,5 3,3 3,4 3,2 3,1
3,4
-4
-3
-2
-1
0
1
2
3
4
5
6
7
2007 2008 2009 2010 2011 2012 2013 2014 2015 2016 2017
Real GDP growth%
Advanced GlobalForecast
7

Weakness in global trade(I)
Source: Círculo de Empresarios based on WTO, 2016
18.5 tn$
Billion $
Global merchandise trade
16.4 tn$
2014
2015
Global trade volume 2015
-11,4%
8

Weakness in global trade(II)
World trade will grow at the slowest pace since the global financial crisis
Source: Círculo de Empresarios based on WTO, 2016
Forecast 2016:
1.7%(2.8% in April)
Lower relationship betweentrade growth and world GDP
Reasons for a global trade
contraction
Slowing GDP
Creeping protectionism
Note: Baltic Dry Index surged 100% since February minimums
-18,3
18,3
1,3
-25
-20
-15
-10
-5
0
5
10
15
20
25
07T1 08T1 09T1 10T1 11T1 12T1 13T1 14T1 15T1 16T2
Quarterly global trade evolutionAnnual change
9

China
China’s transition to a more consumption economy influences in global trade
slowdown
Source: Círculo de Empresarios based on Reuters, IMF, 2016
Chinese imports accounts 10% of global imports and has an impact on 80% of global trade
0
0,2
0,4
0,6
0,8
1
Asia Commodity
exporters
Advanced Eastern Europe Rest
Impact on exports of a 1 % shock to China's demand
after one year
Global average impact-11,2
-25,4
11,5
-1,8
-4,1 -4,8 -4,4-2,8
-10
-18,8
-13,8
-7,6
-10,9
-0,4
-8,4
-12,5
1,5
-1,9
-30
-25
-20
-15
-10
-5
0
5
10
15
Jan-16 Feb-16 Mar-16 Apr-16 May-16 Jun-16 Jul-16 Aug-16 Sep-16
Chinese external sectorAnnual change
Exports Imports
10

China
Forecast
GDP growth remained stable in Q3 at 6.7% (6.9% year
on year change Q2)
Consumption contributed 71% of GDP growth in the first 3
quarters of the year (66.4% in 2015):
Gradual transition continues
Improvements...
Manufacturing PMI
Industrial Production
Fixed Investment
Retail sales
51,2
6
8,2
10,7
Source: Círculo de Empresarios based on IMF, Bankia, 2016
Note: Chinese Government GDP target: 6,5%-7%
%
%
%
points
8,4
14,2
10,61
6,6 5,9
0
2
4
6
8
10
12
14
16
Real GDP growth
%
11

China
Higher financial imbalances
Chinese corporate debt (18 trillion
$) is equivalent to US GDP
Source: Círculo de Empresarios based on IMF (October), 2016
Total China’s debt to GDP ratio is
250%
Note: Actually, China requires 6 yuan debt to generate 1 yuan of GDP
Chinese non-perfoming loans
(NPLs) rose to 14% (IMF) vs 2.15
(Chinese government)
121,9
170
70,7
97
50
70
90
110
130
150
170
190
2010 2011 2012 2013 2014 2015 2016
Chinese corporate debt% GDP
China
Emerging
12

Latin America
Gradual recovery in economic activity
Source: Círculo de Empresarios based on IMF (October) and BBVA Research, 2016
LATIN
AMERICA
2016 GDP growth
PACIFIC ALLIANCE MERCOSUR
Great disparities in the region
2.6%
-0.9Pacific Alliance: Chile, Colombia, Mexico, Peru
Mercosur: Argentina, Brazil, Venezuela, Paraguay, Uruguay and Bolivia
3,14
-1,8
6,1
4,6
3 2,9
10
-0,6
1,6
-4
-2
0
2
4
6
8
Real GDP growth
%
%
13

Higher market confidence
Financial Markets
Recovery in exports
Brazil
Source: Círculo de Empresarios based on IMF, BBVA Research, 2016
The economy continues in contraction but recovery in 2017
Lack of reforms
Reduction in potential GDP
Deficit in public accounts
Weaknesses Strengths Challenges
Inflation
Debt
Confidence
14

Brazil
Source: Círculo de Empresarios based on BBVA Research, IBGE, 2016
Brazil’s economy will grow between 0.5-0.9% in 2017 underpinned by domestic
demand and exports
Lower inflation pressure but still above
inflation range (4.5%)
-20
-15
-10
-5
0
5
10
15
Fixed capital
investment
Private
consumption
Public
expenditure
Exports Imports GDP
GDP by components%
2015 2016 2017
0
0,3
-1
-2,3
-1,5-1,3
-0,4-0,6
-2,5
-2
-1,5
-1
-0,5
0
0,5
Q3-14 Q4-14 Q1-15 Q2-15 Q3-15 Q4-15 Q1-16 Q2-16
Real GDP growthQuarterly change %
15

Japan
Source: Círculo de Empresarios based on OECD, Caixabank Research, 2016
Economic growth remains fragile although new fiscal stimulus
Forecast
* The plan incorporates 13.5 trillion yen mainly aimed to infrastructure projects and demographics
%
GDP 2017: 5,1 tn $ (500 tn ¥)
Japan’s potential GDP is projected
to remain weak and unemployment
rate in minimums
Doubts to achieve inflation target
(2%)
-10,0
-8,0
-6,0
-4,0
-2,0
0,0
2,0
4,0
6,0
8,0
Real GDP growthAnnual change %
2014 2015 2016 2017
Unemployment rate 3,6 3,4 3,2 3,1
Employment 0,6 0,4 0,5 -0,2
Wages 0,8 0,7 1 2
Inflation 2,7 0,8 0,1 2,1
Real GDP 0 0,5 0,5 0,6
16

US
Source: Círculo de Empresarios based on Markit, Bloomberg, 2016
January-16 March-16 May-16 July-16 September-16 October-16
Positive leading indicators
Expansion
Contraction
New home sales surge
to 9 – year high
+3.1%
Durable godos orders*
+1.6%
* Non volatile sectors included
47
48
49
50
51
52
53
54
55
56
Manufacturing and services PMI's, 2016
Services Manufacturing
17

US
Source: Círculo de Empresarios based on Markit, Bloomberg, 2016
After loosing economic momentum between Q415-Q216, US GDP growth
picked up
4Q15-2Q16
+1% +1.4%
2Q-2016
+2.9%
3Q-2016
+1.6-2%
2016 Forecast
-1,2
4
5
2,32
2,62
0,9 0,81,4
2,9
-2
-1
0
1
2
3
4
5
6
1Q-14 2Q-14 3Q-14 4Q-14 1Q-15 2Q-15 3Q-15 4Q-15 1Q-16 2Q-16 3Q-16
Real GDP growthAnnual change %
-10
-5
0
5
10
15
1Q-14 2Q-14 3Q-14 4Q-14 1Q-15 2Q-15 3Q-15 4Q-15 1Q-16 2Q-16 3Q-16
GDP by componentsAnnual change %
Private consumption Private investment Exports
18

USStable net employment creation
+192,000 (average jul-sep*)
5%(sep)
Net employment creation
Unemployment rate
Wages
+2.6%
Source: Círculo de Empresarios based on BLS, BEA, 2016
149
295 280 271
168
233
186
144
24
271252
167 156
0
50
100
150
200
250
300
350
US net employment creationMonhly, thousands
62,2
62,4
62,6
62,8
63,0
63,2
63,4
4,0
4,5
5,0
5,5
6,0
6,5
7,0
Unemployment and labor force participation% labour force
Labor force (right axis)
Unemployment (left axis)
19

US
Financial markets anticipates a rate hike before the end of the year
Source: Círculo de Empresarios based on Berenberg, 2016
70% probability
Not in favor In favor
Indications to raise interests
0,5 0,5 0,5
0,75
1 1
1,25
1,5
0
0,2
0,4
0,6
0,8
1
1,2
1,4
1,6
1Q-16 2Q-16 3Q-16 4Q-16 1Q-17 2Q-17 3Q-17 4Q-17
Fed interest rates expectations%
20

Europe
Economic growth after Brexit
1.8% 1.8% 1.8%
Q1-2016 Q2-2016 Q3-2016
BREXIT
EU-28 real GDP growth Euro Area real GDP
1.7
Q3-2016
Q2-2016
Q1-2016
1.6
1.6
Source: Círculo de Empresarios based on Eurostat, OECD, 2016
Q3 GDP 2015, by countries(%)
+0.7 +0.3
(+0,8% T2) (+0,4% T2)
+0.5
(+0,7% T2)
+0.2(0% T2 )
+0.1(0% T2)
More ECB
measures
21

Eurozone
PMI’s showed economic expansion
Source: Círculo de Empresarios based on Eurostat, OECD, 2016
GERMANY
55SPAIN
53.3FRANCE
51.l8ITALY
50.9PMI > 50 = Expansion
PMI< 50 = Contraction
53.5
Eurozone Average
22

Unemployment rate by countries% labour force
Source: Círculo de Empresarios based on Eurostat, 2016
Eurozone: Labour market
Lowest rate recorded since July 2011
Youth unemployment
20.7%
Long-term unemployment*
51.5%
* > 12 months
23,2
18,91
10,8 11,510 9,9
7,78,6 8,4 7,9
5,7 6,2
4,1
0
5
10
15
20
25
23
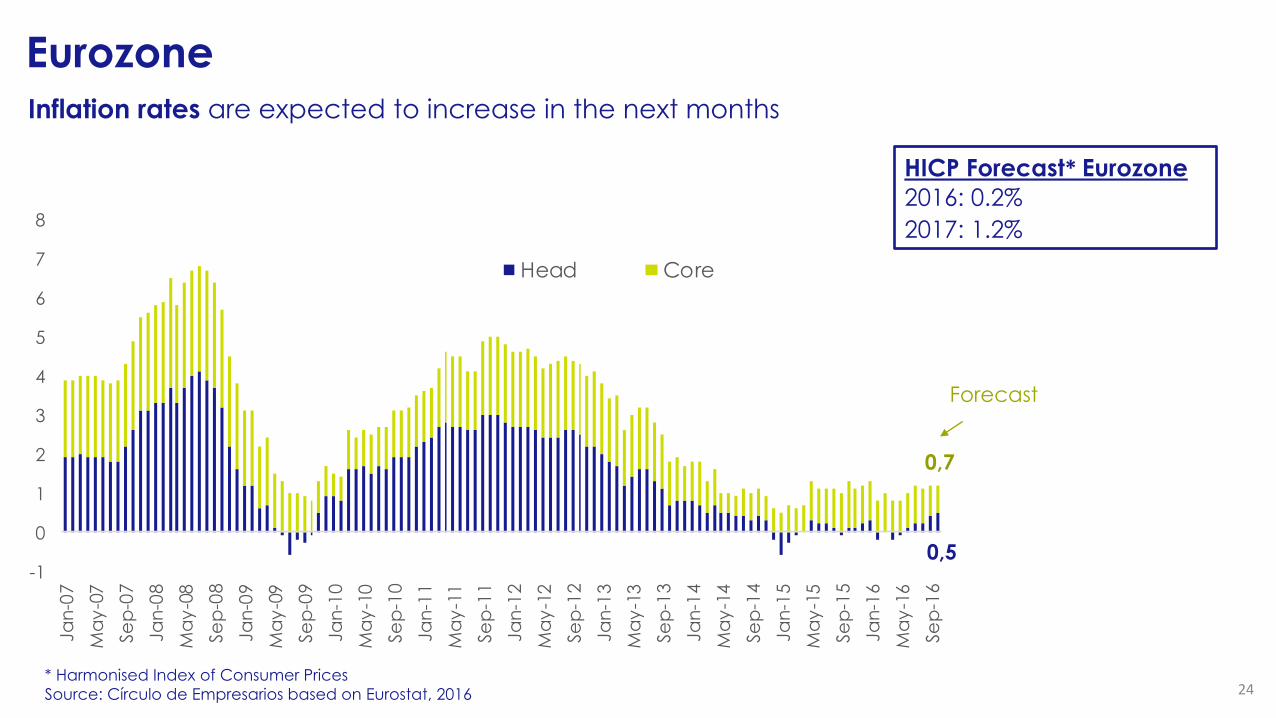
EurozoneInflation rates are expected to increase in the next months
* Harmonised Index of Consumer Prices
Source: Círculo de Empresarios based on Eurostat, 2016
Forecast
HICP Forecast* Eurozone
2016: 0.2%
2017: 1.2%
0,5
0,7
-1
0
1
2
3
4
5
6
7
8
Ja
n-0
7
Ma
y-0
7
Se
p-0
7
Ja
n-0
8
Ma
y-0
8
Se
p-0
8
Ja
n-0
9
Ma
y-0
9
Se
p-0
9
Ja
n-1
0
Ma
y-1
0
Se
p-1
0
Ja
n-1
1
Ma
y-1
1
Se
p-1
1
Ja
n-1
2
Ma
y-1
2
Se
p-1
2
Ja
n-1
3
Ma
y-1
3
Se
p-1
3
Ja
n-1
4
Ma
y-1
4
Se
p-1
4
Ja
n-1
5
Ma
y-1
5
Se
p-1
5
Ja
n-1
6
Ma
y-1
6
Se
p-1
6
Head Core
24

BREXIT
Source: Círculo de Empresarios based on Eurostat, OECD, 2016
Less impact than expected in financial markets but Brexit uncertainty remains
High degree of uncertainty about the exit process will reduce
investment in the next months
Brexit
Since the referendum, the poundplunged 15% and will push inflation up
to 0.7% in 2016 and 2.5% in 2016
BOE cuts
interest rates
to 0.25%
1,15
1,25
1,35
1,45
1,55
1,65
GBP/USD
25

BREXIT2017 GDP growth projections revised downwards
•EuropeanCommission
• BBVA
Research
• OECD• IMF
1,1
(2,2)
1
(2)
1,1
(1.9)
0,4
(1.9)
Source: Círculo de Empresarios based on IMF OECD, BBVA Research, S&P, Fitch, Moody`s, 2016
Note: In brackets pre-Brexit forecast
AA1 (negative)
AA1 (stable)
AA (negative)
AAA (negative)
AA+ (stable)
AA (negative)
Moody`s
S&P
Fitch
Before-Brexit
After Brexit
Ratings agencies credit score%
26

Commodities
Source: Círculo de Empresarios based on World Bank, 2016
World Bank forecasts
2016
43 $
2017
55 $
20
25
30
35
40
45
50
55
Jan-16 Feb-16 Mar-16 Apr-16 May-16 Jun-16 Jul-16 Aug-16 Sep-16 Oct-16 Nov-16
WTI evolution, 2016$
Oil Price increases after OPEC meeting in Algeria*
Upturn to $51 after OPEC agreement (1/3 of global
production) to reduce supply
* Uncertainty over the intention of cutting OPEC production in 1 mbd
27

Commodities
Source: Círculo de Empresarios based on IMF, 2016
Commodity prices evolution2005=100
Gradual increase of commodity prices
50
90
130
170
210
250
290 Total Non-fuel Energy Metals
28

Foreign Exchange market
Source: Círculo de Empresarios a based on Bloomberg, 2016
Change since 2016 against $%
-18,4
-15
-6,9
-4,5
-1,0
0,3
3,5
3,6
12,5
15,0
20,5
Argentine peso
Pound sterling
Turkish lira
Chinese yuan
Indian rupee
Euro
Australian dollar
Canadian dollar
Japanese yen
Russian ruble
Brazilian real
29

8,27,13
4
0,67
-0,06-1,17 -1,21
-2,1
-5
-8
-6
-4
-2
0
2
4
6
8
10
Shanghai
Composite
(China)
Ftse 100 (UK) Nikkei
(Japan)
Dax
(Germany)
Ibex 35
(Spain)
S&P 500 (US) Cac 40
(France)
Eurostoxx 50 FTSE MIB
(Italy)
Financial markets
Source: Círculo de Empresarios based on Bloomberg, 2016
-8,6
After temporary instability due to Brexit, Central Banks cause concern in stock markets
Brexit-3 Nov 2016
30


▼ Oil prices
▼Financial costs
Depreciation of the €
´Expansive fiscal policy
Growth boosts
1
2
3
56
Job creation
▲Exports to EU market
Domestic demand
4
7
32
At a moderate pace...
Remain broadly stable...

Forecasts: the recovery continues…
2017 2018
2.3%
2.1%
Source: Bank of Spain, Sept. 2016
… but at a moderate pace
3.2%
2016
The IMF has revised its forecasts upward for 2016 up to 3.1%
33

Forecasts 2016: composition of growth
GDP annual growth in 2016 = 3.2%
• Private consumption= 3.4%*
• Public consumption = 1%*
• GFCF = 4%*
* % annual change
• Exports = 5.3%*
• Imports = 5.4%*
* % annual change
Domestic demand
0.1 pp
3.1 pp
External demand
contribution to growth
contribution to growth
Source: Círculo de Empresarios, based on Bank of Spain data, Sept. 2016
34
Goods and services
Goods and services

GDP forecasts 2016 by regions% annual change
Galicia
2.7%
Asturias
2.6%
Cantabria
2.5%
Basque C.
2.7%
La Rioja
3.2%
Navarre
2.9%
Aragon
3.4%
Catalonia
3.3%
Valencian C.
3.3%
Murcia
3.4%
Andalusia
2.9%
Balearic I.
3.7%
Canary I.
3.2%
Extremadura
2.8%
Castile and Leon
2.7%
Madrid
3.5%
Castile-La Mancha
3.3%
Source: Círculo de Empresarios, based on BBVA Research, 2016
2.4 – 2.7%
≥ 3.3%
2.8 – 3.2%
Tourism and private consumption
boost growth in Canary Islands,
Balearic Islands, the East region and
Madrid
35

GDP growth
Domestic demand supports growth
Private consumption and investment
lead Spanish recovery
Despite national and internacional
uncertainties, Spain doubles OECD
and Eurozone growth rates
After 5 quarters, the external
demand contribution to growth has
become positive
36
3.2
-8
-6
-4
-2
0
2
4
6
2Q
200
7
3Q
200
7
4Q
200
7
1Q
200
8
2Q
200
8
3Q
200
8
4Q
200
8
1Q
200
9
2Q
200
9
3Q
200
9
4Q
200
9
1Q
201
0
2Q
201
0
3Q
201
0
4Q
201
0
1Q
201
1
2Q
201
1
3Q
201
1
4Q
201
1
1Q
201
2
2Q
201
2
3Q
201
2
4Q
201
2
1Q
201
3
2Q
201
3
3Q
201
3
4Q
201
3
1Q
201
4
2Q
201
4
3Q
201
4
4Q
201
4
1Q
201
5
3Q
201
5
3Q
201
5
4Q
201
5
1Q
201
6
2Q
201
6
3Q
201
6
GDP (annual change) and contribution of domestic and external demand (pp)
Domestic demand
External demand
GDP Spain
GDP Eurozone
GDP OECD
Source: Círculo de Empresarios, based on NSI, Bank of Spain and OECD data, 2016

Productivity and competitiveness
From 2014, low increase in productivity by
employee
37
Spain loses competitiveness in terms of
unit labour costs, converging towards
Eurozone average
0,9
2,9
1,8
1,7
1,5 1,3 0,4 0,3
-6,0
-5,0
-4,0
-3,0
-2,0
-1,0
0,0
1,0
2,0
3,0
4,0
2008 2009 2010 2011 2012 2013 2014 2015
GDP by employee 2008-2015
% annual change
Eurozone
Germany
Spain
Source:OECD, 2016
5,9
1,6
-1,6
-0,9
-2,8
-0,1
-0,9
0,2
-4,0
-2,0
0,0
2,0
4,0
6,0
8,0
2008 2009 2010 2011 2012 2013 2014 2015
Unit labour costs 2008-2015
% annual change
Germany
Eurozone
Spain
Source:OECD, 2016

Labour market
SEPE data – Oct. 2016:
▲ unemployed = 44,685 vs. Sep.
▲ affiliates = 101,335 vs. Sep.
▲ registered contracts = 1,867,360
Unemployment rate in Spain 3Q 2016 = 18.91% (EPA, NSI) vs. eurozone average = 10% (Eurostat)
38
16.393.866
17.813.356
4.763.680
3.764.982
0
1.000.000
2.000.000
3.000.000
4.000.000
5.000.000
6.000.000
16.000.000
16.500.000
17.000.000
17.500.000
18.000.000
18.500.000
19.000.000
19.500.000
20.000.000
2007
2008
2009
2010
2011
2012
2013
2014
2015
Jan
-16
Feb
-16
Ma
r-16
Ap
r-16
Ma
y-16
Jun
-16
Jul-16
Au
g-1
6Se
p-1
6O
ct-
16
Affilia
tes
Evolution of affiliation to Social Security and registered unemployed
Persons
Affiliates
Unemployed
Un
em
plo
ye
d
Source: Círculo de Empresarios based on Ministry of Employment data, Nov. 2016

Duality in the labour market
39
Temporary rate = 27% of dependent
employment (vs. 35% before 2008)
3Q 2016 → 46.7% of new job were permanent (vs.
33.2% in 2015)
154.900
-545.300
350.400
-600.000
-500.000
-400.000
-300.000
-200.000
-100.000
0
100.000
200.000
300.000
400.000
Ma
r-09
Jun
-09
Se
p-0
9
De
c-0
9
Ma
r-10
Jun
-10
Se
p-1
0
De
c-1
0
Ma
r-11
Jun
-11
Se
p-1
1
De
c-1
1
Ma
r-12
Jun
-12
Se
p-1
2
De
c-1
2
Ma
r-13
Jun
-13
Se
p-1
3
De
c-1
3
Ma
r-14
Jun
-14
Se
p-1
4
De
c-1
4
Ma
r-15
Jun
-15
Se
p-1
5
De
c-1
5
Ma
r-16
Jun
-16
Se
p-1
6
Permanent employment
Annual change, number of employees
Source:Círculo de Empresarios, based on NSI data, 2016
32
27
22
23
24
25
26
27
28
29
30
31
32
Ma
r-07
Se
p-0
7
Ma
r-08
Se
p-0
8
Ma
r-09
Se
p-0
9
Ma
r-10
Se
p-1
0
Ma
r-11
Se
p-1
1
Ma
r-12
Se
p-1
2
Ma
r-13
Se
p-1
3
Ma
r-14
Se
p-1
4
Ma
r-15
Se
p-1
5
Ma
r-16
Se
p-1
6
Temporary rate
% of dependent employment
Source: Círculo de Empresarios based on NSI data, 2016

Youth unemployment and NEETs by regions 2016% population between 15-29 years, 4Q 2015
Catalonia35.15%
18.4%
Valencian C.42.53%
18.6%
Murcia44.22%
22.5%Andalusia55.18%
24.1%
Balearic I.27.1%
19.6%
Canary I.51.42%
24.2%
Source: Círculo de Empresarios, based on NSI and Ministry of Employment data, 2016
< 40 %
50 ≥ %
40 – < 50 %
Galicia37.61%
16.4%
Asturias47.02%
17.8%
Cantabria29.32%
14.7%
Basque C.39.73%
12.8%
La Rioja35.48%
17.6%
Navarre32.53%
12.3%
Aragon39.23%
16.6%
Extremadura49.06%
23.3%
Castile and Leon34.14%
15.4%
Madrid37,75%
16%
Castile-La Mancha47.46%
22.4%
SPAIN
Youth unemployment:
41.94%
NEETs: 19.4%
40
Andalusia
Canary I .
Asturias
Extremadura
Castile-La
Mancha
Valencian C.
SPAIN
La Rioja
Murcia
Madrid
Galicia
Navarre
Castile and
Leon
Cantabria
Balearic I .
Aragon
basque C.
Catalonia
10
15
20
25
35 40 45 50 55 60
Youth unemployment and NEETs by regions, 2016
NEETs
%p
op
ula
tio
n 1
5-2
9 y
ea
rs
Youth unemployment
% total unemployment

Prices
In October 2016:
Interannual CPI increases to 0.7%,
mainly because the rise in energy prices
Above the average of the Eurozone
41
0.7 % (Oct)
0.8 % (Sep)
0.5 % (Oct)
-1,5
-1
-0,5
0
0,5
1
1,5
201
6M
10
201
6M
09
201
6M
08
201
6M
07
201
6M
06
201
6M
05
201
6M
04
201
6M
03
201
6M
02
201
6M
01
201
5M
12
201
5M
11
201
5M
10
201
5M
09
201
5M
08
201
5M
07
201
5M
06
201
5M
05
201
5M
04
201
5M
03
201
5M
02
201
5M
01
201
4M
12
201
4M
11
201
4M
10
201
4M
09
201
4M
08
201
4M
07
201
4M
06
General and core inflationAnnual change %
CPI Spain
Core inflation Spain *
CPI Eurozone
* without energy and non-processed food
Source:Círculo de Empresarios, based on NSI and Eurostat data, Oct. 2016

Financial conditions
Credit increases mainly in consumption
and agriculture
Default rate falls down while it is still
high in the construction and
developer sectors
42
Credit and default rate in Spain 2Q 2016
Bn € and %
Balance
2Q 2016
Annual
changeDefault rate
Households (housing) 544 -3,6 4,7
Households (consumption) 121 4,5 8,1
Productive activities 614 -7,2 14
Construction 42 -9,8 29,6
Developer 125 -9,8 26,9
Serv ices 319 -8,7 8,7
Industry 110 -0,2 9,5
Agriculture 19 6,3 9,1
Total* 1.279 -4,6 9,4
Source: CaixaBank based on Bank of Spain data, 2016

Public accounts – revenues, expenditures and balance
AIReF → the target of déficit for 2016 may be achieved = 4.6% of GDP
Estimated balance for 2016:
43
o Central Administration= - 2.2% of GDP
o Social Security = - 1.6% of GDP
o Autonomous Regions = - 0.8% of GDP
o Local units = + 0.4% of GDP
General Administration deficit Jan.-Aug. 2016 (without local units and
financial aid) = 3.3% of GDP
5,14,0
2,9 3,2 3,23,7
4,2 3,8
1,1
-3,6
0,0
-1,0
-2,6-1,7
1,4
3,2
-1,0-0,5 -0,4 -0,4 0,0
1,22,2 2,0
-4,4
-11,0
-9,4 -9,6-10,4
-6,9-5,9
-5,1
30
32
34
36
38
40
42
44
46
48
50
-12
-10
-8
-6
-4
-2
0
2
4
6
2000 2001 2002 2003 2004 2005 2006 2007 2008 2009 2010 2011 2012 2013 2014 2015
Public revenues and expenditures
% GDP GDP growth Balance
Revenues Expenditures
Source: IMF, 2016
-1,5
-1
-0,5
0
0,5
1
Autonomous regions balance, Aug. 2016
% GDP
Source: Círculo de Empresarios based on Ministry of Finance data, 2016

Public and private debt
Public debt goes on increasing, 0.7% since 2Q 2015, above 100% of GDP
Households and companies reduce their debt at a more moderate pace
44
58,054,2
51,347,6
45,342,3
38,935,5
39,4
52,7
60,1
69,5
85,7
95,4100,4
99,8
101,2
101,0
2000200120022003200420052006200720082009201020112012201320142015 1Q
2016
2Q
2016
PPAA debt
%
Source: Bank of Spain, 2016
0
20
40
60
80
100
120
140
160
180
-10
-8
-6
-4
-2
0
2
4
6
8
10
Gross public debt 2Q 2016
% GDP and annual change% GDP 2Q 2016
Annual change
Source: Círculo de Empresarios based on Eurostat data, 2016
300.000
500.000
700.000
900.000
1.100.000
1.300.000
1.500.000
Se
p-0
7D
ec
-07
Ma
r-08
Jun
-08
Se
p-0
8D
ec
-08
Ma
r-09
Jun
-09
Se
p-0
9D
ec
-09
Ma
r-10
Jun
-10
Se
p-1
0D
ec
-10
Ma
r-11
Jun
-11
Se
p-1
1D
ec
-11
Ma
r-12
Jun
-12
Se
p-1
2D
ec
-12
Ma
r-13
Jun
-13
Se
p-1
3D
ec
-13
Ma
r-14
Jun
-14
Se
p-1
4D
ec
-14
Ma
r-15
Jun
-15
Se
p-1
5D
ec
-15
Ma
r-16
Jun
-16
Se
p-1
6
Non-financial sectors debtMillions of € PPAA
Non-financial companies
Households
Source:Bank of Spain, Nov. 2016

Exports of goods
January – August 2016 (annual change)
▲ 1.3% (167,053.6 M€)
Imports of goods ▼ -1.6% (178,049.9 M€)
Trade balance ▼ 31.6% del DEFICIT (-10,996.3 M€)
▼ 42.4% in energy deficit
Geographical distribution (%)TO
P 3
SEC
TOR
S
Exp
ort
sIm
po
rts
Source: Círculo de Empresarios, based on Ministry of Economy, Oct. 2016
External sector
45
Exportaciones % / total Importaciones % / total
Bienes de equipo 20,2 Bienes de equipo 21,6
Automóvil 17,9 Productos químicos 16
Alimentación, bebidas y
tabaco17,1 Automóvil 14
-94.159,9-24.173,9 -10.996,3
-100.000
-50.000
0
50.000
100.000
150.000
200.000
250.000
300.000
Evolución exportaciones, importaciones y saldo comercialMillones €
Exportaciones
Importaciones
Saldo
EUROPE72
EU
66,3
AMERICA10,5
ASIA9,4
AFRICA6,3
OTHER1,8
Exports
EUROPE62,6
EU
56,9
ASIA19,7
China8,8
AMERICA10,1
AFRICA7,3
OTHER0,3
Importaciones

Interet rates and risk premium
Brexit → German bond in negative values
Risk Premium has recovered to 2015 March levels
46
0
20
40
60
80
100
120
140
160
180
-0,5
0
0,5
1
1,5
2
2,5
3
3,5
Ten years bond yield. Spain adn Germany (%)Risk premium (bp)
Spain
Germany
Risk premium
Source: Círculo de Empresarios based on Bank of Spain data, 2016
Risk premiumInterest rate

Enterprise creation
Enterprise creation rate 2007 - 2Q
2016:
In Spain it remains below pre-crisis
rates at 28.5%.
In the United Kingdom, it has
increased by 31%.
47
-40
-30
-20
-10
0
10
20
30
40
Enterprise creation. Difference between 2007-2016
%
Source: OECD, 2016

Ibex 35
48
7.500
7.700
7.900
8.100
8.300
8.500
8.700
8.900
9.100
9.300
Source: Investing, 2016
Brexit
(23 Jun)
Elections USA
↑ Trump
(1 Nov)
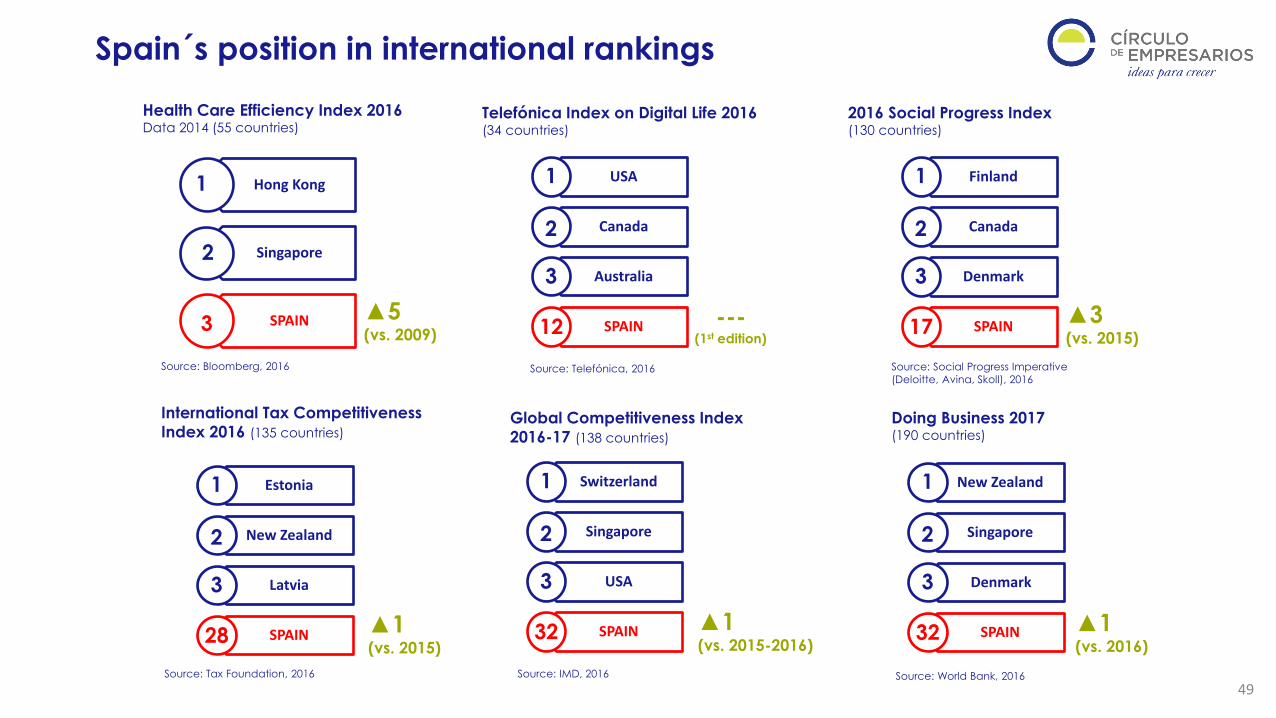
Spain´s position in international rankings
Finland
Canada
Denmark
SPAIN
49
Hong Kong
Singapore
SPAIN
1
2
3
Health Care Efficiency Index 2016 Data 2014 (55 countries)
Source: Bloomberg, 2016
▲5(vs. 2009)
USA
Canada
Australia
SPAIN
1
2
3
12
Telefónica Index on Digital Life 2016 (34 countries)
Source: Telefónica, 2016
---(1st edition)
1
2
3
17
2016 Social Progress Index(130 countries)
Source: Social Progress Imperative
(Deloitte, Avina, Skoll), 2016
▲3(vs. 2015)
Estonia
New Zealand
Latvia
SPAIN
1
2
3
28
International Tax Competitiveness
Index 2016 (135 countries)
Source: Tax Foundation, 2016
▲1(vs. 2015)
Switzerland
Singapore
USA
SPAIN
1
2
3
32
Global Competitiveness Index
2016-17 (138 countries)
Source: IMD, 2016
▲1(vs. 2015-2016)
New Zealand
Singapore
Denmark
SPAIN
1
2
3
32
Doing Business 2017 (190 countries)
Source: World Bank, 2016
▲1(vs. 2016)

www.circulodeempresarios.org