Quarterly Report on - isec.ac.in · Acknowledgement i list of figures iii 1 ... Vermi-compost and...
68
Agro-Economic Research Centre Agricultural Development and Rural Transformation Centre INSTITUTE FOR SOCIAL AND ECONOMIC CHANGE Bengaluru - 560 072 Quarterly Report on INDICATORS OF AGRICULTURE October – December 2017 Report for Department of Agriculture, Cooperation and Farmers Welfare, Ministry of Agriculture and Farmers Welfare, Government of India, New Delhi
Transcript of Quarterly Report on - isec.ac.in · Acknowledgement i list of figures iii 1 ... Vermi-compost and...

Agro-Economic Research Centre
Agricultural Development and Rural Transformation Centre
InsTITuTE foR soCIAl AnD EConomIC ChAngEBengaluru - 560 072
Quarterly Report on
INDICATORS OF AGRICULTURE
October – December 2017
Report for Department of Agriculture, Cooperation and Farmers Welfare, Ministry of Agriculture and Farmers Welfare,
Government of India, New Delhi
Copyright © 2017
Disclaimer
IsEC and moA & fW, govt. of India, new Delhi does not make any warranty, either express or implied, or
assumes any legal liability or responsibility for the accuracy, completeness, or any third party’s use or the
results of such use of any information, apparatus, product, or process disclosed of the information contained
herein or represents that its use would not infringe privately owned rights. The views and opinions of the
author expressed herein do not necessarily state or reflect those of the ISEC. While every effort has been made
to ensure the correctness of data/information used in this report, neither the author nor IsEC nd moA & fW,
govt. of India, new Delhi accept any legal liability for the accuracy or inferences drawn from the material
contained therein or for any consequences arising from the use of this material.
Text from this report can be quoted provided the source is acknowledged.
Contact:
Dr. A.V. manjunatha, Ph.D. in Agricultural Economics (Justus liebig university, germany) Assistant ProfessorAgricultural Development and Rural Transformation Centre (ADRTC)Institute for social and Economic Change, Bengaluru - 560 072Ph: +91-80-23397689 (o), +91 9448402848 (mobile)Email: [email protected]; [email protected]
Design by: dataworx, Bengaluru - Website: www.dataworx.co.in

Report for
Department of Agriculture, Cooperation and Farmers Welfare, Ministry of Agriculture and Farmers Welfare,
Government of India, New Delhi
Agro-Economic Research Centre
Agricultural Development and Rural Transformation Centre
InsTITuTE foR soCIAl AnD EConomIC ChAngEBengaluru - 560 072
october - December 2017
Quarterly Report on
INDICATORS OF AGRICULTURE

Quarterly Report on Indicators of Agriculture october-December 2017

i
Acknowledgement
The ministry of Agriculture and farmers Welfare, government of India
and national Institution for Transformation of India, intend to know
the agriculture situation in different states using selected agricultural
indicators. Thirteen Agro-Economic Research Centres spread across
the Country are assigned to collect the information on important
agricultural indicators for the state under their jurisdiction on quarterly
basis and submit the data to the Agricultural Development and Rural
Transformation Centre, IsEC, Bengaluru. The Centre will be preparing a
consolidated report for all the major states in the country and submit the
report for every quarter for taking immediate policy decisions. We are
grateful to the ministry of Agriculture and farmers Welfare, government
of India, New Delhi for reposing confidence in the ADRT Centre, ISEC for
assigning this task.
We are grateful to Prof. m.g. Chandrakanth, Director, Institute for social
and Economic Change, Bangalore, for his encouragement to this work.
We thank mrs. Prema Kumari for being involved in the consolidation
of this report. We also thank our colleagues from various AERCs for
compiling the data from various sources of the respective state under
their jurisdiction and submitting the same to facilitate consolidation of
the quarterly report on indicators of agriculture for the period, october
to December 2017.
A.V. manjunathaAssistant Professor
Quarterly Report on Indicators of Agricultureoctober-December 2017

April-June 2017Quarterly Report on Indicators of Agriculture
Table of Contents
Sl.No. Particulars Page No.
Acknowledgement i
list of figures iii
1 Average Rainfall 1
2 Percentage of Deficit Rainfall Districts 3
3 Area Covered under major Crops 3
4 Incidence of major Pests and Diseases in Principal Crops sown 5
5 farm output Prices of major Crops 5
6 seed Availability in the local market for major Crops 5
7 Prevailing market Price of seeds of major Crops 6
8 Chemical fertilizer (nPK) Availability in the local market 7
9 Prevailing market Prices of fertilizers 7
10 Availability of Agricultural labour 7
11 Prevailing Wage Rate for Casual labour in Agriculture 7
12 Availability of Institutional Credit for Agriculture in the state 8
13 Electricity Availability for Irrigation Pump sets 8
14 Availability of farm machinery for Timely sowing, harvesting and other operations 10
15 Availability of organic manure, farm-Yard-manure, Vermi-compost and Bio-fertilizers 10
Filled in Questionnaires of Different States 11-58
ii
october-December 2017

october-December 2017
iii
Quarterly Report on Indicators of Agriculture
Figure No. Title of the Figure Page No.
1 state-wise distribution of actual and normal rainfall which have received rainfall in excess of the normal 2
2 state-wise distribution of actual and normal rainfall which have received rainfall less than normal 2
3 Deficit rainfall districts as per cent to total districts of state 3
4 Area covered under major crops in 4th quarter of last 6 years as per cent to targeted area 4
5 state-wise area covered under major crops as per cent to targeted area 4
6 Area covered under different crop categories (lakh hectares) 5
7 Prevailing market price of fertilizer (Rs. per kg.) 7
8 Prevailing wage rate for casual labours in agriculture (Rs. per day) 8
9 Availability of Institutional Credit for Agriculture in the state 10
List of Figures

iv
october-December 2017Quarterly Report on Indicators of Agriculture

1
Quarterly Report on Indicators of AgricultureApril-June 2017 Quarterly Report on Indicators of Agriculture
Agriculture plays a vital role in India’s economy.
nearly 55 per cent of the population is
engaged in agriculture and allied activities
(Census 2011). As per the Provisional Estimates
released by Cso on 31st may 2016, the Agriculture
and Allied sector contributed 17 per cent of gross
Value Added (gVA) at current prices during 2015-16.
There has been a continuous decline in the share of
Agriculture and Allied sector in the gVA from 18.2 per
cent in 2012-13 to 17 per cent in 2015-16 at current
prices. falling share of Agriculture and Allied sector
in gVA is an expected outcome in a fast growing and
structurally changing economy. The Agriculture and
Allied sector witnessed a growth of 1.5 per cent in
2012- 13, 4.2 per cent in 2013-14, -0.2 per cent in
2014-15 and 1.2 per cent in 2015-16 at 2011-12 basic
prices. Total food grains production in the country is
estimated at 252.22 million tonnes in 2015-16 which
is marginally higher by 0.20 million tonnes than the
previous year’s food grains production of 252.02
million tonnes. Production of pulses estimated at
16.47 million tonnes is lower by 0.68 million tonnes
than the previous year’s pulses production (Central
Statistics Office, Ministry of Statistics and Programme
Implementation, govt. of India, Annual Report, DAC
& fW, 2016-17).
national Institution for Transformation of India
(nITI), government of India entrusted Agricultural
Development and Rural Transformation Centre
(ADRTC), Institute for social and Economic
Change (IsEC), Bangalore, to undertake a study on
“Indicators of Agriculture”. This report is compiled
from data furnished by Agro-Economic Research
Centers (AERCs) located across India. The most
of the data on agricultural indicators pertains to
the period, october to December 2017. The basic
data regarding agricultural indicators received
from twenty-three states, namely Andhra Pradesh,
Arunachal Pradesh, Assam, Bihar, Chhattisgarh,
gujarat, haryana, himachal Pradesh, Jharkhand,
Karnataka, madhya Pradesh, manipur, meghalaya,
mizoram, nagaland, odisha, Punjab, Rajasthan,
Tamil nadu, Tripura, uttarakhand, uttar Pradesh and
West Bengal. fifteen agriculture related indicators
were covered for the study which are as under:
1. Average Rainfall
2. Number of deficit rainfall districts
3. Area covered under major crops
4. Incidence of major pests and diseases in principal crops
5. farm output prices of major crops
6. seed availability in the local market for major crops
7. Prevailing market price of seed of major crops
8. Chemical fertilizer (nPK) availability in the local market
9. Prevailing market price of fertilizers
10. Availability of agricultural labour
11. Prevailing wage rate for casual labour in agriculture
12. Availability of institutional credit for agriculture
13. Electricity availability for irrigation pump sets
14. Availability of farm machinery for timely sowing, harvesting and other operations
15. Availability of organic manure, farmyard manure, vermi-compost and bio-fertilizers
1. Average Rainfall
The overall rainfall status for 4th quarter of 2017 for
21 states indicated that three states have received
rainfall in excess of their normal rainfall and the
remaining 18 states received rainfall lower than their
normal rainfall. The excess rainfall was reported
mainly in West Bengal, odisha and Jharkhand. West
Bengal and Jharkhand have received lesser rainfall
than the normal during the corresponding quarter
october-December 2017

2
Quarterly Report on Indicators of Agriculture October-December 2017
of the previous year. All the north-Eastern states
of the country had rainfall lesser than the normal.
All the southern states, like Karnataka, Andhra
Pradesh and Tamil nadu had received rainfall lesser
than the normal. The comparative figures for actual
and normal rainfall of different states are depicted
in Figure 1 and Figure 2 for those states which
received higher rainfall than the normal and for
those states which received lower rainfall than the
normal, respectively. Among the states that have
received excess rainfall, West Bengal had recorded
excess rainfall than the normal to the tune of 61 per
cent. This is followed by odisha (43%) and Jharkhand
(16%).
Figure 1: State-wise distribution of actual and normal rainfall which have received rainfall in excess of the normal
Figure 2: State-wise distribution of actual and normal rainfall which have received rainfall less than normal
Note: Data for Rajasthan, Gujarat, Haryana and Uttarakhand pertains to 1st Oct 2017 to 27th Dec 2017; Data was not received from Punjab and Uttar Pradesh for Average rainfall.
0
50
100
150
200
250
300
350
400
450 399.
0
177.
5 230.
6
148.
7
133.
5
137.
7
163.
0
140.
4
108.
2
118.
6
55.2
21.3 61
.8
49.6
17.5
15.1
5.6
2.6
438.
5
296.
0
256.
0
203.
7
192.
1
192.
0
188.
0
168.
5
164.
5
161.
8
98.9
84.7
78.0
77.5
54.8
31.8
27.5
17.4
Rain
fall
in m
m
Actual Rainfall normal Rainfall
0
200
400
600
800
1000
1200
1400
1600
West Bengal odisha Jharkhand
1415.7
215.5106.4
881.8
150.70 91.6
Rain
fall
in m
m
Actual Rainfall normal Rainfall

3
Quarterly Report on Indicators of AgricultureOctober-December 2017
2.Percentage of Deficit Rainfall Districts
The rainfall data received for 21 states covering 458 districts. Around 55 per cent of these districts have not received sufficient rainfall, and hence they have been classified as districts with deficit rainfall. The situation in this quarter is also similar as compared to the same quarter of the previous year 2016, which reported 45 per cent of the districts as deficit. All the districts of haryana, Rajasthan and uttarakhand have received deficit rainfall. Around 82 per cent and 81 per cent of districts in nagaland and Assam had received deficit rainfall, respectively. One district of Himachal Pradesh had received deficit rainfall. The deficit rainfall was observed in the districts of Jharkhand (38 per cent), odisha (13 per cent) and West Bengal (11 per cent), respectively. This is despite the states Jharkhand (16 per cent), odisha (43 per cent) and West Bengal (61 per cent) has received excess rainfall than the normal. Deficit rainfall was reported in 3 districts each of gujarat and Tripura and 4 districts each of odisha and meghalaya. however, the rainfall received in these four states was in deficit as compared to the normal rainfall. Around 75 per cent of districts each
of Arunachal Pradesh and Tripura and 74 per cent of districts of Bihar had received deficit rainfall. haryana, Rajasthan, uttarakhand, nagaland and Assam had higher rainfall deficit as compared to the remaining states. The per cent of districts with deficit rainfall for 21 states is represented in
Figure 3 in the descending order.
3. Area Covered under Major Crops
The proportion of actual area covered under different crops as against their targeted area is taken as the basis for measuring inter-quarter performance of each state on this indicator. As per the data provided by 23 states on targeted and actual area, 58 million hectares was the actual area covered out of the targeted area of 66 million hectares. Thus, the achievement was 88 per cent of the targeted area covered by major crops. The per cent achievement as against the target has decreased from corresponding quarter of previous year to current year, which can be clearly seen in Figure 4. few states of north eastern India had not provided data for last three years. This was another reason for variations in overall per cent in achievement.
Figure 3: Deficit rainfall districts as per cent to total districts of state
Note: Data for Rajasthan, Gujarat, Haryana and Uttarakhand pertains to 1st Oct 2017 to 27th Dec 2017; Data was not received from Punjab and Uttar Pradesh for Number of districts received deficit rainfall.
0
10
20
30
40
50
60
70
80
90
100
100.
0
100.
0
100.
0
81.8
81.5
75.0
75.0
73.7
66.7
66.7
62.5
57.1
53.8
46.9
40.0
37.5
25.9
13.3
10.5
9.1
8.3
0.0
0.0
Per c
ent

4
Quarterly Report on Indicators of Agriculture October-December 2017
The performance of states on the basis of per cent achievement to targeted area within this quarter is presented in Figure 5. It can be clearly seen from the figure that Gujarat, Karnataka and Punjab have exceeded the targeted area. haryana, himachal Pradesh, uttarakhand, Tamil nadu, uttar Pradesh and Bihar have crossed 90 per cent of the targeted
area. This higher achievement to target percentage was mainly due to the state and central government programmes.
Among crop categories, cereals are major, which covered 63 per cent of the total area. Area under Wheat was the highest not only under cereals but
Figure 4: Area covered under major crops in 4th quarter of last 6 years as per cent to targeted area
Figure 5: State-wise area covered under major crops as per cent to targeted area
Note: Haryana and Uttarakhand data pertains to 28th Dec 2017; Madhya Pradesh data pertains to 25th Dec 2017; Rajasthan data pertains to 18th Dec 2017; Chhattisgarh data pertains to 25th Dec 2017;
Gujarat data pertains to 1st Jan 2018; Punjab data pertains to 2017-18.
0
20
40
60
80
100
Quarter 4of 2012
Quarter 4 of 2013
Quarter 4of 2014
Quarter 4of 2015
Quarter 4of 2016
Quarter 4of 2017
78.79
96.9390.22 87.66 89.30 87.70
0
20
40
60
80
100
120
140
122.
28
100.
72
100.
41
98.2
2
98.0
9
96.9
3
95.9
5
94.6
3
91.6
7
89.6
8
89.1
8
88.4
0
85.2
2
83.7
7
81.2
5
75.3
4
70.9
6
69.6
4
68.2
0
65.6
8
58.5
1
45.9
0
39.8
7
Per
cent

5
Quarterly Report on Indicators of AgricultureOctober-December 2017
among all crops. It accounts for 73 per cent of area under cereals and 46 per cent of total area under major crops. Paddy was another cereal crop which covered 22 per cent of area under cereals and 13 per cent of total area under major crops. maize was another cereal crop which claimed 2 per cent of area under cereals and 2 per cent of total area under major crops.
Among the pulses, area under gram was the highest which accounts for 56 per cent of area under pulses and 11 per cent of total area under major crops. The share of pulses and oil seeds in the total area covered under major crops was 20 per cent and 10 per cent, respectively. Red gram, lentil, Cowpea, Chickpea, green gram and Black gram were the main pulse crops. other crop categories include vegetables and cash crops (sugarcane, jute, tobacco and cotton). These crops accounts for 8 per cent of the total area covered. The area covered under cereals, pulses, oilseeds and other crops is given in Figure 6.
4. Incidence of Major Pests and Diseases in Principal Crops Sown
The incidence of major pests and diseases in principal crops were found to be moderate in Assam, Arunachal Pradesh, manipur, meghalaya, mizoram,
nagaland and Tripura. The incidence of pests and diseases was relatively lower in Bihar, gujarat, haryana, Jharkhand, Karnataka, odisha, Punjab, Tamil nadu, uttarakhand, uttar Pradesh and West Bengal. no attack of pests and diseases was reported in Chhattisgarh, himachal Pradesh, madhya Pradesh and Rajasthan.
5. Farm Output Prices of Major Crops
Farm output prices of major crops across different states have shown wide variations. Price of paddy was highest in Bihar (Rs.3000/qtl) and lowest in Assam (Rs.1250/qtl). The price of Wheat varied between Rs.1500/qtl in Bihar and Rs.3200/qtl in Chhattisgarh. The price of maize varied between Rs.950/qtl in Jharkhand and Rs.1463/qtl in gujarat. The prices varied depending upon the type of produce (local or hYV), quality and time of sale.
6. Seed Availability in the Local Market for Major Crops
The shortage of seeds has been reported in Assam, Arunachal Pradesh, manipur, meghalaya, mizoram, nagaland, Tripura and uttarakhand, whereas no shortage was reported in Andhra Pradesh, Bihar, Chhattisgarh, gujarat, haryana, himachal Pradesh, Jharkhand,
Figure 6: Area covered under different crop categories (lakh hectares)
oilseeds, 58.77

6
Quarterly Report on Indicators of Agriculture October-December 2017
Karnataka, madhya Pradesh, odisha, Punjab, Rajasthan, Tamil nadu, uttar Pradesh and West Bengal.
7. Prevailing Market Price of Seeds of Major Crops
The prevailing market prices of seeds of major crops
during the period october 2017 to December 2017
is presented in Table 1. The prices depended on
the type of seed (i.e. hybrid or hYV) and source of
purchase (i.e. open market or from departments
with subsidy). Price of paddy seeds per kilogram
ranged between Rs.16 in odisha and Rs.250 in
Assam, nagaland and Tripura. While the price of
maize ranged between Rs.9 in Jharkhand and Rs.450
in Bihar. The price of Wheat ranged between Rs.16
in himachal Pradesh and Rs.45 in Rajasthan.
States Paddy Maize Wheat
Andhra Pradesh 34 270 -
Arunachal Pradesh 35-220 30-70 -
Assam34-200 (Winter Paddy)
50-250 (summer Paddy)- -
Bihar - 450 (hybrid) 21
Chhattisgarh - - 30
gujarat - 20-30
haryana - - 25-30
himachal Pradesh - - 16
Jharkhand - 9 20
Karnataka 34 100 -
madhya Pradesh - - 18-33
manipur 30-225 26-50 -
meghalaya 30-230 28-55 -
mizoram 30-240 29-65 -
nagaland 30-250 30-65 -
odisha 16 60 -
Punjab - - 30
Rajasthan - - 19-45
Tamil nadu 31 - -
Tripura 30-250 30-70 -
uttar Pradesh - - 32-36
uttarakhand - - 25-30
West Bengal 36 - 27
Table 1: Market Prices of Seeds of Major Crops (Rs. /kg)

7
Quarterly Report on Indicators of AgricultureOctober-December 2017
8. Chemical Fertilizer (NPK) Availability in the Local Market
supply of chemical fertilizers (urea, ssP and DAP) was adequate in Andhra Pradesh, Bihar, Chhattisgarh, gujarat, haryana, himachal Pradesh, Jharkhand, Karnataka, madhya Pradesh, odisha, Punjab, Rajasthan, Tamil nadu, uttarakhand, uttar Pradesh and West Bengal, whereas it is inadequate in Assam, Arunachal Pradesh, manipur, meghalaya, mizoram, nagaland and Tripura (except Urea). It is quite significant to note that no deficit of Urea was reported because of the mandatory policy of supply of neem coated urea to the farmers by the Central government.
9. Prevailing Market Prices of Fertilizers
Prevailing market price of fertilizers are given in figure 7. The prices of fertilizers are relatively higher in uttarakhand (urea - Rs.11/kg and DAP - Rs.33.50/kg) and Jharkhand (ssP - Rs.17/kg). The prices of urea (nitrogenous fertilizer) ranged from Rs.5.80/kg in Karnataka to Rs.11/kg in uttarakhand. similarly, prices
of DAP varied between Rs.20/kg in nagaland and Rs.33.50/kg in uttarakhand. The prices of ssP varied between Rs.5.83/kg in madhya Pradesh and Rs.17/kg in Jharkhand.
10. Availability of Agricultural Labour
The access to agricultural labour was better in Andhra Pradesh, Chhattisgarh, himachal Pradesh and madhya Pradesh, whereas it is shortage in Assam, Arunachal Pradesh, Bihar, gujarat, haryana, Jharkhand, Karnataka, manipur, meghalaya, mizoram, nagaland, odisha, Punjab, Rajasthan, Tamil nadu, Tripura, uttarakhand, uttar Pradesh and West Bengal.
11. Prevailing Wage Rate for Casual Labour in Agriculture
Prevailing wage rate for casual labour in agriculture is presented in Figure 8. It is noticed from the figure that male and female labour had received same wage rates in Chhattisgarh, himachal Pradesh, Karnataka, odisha and West Bengal. In the remaining states, the wage
Figure 7: Prevailing market price of fertilizer
Note: Data was not received from Punjab and Bihar for the SSP
0
5
10
15
20
25
30
35
Rs.
Per
Kg
urea DAP ssP

8
Quarterly Report on Indicators of Agriculture October-December 2017
rates of males were relatively higher than the females. overall, there was variation in wage rates among most of the states. for instance, the wage rate was Rs.325/day in Chhattisgarh, Rs.269/day in Karnataka, Rs.240/day each in himachal Pradesh and West Bengal and Rs.230/day in odisha for both male and female, respectively. The highest wage rate was Rs.375/day in haryana for male and Rs.325/day in Chhattisgarh and haryana states for female.
12. Availability of Institutional Credit for Agriculture in the State
Targets will be fixed annually for the credit disbursement to agricultural sector in India. Eighteen states have provided the information regarding target and achievement of institutional agricultural credit (Figure 9). It was found that Tamil nadu achieved 96 per cent of the target
flow of institutional credit to agriculture. The achievement was 86 per cent, 82 per cent, 70 per cent, 55 per cent and 51 per cent of the target in Chhattisgarh, Punjab, himachal Pradesh, Bihar and Karnataka, respectively. The remaining states like Tripura, Andhra Pradesh, Arunachal Pradesh, odisha, Jharkhand, uttar Pradesh, West Bengal, nagaland, madhya Pradesh, Assam, mizoram and meghalaya achieved less than 50 per cent of the targeted flow of agricultural credit. The institutional credit for agriculture in the states is given in the Table 2.
13. Electricity Availability for Irrigation Pump sets
Availability of electricity for agricultural purposes in thirteen states showed that the electricity was available for 24 hrs in Chhattisgarh and Tamil nadu, 15 to 20 hrs in uttar Pradesh, 10 to 12 hrs in haryana
Figure 8: Prevailing wage rate for casual labour in agriculture
Note: Data was not received from Andhra Pradesh for wage rate of male and female and
Punjab for wage rate of female
0
50
100
150
200
250
300
350
400
Rs.
Per
Day
Wage Rate male Wage Rate female

9
Quarterly Report on Indicators of AgricultureOctober-December 2017
and uttarakhand, 8 to 10 hrs in Bihar, 8 to 9 hours in Jharkhand, 8 hrs gujarat and madhya Pradesh, 7 hrs in Andhra Pradesh, 6-8 hrs Punjab, 5 to 7 hrs in
Rajasthan and 4 hrs in Karnataka. on an average, the availability of electricity for irrigation pumps was about 11 hours per day.
Table 2: Availability of Institutional Credit for Agriculture in the State (Rs. in crore)
states Target Achievement Per cent
Tamil nadu* 55870.01 53413.24 95.60
Chhattisgarh** 3800.00 3268.91 86.02
Punjab*** 28779.00 23651.00 82.18
himachal Pradesh 4158.54 2920.31 70.22
Bihar 49000.00 26950.00 55.00
Karnataka* 86690.10 44023.78 50.78
Tripura 2117.11 1057.33 49.94
Andhra Pradesh 36552.04 16629.84 45.50
Arunachal Pradesh 52.22 20.69 39.62
odisha 31208.41 11851.46 37.98
Jharkhand 7682.38 2690.00 35.02
uttar Pradesh 62416.32 19372.74 31.04
West Bengal 59097.77 17866.00 30.23
nagaland 384.70 96.98 25.21
madhya Pradesh** 94868.00 22451.00 23.67
Assam 12846.51 2826.82 22.00
mizoram 436.75 90.36 20.69
meghalaya 2219.24 349.55 15.75
Note: * Data pertains to Quarter ended Sep 2017-18;
** As on 18.09.2017 (source: SLBC, Madhya Pradesh);
*** Data pertains up to June of financial year 2017-18 (Source: 141th meeting, State level Bankers Committee, Punjab).

10
Quarterly Report on Indicators of Agriculture October-December 2017
14. Availability of Farm Machinery for Timely Sowing, Harvesting and Other Operations
farm machinery was easily available in Andhra Pradesh, Chhattisgarh, gujarat, haryana, himachal Pradesh, Karnataka, madhya Pradesh, odisha, Punjab, Rajasthan, Tamil nadu and uttar Pradesh for timely sowing, harvesting and other operations, whereas it is shortage in Assam, Arunachal Pradesh, Bihar, Jharkhand, manipur, meghalaya, mizoram, nagaland, Tripura, uttarakhand and West Bengal.
15. Availability of Organic Manure, Farm-Yard-Manure, Vermi-compost and Bio-fertilizers
The availability of organic manure, farmyard manure, vermi-compost and bio-fertilizers was adequate in Bihar, gujarat, Jharkhand, Karnataka, odisha, uttar Pradesh and West Bengal, whereas it is shortage in Andhra Pradesh, Assam, Arunachal
Pradesh, Chhattisgarh, haryana, himachal Pradesh, madhya Pradesh, manipur, meghalaya, mizoram, nagaland, Punjab, Rajasthan, Tamil nadu, Tripura and uttarakhand
Figure 9: Availability of Institutional Credit for Agriculture in the State
0
20000
40000
60000
80000
100000
Rs.
in C
rore
Institutional Credit Target (Rs. in crore)Institutional Credit Achievement (Rs. in crore)

11
Quarterly Report on Indicators of AgricultureOctober-December 2017
Filled-in Questionnaires of
AERCs for different States

12
Quarterly Report on Indicators of Agriculture October-December 2017
Agro-Economics Research Centre, University of Delhi, Delhi-110007
name of AERC: Delhi state: Haryana Quarter Covered: Oct - Dec 2017
Sl.No. Indicators Current status
1 Average Rainfall (mm)
(01.10.17 to 27.12.17)
Actual normal
5.6 27.5
2 Number of districts received deficit rainfall in the state (Above mentioned period)
No. of districts with deficit rainfall Total number of districts
21
All the districts21
3 Area covered under major crops in Rabi season
As on 28.12.2017
sl. no.
name of the cropActual area (lakh ha)
Targeted area (lakh ha)
1 Wheat 24.78 25.23
2 gram 0.53 NA
3 mustard 5.86 NA
4 Incidence of major pests and Diseases in principal crops (√)
sl. no.
name of the Crop
severe moderate low not at all
1 Wheat √
2 gram √
3 mustard √
5 farm output price of major crops sl. no.
name of the crop Price (Rs. per quintal)
1 Wheat 1650-1750
2 gram 4400-5200
3 mustard 4000-4200
6 seed availability in the local market for major crops (√)
sl. no.
name of the crop Adequate shortage not available
1 Wheat √
2 gram √
3 mustard √
7 Prevailing market price of seed (certified) of major crops
sl.no. name of the crop Price (Rs. per kgs)
1 Wheat 25-30
2 gram 85-100
3 mustard 75-85
8 Chemical fertilizer( nPK) availability in the local market (√)
Details Adequate shortage not available
urea √
DAP √
ssP √

13
Quarterly Report on Indicators of AgricultureOctober-December 2017
9 Prevailing market price of fertilizer Details Price (Rs. per Kg.)
urea 9 – 10
DAP 28 – 30
ssP 10 – 12
10 Availability of agricultural labour (√) Easily available shortage not available
√
11 Prevailing wage rate for casual labour in agriculture (Rs./day)
male female
350 - 400 300-350
12 Availability of institutional credit for agriculture in the state
Target (Rs. crore) Achievement (Rs. crore)
NA NA
13 Electricity availability for irrigation pump sets (number of hours per day)
10 - 12
14 Availability of farm machinery for timely sowing, harvesting and other operations (√)
Easily available shortage not available
√
15 Availability of organic manure, farm-yard-manure, vermi-compost, bio-fertilizer (√)
Adequate shortage not available
√
Remarks and observations
NA implies Not Available

14
Quarterly Report on Indicators of Agriculture October-December 2017
Agro-Economics Research Centre, University of Delhi, Delhi-110007
name of AERC: Delhi state: Uttarakhand Quarter Covered: Oct - Dec 2017
Sl.No. Indicators Current status
1 AAverage Rainfall (mm)
(01.10.17 to 27.12.17)
Actual normal
21.3 84.7
2 Number of districts received deficit rainfall in the state (Above mentioned period)
No. of districts with deficit rainfall Total number of districts
13 All the districts 13
3 Area covered under major crops in Rabi season
As on 28.12.2017
sl. no.
name of the cropActual area (lakh ha)
Targeted area (lakh ha)
1 Wheat 3.47 3.58
4 Incidence of major pests and Diseases in principal crops (√)
sl. no.
name of the Crop
severe moderate low not at all
1 Wheat √
2 mustard √
3 sugarcane √
4 Potato √
5 farm output price of major crops sl. no.
name of the crop Price (Rs. per quintal)
1 Wheat 1750-1800
2 mustard 4000-4200
6 seed availability in the local market for major crops (√)
sl. no.
name of the crop Adequate shortage not available
1 Wheat √
2 mustard √
7 Prevailing market price of seed (certified) of major crops
sl.no. name of the crop Price (Rs. per Kgs)
1 Wheat 25 –30
2 mustard 85 – 90
8 Chemical fertilizer (nPK) availability in the local market (√)
Details Adequate shortage not available
urea √
DAP √
ssP √
9 Prevailing market price of fertilizer Details Price (Rs. per kg)
urea 10 – 12
DAP 32 – 35
ssP 12 – 13
10 Availability of agricultural labour (√) Easily available shortage not available
√

15
Quarterly Report on Indicators of AgricultureOctober-December 2017
11 Prevailing wage rate for casual labour in agriculture (Rs./day)
male female
300 - 350 250 - 300
12 Availability of institutional credit for agriculture in the state
Target (Rs. crore) Achievement (Rs. crore)
NA NA
13 Electricity availability for irrigation pump sets (number of hours per day)
10 - 12
14 Availability of farm machinery for timely sowing, harvesting and other operations (√)
Easily available shortage not available
√
15 Availability of organic manure, farm-yard-manure, vermi-compost, bio-fertilizer (√)
Adequate shortage not available
√
Remarks and observations
NA implies Not Available

16
Quarterly Report on Indicators of Agriculture October-December 2017
Agro-Economic Research Centre, Vallabh Vidyanagar, Gujarat
name of AERC: VV Nagar state: Gujarat Quarter Covered: Oct - Dec 2017
Sl.No. Indicators Currrent Status
1 Average Rainfall (mm)
(01.10.2017 to 27.12.2017)
Actual normal
15.1 31.8
2 No of districts received deficit rainfall in the state (01.10.2017 to 27.12.2017)
No. of districts with deficit rainfall Total number of districts
3 33
3 Area covered under major crops during 2017 (as on 01.01.2018)
(source: http://dag.gujarat.gov.in)
sl. no.
name of the cropActual Area
(lakh ha)Target Area*
(lakh ha)
1 Wheat 10.45 9.28
2 gram 2.91 1.64
3 mustard 2.21 1.99
4 Cumin 3.82 2.77
5 Potato 1.30 1.24
4 Incidence of major pests and diseases in principal crops sown (√)
sl. no.
name of the Crop
severe moderate low not at all
1 Wheat √
2 gram √
3 mustard √
4 Cumin √
5 Potato √
5 farm output price of major crops sl. no.
name of the crop Price (Rs. per quintal)
1 Paddy 1550-1590
2 maize 1425-1500
3 groundnut 4450-5300
4 Castor 3250-4175
5 Cotton 4020-4320
6 seed availability in the local market for major crops (√)
sl. no.
name of the crop Adequate shortage not available
1 Wheat √
2 gram √
3 mustard √
4 Cumin √
5 Potato √
7 Prevailing market price of seed (certified) of major crops
sl.no. name of the crop Price (Rs. per Kg.)
1 Wheat 20 to 30
2 gram 50 to 65
3 mustard 180 to 200
4 Cumin 155 to 250
5 Potato 55 to 65

17
Quarterly Report on Indicators of AgricultureOctober-December 2017
8 Chemical fertilizer (nPK) availability in the local market (√)
Details Adequate shortage not available
urea √
DAP √
ssP √
others √
9 Prevailing market price of fertilizer Details Price (Rs. per Kg.)
urea 6.25
DAP 23.60
ssP (powder) 7.00
ssP (granuls) 7.60
10 Availability of agricultural labour (√) Easily available shortage not available
√
11 Prevailing wage rate for casual labour in agriculture (Rs./day)
male female
300 250
12 Availability of institutional credit for agriculture in the state (Year 2014-15)
Target (Rs. crore) Achievement (Rs. crore)
NA NA
13 Electricity availability for irrigation pump sets (number of hours per day)
8
14 Availability of farm machinery for timely sowing, harvesting and other operations (√)
Easily available shortage not available
√
15 Availability of organic manure, farm-yard-manure, vermi-compost, bio-fertilizer (√)
Adequate shortage not available
√
Remarks and observations *Because of unavailability of targeted area figures, the previous year area under Kharif has been taken as the proxy.
Note: NA implies not available

18
Quarterly Report on Indicators of Agriculture October-December 2017
Agro-Economic Research Centre, Vallabh Vidyanagar, Gujarat
name of AERC: VV Nagar state: Rajasthan Quarter Covered: Oct - Dec 2017
Sl.No. Indicators Current status
1 Average Rainfall (mm)
(01-10-2017 to 27-12-2017)
Actual normal
2.6 mm 17.4 mm
2 No of districts received deficit rainfall in the state (Above mentioned period)
No. of districts with deficit rainfall Total number of districts
33 33
3 Area covered under major crops
(As on 18-12-2017 as per Directorate of Agriculture Jaipur, Rajasthan,)
sl. no.
name of the cropActual area (lakh ha)
Targeted area (lakh ha)
1 Wheat 26.89 32.0
2 Barley 3.25 3.0
3 gram 15.00 15.0
4 Rapeseed & mustard 19.91 26.0
5 Taramira 0.29 2.0
6 All Crops 78.99 94.0
4 Incidence of major pests and diseases in principal crops (√)
sl. no.
name of the Crop severe moderate low not at all
1 Wheat √
2 Barley √
3 gram √
4 Rapeseed & mustard √
5 Taramira √
5 farm output price of major crops
(As on 01/01/2018 as per mandi online, Rajasthan website)
sl. no.
name of the crop Price (Rs. per quintal)
1 Bajra 1106-1400
2 maize 1098-1600
3 moong 4376-5575
4 soybean 2798-3034
5 guar 3700-4008
6 seed availability in the local market for major crops (√)
sl. no.
name of the crop Adequate shortage not available
1 gram √
2 Wheat √
3 Barley √
4Rapeseed & mustard
√

19
Quarterly Report on Indicators of AgricultureOctober-December 2017
7 Prevailing market price of seed of major crops (Based on RssC ltd. Rajasthan)
sl.no. name of the crop Price (Rs. per Kg.)
1 Rapeseed and mustard 40-50
2 gram 65.00
3 Barley 18-30
4 Wheat 19-45
5 Taramira 45.00
6 Cumin 290.00
8 Chemical fertilizer (nPK) availability in the local market (√)
Details Adequate shortage not available
urea √
DAP √
ssP √
others / nPK √
9 Prevailing market price of fertilizer Details Price (Rs. per Kg.)
urea 6.20
DAP 21.60
ssP 5.57-9.20 (Powder)
others/nPK 15.40
10 Availability of agricultural labour (√) Easily available shortage not available
√
11 Prevailing wage rate for casual labour in agriculture (Rs./day)
male female
350 300
12 Availability of institutional credit for agriculture in the state
Target (Rs. crore) Achievement (Rs. crore)
NA NA
13 Electricity availability for irrigation pump sets (number of hours per day)
5-7
14 Availability of farm machinery for timely sowing, harvesting and other operations (√)
Easily available shortage not available
√
15 Availability of organic manure, farm-yard-manure, vermi-compost, bio-fertilizer (√)
Adequate shortage not available
√
Remarks and observations
NA implies Not Available
20
Quarterly Report on Indicators of Agriculture October-December 2017
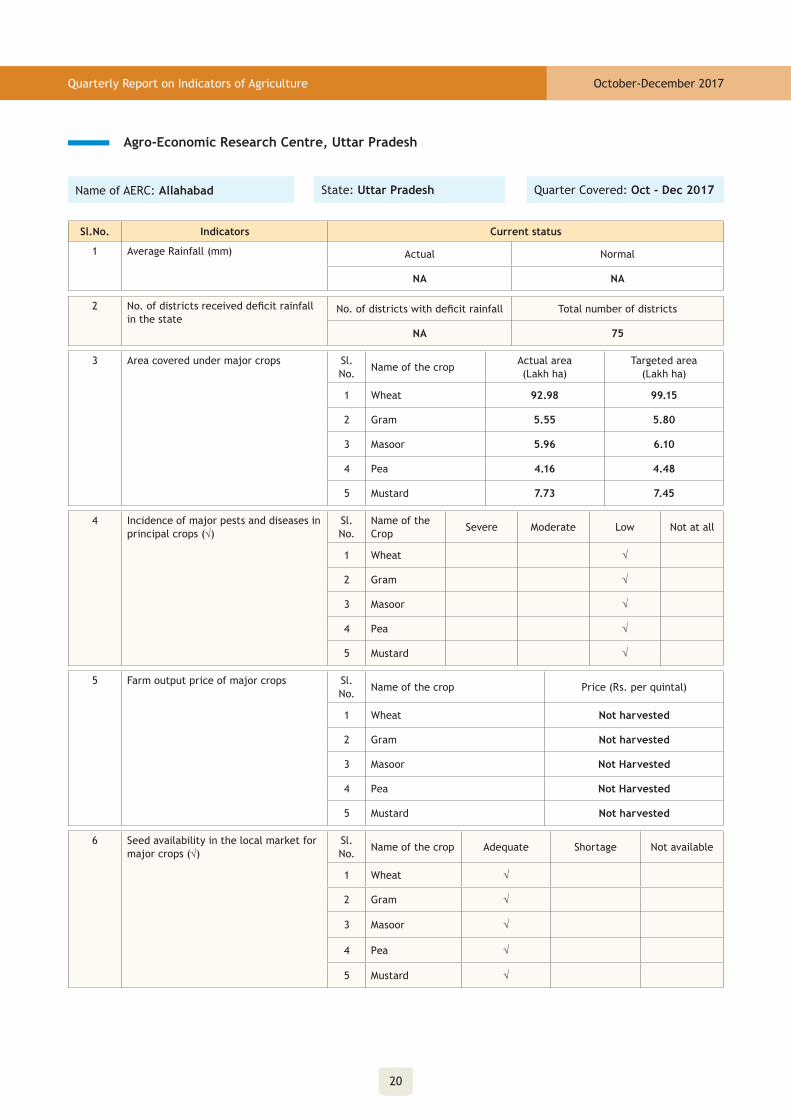
Agro-Economic Research Centre, Uttar Pradesh
name of AERC: Allahabad state: Uttar Pradesh Quarter Covered: Oct - Dec 2017
Sl.No. Indicators Current status
1 Average Rainfall (mm) Actual normal
NA NA
2 No. of districts received deficit rainfall in the state
No. of districts with deficit rainfall Total number of districts
NA 75
3 Area covered under major crops sl. no.
name of the cropActual area (lakh ha)
Targeted area (lakh ha)
1 Wheat 92.98 99.15
2 gram 5.55 5.80
3 masoor 5.96 6.10
4 Pea 4.16 4.48
5 mustard 7.73 7.45
4 Incidence of major pests and diseases in principal crops (√)
sl. no.
name of the Crop
severe moderate low not at all
1 Wheat √
2 gram √
3 masoor √
4 Pea √
5 mustard √
5 farm output price of major crops sl. no.
name of the crop Price (Rs. per quintal)
1 Wheat Not harvested
2 gram Not harvested
3 masoor Not Harvested
4 Pea Not Harvested
5 mustard Not harvested
6 seed availability in the local market for major crops (√)
sl. no.
name of the crop Adequate shortage not available
1 Wheat √
2 gram √
3 masoor √
4 Pea √
5 mustard √

21
Quarterly Report on Indicators of AgricultureOctober-December 2017
7 Prevailing market price of seed (certified) of major crops
sl.no. name of the crop Price (Rs. per Kg.)
1 Wheat 32-36
2 gram 99-120
3 masoor 78-85
4 Pea 50-70
5 mustard 70-95
8 Chemical fertilizer (nPK) availability in the local market (√)
Details Adequate shortage not available
urea √
DAP √
ssP √
others √
9 Prevailing market price of fertilizer Details Price (Rs. per Kg.)
urea 6.50-8.00
DAP 23.00-25.00
ssP 9.00-10.00
others 12.00-18.00
10 Availability of agricultural labour (√) Easily available shortage not available
√
11 Prevailing wage rate for casual labour in agriculture (Rs./day)
male female
250-300 175-225
12 Availability of institutional credit for agriculture in the state
Target (Rs. crore) Achievement (Rs. crore)
62416.32 19372.74
13 Electricity availability for irrigation pump sets (number of hours per day)
15-20
14 Availability of farm machinery for timely sowing, harvesting and other operations (√)
Easily available shortage not available
√
15 Availability of organic manure, farm-yard-manure, vermi-compost, bio-fertilizer (√)
Adequate shortage not available
√
Remarks and observations 1. Information from sr. no. 1 to 4 have been collected from Directorate of Agriculture, u.P., lucknow.
2. The availability of institutional credit for agriculture (Crop loan & KCC) in u.P. has also been collected from Directorate of Agriculture u.P., lucknow.
3. Apart from these most of information have been collected from the farmers of Allahabad district.
4. The prices of fertilizers in open markets were much higher than that of cooperative stores.
5. The information of availability for Institutional credit for agriculture (Crop loan & KCC) in the state is upto 27.12.2017.
6. Electricity availability for irrigation pump sets was very irregular across the state.
7. Information of area covered under major crops is upto 28.12-2017.
Note: Data shall be collected quarterly consisting of 1st Quarter – July to September, 2nd Quarter – October to December, 3rd Quarter – January to March and 4th Quarter – April to June.

22
Quarterly Report on Indicators of Agriculture October-December 2017
Agro-Economic Research Centre, PAU, Ludhiana
name of AERC: PAU state: Punjab Quarter Covered: Oct - Dec 2017
Sl.No. Indicators Current status
1 Average Rainfall (mm) Actual normal
@ @
2 No. of districts received deficit rainfall in the state
No. of districts with deficit rainfall Total number of districts
@ 20
3 Area covered under major crops (2017-18)
sl. no.
name of the cropActual area (lakh ha)**
Targeted area (lakh ha)
1 Wheat 34.90 34.90
2 Paddy 29.26 28.45
3 Cotton 3.79 4.00
4 maize 1.35 1.65
5 mustard 0.42 0.40
6 sugarcane 0.97 1.00
7 Sunflower - 0.15
4 Incidence of major pests and diseases in principal crops (√)
sl. no.
name of the Crop
severe moderate low not at all
1 Wheat - - √ -
2 Paddy - - √ -
3 Cotton - - √ -
4 maize - - √ -
5 mustard - - √ -
6 sugarcane - - √ -
7 Sunflower - - - -
5 farm output price of major crops sl. no.
name of the crop Price (Rs. per quintal)
1 Wheat 1650-1740
2 Paddy 1590
3 Cotton (A) 4250-5250
4 maize 1150-1510
5 mustard -
6 sugarcane 310
7 Sunflower -
6 seed availability in the local market for major crops (√)
sl. no.
name of the crop Adequate shortage not available
1 Wheat √ - -
2 Paddy - - -
3 Cotton - - -
4 maize - - -
5 mustard √ - -
6 sugarcane - - -
7 Sunflower - - -

23
Quarterly Report on Indicators of AgricultureOctober-December 2017
7 Prevailing market price of seed of major crops
sl.no. name of the crop Price (Rs. per Kg.)
1 Wheat 30
2 Paddy -
3 Cotton (Bt) -
4 maize(hybrid) -
5 mustard (gobi sarson)/hyola 120 / 900
6 sugarcane -
7 Sunflower -
8 Chemical fertilizer (nPK) availability in the local market (√)
Details Adequate shortage not available
urea √ - -
DAP - √ -
moP √ - -
9 Prevailing market price of fertilizer Details Price (Rs. per Kg.)
urea 5.90
DAP 21.50
muriate of Potash (moP) 12.50
10 Availability of agricultural labour (√) Easily available shortage not available
√
11 Prevailing wage rate for casual labour in agriculture (Rs./day)
male female
360 -
12 Availability of institutional credit for agriculture in the state ***
Target (Rs. crore) Achievement (Rs. crore)
28779*** 23651***
13 Electricity availability for irrigation pump sets (number of hours per day)
6-8
14 Availability of farm machinery for timely sowing, harvesting and other operations (√)
Easily available shortage not available
√
15 Availability of organic manure, farm-yard-manure, vermi-compost, bio-fertilizer (√)
Adequate shortage not available
√
16 Remarks and observations
Note: @ Information on rainfall yet to be received from the concerned Agro-metrological Department and will be sent as early as possible. ** Provisional estimates*** Data pertains up to June of financial year 2017-18. (Source: 141th meeting, state level Bankers Committee, Punjab).

24
Quarterly Report on Indicators of Agriculture October-December 2017
Agro-Economic Research Centre, Shimla, Himachal Pradesh
name of AERC: Shimla state: Himachal Pradesh Quarter Covered: Oct - Dec 2017
Sl.No. Indicators Current status
1 Average Rainfall (mm) Actual normal
55.2 98.9
2 No. of districts received deficit rainfall in the state
No. of districts with deficit rainfall Total number of districts
1.33 12
3 Area covered under major crops sl. no.
name of the cropActual area (lakh ha)
Targeted area (lakh ha)
1 Wheat 3.53 3.6
2 Barley 0.191 0.195
3 Pulses 0.124 0.125
4 Incidence of major pests and diseases in principal crops (√)
sl. no.
name of the Crop
severe moderate low not at all
1 Wheat √
2 Barley √
3 Pulses √
5 farm output price of major crops sl. no.
name of the crop Price (Rs. per quintal)
1 Wheat 1600
2 Barley 1500
3 Pulses 8000
6 seed availability in the local market for major crops (√)
sl. no.
name of the crop Adequate shortage not available
1 Wheat √
2 Barley √
3 Pulses √
7 Prevailing market price of seed (certified) of major crops
sl.no. name of the crop Price (Rs. per Kg.)
1 Wheat 16.00
2 Barley 14.50
3 Pulses 80.00
8 Chemical fertilizer (nPK) availability in the local market (√)
Details Adequate shortage not available
urea √
DAP As per demand
ssP √
othersnPK √
moP √

25
Quarterly Report on Indicators of AgricultureOctober-December 2017
9 Prevailing market price of fertilizer Details Price (Rs. per Kg.)
urea 5.92
DAP 22.70
ssP 11.66
othersnPK 21.22
moP 11.60
10 Availability of agricultural labour (√) Easily available shortage not available
√
11 Prevailing wage rate for casual labour in agriculture (Rs./day)
male female
240 240
12 Availability of institutional credit for agriculture in the state
Target (Rs. crore) Achievement (Rs. crore)
4158.54 2920.31
13 Electricity availability for irrigation pump sets (number of hours per day)
NA
14 Availability of farm machinery for timely sowing, harvesting and other operations (√)
Easily available shortage not available
√
15 Availability of organic manure, farm-yard-manure, vermi-compost, bio-fertilizer (√)
Adequate shortage not available
√
Remarks and observations There is 20% net irrigated area in himachal Pradesh
NA implies Not Available

26
Quarterly Report on Indicators of Agriculture October-December 2017
Agro-Economic Research Centre, ADRTC, Bengaluru
name of AERC: ADRTC state: Karnataka Quarter Covered: Oct - Dec 2017
Sl.No. Indicators Current status
1 Average Rainfall (mm) Actual normal
163 188
2 No. of districts received deficit rainfall in the state
No. of districts with deficit rainfall Total number of districts
12 30
3 Area covered under major crops sl. no.
name of the cropActual area (lakh ha)
Targeted area (lakh ha)
1 Paddy 0.22 0.24
2 maize 0.96 1.11
3 groundnut 0.51 1.14
4 Sunflower 1.24 2.22
5 Bengal gram 13.80 11.90
4 Incidence of major pests and diseases in principal crops sown (√)
sl. no.
name of the Crop
severe moderate low not at all
1 Paddy √
2 maize √
3 groundnut √
4 Sunflower √
5 Bengal gram √
5 farm output price of major crops sl. no.
name of the crop Price (Rs. per quintal)
1 Paddy 2245.00
2 maize 1240.0
3 groundnut 3430.00
4 Sunflower 2929.00
5 Bengal gram 4965.00
6 seed availability in the local market for major crops (√)
sl. no.
name of the crop Adequate shortage not available
1 Paddy √
2 maize √
3 groundnut √
4 Sunflower √
5 Bengal gram √

27
Quarterly Report on Indicators of AgricultureOctober-December 2017
7 Prevailing market price of seed (certified) of major crops
sl.no. name of the crop Price (Rs. per Kg.)
1 Paddy 34.00
2 maize 100.00
3 groundnut 73.00
4 Sunflower 170.00
5 Bengal gram 83.00
8 Chemical fertilizer (nPK) availability in the local market (√)
Details Adequate shortage not available
urea √
DAP √
ssP √
others √
9 Prevailing market price of fertilizer Details Price (Rs. per Kg.)
urea 5.78
DAP 21.89
ssP 15.70
others -
10 Availability of agricultural labour (√) Easily available shortage not available
√
11 Prevailing wage rate for casual labour in agriculture (Rs./day)
male female
269 269
12 Availability of institutional credit for agriculture in the state *
Target (Rs. crore) Achievement (Rs. crore)
86690.05 44023.78
13 Electricity availability for irrigation pump sets (number of hours per day)
4
14 Availability of farm machinery for timely sowing, harvesting and other operations (√)
Easily available shortage not available
√
15 Availability of organic manure, farm-yard-manure, vermi-compost, bio-fertilizer (√)
Adequate shortage not available
√
Remarks and observations
Note: * Targets for the quarter ended June 2017 and Achievement up to the end of the current quarter.
NA implies Not Available

28
Quarterly Report on Indicators of Agriculture October-December 2017
Agro-Economic Research Centre, Madras University, Tamil Nadu
name of AERC: Chennai state: Tamil Nadu Quarter Covered: Oct - Dec 2017
Sl.No. Indicators Current status
1 Average Rainfall (mm) Actual normal
399 438.5
2 No. of districts received deficit rainfall in the state
No. of districts with deficit rainfall Total number of districts
15 32
3 Area covered under major crops sl. no.
name of the cropActual area (lakh ha)
Targeted area (lakh ha)
1 Paddy 11.308 11.201
2 Coarse Cereals 3.687 3.442
3 Pulses 3.874 4.494
4 food grains 18.869 19.137
5 oilseeds 0.841 1.942
4 Incidence of major pests and diseases in principal crops sown (√)
sl. no.
name of the Crop
severe moderate low not at all
1 Paddy √
2 millets √
3 Cotton √
4 oilseeds √
5 sugarcane √
5 farm output price of major crops sl. no.
name of the crop Price (Rs. per quintal)
1 Paddy 1350-2073
2 millets 1069-1736
3 groundnut 4874-6023
4 Cotton 4010-5140
5 sugarcane 285
6 seed availability in the local market for major crops (√)
sl. no.
name of the crop Adequate shortage not available
1 Paddy √
2 millets √
3 groundnut √
4 Cotton √
5 sugarcane √
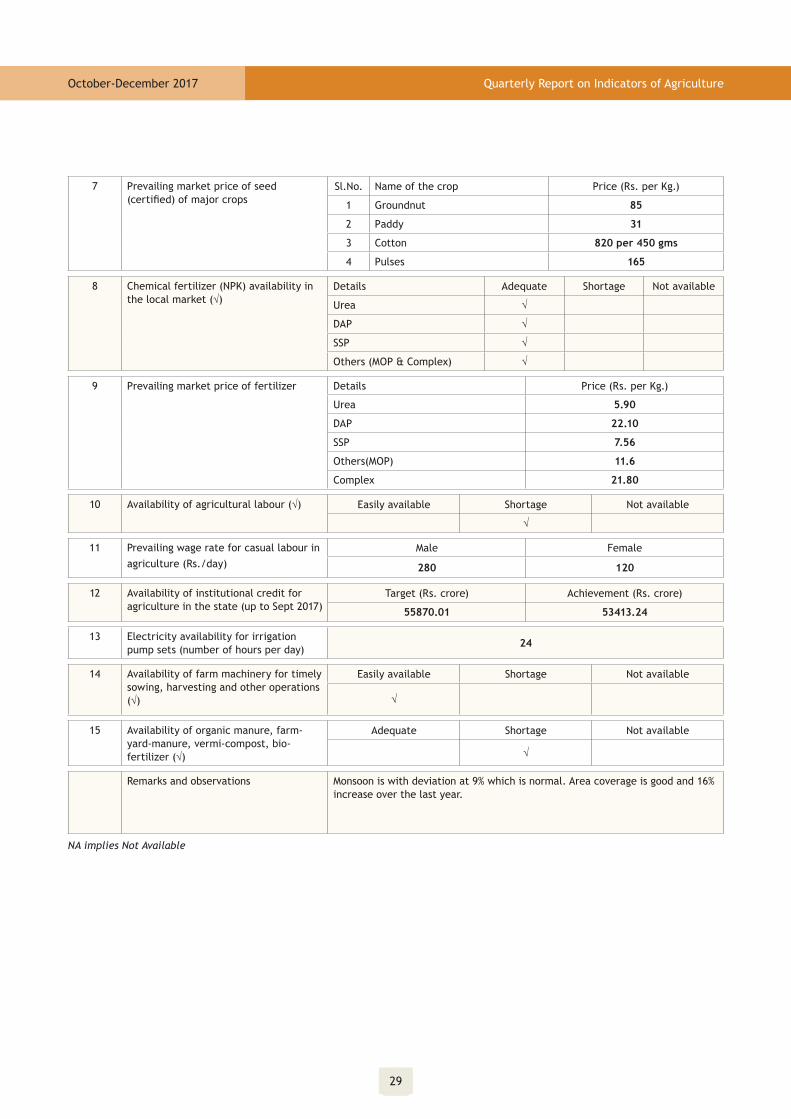
29
Quarterly Report on Indicators of AgricultureOctober-December 2017
7 Prevailing market price of seed (certified) of major crops
sl.no. name of the crop Price (Rs. per Kg.)
1 groundnut 85
2 Paddy 31
3 Cotton 820 per 450 gms
4 Pulses 165
8 Chemical fertilizer (nPK) availability in the local market (√)
Details Adequate shortage not available
urea √
DAP √
ssP √
others (moP & Complex) √
9 Prevailing market price of fertilizer Details Price (Rs. per Kg.)
urea 5.90
DAP 22.10
ssP 7.56
others(moP) 11.6
Complex 21.80
10 Availability of agricultural labour (√) Easily available shortage not available
√
11 Prevailing wage rate for casual labour in agriculture (Rs./day)
male female
280 120
12 Availability of institutional credit for agriculture in the state (up to sept 2017)
Target (Rs. crore) Achievement (Rs. crore)
55870.01 53413.24
13 Electricity availability for irrigation pump sets (number of hours per day)
24
14 Availability of farm machinery for timely sowing, harvesting and other operations (√)
Easily available shortage not available
√
15 Availability of organic manure, farm-yard-manure, vermi-compost, bio-fertilizer (√)
Adequate shortage not available
√
Remarks and observations monsoon is with deviation at 9% which is normal. Area coverage is good and 16% increase over the last year.
NA implies Not Available

30
Quarterly Report on Indicators of Agriculture October-December 2017
Agro-Economic Research Centre, JNKVV, Jabalpur, MP
name of AERC: Jabalpur state: Chhattisgarh Quarter Covered: Oct - Dec 2017
Sl.No. Indicators Current status
1 Average Rainfall (mm) Actual normal
61.8 78
2 No. of districts received deficit rainfall in the state
No. of districts with deficit rainfall Total number of districts
7 Tehsil of 21 district 21
3 Area covered under major crops
(as on 25 December 2017)
sl. no.
name of the cropActual area (000’ ha)
Targeted area (000’ ha)
1 Wheat 1.26 1.97
2 maize 0.42 0.95
3 gram 2.89 3.9
4 Pea 0.47 0.6
5 moong+urd 0.12 0.54
6 lathyrus 2.92 3.64
7 linseed 0.49 0.76
8 Rapeseed mustard 1.45 1.76
4 Incidence of major pests and diseases in principal crops sown (√)
sl. no.
name of the Crop
severe moderate low not at all
1 Wheat √
2 maize √
3 gram √
4 Pea √
5 moong+urd √
6 lathyrus √
7 linseed √
8 Rapeseed mustard √
5 farm output price of major crops sl. no.
name of the crop Price (Rs. per quintal)
1 Wheat 3200
2 gram 4200
3 Pea 4000
4 lathyrus 4000

31
Quarterly Report on Indicators of AgricultureOctober-December 2017
6 seed availability in the local market for major crops (√)
sl. no.
name of the crop Adequate shortage not available
1 Wheat √
2 gram √
3 Pea √
4 lentil √
5 mustard √
6 sugarcane √
7 Prevailing market price of seed (certified) of major crops
sl.no. name of the crop Price (Rs. per Kg.)
1 Wheat 30
2 gram 80
3 Pea 40
4 mustard 45
5 lathyrus 50
6 Sunflower 575
8 Chemical fertilizer (nPK) availability in the local market (√)
Details Adequate (mT) shortage not available
urea √
DAP √
ssP √
others (moP) √
9 Prevailing market price of fertilizer Details Price (Rs. per Kg)
urea/ nCu 5.96
DAP 24.88
ssP 6.86
others (12:32:16) 22.78
10 Availability of agricultural labour (√) Easily available shortage not available
√
11 Prevailing wage rate for casual labour in agriculture (Rs./day)
male female
325 325
12 Availability of institutional credit for agriculture in the state (As on 18.09.2017) Source: SLBC, MP
Target (Rs. crore) Achievement (Rs. crore)
Kharif-3200
Rabi-600
3164.04
104.87
13 Electricity availability for irrigation pump sets (number of hours per day)
24
14 Availability of farm machinery for timely sowing, harvesting and other operations (√)
Easily available shortage not available
√
15 Availability of organic manure, farm-yard-manure, vermin-compost, bio-fertilizer (√)
Adequate shortage not available
√
Remarks and observations

32
Quarterly Report on Indicators of Agriculture October-December 2017
Agro-Economic Research Centre, JNKVV, Jabalpur, MP
name of AERC: Jabalpur state: Madhya Pradesh Quarter Covered: Oct - Dec 2017
Sl.No. Indicators Currrent Status
1 Average Rainfall (mm) Actual normal
17.5 54.8
2 No. of districts received deficit rainfall in the state
No. of districts with deficit rainfall Total number of districts
34 51
3 Area covered under major crops (as on 25 December 2017)
sl. no.
name of the cropActual Area ( lakh ha)
Target Area ( lakh ha)
1 Wheat 41.09 49.06
2 gram 34.59 38.38
3 Pea 2.87 3.42
4 lentil 5.86 7.16
5 mustard 7.51 9.38
6 sugarcane 0.83 1.43
4 Incidence of major pests and diseases in principal crops sown (√)
sl. no.
name of the Crop
severe moderate low not at all
1 Wheat √
2 gram √
3 Pea √
4 lentil √
5 mustard √
6 sugarcane √
5 farm output price of major crops sl. no.
name of the crop Price (Rs. per quintal)
1 Wheat 1400-3495
2 gram 3100-6000
3 Pea 2050-5000
4 lentil 2000-5500
5 mustard 1500-4800
6 seed availability in the local market for major crops (√)
sl. no.
name of the crop Adequate shortage not available
1 Wheat √
2 gram √
3 Pea √
4 lentil √
5 mustard √
6 sugarcane √
7 Prevailing market price of seed (certified) of major crops
sl.no. name of the crop Price (Rs. per Kg.)
1 Wheat 18-33
2 gram 50-75
3 field Pea 26-75
4 Pea (Arkil) 35-50
5 lentil 35-60
6 mustard 35-60
7 linseed 38-60

33
Quarterly Report on Indicators of AgricultureOctober-December 2017
8 Chemical fertilizer (nPK) availability in the local market (√)
Details Adequate shortage not available
urea √
DAP √
ssP √
others (moP) √
9 Prevailing market price of fertilizer Details Price (Rs. per kg)
urea/ nCu 6.02
DAP 21.74
ssP 5.56-6.20
moP 17.06
others (12:32:16) 21.62
10 Availability of agricultural labour (√) Easily available shortage not available
√
11 Prevailing wage rate for casual labour in agriculture (Rs/day)
male female
250-300 180-200
12 Availability of institutional credit for agriculture in the state (As on 18.09.2017) Source: SLBC, MP
Target (Rs. crore) Achievement (Rs. crore)
94868 22451
13 Electricity availability for irrigation pump sets (number of hours per day)
8
14 Availability of farm machinery for timely sowing, harvesting and other operations (√)
Easily available shortage not available
√
15 Availability of organic manure, farm-yard-manure, vermi-compost, bio-fertilizer (√)
Adequate shortage not available
√
Remarks and observations

34
Quarterly Report on Indicators of Agriculture October-December 2017
Agro-Economic Research Centre for Bihar & Jharkhand, TM Bhagalpur University, Bhagalpur, Bihar
name of AERC: Bhagalpur state: Bihar Quarter Covered: Oct - Dec 2017
Sl.No. Indicators Current status
1 Average Rainfall (mm) Actual normal
49.6 77.5
2 No. of districts received deficit rainfall in the state
No. of districts with deficit rainfall Total number of districts
28 38
3 Area covered under major crops sl. no.
name of the cropActual area (lakh ha)
Targeted area (lakh ha)
1 Wheat 21.50 23.25
2 maize 4.10 4.25
3 gram 0.98 1.20
4 lentil 1.90 2.20
5. Rai/mustard 1.00 1.26
4 Incidence of major pests and diseases in principal crops sown (√)
sl. no.
name of the Crop
severe moderate low not at all
1 Wheat √
2 maize √
3 gram √
4 lentil √
5 Rai/mustard √
5 farm output price of major crops sl. no.
name of the crop Price (Rs. per quintal)
1 Rice (medium) 3000
2 Wheat 1500
3 maize 1100
4 gram 6000
5. lentil 6500
6 seed availability in the local market for major crops (√)
sl. no.
name of the crop Adequate shortage not available
1 Wheat √
2 maize √
3 gram √
4 lentil √
5. Rai/mustard √

35
Quarterly Report on Indicators of AgricultureOctober-December 2017
7 Prevailing market price of seed (certified) of major crops
sl.no. name of the crop Price (Rs. per Kg.)
1 Wheat 21.00
2 maize (hybrid) 450.00
3 gram 55.00
4 lentil 60.00
8 Chemical fertilizer (nPK) availability in the local market (√)
Details Adequate shortage not available
urea √
DAP √
ssP √
others √
9 Prevailing market price of fertilizer Details Price (Rs. per kg)
urea 6.00
DAP 25.00
Potash 15.00
Zinc 60.00
moP 10.00
10 Availability of agricultural labour (√) Easily available shortage not available
√
11 Prevailing wage rate for casual labour in agriculture (Rs./day)
male female
200 150
12 Availability of institutional credit for agriculture in the state
Target (Rs. crore) Achievement (Rs. crore)
49000 (Annual) 26950 (Approx)
13 Electricity availability for irrigation pump sets (number of hours per day)
8 - 10
14 Availability of farm machinery for timely sowing, harvesting and other operations (√)
Easily available shortage not available
√
15 Availability of organic manure, farm-yard-manure, vermi-compost, bio-fertilizer (√)
Adequate shortage not available
√
Remarks and observations Incidence of labour migration is being observed due to liquor ban and reluctancy to work as a consequence of subsidized grains.
NA implies Not Available

36
Quarterly Report on Indicators of Agriculture October-December 2017
Agro-Economic Research Centre for Bihar & Jharkhand, TM Bhagalpur University, Bhagalpur, Bihar
name of AERC: Bhagalpur state: Jharkhand Quarter Covered: Oct - Dec 2017
Sl.No. Indicators Current status
1 Average Rainfall (mm) Actual normal
106.4 91.6
2 No. of districts received deficit rainfall in the state
No. of districts with deficit rainfall Total number of districts
09 24
3 Area covered under major crops sl. no.
name of the cropActual area (lakh ha)
Targeted area (lakh ha)
1 Wheat 1.90 2.41
2 maize 0.18 0.28
3 gram 1.98 2.50
4 lentil 0.55 0.78
5. Rai/mustard 2.80 3.15
4 Incidence of major pests and diseases in principal crops sown (√)
sl. no.
name of the Crop
severe moderate low not at all
1 Wheat √
2 maize √
3 gram √
4 lentil √
5 Rai/mustard √
5 farm output price of major crops sl. no.
name of the crop Price (Rs. per quintal)
1 Rice (medium) 2500
2 Wheat 1600
3 maize 950
4 gram 5800
5. lentil 5500
6 seed availability in the local market for major crops (√)
sl. no.
name of the crop Adequate shortage not available
1 Wheat √
2 maize √
3 gram √
4 lentil √
5. Rai/mustard √
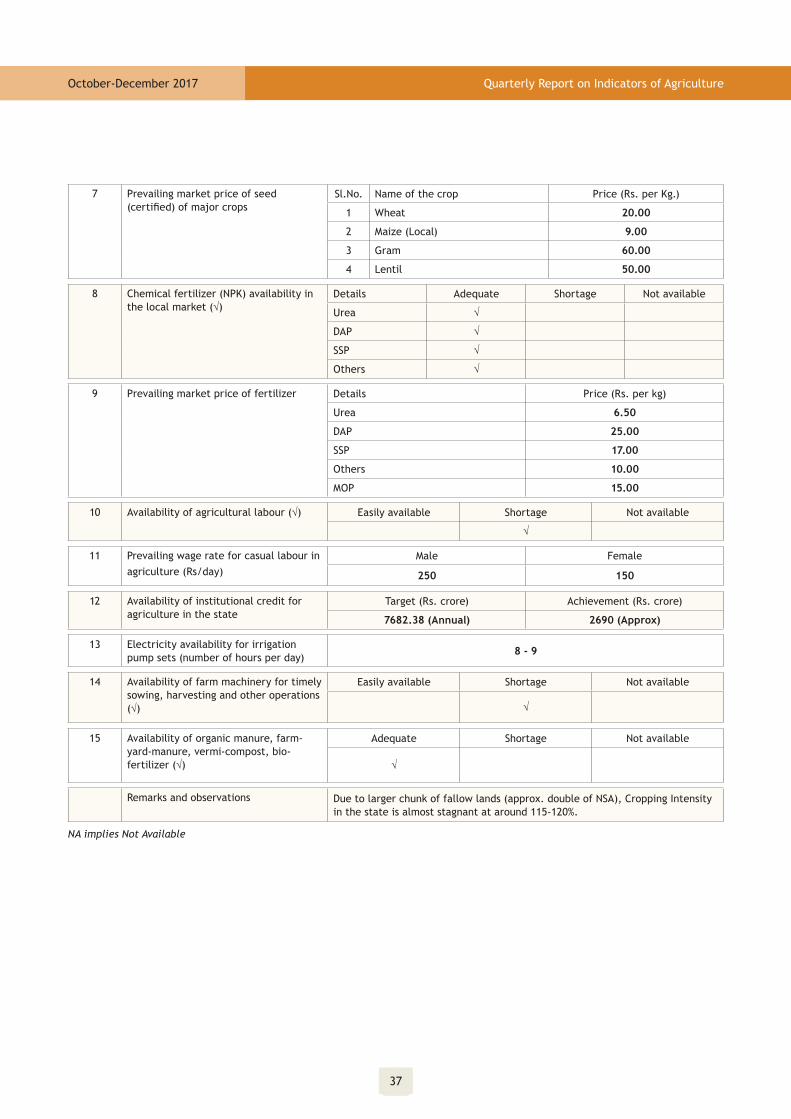
37
Quarterly Report on Indicators of AgricultureOctober-December 2017
7 Prevailing market price of seed (certified) of major crops
sl.no. name of the crop Price (Rs. per Kg.)
1 Wheat 20.00
2 maize (local) 9.00
3 gram 60.00
4 lentil 50.00
8 Chemical fertilizer (nPK) availability in the local market (√)
Details Adequate shortage not available
urea √
DAP √
ssP √
others √
9 Prevailing market price of fertilizer Details Price (Rs. per kg)
urea 6.50
DAP 25.00
ssP 17.00
others 10.00
moP 15.00
10 Availability of agricultural labour (√) Easily available shortage not available
√
11 Prevailing wage rate for casual labour in agriculture (Rs/day)
male female
250 150
12 Availability of institutional credit for agriculture in the state
Target (Rs. crore) Achievement (Rs. crore)
7682.38 (Annual) 2690 (Approx)
13 Electricity availability for irrigation pump sets (number of hours per day)
8 - 9
14 Availability of farm machinery for timely sowing, harvesting and other operations (√)
Easily available shortage not available
√
15 Availability of organic manure, farm-yard-manure, vermi-compost, bio-fertilizer (√)
Adequate shortage not available
√
Remarks and observations Due to larger chunk of fallow lands (approx. double of nsA), Cropping Intensity in the state is almost stagnant at around 115-120%.
NA implies Not Available

38
Quarterly Report on Indicators of Agriculture October-December 2017
Agro-Economic Research Centre, Assam Agricultural University, Jorhat, Assam
name of AERC: Jorhat state: Assam Quarter Covered: Oct - Dec 2017
Sl.No. Indicators Current status
1 Average Rainfall (mm) Actual normal
140.4 168.5
2 No. of districts received deficit rainfall in the state
No. of districts with deficit rainfall Total number of districts
22 27
3 Area covered under major crops sl. no.
name of the cropActual area (lakh ha)
Targeted area (lakh ha)
1 Winter Paddy 18.83 19.35
2 summer Paddy 4.16 5.90
3 Pulses 1.48 2.00
4 mustard 2.81 3.50
5 sugarcane 0.30 0.45
4 Incidence of major pests and diseases in principal crops sown (√)
sl. no.
name of the Crop severe moderate low not at all
1 Winter Paddy √
2 summer Paddy √
3 Pulses √
4 mustard √
5 sugarcane √
5 farm output price of major crops sl. no.
name of the crop Price (Rs. per quintal)
1 Winter Paddy 1400.00
2 summer Paddy 1250.00
3 Pulses 3700.00
4 mustard 3150.00
5 sugarcane 245.00
6 seed availability in the local market for major crops (√)
sl. no.
name of the crop Adequate shortage not available
1 Winter Paddy √
2 summer Paddy √
3 Pulses √
4 mustard √
5 sugarcane √

39
Quarterly Report on Indicators of AgricultureOctober-December 2017
sl.no. Indicators Current status
7 Prevailing market price of seed (certified) of major crops
sl.no. name of the crop Price (Rs. per Kg.)
1 Winter Paddy 34.00-200.00
2 summer Paddy 50.00-250.00
3 Pulses 70.00-130.00
4 mustard 65.00-125.00
5 sugarcane 22.00-34.00
8 Chemical fertilizer (nPK) availability in the local market (√)
Details Adequate shortage not available
urea √
DAP √
ssP √
others √
9 Prevailing market price of fertilizer Details Price (Rs. per kg)
urea 8.50
DAP 28.00
ssP 10.00
others 10.00-15.00
10 Availability of agricultural labour (√) Easily available shortage not available
√
11 Prevailing wage rate for casual labour in agriculture (Rs./day)
male female
270.00 180.00
12 Availability of institutional credit for agriculture in the state
Target (Rs. crore) Achievement (Rs. crore)
12846.51 2826.82
13 Electricity availability for irrigation pump sets (number of hours per day)
NA
14 Availability of farm machinery for timely sowing, harvesting and other operations (√)
Easily available shortage not available
√
15 Availability of organic manure, farm-yard-manure, vermi-compost, bio-fertilizer (√)
Adequate shortage not available
√
Remarks and observations
NA implies Not Available

40
Quarterly Report on Indicators of Agriculture October-December 2017
Agro-Economic Research Centre, Assam Agricultural University, Jorhat, Assam
name of AERC: Jorhat state: Arunachal Pradesh Quarter Covered: Oct - Dec 2017
Sl.No. Indicators Current status
1 Average Rainfall (mm) Actual normal
118.6 161.8
2 No. of districts received deficit rainfall in the state
No. of districts with deficit rainfall Total number of districts
12 16
3 Area covered under major crops sl. no.
name of the cropActual area (lakh ha)
Targeted area (lakh ha)
1 Paddy 1.30 1.50
2 oilseeds 0.34 0.40
3 Pulses 0.10 0.50
4 maize 0.47 0.53
5 sugarcane 0.02 0.03
4 Incidence of major pests and diseases in principal crops sown (√)
sl. no.
name of the Crop
severe moderate low not at all
1 Paddy √
2 oilseeds √
3 Pulses √
4 maize √
5 sugarcane √
5 farm output price of major crops sl. no.
name of the crop Price (Rs. per quintal)
1 Paddy 1410.00
2 oilseeds 3430.00
3 Pulses 3600.00
4 maize 1280.00
5 sugarcane 240.00
6 seed availability in the local market for major crops (√)
sl. no.
name of the crop Adequate shortage not available
1 Paddy √
2 oilseeds √
3 Pulses √
4 maize √
5 sugarcane √

41
Quarterly Report on Indicators of AgricultureOctober-December 2017
sl.no. Indicators Current status
7 Prevailing market price of seed (certified) of major crops
sl.no. name of the crop Price (Rs. per Kg.)
1 Paddy 35.00-220.00
2 oilseeds 60.00-130.00
3 Pulses 70.00-150.00
4 maize 30.00-70.00
5 sugarcane 20.00-60.00
8 Chemical fertilizer (nPK) availability in the local market (√)
Details Adequate shortage not available
urea √
DAP √
ssP √
others √
9 Prevailing market price of fertilizer Details Price (Rs. per Kg)
urea 8.00
DAP 22.00
ssP 8.00
others 8.00-15.00
10 Availability of agricultural labour (√) Easily available shortage not available
√
11 Prevailing wage rate for casual labour in agriculture (Rs./day)
male female
280.00 180.00
12 Availability of institutional credit for agriculture in the state
Target (Rs. crore) Achievement (Rs. crore)
52.22 20.69
13 Electricity availability for irrigation pump sets (number of hours per day)
NA
14 Availability of farm machinery for timely sowing, harvesting and other operations (√)
Easily available shortage not available
√
15 Availability of organic manure, farm-yard-manure, vermi-compost, bio-fertilizer (√)
Adequate shortage not available
√
Remarks and observations
NA implies Not Available

42
Quarterly Report on Indicators of Agriculture October-December 2017
Agro-Economic Research Centre, Assam Agricultural University, Jorhat, Assam
name of AERC: Jorhat state: Meghalaya Quarter Covered: Oct - Dec 2017
Sl.No. Indicators Current status
1 Average Rainfall (mm) Actual normal
137.66 192.01
2 No. of districts received deficit rainfall in the state
No. of districts with deficit rainfall Total number of districts
4 7
3 Area covered under major crops sl. no.
name of the cropActual area (lakh ha)
Targeted area (lakh ha)
1 Paddy 1.09 1.53
2 maize 0.18 0.30
3 Jute 0.06 0.10
4 oilseeds 0.14 0.29
5 Pulses 0.08 0.14
4 Incidence of major pests and diseases in principal crops sown (√)
sl. no.
name of the Crop
severe moderate low not at all
1 Paddy √
2 maize √
3 Jute √
4 oilseeds √
5 Pulses √
5 farm output price of major crops sl. no.
name of the crop Price (Rs. per quintal)
1 Paddy 1390.00
2 maize 1290.00
3 Jute 2600.00
4 oilseeds 3300.00
5 Pulses 3650.00
6 seed availability in the local market for major crops (√)
sl. no.
name of the crop Adequate shortage not available
1 Paddy √
2 maize √
3 Jute √
4 oilseeds √
5 Pulses √

43
Quarterly Report on Indicators of AgricultureOctober-December 2017
7 Prevailing market price of seed (certified) of major crops
sl.no. name of the crop Price (Rs. per Kg.)
1 Paddy 30.00-230.00
2 maize 28.00-55.00
3 Jute 60.00-110.00
4 oilseeds 70.00-125.00
5 Pulses 80.00-150.00
8 Chemical fertilizer (nPK) availability in the local market (√)
Details Adequate shortage not available
urea √
DAP √
ssP √
others √
9 Prevailing market price of fertilizer Details Price (Rs. per kg)
urea 7.50
DAP 22.00
ssP 8.00
others 10.00-15.00
10 Availability of agricultural labour (√) Easily available shortage not available
√
11 Prevailing wage rate for casual labour in agriculture (Rs./day)
male female
290 200
12 Availability of institutional credit for agriculture in the state
Target (Rs. crore) Achievement (Rs. crore)
2219.24 349.55
13 Electricity availability for irrigation pump sets (number of hours per day)
NA
14 Availability of farm machinery for timely sowing, harvesting and other operations (√)
Easily available shortage not available
√
15 Availability of organic manure, farm-yard-manure, vermi-compost, bio-fertilizer (√)
Adequate shortage not available
√
Remarks and observations
NA implies Not Available

44
Quarterly Report on Indicators of Agriculture October-December 2017
Agro-Economic Research Centre, Assam Agricultural University, Jorhat, Assam
name of AERC: Jorhat state: Mizoram Quarter Covered: Oct - Dec 2017
Sl.No. Indicators Current status
1 Average Rainfall (mm) Actual normal
133.45 192.06
2 No. of districts received deficit rainfall in the state
No. of districts with deficit rainfall Total number of districts
5 8
3 Area covered under major crops sl. no.
name of the cropActual area (lakh ha)
Targeted area (lakh ha)
1 Paddy 0.40 0.62
2 oilseeds 0.03 0.07
3 maize 0.07 0.12
4 Pulses 0.04 0.10
5 sugarcane 0.01 0.03
4 Incidence of major pests and diseases in principal crops sown (√)
sl. no.
name of the Crop
severe moderate low not at all
1 Paddy √
2 oilseeds √
3 maize √
4 Pulses √
5 sugarcane √
5 farm output price of major crops sl. no.
name of the crop Price (Rs. per quintal)
1 Paddy 1400.00
2 oilseeds 3700.00
3 maize 1300.00
4 Pulses 2600.00
5 sugarcane 240.00
6 seed availability in the local market for major crops (√)
sl. no.
name of the crop Adequate shortage not available
1 Paddy √
2 oilseeds √
3 maize √
4 Pulses √
5 sugarcane √

45
Quarterly Report on Indicators of AgricultureOctober-December 2017
7 Prevailing market price of seed (certified) of major crops
sl.no. name of the crop Price (Rs. per Kg.)
1 Paddy 30.00-240.00
2 oilseeds 70.00-130.00
3 maize 29.00-65.00
4 Pulses 60.00-125.00
5 sugarcane 22.00-40.00
8 Chemical fertilizer (nPK) availability in the local market (√)
Details Adequate shortage not available
urea √
DAP √
ssP √
others √
9 Prevailing market price of fertilizer Details Price (Rs. per Kg.)
urea 8.50
DAP 28.00
ssP 10.00
others 10.00-15.00
10 Availability of agricultural labour (√) Easily available shortage not available
√
11 Prevailing wage rate for casual labour in agriculture (Rs./day)
male female
280 180
12 Availability of institutional credit for agriculture in the state
Target (Rs. crore) Achievement (Rs. crore)
436.75 90.36
13 Electricity availability for irrigation pump sets (number of hours per day)
NA
14 Availability of farm machinery for timely sowing, harvesting and other operations (√)
Easily available shortage not available
√
15 Availability of organic manure, farm-yard-manure, vermi-compost, bio-fertilizer (√)
Adequate shortage not available
√
Remarks and observations
NA implies Not Available

46
Quarterly Report on Indicators of Agriculture October-December 2017
Agro-Economic Research Centre, Assam Agricultural University, Jorhat, Assam
name of AERC: Jorhat state: Manipur Quarter Covered: Oct - Dec 2017
Sl.No. Indicators Current status
1 Average Rainfall (mm) Actual normal
230.6 256.01
2 No. of districts received deficit rainfall in the state
No. of districts with deficit rainfall Total number of districts
6 9
3 Area covered under major crops sl. no.
name of the cropActual area (lakh ha)
Targeted area (lakh ha)
1 Paddy 2.40 2.50
2 oilseeds 0.37 0.50
3 maize 0.26 0.32
4 Pulses 0.30 0.41
5 sugarcane 0.05 0.06
4 Incidence of major pests and diseases in principal crops sown (√)
sl. no.
name of the Crop
severe moderate low not at all
1 Paddy √
2 oilseeds √
3 maize √
4 Pulses √
5 sugarcane √
5 farm output price of major crops sl. no.
name of the crop Price (Rs. per quintal)
1 Paddy 1370.00
2 oilseeds 3300.00
3 maize 1300.00
4 Pulses 3600.00
5 sugarcane 240.00
6 seed availability in the local market for major crops (√)
sl. no.
name of the crop Adequate shortage not available
1 Paddy √
2 oilseeds √
3 maize √
4 Pulses √
5 sugarcane √

47
Quarterly Report on Indicators of AgricultureOctober-December 2017
7 Prevailing market price of seed (certified) of major crops
sl.no. name of the crop Price (Rs. per Kg.)
1 Paddy 30.00-225.00
2 oilseeds 65.00-125.00
3 maize 26.00-50.00
4 Pulses 70.00-120.00
5 sugarcane 21.00-32.00
8 Chemical fertilizer (nPK) availability in the local market (√)
Details Adequate shortage not available
urea √
DAP √
ssP √
others √
9 Prevailing market price of fertilizer Details Price (Rs. per kg)
urea 7.50
DAP 21.50
ssP 7.50
others 9.00-15.00
10 Availability of agricultural labour (√) Easily available shortage not available
√
11 Prevailing wage rate for casual labour in agriculture (Rs./day)
male female
250.00 180.00
12 Availability of institutional credit for agriculture in the state
Target (Rs. crore) Achievement (Rs. crore)
NA NA
13 Electricity availability for irrigation pump sets (number of hours per day)
NA
14 Availability of farm machinery for timely sowing, harvesting and other operations (√)
Easily available shortage not available
√
15 Availability of organic manure, farm-yard-manure, vermi-compost, bio-fertilizer (√)
Adequate shortage not available
√
Remarks and observations
NA implies Not Available

48
Quarterly Report on Indicators of Agriculture October-December 2017
Agro-Economic Research Centre, Assam Agricultural University, Jorhat, Assam
name of AERC: Jorhat state: Nagaland Quarter Covered: Oct - Dec 2017
Sl.No. Indicators Current status
1 Average Rainfall (mm) Actual normal
108.2 164.5
2 No. of districts received deficit rainfall in the state
No. of districts with deficit rainfall Total number of districts
9 11
3 Area covered under major crops sl. no.
name of the cropActual area (lakh ha)
Targeted area (lakh ha)
1 Paddy 1.89 2.90
2 oilseeds 0.67 0.92
3 Pulses 0.37 0.50
4 maize 0.70 0.86
5 sugarcane 0.04 0.09
4 Incidence of major pests and diseases in principal crops sown (√)
sl. no.
name of the Crop
severe moderate low not at all
1 Paddy √
2 oilseeds √
3 Pulses √
4 maize √
5 sugarcane √
5 farm output price of major crops sl. no.
name of the crop Price (Rs. per quintal)
1 Paddy 1400.00
2 oilseeds 3300.00
3 Pulses 3600.00
4 maize 1320.00
5 sugarcane 235.00
6 seed availability in the local market for major crops (√)
sl. no.
name of the crop Adequate shortage not available
1 Paddy √
2 oilseeds √
3 Pulses √
4 maize √
5 sugarcane √

49
Quarterly Report on Indicators of AgricultureOctober-December 2017
7 Prevailing market price of seed (certified) of major crops
sl.no. name of the crop Price (Rs. per Kg.)
1 Paddy 30.00-250.00
2 oilseeds 70.00-130.00
3 Pulses 60.00-130.00
4 maize 30.00-65.00
5 sugarcane 20.00-40.00
8 Chemical fertilizer (nPK) availability in the local market (√)
Details Adequate shortage not available
urea √
DAP √
ssP √
others √
9 Prevailing market price of fertilizer Details Price (Rs. per Kg.)
urea 8.00
DAP 20.00
ssP 7.50
others 8.00-15.00
10 Availability of agricultural labour (√) Easily available shortage not available
√
11 Prevailing wage rate for casual labour in agriculture (Rs./day)
male female
280.00 190.00
12 Availability of institutional credit for agriculture in the state
Target (Rs. crore) Achievement (Rs. crore)
384.70 96.98
13 Electricity availability for irrigation pump sets (number of hours per day)
NA
14 Availability of farm machinery for timely sowing, harvesting and other operations (√)
Easily available shortage not available
√
15 Availability of organic manure, farm-yard-manure, vermi-compost, bio-fertilizer (√)
Adequate shortage not available
√
Remarks and observations
NA implies Not Available

50
Quarterly Report on Indicators of Agriculture October-December 2017
Agro-Economic Research Centre, Assam Agricultural University, Jorhat, Assam
name of AERC: Jorhat state: Tripura Quarter Covered: Oct - Dec 2017
Sl.No. Indicators Current status
1 Average Rainfall (mm) Actual normal
148.7 203.7
2 No. of districts received deficit rainfall in the state
No. of districts with deficit rainfall Total number of districts
3 4
3 Area covered under major crops sl. no.
name of the cropActual area (lakh ha)
Targeted area (lakh ha)
1 Paddy 2.54 2.75
2 maize 0.05 0.09
3 Pulses 0.10 0.13
4 oilseeds 0.07 0.10
5 sugarcane 0.02 0.03
4 Incidence of major pests and diseases in principal crops sown (√)
sl. no.
name of the Crop
severe moderate low not at all
1 Paddy √
2 maize √
3 Pulses √
4 oilseeds √
5 sugarcane √
5 farm output price of major crops sl. no.
name of the crop Price (Rs. per quintal)
1 Paddy 1400.00
2 maize 1310.00
3 Pulses 3650.00
4 oilseeds 3350.00
5 sugarcane 250.00
6 seed availability in the local market for major crops (√)
sl. no.
name of the crop Adequate shortage not available
1 Paddy √
2 maize √
3 Pulses √
4 oilseeds √
5 sugarcane √

51
Quarterly Report on Indicators of AgricultureOctober-December 2017
7 Prevailing market price of seed (certified) of major crops
sl.no. name of the crop Price (Rs. per Kg.)
1 Paddy 30.00-250.00
2 maize 30.00-70.00
3 Pulses 70.00-135.00
4 oilseeds 80.00-125.00
5 sugarcane 20.00-55.00
8 Chemical fertilizer (nPK) availability in the local market (√)
Details Adequate shortage not available
urea √
DAP √
ssP √
others √
9 Prevailing market price of fertilizer Details Price (Rs. per Kg.)
urea 7.00
DAP 20.50
ssP 7.00
others 10.00-18.00
10 Availability of agricultural labour (√) Easily available shortage not available
√
11 Prevailing wage rate for casual labour in agriculture (Rs./day)
male female
280.00 200.00
12 Availability of institutional credit for agriculture in the state (Annual)
Target (Rs. crore) Achievement (Rs. crore)
2117.11 1057.33
13 Electricity availability for irrigation pump sets (number of hours per day)
NA
14 Availability of farm machinery for timely sowing, harvesting and other operations (√)
Easily available shortage not available
√
15 Availability of organic manure, farm-yard-manure, vermi-compost, bio-fertilizer (√)
Adequate shortage not available
√
Remarks and observations
NA implies Not Available
Sources:
1) Economic Survey
2) Statistical Hand Book
3) Website of Agricultural Department
4) Nedfi Data Bank
5) IMD, Website
6) Minutes of SLBC Meeting

52
Quarterly Report on Indicators of Agriculture October-December 2017
Agro-Economic Research Centre, West Bengal
name of AERC: Shantiniketan state: West Bengal Quarter Covered: Oct - Dec 2017
Sl.No. Indicators Current status
1 Average Rainfall (mm) Actual normal
1415.7 881.8
2 No. of districts received deficit rainfall in the state
No. of districts with deficit rainfall Total number of districts
2 19
3 Area covered under major crops sl. no.
name of the cropActual area (lakh ha)
Targeted area (lakh ha)
1 summer Paddy 0.14 13.10
2 Wheat 0.95 1.54
3 Potato 4.05 4.60
4 mustard 5.42 5.75
5 lentil 1.46 1.20
4 Incidence of major pests and diseases in principal crops sown (√)
sl. no.
name of the Crop
severe moderate low not at all
1 summer Paddy √
2 Wheat √
3 Potato √
4 mustard √
5 lentil √
5 farm output price of major crops sl. no.
name of the crop Price (Rs. per quintal)
1 summer Paddy 1560
2 Wheat 1670
3 Potato 435
4 mustard 4000
5 lentil 5000
6 seed availability in the local market for major crops (√)
sl. no.
name of the crop Adequate shortage not available
1 summer Paddy √
2 Wheat √
3 Potato √
4 mustard √
5 lentil √

53
Quarterly Report on Indicators of AgricultureOctober-December 2017
7 Prevailing market price of seed (certified) of major crops
sl.no. name of the crop Price (Rs. per Kg.)
1 summer Paddy 36.00
2 Wheat 27.00
3 Potato 28.00
4 mustard 43.00
5 lentil 50.00
8 Chemical fertilizer (nPK) availability in the local market (√)
Details Adequate shortage not available
urea √
DAP √
ssP √
others √
9 Prevailing market price of fertilizer Details Price (Rs. per Kg.)
urea 9.00
DAP 26.00
ssP 11.00
others 16.00
10 Availability of agricultural labour (√) Easily available shortage not available
√
11 Prevailing wage rate for casual labour in agriculture (Rs./day)
male female
240.00 240.00
12 Availability of institutional credit for agriculture in the state
Target (Rs. crore) Achievement (Rs. crore)
59097.77 17866.00
13 Electricity availability for irrigation pump sets (number of hours per day)
NA
14 Availability of farm machinery for timely sowing, harvesting and other operations (√)
Easily available shortage not available
√
15 Availability of organic manure, farm-yard-manure, vermi-compost, bio-fertilizer (√)
Adequate shortage not available
√
Remarks and observations
NA implies Not Available

54
Quarterly Report on Indicators of Agriculture October-December 2017
Agro-Economic Research Center, Andhra University, Visakapatnam
name of AERC: Visakhapatnam state: Andhra Pradesh Quarter Covered: Oct - Dec 2017
Sl.No. Indicators Currrent Status
1 Average Rainfall (mm)
1.10.2017 to 31.12.2017
Actual normal
177.5 296.0
2 No. of districts received deficit rainfall in the state
No. of districts with deficit rainfall Total number of districts
9 (7 deficit, 2 scanty) 13
3 Area covered under major crops sl. no.
name of the cropActual Area In ‘000 hect.
Target Area In ‘000 hect
1 Rice 376 750
2 other Cereals 233 237
3 Pulses 885 1157
4 oilseeds 78 161
5 Vegetables - -
6 spices - -
7 Others (fibers) - -
4 Incidence of major pests and diseases in principal crops sown (√)
sl. no.
name of the Crop
severe moderate low not at all
1 Paddy
2 non-Paddy
5 farm output price of major crops sl. no.
name of the crop Price (Rs. per quintal)
1Paddy (Common) 1550
Paddy (grade A) 1590
2 maize 1425
3 Ragi 1900
4 groundnut 4450
5 mung 5575
6 Biri 5400
7 Wheat 1735
8 Arhar 5450
9 gram 4400
10 Til 5300
11 mustard 4000

55
Quarterly Report on Indicators of AgricultureOctober-December 2017
6 seed availability in the local market for major crops (√)
Sl. No.
Name of the crop Adequate Shortage Not available
1 Paddy √
2 Pulses √
3 groundnut √
7 Prevailing market price of seed (certified) of major crops
Sl.No. Name of the crop Price (Rs. per Qtl.)
1 Paddy 3400
2 Ragi 5500
3 mung 7000
4 Biri 9700
5 Arhar 7200
6 groundnut 7700
7 Til 11600
8 niger 7000
9 Jute 6500
10 Dhanicha 4000
11 Sunflower 500
12 maize 270
8 Chemical fertilizer (nPK) availability in the local market (√)
Details Adequate shortage not available
urea √
DAP √
ssP √
others Complex √
9 Prevailing market price of fertilizer Details Price (Rs. per 50 Kg. bag)
urea 295
DAP 1076-1113
ssP 362-378
20:20:0:13 813.50-897.50
28:28:0 1122
14:35:14 1122
10:26:26 1044-1081
12:32:16:00 1061-1082
15:15:15 887-906
As 653-750
moP 624
16:16:16 892
14:28:14 0
10 Availability of agricultural labour (√) Easily available shortage not available
√

56
Quarterly Report on Indicators of Agriculture October-December 2017
11 Prevailing wage rate for casual labour in agriculture (Rs./day)
male female
NA NA
12 Availability of institutional credit for agriculture in the state (Co-operative Bank)
Target (Rs. crore) Achievement (Rs. crore)
36552.04 16629.84
13 Electricity availability for irrigation pump sets (number of hours per day)
7
14 Availability of farm machinery for timely sowing, harvesting and other operations (√)
Easily available shortage not available
√
15 Availability of organic manure, farm-yard-manure, vermi-compost, bio-fertilizer (√)
Adequate shortage not available
√
Remarks and observations

57
Quarterly Report on Indicators of AgricultureOctober-December 2017
Agro-Economic Research Centre, Andhra University, Visakhapatnam
name of AERC: Visakhapatnam state: Odisha Quarter Covered: Oct - Dec 2017
Sl.No. Indicators Currrent Status
1 Average Rainfall (mm) Actual normal
215.5 150.7
2 No. of districts received deficit rainfall in the state
No. of districts with deficit rainfall Total number of districts
4 30
3 Area covered under major crops Kharif season (Provisional)
sl. no.
name of the cropActual Area (lakh ha.)
Target Area (lakh ha.)
1 Paddy 0.02 2.70
2 maize 0.09 0.30
3 mung 2.82 6.20
4 Biri 1.63 3.00
5 ground nut 0.62 1.70
6 mustard 0.93 1.30
7 Til 0.19 0.60
4 Incidence of major pests and diseases in principal crops sown (√)
sl. no.
name of the Crop
severe moderate low not at all
1 Paddy √
2 non Paddy √
5 farm output price of major crops sl. no.
name of the crop Price (Rs. per quintal)
1 Paddy 1500
2 maize 1425
3 mung 5575
4 Biri 5400
5 ground nut 4450
6 mustard 4000
7 Til 5300
6 seed availability in the local market for major crops (√)
sl. no.
name of the crop Adequate shortage not available
1 Paddy √
2 maize √
3 mung √
4 Biri √
5 ground nut √
6 mustard √
7 Til √

58
Quarterly Report on Indicators of Agriculture October-December 2017
7 Prevailing market price of seed (certified) of major crops
sl.no. name of the crop Price (Rs. per Kg.)
1 Paddy 16.00
2 maize 60.00
3 mung 50.00
4 Biri 70.00
5 g.nut 55.00
6 mustard 45.00
7 Til 35.00
8 Chemical fertilizer (nPK) availability in the local market (√)
Details Adequate shortage not available
urea √
DAP √
ssP √
others √
9 Prevailing market price of fertilizer Details Price (Rs. per Kg.)
urea 298.42
DAP 1139.25
ssP 440.00
others 1122.00
10 Availability of agricultural labour (√) Easily available shortage not available
√
11 Prevailing wage rate for casual labour in agriculture (Rs./day)
male female
200 - 260 200 - 260
12 Availability of institutional credit for agriculture in the state
Target (Rs. crore) Achievement (Rs. crore)
31208.41 11851.46
13 Electricity availability for irrigation pump sets (number of hours per day)
NA
14 Availability of farm machinery for timely sowing, harvesting and other operations (√)
Easily available shortage not available
√
15 Availability of organic manure, farm-yard-manure, vermi-compost, bio-fertilizer (√)
Adequate shortage not available
√
Remarks and observations Rabi Crop condition is normal.
NA implies Not Available


Desi
gned
by
data
wor
x -
web
site
: w
ww
.dat
awor
x.co
.in
Agricultural Development and Rural Transformation CentreInstitute for Social and Economic Change
Dr. V.K.R.V. Rao Road, Nagarabhavi, Bengaluru - 560 072
Phone: +91-80-23215468, 23215519; Fax: +91-80-23217008
Email: [email protected]; website: http://www.isec.ac.in