Quantitative Assessment Canalicular Bile Formation ... · optical planimetry using high resolution...
9
Quantitative Assessment of Canalicular Bile Formation in Isolated Hepatocyte Couplets Using Microscopic Optical Planimetry A. Gautam, 0. C. Ng, M. Strazzabosco, and J. L. Boyer Department ofMedicine and Liver Center, Yale University School ofMedicine, New Haven, Connecticut 06510 Abstract Isolated rat hepatocyte couplets (IRHC) are primary units of bile secretion that accumulate fluid in an enclosed canalicular space with time in culture. We have quantitated the rate of canalicular secretion in IRHC cultured for 4-8 h by measuring the change in canalicular space volume by video-microscopic optical planimetry using high resolution Nomarski optics. Electron microscopic morphometric studies revealed signifi- cant increases in canalicular membrane area after 4-6 h in culture. Canalicular secretion in basal L-15 medium (3.8±1.3 fl/min) increased significantly with the choleretic bile salts (10 uMM), taurocholate, and ursodeoxycholate (14±7 fl/min each). Secretion rates after exposure to bile acids correlated directly with the canalicular surface area before stimulation. In contrast, expansion times after stimulation varied inversely with initial canalicular volumes. Ursodeoxycholic acid failed to produce a hypercholeresis at 10-, 100-, or 200-,MM concentra- tions compared with taurocholate, either in normal or taurine- depleted IRHC. The present findings establish that rates of canalicular bile secretion can be quantitated in IRHC by serial optical planim- etry, both in the basal state and after stimulation with bile acids. Furthermore, ursodeoxycholate does not acutely induce hypercholeresis at the canalicular level in this model. Rather, both taurocholic and ursodeoxycholic acids induced secretion in proportion to the surface area of the canalicular membrane. The IRHC are a useful model to identify canalicular cholere- tics and for studies of canalicular bile formation. Introduction Hepatocytes are polarized cells that form bile by secreting sol- utes and water across an apical membrane into small canalicu- lar spaces that exist between adjacent hepatocytes. This pri- mary secretion may be further modified by reabsorption or secretion by the bile ductular epithelium at distal sites. Although significant progress has been achieved in under- standing the mechanisms of canalicular bile secretion (1-5), Portions of this work were presented in preliminary form at the An- nual Meetings of the American Gastroenterology Association, 1986 and 1987 (1986. Gastroenterology. 90:1727, and 1987. Gastroenterol- ogy. 92:1734). Please address all correspondence to Dr. Anil Gautam, Liver Unit, 1080 LMP, Yale University School of Medicine, New Haven, CT 06510. Receivedfor publication 8 September 1987 and in revisedform 20 September 1988. knowledge is still incomplete, in part because the small size (1-2 um) and inaccessibility of the bile canaliculus in the in- tact liver precludes direct quantitative measurements of the primary secretion. Most studies of canalicular bile secretion have relied, therefore, on indirect methods including isolated perfused liver systems, where bile is sampled from biliary can- nulas at distal sites after contact with and possible modifica- tion by bile ductules and ducts. Isolated membrane subfrac- tions obtained from specific hepatocyte membrane domains have also been useful in localizing membrane transport sys- tems and determining solute driving forces (6-8). However, liver cells are disrupted in this in vitro system and the findings may not always mirror the physiology in vivo. Thus, uncer- tainties still exist about the mechanisms of primary canalicular secretory processes, as summarized in several reviews (3-5). This report describes a new way to directly quantitate canalic- ular secretory events in a cell culture system. Isolated rat hepatocyte couplets (IRHC)1 permit assess- ment of canalicular secretory events in an isolated cell culture system that eliminates confounding effects of blood flow, hor- monal influences, or transport events in the bile duct system (9, 10). IRHC consist of two nondissociated hepatocytes en- closing a sealed canalicular space. When the couplets are placed in short-term culture, secretion accumulates within the space resulting in progressive expansion followed by spontane- ous collapse or contractions, as originally observed by Oshio and Phillips ( 11). Several studies have demonstrated that IRHC display many characteristics of a functionally intact primary unit of canalicular bile formation (9, 11-14). Studies of the structural characteristics of the IRHC (10, 15, 16) indicate that freshly isolated hepatocyte pairs reorganize their apical membranes to the retained canalicular pole that is demarcated by tight junc- tion complexes between the two hepatocytes. Thus, the IRHC retains its structural secretory polarity. A detailed electrophysi- ologic analysis of this primary canalicular secretory unit has recently been completed (12). In the present report we describe a method to quantitate the volume of the canalicular space by microscopic optical planimetry using differential interference contrast (DIC) video-microscopy (17-19). By determining the change in vol- ume of the canalicular space in response to choleretic stimuli, we have quantitated rates of canalicular bile formation in this isolated hepatocyte couplet system (20). In addition, we have compared the canalicular choleretic effects of the bile salts, sodium taurocholate and ursodeoxycholate. Ursodeoxycholate in high concentrations has been re- ported to produce a unique hypercholeresis of bicarbonate- enriched bile where bile flow is significantly greater than that 1. Abbreviations used in this paper: DIC, differential interference con- trast; IRHC, isolated rat hepatocyte couplets; L- 15, Liebowitz- 15 me- dium. Optical Quantitation of Canalicular Bile Formation 565 J. Clin. Invest. © The American Society for Clinical Investigation, Inc. 0021-9738/89/02/0565/09 $2.00 Volume 83, February 1989, 565-573
Transcript of Quantitative Assessment Canalicular Bile Formation ... · optical planimetry using high resolution...

Quantitative Assessment of Canalicular Bile Formationin Isolated Hepatocyte Couplets Using Microscopic Optical PlanimetryA. Gautam, 0. C. Ng, M. Strazzabosco, and J. L. BoyerDepartment of Medicine and Liver Center, Yale University School of Medicine, NewHaven, Connecticut 06510
Abstract
Isolated rat hepatocyte couplets (IRHC) are primary units ofbile secretion that accumulate fluid in an enclosed canalicularspace with time in culture. Wehave quantitated the rate ofcanalicular secretion in IRHC cultured for 4-8 h by measuringthe change in canalicular space volume by video-microscopicoptical planimetry using high resolution Nomarski optics.Electron microscopic morphometric studies revealed signifi-cant increases in canalicular membrane area after 4-6 h inculture. Canalicular secretion in basal L-15 medium (3.8±1.3fl/min) increased significantly with the choleretic bile salts(10 uMM), taurocholate, and ursodeoxycholate (14±7 fl/mineach). Secretion rates after exposure to bile acids correlateddirectly with the canalicular surface area before stimulation. Incontrast, expansion times after stimulation varied inverselywith initial canalicular volumes. Ursodeoxycholic acid failed toproduce a hypercholeresis at 10-, 100-, or 200-,MM concentra-tions compared with taurocholate, either in normal or taurine-depleted IRHC.
The present findings establish that rates of canalicular bilesecretion can be quantitated in IRHC by serial optical planim-etry, both in the basal state and after stimulation with bileacids. Furthermore, ursodeoxycholate does not acutely inducehypercholeresis at the canalicular level in this model. Rather,both taurocholic and ursodeoxycholic acids induced secretionin proportion to the surface area of the canalicular membrane.The IRHC are a useful model to identify canalicular cholere-tics and for studies of canalicular bile formation.
Introduction
Hepatocytes are polarized cells that form bile by secreting sol-utes and water across an apical membrane into small canalicu-lar spaces that exist between adjacent hepatocytes. This pri-mary secretion may be further modified by reabsorption orsecretion by the bile ductular epithelium at distal sites.
Although significant progress has been achieved in under-standing the mechanisms of canalicular bile secretion (1-5),
Portions of this work were presented in preliminary form at the An-nual Meetings of the American Gastroenterology Association, 1986and 1987 (1986. Gastroenterology. 90:1727, and 1987. Gastroenterol-ogy. 92:1734).
Please address all correspondence to Dr. Anil Gautam, Liver Unit,1080 LMP, Yale University School of Medicine, New Haven, CT06510.
Receivedfor publication 8 September 1987 and in revisedform 20September 1988.
knowledge is still incomplete, in part because the small size(1 -2 um) and inaccessibility of the bile canaliculus in the in-tact liver precludes direct quantitative measurements of theprimary secretion. Most studies of canalicular bile secretionhave relied, therefore, on indirect methods including isolatedperfused liver systems, where bile is sampled from biliary can-nulas at distal sites after contact with and possible modifica-tion by bile ductules and ducts. Isolated membrane subfrac-tions obtained from specific hepatocyte membrane domainshave also been useful in localizing membrane transport sys-tems and determining solute driving forces (6-8). However,liver cells are disrupted in this in vitro system and the findingsmay not always mirror the physiology in vivo. Thus, uncer-tainties still exist about the mechanisms of primary canalicularsecretory processes, as summarized in several reviews (3-5).This report describes a new way to directly quantitate canalic-ular secretory events in a cell culture system.
Isolated rat hepatocyte couplets (IRHC)1 permit assess-ment of canalicular secretory events in an isolated cell culturesystem that eliminates confounding effects of blood flow, hor-monal influences, or transport events in the bile duct system(9, 10). IRHC consist of two nondissociated hepatocytes en-closing a sealed canalicular space. When the couplets areplaced in short-term culture, secretion accumulates within thespace resulting in progressive expansion followed by spontane-ous collapse or contractions, as originally observed by Oshioand Phillips ( 11).
Several studies have demonstrated that IRHC displaymany characteristics of a functionally intact primary unit ofcanalicular bile formation (9, 11-14). Studies of the structuralcharacteristics of the IRHC (10, 15, 16) indicate that freshlyisolated hepatocyte pairs reorganize their apical membranes tothe retained canalicular pole that is demarcated by tight junc-tion complexes between the two hepatocytes. Thus, the IRHCretains its structural secretory polarity. A detailed electrophysi-ologic analysis of this primary canalicular secretory unit hasrecently been completed (12).
In the present report we describe a method to quantitatethe volume of the canalicular space by microscopic opticalplanimetry using differential interference contrast (DIC)video-microscopy (17-19). By determining the change in vol-ume of the canalicular space in response to choleretic stimuli,we have quantitated rates of canalicular bile formation in thisisolated hepatocyte couplet system (20). In addition, we havecompared the canalicular choleretic effects of the bile salts,sodium taurocholate and ursodeoxycholate.
Ursodeoxycholate in high concentrations has been re-ported to produce a unique hypercholeresis of bicarbonate-enriched bile where bile flow is significantly greater than that
1. Abbreviations used in this paper: DIC, differential interference con-
trast; IRHC, isolated rat hepatocyte couplets; L- 15, Liebowitz- 15 me-
dium.
Optical Quantitation of Canalicular Bile Formation 565
J. Clin. Invest.© The American Society for Clinical Investigation, Inc.0021-9738/89/02/0565/09 $2.00Volume 83, February 1989, 565-573
accounted for by the biliary bile acid output (21, 22), andcholeresis correlates both with biliary HCO- concentrationand output and the amount of unconjugated ursodeoxycholatein bile. Both hypercholeresis and HCO- output are blocked bythe Na'-H + inhibitor, amiloride, and its more potent and pre-sumably more specific analogues (22, 23). The mechanismsand sites of action of ursodeoxycholate remain undeterminedbut may include: (a) stimulation of bile formation at the levelof the hepatocyte (24) by stimulation of the basolateralNa+/H+ exchanger (25) leading to passive or active transportof HCO- into the canalicular space; (b) primary stimulationof other unknown ion pumps by large intracellular accumula-tions of unconjugated bile acid; (c) cholehepatic shunting,where the unconjugated bile acid is excreted into bile at thecanalicular level but is protonated and partly reabsorbed pas-sively distally in the biliary tree, thereby recycling across thecanalicular membrane to affect an apparent hypercholeresisrelative to the total amount of bile acid finally excreted in bile(26); and (d) stimulation of ion transporters distally at thelevel of the bile ductules or ducts.
In this study we determine whether ursodeoxycholate invarious concentrations produces a hypercholeretic effect inisolated hepatocyte couplets compared with similar concen-trations of taurocholate.
MethodsIsolation of hepatocyte couplets. IRHC were prepared in the Hepato-cyte Isolation Core laboratory of the Liver Center from fed, maleSprague-Dawley rats (180-250 g; CammResearch Lab Animals,Wayne, NJ) as previously described (9, 27) by a modification of thenonrecirculating collagenase perfusion method of Seglen. Newmodifi-cations were the inclusion of 0.8 U of trypsin inhibitor (Sigma Chemi-cal Co., St. Louis, MO)/U of tryptic activity in the collagenase and 1mg of the clostripan inhibitor, N-tosyl L-lysyl chloromethane hydro-chloride, in the collagenase buffer to minimize nonspecific proteolyticactivity of these contaminants. The resulting cell preparations con-taining 0.8-2.2 X 10⁷ hepatocytes/g of liver were > 95% hepatocytes,and 91.7±2.9% of the usable preparations excluded trypan blue (n= 231 isolations) and were relatively enriched in hepatocyte couplets(31.6±8.6% of cells were IRHC in 138 consecutive isolations). Prepa-rations in which < 85% cells excluded trypan blue were discarded. Thefinal cell suspension was plated onto glass coverslip fragments in 35X 10-mm plastic tissue culture dishes at a cell concentration of 0.75X 10⁵/ml of Liebowitz- 15 medium (L- 15; Gibco Laboratories, GrandIsland, NY) containing 50 U of penicillin and 50 ,ug of strepto-mycin/ml.
Measurement of canalicular volume and quantitative assessment ofcanalicular bile formation in IRHC. The unique structural and secre-tory properties of the hepatocyte couplet were exploited to quantitatethe rate of primary canalicular secretion both in a basal medium andafter stimulation with choleretic bile salts. The approach used was (a)to quantitate the canalicular space volume accurately by obtainingcross-sectional dimensions at several known intervals through the en-tire canalicular depth by the technique of microscopic optical planim-etry using DIC video-microscopy (I17-20), and (b) to calculate the rateof canalicular secretion from the rate of change of the canalicularvolume with time as secretion was elaborated.
Optical and video systems for optical planimetry. Canalicular vol-ume was measured by microscopic optical planimetry, originally de-scribed by Spring et al. ( 17, 18). The principle of this method is shownin Fig. 1. Using DIC, or Nomarski optics, which has a very shallowdepth of focus (0.3-0.4 Jtm under our optical conditions), cross-sec-tional images of the canaliculus were obtained at multiple opticalplanes through the depth of the canaliculus at 1-Mum intervals. On theright is a three-dimensional projection of the canalicular space gener-
FFigure 1. Principle ofoptical planimetry. A
-fE _- C l couplet adherent to a\- ____-__ }1Ijm < coverslip fragment is
_____Of/viewed from the side.________ //____ Using Nomarski optics
(see text for detailedspecifications), multiple optical sections are obtained 1 /Am apartthrough the depth of the canaliculus. A computer-generated three-di-mensional projection is shown on the right. Each section is quanti-tated for cross-sectional area and perimeter using an image analyzer.The sum of measured cross-sectional areas X 1 ,um = canalicular vol-ume; the sum of measured perimeters X 1 ,um = canalicular surfacearea.
ated by a video-plan II image analyzer (Carl Zeiss, Inc., Thornwood,NY). The extremely shallow depth of focus of Nomarski optics per-mits spacing the steps 0.5-1 Mumapart so that each optical plane is truewithout bleeding of images of optical planes above and below into theplane of focus. At each step the perimeter and the cross-sectionalsurface area of the canalicular space were quantitated. The sum of themeasured cross-sectional areas X displacement (1 Mmin this case)= canalicular volume (in femtoliters), and the sum of the measuredperimeters X 1 Mm= canalicular surface area (in square micrometers).In preliminary studies a comparison of canalicular area and volumemeasurements was made using 0.5-, 1.0-, and 2.0-,gm steps. No signifi-cant differences were noted in the coefficient of variation between 0.5-and 2.0-Am steps in the measured parameters. Steps of 1.0 or 2.0 Jmwere used thereafter.
Optical planimetry was carried out in the following manner. IRHCwere cultured for - 4 h in L-15 medium at 370C on 5 X 5-mm glasscoverslip fragments, which were then transferred for observation into a1.2-mm-thick flow-through lucite chamber in which perfusing bufferwas kept at 37±0.1 'C by a feedback-controlled heating device. A"lung" of gas-permeable tubing was used to aerate the buffer with100% 02 or 95% 02/5% C02. The perfusion chamber was placed onthe stage of an inverted microscope (IM35; Carl Zeiss, Inc.) and cou-plets were studied temporally with DIC optics at a magnification of4,660 using a 63X oil objective (Plan Neoflaur with a numerical aper-ture of 1.25; Carl Zeiss, Inc.) with matching DIC Wollaston prisms andan aplanatic-achromatic condenser with a 1.4 pol front (oil immer-sion) lens. The iris diaphragm could be opened fully with video-mi-croscopy for the highest resolution. Contrast was adjusted by selectingthe appropriate black level for the video camera circuit using a gainand black control device. Using this optical system a lateral resolutionof 0.3 Emand vertical resolution of 0.35 Mmwas realized throughout.The lens combination used to achieve this resolution limits the con-denser-objective lens working distance to -1 mm. Chambers of lu-cite, with a bottom composed of a 100-,Mm-thick coverslip, were usedwith a similar coverslip used on top of the chamber to which the oilimmersion condenser was applied. A thin flow-through chamber wasthus established in which buffer exchanges occurred within 10 s at aflow rate of 1 ml/min. Koehler illumination was set daily. Correctionsfor the differences in the refractive indices of the immersion oil, glasscoverslip fragments, and cells were madeby calibrating the image-anal-ysis system with a stage micrometer kept in the plane of the examinedcells.
The couplets being studied could then be either photographed di-rectly or imaged at high resolution using a video camera (67; Dage-MTI Inc., Wabash, MI). Images were stored on a 9240XD Panasonichigh resolution 3/4" video cassette recorder (480 X 480 line resolution).Analyses could subsequently be performed on the stored data by trac-ing the canalicular perimeter at each step with a cursor directly fromthe video overlay using a digitizing tablet and a videoplan II imageanalyzer (Carl Zeiss, Inc.).
For each volume quantitation the top pole of the canaliculus waslocated and the fine focus of the microscope advanced at 1-Mm inter-
566 A. Gautam, 0. C. Ng, M. Strazzabosco, and J. L. Boyer

vals through the depth of the canaliculus. With a 2-3-s exposure ateach step the entire record of 8-10 cuts per canaliculus was obtainedwithin 30 s. Volume quantitations were repeated at 3-5-min intervalsin the untreated basal state to identify IRHC with expanding canalicu-lar spaces since these are most suitable for quantitating rates of canalic-ular expansion in response to choleretics. Others were not used forexperiments. From these measurements the basal secretory rates inunmodified L- 15 medium were quantitated. Observations were re-peated at 3-5-min intervals after exposure to bile acids to obtain stimu-lated secretory rates. This technique of quantitation of volumes of cellsand interspaces by microscopic optical planimetry readily permittedaccurate detection of volume changes that were at least 5%greater thanpreceding or baseline measurements (28). Approximately half of theIRHC with expanded canaliculi were unsuitable for study since theywere already in the process of collapsing or contracting. These canalic-uli may respond by reexpansion at variable time periods after exposureto choleretic bile acids with expansions presumably occurring whenthe canalicular limiting membranes reseal.
To study the effect of various concentrations of ursodeoxycholateon the bile flow rate in couplets, IRHC were maintained in either L- 15or in MEMsupplemented with 10% FCS. Before volume measure-ments the coverslip fragments were either transferred from L- 15 intoKRB, pH 7.4, and equilibrated for 10 min before measurements of bileflow rates in this bicarbonate-containing perfusate, or transferred fromMEMto a MEMperfusion medium to continue a bicarbonate envi-ronment. Additional experiments were conducted on IRHC pretreatedfor 2 d with #-alanine (20 mmol/kg body wt daily for 2 d instilled intothe stomach by gavage) to deplete them of taurine according to themethod of Shaffer and Kocsis (29) as used by Kitani and Kanai (24).Couplets isolated from f3-alanine-treated rats were further maintainedin culture media supplemented with f3-alanine (0.1 mg/ 3 ml medium)for 3-6 h before study. This treatment to deplete IRHC of taurine wasdesigned to minimize taurine conjugation of ursodeoxycholate totauroursodeoxycholate which is not hypercholeretic in rats. Taurine-depleted rats demonstrate an earlier and more vigorous hypercholer-esis in response to ursodeoxycholic acid administration (24), presum-ably since taurine conjugation is minimized from the beginning of theexperiment rather than resulting from a progressive depletion of en-dogenous taurine stores in the normal liver after prolonged exposure tolarge doses of ursodeoxycholic acid.
Electron microscopic morphometry of the canalicular membrane.The canalicular membranes in IRHC are lined by normal-appearing(0. 1-0.2-,um-thick) microvilli immediately after isolation and after4-8 h in culture. Morphometric studies were carried out on thin-sec-tion electron micrographs of isolated couplets in culture to (a) deter-mine the percentage of canalicular space volume occupied by thesemicrovilli, since measurements by optical planimetry do not take intoaccount the canalicular microvilli that are below the level of resolutionby light microscopy, and (b) to assess if there was a change in thenumber of microvilli per unit length of canalicular membrane or in thepercentage of cross-sectional area occupied by microvilli with time inculture.
Two groups of IRHC were studied. Freshly isolated hepatocyteswere plated onto glass coverslip fragments in L- 15 medium for 10-15min to allow the couplets to adhere to the glass surface and thenprocessed for electron microscopic study. This group is referred to asthe 0-1 5-min sample. Couplets were also cultured on the coverslip inL- 15 medium at 37°C for 4-8 (mean 6) h. All cultured adherent cellswere fixed with 1.5% glutaraldehyde in 0.1 Mcacodylate buffer, pH7.4, postfixed with 1% osmium tetroxide in 0.1 Mcacodylate buffercontaining 1% potassium ferrocyanide, en bloc stained with 0.5% ura-nyl acetate in 0.15 Msodium chloride, dehydrated in graded alcohol,and embedded in epon. The coverslips were mounted on the top of theflat end of the BEEMcapsule (Ted Pella, Inc., Tustin, CA). Afterpolymerization the coverslips were cracked and the cells were sec-tioned horizontal to the culture plane. Thin sections were stained withuranyl acetate and lead citrate and examined with an electron micro-scope (lOB; Carl Zeiss, Inc.) at 80 kV. Morphometric analyses were
bc
Figure 2. Diagrammatic representation of quantita-tive morphometric analyses of electron micrographcross-sections of canalicular spaces in IRHC. Theimage analysis cursor was traced first over the en-tire surface, including microvilli and canalicular pe-rimeter (. ) (measurement A); the secondtracing was over the canalicular perimeter acrossthe base of the microvilli (- -) (measurement B).bc, canalicular lumen; my, microvilli.
then carried out on electron micrographs of canalicular cross-sections(final magnification 12,740) using a Video-Plan II image analyzer(Carl Zeiss, Inc.) as illustrated in Fig. 2.
The image analysis cursor was first traced over the entire perimeterincluding each microvillus (A) to yield the actual canalicular cross-sectional surface area and total membrane perimeter. The cursor wasthen traced over the perimeter of the cross-section across the base ofthe microvilli (B), thus excluding them from calculations. The differ-ence (A - B) reflects the amount of membrane accounted for by themicrovilli. Analysis (B) corresponds more closely to the volume mea-surements carried out by light microscopy during optical planimetryfrom the video overlay, since visualization of microvilli is not possibleat this resolution.
Statistical methods. The significance of the change between the bileacid stimulated secretory rate relative to basal secretory rate in thesame couplet was determined using the paired t test. Stimulated secre-tory rates between choleretic agents were compared using the unpairedt test.
Results
IRHC cultured on glass without serum remained spherical for3-8 h after isolation as previously reported. The membraneslimiting the canalicular space resealed after isolation and thespace then expanded as secretion accumulated. Dilated cana-licular spaces were detectable by Nomarski optics by 90-120min after initial plating and, as previously described,12.7±4.7% of IRHC displayed canalicular spaces with diame-ter > 3 tim after 4 h in culture (10). After 4 h the ultrastructureof the couplets was usually normal except for an increase inautophagic vacuoles, and the canalicular membrane displayedmicrovilli on its surface.
Since the volume of the canalicular space, as measured byoptical planimetry in the hepatocyte couplet system, expandedwith time over the 4-h period in culture after initial plating, itwas important to determine if this expansion represented ac-crual of new apical membrane as opposed to distension of theoriginal canalicular lumen. Since the latter was lined with mi-crovilli after isolation of the couplets, it was possible that thelumen might dilate as pressure built up within this closedspace, with concomitant blunting of microvilli. Electron mi-crographs from 42 couplets (from 8 separate preparations)with a canalicular space diameter of 2-4 tim obtained 4 h afterculture were compared with similar thin-section electron mi-crographs of 36 couplets (5 experiments) obtained immedi-ately after isolation.
Table I gives the absolute values and ratios of the twomorphometrically measured parameters obtained from freshlyisolated couplets and those cultured for 4 h in L- 15 media.Canalicular spaces in the 4-8-h sample were divided into twogroups based on their ultrastructural appearance: one groupwith essentially normal microvilli and pericanalicular mor-
Optical Quantitation of Canalicular Bile Formation 567

Table I. Morphometric Analysis of the Effects of Time in Culture on Canalicular Membrane Perimeter (Pm) and Cross-sectional Areawith and without Microvilli (±MV) in IRHC
Canalicular perimeter (tim) Cross-sectional area of canalicular lumen (Am2)
Canal Pm Canal PmCulture Canal +MV -MV MVPm Ratio Area +MV Area -MV MVarea Ratio
time diameter A B A - B A/B A B A - B A/B
0-15 min o-i Im 10.8±5.4* 5.4±3 4.8±2.6* 1.9±0.25t 1.3±1.14* 1.05±1.0 0.25±0.16* 1.2±0.8n = 36
Normal (n = 37) 41.1±15* 23.0±6.8 18.2±8.9* 1.8±0.3t 17.8±6.5* 16.9±6.3 0.86±0.5* 1.05±0.034-8 h 2-4 tmn = 42
Cholestatic(n = 5) 25±7.1 19.3±4.8 5.4±3.6 1.3±0.18 13.7±3.6 13.4±3.5 0.38±0.31 1.02±0.02
Hepatocyte couplets were analyzed immediately after isolation (n = 36) or after 4-8 h in culture (n = 42). Measurements were limited to thosecouplets whose lumens had expanded to a diameter of 2-4 ,gm. Cholestatic couplets were defined as having widened pericanalicular ectoplasmand loss of microvilli. * P < 0.005. t Nonsignificant difference: normal couplets at 4-8 h compared with couplets immediately after isolation.
phology, and the other, cholestatic, group defined by thicken-ing of the pericanalicular ectoplasm and loss of microvilli onthe canalicular membrane, an appearance consistent with thecharacteristic ultrastructural morphology of cholestasis (10).
The actual area of the canalicular space after 4 h in culturemeasured from the electron micrographs in analysis (A) was95-97% of the cross-sectional area measured when the micro-villi were excluded in analysis (B). This latter measurementcorresponded to the optical planimetry method. Since volumewas calculated from the sum of all cross-sectional areasthrough the depth of the canalicular vacuole, the optical pla-nimetry volume measurements should closely approximatethe actual volume (0.95:1) since there was an error of overes-timation of only 3-5% based on the electron micrograph stud-ies. Furthermore, the error remained relatively constant whencanalicular spaces of various diameters from 1 to 4 ,um wereexamined. Thus, the canalicular microvilli did not introduce asignificant error in volume measurements as calculated by op-tical planimetry.
: :..:;..., 1 pm
....
Both the total canalicular membrane length and microvil-lar membrane length (A and A - B, respectively) increasedsignificantly from the 0-15-min sample to the 4-8-h sample(10.8±5.4 and 4.8±2.6 qm, and 41.1±14.7 and 18.2±9 ram,respectively). Since the total membrane area increased but theratio of A to B was essentially identical in freshly isolated cellsand after 4 h in culture, these findings indicate that there mustbe insertion of additional unit membrane into the canalicularmembrane domain with time in culture. Although the presentdata are from morphometric analyses of canaliculi with amaximum luminal diameter of 2-4 /Am (the most commonlystudied spaces for optical planimetry), similar analyses havebeen carried out on canalicular spaces with maximal diametersof 1-2 and > 4 pem and reveal identical findings.
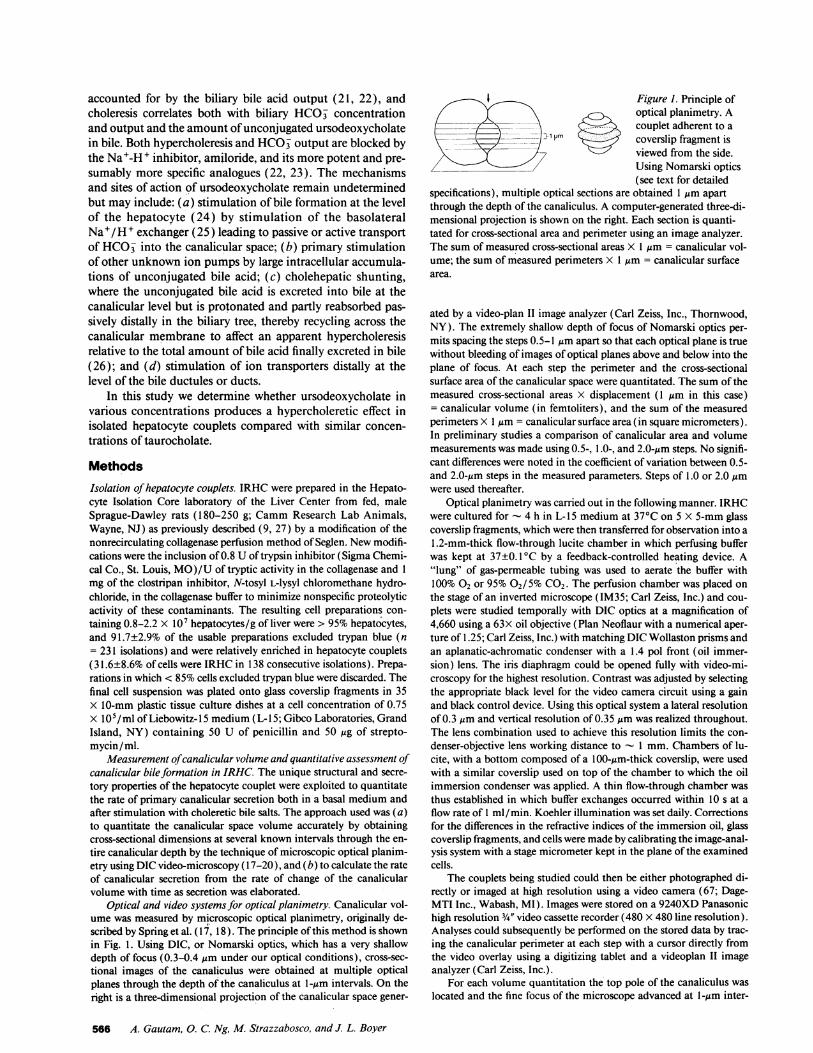
Canalicular volume measurements by optical planimetry.Serial cross-sectional images of a canaliculus from a hepato-cyte couplet were obtained at I-,rm intervals by optical pla-nimetry and are illustrated in Fig. 3. Direct photographs ofeight sequential optical planes are shown, beginning from the;.,iS :;::^2 .:5 __ l I&'.:.'.-fi:i. 1 1#. >'! b l b a.. .
.. Brig........ 52g :i;:"2.. .. :: 'as W.'. . E I,']2s: ' >',,'SS',5,,,. .,4 ,,..
..
:: :: 4 pm.. .. ........ ..... . ..... ....*: :. ::.: ::
.... .. .j,.M 1* . '.'::'. . ::'::';.,".lS i ;2 _1_ 5 22.* . v.tSs ! A..w l swa :9 F *t A-.. . ... A....
.. E.-.* .. . .i.d.. , :* . . . ..:
:; :2pm :A: 3 m
6pm 7:j;lm i'8:p
Figure 3. Optical planimetry of a single couplet. Cross-sectional images at 1 -,m intervals through the depth of a canaliculus from the top poleto the bottom end. (Nomarski optics, Kodak Panatomic-X, ASA32 film).
568 A. Gautam, 0. C. Ng, M. Strazzabosco, and J. L. Boyer

400
3004-
2004
100-
S
S \<0 0~
Control T 10 M Taurocholote
@1
5 10 15 20 25 30 35 40
TIME (min)
Figure 4. Effect of 10mMtaurocholate onrate of change of cana-licular volume in fem-toliters in isolated cou-plets. After several vol-ume measurements byoptical planimetry, theL- 1 5 perfusion mediumis changed to one con-taining 10 AsM tauro-cholate. Volume mea-surements are contin-ued at 3-5-minintervals to determinerate of change of cana-licular volume.
40,
30
20.
10
z
=) 40.,0
LA. 30.
M 20
z
10
r1
I
FL_
100 200 300 400 500 BO0 700 800
CANALICULARVOLUME(50-fl blocks)
100 200 300 400 500 600 700 800
CANAUCULARSURFACEAREA(50-Mm2 blocks)
Figure 6. Variability ofcanalicular volume(femtoliters) and sur-
face area (Amm2) at thepoint of the first vol-ume quantitation in thecontrol period. Thenumber of canaliculifrom each size category(50-,gl volume incre-ments) are indicated.
top of the canaliculus and proceeding through the middle ofthe space to the opposite end. These photographs demonstratethe moderately irregular shape and cross-sectional area of thecanaliculus although there is a substantial loss of contrastcompared with the video-enhanced microscopy from whichactual measurements were made.
The shape of the canalicular space was only infrequentlyspherical or ovoid and was usually asymmetrical with thelength of the canaliculus aligned variably, parallel or perpen-dicular to the z-axis (vertical axis) or at varying angles to it.Furthermore, expansion did not occur symmetrically in alldimensions. Thus, although calculations of canalicular vol-umeextrapolated mathematically from two-dimensional mea-surements at the largest diameter and based on the uniformassumption of a spherical canalicular shape are simpler andless time consuming, they are not applicable to the large pro-portion of IRHC. Canalicular volume calculations, based onthe above assumption, differ from planimetric measurementsby 13±33%, ranging from -40% to + 1 14%. Canalicular vol-umes were underestimated in 38% of couplets and overesti-mated in 62% of IRHC. Values of canalicular volume agreedto within 10% of planimetric volumes in 28% of couplets andto within 5% in only 14% of IRHC.
Wenext studied the basal secretion rate as calculated fromthe rate of canalicular volume change and compared this withthe effect of superfusion of 10 zM taurocholate (Fig. 4). Sev-eral measurements of the expanding canalicular volume were
made in L- 15 medium and represented the basal flow rate.
, r FigureS. Calculation of
measured parameters.
E:1 * pINCREASVOLUME Initial flow rate (ins , 1 / , (fi) femtoliters/ minute) is
the increase in canalicu-EXPANSIONTIME
(min) lar volume in femto-liters divided by the
/1WVOLUhlEINCREASE time in minutes of the
MIN duration of first periodINITIAL FLOWRATE (3-5 min) of quantita-
tion, in both the controlperiod and after exposure to the bile acid. Total volume increase (infemtoliters) is the total secretion from the point of exposure to thebile acid to the point when the space begins to collapse, and expan-
sion time (minutes) is the time elapsed between these two points.
Taurocholate (10 Am) -containing L- 15 medium was then su-
perfused and provoked a canalicular space expansion that in-creased progressively over 20 min until the canalicular spaceeither collapsed because of leakiness of the junctions or con-tracted. The secretory cycle was quantitated as illustrated(Fig. 5).
Fig. 6 represents the number and range of canalicular vol-umes and canalicular surface areas measured by this techniquefrom a total of 161 couplets. A considerable variation is notedin the volumes and surface areas of the canalicular spacesobserved during the 4-8 h after IRHC isolation.
Pooled data from a number of experiments is given inTable II. Basal bile flow rates averaged 3.8±1.3 fl/min in thecouplet system in unmodified L- 15 medium. L- 15 medium isa defined medium containing amino acids and nutrients but isnominally HCO3-free and contains no specific growth factors.Taurocholate and ursodeoxycholate in 10-MM concentrationsboth stimulated initial flow rate significantly and to compara-ble levels. Total volume also increased to comparable levelsbefore leakiness or contractions occurred. The expansion cycleaveraged 12±5 min after taurocholate administration and18±9 min after ursodeoxycholate, and correlated inverselywith the canalicular volume at the point of stimulation withthe bile acid (r = 0.54, P < 0.01; Fig. 7). Significant variabilitywas noted in the initial flow rate in each treatment groupdespite the same stimulating dose of bile acid (10 MM). Thisvariation in secretory rates correlated linearly with the initialcanalicular membrane surface area as illustrated in Fig. 8, sug-
Table II. Choleresis Induced by Bile Salts in IRHC
Initial flow rate Total secretion Expansion time
(fl/mi) ) (min)
Control (n = 28) 3.8±1.3(range 1.8-5.5)
Taurocholate 14±7 119±63 12±5(100,M, n = 40) (range 3-29)
Ursodeoxycholate 14±7 137±74 18±9(10M/M, n = 24) (range 6-25)
Optical Quantitation of Canalicular Bile Formation 569
C-,
0
C-)
I=_

r=0.54
. 0
0* 0~~~~e0 0~.
100 200 300 400 500 600 700 800
CANALICULARVOLUME (f 1)
Figure 7. Correlationbetween expansion timeand canalicular volumeat the point of exposureto taurocholate. A sig-nificant (P < 0.01) in-verse relationship isnoted between the twoparameters.
gesting that fluid flow in the couplet system is a function of thecanalicular surface area and is presumably related to either thenumber of bile acid transporters on the canalicular membrane,its total hydraulic conductivity, or both. Similar correlationsbetween flow rate and canalicular surface area were seen afterursodeoxycholic acid-induced secretion.
Fig. 9 shows the effect of various concentrations of urso-taurocholate on the bile flow rate in IRHC perfused with aKRB. The basal flow rate (7.6±2.1 fl/min representing a3.85±1.4% increase in canalicular vol/min, n = 19) was signif-icantly higher ( - twofold) than the basal flow rate in the L-1 5medium (see Table II). 100MgMtaurocholate induced a signifi-cantly greater initial rate of secretion (24.2±11.9 fl/min thatrepresents a 12.7±8.3% increase in canalicular vol/min afterexposure to the bile acid, n = 25) than 10 ,M taurocholate(16.6±7.2 fl/min, representing an 8.1±3.1% increase in cana-licular vol/min, n = 14). Neither 100 MMursodeoxycholate(17.2±7.2 fl/min; a 9±3.2% volume increase/min; n = 10)nor 200 MAMursodeoxycholate (15.3±8.1 fl/min, an 11.8±6%volume increase/min, n = 15) induced a hypercholeresiscompared with taurocholate. In taurine-depleted IRHC per-fused with a KRB-HCO3buffer, no hypercholeresis was notedin the 100-MM urso experimental group (18.7±7 fl/min, n= 18) compared with 20 uM taurocholate (20±10 fl/min, n= 1 1), similar to findings in normal IRHC.
Fig. 10 shows the effect of ursodeoxycholate on bile secre-tory rates in (3-alanine-pretreated, taurine-depleted IRHC thatwere both grown and perfused in bicarbonate and growth fac-tor containing nutrient medium (MEM supplemented with10% FCS). This protocol also eliminated a transfer step fromthe L- 15 growth medium to a salt solution (KRB perfusionbuffer). Bile secretory rates were measured in IRHC exposedto 100 ,M concentrations of ursodeoxycholate and taurocho-late and in untreated controls. Although the basal flow rateswere similar in both groups (controls: 3.8±4.7 fl/min, n = 18;taurocholate: 4.8±4.2 fl/min, n = 44; and ursodeoxycholate:5.1±3.4 fl/min, n = 52), 100 MMtaurocholate induced a sig-
40BASAL RATE * +
_ 35 COBILE-ACID SIMULATEDRATEE 30- 25~~~~20~~~~~~~~00
-J 15
0._CONTROL TC URSO TC URSO URSO
(10pM) (10o0) (100 M) (100 pM) (200UM)
Figure 9. Effect of var-ious concentrations oftaurocholate and urso-deoxycholate on thebile secretory rate inIRHC perfused withKRB. *P < 0.01 vs.paired basal secretoryrates. +P < 0.05 vs. 10MMursodeoxycholateand taurocholate and100 and 200 AMurso-deoxycholate. **NS vs.paired basal rates.
nificantly greater maximal rate of choleresis than ursodeoxy-cholate (taurocholate: 16.8±11.4 fl/min, n = 44; ursodeoxy-cholate: 9±6.33 fl/min, n = 52, P < 0.01), while the bilesecretory rate in controls was significantly lower than eitherbile acid (6.3±3.0; P < 0.005).
These studies suggest that ursodeoxycholate-induced hy-percholeresis in the intact liver does not occur by a direct acuteeffect of the bile acid on single hepatocyte secretory units.Norursodeoxycholic acid (50-100 MM), kindly provided byDr. Alan Hoffman, University of California San Diego Medi-cal School (San Diego, CA), which is a C-23 bile acid thatproduces a hypercholeresis in vivo and is not conjugated totaurine/glycine significantly (26), also failed to induce a hy-percholeresis in these IRHC (unpublished observations).
Discussion
IRHC in short-term culture provide a unique model thatfunctions as a primary unit of canalicular secretion. The vol-ume of the canalicular space increases as secretion occurs ex-clusively across the canalicular membrane independently ofhormonal or blood-flow effects or distal modifications of se-cretion by bile ductular cells. The rate of volume increase inunmodified L-15 medium reflects the baseline secretion rateand is significantly enhanced after exposure to the cholereticbile acids, taurocholate and ursodeoxycholate. Thus, theIRHC model provides a novel opportunity to measure canalic-ular secretion using quantitative video-microscopy techniquesthat record changes in canalicular volume.
Techniques for volume measurement of cells and inter-spaces by microscopic optical planimetry have been previously
0
* .0
0 0
0
000
* r=0.85* 0~
Figure 8. Correlation be-tween the initial flow rateand the initial canalicularsurface area, i.e., surfacearea of the canalicularspace at the point of firstexposure to the bile acid (P< 0.005). Each point rep-resents one experimentwhere the canalicular secre-tion rate is measured in aseparate couplet.
.EII
I
§-a]
30-
25.
20
I BASALRATEMiOLEACID
sliMULATED RATE
15-
10- ++
05-AifL±CONTROL TAUROCHOLATE URSO
(100 PM) (100 m)
Figure 10. Effect of 100 AMursodeoxycholate and tauro-cholate compared with un-treated controls on bile secre-tory rates in taurine-depletedIRHC, cultured and studied inbicarbonate-containing nu-trient medium (MEM+ 10%FCS). *JP < 0.001 vs. pairedbasal secretory rates; **P< 0.005 vs. maximal secretoryrate in untreated controls; +P< 0.01, taurocholate vs. urso-deoxycholate; `+NS vs. pairedbasal control rates.
570 A. Gautam, 0. C. Ng, M. Strazzabosco, and J. L. Boyer
30
.E_
L, 20
z0)( 10Vz
0.x
30
20
10
1-J
LEC
w
0 100 200 300 400 500 600 700CANAUCULARSURFACEAREA (Mm2)
* 0
* *0

validated by Spring et al. (17-19) and other investigators (30,31). The canalicular space is frequently irregular in shape anddoes not expand symmetrically in all dimensions. Extrapola-tions of canalicular volume measurements from single mea-surements at the largest diameter result in significant under- oroverestimations of canalicular volume and volume changes inthe basal or stimulated state, and do not compensate for spon-taneous modulation of canalicular shape with time. Nomarski(DIC) optics, which provide an extremely shallow depth focus,are ideal for optical sectioning of an irregular three-dimen-sional structure to quantitate its volume more accurately.
Video-microscopy also provides major advantages over vi-sualization by the human eye or by cine photomicrography. Avideo imaging device reacts linearly to light intensity and thuscan distinguish a larger number of gray scales in an imagecompared with the human eye which reacts logarithmically tolight intensity and also accommodates automatically (32). It ispossible to increase the numerical aperture of the condenserlens close to that of the objective lens, thereby increasing reso-lution while contrast in images is enhanced by adjusting theblack level. Finally, data storage and quantitative analyses areeasier to process compared with data on photographic film.
At the level of resolution of the light microscope, microvillilining the canalicular membrane can not be distinguished.However, these structures (0.1-0.2 Mmdiameter) account fora minor and relatively constant percentage of the total volumeof the canaliculus and this percentage remains virtually con-stant as canalicular space size increases with time in culture.Thus, the space occupied by the microvilli represents an insig-nificant error in the volume measurements of the canaliculus.
As the canalicular space expands over 4 h in culture afterplating, the total surface area of apical membranes increaseswithout significant loss or flattening of microvilli. Therefore,the volume increase during this time cannot be explained bysimple stretching of the membrane but must occur because ofaddition of new canalicular membrane with preservation ofrelatively normal microvillar architecture as the couplet reor-ganizes its remaining apical domain. The accrual of additionalcanalicular membrane presumably occurs incrementally withtime over 4-8 h in culture over repeated expansion/collapsecycles. Previous studies from our laboratory suggest that thismembrane reorganization process may depend on intact mi-crofilament function since cytochalasin D prevents relocationof canalicular remnant Mg "ATPase to the remaining canalic-ular domain between the two hepatocytes (10). This IRHCmodel should, therefore, be of interest in studies of membranedomain targeting and reorganization.
Canalicular volume increases slowly (3.8±1.3 fl/min) inthe basal L- 15 medium and presumably represents the rate ofnonbile acid-dependent canalicular bile formation in the iso-lated hepatocyte couplets in the absence of bile acids, serum,hormones, bicarbonate, and growth factors. The measuredvalue represents 10-15% of the total basal rate of secretion(both bile acid-dependent and independent) calculated for twohepatocytes in the intact, bile duct-cannulated rat with a 10-gliver containing 1 X 101 hepatocytes and 20-35% of the rate ofbasal secretion in the isolated perfused rat liver system (10-gliver, bile flow rate 1 ,ul/min per g liver wt without bile acidperfusion). Furthermore, when the perfusion medium con-tained bicarbonate, the basal rate of secretion increased by afactor of - 2 representing 40-70% of the basal secretory rate.However, additional systematic studies comparing bicarbon-
ate-containing or bicarbonate-free perfusion media are neededto further study the role of bicarbonate in basal canalicular bileformation.
Secretion in the couplet system occurs into a closed spacethat is separated from the perfusion medium by tight junc-tional structures that display selective permeability and elec-trical resistances consistent with conductances across a leakyepithelium ( 12). Thus, hydrostatic pressure presumably buildsup within the lumen as the space distends and the canalicularmembrane is stretched in a cycle of expansion and after addi-tion of choleretic bile acids. This pressure may also result inlower basal secretory rate observed. To minimize the effects ofhydrostatic forces on bile acid-stimulated secretion, initial flowrates were used in these studies to compare the choleretic ef-fects of sodium taurocholate and ursodeoxycholate.
Additions of either taurocholate and ursodeoxycholate (10uMM) resulted in stimulation of secretion to comparable levels(initial flow rate, 14±7 fl/min each). This bile acid-inducedincrement in the initial flow rate approximated 50-100% ofthat expected for two hepatocytes in the intact bile-duct can-nulated rat (I0-g liver) for 10-MgM concentrations of taurocho-late. Thus, with appropriate controls the IRHC is a suitablemodel for comparing both the effects of choleretic agents onstimulated bile secretory rates and for the role of various fac-tors on basal bile secretion.
The initial rate of expansion after bile acid stimulation wasquite variable and this may limit rapid detection of agents thatare weakly choleretic at the canalicular level. While some ofthe variability in secretory rates might result from differencesin the zonal origin of the couplets (centrizonal or periportal),the initial flow rates correlated well with the surface area of thecanaliculus at the time of addition of the bile acids, suggestingthat the rate of canalicular fluid secretion is either a function ofthe number of transport carriers on the canalicular membraneor a larger net hydraulic conductivity for H20. Since it is likelythat during acute bile acid choleresis the relatively rapid ex-pansion of the canalicular space is the result of canalicularstretching rather than significant addition of new membrane,another physical factor that could account for this phenome-non is described by Laplace's law, which predicts that less force(secretion pressure) is required to overcome the wall tension inthe larger canalicular spaces. However, Laplace's law wouldapply more closely when the canalicular space is maximallydistended immediately before the time when the space con-tracts or collapses rather than during the earliest phase of ex-pansion, i.e., when the initial flow rate is calculated.
In the present study the duration of the expansion time,i.e., from the point of stimulation with the bile acid to theonset of collapse, was also variable but was inversely related tothe degree of "filling" of the canalicular space at the point ofstimulation with the choleretic agent. Thus, canalicular spacesthat were expanded relative to their surface area (initial cana-licular volume/canalicular surface area ratio > 1) contractedor collapsed sooner than those in which volume was relativelyless compared with their surface area. This inverse relationshipbetween the degree of expansion and time of collapse stronglysuggests that the collapse/contraction phenomenon is notspontaneous but is a functioi. of the filling pressure and dis-tension of this closed canalicular space.
When the canalicular space is maximally expanded, leaksdevelop in the tight junction and the space collapses. However,this collapse may subsequently also involve active contraction
Optical Quantitation of Canalicular Bile Formation 571

of the cytoskeleton in the submembrane region since microfi-lament inhibitors (cytochalasins) inhibit this contraction pro-cess (33). After collapse or contraction of the space the tightjunctions apparently reseal and another cycle of expansionbegins, according to Phillips' group. Rapid reassembly andrepair of transiently ruptured tight junctions has been ob-served previously in organ and tissue culture systems (34, 35).The frequency of collapse/contraction episodes in our studywas much slower than the 3-5-min frequency reported pre-viously by Phillips and co-workers (36). This difference maybe accounted for in part by a lower basal secretion rate in theunmodified and unenriched L- 15 medium. However, thephase-contrast optics imaging system, as used by these authorsin a single plane of focus at the largest diameter, may, duringtime-lapse cine-micro-photography, register a modulation ofcanalicular shape as a partial contraction and thereby record ahigher rate of contractions (37).
A major finding in these studies is the absence of hyper-choleresis after exposure of IRHC to various concentrations ofursodeoxycholate (10, 100, or 200 ,M) compared with tauro-cholic acid, suggesting that the ursodeoxycholate-induced hy-percholeresis observed in the intact liver does not occur by adirect acute effect of this bile acid on an individual hepatocytesecretory unit. This conclusion is strengthened by the absenceof hypercholeresis in isolated couplets that were depleted oftaurine. This protocol minimizes taurine conjugation of urso-deoxycholate to tauroursodeoxycholate which is not hyper-choleretic and might otherwise mask an acute hypercholereticeffect. Hypercholeresis was absent in couplets perfused witheither KRB or a bicarbonate-containing nutrient medium,MEM. Preliminary experiments in collaboration with Dr. A.Hoffman (University of California, San Diego) revealed thatnorursodeoxycholate, a C-23 bile acid that is not significantlyamidated and is excreted largely unconjugated into bile (26),was also not hypercholeretic in this IRHC system.
It is possible that an ursodeoxycholic acid-induced hyper-choleresis is masked in the IRHC model due to increased tightjunctional permeability to putative osmotically active inor-ganic ionic species that might be secreted in response to thisbile acid. However, preliminary studies demonstrate thatcAMPanalogues and forskolin, a direct activator of endoge-nous adenylate cyclase, which induce secretion in a variety ofepithelia primarily by stimulating electrolyte secretion, alsostimulate canalicular bile flow in IRHC (38, 39).
Thus, ursodeoxycholate-induced hypersecretion in the in-tact animal could either be based on repeated cycling of thebile acid across the canalicular membrane (the cholehepaticshunt pathway, 25) or result from a primary action of the bileacid at sites distal to the bile canaliculus.
Another interesting observation is the lack of difference incholeretic response between 10-, 100-, or 200-,gM concentra-tions of ursodeoxycholate in contrast to significant differencesin bile secretion induced by 10- and I 00-,uM taurocholate. Theinitial flow rates measured in these studies reflect the osmoticeffects of bile acids secreted into the canalicular lumen. Theseobservations suggest that saturation of the bile acid transportmechanisms occurs at lower intracellular concentrations ofursodeoxycholic acid than taurocholic acid in this primarysecretory unit. Since ursodeoxycholic acid produces a dose-dependent increase in bile flow in vivo, recruitment of addi-tional secretory units within the hepatic lobule may occurrather than increased secretion at the level of each secretory
unit. If this hypothesis is true, relatively more secretory unitsshould be recruited within the hepatic lobule by ursodeoxy-cholate compared with equivalent doses of taurocholate.
Acknowledaments
This work was supported in part by a Pilot Project from a NationalInstitutes of Health Liver Center grant DK-34984 and DK-25636. Dr.Strazzabosco was a recipient of North Atlantic Treaty Organization-Consiglio Nazionale delle Ricerche Advanced Fellowship ProgramAward.
References
1. Boyer, J. L. 1986. Mechanisms of bile secretion and hepatictransport. In Physiology of Membrane Disorders. T. E. Andriole, F.Hoffman, and D. D. Fanestil, editors. Plenum Publishing Corp., NewYork. 609-636.
2. Klassen, C. D., and J. B. Watkins. 1984. Mechanisms of bileformation, hepatic uptake and biliary excretion. Pharmacol. Rev.36:1-67.
3. Scharschmidt, B. F., and R. W. van Dyke. 1983. Mechanisms ofhepatic electrolyte transport. Gastroenterology. 85:1199-1214.
4. Graf, J. 1983. Canalicular bile salt-independent bile formation:concepts and clues from electrolyte transport in rat liver. Am. J. Phy-siol. 244:G233-G246.
5. Arias, I. M. 1986. Mechanisms and consequences of ion trans-port in the liver. In Progress in Liver Diseases. Vol. VIII. H. Popperand F. Schaffner, Editors. Grune & Stratton, Inc., NewYork. 145-160.
6. Inoue, M., R. Kinne, T. Tran, and I. M. Arias. 1982. Taurocho-late transport by rat liver sinusoidal membrane vesicles: evidence ofsodium cotransport. Hepatology (Baltimore). 2:572-579.
7. Meier, P. J., E. S. Sztul, A. Reuben, and J. L. Boyer. 1984.Structural and functional polarity of canalicular and basolateralplasma membrane vesicles isolated in high yield from rat liver. J. CellBiol. 98:991-1000.
8. Inoue, M., R. Kinne, T. Tran, L. Biempica, and I. M. Arias.1983. Rat liver canalicular vesicles: isolation and topographical char-acterization. J. Biol. Chem. 258:5183-5188.
9. Graf, J., A. Gautam, and J. L. Boyer. 1984. Isolated rat hepato-cyte couplets: a primary secretory unit for electrophysiological studiesof bile secretory function. Proc. Natl. Acad. Sci. USA. 81:6516-6520.
10. Gautam, A., 0. C. Ng, and J. L. Boyer. 1987. Isolated rathepatocyte couplets in short-term culture: structural characteristicsand plasma membrane reorganization. Hepatology (Baltimore).7(2):216-223.
11. Oshio, C., and M. J. Phillips. 1981. Contractility of bile canalic-uli: implications for liver function. Science (Wash. DC). 212:1041-1042.
12. Graf, J., R. M. Henderson, B. Krumpholz, and J. L. Boyer.1987. Cell membrane and transepithelial voltages and resistances inisolated rat hepatocyte couplets. J. Membr. Biol. 95:241-254.
13. Henderson, R. M., J. Graf, and J. L. Boyer. 1987. Na-H ex-change regulates intracellular pH in isolated rat hepatocyte couplets.Am. J. Physiol. 252:G109-G1 13.
14. Boyer, J. L., 0. C. Ng, and A. Gautam. 1985. Formation ofcanalicular spaces in isolated hepatocyte couplets. Prog. Am. Assoc.Physicians. XCVIII:21-29.
15. Sakisaka, S., 0. C. Ng, J. Bouderdaben, and J. L. Boyer. 1988.Evidence for tubulovesicular transcellular transport of horseradishperoxidase (HRP) in isolated rat hepatocyte couplets in short-termculture. Gastroenterology. 95:793-804.
16. Boyer, J. L., A. Gautam, and J. Graf. 1988. Mechanisms of bilesecretion: insights from the hepatocyte couplet. Semin. Liver Dis.8:308-316.
17. Spring, K. R., and A. Hope. 1979. Fluid transport and dimen-sions of cells and interspaces of living Nectarus gallbladder. J. Gen.Physiol. 73:287-305.
572 A. Gautam, 0. C. Ng, M. Strazzabosco, and J. L. Boyer

18. Persson, B.-E. and K. R. Spring. 1982. Gallbladder epithelialcell hydraulic water permeability and volume regulation. J. Gen. Phy-siol. 79:481-505.
19. Fisher, R. S., and K. R. Spring. 1984. Intracellular activitiesduring volume regulation by Nectarus gallbladder. J. Membr. Biol.78:187-199.
20. Gautam, A., D. M. Scaramuzza, and J. L. Boyer. 1986. Quan-titative assessment of primary canalicular secretion in isolated rat he-patocyte couplets by optical planimetry. Gastroenterology.90(5):1727a. (Abstr.)
21. Dumont, M., S. Erlinger, and S. Uchman. 1980. Hypercholer-esis induced by ursodeoxycholic acid and 7-ketolithocholic acid in therat: possible role of bicarbonate transport. Gastroenterology. 79:82-89.
22. Lake, J. R., R. W. Van Dyke, and B. F. Scharschmidt. 1987.Effect of Na+ replacement and amiloride on ursodeoxycholic acid-stimulated choleresis and biliary bicarbonate secretion. Am. J. Physiol.252 (Gastrointest. Liver Physiol. 15):G 163-G 169.
23. Renner, E. L., J. R. Lake, E. J. Cragoe, R. W. Van Dyke, andB. F. Scharschmidt. 1988. Ursodeoxycholic acid choleresis: relation-ship to biliary HCO- and effects of Na'-H' exchange inhibitors. Am.J. Physiol. 254 (Gastrointest. Liver Physiol. 17):G232-G241.
24. Kitani, K., and S. Kanai. 1985. Ursodeoxycholate-inducedcholeresis in taurine-deprived and taurine-supplemented rats. Jpn. J.Physiol. 35:443-462.
25. Moseley, R. H., P. J. Meier, P. S. Aronson, and J. L. Boyer.1986. Na-H exchange in rat liver basolateral but not canalicular mem-brane vesicles. Am. J. Physiol. 260:G35-43.
26. Yoon, Y. B., L. R. Hagey, A. F. Hoffman, D. Gurantz, E. L.Michelotti, and J. H. Steinbach. 1986. Effect of side-chain shorteningon the physiologic properties of bile acids: hepatic transport and effecton biliary secretion of 23-Norursodeoxycholate in rodents. Gastroen-terology. 90:837-852.
27. Blitzer, B. L., S. L. Ratoosh, C. B. Donovan, and J. L. Boyer.1982. Effects of inhibitors of Na+-coupled ion transport on bile aciduptake by isolated rat hepatocytes. Am. J. Physiol. 243:G48-53.
28. Strange, K., and K. R. Spring. 1987. Absence of significant
cellular dilution during ADH-stimulated water absorption. Science(Wash. DC). 235:1068-1070.
29. Shaffer, J. E., and J. J. Kocsis. 1981. Taurine mobilizing effectof beta alanine and other inhibitors of taurine transport. Life Sci.28:2727-2736.
30. Capri-Medina, P., B. Lindemann, E. Gonzalez, and G. Whit-tembury. 1984. The continuous measurement of tubular volumechanges in response to step changes in contraluminal osmolality.Pfluegers Arch. Eur. J. Physiol. 400:343-348.
31. Davis, C. W., and A. L. Finn. 1981. In Membrane Biophysics 1.Physical Methods in the Study of Epithelia. M. A. Dinno et al., editors.Alan R. Liss, Inc., NewYork. 25-36.
32. Inoue, S. 1986. Physiological characteristics of the eye. In Vi-deomicroscopy. Plenum Publishing Corp. 71-92.
33. Phillips, M. J., C. Oshio, M. Miyairi, and C. R. Smith. 1983.Intrahepatic cholestasis as a canalicular motility disorder: evidenceusing cytochalasin. Lab Invest. 48:205-211.
34. Meldolesi, J., G. Castiglioni, R. Parma, N. Nassivera, and P.DeCamilli. 1978. Ca++-dependent disassembly and reassembly of oc-cluding junctions in guinea pig pancreatic acinar cells. Effect of drugs.J. Cell Biol. 79:156-172.
35. Kachar, B., and P. DaSilva. 1981. Rapid massive assembly oftight junction strands. Science (Wash. DC). 213:541-544.
36. Miyairi, M., C. Oshio, S. Watanabe, C. R. Smith, I. M. Yousef,and M. J. Phillips. 1984. Taurocholate accelerates bile canalicularcontractions in isolated rat hepatocytes. Gastroenterology. 87:788-792.
37. Boyer, J. L. 1987. Contractile activity of bile canaliculi: con-traction or collapse? Hepatology (Baltimore). 7 (1): 190-192.
38. Gautam, A., A. Ma, T. Mcguire, J. N. Forrest, E. R. Gordon,and J. L. Boyer. 1986. Forskolin, but not its cyclase inactive analog,stimulates choleresis in the isolated perfused rat liver. Hepatology(Baltimore). 1169a. (Abstr.)
39. Nathanson, M. J., and A. Gautam. 1988. Activation of endoge-nous adenylate cyclase (AC) stimulates choleresis in isolated rat hepa-tocyte couplets (IRHC). Gastroenterology. 94:619a. (Abstr.)
Optical Quantitation of Canalicular Bile Formation 573