Quantitative Analysis of Hedge Fund and Managed Futures Return and Risk Characteristics
32
1 Quantitative Analysis of Hedge Fund and Managed Futures Return and Risk Characteristics Thomas Schneeweis* Richard Spurgin** *Professor of Finance, University of Massachusetts **Assistant Professor of Finance, Clark University CISDM Abstract Recent research has shown that, for stock and bond mutual fund investors, multi-factor models often provide improved explanatory power regarding the return structure of these investment vehicles. While the sources of return to actively managed assets in the mutual fund industry have been extensively studied, little research exists on the factors explaining the performance of managed futures investment or hedge funds. Hedge funds and commodity trading advisors have different trading styles and trading opportunities than traditional stock and bond mutual fund managers. As a result, factors that incorporate the possibility of returns to trending prices, short sales, and volatility may better capture their relative return movement. Previous studies have focused on explanatory factors unique to a particular asset class. In this study the same set of factors is used to describe return movement across each of the asset classes studied. Results indicate that a different set of factors explains returns to mutual funds, hedge funds and managed futures, and that each can contribute to a diversified investment portfolio. Please send all correspondence to: Thomas Schneeweis CISDM/School of Management University of Massachusetts Amherst, Massachusetts 01003 Phone: 413-545-5641 Fax: 413-545-3858 Email: [email protected] *The authors would like to thank the Foundation for Managed Derivatives Research for their support in this research. The results of this study represent the conclusions of the authors and do not necessarily reflect the opinions of the foundation.
Transcript of Quantitative Analysis of Hedge Fund and Managed Futures Return and Risk Characteristics
1
Quantitative Analysis of Hedge Fund and Managed FuturesReturn and Risk Characteristics
Thomas Schneeweis*Richard Spurgin**
*Professor of Finance, University of Massachusetts**Assistant Professor of Finance, Clark University
CISDM
Abstract
Recent research has shown that, for stock and bond mutual fund investors, multi-factor models often provideimproved explanatory power regarding the return structure of these investment vehicles. While the sources of returnto actively managed assets in the mutual fund industry have been extensively studied, little research exists on thefactors explaining the performance of managed futures investment or hedge funds. Hedge funds and commoditytrading advisors have different trading styles and trading opportunities than traditional stock and bond mutual fundmanagers. As a result, factors that incorporate the possibility of returns to trending prices, short sales, and volatilitymay better capture their relative return movement. Previous studies have focused on explanatory factors unique to aparticular asset class. In this study the same set of factors is used to describe return movement across each of theasset classes studied. Results indicate that a different set of factors explains returns to mutual funds, hedge funds andmanaged futures, and that each can contribute to a diversified investment portfolio.
Please send all correspondence to:Thomas SchneeweisCISDM/School of ManagementUniversity of Massachusetts Amherst, Massachusetts 01003Phone: 413-545-5641 Fax: 413-545-3858Email: [email protected]
*The authors would like to thank the Foundation for Managed Derivatives Research for their support in this research.The results of this study represent the conclusions of the authors and do not necessarily reflect the opinions of thefoundation.
2
Quantitative Analysis of Hedge Fund and Hedge FundReturn and Risk Characteristics
Introduction
The past decade has witnessed a dramatic increase in the use of stock and bond mutual funds as stand-alone
investments or as part of an investor’s diversified portfolio. Moreover, recent research [Sharpe, 1992; Elton et al.,
1995] has shown that for stock and bond mutual fund investors, multi-factor models often provide improved
explanatory power regarding the return structure of these investment vehicles. While the sources of return to actively
managed assets in the mutual fund industry have been extensively studied, little research exists on the factors
explaining the performance of alternative investments such as hedge funds1 or managed futures investment2.
This is important for several reasons. First, hedge funds and commodity trading advisors have different
trading styles (e.g., long and short positions and leverage) and trading opportunities (e.g., commodity and currency
markets) than traditional stock and bond mutual fund managers. As a result, factors which incorporate the possibility
of trending prices (up or down) may better capture their relative return movement. Second, previous studies have
focused on explanatory factors unique to a particular asset class. In this study the same set of factors is used to
describe return movement across each of the asset classes studied. Previous research [Lintner, 1983; Schneeweis,
1996] has indicated the potential benefits to including alternative investments in stock and bond portfolios. However,
the factors that explain the differences in the return of managed futures, hedge funds, and traditional stock and bond
funds have not been explored.
Sources of Return to Hedge Fund and Managed Derivative Investments
Much of the previous research on managed futures [Elton et al, 1992; Edwards and Ma, 1988; and
McCarthy et al., 1996] compares historical CTA returns to the realized returns of public commodity funds or CTAs,
1 Hedge funds invest in futures and options as well as cash commodity, currency, and security markets.
3
with the goal of identifying the usefulness of historical returns in forecasting future performance. This study uses
factors designed to capture the trading opportunities available to a CTA or hedge fund (e.g., arbitrage, overvalued
markets) as a means of forecasting of return performance.
Previous research employs historical CTA performance as a proxy for the source of return. Irwin et al.
[1994] use a simple managed futures benchmark as the best forecast of an individual CTA’s return, while McCarthy
et al. [1997] propose a single index benchmark with a Bayesian risk adjustment designed to capture differences in
leverage relative to the underlying benchmark. While this research sheds light on how CTAs perform relative to one
another it does not address the underlying source of CTA return. , Mitev [1996] suggests a five-factor model for
CTAs that emphasizes the differential CTA trading strategies. Mitev concludes that the CTAs in his sample fall
primarily into 1) trend following strategies, 2) surprise or stop-loss control models, 3) agricultural markets, 4)
spread-strategies (primarily interest rate) and 5) fundamental economic factors or global markets.
Academic research on the sources of hedge fund returns is less well developed than for CTAs. Fung and
Hsieh [1996] use factor-analytic approaches to determine the common factors that help explain hedge fund return
patterns. Fung and Hsieh identify five general investment approaches (distressed, global/macro, systems,
systems/opportunistic, and value) that are shown to explain most hedge fund return variation. Of these five groups,
global/macro, systems, and systems/opportunistic were shown to have factors not easily explained by the factors
common to stock funds, bond funds, distressed funds, or value funds. Fung and Hsieh do not determine if the
difference is due primarily to differences in trading strategy or to differences in asset markets traded, but conclude
that the differences occurred in time periods when rallies or severe declines were experienced. Like Mitev, Fung and
Hsieh use factor analysis to identify funds with common factors, but does not conduct multi-factor regression aimed
at determining what those factors are.3
CTAs and many hedged funds derive much of their return from derivatives. However, the derivatives market
is, by definition, a zero-sum game. In order for these strategies to offer returns that exceed the cost of capital the
other players in these markets, principally hedgers, must experience returns on their derivative transactions that are
2 Investments managed by commodity trading advisors (CTAs), who trade primarily futures and options.3 The use of derived variables which attempt to replicate the factor loading in multi-factor regression models isconsistent with research conducted in equity research [Chen and Jorden, 1993].
4
less than the riskless rate of return. Empirical research [Schneeweis, 1996; Schneeweis and Spurgin, 1998] that
studies the historical performance of CTAs and hedge funds clearly demonstrates that these assets have offered
positive, risk-adjusted returns. Theoretical studies of derivative market structure have identified many potential
sources of this risk premium in trading derivative-based products.
• Futures and options investors may simply hold positions that mimic the return of the underlying cashasset, which would yield a positive expected return if, as with stock index futures, the underlying assethad an expected return greater than the cost of financing.
• Speculative traders offer liquidity to hedgers. An imbalance between hedging demand from long hedgersand short hedgers may create opportunities to earn returns by purchasing (providing) the excess supply(demand) from the hedging community.
• Transaction costs in futures and options markets are generally lower than for comparable cashinstruments. Low transactions costs may allow derivatives traders to exploit information about an asset'svalue that is too small for investors in cash instruments to utilize profitably.
• Many academic studies [Chan et al, 1996, Silber, 1994] have shown that momentum-based tradingstrategies are profitable over time. While most of these studies were conducted on equity markets, suchthat the momentum profits may not be large enough to cover the cost of transacting the trades, derivativemarkets may offer the opportunity to earn these returns because of their low transactions costs and highleverage.
• Options traders may be able to create positions that offer a risk premium in exchange for acceptingexposure to certain portions of the return distribution of the underlying security.
• Options traders also have the ability to create positions that may profit from changes in expectedvolatility of the underlying asset. Investors in cash instruments can only profit from changes in the valueof the underlying asset.
Thus, for the hedge funds and managed futures funds, theoretical and empirical models of return estimation
may necessarily be based on the anticipated trading style of the hedge fund manager. For instance, hedge funds
focusing on pure zero-risk arbitrage positions will have the risk free rate as a benchmark. If the hedge fund focuses
on long international equity then international equity benchmarks similar to that used for traditional international
mutual funds may be regarded as standard [Fung and Hsieh, 1996]. Many factors have been proposed to explain the
higher risk-adjusted returns earned by hedge funds in recent years as compared to mutual funds that trade similar
assets [Ackermann, 1998]
• Hedge funds have a larger set of potential investments available to them than mutual funds. Forinstance, hedge funds can purchase restricted stock and debt, use short sales to profit from overvalued
5
securities, and are better suited to influence the management of companies in which they hold debt orequity stakes.
• Hedge funds can use leverage to amplify returns to a particular strategy. If a mutual fund manager and ahedge fund manager identify the same mispriced security, the mutual fund can only allocate a portion ofthe available investment capital, while the mutual fund manger can allocate several times the investedcapital base. Furthermore, if the mispriced security is overpriced, the mutual fund manager cannot takeadvantage because of short sale restrictions.
• Hedge funds are not required to offer daily liquidity, and often have lockup provisions longer than a year. This allows hedge funds to take illiquid positions that may be very difficult to mark to market, but willoffer positive risk-adjusted returns.
Thus, to the degree that different factors explain the returns to managed futures, hedge funds, and stock
and bond fund returns, each may provide investors exposure to unique sources of return, and, provide an important
source return to a diversified investment portfolio.
Data and Methodology
Returns for all data series are expressed as monthly holding period returns. The test period, covering six
years from January 1990 through December 1995, was chosen because several managed futures and hedge fund
indexes started in 1/90. Monthly data are used because most CTAs and hedge funds report results monthly.
Hedge fund indexes are supplied by Hedge Fund Research (HFR) and Evaluation Associates Capital
Management (EACM). CTA indexes are provided by Managed Accounts Reports (MAR), Barclay Trading
(Barclay), and EACM. Mutual fund returns are from Morningstar. The asset class benchmarks employed are the
Standard and Poors 500 stock index (SP500), the Salomon Brothers government bond index (SBBI), the Goldman
Sachs Commodity Index (GSCI), and the US Dollar trade-weighted currency index (USDX). The Mount Lucas
Management index (MLM) is used as a proxy for timing skill. Other indexes employed in the study include the
MSCI World Equity index, the Salmon World Government Bond index, the US producer price index (PPI) and the
return on US 30-day Treasury bills. The source for the benchmark data is Datastream.
To understand the differences between top performing, average, and bottom performing managers in each
class, indexes were created from returns to individual managers. The top five, median, and bottom five CTA, hedge
fund and Growth & Income mutual funds were selected. An equally weighted portfolio of their performance was
computed. For CTAs and hedge funds, a subset was also selected. The CTA subset consists of all CTAs that
6
identified themselves as Diversified (a total of 66 CTAs) and the hedge fund subset consists of funds that identified
themselves as Opportunity funds (15 funds). Portfolios of the top five, median, and bottom five for each subset were
constructed.
Statistical tests include descriptive risk and return characteristics and a number of return correlations. These
correlations include each asset's correlation with nominal and absolute value of factor indexes, with the intramonth
standard deviation of the indexes, and with the maximum intramonth drawdown and drawup as well. Multiple
regression analysis is conducted using CTA, hedge fund, and stock and bond fund indexes as the dependent variables
and the nominal, absolute value, and intramonth standard deviation of indexes as explanatory variables.
Returns to active management of stock, bond, CTA, and hedge fund investments are assumed to flow from
four sources:
1. A natural return to owning financial and real assets. This is modeled by including the nominal value ofstock (SP500), bond (SBBI), commodity (GSCI), and currency (USDX) index returns.
2. Flexibility to use both long and short positions to benefit from market timing skill. This is capturedwith the absolute value of the monthly returns of the underlying asset markets.
3. Intramonth volatility. Managers can profit from intramonth volatility either by using option strategies orthrough intramonth timing strategies. Returns to this factor are modeled by the intramonth standarddeviation of the indexes and by computing the maximum drawup and drawdown of the index for eachmonth.
4. Market inefficiencies that result in temporary trends in prices. A proxy for this is the MLM index,which captures the return to a moving average strategy using 20 active commodity and financial futures.
This common set of factors is used to explain the returns to active management of hedge funds, stock and
bond mutual funds, and CTAs.
Results
A. Managed Futures, Hedge Fund, Stock and Bond Indices: Descriptive Statistics
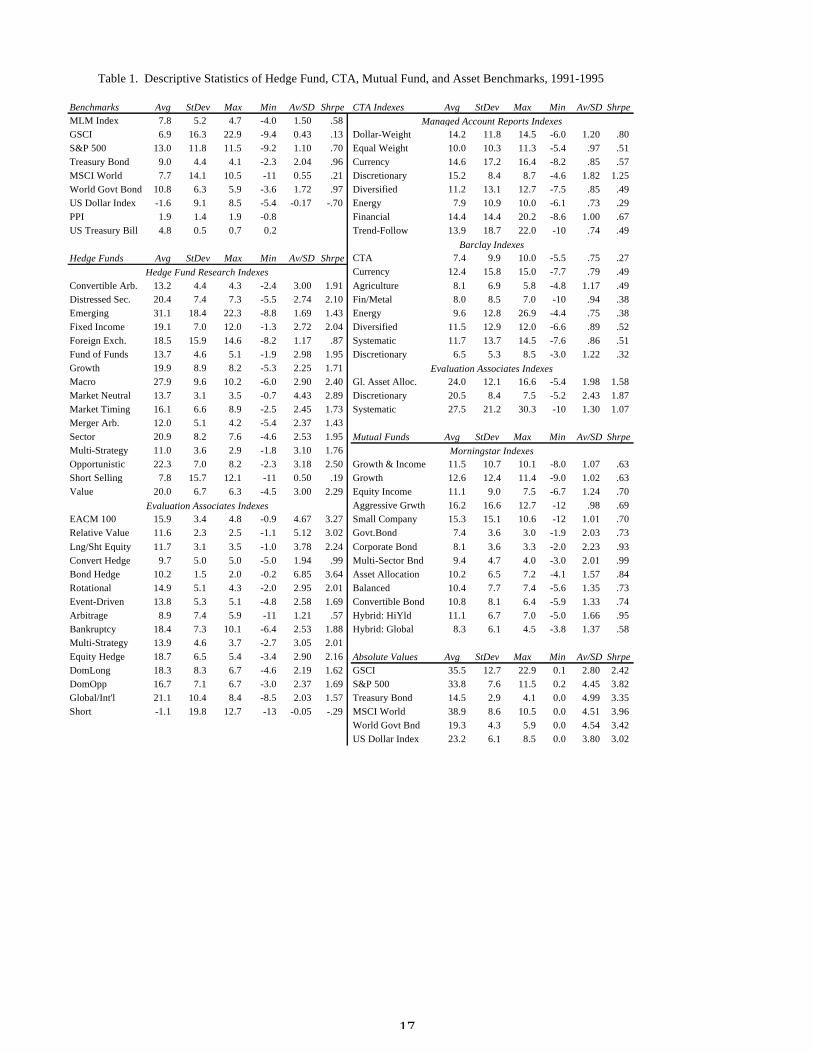
Table 1 gives descriptive statistics of the data used in this study. Included are the average annual return,
standard deviation, maximum and minimum monthly return, the information ratio4, and the Sharpe ratio for each of
4 The information ratio is the ratio of average return to standard deviation. It is similar to the Sharpe ratio, but does not adjust the returnby the Treasury Bill rate. We employ this measure in addition to the Sharpe ratio because the Sharpe ratio implicitly assumes a USinvestor whose risk-free rate is accurately described by the Tbill rate. The information ratio is a purely statistical measure of variabilityand assumes nothing about the behavior of investors.

7
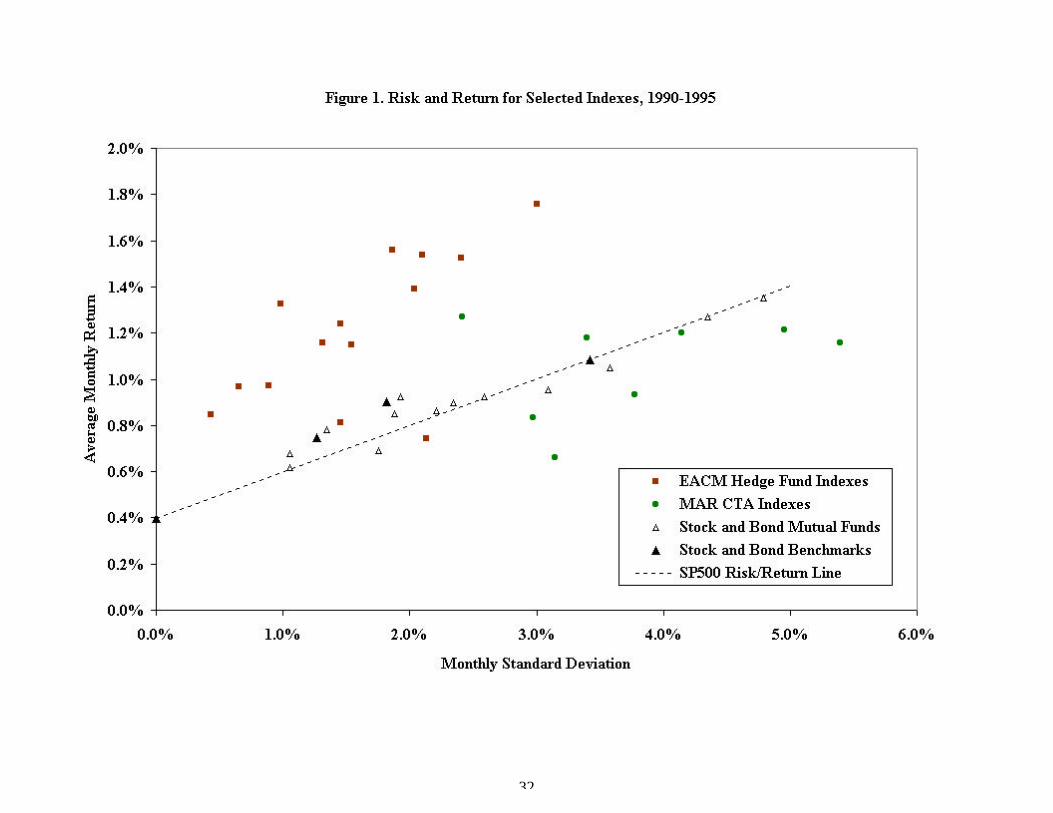
the CTA, hedge fund, and stock and bond fund indexes as well as the unmanaged indexes. Figure 1 shows a subset of
the indexes plotted in return/standard deviation space.
----------------------- Insert Table 1 and Figure 1 about here -------------------------
Results in Table 1 and Figure 1 are generally consistent with the hypothesis that stock and bond funds, hedge
funds, and managed futures investments have different risk and return structures. For the period of analysis, fixed
income and market-neutral hedge fund strategies dominate in terms of risk/return tradeoff, while hedge fund styles
which concentrated primarily on equity short selling joined passive commodity investment (GCSI) and certain
managed futures strategies in providing the lowest return/risk ratios. Figure 1 shows that during the test period
studied, most of the hedge fund categories offered higher risk-adjusted returns higher than that available by allocating
assets to the SP500 and cash. However, most mutual fund indexes are clustered very close to this line. CTA
performance measures are more widely scattered, but are generally a bit below the line.
While results in Table 1 provides evidence that these assets have different historical risk/return tradeoffs, it
does not explain what the determinants of that return are. The following section describes the results of multivariate
analysis of the returns. Results indicate that certain asset management strategies derive their return primarily from
the nominal value of assets (e.g., mutual funds), while others derive their return primarily from the absolute value
and intramonth volatility of the same indexes (e.g. hedge funds and managed derivative strategies).
B. Managed Futures, Hedge Fund, Stock and Bond Indices: Simple Correlations
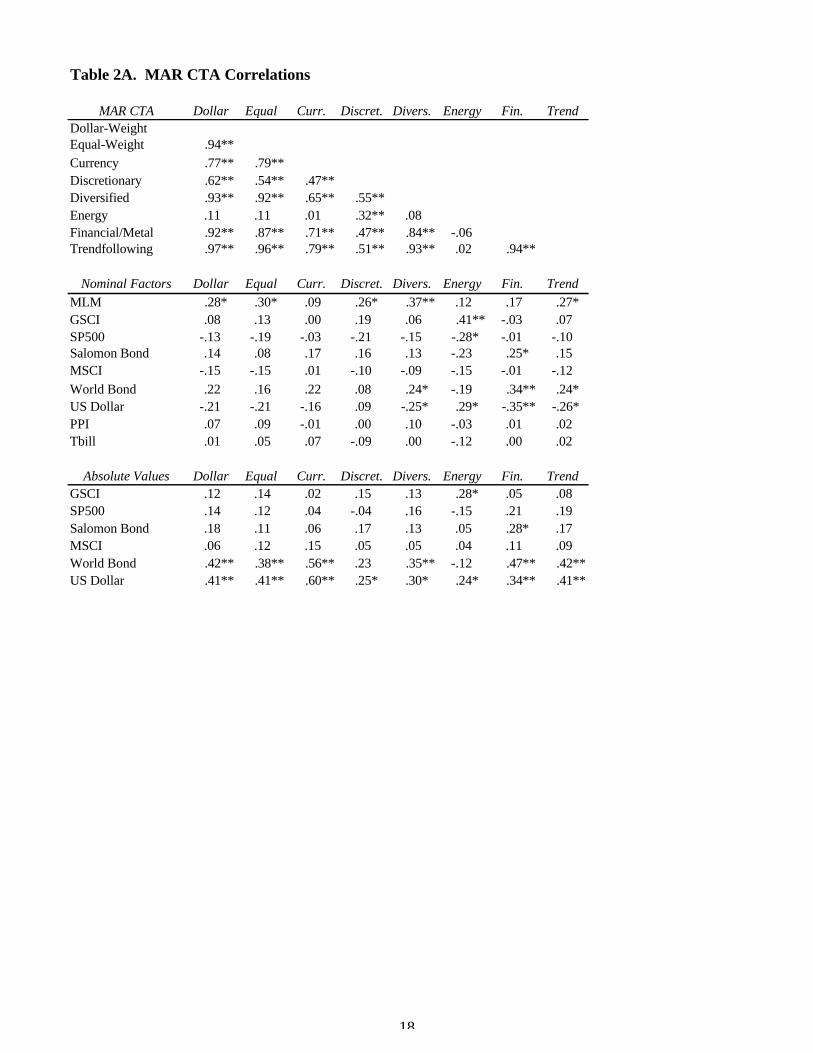
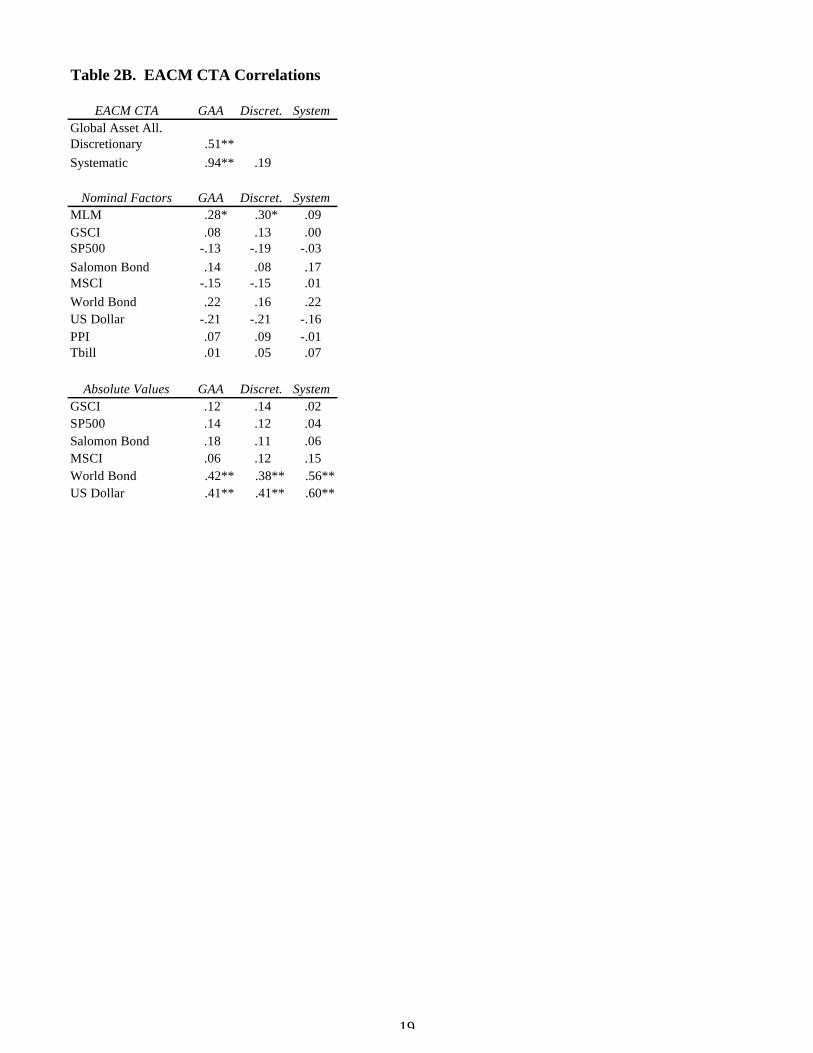
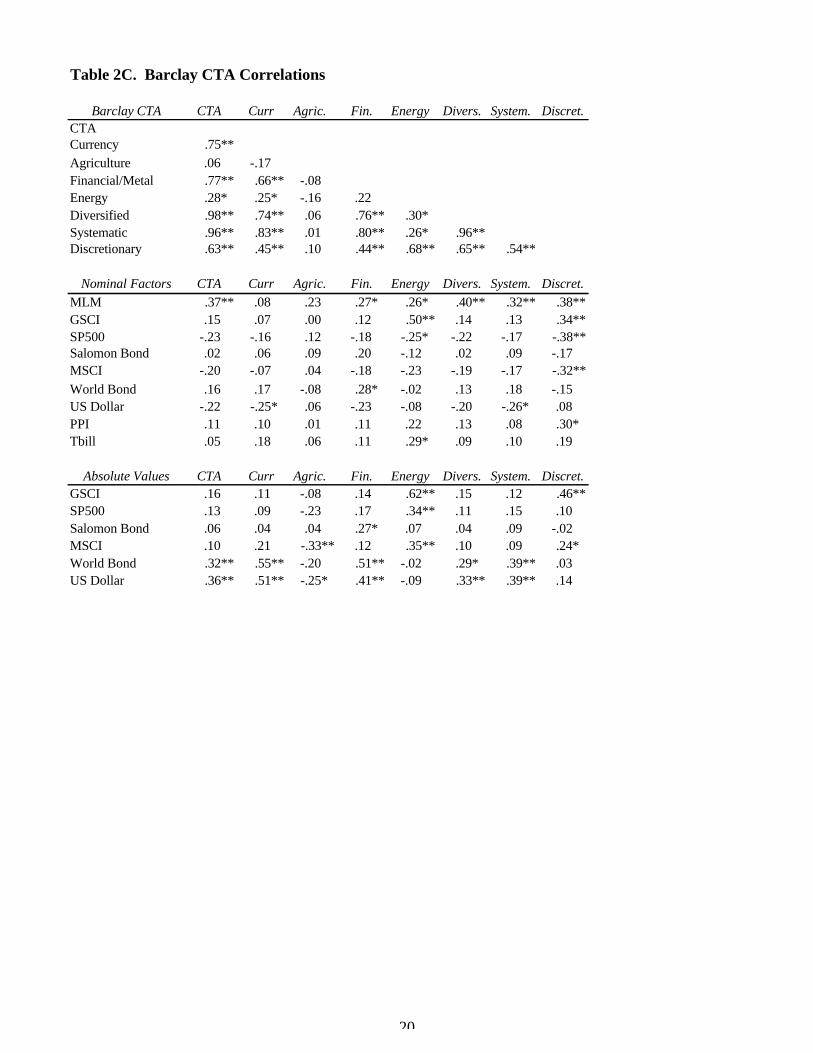
Tables 2A-2C present the correlations among broad-based CTA indices and subindices from each of the
three CTA index groupings (MAR, Barclay, and EACM) and between those indices and the nominal and absolute
values of the primary indices (GSCI, SP500, Tbond, MSCI, WorldBond, USDX) and the nominal values of the
MLM, PPI, and Tbill. There is a highly significant (99% confidence) correlation between overall CTA indices (MAR
CTA and Barclay CTA) and most CTA subindices. The only correlations that are not highly significant are the
energy and agricultural CTA subindices. The correlation of systematic/trendfollowing CTAs with the broad-based
indexes is higher than for discretionary CTAs. These results indicate that systematic/trendfollowing strategies are the
8
dominant strategies followed by CTAs.
The potential impact of the explanatory variables is also shown in Tables 2A-2C. The MLM index had
statistically significant positive correlations for most of the CTA indexes.5 Two other variables show statistically
significant correlations among broad-based indices, the absolute values of the Salomon World Bond and the US
Dollar indexes. Among CTAs that focus on a particular market, financial CTAs are correlated with both the World
Bond and USDX indexes, and energy CTAs are correlated with the energy-heavy GSCI index.
_______________
Insert Tables 2A-2C about here________________
Hedge Fund Correlations with Commodity, Stock, Bond and Currency Indices
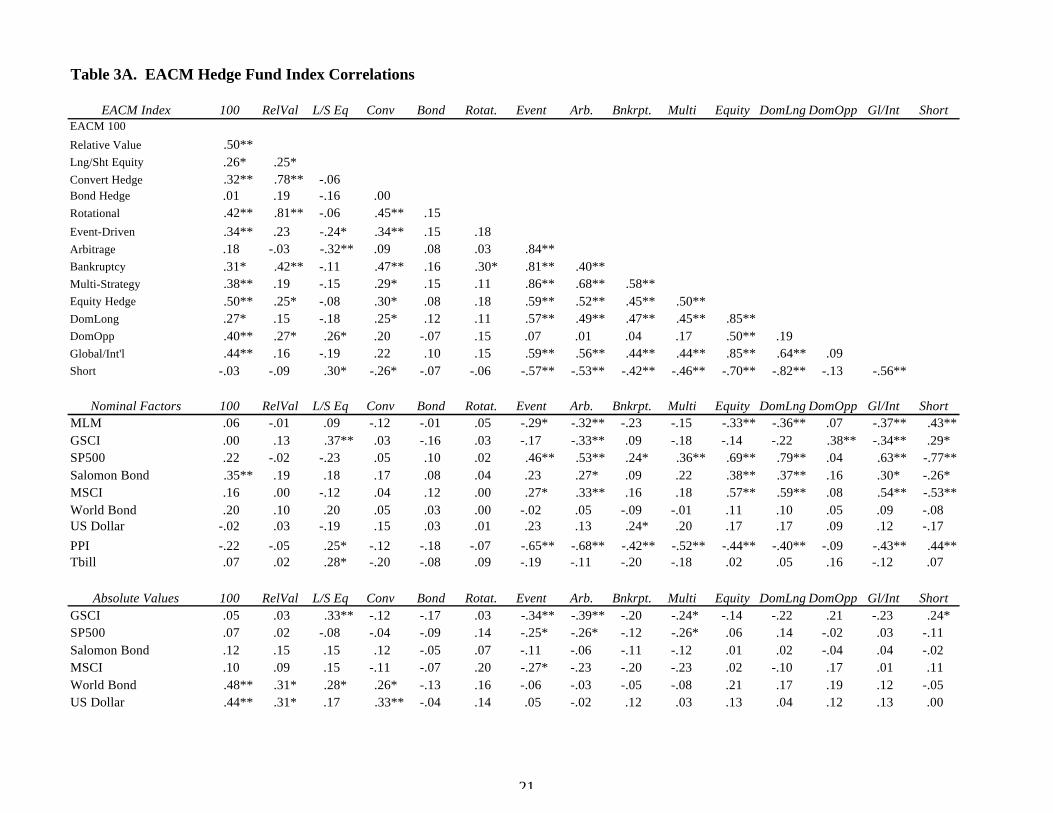
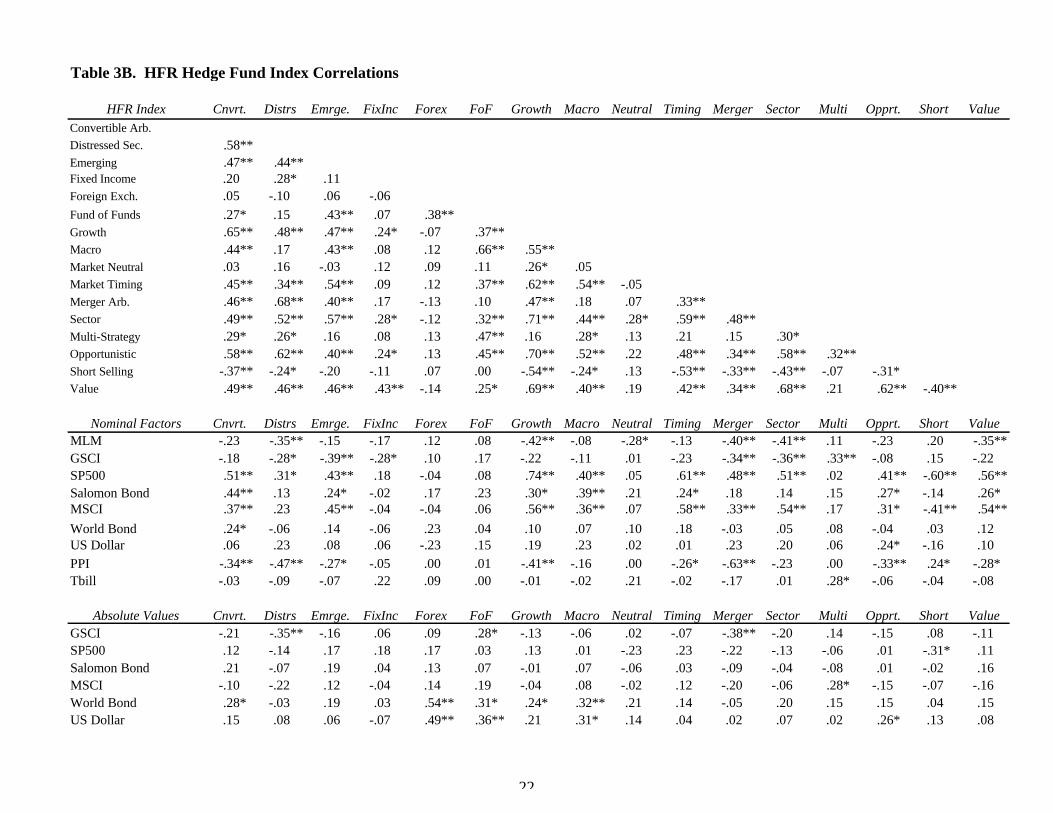
Tables 3A-3B show the correlation between each of the HFR and EACM hedge fund indexes and the set of
explanatory factors. Of interest, are the differences, if any, in the correlations patterns of the HFR and EACM hedge
fund performance indices given in Tables 3A and 3B compared to those in Tables 2A-2C. Three primary differences
can be observed. First, in contrast to the CTA tables, EACM subindexes are not highly correlated with the broad-
based EACM 100 index. Second there exists a relatively low correlation between hedge fund indices and the variable
designed to capture trend-following strategies, the MLM index. Third, also in contrast to CTA indices, hedge fund
indices are positively correlated with nominal stock and bond returns. None of the CTA indices had statistically
significant correlations SP500, but the majority of the EACM and HFR hedge fund indices had statistically
significant correlations with the this index. The principal similarity between CTA and hedge fund performance
indices is that both are groups are positively correlated with the absolute value of the USDX. Except for this, CTAs
and hedge fund advisors seem to be capturing differing return patterns.
________________
Insert Tables 3A-3B about here________________
5There is little evidence that the MLM index captures return patterns in the currency, energy, or financial returnsubindices. Similar results are seen in the Barclay currency subindex. This could in part be due to the small currencyand energy weighting in the MLM index and the fact that financial markets, especially, the S&P 500 generally showlittle evidence of long-term trend following.
9
Stock and Bond Fund Correlations with Commodity, Stock, Bond and Currency Indices
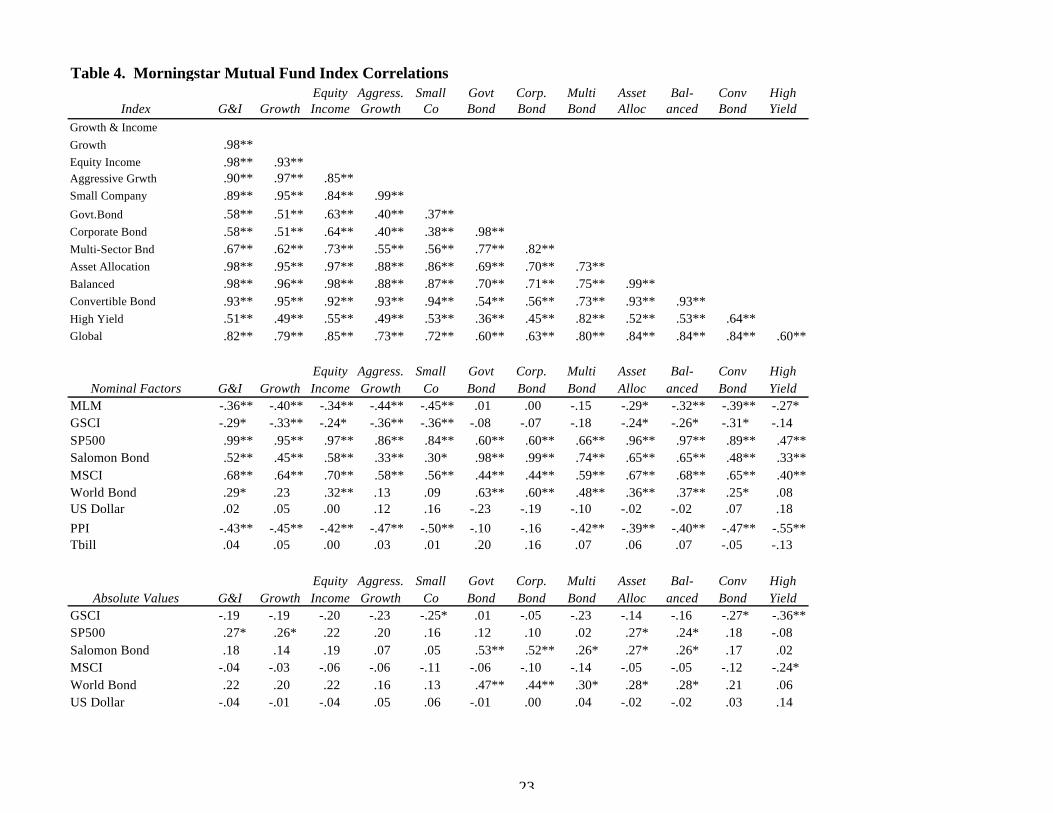
In Table 4, the correlation between each of the stock and bond fund performance indices and the nominal
and absolute values of the set of explanatory variables is given. Again, of principal interest, is the differences, if any,
in the correlation patterns of the CTA and hedge fund performance indices given in Tables 2 and 3 with those given
in Table 4. The buy-and-hold strategy employed by stock and bond mutual fund managers results in correlation
patterns that are very different from broad hedge fund and CTA indices. First, the correlations among the equity-
based indices are all above .80. Similar correlations are seen among the government and corporate bond mutual
funds. As discussed in previous analysis [Fung and Hsieh (1996) and Schneeweis (1996)], the high intercorrelation
among stock and bond mutual funds lessens the potential diversification benefits within those groups.
The MLM index is negatively correlated with stock funds and is uncorrelated with bond funds. This is in
contrast to the pattern for CTA indices. Lastly, in contrast, to both hedge funds and CTAs, there is little evidence of
the importance of the absolute values of the factors on stock or bond mutual fund performance.6
________________
Insert Table 4 about here_______________
Different correlation patterns are evident in the three classes of assets studied. CTAs capture a
trendfollowing component through their correlation with the MLM index, while hedge funds and mutual funds are
negatively correlated with this index. CTAs also correlate more strongly with the absolute values of asset
benchmarks than with nominal values, reflecting the ability to sell short and to engage in option strategies. Pairwise
correlation patterns suggest CTA investment would provide diversification benefits to a portfolio of stocks, bonds,
and hedge funds. Hedge funds, on the other hand, share some explanatory factors with stocks and bonds. A close
6 The reported results, i.e., low correlation between commodity benchmarks and an equity index, may differ forsubindices of the equity index that would be expected to be highly correlated with underlying commodity markets(e.g., mining, energy firms).
10
examination of the strategy employed by the fund is necessary before determining the diversification benefits of a
hedge fund relative to a stock and bond portfolio.
C. Factors Determining CTA, Hedge, and Mutual Fund Returns: Regression Analysis
Correlation results suggest the factors determining CTA and hedge fund performance differ
considerably from the factors that drive stock and bond fund returns, although hedge funds share some factors with
CTAs and some factors with traditional stock and bond fund managers. In this section, regression analysis is used to
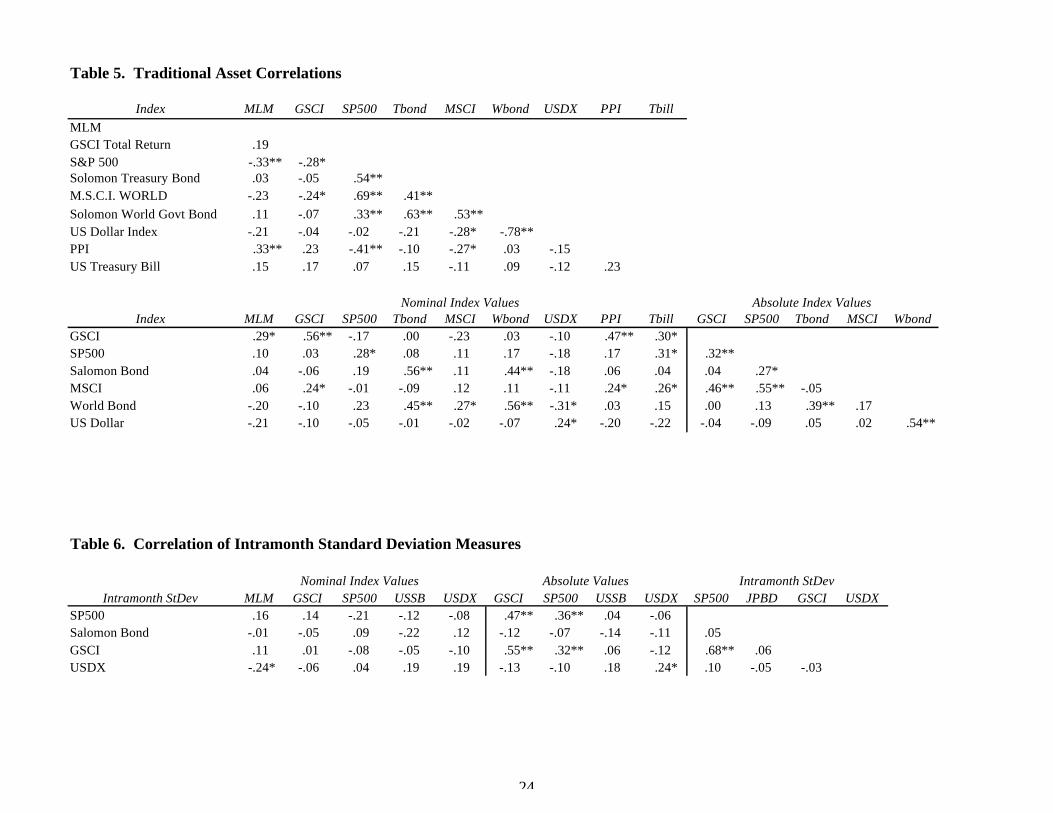
fit an explicit multifactor model. Tables 5 and 6 give a correlation matrix for the full set of explanatory variables.
These results show few pairwise correlations above .5. While low pairwise regressions do not prevent high levels of
multi-collinearity among the explanatory variables, the relatively low correlations allow the assumption of stable
coefficients.
________________
Insert Tables 5 and 6 about here_______________
Regression Analysis of CTA, Hedge, and Mutual Fund Returns
Tables 7-9 report the regression results. Table 7 shows the coefficients using the MAR CTA indexes. Table
8 gives the EACM hedge fund regression results, and Table 9 reports the Morningstar stock and bond mutual fund
regressions. In each instance, the independent variables are the nominal and absolute values of the SP500, GSCI,
SBBI, and USDX, the intramonth standard deviation of the SP500, GSCI, bond, and USDX, and the nominal value
of the MLM index. For each regression, the r-square, f-statistic, intercept, and thirteen slope coefficients are
reported. Significance of coefficients is reported at the 5% and 1% significance levels.
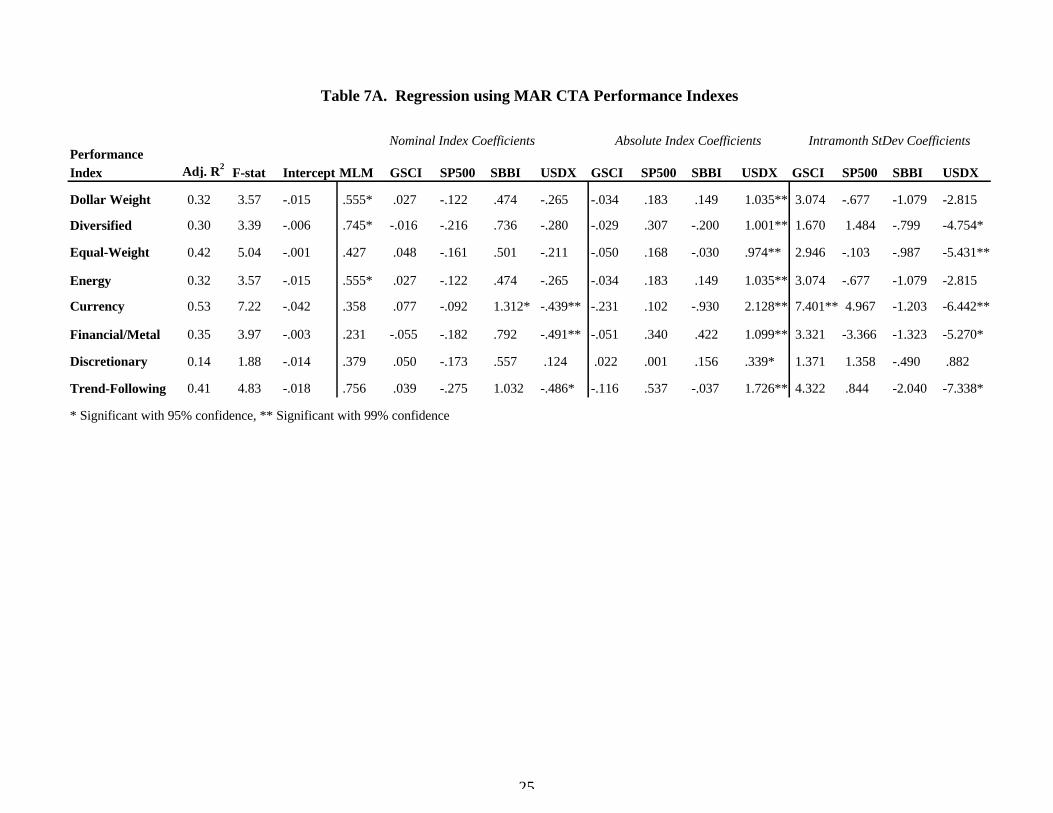
In Table 7A, the regression results for the CTA dollar-weighted index are given. For the overall sample, the
most significant variables are the MLM trendfollowing index, and the absolute value of the USDX. The sign for the
MLM factor is positive, as is the sign for the absolute value of the USDX. The sign is negative for the intra-month
standard deviation of the USDX. This is as expected. The MLM variable captures various long-term trendfollowing
models used by many CTAs. The absolute value of the USDX may also capture returns to CTAs who were long or
11
short foreign currencies during the period of analysis for which currency trends existed. The MAR Diversified index,
also on table 7A, has the same two significant coefficients and also the intramonth standard deviation of the USDX.
The negative coefficient for the intra-month standard deviation of the USDX confirms the expectation that, to the
degree that many CTAs are trendfollowers, high intra-month standard deviation may result in traders being
‘whipsawed’ in a volatile market. While these variables are generally significant across all of the various sub-indices,
the relative significance is a function of the CTA trading style or market. For instance, the highest significance for the
absolute value of the USDX is reported for CTA currency managers. The significance of the USDX variable is
lowest for Discretionary CTA managers, whose investment opportunities and trading style are not fixed on a single
market or trendfollowing system.
----------------------- Insert Table 7A about here -------------------------
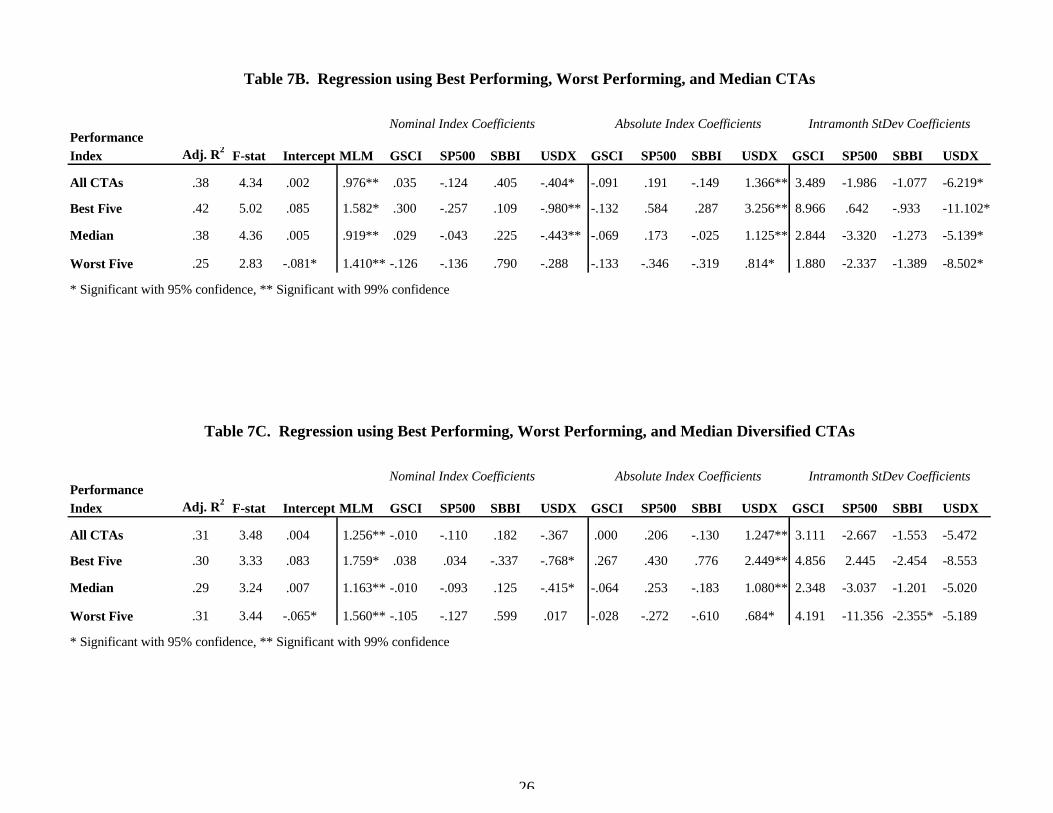
In Tables 7B and 7C, regression results for the top five, median, and bottom five CTAs are presented. Table
7B covers all CTAs who reported results for the full 1990-1995 period, and Table 7C gives results for CTAs listed
as Diversified by MAR. If relative investor skill is important (and not just differential leverage or risk factors), the
top five should be sensitive to the same variables as the other groups, but have a positive alpha. The median CTAs
should have an insignificant alpha while the bottom five CTA should have a negative alpha. Results in Table 7B are
consistent with this hypothesis. The best 5 CTAs have a monthly alpha of 8.80%, the median CTA of .5% and the
bottom 5 an alpha of -8.1%.
Similar results are reported for Diversified CTAs in Table 7C. Moreover, the return model is consistent
across alternative performing CTAs. For most regressions the MLM index and the absolute value and intra-month
variance of the USDX are significant, and the coefficients have the same sign and similar magnitudes.
-------------------------- Insert Tables 7B-7C about here ---------------------
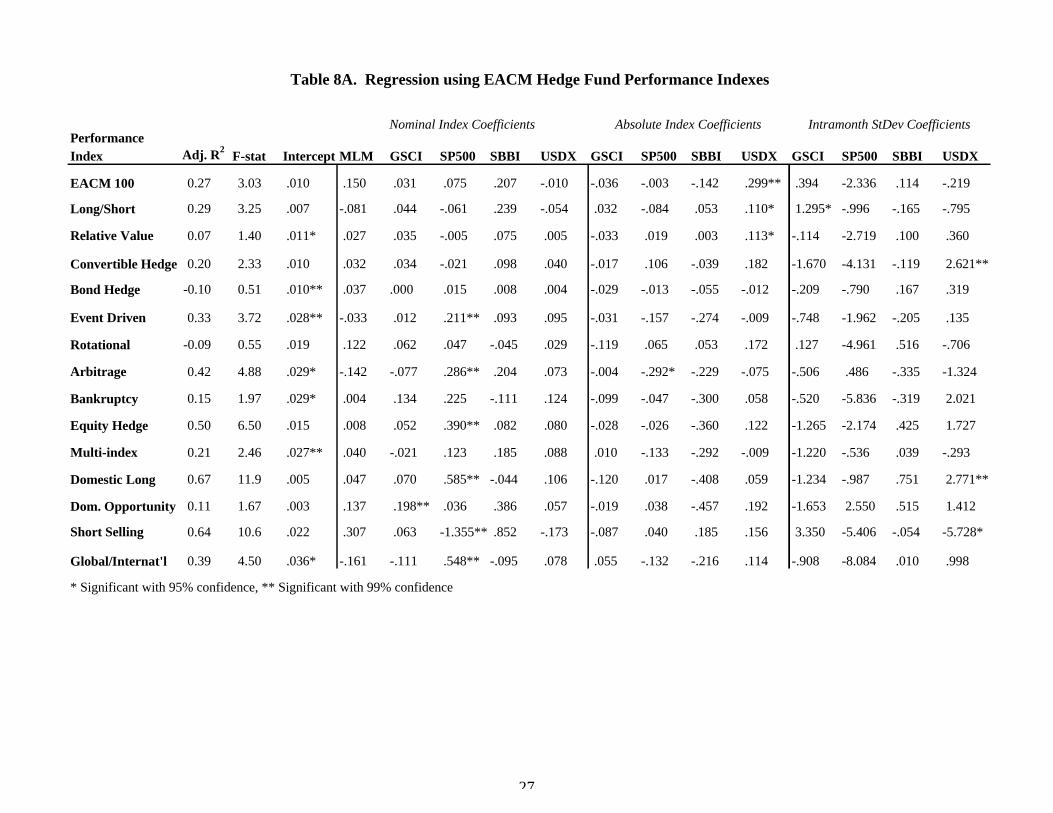
In Table 8A, the regression results for the EACM hedge fund indexes are given. For the EACM 100 index (a
broad index which tracks primarily hedge funds and has some exposure to managed futures strategies through the
Global Asset Allocators sub-index), the most significant variable is the absolute value of the USDX. The MLM is
12
almost significant at the 5% level (p-value is .062). The sign of both the USDX and the MLM are positive. This is
expected because the index includes some CTAs and also some hedge funds that follow similar directional strategies.
However, most hedge fund advisors have investment styles and trade in asset markets that differ from CTAs. The
MLM index is not significant in any of the hedge fund index regressions7. As important, the signs are generally in line
with expectations. For instance, the equity-based indexes (Event-driven, Equity Hedge, Domestic Long,
Global/International, and Short Selling) are significantly correlated with the S&P 500 and have the expected signs.
Similarly, for other hedge fund indices such as the Bond Hedge, there is little evidence of significant explanatory
variables. This too is as expected, given that a pure hedge play should not be correlated directly with the long return
of any of the underlying markets. Bond Hedge reports a statistically significant alpha of 1% per month. This
suggests the source of the returns is not captured by the explanatory variables tested, and other variables are needed
to fully explain this return. Many other hedge fund indexes report significantly positive alphas as well.
-------------------------- Insert Table 8A about here ---------------------
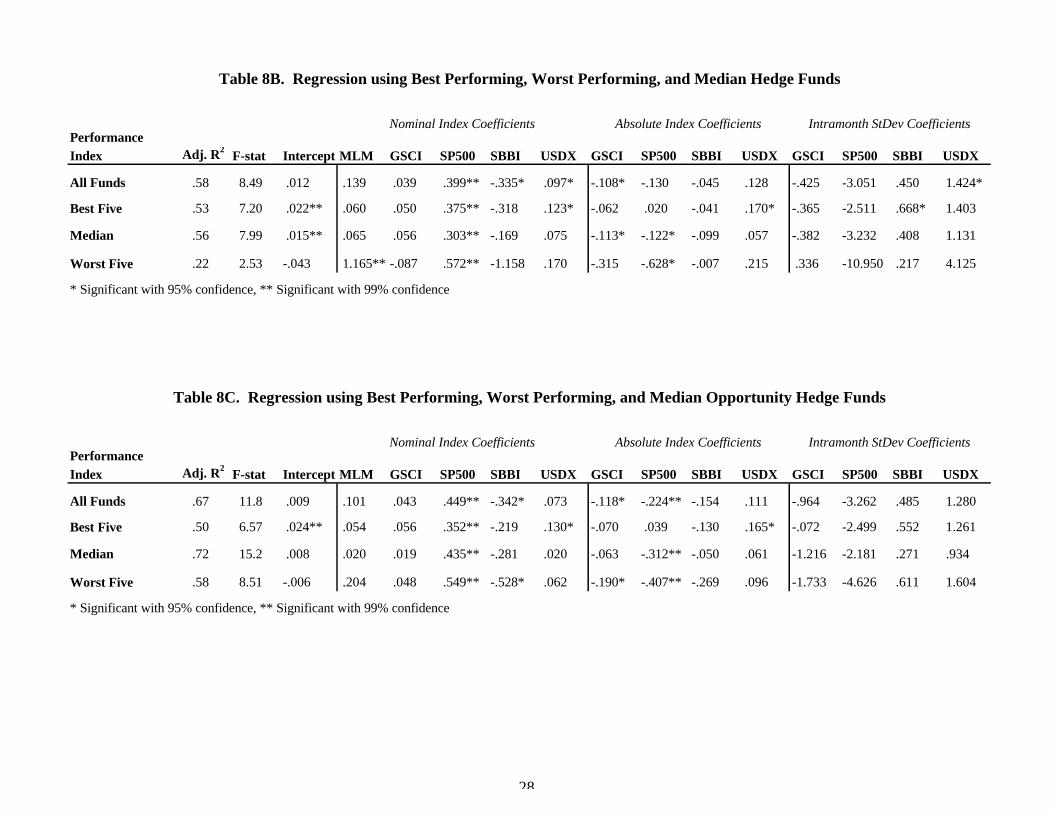
In Tables 8B and 8C, regression results for the top five, the median, and bottom five hedge funds are
presented. Table 8B covers all hedge funds that have reported data to MAR from 1990-1995, and Table 8C analyzes
the performance of those funds listed as US Opportunity funds. In Table 8B, the best 5 hedge funds are shown to
have a significant monthly alpha of 2.2%, the median hedge fund a significant monthly alpha of 1.5% and the bottom
5 a monthly alpha of -4.31% (this coefficient is significant at the 10% level, but not the 5% level). Results also
indicate that the MLM index explains a portion of the lowest performers but not the median or best performers. This
suggests that the worst performing funds in a given month were following directional strategies that, consistent with
results in Table 1, offered lower risk-adjusted returns during the sample period.
Table 8C shows similar results for the US Opportunity hedge fund subsample. The return model is both
consistent across varying performing hedge funds. For each group the S&P 500 index is significant, while for the
median and bottom hedge funds the absolute value of the S&P 500 had a negative coefficient.
7 Hedge funds that follow directional derivative strategies (EACM Global Asset Allocators) were grouped in the CTA category
13
-------------------------- Insert Tables 8B and 8C about here ---------------------
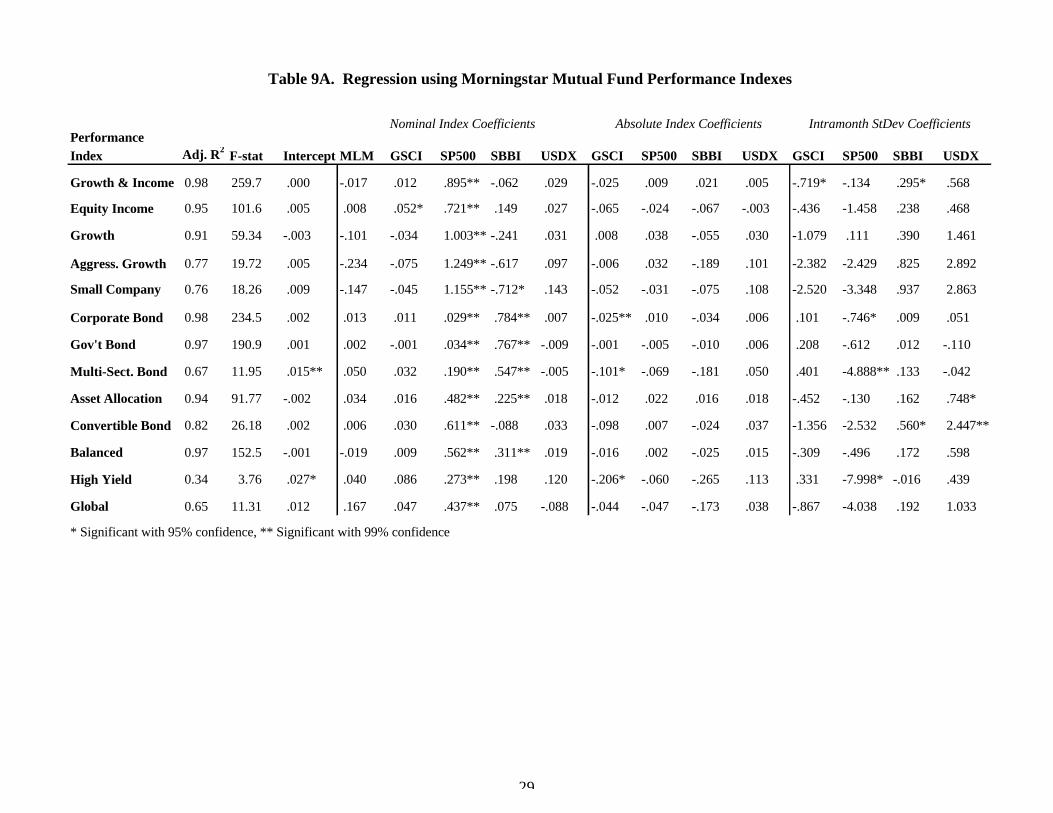
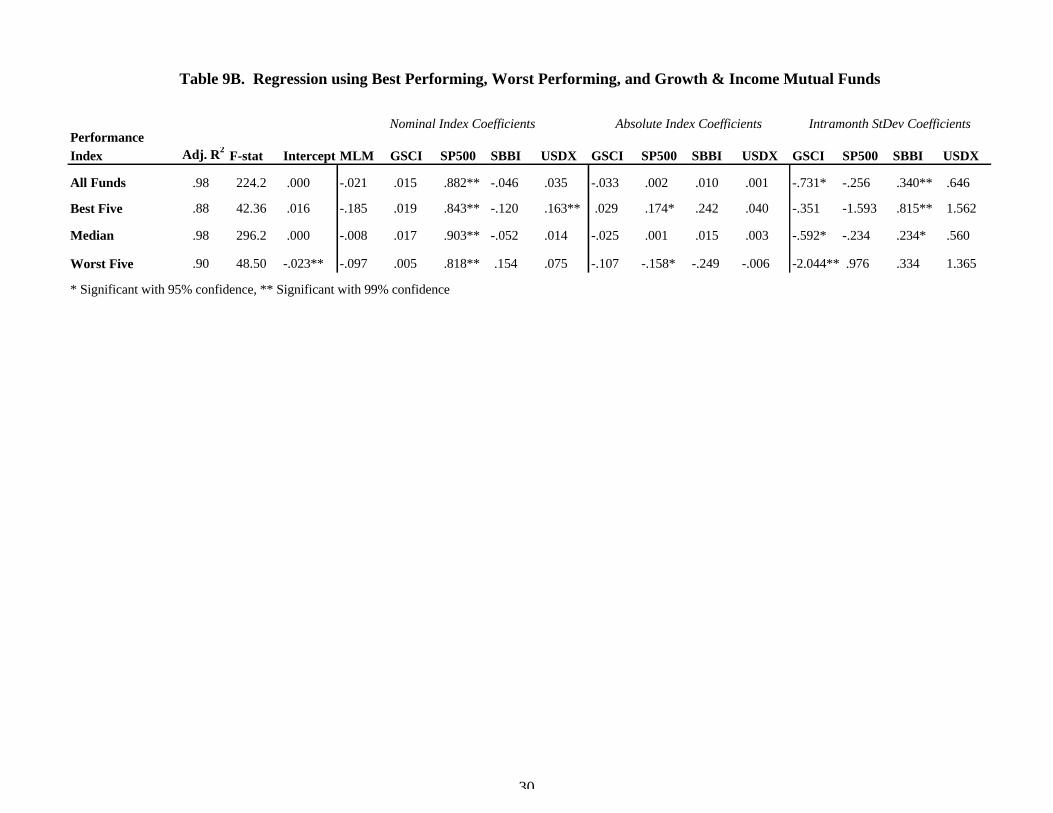
Tables 9A and 9B repeat this analysis for Morningstar stock and bond mutual fund indices and the best,
median and bottom Growth & Income equity mutual funds. The results are consistent with results reported
previously by Sharpe [1992], Blake et al., [1993], and Elton et al., [1995]. The major factor determining the return of
a fund is the factor that reflects the primary market the fund is trading. For instance, all the mutual fund indexes have
significantly positive SP500 coefficients. Fixed income and asset allocation mutual funds also report significant
coefficients with the Salmon Bond index (except Convertible bonds, which has no sensitivity to this index). For
equity mutual funds, the intra-month standard deviation of the S&P 500 has a negative sign (significantly so for
Growth & Income). Similarly, most bond funds have negative sensitivity to volatility in the bond index. This
suggests that mutual fund returns are diminished by volatility in the underlying markets.
-------------------------- Insert Table 9A about here ---------------------
The average, best, median, and bottom Growth & Income funds all show significance at the 95% level to the
SP500 (Table 4B). The top Growth & Income managers have a significant positive sign with the absolute value of
the SP500 while reporting a lower overall fit (r-square of .88) with the model than the median manager (r-square of
.98). The worst managers have a significantly negative coefficient with the absolute value of the SP500.
Interestingly, the best managers have a large, significant coefficient with the bond index, suggesting the managers
who placed relatively more emphasis on income as opposed to growth performed best during the sample period.
-------------------------- Insert Table 9B about here ---------------------
D. Trading Style and CTA, Hedge Fund, and Mutual Fund Returns
Correlation Relationships
Results in section C conclude that CTA returns are positively related to factors such as market trends and
currency movement, while hedge fund and mutual fund returns are best explained by the return to a buy-and-hold
14
strategy in the markets the fund invests in. In this section, we further explore these sources of return by correlating
the returns of the top five, median, and bottom five performers with other measures of intramonth price movement.
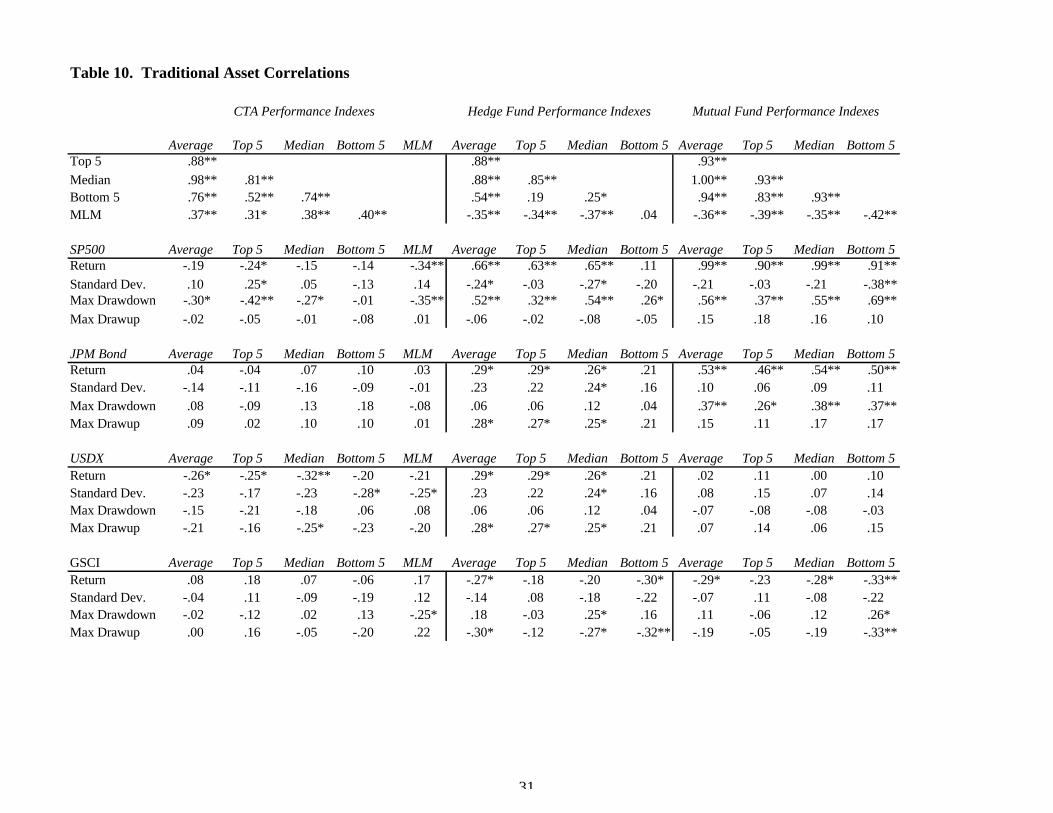
Results are reported in Table 10. Three measures of intramonth price movement are calculated: the standard
deviation, the maximum drawdown, and the maximum drawup. For CTAs, results are consistent with results in
section C that show a high positive correlation with the MLM index. There is a significant negative correlation with
the maximum drawup of the SP500 and almost no correlation with the maximum drawup of the SP500. This is
especially true for the top performers, and is consistent with the inclusion of CTAs to provide downside risk
protection for equity portfolios [Schneeweis, Spurgin, and Potter, 1996].
___________________
Insert Table 10 about here_____________________
Hedge fund performance is positively correlated with SP500 drawups and drawdowns. Among top
performers the coefficients are of the same magnitude, but for median and bottom performers the drawup coefficient
is much lower than the drawdown. Hedge funds show significant correlation with the maximum drawup of USDX
but not with the maximum drawdown, suggesting they are better able to time the currency market than the stock
market. Growth and Income mutual fund performance is positively correlated with both SP500 and JPM Bond index
drawups and drawdowns. This is as expected, as mutual funds generally do not attempt to time entry and exit.
Results for G&I funds also show a negative relationship with the standard deviation of the stock market. For the top
performers, however, this relationship is less negative.
Implications of Results
Previous research on investment performance concentrates on single-factor models such as beta, standard
deviation, and drawdown as an indicator of future risk/returns performance. In this paper, a number of factors are
proposed to explain a broad range of managed assets. Results indicate that these factors may help explain the
differences in investment return, as well as some of the differences within each investment grouping. Adding managed

15
futures and hedge fund products to traditional stock and bond portfolios only makes sense if these products derive
return from sources unique from those that drive stock and bond return, and if, furthermore, the returns from those
sources are positive. If this is the case, and results reported here support this, then alternative investments provide
beneficial diversification to traditional stock and bond funds.
Future research is required to develop passive investment approaches that capture these unique factors more
precisely. Unlike equity or bond mutual funds, the lack of a single factor that describes the return process means that
alternative investments must be classified according to their style rather than a general return process. Alternatively,
the fact that each position in a fund may draw from a unique return source means that a detailed breakdown of the
individual positions in a fund may be required to understand the expected return. Results presented in this paper
suggest both of these areas of research contain important information about the returns to actively managed assets in
general, and managed futures and hedge funds, in particular.
16
Bibliography
Ackermann, Carl, "The Impact of Regulatory Restrictions of Fund Performance: A Comparative Study of Hedge Funds andMutual Funds" Working Paper, University of North Carolina at Chapel Hill, 1998
Blake, C., E. Elton, and M. Gruber. “The Performance of Bond Mutual Funds,” Journal of Business. Vol. 66. No. 3(1993), pp. 371-403.
Chan, L., N. Jegadeesh, and J. Lakonishok. "Momentum Strategies," Journal of Finance, December, 1996, pp.1681-1713.
Edwards, F. and Andy C. Ma. "Commodity Fund Performance: Is the Information Contained in Fund ProspectusesUseful?” Journal of Futures Markets Vol. 8. No. 5 (1988), 589-616.
Elton, E. .J., M. .J. Gruber, and C. Blake. “Fundamental Economic Variables, Expected Returns, and Bond FundPerformance.” Journal of Finance, Vol. 50, No. 4 (September, 1995), 1229-1256.
Fung, William and D. Hsieh. “Empirical Characteristics of Dynamic Trading Strategies", The Review ofFinancial Studies, 1977, pp. 275-302.
Irwin, S. “Further Evidence on the Usefulness of CTA Performance Information in Public Commodity Fund Prospectusesand a Proposal for Reform,” Advances in Futures and Options Research, Vol. 7 (1994), 251-265.
Lintner, J. “The Potential Role of Managed Commodity-Financial Futures Accounts in Portfolios of Stocks and Bonds.” Annual Conference of the Financial Analysts Federation, Toronto, Canada, 1983
McCarthy D., Schneeweis, T., R. Spurgin and. “Informational Content in Historical CTA Performance.” Journal ofFutures Markets, May, 1997, pp. 317-340
Schneeweis, T. The Benefits of Managed Futures. European Managed Futures Association, 1996.
Schneeweis, T., R. Spurgin, and M. Potter. “Managed Futures and Hedge Fund Investment for Downside EquityRisk Management", Derivatives Quarterly, Fall, 1996.
Schneeweis, T. “Multi-Factor Models in CTA, Hedge Fund, and Mutual Fund Return Estimation: A TechnicalReport” MFA (1997).
Silber, W. "Technical Trading - When it Works and When it Doesn't", The Journal of Derivatives, Spring, 1994, pp.39-44
Schneeweis, T. “Equity Alternatives: A Managed Futures, Hedge Fund, and Mutual Fund Comparison CISDMWorking Paper, 1997.
Sharpe, W. "Asset Allocation: Management Style and Performance Measurement.” Journal of PortfolioManagement Vol 18. No. 2 (1992), 7-19.
Spurgin, R. "Managed Futures, Hedge Fund, and Mutual Fund Performance: An Equity Class Analysis", TheJournal of Alternative Investments, Summer, 1998, pp. 41-55.
17
Benchmarks Avg StDev Max Min Av/SD Shrpe CTA Indexes Avg StDev Max Min Av/SD ShrpeMLM Index 7.8 5.2 4.7 -4.0 1.50 .58 GSCI 6.9 16.3 22.9 -9.4 0.43 .13 Dollar-Weight 14.2 11.8 14.5 -6.0 1.20 .80 S&P 500 13.0 11.8 11.5 -9.2 1.10 .70 Equal Weight 10.0 10.3 11.3 -5.4 .97 .51 Treasury Bond 9.0 4.4 4.1 -2.3 2.04 .96 Currency 14.6 17.2 16.4 -8.2 .85 .57 MSCI World 7.7 14.1 10.5 -11 0.55 .21 Discretionary 15.2 8.4 8.7 -4.6 1.82 1.25 World Govt Bond 10.8 6.3 5.9 -3.6 1.72 .97 Diversified 11.2 13.1 12.7 -7.5 .85 .49 US Dollar Index -1.6 9.1 8.5 -5.4 -0.17 -.70 Energy 7.9 10.9 10.0 -6.1 .73 .29 PPI 1.9 1.4 1.9 -0.8 Financial 14.4 14.4 20.2 -8.6 1.00 .67 US Treasury Bill 4.8 0.5 0.7 0.2 Trend-Follow 13.9 18.7 22.0 -10 .74 .49
Hedge Funds Avg StDev Max Min Av/SD Shrpe CTA 7.4 9.9 10.0 -5.5 .75 .27 Currency 12.4 15.8 15.0 -7.7 .79 .49
Convertible Arb. 13.2 4.4 4.3 -2.4 3.00 1.91 Agriculture 8.1 6.9 5.8 -4.8 1.17 .49 Distressed Sec. 20.4 7.4 7.3 -5.5 2.74 2.10 Fin/Metal 8.0 8.5 7.0 -10 .94 .38 Emerging 31.1 18.4 22.3 -8.8 1.69 1.43 Energy 9.6 12.8 26.9 -4.4 .75 .38 Fixed Income 19.1 7.0 12.0 -1.3 2.72 2.04 Diversified 11.5 12.9 12.0 -6.6 .89 .52 Foreign Exch. 18.5 15.9 14.6 -8.2 1.17 .87 Systematic 11.7 13.7 14.5 -7.6 .86 .51 Fund of Funds 13.7 4.6 5.1 -1.9 2.98 1.95 Discretionary 6.5 5.3 8.5 -3.0 1.22 .32 Growth 19.9 8.9 8.2 -5.3 2.25 1.71 Macro 27.9 9.6 10.2 -6.0 2.90 2.40 Gl. Asset Alloc. 24.0 12.1 16.6 -5.4 1.98 1.58 Market Neutral 13.7 3.1 3.5 -0.7 4.43 2.89 Discretionary 20.5 8.4 7.5 -5.2 2.43 1.87 Market Timing 16.1 6.6 8.9 -2.5 2.45 1.73 Systematic 27.5 21.2 30.3 -10 1.30 1.07 Merger Arb. 12.0 5.1 4.2 -5.4 2.37 1.43 Sector 20.9 8.2 7.6 -4.6 2.53 1.95 Mutual Funds Avg StDev Max Min Av/SD ShrpeMulti-Strategy 11.0 3.6 2.9 -1.8 3.10 1.76 Opportunistic 22.3 7.0 8.2 -2.3 3.18 2.50 Growth & Income 11.5 10.7 10.1 -8.0 1.07 .63 Short Selling 7.8 15.7 12.1 -11 0.50 .19 Growth 12.6 12.4 11.4 -9.0 1.02 .63 Value 20.0 6.7 6.3 -4.5 3.00 2.29 Equity Income 11.1 9.0 7.5 -6.7 1.24 .70
Aggressive Grwth 16.2 16.6 12.7 -12 .98 .69 EACM 100 15.9 3.4 4.8 -0.9 4.67 3.27 Small Company 15.3 15.1 10.6 -12 1.01 .70 Relative Value 11.6 2.3 2.5 -1.1 5.12 3.02 Govt.Bond 7.4 3.6 3.0 -1.9 2.03 .73
Lng/Sht Equity 11.7 3.1 3.5 -1.0 3.78 2.24 Corporate Bond 8.1 3.6 3.3 -2.0 2.23 .93 Convert Hedge 9.7 5.0 5.0 -5.0 1.94 .99 Multi-Sector Bnd 9.4 4.7 4.0 -3.0 2.01 .99 Bond Hedge 10.2 1.5 2.0 -0.2 6.85 3.64 Asset Allocation 10.2 6.5 7.2 -4.1 1.57 .84 Rotational 14.9 5.1 4.3 -2.0 2.95 2.01 Balanced 10.4 7.7 7.4 -5.6 1.35 .73 Event-Driven 13.8 5.3 5.1 -4.8 2.58 1.69 Convertible Bond 10.8 8.1 6.4 -5.9 1.33 .74 Arbitrage 8.9 7.4 5.9 -11 1.21 .57 Hybrid: HiYld 11.1 6.7 7.0 -5.0 1.66 .95 Bankruptcy 18.4 7.3 10.1 -6.4 2.53 1.88 Hybrid: Global 8.3 6.1 4.5 -3.8 1.37 .58 Multi-Strategy 13.9 4.6 3.7 -2.7 3.05 2.01 Equity Hedge 18.7 6.5 5.4 -3.4 2.90 2.16 Absolute Values Avg StDev Max Min Av/SD ShrpeDomLong 18.3 8.3 6.7 -4.6 2.19 1.62 GSCI 35.5 12.7 22.9 0.1 2.80 2.42 DomOpp 16.7 7.1 6.7 -3.0 2.37 1.69 S&P 500 33.8 7.6 11.5 0.2 4.45 3.82 Global/Int'l 21.1 10.4 8.4 -8.5 2.03 1.57 Treasury Bond 14.5 2.9 4.1 0.0 4.99 3.35 Short -1.1 19.8 12.7 -13 -0.05 -.29 MSCI World 38.9 8.6 10.5 0.0 4.51 3.96
World Govt Bnd 19.3 4.3 5.9 0.0 4.54 3.42 US Dollar Index 23.2 6.1 8.5 0.0 3.80 3.02
Table 1. Descriptive Statistics of Hedge Fund, CTA, Mutual Fund, and Asset Benchmarks, 1991-1995
Hedge Fund Research Indexes
Evaluation Associates Indexes
Managed Account Reports Indexes
Barclay Indexes
Evaluation Associates Indexes
Morningstar Indexes
18
Table 2A. MAR CTA Correlations
MAR CTA Dollar Equal Curr. Discret. Divers. Energy Fin. TrendDollar-WeightEqual-Weight .94**Currency .77** .79**Discretionary .62** .54** .47**Diversified .93** .92** .65** .55**Energy .11 .11 .01 .32** .08 Financial/Metal .92** .87** .71** .47** .84** -.06 Trendfollowing .97** .96** .79** .51** .93** .02 .94**
Nominal Factors Dollar Equal Curr. Discret. Divers. Energy Fin. Trend
MLM .28* .30* .09 .26* .37** .12 .17 .27* GSCI .08 .13 .00 .19 .06 .41** -.03 .07 SP500 -.13 -.19 -.03 -.21 -.15 -.28* -.01 -.10 Salomon Bond .14 .08 .17 .16 .13 -.23 .25* .15 MSCI -.15 -.15 .01 -.10 -.09 -.15 -.01 -.12
World Bond .22 .16 .22 .08 .24* -.19 .34** .24* US Dollar -.21 -.21 -.16 .09 -.25* .29* -.35** -.26* PPI .07 .09 -.01 .00 .10 -.03 .01 .02 Tbill .01 .05 .07 -.09 .00 -.12 .00 .02
Absolute Values Dollar Equal Curr. Discret. Divers. Energy Fin. TrendGSCI .12 .14 .02 .15 .13 .28* .05 .08 SP500 .14 .12 .04 -.04 .16 -.15 .21 .19 Salomon Bond .18 .11 .06 .17 .13 .05 .28* .17 MSCI .06 .12 .15 .05 .05 .04 .11 .09 World Bond .42** .38** .56** .23 .35** -.12 .47** .42**US Dollar .41** .41** .60** .25* .30* .24* .34** .41**
19
Table 2B. EACM CTA Correlations
EACM CTA GAA Discret. SystemGlobal Asset All.Discretionary .51**
Systematic .94** .19
Nominal Factors GAA Discret. SystemMLM .28* .30* .09 GSCI .08 .13 .00 SP500 -.13 -.19 -.03
Salomon Bond .14 .08 .17 MSCI -.15 -.15 .01
World Bond .22 .16 .22 US Dollar -.21 -.21 -.16 PPI .07 .09 -.01 Tbill .01 .05 .07
Absolute Values GAA Discret. SystemGSCI .12 .14 .02 SP500 .14 .12 .04 Salomon Bond .18 .11 .06 MSCI .06 .12 .15 World Bond .42** .38** .56**US Dollar .41** .41** .60**
20
Table 2C. Barclay CTA Correlations
Barclay CTA CTA Curr Agric. Fin. Energy Divers. System. Discret.CTACurrency .75**Agriculture .06 -.17 Financial/Metal .77** .66** -.08 Energy .28* .25* -.16 .22 Diversified .98** .74** .06 .76** .30* Systematic .96** .83** .01 .80** .26* .96**Discretionary .63** .45** .10 .44** .68** .65** .54**
Nominal Factors CTA Curr Agric. Fin. Energy Divers. System. Discret.
MLM .37** .08 .23 .27* .26* .40** .32** .38**GSCI .15 .07 .00 .12 .50** .14 .13 .34**SP500 -.23 -.16 .12 -.18 -.25* -.22 -.17 -.38**Salomon Bond .02 .06 .09 .20 -.12 .02 .09 -.17 MSCI -.20 -.07 .04 -.18 -.23 -.19 -.17 -.32**
World Bond .16 .17 -.08 .28* -.02 .13 .18 -.15 US Dollar -.22 -.25* .06 -.23 -.08 -.20 -.26* .08 PPI .11 .10 .01 .11 .22 .13 .08 .30* Tbill .05 .18 .06 .11 .29* .09 .10 .19
Absolute Values CTA Curr Agric. Fin. Energy Divers. System. Discret.GSCI .16 .11 -.08 .14 .62** .15 .12 .46**SP500 .13 .09 -.23 .17 .34** .11 .15 .10 Salomon Bond .06 .04 .04 .27* .07 .04 .09 -.02 MSCI .10 .21 -.33** .12 .35** .10 .09 .24* World Bond .32** .55** -.20 .51** -.02 .29* .39** .03 US Dollar .36** .51** -.25* .41** -.09 .33** .39** .14
21
Table 3A. EACM Hedge Fund Index Correlations
EACM Index 100 RelVal L/S Eq Conv Bond Rotat. Event Arb. Bnkrpt. Multi Equity DomLng DomOpp Gl/Int ShortEACM 100
Relative Value .50**Lng/Sht Equity .26* .25* Convert Hedge .32** .78** -.06 Bond Hedge .01 .19 -.16 .00 Rotational .42** .81** -.06 .45** .15
Event-Driven .34** .23 -.24* .34** .15 .18 Arbitrage .18 -.03 -.32** .09 .08 .03 .84**Bankruptcy .31* .42** -.11 .47** .16 .30* .81** .40**Multi-Strategy .38** .19 -.15 .29* .15 .11 .86** .68** .58**Equity Hedge .50** .25* -.08 .30* .08 .18 .59** .52** .45** .50**DomLong .27* .15 -.18 .25* .12 .11 .57** .49** .47** .45** .85**DomOpp .40** .27* .26* .20 -.07 .15 .07 .01 .04 .17 .50** .19 Global/Int'l .44** .16 -.19 .22 .10 .15 .59** .56** .44** .44** .85** .64** .09 Short -.03 -.09 .30* -.26* -.07 -.06 -.57** -.53** -.42** -.46** -.70** -.82** -.13 -.56**
Nominal Factors 100 RelVal L/S Eq Conv Bond Rotat. Event Arb. Bnkrpt. Multi Equity DomLng DomOpp Gl/Int ShortMLM .06 -.01 .09 -.12 -.01 .05 -.29* -.32** -.23 -.15 -.33** -.36** .07 -.37** .43**GSCI .00 .13 .37** .03 -.16 .03 -.17 -.33** .09 -.18 -.14 -.22 .38** -.34** .29* SP500 .22 -.02 -.23 .05 .10 .02 .46** .53** .24* .36** .69** .79** .04 .63** -.77**Salomon Bond .35** .19 .18 .17 .08 .04 .23 .27* .09 .22 .38** .37** .16 .30* -.26* MSCI .16 .00 -.12 .04 .12 .00 .27* .33** .16 .18 .57** .59** .08 .54** -.53**World Bond .20 .10 .20 .05 .03 .00 -.02 .05 -.09 -.01 .11 .10 .05 .09 -.08 US Dollar -.02 .03 -.19 .15 .03 .01 .23 .13 .24* .20 .17 .17 .09 .12 -.17
PPI -.22 -.05 .25* -.12 -.18 -.07 -.65** -.68** -.42** -.52** -.44** -.40** -.09 -.43** .44**Tbill .07 .02 .28* -.20 -.08 .09 -.19 -.11 -.20 -.18 .02 .05 .16 -.12 .07
Absolute Values 100 RelVal L/S Eq Conv Bond Rotat. Event Arb. Bnkrpt. Multi Equity DomLng DomOpp Gl/Int ShortGSCI .05 .03 .33** -.12 -.17 .03 -.34** -.39** -.20 -.24* -.14 -.22 .21 -.23 .24* SP500 .07 .02 -.08 -.04 -.09 .14 -.25* -.26* -.12 -.26* .06 .14 -.02 .03 -.11 Salomon Bond .12 .15 .15 .12 -.05 .07 -.11 -.06 -.11 -.12 .01 .02 -.04 .04 -.02 MSCI .10 .09 .15 -.11 -.07 .20 -.27* -.23 -.20 -.23 .02 -.10 .17 .01 .11 World Bond .48** .31* .28* .26* -.13 .16 -.06 -.03 -.05 -.08 .21 .17 .19 .12 -.05 US Dollar .44** .31* .17 .33** -.04 .14 .05 -.02 .12 .03 .13 .04 .12 .13 .00
22
Table 3B. HFR Hedge Fund Index Correlations
HFR Index Cnvrt. Distrs Emrge. FixInc Forex FoF Growth Macro Neutral Timing Merger Sector Multi Opprt. Short Value
Convertible Arb.
Distressed Sec. .58**Emerging .47** .44**Fixed Income .20 .28* .11 Foreign Exch. .05 -.10 .06 -.06 Fund of Funds .27* .15 .43** .07 .38**Growth .65** .48** .47** .24* -.07 .37**Macro .44** .17 .43** .08 .12 .66** .55**Market Neutral .03 .16 -.03 .12 .09 .11 .26* .05 Market Timing .45** .34** .54** .09 .12 .37** .62** .54** -.05 Merger Arb. .46** .68** .40** .17 -.13 .10 .47** .18 .07 .33**Sector .49** .52** .57** .28* -.12 .32** .71** .44** .28* .59** .48**Multi-Strategy .29* .26* .16 .08 .13 .47** .16 .28* .13 .21 .15 .30* Opportunistic .58** .62** .40** .24* .13 .45** .70** .52** .22 .48** .34** .58** .32**Short Selling -.37** -.24* -.20 -.11 .07 .00 -.54** -.24* .13 -.53** -.33** -.43** -.07 -.31* Value .49** .46** .46** .43** -.14 .25* .69** .40** .19 .42** .34** .68** .21 .62** -.40**
Nominal Factors Cnvrt. Distrs Emrge. FixInc Forex FoF Growth Macro Neutral Timing Merger Sector Multi Opprt. Short ValueMLM -.23 -.35** -.15 -.17 .12 .08 -.42** -.08 -.28* -.13 -.40** -.41** .11 -.23 .20 -.35**GSCI -.18 -.28* -.39** -.28* .10 .17 -.22 -.11 .01 -.23 -.34** -.36** .33** -.08 .15 -.22 SP500 .51** .31* .43** .18 -.04 .08 .74** .40** .05 .61** .48** .51** .02 .41** -.60** .56**Salomon Bond .44** .13 .24* -.02 .17 .23 .30* .39** .21 .24* .18 .14 .15 .27* -.14 .26* MSCI .37** .23 .45** -.04 -.04 .06 .56** .36** .07 .58** .33** .54** .17 .31* -.41** .54**
World Bond .24* -.06 .14 -.06 .23 .04 .10 .07 .10 .18 -.03 .05 .08 -.04 .03 .12 US Dollar .06 .23 .08 .06 -.23 .15 .19 .23 .02 .01 .23 .20 .06 .24* -.16 .10 PPI -.34** -.47** -.27* -.05 .00 .01 -.41** -.16 .00 -.26* -.63** -.23 .00 -.33** .24* -.28* Tbill -.03 -.09 -.07 .22 .09 .00 -.01 -.02 .21 -.02 -.17 .01 .28* -.06 -.04 -.08
Absolute Values Cnvrt. Distrs Emrge. FixInc Forex FoF Growth Macro Neutral Timing Merger Sector Multi Opprt. Short ValueGSCI -.21 -.35** -.16 .06 .09 .28* -.13 -.06 .02 -.07 -.38** -.20 .14 -.15 .08 -.11 SP500 .12 -.14 .17 .18 .17 .03 .13 .01 -.23 .23 -.22 -.13 -.06 .01 -.31* .11 Salomon Bond .21 -.07 .19 .04 .13 .07 -.01 .07 -.06 .03 -.09 -.04 -.08 .01 -.02 .16 MSCI -.10 -.22 .12 -.04 .14 .19 -.04 .08 -.02 .12 -.20 -.06 .28* -.15 -.07 -.16 World Bond .28* -.03 .19 .03 .54** .31* .24* .32** .21 .14 -.05 .20 .15 .15 .04 .15 US Dollar .15 .08 .06 -.07 .49** .36** .21 .31* .14 .04 .02 .07 .02 .26* .13 .08
23
Table 4. Morningstar Mutual Fund Index CorrelationsEquity Aggress. Small Govt Corp. Multi Asset Bal- Conv High
Index G&I Growth Income Growth Co Bond Bond Bond Alloc anced Bond Yield
Growth & Income
Growth .98**Equity Income .98** .93**Aggressive Grwth .90** .97** .85**Small Company .89** .95** .84** .99**
Govt.Bond .58** .51** .63** .40** .37**Corporate Bond .58** .51** .64** .40** .38** .98**Multi-Sector Bnd .67** .62** .73** .55** .56** .77** .82**Asset Allocation .98** .95** .97** .88** .86** .69** .70** .73**Balanced .98** .96** .98** .88** .87** .70** .71** .75** .99**Convertible Bond .93** .95** .92** .93** .94** .54** .56** .73** .93** .93**High Yield .51** .49** .55** .49** .53** .36** .45** .82** .52** .53** .64**Global .82** .79** .85** .73** .72** .60** .63** .80** .84** .84** .84** .60**
Equity Aggress. Small Govt Corp. Multi Asset Bal- Conv HighNominal Factors G&I Growth Income Growth Co Bond Bond Bond Alloc anced Bond Yield
MLM -.36** -.40** -.34** -.44** -.45** .01 .00 -.15 -.29* -.32** -.39** -.27* GSCI -.29* -.33** -.24* -.36** -.36** -.08 -.07 -.18 -.24* -.26* -.31* -.14 SP500 .99** .95** .97** .86** .84** .60** .60** .66** .96** .97** .89** .47**Salomon Bond .52** .45** .58** .33** .30* .98** .99** .74** .65** .65** .48** .33**MSCI .68** .64** .70** .58** .56** .44** .44** .59** .67** .68** .65** .40**World Bond .29* .23 .32** .13 .09 .63** .60** .48** .36** .37** .25* .08 US Dollar .02 .05 .00 .12 .16 -.23 -.19 -.10 -.02 -.02 .07 .18
PPI -.43** -.45** -.42** -.47** -.50** -.10 -.16 -.42** -.39** -.40** -.47** -.55**Tbill .04 .05 .00 .03 .01 .20 .16 .07 .06 .07 -.05 -.13
Equity Aggress. Small Govt Corp. Multi Asset Bal- Conv HighAbsolute Values G&I Growth Income Growth Co Bond Bond Bond Alloc anced Bond Yield
GSCI -.19 -.19 -.20 -.23 -.25* .01 -.05 -.23 -.14 -.16 -.27* -.36**SP500 .27* .26* .22 .20 .16 .12 .10 .02 .27* .24* .18 -.08 Salomon Bond .18 .14 .19 .07 .05 .53** .52** .26* .27* .26* .17 .02 MSCI -.04 -.03 -.06 -.06 -.11 -.06 -.10 -.14 -.05 -.05 -.12 -.24* World Bond .22 .20 .22 .16 .13 .47** .44** .30* .28* .28* .21 .06 US Dollar -.04 -.01 -.04 .05 .06 -.01 .00 .04 -.02 -.02 .03 .14
24
Table 5. Traditional Asset Correlations
Index MLM GSCI SP500 Tbond MSCI Wbond USDX PPI Tbill
MLMGSCI Total Return .19 S&P 500 -.33** -.28* Solomon Treasury Bond .03 -.05 .54**M.S.C.I. WORLD -.23 -.24* .69** .41**
Solomon World Govt Bond .11 -.07 .33** .63** .53**US Dollar Index -.21 -.04 -.02 -.21 -.28* -.78**PPI .33** .23 -.41** -.10 -.27* .03 -.15 US Treasury Bill .15 .17 .07 .15 -.11 .09 -.12 .23
Index MLM GSCI SP500 Tbond MSCI Wbond USDX PPI Tbill GSCI SP500 Tbond MSCI WbondGSCI .29* .56** -.17 .00 -.23 .03 -.10 .47** .30* SP500 .10 .03 .28* .08 .11 .17 -.18 .17 .31* .32**Salomon Bond .04 -.06 .19 .56** .11 .44** -.18 .06 .04 .04 .27* MSCI .06 .24* -.01 -.09 .12 .11 -.11 .24* .26* .46** .55** -.05 World Bond -.20 -.10 .23 .45** .27* .56** -.31* .03 .15 .00 .13 .39** .17 US Dollar -.21 -.10 -.05 -.01 -.02 -.07 .24* -.20 -.22 -.04 -.09 .05 .02 .54**
Table 6. Correlation of Intramonth Standard Deviation Measures
Intramonth StDev MLM GSCI SP500 USSB USDX GSCI SP500 USSB USDX SP500 JPBD GSCI USDXSP500 .16 .14 -.21 -.12 -.08 .47** .36** .04 -.06 Salomon Bond -.01 -.05 .09 -.22 .12 -.12 -.07 -.14 -.11 .05 GSCI .11 .01 -.08 -.05 -.10 .55** .32** .06 -.12 .68** .06 USDX -.24* -.06 .04 .19 .19 -.13 -.10 .18 .24* .10 -.05 -.03
Nominal Index Values Absolute Index Values
Nominal Index Values Absolute Values Intramonth StDev
25
PerformanceIndex Adj. R2
F-stat Intercept MLM GSCI SP500 SBBI USDX GSCI SP500 SBBI USDX GSCI SP500 SBBI USDX
Dollar Weight 0.32 3.57 -.015 .555* .027 -.122 .474 -.265 -.034 .183 .149 1.035** 3.074 -.677 -1.079 -2.815
Diversified 0.30 3.39 -.006 .745* -.016 -.216 .736 -.280 -.029 .307 -.200 1.001** 1.670 1.484 -.799 -4.754*
Equal-Weight 0.42 5.04 -.001 .427 .048 -.161 .501 -.211 -.050 .168 -.030 .974** 2.946 -.103 -.987 -5.431**
Energy 0.32 3.57 -.015 .555* .027 -.122 .474 -.265 -.034 .183 .149 1.035** 3.074 -.677 -1.079 -2.815
Currency 0.53 7.22 -.042 .358 .077 -.092 1.312* -.439** -.231 .102 -.930 2.128** 7.401** 4.967 -1.203 -6.442**
Financial/Metal 0.35 3.97 -.003 .231 -.055 -.182 .792 -.491** -.051 .340 .422 1.099** 3.321 -3.366 -1.323 -5.270*
Discretionary 0.14 1.88 -.014 .379 .050 -.173 .557 .124 .022 .001 .156 .339* 1.371 1.358 -.490 .882
Trend-Following 0.41 4.83 -.018 .756 .039 -.275 1.032 -.486* -.116 .537 -.037 1.726** 4.322 .844 -2.040 -7.338*
* Significant with 95% confidence, ** Significant with 99% confidence
Nominal Index Coefficients Absolute Index Coefficients Intramonth StDev Coefficients
Table 7A. Regression using MAR CTA Performance Indexes
26
PerformanceIndex Adj. R2
F-stat Intercept MLM GSCI SP500 SBBI USDX GSCI SP500 SBBI USDX GSCI SP500 SBBI USDX
All CTAs .38 4.34 .002 .976** .035 -.124 .405 -.404* -.091 .191 -.149 1.366** 3.489 -1.986 -1.077 -6.219*
Best Five .42 5.02 .085 1.582* .300 -.257 .109 -.980** -.132 .584 .287 3.256** 8.966 .642 -.933 -11.102*
Median .38 4.36 .005 .919** .029 -.043 .225 -.443** -.069 .173 -.025 1.125** 2.844 -3.320 -1.273 -5.139*
Worst Five .25 2.83 -.081* 1.410** -.126 -.136 .790 -.288 -.133 -.346 -.319 .814* 1.880 -2.337 -1.389 -8.502*
* Significant with 95% confidence, ** Significant with 99% confidence
Nominal Index Coefficients Absolute Index Coefficients Intramonth StDev Coefficients
Table 7B. Regression using Best Performing, Worst Performing, and Median CTAs
PerformanceIndex Adj. R2
F-stat Intercept MLM GSCI SP500 SBBI USDX GSCI SP500 SBBI USDX GSCI SP500 SBBI USDX
All CTAs .31 3.48 .004 1.256** -.010 -.110 .182 -.367 .000 .206 -.130 1.247** 3.111 -2.667 -1.553 -5.472
Best Five .30 3.33 .083 1.759* .038 .034 -.337 -.768* .267 .430 .776 2.449** 4.856 2.445 -2.454 -8.553
Median .29 3.24 .007 1.163** -.010 -.093 .125 -.415* -.064 .253 -.183 1.080** 2.348 -3.037 -1.201 -5.020
Worst Five .31 3.44 -.065* 1.560** -.105 -.127 .599 .017 -.028 -.272 -.610 .684* 4.191 -11.356 -2.355* -5.189
* Significant with 95% confidence, ** Significant with 99% confidence
Nominal Index Coefficients Absolute Index Coefficients Intramonth StDev Coefficients
Table 7C. Regression using Best Performing, Worst Performing, and Median Diversified CTAs
27
PerformanceIndex Adj. R2
F-stat Intercept MLM GSCI SP500 SBBI USDX GSCI SP500 SBBI USDX GSCI SP500 SBBI USDX
EACM 100 0.27 3.03 .010 .150 .031 .075 .207 -.010 -.036 -.003 -.142 .299** .394 -2.336 .114 -.219
Long/Short 0.29 3.25 .007 -.081 .044 -.061 .239 -.054 .032 -.084 .053 .110* 1.295* -.996 -.165 -.795
Relative Value 0.07 1.40 .011* .027 .035 -.005 .075 .005 -.033 .019 .003 .113* -.114 -2.719 .100 .360
Convertible Hedge 0.20 2.33 .010 .032 .034 -.021 .098 .040 -.017 .106 -.039 .182 -1.670 -4.131 -.119 2.621**
Bond Hedge -0.10 0.51 .010** .037 .000 .015 .008 .004 -.029 -.013 -.055 -.012 -.209 -.790 .167 .319
Event Driven 0.33 3.72 .028** -.033 .012 .211** .093 .095 -.031 -.157 -.274 -.009 -.748 -1.962 -.205 .135
Rotational -0.09 0.55 .019 .122 .062 .047 -.045 .029 -.119 .065 .053 .172 .127 -4.961 .516 -.706
Arbitrage 0.42 4.88 .029* -.142 -.077 .286** .204 .073 -.004 -.292* -.229 -.075 -.506 .486 -.335 -1.324
Bankruptcy 0.15 1.97 .029* .004 .134 .225 -.111 .124 -.099 -.047 -.300 .058 -.520 -5.836 -.319 2.021
Equity Hedge 0.50 6.50 .015 .008 .052 .390** .082 .080 -.028 -.026 -.360 .122 -1.265 -2.174 .425 1.727
Multi-index 0.21 2.46 .027** .040 -.021 .123 .185 .088 .010 -.133 -.292 -.009 -1.220 -.536 .039 -.293
Domestic Long 0.67 11.9 .005 .047 .070 .585** -.044 .106 -.120 .017 -.408 .059 -1.234 -.987 .751 2.771**
Dom. Opportunity 0.11 1.67 .003 .137 .198** .036 .386 .057 -.019 .038 -.457 .192 -1.653 2.550 .515 1.412
Short Selling 0.64 10.6 .022 .307 .063 -1.355** .852 -.173 -.087 .040 .185 .156 3.350 -5.406 -.054 -5.728*
Global/Internat'l 0.39 4.50 .036* -.161 -.111 .548** -.095 .078 .055 -.132 -.216 .114 -.908 -8.084 .010 .998
* Significant with 95% confidence, ** Significant with 99% confidence
Nominal Index Coefficients Absolute Index Coefficients Intramonth StDev Coefficients
Table 8A. Regression using EACM Hedge Fund Performance Indexes
28
PerformanceIndex Adj. R2
F-stat Intercept MLM GSCI SP500 SBBI USDX GSCI SP500 SBBI USDX GSCI SP500 SBBI USDX
All Funds .58 8.49 .012 .139 .039 .399** -.335* .097* -.108* -.130 -.045 .128 -.425 -3.051 .450 1.424*
Best Five .53 7.20 .022** .060 .050 .375** -.318 .123* -.062 .020 -.041 .170* -.365 -2.511 .668* 1.403
Median .56 7.99 .015** .065 .056 .303** -.169 .075 -.113* -.122* -.099 .057 -.382 -3.232 .408 1.131
Worst Five .22 2.53 -.043 1.165** -.087 .572** -1.158 .170 -.315 -.628* -.007 .215 .336 -10.950 .217 4.125
* Significant with 95% confidence, ** Significant with 99% confidence
Nominal Index Coefficients Absolute Index Coefficients Intramonth StDev Coefficients
Table 8B. Regression using Best Performing, Worst Performing, and Median Hedge Funds
PerformanceIndex Adj. R2
F-stat Intercept MLM GSCI SP500 SBBI USDX GSCI SP500 SBBI USDX GSCI SP500 SBBI USDX
All Funds .67 11.8 .009 .101 .043 .449** -.342* .073 -.118* -.224** -.154 .111 -.964 -3.262 .485 1.280
Best Five .50 6.57 .024** .054 .056 .352** -.219 .130* -.070 .039 -.130 .165* -.072 -2.499 .552 1.261
Median .72 15.2 .008 .020 .019 .435** -.281 .020 -.063 -.312** -.050 .061 -1.216 -2.181 .271 .934
Worst Five .58 8.51 -.006 .204 .048 .549** -.528* .062 -.190* -.407** -.269 .096 -1.733 -4.626 .611 1.604
* Significant with 95% confidence, ** Significant with 99% confidence
Nominal Index Coefficients Absolute Index Coefficients Intramonth StDev Coefficients
Table 8C. Regression using Best Performing, Worst Performing, and Median Opportunity Hedge Funds
29
PerformanceIndex Adj. R2
F-stat Intercept MLM GSCI SP500 SBBI USDX GSCI SP500 SBBI USDX GSCI SP500 SBBI USDX
Growth & Income 0.98 259.7 .000 -.017 .012 .895** -.062 .029 -.025 .009 .021 .005 -.719* -.134 .295* .568
Equity Income 0.95 101.6 .005 .008 .052* .721** .149 .027 -.065 -.024 -.067 -.003 -.436 -1.458 .238 .468
Growth 0.91 59.34 -.003 -.101 -.034 1.003** -.241 .031 .008 .038 -.055 .030 -1.079 .111 .390 1.461
Aggress. Growth 0.77 19.72 .005 -.234 -.075 1.249** -.617 .097 -.006 .032 -.189 .101 -2.382 -2.429 .825 2.892
Small Company 0.76 18.26 .009 -.147 -.045 1.155** -.712* .143 -.052 -.031 -.075 .108 -2.520 -3.348 .937 2.863
Corporate Bond 0.98 234.5 .002 .013 .011 .029** .784** .007 -.025** .010 -.034 .006 .101 -.746* .009 .051
Gov't Bond 0.97 190.9 .001 .002 -.001 .034** .767** -.009 -.001 -.005 -.010 .006 .208 -.612 .012 -.110
Multi-Sect. Bond 0.67 11.95 .015** .050 .032 .190** .547** -.005 -.101* -.069 -.181 .050 .401 -4.888** .133 -.042
Asset Allocation 0.94 91.77 -.002 .034 .016 .482** .225** .018 -.012 .022 .016 .018 -.452 -.130 .162 .748*
Convertible Bond 0.82 26.18 .002 .006 .030 .611** -.088 .033 -.098 .007 -.024 .037 -1.356 -2.532 .560* 2.447**
Balanced 0.97 152.5 -.001 -.019 .009 .562** .311** .019 -.016 .002 -.025 .015 -.309 -.496 .172 .598
High Yield 0.34 3.76 .027* .040 .086 .273** .198 .120 -.206* -.060 -.265 .113 .331 -7.998* -.016 .439
Global 0.65 11.31 .012 .167 .047 .437** .075 -.088 -.044 -.047 -.173 .038 -.867 -4.038 .192 1.033
* Significant with 95% confidence, ** Significant with 99% confidence
Nominal Index Coefficients Absolute Index Coefficients Intramonth StDev Coefficients
Table 9A. Regression using Morningstar Mutual Fund Performance Indexes
30
PerformanceIndex Adj. R2
F-stat Intercept MLM GSCI SP500 SBBI USDX GSCI SP500 SBBI USDX GSCI SP500 SBBI USDX
All Funds .98 224.2 .000 -.021 .015 .882** -.046 .035 -.033 .002 .010 .001 -.731* -.256 .340** .646
Best Five .88 42.36 .016 -.185 .019 .843** -.120 .163** .029 .174* .242 .040 -.351 -1.593 .815** 1.562
Median .98 296.2 .000 -.008 .017 .903** -.052 .014 -.025 .001 .015 .003 -.592* -.234 .234* .560
Worst Five .90 48.50 -.023** -.097 .005 .818** .154 .075 -.107 -.158* -.249 -.006 -2.044** .976 .334 1.365
* Significant with 95% confidence, ** Significant with 99% confidence
Nominal Index Coefficients Absolute Index Coefficients Intramonth StDev Coefficients
Table 9B. Regression using Best Performing, Worst Performing, and Growth & Income Mutual Funds
31
Table 10. Traditional Asset Correlations
Average Top 5 Median Bottom 5 MLM Average Top 5 Median Bottom 5 Average Top 5 Median Bottom 5Top 5 .88** .88** .93**
Median .98** .81** .88** .85** 1.00** .93**Bottom 5 .76** .52** .74** .54** .19 .25* .94** .83** .93**MLM .37** .31* .38** .40** -.35** -.34** -.37** .04 -.36** -.39** -.35** -.42**
SP500 Average Top 5 Median Bottom 5 MLM Average Top 5 Median Bottom 5 Average Top 5 Median Bottom 5Return -.19 -.24* -.15 -.14 -.34** .66** .63** .65** .11 .99** .90** .99** .91**
Standard Dev. .10 .25* .05 -.13 .14 -.24* -.03 -.27* -.20 -.21 -.03 -.21 -.38**Max Drawdown -.30* -.42** -.27* -.01 -.35** .52** .32** .54** .26* .56** .37** .55** .69**
Max Drawup -.02 -.05 -.01 -.08 .01 -.06 -.02 -.08 -.05 .15 .18 .16 .10
JPM Bond Average Top 5 Median Bottom 5 MLM Average Top 5 Median Bottom 5 Average Top 5 Median Bottom 5Return .04 -.04 .07 .10 .03 .29* .29* .26* .21 .53** .46** .54** .50**Standard Dev. -.14 -.11 -.16 -.09 -.01 .23 .22 .24* .16 .10 .06 .09 .11 Max Drawdown .08 -.09 .13 .18 -.08 .06 .06 .12 .04 .37** .26* .38** .37**Max Drawup .09 .02 .10 .10 .01 .28* .27* .25* .21 .15 .11 .17 .17
USDX Average Top 5 Median Bottom 5 MLM Average Top 5 Median Bottom 5 Average Top 5 Median Bottom 5Return -.26* -.25* -.32** -.20 -.21 .29* .29* .26* .21 .02 .11 .00 .10 Standard Dev. -.23 -.17 -.23 -.28* -.25* .23 .22 .24* .16 .08 .15 .07 .14 Max Drawdown -.15 -.21 -.18 .06 .08 .06 .06 .12 .04 -.07 -.08 -.08 -.03 Max Drawup -.21 -.16 -.25* -.23 -.20 .28* .27* .25* .21 .07 .14 .06 .15
GSCI Average Top 5 Median Bottom 5 MLM Average Top 5 Median Bottom 5 Average Top 5 Median Bottom 5Return .08 .18 .07 -.06 .17 -.27* -.18 -.20 -.30* -.29* -.23 -.28* -.33**Standard Dev. -.04 .11 -.09 -.19 .12 -.14 .08 -.18 -.22 -.07 .11 -.08 -.22 Max Drawdown -.02 -.12 .02 .13 -.25* .18 -.03 .25* .16 .11 -.06 .12 .26* Max Drawup .00 .16 -.05 -.20 .22 -.30* -.12 -.27* -.32** -.19 -.05 -.19 -.33**
CTA Performance Indexes Hedge Fund Performance Indexes Mutual Fund Performance Indexes
32