Quantitative Analysis Lab...
141
Quantitative Analysis Lab Manual Prof. Monzir S. Abdel-Latif 1 Quantitative Analysis Lab Manual Prof. Monzir S. Abdel-Latif Department of Chemistry Islamic University of Gaza Fifth Edition October 2018
Transcript of Quantitative Analysis Lab...

Quantitative Analysis Lab Manual Prof. Monzir S. Abdel-Latif
1
Quantitative Analysis
Lab Manual
Prof. Monzir S. Abdel-Latif Department of Chemistry Islamic University of Gaza
Fifth Edition October 2018

Quantitative Analysis Lab Manual Prof. Monzir S. Abdel-Latif
2
All Rights Reserved. Direct your inquiries, comments, and
suggestions to:
Quantitative Analysis Lab Manual Prof. Monzir S. Abdel-Latif
3
Preface
This quantitative Analytical Chemistry lab manual in its fifth edition
continues to present basic analytical techniques and methods, to fulfill
the requirements for practical Analytical Chemistry at the sophomore
level. Material was carefully chosen to cover all basic wet Analytical
Chemistry techniques, and students are supposed to master the basic
understanding and skills necessary for such a course.
For those using the manual for the first time, they will find it very
convenient, as the material has been practiced and tested for about
three decades, thanks to all those who taught the material and
contributed a feedback. I prefer using the manual in the same order of
topics and experiments, although it is not necessary.
This manual , in whole or part, can be copied and distributed for
educational reasons, but with suitable referencing. However,
commercial printing, in whole or part, is not permitted without
permission of the author.
Gaza, Palestine October 2018
Prof. Monzir S. Abdel-Latif Professor of Chemistry Islamic University of Gaza

Quantitative Analysis Lab Manual Prof. Monzir S. Abdel-Latif
4
Quantitative Analysis Lab Manual Prof. Monzir S. Abdel-Latif
5
Table of Contents
Preface 3 Chapter 1
9
ESSENTIAL SKILLS AND OPERATIONS 9 Weighing of the Substance Required 9 Precautions 9 Flasks, Beakers and Cylinders 10 PIPETS 10 Burets 11 Desiccators 11 Furnaces and Drying Ovens 12 Cleaning of Glassware 12 Repetition of Experiments 13 Preparation of Dilute Solutions of Acids 13 Safety Rules 14 Chapter 2
15
DATA MANAGEMENT 15 Significant Figures 15 Mutiplication and Division 16 Addition and Subtraction 17 Rounding Off 17 Exact Numbers 18 Accuracy and Precision 19 Types of Errors 19 Determinate Error 19 Indeterminate Error 19 Important Statistical concepts 20 The Linear Least-Squares Line 20 Mean 20 Sample or Estimated Standard Deviation 20 Chapter 3
23
ACID-BASE TITRATIONS 23 Preparation of a Stock HCl solution 23 Standardization of a Stock HCl Solution 24

Quantitative Analysis Lab Manual Prof. Monzir S. Abdel-Latif
6
Preparation of a Stock NaOH Solution 25 Standardization of the Stock NaOH Solution 26 Titrations Involving Weak Acids or Bases 28 Acid - Base Indicators 28 Acid - Base Titrations of Mixtures 30 Determination of a Mixture of Carbonate and Hydroxide 30 Determination of CO3
2-/ HCO3- Mixture 30
Experiment 1. Standardization of Approximately 0.1 M NaOH 31 Experiment 2. Standardization of Approximately 0.1M HCl Solution
35
Experiment 3. Determination of the Total Acidity of Vinegar 40 Experiment 4. Determination of Carbonate and Hydroxide in a Mixture
44
Experiment 5. Determination of the Molecular Mass of an Acid 50 Chapter 4
55
GRAVIMETRIC PROCEDURES 55 Quantitative Reaction 55 Precipitating Agents 55 Filtration of Precipitates 55 Formation of Nuclei Versus Growth of Crystals 56 Optimum Conditions for Precipitation 56 Contamination of Precipitates 57 Experiment 6. Determination of Nickel as Nickel Dimethylglyoximate
61
Experiment 7. Determination of Sulfur by Precipitation as Barium Sulfate
65
Experiment 8. Determination of Chloride by Precipitation as Silver Chloride
68
Chapter 5
71
OXIDATION-REDUCTION TITRATIONS 71 Identification of a Redox Reaction 71 Balancing Redox Reactions 72 Preparation of Permanganate Solutions 76 Standardization of Permanganate Solutions 76 Redox Reactions Involving Iodine 78 Indicators Involved in Iodine Methods 79
Quantitative Analysis Lab Manual Prof. Monzir S. Abdel-Latif
7
Experiment 9. Standardization of Potassium Permanganate Using Sodium Oxalate
83
Experiment 10. Determination of Hydrogen Peroxide by Titration with Potassium Permanganate
86
Experiment 11. Determination of Iron by Redox Titrations 89 Experiment 12. Iodometric Titration of a Hypochlorite Sample 93 Experiment 13. Iodometric Determination of Copper 98 Chapter 6
101
EDTA TITRATIONS 101
Indicators for EDTA Titrations 102
Preparation of an EDTA Standard Solution 103
Sharpness of the End Point 103
Masking and Demasking Agents 103
Back Titration Using EDTA 104
Calculations Involved in EDTA Titrations 104 Experiment 14. Complexometric Determination of Total Hardness of Water
105
Experiment 15. Indirect Complexometric Determination of
Cobalt
109
Experiment 16. Complexometric Determination of Zinc and
Magnesium in a Mixture
113
Chapter 7
117
PRECIPITATION TITRATIONS 117 Argentometric Titrations 117 Mohr Method 117 Volhard Method 118 Fajans Method 118 Experiment 17. Determination of Chloride by Precipitation Titration
119
Experiment 18. Determination of Sulfate by Precipitation Titration
125
Appendix
129
Equilibrium Constants, Physical Constants, Indicators, etc.. 131
Quantitative Analysis Lab Manual Prof. Monzir S. Abdel-Latif
8
A Selected List of Oxidation-Reduction Indicators 132 Ionization Constants of Aqueous Monoprotic Acids 133 Ionization Constants of Aqueous Polyprotic Acids 134
Solubility Products of Slightly Soluble Salts 135
Stability Constants of Aqueous Complex Ions 136
Aqueous Standard Reduction Potentials 137
Values of Fundamental Physical Constants 139
Values of t for degrees of freedom at various confidence levels 140
Values of F at the 95% Confidence Level 141 Rejection Quotient, Q, at Different Confidence Level 141

Quantitative Analysis Lab Manual Prof. Monzir S. Abdel-Latif
9
Chapter 1
ESSENTIAL SKILLS AND OPERATIONS
It is extremely important that chemists pursuing analytical work be
familiar of the very basic skills and essentials of analysis. This will help
provide reasonable data of acceptable accuracy. The first challenge
would be the need to prepare a standard solution. Problems associated
with this can be summarized below:
Weighing of the Substance Required
A knowledge of the operation of analytical balances is
essential. Currently, this problem has been greatly reduced with the
introduction of electronic balances. Digital, fully automated analytical
balances are now most common. Easy calibration, auto zero, and high
precision are just few of their features. However, it should be
emphasized that these balances are very expensive and need special
attention. The best practice, which has proved excellent protection can
be summarized as follows:
After turning the power on, a clean weighing bottle or beaker is placed
on the single pan and the reading is zeroed by using the tare
button. The weighing bottle is then removed from the balance by
means of a piece of paper, placed on a clean weighing paper that is
placed close to the balance. The sample is transferred into the bottle
and the bottle is placed back on the balance. The reading gives the
weight of the sample. The process can be repeated if required.
Precautions
1. Never take back some of the transferred material.

Quantitative Analysis Lab Manual Prof. Monzir S. Abdel-Latif
10
2. Never transfer any chemical to the weighing bottle or beaker while
on the balance, as there is always a good chance of spilling some of the
material on the balance
3. Never try to weigh objects that are not at room temperature.
4. Never use a weighing paper placed directly on the balance. When
you try to take it off the balance your hands may cause a severe shock
to the very sensitive electronic balance.
5. Always make sure that the container used in weighing is precleaned,
dried, and within the weighing range of the balance..
6. Always make sure that the sample is predried and desiccated.
Balances that are good enough for analytical work are those which can
be used for weighing samples in the 0.1 mg range, or at most to the 1
mg range depending on application.
It should also be noted that some electronic balances have special
operating procedures. These should be followed exactly rather than the
general description given above.
Flasks, Beakers and Cylinders
After weighing of the substance, it is necessary to dissolve it in an
appropriate volume of solvent. Measuring flasks with long necks are
used for this purpose where about one third of the flask is filled with
distilled water and the sample is dissolved in this volume. Then the
volume is completed to the mark with distilled water. The bottom of
the meniscus of the solution should touch the mark.
Beakers and cylinders are not adequate for the dissolution of the
sample, as great uncertainty in the volume limit their use.
Pipets
The use of pipets is very frequent in the analytical laboratory. Four
important types of pipets are most common: transfer pipets, measuring
pipets, digital pipets and syringe pipets.
Measuring pipets are not very accurate, although they have excellent
accuracy as compared to cylinders. All work, which involves
Quantitative Analysis Lab Manual Prof. Monzir S. Abdel-Latif
11
transferring a volume of a standard solution or an unknown, should be
made by transfer pipets.
Digital pipets in the microliter range are available and good brands yeild
excellent results. They are very convenient for repetitive transfer of
volumes.
Syringe pipets, Hamilton type, are excellent in the low microliter
range. They find widespread use in Gas and Liquid Chromatography. A
Pasteur pipette is used as a dropper with, usually, no volume calibration.
It should be observed that the bottom of the meniscus should touch the
mark on the pipets of the first two types.
Burets
These are used to deliver the titrant to a conical flask, or
beaker, containing the material to be titrated. The most common
burets have volumes of either 25 mL or 50 mL, but burets of other
volumes and diffirent designs, to fit certain applications, are also
available. It should always be realized that no leakage takes place at the
stopcock, as this might lead to significant errors. Correct reading of the
volume is essential because the relatively large diameter of the buret
may lead to important errors. However, with practice and careful
location of the meniscus, excellent readings can usually be obtained.
Desiccators
These are glass containers that can be vacuumed. The lower part of a
desiccator contains water-absorbing chemicals, calcium chloride is most
common.
Hot objects and chemicals are placed in the desiccator till the
attainment of room temperature. This prevents absorption of
atmospheric water vapor by these chemicals and objects, like glassware.
Quantitative Analysis Lab Manual Prof. Monzir S. Abdel-Latif
12
Furnaces and Drying Ovens
In some cases, precipitates, which do not have definite formula can be
ignited to attain a known chemical formula. This is usually done by
placing the sample in a muffle furnace, which is usually electrically
heated up to about 1200 oC.
In other cases, regular drying will kick out extra water in the precipitate
leading to a definite formula. This is conducted in a drying oven, the
temperature of which can reach up to 300 oC.
Drying ovens are also used in drying of different samples, especially
those, which will be used in the preparation of standard solutions or
samples of unknown materials.
Drying ovens are also used for glassware drying after regular cleaning.
Cleaning of Glassware
It is essential to pursue all analytical work using very clean
glassware. Distilled water is not enough for cleaning. The washing
process involves a sequence of steps starting with rinsing the glassware
with tap water several times followed by a detergent solution (like
Teepol). Tap water is used again followed in the last step with distilled
water.
If this is not enough, glassware can be soaked in the detergent solution
for hours before rinsing with tap water.
In some cases of severe dirt, dilute acids or bases can be used and in
very bad cases chromic acid can be utilized. Always check with your
instructor if you doubt the cleaning method or cleanliness of your
glassware.

Quantitative Analysis Lab Manual Prof. Monzir S. Abdel-Latif
13
Repetition of Experiments
To be sure of your results and to report reasonable data, you should
always repeat the experiment in question several times, at least three
times. The mean is reported together with the relative standard
deviation. If a calibration curve is involved, the equation for the least-
square line should be reported in addition to mean and relative
standard deviation.
Preparation of Dilute Solutions of Acids
It is important to know how a dilute acid solution can be prepared from
the concentrated acid. Although the discussion here is concerned with
acids, the same principle can be applied to any liquid sample.
The molarity of the concentrated acid can be determined followed by
dilution using the dilution law. For example, prepare 200 mL of 2 M
H2SO4 from a 88% H2SO4 solution which has a density of 1.84 g/mL.
Solution
� =� ∗% ∗ 10�
��
� =1.84∗ 0.88 ∗ 10�
98= 16.5 �
Then from dilution law, the volume of H2SO4 that should be diluted to
200 mL can be calculated:
���� (����)= ���� (���)
16.5 ∗ �� = 2 ∗ 200
�� = 24.2 ��
Therefore 24.2 mL of the concentrated acid should be diluted to 200 mL
in order to obtain a 2 M solution.

Quantitative Analysis Lab Manual Prof. Monzir S. Abdel-Latif
14
The key elements, which you should look for are the density and
percentage of the liquid in order to evaluate its molarity.
Safety Rules
Your should be aware that working with chemicals may be of great
hazard if not properly undertaken. Some rules for your safety are
presented below. You are fully responsible for implementing these
rules; otherwise you should expect dismissal or supension from the
laboratory:
1. You should wear safety glasses or goggles for eye protection in the
laboratory or wherever chemicals are manipulated. Contact lenses are
dangerous in the laboratory especially when working with corrosive
gases. Check with the instructor if you have to wear them.
2. No eating, drinking or smoking is allowed in the laboratory.
3. It is forbidden to use laboratory glassware as food or drink
containers.
4. Appropriate clothing should be worn all the time while in the
laboratory.
5. It is forbidden to conduct any experiment while alone in the
laboratory as well as any unauthorized experiments.
6. Avoid using open-toed shoes or sandals in the laboratory. Chemicals
may be spilled on your skin.
7. Mouth suction of solutions is prohibited for any reason.
8. Always, wash your hands and face after finishing your lab work.
9. If concentrated chemicals come in contact with your skin, flush with
plenty of water for at least 10-15 min.
10. Immediately report any accident or unusual observation to your
instructor.

Quantitative Analysis Lab Manual Prof. Monzir S. Abdel-Latif
15
Chapter 2
DATA MANAGEMENT
An analytical chemist is responsible for many tasks including
measurement of unknown concentrations of analytes. Usually, this is
accomplished by conducting experiments in, at least, triplicates. This is
just to make sure that the measurement is reproducible and
precise. However, it is very seldom that all three results will be
identical. Therefore, a method of choosing an acceptable value, in order
to include in a report, should be available.
In other cases, some experimental data may be too much off and a
method for evaluating this data point must be considered. Also, an
acceptable method of presenting data in some fashion where it can be
compared, manipulated, or used in other calculations should be applied.
Significant Figures
It is essential to report results that really express the actual values for
measurements. For example, it is nonsense to report a result for weight
in three significant figures if the balance that was used gives only
two. Therefore, it is of extreme importance to use the correct number
of significant figures to express a result. The argument below shows
how calculations can be made using the significant figure concept:
Counting Significant Figures
1. All digits from 1-9 are significant. For example:
1.235 has 4 significant figures
2. All zeros occurring within numbers from 1-9 are significant.
Example: 1002201 has 7 significant figures

Quantitative Analysis Lab Manual Prof. Monzir S. Abdel-Latif
16
3. If the value has no decimal point, all zeroes to the left or right of
numbers from 1-9 are non-significant.
Example: 351000 has 3 significant figures, and the value 0038000 has
just two.
4. If the value contains a decimal point, all zeroes to the right are
significant, while those occurring to the left are non-significant.
Example: the value 0.000400 has 3 significant figures, while the value
0.0003 has only one. Do not mess with values like 2.0005 which has five
significant figures, as we start counting from the first digit to the left and
proceed to right. All zeros to the left of a digit other than zero are not
counted.
Mathematics Using Significant Figures
Mutiplication and Division
In multiplication and division processes, the answer should have
significant figures equal to the least number of significant figures
involved in the process (the key number). For example:
1.32 x 2.5 = 3.3025
The correct answer should contain two significant figures: i.e. 3.3.
Combined operations of multiplication and division are treated in the
same manner. For example:
35.63 ∗ 0.5481∗ 0.05300
1.1689∗ 100% = 88.5471%
The answer should have three significant figures, i.e. 88.55
In this regard it should be mentioned that, in some cases, one might
have to use the scientific notation concept, which includes writing the
result in exponential form. Example:
137.5 ∗ 5.45
0.023= 30211.957= 3.0 ∗ 10�

Quantitative Analysis Lab Manual Prof. Monzir S. Abdel-Latif
17
However, the answer should have two significant figures only, therefore,
the answer should be written as: 3.0X10⁴.
In situations where the answer is less than the key number (omitting the
decimal point if present), the answer should have an extra digit (more
than the key number) but written as a subscript). For example:
3.6432∗ 3.59
0.423= 30.91982
This is equal to 30.91982 (from calculator), however the correct answer
should be reported as 30.92 since the value 309 is less than the key
number 359 (regardless of the decimal point). This has to do with
adjusting the uncertainty and will be covered in details in the theoretical
course.
Addition and Subtraction
In calculations involving addition and subtraction, the easiest way is to
look at the uncertainties of the measurements. For example, a sample
was weighed on different balances, on the first balance it weighed
4.3271 g and on the second it weighed 4.33 g. The summation of the
two values will yield:
4.3271 + 4.33 = 8.6571
However, the uncertainly of the second measurement is in the
hundredth (+ 0.01) while that of the first value occurs in the one in ten
thousands (+0.0001) which is much smaller than the uncertainty in the
value 4.33. The answer cannot have an uncertainty better than the
highest uncertainty in any measurement.
Therefore, the result should not be more precise than the second
measurement and only two significant figures should be included after
the decimal point giving an answer of 8.66.
Rounding Off
Any digit that is greater than 5 must be rounded off while those which
are less than 5 are dismissed. In case the digit equals exactly 5, then if
Quantitative Analysis Lab Manual Prof. Monzir S. Abdel-Latif
18
rounding off will result in an even digit, it should be rounded off. On the
other hand, if rounding off results in an odd digit, the 5 is not rounded
off.
Rounding the value 6.885 to 3 significant figures gives 6.88, while
rounding the value 6.875 to 3 significant figures will also give 6.88.
However, one should know that in a value like 6.88500001, rounding to
3 significant figures gives 6.89, as this problem does not follow the
above rule, since 500001 is greater than 5.
Exact Numbers (have infinite numbers of Significant Figures)
1. The counts: for example, you have done 3 experiments. The
number 3 has an infinite number of significant figures, since it is
exact and impossible to have performed 3.2 or 2.8 experiments.
Thus it could be written as 3 or 3.0 or 3.0000, etc.
2. The 10x (scientific notation) is not considered towards counting
significant figures.
3. Equivalent relations are not considered towards counting the
number of significant figures as these contain infinite number of
significant figures. For example, the equivalents:
1 m = 100 cm
The 1 and the 100 here are exact numbers where an infinite number of
significant figures can be written.
1.0000... = 100.0000... cm
It is clear that a 1m will always be exactly 100 cm not less or more, or
simply such equivalents have no uncertainties.
Therefore, in the calculation,
2.34 �� ∗3 ��
1 ��= 7.02 ��

Quantitative Analysis Lab Manual Prof. Monzir S. Abdel-Latif
19
The exact numbers in the ratio � ��
� �� has nothing to do with significant
figures.
Accuracy and Precision
Accuracy is a measure of how close a measurement is to the actual
value. However, it does not necessarily give an idea about the skill of
the analyst. Precision is a measure of the ability to reproduce the
results, but may not always refer to accuracy of the measurement. In
some cases, accurate results may not be precise and, of course, precise
results may not necessarily be accurate.
Types of Errors
Two major types of errors are usually encountered:
1. Determinate Error
It is the type of error that can be followed and assessed where it usually
results in deviation from the correct answer in certain
direction. Examples of determinate error include, for example, the use
of an uncalibrated pipet that takes more or less volume than it should,
uncalibrated equipment in general, the chemical method used may not
necessarily be quantitative enough or yield some bias in certain
directions, etc.
2. Indeterminate Error
This type of error is a random error that cannot be systematically
followed and corrected. The effect on results cannot be predicted. An
example of this type of error can be encountered in an experiment that
is performed by a lazy or tired student where inadequate attention is

Quantitative Analysis Lab Manual Prof. Monzir S. Abdel-Latif
20
paid to the several experimental steps that should be done. One can
not exactly evaluate which step was not performed properly.
Important Statistical concepts
Mean
The sum of individual values divided by the number of values is called
the average or mean.
For example, an analyte was weighed after precipitation. The weights
are 1.37, 1.35, 1,43, and 1.28 g. Calculate the mean:
� � =1.37+ 1.35+ 1.43+ 1.28
4= 1.36
Sample or Estimated Standard Deviation, s
This is a measure of precision of a set of results. Mathematically, it is
represented by the relation
� = �∑ (x�− x�)�����
� − 1
where Xi, represents individual values.
n , represents the number of values.
can be obtained for the data points in the previous example.
(x�− x�)� (x�− x�) x�
0.0001 0.01 1.37
0.0001 -0.01 1.35
0.0049 0.07 1.43
0.0064 -0.08 1.28
� (x�− x�)�
= 0.0115

Quantitative Analysis Lab Manual Prof. Monzir S. Abdel-Latif
21
� = �0.0115
3= 0.062
The Linear Least-Squares Line
It is a regular practice that analytical chemists construct calibration
curves is order to use the resulting straight line for calculation of an
unknown concentration. The straight line expression is given by the
relation:
� = �� + �
where X, Y are the two variables
m, b represent the slope and intercept, respectively, m can be obtained
from the relation:
� = {∑(����)− (∑ ��∑ ��)/�}
�∑ ��� − ��∑ ���
��/��
And b can be obtained from the relation:
��= ���+ �
Where X and Y are the means for variables Xi and Yi, respectively.

Quantitative Analysis Lab Manual Prof. Monzir S. Abdel-Latif
22

Quantitative Analysis Lab Manual Prof. Monzir S. Abdel-Latif
23
Chapter 3
ACID-BASE TITRATIONS
Acids can be neutralized by addition with bases, and vice versa, yeilding
appropriate salts and water. The reaction of strong acids with strong
bases is straightforward with the availability of good
indicators. However, the most widely used acid, HCl, and base, NaOH,
are not primary standards where a preliminary standardization step is
required for each of them.
Preparation of a Stock HCl solution
HCl solutions are usually prepared by dilution of the concentrated
solution which has a molarity of about 11. The molarity of the
concentrated solution can be calculated from the knowledge of two
pieces of information, namely density of the solution and percentage of
HCl as below:
� =� ∗% ∗ 10�
��
For example, the molarity of a HCl solution that is 32% and has a density
of 1.20 g / mL can be calculated as follows:
� =1.20 ∗ 0.32 ∗ 10�
36.5= 10.5 �
Any solution of lower molarity can be prepared by dilution using the
relationship
���� (����)= ���� (���)

Quantitative Analysis Lab Manual Prof. Monzir S. Abdel-Latif
24
Standardization of a Stock HCl Solution
HCl stock solution can be standardized using a primary or secondary
standard solution. Two important methods are usually used; against
sodium carbonate, or sodium tetraborate decahydrate (borax). The
second substance is preferred due to its relatively large molecular mass,
superior purity, non-hygroscopic characters, and sharpness of the end
point at room temperature.
a. Against Na2CO3
Sodium carbonate reacts with HCl according to the equation:
Na2 CO3 + 2 HCl 2 NaCl + CO2 + H2O
This reaction occurs if enough HCl is used which can be visualized using
methyl orange indicator. Usually, an appropriate weight of Na2CO3 is
dissolved in water and titrated against HCl to determine the molarity of
the acid. For example: When 0.800 g Na2CO3 are dissolved in water
and required 25.00 mL of HCl in presence of methyl orange indicator,
the molarity of HCl can be calculated as follows:
2���� ������ = ���� ���
2 ∗�� (������)
�� (������) = ���� ∗ ���(���)
2 ∗800
106 = ���� ∗ 25
���� = 0.60 �
However, in presence of phenolphthalein indicator, the end point of the
reaction between Na2CO3 and HCl appears when the reaction proceeds
to the point of NaHCO3 formation which requires half the volume of HCl
consumed in the previous example.
Na2C03 + HCl NaCl + NaHC03

Quantitative Analysis Lab Manual Prof. Monzir S. Abdel-Latif
25
The molarity of HCl in the previous example can be calculated by
substitution of a 1:1 mole ratio of HCl to Na2CO3.
It is clear from above that in case of using phenolphthalein indicator the
volume of HCl is half that required for the observation of the end point
as compared to the volume required in presence of methyl orange
indicator.
b. Against Sodium Tetraborate
Sodium tetraborate (borax) can be used for neutralization of acids as
mentioned previously. Usually, methyl red is the preferred indicator
where boric acid is the result of the reaction as the following equation
shows:
Na2B4O7 + 2 HCl + 5 H2O 4 H3BO3 + 2 NaCl
The concentration of stock HCl can be determined from results of the
titration. For example, 25.00 mL of HCl were consumed in the
neutralization of 0.600 g of Na2B4O7.1O H2O . The molarity of HCl can
be calculated as follows:
2���� ������� = ���� ���
2 ∗�� (�������)
�� (�������.10���) = ���� ∗ ���(���)
2 ∗600
381.4 = ���� ∗ 25
���� = 0.13 �
Preparation of a Stock NaOH Solution
When a stock solution of NaOH is to be prepared, preboiled and cooled
distilled water is used. This step is necessary to eliminate any dissolved

Quantitative Analysis Lab Manual Prof. Monzir S. Abdel-Latif
26
CO2 . An appropriate weight of solid NaOH is transferred into a glass vial
and dissolved in distilled water.
For example, when 500 mL of 0.1 M NaOH is to be prepared, the weight
of NaOH can be determined as follows:
����� ∗ ���(����) =�� (����)
�� (����)
0.1 ∗ 500 =�� (����)
40
�� (����)= 2000 �� �� 2 �
Therefore, this weight of NaOH is dissolved in 500 mL to yeild a 0.1 M
solution.
Standardization of the Stock NaOH Solution
Solid NaOH is hygroscopic where significant amounts of water vapor can
be absorbed. Also, as NaOH is a strong base, significant amounts of
atmospheric carbon dioxide can be absorbed. Therefore, it should
always be remembered that vials containing NaOH, either solid or
solution, should be well closed and separated from atmosphere. It is
also clear that NaOH cannot serve as a primary standard and thus needs
standardization by a primary or secondary standard.
a. Against Standardized HCl
NaOH solutions can be directly titrated versus standardized HCl using
phenolphthalein or methyl orange indicator. If reasonable
concentrations of the acid and base are used, very sharp end points can
be achieved. The concentration of stock NaOH solution can be
Quantitative Analysis Lab Manual Prof. Monzir S. Abdel-Latif
27
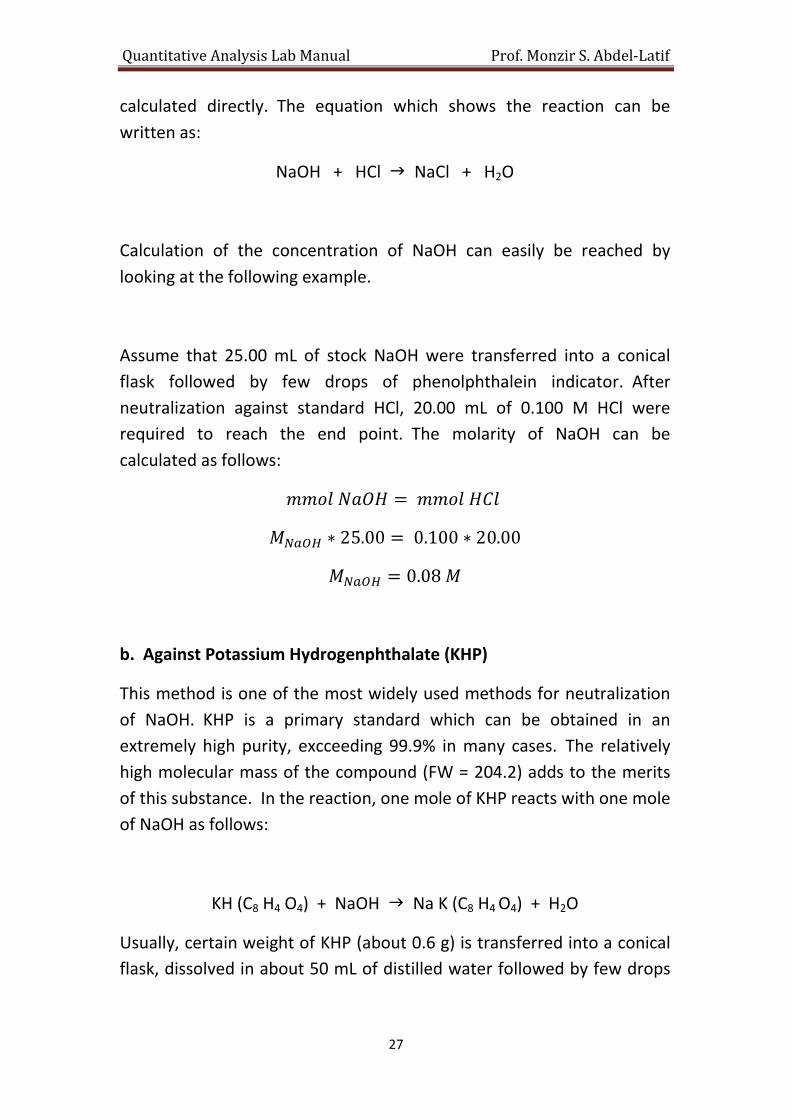
calculated directly. The equation which shows the reaction can be
written as:
NaOH + HCl NaCl + H2O
Calculation of the concentration of NaOH can easily be reached by
looking at the following example.
Assume that 25.00 mL of stock NaOH were transferred into a conical
flask followed by few drops of phenolphthalein indicator. After
neutralization against standard HCl, 20.00 mL of 0.100 M HCl were
required to reach the end point. The molarity of NaOH can be
calculated as follows:
���� ���� = ���� ���
����� ∗ 25.00 = 0.100 ∗ 20.00
����� = 0.08 �
b. Against Potassium Hydrogenphthalate (KHP)
This method is one of the most widely used methods for neutralization
of NaOH. KHP is a primary standard which can be obtained in an
extremely high purity, excceeding 99.9% in many cases. The relatively
high molecular mass of the compound (FW = 204.2) adds to the merits
of this substance. In the reaction, one mole of KHP reacts with one mole
of NaOH as follows:
KH (C8 H4 O4) + NaOH Na K (C8 H4 O4) + H2O
Usually, certain weight of KHP (about 0.6 g) is transferred into a conical
flask, dissolved in about 50 mL of distilled water followed by few drops
Quantitative Analysis Lab Manual Prof. Monzir S. Abdel-Latif
28
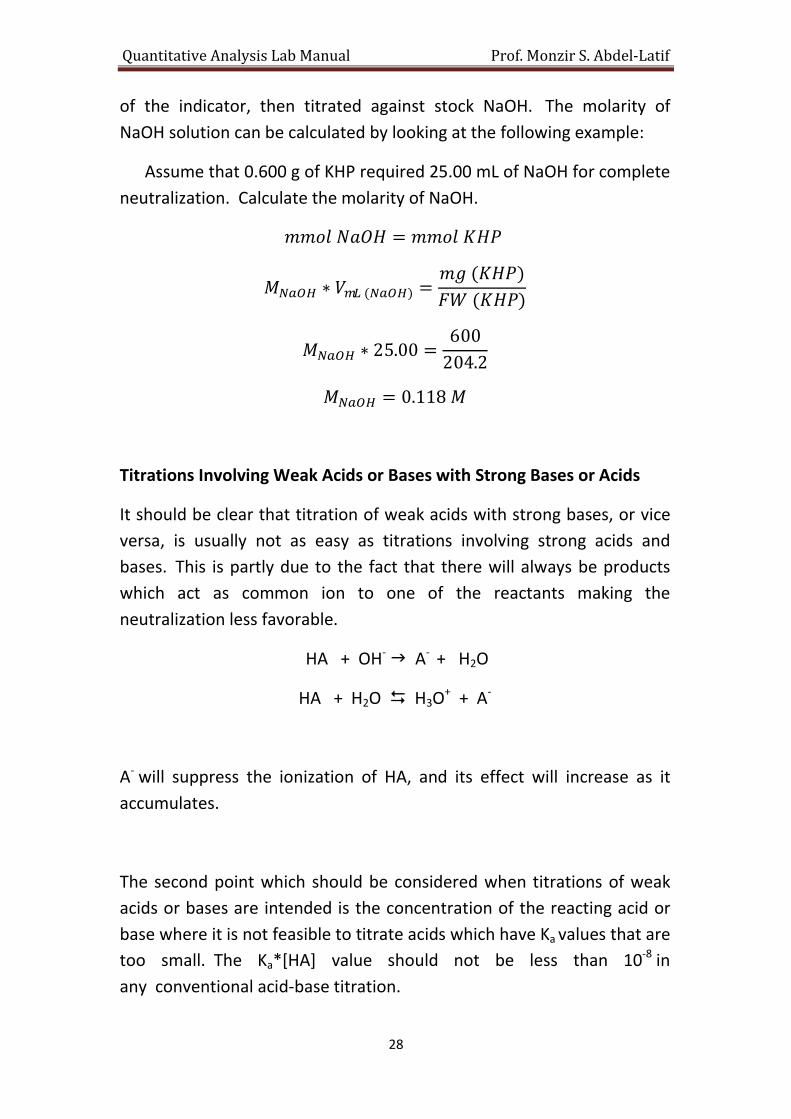
of the indicator, then titrated against stock NaOH. The molarity of
NaOH solution can be calculated by looking at the following example:
Assume that 0.600 g of KHP required 25.00 mL of NaOH for complete
neutralization. Calculate the molarity of NaOH.
���� ���� = ���� ���
����� ∗ ���(����) =�� (���)
�� (���)
����� ∗ 25.00 =600
204.2
����� = 0.118 �
Titrations Involving Weak Acids or Bases with Strong Bases or Acids
It should be clear that titration of weak acids with strong bases, or vice
versa, is usually not as easy as titrations involving strong acids and
bases. This is partly due to the fact that there will always be products
which act as common ion to one of the reactants making the
neutralization less favorable.
HA + OH- A- + H2O
HA + H2O H3O+ + A-
A- will suppress the ionization of HA, and its effect will increase as it
accumulates.
The second point which should be considered when titrations of weak
acids or bases are intended is the concentration of the reacting acid or
base where it is not feasible to titrate acids which have Ka values that are
too small. The Ka*[HA] value should not be less than 10-8 in
any conventional acid-base titration.

Quantitative Analysis Lab Manual Prof. Monzir S. Abdel-Latif
29
Acid - Base Indicators
Acid - base Visual indicators are substances that change color when the
pH changes at a specific point. Usually, there is a pH interval for each
indicator which is about 2 pH units. These indicators are either weak
acids or weak bases that dissociate in aqueous solutions as follows:
H In + H20 H30+ + In-
���=[��][���]
[���]
[��]= ���[���]
[���]
�� = ����+ ���[���]
[���]
The base color can be observed when:
[���]> 10[���]
And the acid color can be observed when:
[���]> 10[���]
Therefore, we can write:
�� = ����∓ 1
Which means that, an acid base indicator can work within two pH units
of the the pKa of the indicator only. A list of acid-base indicators is
shown in the appendix.
Quantitative Analysis Lab Manual Prof. Monzir S. Abdel-Latif
30
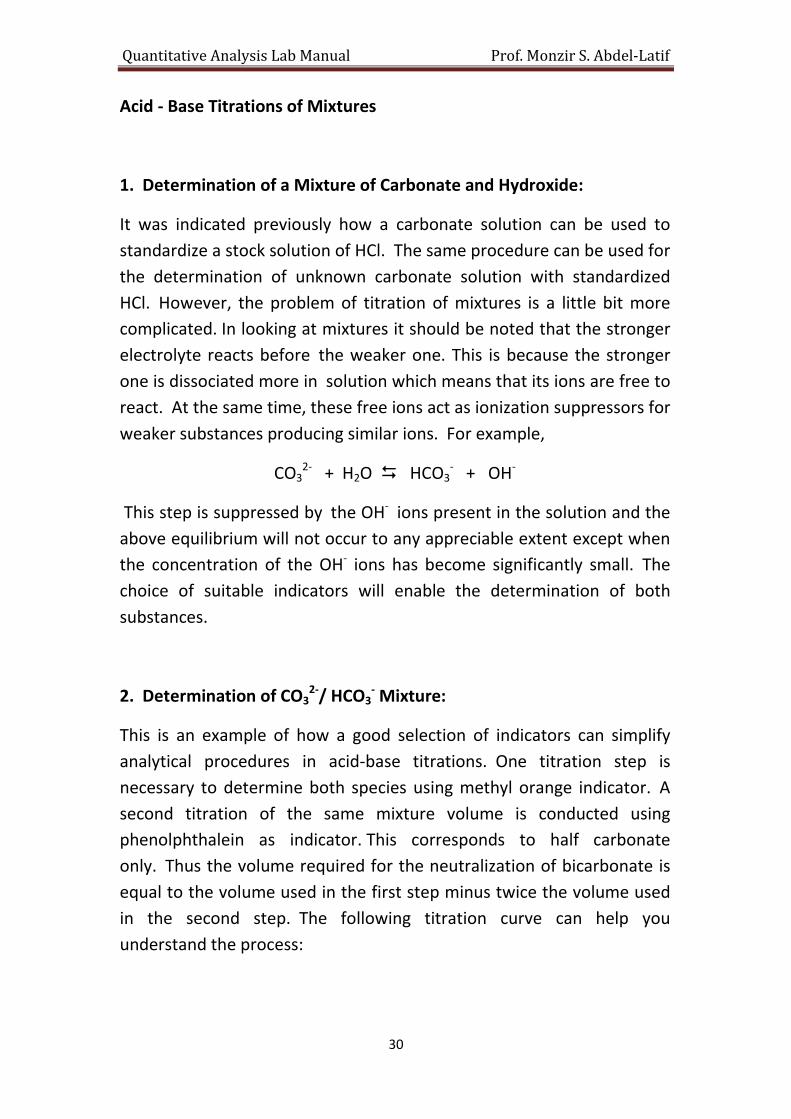
Acid - Base Titrations of Mixtures
1. Determination of a Mixture of Carbonate and Hydroxide:
It was indicated previously how a carbonate solution can be used to
standardize a stock solution of HCl. The same procedure can be used for
the determination of unknown carbonate solution with standardized
HCl. However, the problem of titration of mixtures is a little bit more
complicated. In looking at mixtures it should be noted that the stronger
electrolyte reacts before the weaker one. This is because the stronger
one is dissociated more in solution which means that its ions are free to
react. At the same time, these free ions act as ionization suppressors for
weaker substances producing similar ions. For example,
CO32- + H2O HCO3
- + OH-
This step is suppressed by the OH- ions present in the solution and the
above equilibrium will not occur to any appreciable extent except when
the concentration of the OH- ions has become significantly small. The
choice of suitable indicators will enable the determination of both
substances.
2. Determination of CO32-/ HCO3
- Mixture:
This is an example of how a good selection of indicators can simplify
analytical procedures in acid-base titrations. One titration step is
necessary to determine both species using methyl orange indicator. A
second titration of the same mixture volume is conducted using
phenolphthalein as indicator. This corresponds to half carbonate
only. Thus the volume required for the neutralization of bicarbonate is
equal to the volume used in the first step minus twice the volume used
in the second step. The following titration curve can help you
understand the process:

Quantitative Analysis Lab Manual Prof. Monzir S. Abdel-Latif
31

Quantitative Analysis Lab Manual Prof. Monzir S. Abdel-Latif
32
Applications
Experiment 1. Standardization of Approximately 0.1 M NaOH
Background
As mentioned in the text, NaOH is not a primary standard which means
that it should be standardized either against a primary or a secondary
standard. Potassium hydrogenphthalate (KHP) in primary standard
grade will be used here for this purpose.
Reactions
C8 H5 O4 K + NaOH C8 H4 O4 K Na + H2O
Reagents and Chemicals
a. Provided
1. Stock solution of NaOH (about 5 M) .
2. Phenolphthalein indicator.
3. Solid KHP (predried and desiccated).
b. Need Preparation
1. 500 mL of about 0.1 M NaOH. Method: Transfer about 10 mL of the
5 M NaOH solution (using a cylinder) and dilute to 500 mL with distilled
water.

Quantitative Analysis Lab Manual Prof. Monzir S. Abdel-Latif
33
Procedure
1. Weigh out accurately three KHP samples in the range from 0.200 to
0.300g each. Record the weights to three significant figures.
2. Place each KHP sample in a separate 250 mL conical flask.
3. To each sample add about 25 mL of distilled water (use a cylinder
to perform this step) and gently shake the flask till all KHP samples are
well-dissolved.
4. Add 2 drops of phenolphthalein indicator to each flask.
5. Fill the burette with NaOH that is about 0.1 M and titrate against KHP
solution in the first flask till the very first appearance of the
pink color. Repeat for other flasks.
6. Record the volume to two significant figures after the decimal point.
7. Calculate the molarity of NaOH.
Note: Do not discard excess NaOH as you will need it for future work.
Report of Results
Weight of KHP Volume of NaOH Molarity of NaOH
X =
s =

Quantitative Analysis Lab Manual Prof. Monzir S. Abdel-Latif
34
Remarks and Observations

Quantitative Analysis Lab Manual Prof. Monzir S. Abdel-Latif
35
Experiment 2. Standardization of Approximately 0.1M HCl
Solution
Background
The easiest method to achieve this standardization is to use a standard
NaOH solution. The titration is reproducible and usually yields excellent
results.
As this is a straightforward titration, anhydrous, analytical grade
Na2CO3 will be used in this experiment and results will be compared to
those obtained by the NaOH direct titration.
Reactions
2 HCl + Na2CO3 2 NaCl + CO2 + H2O
HCl + NaOH NaCl + H2O
Reagents and Chemicals
a. Provided
1. A stock HCl solution that is about 2 M.
2. Methyl Orange indicator.
3. Phenolphthalein indicator.
b. Need Preparation
1. About 0.1 M HCl solution (500 mL). Method: can be prepared by
transferring 25 mL of the stock and diluting with distilled water to about
500 mL.
2. 250 mL of 0.05 M Na2C03 standard solution.

Quantitative Analysis Lab Manual Prof. Monzir S. Abdel-Latif
36
Method: Weigh accurately about 1.2 to 1.4 g of predried and
desiccated Na2CO3. Transfer to a 250 mL measuring flask, dissolve in
about 100 mL of distilled water and then complete to the mark using
distilled water. Calculate the exact molarity of this solution.
Using Methyl Orange Indicator
Procedure
1. Transfer exactly 10 mL of the standard Na2CO3 solution into a 250 mL
conical flask.
2. Add 2 drops of methyl orange indicator.
3. Titrate against the approximately 0. 1M HCl solution and record the
volume to two significant figures after the decimal point.
4. Repeat steps 1-3 two more times.
5. Calculate the exact molarity of HCl.
Report of Results
Volume of HCl Volume of Na2CO3 Molarity of HCl
X =
s =
Quantitative Analysis Lab Manual Prof. Monzir S. Abdel-Latif
37
Using Phenolphthalein Indicator
Procedure
1. Repeat steps 1-4 mentioned in the previous procedure but use
phenolphthalein indicator instead of methyl orange.
2. Calculate the exact molarity of HCl.
Report of Results
Volume of HCl Volume of Na2CO3 Molarity of HCl
X =
s =
Using Standard NaOH
Procedure
1. Transfer exactly 10 mL of the approximately 0.1 M HCl solution into a
250 mL conical flask.
2. Add 2 drops of phenolphthalein indicator.
3. Titrate against standard NaOH solution till the very first appearance of
the permanent pink color.
4. Repeat steps 1-3 two more times.

Quantitative Analysis Lab Manual Prof. Monzir S. Abdel-Latif
38
5. Calculate the molarity of HCl.
Report of Results
Volume of HCl Volume of NaOH Molarity of HCl
X =
s =
If you are not certain about any step, contact your instructor and check
with him/her about any problem you may encounter.

Quantitative Analysis Lab Manual Prof. Monzir S. Abdel-Latif
39
Remarks and Observations
Quantitative Analysis Lab Manual Prof. Monzir S. Abdel-Latif
40
Experiment 3. Determination of the Total Acidity of Vinegar
Background
Vineger contains several acids but acetic acid is the major acid present
and results of this experiment should be reported in g acetic acid / 100
mL vinegar. The titration is a typical acid - base titration in which
standard NaOH reacts with acids present.
Reactions
NaOH + CH3COOH CH3COO- Na+ + H2O
Reagents and Chemicals
a. Provided
1. Stock Vinegar solution (100 mL) as the unknown.
In your report of results indicate the unknown number.
2. Phenolphthalein indicator.
b. Need Preparation
1. Standard NaOH (0.1 M) solution.
You should have it from previous experiments, otherwise follow
procedure mentiond in experiment 1 to prepare the standard NaOH
solution.
Quantitative Analysis Lab Manual Prof. Monzir S. Abdel-Latif
41
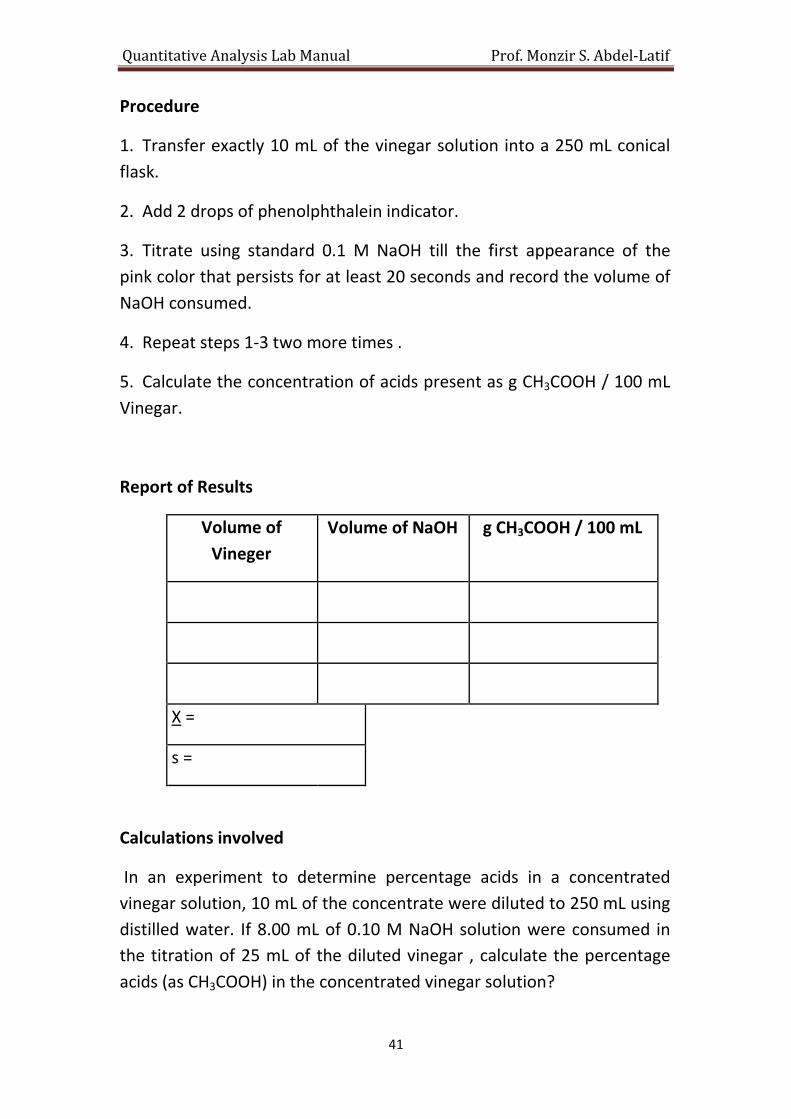
Procedure
1. Transfer exactly 10 mL of the vinegar solution into a 250 mL conical
flask.
2. Add 2 drops of phenolphthalein indicator.
3. Titrate using standard 0.1 M NaOH till the first appearance of the
pink color that persists for at least 20 seconds and record the volume of
NaOH consumed.
4. Repeat steps 1-3 two more times .
5. Calculate the concentration of acids present as g CH3COOH / 100 mL
Vinegar.
Report of Results
Volume of
Vineger
Volume of NaOH g CH3COOH / 100 mL
X =
s =
Calculations involved
In an experiment to determine percentage acids in a concentrated
vinegar solution, 10 mL of the concentrate were diluted to 250 mL using
distilled water. If 8.00 mL of 0.10 M NaOH solution were consumed in
the titration of 25 mL of the diluted vinegar , calculate the percentage
acids (as CH3COOH) in the concentrated vinegar solution?

Quantitative Analysis Lab Manual Prof. Monzir S. Abdel-Latif
42
���� ������� = ���� ����
�� �������
�� �������= ����� ∗ �����
�� ������� �� 25 �� ������� �������
60= 0.10 ∗ 8.00
�� ������� �� 25 �� ������� ������� = 48 ��
�� ������� �� 250 �� �� ������� ������� = 48 ∗250
25= 480 ��
This corresponds to amount of CH3COOH present in 10 mL of the
concentrate. Therefore,
�� ������� �� 100 �� �� ������� ����������� = 0.48 ∗100
10= 4.80 �
This is the percentage acetic acid in vinegar, or:
%������� =4.80
100∗ 100% = 4.80%

Quantitative Analysis Lab Manual Prof. Monzir S. Abdel-Latif
43
Remarks and Observations

Quantitative Analysis Lab Manual Prof. Monzir S. Abdel-Latif
44
Experiment 4. Determination of Carbonate and Hydroxide in a Mixture
Background
It is quite possible to determine carbonate and hydroxide in a mixture
by simple titrimetric procedure. The method which will be discussed
here involves the use of an indicator that changes color after all
carbonate and hydroxide available are completely neutralized by
standard HCl . A second experiment involves addition of excess
BaCl2 solution so as to precipitate the carbonate present. The solution is
then titrated without filtration to determine the hydroxide
present. Carbonate can be determined by difference.
Reactions
Na2 CO3 + 2HCl 2 NaCl + CO2 + H2O
BaCl2 + Na2CO3 BaCO3 (s) + 2NaCl
OH- + HCl H2O + Cl-
Reagents and Chemicals
a. Provided
1. Predried and desiccated sample mixture.
2. BaCl2 solution ( 10% W/V).
3. Phenolphthalein and methyl orange indicators.
b. Need Preparation
1. Standard HCl solution that is about 0.1 M.

Quantitative Analysis Lab Manual Prof. Monzir S. Abdel-Latif
45
You should have enough left from experiment 2, if not follow the
procedure described in experiment 2 to prepare 500 mL of 0.1 M HCl .
Procedure
1. Weigh out accurately about 1.2 - 1.6 g of the predried and
desiccated mixture. Transfer into a 250 mL measuring flask and
dissolve in about 100 mL of distilled water then complete to the
mark.
2. Transfer exactly 25 mL of the mixture into a 250 mL conical flask.
3. Add 3 drops of methyl orange indicator.
4. Titrate against standard HCl solution and record the volume to two
significant figures after the decimal point.
This gives the total alkalinity of the mixture.
5. Repeat steps 1-3 two more times and record your results.
6. Transfer exactly 25 mL of the mixture solution into a 250 mL conical
flask.
7. Add 10 mL of 10% BaCl2 solution, a white precipitate of BaCO3 is
formed.
8. Add 4 drops of phenolphthalein indicator.
9. Titrate against standard HCl till the pink color disappears and record
the volume.
10. Repeat steps 6-9 two more times and accurately record the
volume.
11. By difference, calculate the % Na2CO3 and NaOH in the original
sample mixture.

Quantitative Analysis Lab Manual Prof. Monzir S. Abdel-Latif
46
Report of Results
a. Using methyl orange indicator
Volume of Mixture Volume of HCl (V1)
X =
s =
b. Using BaCl2 and Phenolphthalein Indicator
Volume of Mixture Volume of HCl (V2)
X =
s =
Vol. of HCl consumed by CO32- = V1 - V2 =
Vol. of HCl consumed by OH- = V2
% Na2CO3 =
% NaOH =

Quantitative Analysis Lab Manual Prof. Monzir S. Abdel-Latif
47
Calculations
Assume that V2 was 12 mL and V1 was 26 mL. The weight of Na2CO3 and
NaOH can be calculated as follows provided 0.1 M HCl was used and the
mixture weighed 1.400 g.
���� ��� �������� = ���� ����
12 ∗ 0.1 =�� ����
40
�� ���� = 48 �� �� 0.048 � �� 25 ��
This weight results from 25 mL of the mixture. However, the mixture
total volume is 250 mL which means that 10 times this value is present
�� ���� �� ������� = 0.48 � �� 250 ��
% (����)= 0.48
1.4∗ 100 = 34.3%
���� ��� �������� = 2 ∗ ���� ���CO�
2 ∗�� ���CO�FW ���CO�
= ���� ∗ ����
2 ∗�� ���CO�
106= 0.1 ∗ (26− 12)
�� ���CO� = 74.2 mg in 25 mL
This weight results from 25 mL of the mixture. However, the mixture
total volume is 250 mL which means that 10 times this value is present
�� ���CO�in mixture= 74.2 mg ∗ �250
25�= 0.742 g in 250 mL
% (���CO�)= 0.742
1.4∗ 100 = 53%

Quantitative Analysis Lab Manual Prof. Monzir S. Abdel-Latif
48
The two values do not sum up to 100% providing evidence that the
material is impure or the carbonate or hydroxide or both may not be in
the sodium form.

Quantitative Analysis Lab Manual Prof. Monzir S. Abdel-Latif
49
Remarks and Observations

Quantitative Analysis Lab Manual Prof. Monzir S. Abdel-Latif
50
Experiment 5. Determination of the Molecular Mass of an Acid
Background
Simple titrimetric methods can be of great help in identifying the
molecular mass of a weak acid. An exact weight of the acid is taken,
dissolved in distilled water and then titrated using standard strong base
like NaOH. The molecular mass can be calculated from the results.
Reactions
HA + NaOH H2O + NaA
H2A + 2 NaOH 2H2O + Na2A
H3A + 3 NaOH 3 H2O + Na3A
Reagents and Chemicals
a. Provided
1. Predried and desiccated acid unknown (You will be informed if it is
a mono, di- or triprotic acid).
2. Phenolphtholein indicator solution.
b. Need preparation
1. Standard NaOH that is about 0.1 M. You may still have some from
previous experiments.
If you need more NaOH, follow procedure described in experiment 1 to
prepare it.
Quantitative Analysis Lab Manual Prof. Monzir S. Abdel-Latif
51
Procedure
1. Weigh out, accurately, three samples of about 0.100 - 0.200 g each of
the pure acid unknown provided depending on whether the acid is tri-,
di-, or monoprotic. Check with your instructor for appropriate weight if
you feel doubtful.
2. Transfer each sample to a separate 250 mL conical flask.
3. Add about 25 mL of distilled water to each sample and shake gently
to dissolve the acid.
4. Add 2 drops of phenolphthalein indicator to each flask.
5. Titrate against standard NaOH and record the volume to two
significant figures after the decimal point.
Report of Results
Volume of Acid Volume of NaOH Molecular Mass of
Acid
X =
s =
The molecular mass can be calculated from the results of each
experiment.
Quantitative Analysis Lab Manual Prof. Monzir S. Abdel-Latif
52
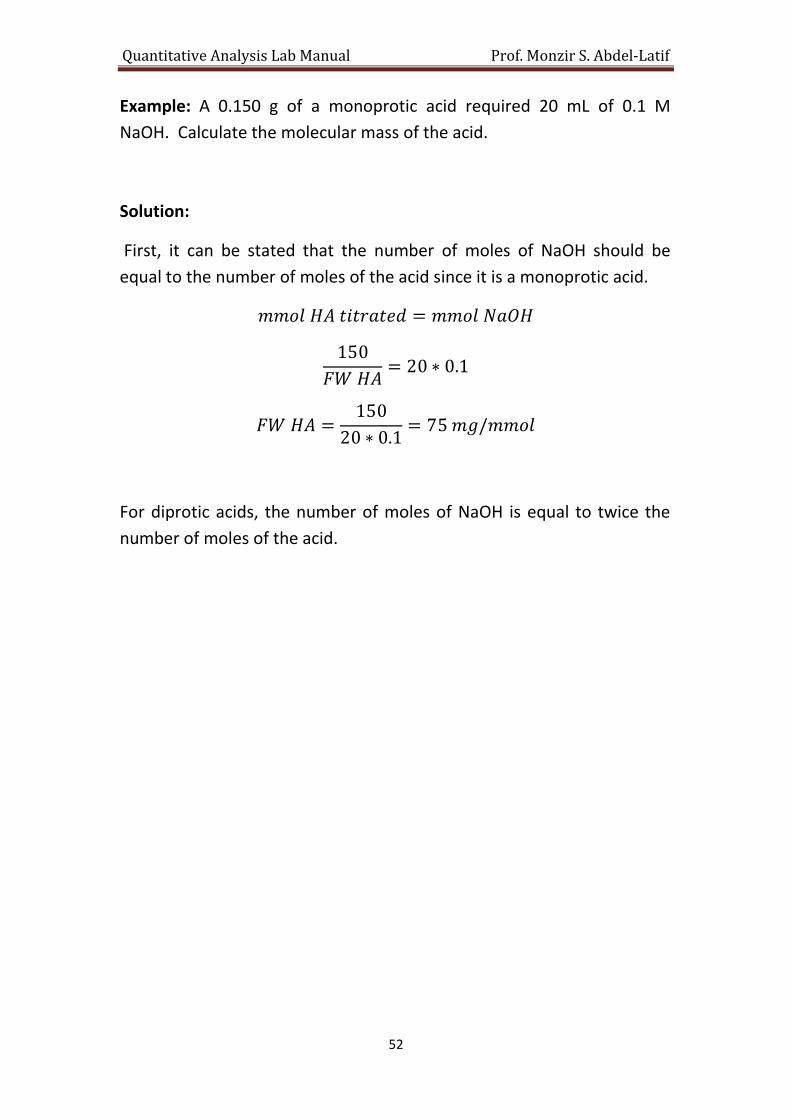
Example: A 0.150 g of a monoprotic acid required 20 mL of 0.1 M
NaOH. Calculate the molecular mass of the acid.
Solution:
First, it can be stated that the number of moles of NaOH should be
equal to the number of moles of the acid since it is a monoprotic acid.
���� �� �������� = ���� ����
150
�� ��= 20 ∗ 0.1
�� �� =150
20 ∗ 0.1= 75 ��/����
For diprotic acids, the number of moles of NaOH is equal to twice the
number of moles of the acid.

Quantitative Analysis Lab Manual Prof. Monzir S. Abdel-Latif
53
Remarks and Observations

Quantitative Analysis Lab Manual Prof. Monzir S. Abdel-Latif
54

Quantitative Analysis Lab Manual Prof. Monzir S. Abdel-Latif
55
Chapter 4
GRAVIMETRIC PROCEDURES
When two solutes in separate solutions are mixed to quantitatively
produce a precipitate, the resulting precipitate can be processed and
used as the basis for a gravimetric procedure. The precipitate can be
washed off, filtered in specific filtration equipment, dried and finally
weighed in order to calculate the concentration of analyte in the original
sample. Gravimetry requires no especially prepared standards since final
calculations are only concerned with the weight of precipitate
itself. However, certain conditions must be satisfied for a gravimetric
procedure to succeed from the analytical point of view.
Quantitative Reaction
The gravimetric reaction must be quantitative which means that the
reaction goes to almost 100% completion with no side reactions of the
analyte with other species. The formula of the precipitate should be
exactly known in order to be able to perform reasonable calculations.
Precipitating Agents
The analyte should selectively react with the precipitating agent which
should preferably have high molecular mass because this will increase
the sensitivity of the method and lower the concentration limit of the
analyte that can be determined. The resulting precipitate should have
minimum solubility so as to decrease losses. However, high solubility
may be necessary (see later sections).
Filtration of Precipitates
Precipitates should be easily filtered in the crystalline state. This is true
if particles are large enough; much larger than colloidal
particulates. Colloidal precipitates are very difficult to filter and are

Quantitative Analysis Lab Manual Prof. Monzir S. Abdel-Latif
56
susceptible to peptization, a process through which filtered precipitates
will return to the colloidal state when washed with water.
Formation of Nuclei Versus Growth of Crystals
It should be emphasized that conditions under which precipitation is
conducted are vital to the formation of crystalline or colloidal
particles. This can be related to the relative supersaturation, first
mentioned be Weimarn in 1913 where,
�������� ��������������� = � − �
�
In this relation:
Q : Concentrations of analyte and precipitating agent.
S : solubility of the precipitate in the medium from which it is
being precipitated.
It turned out that the particle size in a precipitation reaction is inversely
proportional to the value of the relative supersaturation. In situations
involving very high values for supersaturation, nucleation would be
preferred over particle growth leading to colloidal particles. Low values
for supersaturation result in the formation of crystalline particles.
Optimum Conditions for Precipitation
The best approach which should be followed in studying the optimum
precipitation conditions is to study factors affecting the supersaturation.
1. Always, dilute solutions are better because this would decrease the
value of Q , which renders the supersaturation to have lower values,
leading to crystalline particles. Therefore, it is always wise to use dilute
solutions or precipitate from homogeneous solutions.
2. Conduct precipitation from hot solutions. Higher temperatures
increase the solubility of the formed precipitates resulting in lower
values for the supersaturation and better particle size can be

Quantitative Analysis Lab Manual Prof. Monzir S. Abdel-Latif
57
obtained, since smaller particles dissolve and reprecipitate on larger
ones leading to an increase in particle size.
3. Continuous stirring of solution is also an important factor which leads
to better particle size. This is due to the fact that stirring dilutes the
added reagent and homogeneously distributes it through the whole
solution. If the solution is not stirred, while adding the precipitating
agent, the high concentration of the reagent at the spot where it is
added leads to the formation of more nuclei rather than particle growth.
4. Digestion of the precipitate, by heating it for sometime is also
important since smaller particles tend to dissolve and reprecipitate on
larger ones.
5. Adjust the pH of the medium so that the solubility of the formed
precipitate increases. This decreases the value for the supersaturation
and results in larger particles. However, excessive increase of
precipitate solubility by this method may be dangerous since the
reaction may not be quantitative enough.
Solubility = concentration of dissolved undissociated material +
concentration of dissociated material.
In some cases like CaSO4, the concentration of dissolved undissociated
CaSO4 is about 50% of the overall solubility of the compound. Therefore,
the pH should be carefully chosen and adjusted.
Contamination of Precipitates
1. Postprecipitation
The process through which precipitates of foreign metal ions which have
low precipitation rate are precipitated, with time, over the original
precipitate leading to positive errors in all cases. An example of this
type of contamination is the precipitation of Ca2+ as the oxalate in
presence of Mg2+ . If CaC2O4 is not separated shortly after precipitation,
appreciable amounts of MgC2O4 start to accumulate with time over
CaC2O4.

Quantitative Analysis Lab Manual Prof. Monzir S. Abdel-Latif
58
2. Coprecipitation
Three major contamination mechanisms may take place in case of
coprecipitation.
a. Adsorption
This is most significant is cases of colloidal precipitates where particles
of precipitate tend to adsorb foreign ions or molecules, especially ions
which are part of a precipitate but present in excess. Adsorption always
result in positive errors, therefore it should be minimized through good
washing, use of concentrated electrolyte, as well as digestion.
b. Occlusion
The process through which foreign ions or molecules become
incorporated inside the crystal of the precipitate is called occlusion. One
major reason for this is the fast growth of crystals due to fast addition of
reagents. Occlusion may result in either positive or negative errors
depending on the type of occluded species.
c. Inclusion
A process through which an ion from solution replaces an ion of the
precipitate in the crystal lattice. For inclusion to occur, the two ions
should have the same charge and comparable sizes.
Addition of Excess Precipitating Agent
It is necessary to add some excess of the precipitating agent since this
will decrease the solubility of the formed precipitate according to
LeChatelier principle and the solubility product expression.
��� = [���][���]
where MX is a precipitate.
Addition of excess Mn+ or Xn- will reduce the other present in solution,
which results in decreased solubility. However, One should be cautious

Quantitative Analysis Lab Manual Prof. Monzir S. Abdel-Latif
59
that some ions may form complexes with the precipitate forming
soluble products. An example of this is AgCl where addition of much Cl-
will form AgCl2- (aq) or AgCl3
- (aq) . This leads to an appreciable error,
which should be considered.
Calculations Involved in Precipitate Formation
The calculations involved in precipitation reactions are rather
simple. For example, sulfate can be determined by precipitation as
BaSO4. Assume that 1.050 g of BaSO4 were obtained after precipitation,
washing, and drying of the precipitate to constant weight. The weight of
sulfate can be determined as follows:
mmol SO4 = mmol BaSO4
�� (���)
�� (���) =
�� �����
�� �����
�� (���)
�� =
����
���.�
�� (���)=1050 ∗ 96
233.3= 432 ��
If the weight of the sample containing the SO42- is 1.500 g , then the
percentage of sulfate in the sample can be calculated:
%(���)=��� ��
���� ��∗���% ���.�%
The purity of the substance-containing sulfate can be easily determined
if the structure of the substance is known. For example, if a 2.000 g of
impure Na2SO4 yielded 0.500 g SO42- then the purity of Na2SO4 can be
calculated:
���� ��� = ���� ������
�� (���)
�� (���) =
�� ������
�� ������

Quantitative Analysis Lab Manual Prof. Monzir S. Abdel-Latif
60
���
�� =
�� ������
���
�� ������ = 739.6 ��
%(������)=���.� ��
���� ��∗���% ���.�%

Quantitative Analysis Lab Manual Prof. Monzir S. Abdel-Latif
61
Applications
Experiment 6. Determination of Nickel as Nickel Dimethylglyoximate
Background
Dimethylglyoxime forms a solid coordination compund with nickel in
presence of an ammoniacal solution. Pd2+ reacts similarly but in a
slightly acidic solution, therefore it does not interfere. Sodium tartarate
is added to form soluble complexes with Fe3+ and Al3+, which may be
present in the sample.
Reactions
Ni2+ + 2 C4 H8 O2 N2 Ni (C4 H7 O2 N2)2 + 2 H+
Reagents and Chemicals
a. Provided
1. A solution of unknown Ni2+ content, pH = 1-2.
2. 10% tartaric acid solution.
3. NH3 solution, 2 M and 0.01 M.
4. Methyl red indicator 0.02% (w/v) in 60% (v/v) ethanol.
5. Ammonium acetate, 3 M.
6. Dimethylglyoxime solution, 1% in ethanol.
b. Need Preparation
None

Quantitative Analysis Lab Manual Prof. Monzir S. Abdel-Latif
62
Procedure
1. Clean and mark three sintered glass Gooshes of medium porosity.
Dry each in a drying oven at about 120 oC for 1 hr, cool in a
desiccator, weigh and repeat drying and weighing until a constant
weight is obtained. Record the weight of each to 3 significant figures.
2. Transfer, exactly, 25 mL of the Ni2+ unknown into each of
three 400 mL beakers, then add 2 mL of the 10% tartaric acid.
3. Dilute each sample to 125 mL using distilled water.
4. Add 4 drops of methyl red followed by dropwise addition of the
ammonia solution provided till the color changes to yellow.
5. Heat the solution below boiling (80 oC) and add 25 mL of the DMG
solution slowly with continuous stirring.
6. Slowly add about 20 mL of ammonium acetate until the red
precipitate of Ni(DMG)2 is formed. Add an extra 20 mL of
ammonium acetate with stirring.
7. Leave the solution to digest and add 1 mL of DMG to a part of the
supernate to check for completeness of precipitation. If a precipitate
is formed add extra 5 mL of DMG solution and return the supernate.
8. Digest the precipitate for 1 hour at about 60 oC in a water bath.
9. Allow the precipitate to cool to room temperature and filter
through the sintered glass Gooshes treated in step 1.
10. Wash the precipitate with three 5 mL portions of 0.01
M NH3 solution.
11. Dry the Gooshes containing the precipitate in a drying oven at
130 oC for 1 hr . Desiccate and weigh each of them and repeat
drying and weighing till a constant weight is obtained.
12. Report your results as g Ni / 100 mL solution.

Quantitative Analysis Lab Manual Prof. Monzir S. Abdel-Latif
63
Report of Results
Wt of Empty
Goosh
Wt of Goosh
+ ppt
Wt of
Ni(DMG)2
Wt of Ni g Ni /
100mL
X =
s =

Quantitative Analysis Lab Manual Prof. Monzir S. Abdel-Latif
64
Remarks and Observations
Quantitative Analysis Lab Manual Prof. Monzir S. Abdel-Latif
65
Experiment 7. Determination of Sulfur by Precipitation as Barium
Sulfate
Background
Sulfur present in a sulfate sample can be precipitated as BaSO4 . The
precipitate can be collected by filtration through a fine porosity ashless
filter paper, after digestion of the precipitate. The filter paper
containing the precipitate is transferred to a preweighed porcelain
crucible, heated on a flame to remove the solvent and char the paper,
and is then ignited at about 1000 oC, in a muffle furnace.
Reactions
Ba2+ + SO42- BaSO4 (s)
BaSO4 (s) BaS (s) + 2 O2
Reagents and Chemicals
a. Provided
1. 0.2 M BaCl2 solution.
2. 1 : 1 HNO3 solution.
3. Sulfate solution of unknown concentration.
4. 1 : 1 HCl solution.
5. About 0.1 M AgNO3 solution.
b. Need Preparation
None
Procedure
1. Clean and mark three porcelain crucibles, mount at 45o angle and
ignite to constant weight.

Quantitative Analysis Lab Manual Prof. Monzir S. Abdel-Latif
66
2. Transfer exactly three 25 mL portions, of the sulfate unknown
provided, into three 400 mL beakers.
3. Add about 150 mL of distilled water to each sample followed by 5
mL of the HCl solution. Heat to near boiling.
4. Slowly add 25 mL of BaCl2 solution with continuous
stirring. Continue heating the covered solutions at about 80 oC for 1
hour.
5. Filter solutions; while hot, through fine porosity ashless filter paper
(Whatman 42) and wash the precipitate with three portions of 10 mL
hot distilled water. Check latest filtrate for Cl- by acidifying the filtrate
with 2 drops of HNO3 followed by 2 drops of AgNO3 . If a precipitate is
formed, use extra water to wash the precipitate till no precipitate is
observed after AgNO3 addition to filtrate portions.
6. Remove the filter papers, fold each one of them and place each in
one of the crucibles from step 1.
7. Heat on a flame to char the paper and then ignite the precipitate on a
hot flame till almost no carbon remains.
8. Transfer the crucibles to a muffle furnace at about 1000 oC and
ignite the precipitate for 30 min. Remove crucibles into a desiccator
and weigh after they attain room temperature. Bring to constant weight
by repeating this step.
9. Calculate the percentage sulfur in the sample as g S / 100 mL .
Report of Results
Wt of Empty
Crucible
Wt of
Crucible +
ppt
Wt
of BaSO4
Wt of S g S/ 100mL
X =
s =

Quantitative Analysis Lab Manual Prof. Monzir S. Abdel-Latif
67
Remarks and Observations

Quantitative Analysis Lab Manual Prof. Monzir S. Abdel-Latif
68
Experiment 8. Determination of Chloride by Precipitation as Silver
Chloride
Background
Silver forms precipitates with chloride, bromide, iodide and
thiocyanate. Silver chloride is a white precipitate with colloidal
characteristics when dispersed in water. The precipitation of chloride by
silver ions is quantitative and can be used for the determination of
chloride in a sample.
Reactions
Ag+ + Cl- Ag Cl (s)
Reagents and Chemicals
a. Provided
1. A chloride solution of unknown concentration.
2. 0.1 M AgNO3 solution.
3. Dilute nitric acid (4 mL conc HNO3 /L)
4. 1 : 1 Nitric acid solution.
b. Need Preparation
None
Procedure
1. Clean and mark three sintered glass Gooch crucibles and dry them
at 110 oC for 1 hour. Remove crucibles from the oven to a
desiccator, and weigh each of them. Repeat to constant weght.
2. Transfer three 25 mL aliquots of the chloride sample, each into a
separate 400 mL beaker.

Quantitative Analysis Lab Manual Prof. Monzir S. Abdel-Latif
69
3. Dilute each sample with 150 mL of distilled water and add 1 mL
of the 1 : 1 HNO3 solution.
4. To each sample slowly add 30 mL of AgNO3 solution with
continuous stirring, then heat to about 85 oC for 30 min.
5. Allow the precipitate to settle down and test for completeness of
precipitation by addition of few drops of AgNO3 to the supernate. If
a precipitate is formed, insufficient AgNO3 was added. Check with
your instructor for a suitable remedy.
6. Filter each sample through a separate Gooch and wash several
times with several portions of dilute HNO3 checking each time
for Ag+ till No precipitate is formed.
7. Dry each Gooch in an oven at 130 oC for 1 hour, desiccate and
weigh. Bring to constant weight as this is very important at this
point.
8. Calculate the weight of chloride per 100 mL of the sample
solution.
Report of Results
Wt of Empty
Goosh
Wt of Goosh
+ ppt
Wt of AgCl Wt of Cl g Cl/
100mL
X =
s =

Quantitative Analysis Lab Manual Prof. Monzir S. Abdel-Latif
70
Remarks and Observations
Quantitative Analysis Lab Manual Prof. Monzir S. Abdel-Latif
71
Chapter 5
OXIDATION-REDUCTION TITRATIONS
Oxidation - Reduction reactions (Redox rxns) involve the transfer of
electrons from one species of the reactants to another. This results in
an increase in oxidation number (O.N.) of a specific species and a
complementary decrease in oxidation number of another
species. Example:
Ce4+ + Fe2+ Ce3+ + Fe3+
The O.N. of cerium was decreased while that of iron was
increased. Cerium is reduced while iron is oxidized. A process that
involves an increase in O.N. is an oxidation process and vice
versa. Usually, a Redox reaction can be separated into two halves.
Ce4+ + e Ce3+ Reduction
Fe2+ Fe3+ + e Oxidation
Electrons appear in each half reaction while they do not show up in the
overall equations.
Identification of a Redox Reaction
It is a good practice to indicate the O.N. of each species in a chemical
reaction in order to check if it is a Redox reaction or not. If the O.N. of
any species changes, then it is a definite indication of a Redox
reaction. Example,
2 KMnO4 + 5 H2C2O4 + 6 HCl 2 MnCl2 + 2KCl + 10 CO2 + 8 H2O
Quantitative Analysis Lab Manual Prof. Monzir S. Abdel-Latif
72
It is observed that in the left-hand part of the equation, manganese has
an O.N. equals 7 and carbon has an O.N. equals 3. In the right-hand
part, the O.N. of manganese is 2 and that of carbon is 4 . Therefore,
permanganate is reduced while oxalic acid is oxidized. An example of a
non-Redox reaction can be written where no change in O.N. occurs,
Na2CO3 + 2 HCl 2 NaCl + CO2 + H2O
There is no change in O.N. of any species involved in the reaction, which
indicates that this is not a Redox reaction.
Balancing Redox Reactions
Balanced chemical equations are the basis of any reasonable
quantitative calculations. Therefore, it is very important to learn
balancing chemical equations, especially Redox equations that can be
manipulated through definite steps. For example, dichromate reacts
with iron yielding Fe3+ and Cr3+
Cr2O72- + Fe2+ Cr3+ + Fe3+
To balance this equation, the following steps should be followed.
1. Split the equation into two half reactions
Fe2+ Fe3+
Cr2 O72- Cr3+
2. Proceed with each half reaction separately starting with mass
balance. Let us start with first half reaction
Fe2+ Fe3+
One mole of Fe2+ yields one mole of Fe3+ which is balanced.
3. Balance the charges on both sides.
Fe2+ Fe3+

Quantitative Analysis Lab Manual Prof. Monzir S. Abdel-Latif
73
It is clear that an electron (e) should be added to the right side in order
for the charges to be equal
Fe2+ Fe3+ + e
This is a straightforward process but now consider the second half
reaction, which contains species that are not mass balanced
Cr2O72- Cr3+
1. Adjust the number of moles of chromium on both sides. This gives
Cr2O72- 2 Cr3+
2. For each oxygen atom place an H2O on the other side
Cr2O72- 2 Cr3+ + 7 H2O
3. Adjust the number of hydrogen atoms on both sides of the equation
by adding H+
14 H+ + Cr2O72- 2 Cr3+ + 7 H2O
4. The charges on both sides should be balanced at this point. This can
be done by addition of 6 electrons to the left side of the equation
6 e + 14 H+ + Cr2O72- 2Cr3+ + 7H2O
5. This is the case if the reaction is carried out in acidic solution. The
combination of the two half reactions necessitates the multiplication of
the half reaction involving the iron by a factor of 6 in order to cancel
the electrons involved
6 Fe2+ 6 Fe3+ + 6 e
6 e + 14 H+ + Cr2O72- 2 Cr3+ + 7 H2O
_________________________________________
6 Fe2+ + 14 H+ + Cr2O72- 6 Fe3+ + 2Cr3+ + 7 H2O

Quantitative Analysis Lab Manual Prof. Monzir S. Abdel-Latif
74
This is the balanced equation assuming acidic conditions.
In basic solutions, balancing Redox equations requires extra effort
where all previous steps are needed in addition to other steps.
Example:
C2O42- + MnO4
- Mn4+ + CO2
First, proceed as in case of acidic solution.
1. Split the equation into two half reactions
C2O42- CO2
MnO4- Mn4+
2. Balance the first half reaction by adjusting the number of atoms on
both sides (mass balance)
C2O42- 2 CO2
3. Adjust the charges on both sides (charge balance)
C2O42- 2 CO2 + 2 e
The first half reaction is completely balanced.
Now, turn to balance the second half reaction
MnO4- Mn4+
1. Mass balance shows 1 mole of Mn on both sides, therefore Mn is
adjusted.
2. Adjust the oxygens on both sides by placing an H2O for each oxygen
present.
MnO4- Mn4+ + 4 H2O
3. Adjust the number of hydrogen atoms on both sides by additon of H+

Quantitative Analysis Lab Manual Prof. Monzir S. Abdel-Latif
75
8 H+ + MnO4- Mn4+ + 4 H2O
4. Adjusting the charges on both sides gives
3 e + 8 H+ + MnO4- Mn4+ + 4 H2O
Now, watch carefully.
5. Add an OH- on both sides for each H+ present
8 OH- + 3 e + 8 H+ + MnO4- Mn4+ + 4 H2O + 8 OH-
6. Combine the OH- and H+ to form H2O
3 e + 8 H2O + MnO4- Mn4+ + 4 H2O + 8 OH-
7. Adjust the number of H2O molecules on both sides
3 e + 8 H2O + MnO4- Mn4+ + 8 OH-
8. Combine the two half reactions
3 (C2 O42- 2 CO2 + 2 e)
2 ( 3 e + 8 H2O + MnO4- Mn4+ + 8 OH-)
_______________________________________
3 C2O42- + 8 H2O + 2 MnO4
- 6 CO2 + 2 Mn4+ + 16 OH-
The first half reaction was multiplied by 3 and the second was
multiplied by 2 in order to cancel the electrons on both sides.
The previous steps will become straightforward with some training
and should be followed in the same order as described.
The most important Redox reactions that will be encountered in this
text are the dichromate and permanganate reactions. Permanganate ion
is a good oxidizing agent and a self-indicator as well. The dark violet
color of the permanganate ion turns colorless when completely
Quantitative Analysis Lab Manual Prof. Monzir S. Abdel-Latif
76
reduced. This gives a very sharp end point if the reaction is carried out
under recommended conditions. In case of dichromate, a Redox
indicator (like diphenylamine) should be used. This gives a distinct color
when the very first excess of dichromate ion is added. However,
dichromate has a major advantage besides being a very effective
oxidant, where it can be obtained in an extra pure state and a primary
standard dichromate solution is easily prepared.
Preparation of Permanganate Solutions
Usually, a stock permanganate solution is prepared first by weighing a
precalculated amount of the material which is dissolved in an
appropriate volume of distilled water. The solution is then heated to
boiling for about an hour and then filtered through a sintered-glass
Goosh of small porosity. The solution is kept away from light in dark
brown glass bottles.
Standardization of Permanganate Solutions
Two very important methods are routinely used. The first utilizes a
primary standard sodium oxalate in sulfuric acid solution at
temperatures exceeding 70 oC. The equilibrium that takes place can be
represented by the equation:
2 MnO4- + 5 C2O4
2- + 16 H+ 2 Mn2+ + 10 CO2 + 8 H2O
You should be able to derive the two half reactions and find out the
reason for the stoichiometry involved.
The second method involves the use of primary standard
arsenic(III)oxide. The compound is soluble in alkali yielding the
arsenate:
As2O3 + 4 OH - 2 HAsO3
2- + H2O
The arsenate then reduces the permanganate in acidic solution (as
above) yielding AsO43- and Mn2+ . Usually, potassium iodide or iodate is

Quantitative Analysis Lab Manual Prof. Monzir S. Abdel-Latif
77
used as a catalyst that accelerates the reaction, which proceeds at room
temperature.
As O33- As O4
3-
5 (H2O + AsO33- AsO4
3- + 2 H+ + 2 e)
2(MnO4- + 8 H+ + 5 e Mn2+ + 4 H2O)
_________________________________________
5 AsO33- + 2 MnO4
- + 6 H+ 5 AsO43- + 2 Mn2+ + 3 H2O
This is the net Redox equation, which describes the reaction.
Calculations Involving Redox Systems
Historically, equivalents were the primary tools used in Redox
calculations. The equivalent weight of a substance involved in Redox
reactions can be defined as
���������� ����ℎ� = ��
��.�� � ��� ����
Equivalents were used for the definition of a concentration term
called normality, N, where:
��������� = ��.�� ��
�
These concepts are detailed in the theoretical part of the course.
However, the use of these terms has greatly diminished in recent
literature and trends for using molarity rather than normality is widely
accepted. Molarity will be the only unit to be used in our calculations.
Example: Permanganate reacts with hydrogen peroxide according to
the equation:
2 MnO4- + 5 H2O2 + 6 H+ 2 Mn2+ + 5 O2 + 8 H2O
Example: Calculate the molarity of H2O2 if 25 mL of H2O2 required 12.0
mL of 0.1 M KMnO4 .

Quantitative Analysis Lab Manual Prof. Monzir S. Abdel-Latif
78
���� ���� =5
2���� �����
� (����)∗ ��� (����)=5
2∗ � (�����)∗ ���(�����)
� (����)∗ 25 =5
2∗ 0.1 ∗ 12.0
� (����)= 0.12 �
Example: In the previous example, how many mL of 0.1M KMnO4 are
required to react with 30 mL of 0.05 M H2O2?
���� ���� =5
2���� �����
� (�����)∗ ���(�����)=2
5∗ � (����)∗ ��� (����)
0.1 ∗ ���(�����)=2
5∗ 0.05 ∗ 30
���(�����)= 6 ��
In case of other units being given in any problem, change to molarity
units and perform your calculations using molarity.
Redox Reactions Involving Iodine
Iodine is an oxidizing agent and can be used in conjunction with
reducing agents to determine either of them. Two methods are
available that involve iodine. The first is a direct method in which
standard iodine is used for the oxidation of a reducing agent (analyte),
this method is called iodimetry. The second method is an indirect
method, which involves the determination of liberated iodine (from
oxidation of I-) in a Redox reaction and is called iodometry.
Quantitative Analysis Lab Manual Prof. Monzir S. Abdel-Latif
79
Iodine is very slightly soluble in water but is readily soluble in water
containing iodide ion due to the following equilibrium:
I2 + I- I3-
The triiodide is the oxidizing agent involved in iodometric and iodimetric
titrations. It is a mild oxidizing agent that can be efficiently used in
Redox titrations, provided enough precautions are considered.
Two points that would be remembered are the volatility of iodine
where some iodine is usually lost on standing and exposure to
atmosphere. The second point is that the medium in which iodine is
prepared should not be very acidic since some iodide is converted to
iodine under very acidic conditions:
4 I- + O2 + 4 H+ 2 I2 + 2 H2O
This results in a change in the concentration of iodine which
necessitates the use of glass stoppered flasks and performing the
analysis as shortly as possible. Some metal ions, like Cu2+, nitrite as well
as direct sun light catalyze the conversion of I- into I2 . Therefore, dark
brown glass bottles are preferred for storage of solutions containing I- .
Reducing Agents Used in Titrations Involving Iodine
Sodium thiosulfate is the most widely used reducing agent and is
historically associated with titrations involving iodine. The reaction
between iodine and thiosulfate can be represented by the equation:
I2 + 2 S2O32- 2 I- + S4O6
2-
This is the easier way to describe the reaction but what actully takes
place is the following equilibrium:
I3- + 2 S2O3
2- 3 I- + S4O62-
since I2 is present as the triiodide in aqueous solutions containing iodide.
Quantitative Analysis Lab Manual Prof. Monzir S. Abdel-Latif
80
Sodium thiosulfate cannot be used as a primary standard due to the
ambiguity of its content of water of hydration, and thus should be
standardized against an oxidizer. In case of iodate oxidizer:
IO3- + 5 I- + 6 H+ 3 I2 + 3 H2O
It is obvious from this equation that the reaction should be conducted in
acidic solution and in presence of excess iodide. However, great care
should be observed in weighing the iodate in order to obtain good
results.
Another method for thiosulfate standardization uses potassium
dichromate, also in acidic solution, and in presence of excess iodide
according to the equation:
Cr2O72- + 6 I- + 14 H+ 2 Cr3+ + 3 I2 + 7 H2O
Again, the liberated iodine oxidizes the thiosulfate. The reaction takes
place in acidic solution and in presence of excess I-.
If thiosulfate solutions are to be stored for prolonged periods, it should
be emphasized that carbon dioxide present in water will result in the
decomposition of thiosulfate giving elemental sulfur as the result. This
behavior can also be observed when some bacteria is present in
solution:
S2O32- + H+ HSO3
- + S
The elemental sulfur can easily be observed as the solution turns
yellowish. Therefore, solutions of thiosulfate should be prepared from
recently boiled and recooled distilled water with the addition of 3-5
drops of chloroform or about 10 mg /L of HgCl2 which improves the
storage capacity of thiosulfate.

Quantitative Analysis Lab Manual Prof. Monzir S. Abdel-Latif
81
It is also a good practice to store thiosulfate solutions in dark brown
bottles with the addition of about 0.1 g/L of sodium carbonate to
decrease the bacterial activity.
Indicators Involved in Iodine Methods
The most widely accepted indicator in iodine titrations is starch. Starch
forms a complex with iodine leading to a deep blue color. This complex
is insoluble in water, which necessitates the addition of starch just
before the end point which can be determined when the yellow color of
iodine fades significantly. Ethanol and strong acid conditions should be
avoided when starch is used as indicator. This is because ethanol
diminishes the color of the complex while strong acidic solutions will
hydrolyze the starch. It is advised that the starch should be freshly
prepared for sensitive appearance of the blue color.
A starch derivative, sodium starch glycolate, is soluble in hot water
and can be prepared in 1% solutions by gradually adding 1g of the
starch glycolate to 100 mL of water and boiling for few minutes. About
0.1 - 0.2 mL of this solution is sufficient as an indicator.
Calculations Involved in Iodine Methods
It is very important to relate all species to each other by correct
stoichiometric relationships for successful calculations. For example;
Calculate the molarity of thiosulfate solution if 0.200
g of KIO3 required 50.0 mL of the thiosulfate solution. Provided that
excess KI and HCl were added.
IO3- + 5 I- + 6 H+ 3 I2 + 3 H2O
IO3- 3 I2
I2 + 2 S2O32- 2 I- + S4O6
2-
I2 2 S2O32-
IO3- 6 S2O3
2-
Final Equation:
IO3- + 6 H+ + 6 S2O3
2- 3S4O62-+ 3 H2O + I-
Quantitative Analysis Lab Manual Prof. Monzir S. Abdel-Latif
82
���� ������ = 6 ∗ ���� ���
�
� (������)∗ ���(����
��)= 6 ∗�� ���
�
�� ����
� (������)= 6 ∗
200
214 ∗ 50= 0.112 �
Therefore, always find the relationships involved and follow each till you
obtain a direct relation between titrant and the material being
titrated. Then, straightforward calculations are performed.

Quantitative Analysis Lab Manual Prof. Monzir S. Abdel-Latif
83
Applications
Experiment 9. Standardization of Potassium Permanganate Using
Sodium Oxalate
Background
Potassium permanganate stock solution can be standardized against
primary standard sodium oxalate. The reaction takes place in acidic
medium at about 80 oC . As mentioned in the text, permanganate is
reduced to Mn2+ while oxalate is oxidized to CO2 . It should be clear
that this takes place in acid solution and temperature should not be
allowed to drop below 60 oC through the whole titration.
Reactions
2 MnO4- + 5 C2O4
2- + 16 H+ 2 Mn2+ + 10 CO2 + 8 H2O
Reagents and Chemicals
a. Provided
1. Stock KMnO4 solution (about 0.02 M).
2. H2SO4 solution, 3 M.
3. Predried and desiccated sodium oxalate.
b. Need Preparation
250 mL of 0.05 M sodium oxalate solution. Prepare by dissolving an
appropriate weight of the oxalate in 250 mL of distilled water.
Procedure
1. Transfer exactly 10 mL of NaC2O4 into a 250 mL conical flask (keep the
rest of the oxalate for next experiment).

Quantitative Analysis Lab Manual Prof. Monzir S. Abdel-Latif
84
2. Add 25 mL of the 3 M H2SO4 and heat the solution to about 80 oC
(below boiling).
3. Titrate against KMnO4 solution until the very first appearance of pink
color which persists for at least 30 seconds.
4. Repeat steps 1-3 twice and always record the volume of
KMnO4 consumed to two significant figures after the decimal point.
5. Calculate the molarity of KMnO4 stock solution according to the
reaction given above.
Report of Results
Wt of Na2C2O4 =
Molarity of Na2C2O4 =
Vol of C2O42 Vol of KMnO4 Molarity of KMnO4
X =
s =
Calculations
Assume that 25.00 mL of 0.050 M Na2C2O4 required 30.00 mL of
KMnO4 for complete reaction. Calculate the molarity of KMnO4:
���� ����� =
2
5 ���� �������
������ ∗ �����
� =2
5∗ �������� ∗ ��������
������ ∗ 30.00 =
2
5∗ 0.050 ∗ 25.00
������ = 0.017 mol L�

Quantitative Analysis Lab Manual Prof. Monzir S. Abdel-Latif
85
Remarks and Observations

Quantitative Analysis Lab Manual Prof. Monzir S. Abdel-Latif
86
Experiment 10. Determination of Hydrogen Peroxide by Titration
with Potassium Permanganate
Background
Hydrogen peroxide can act as either an oxidizing agent or a reducing
agent. From the analytical point of view, it is a very important species
because many enzymatic reactions yield hydrogen peroxide and a
method for quantitation of this compound is of special
value. Depending on the volume of oxygen released by 1 mL of
hydrogen peroxide, the solution of the compound is usually denoted as
3, 6, 12, or 30 percent.
Reactions
2 MnO4- + 5 H2O2 + 6 H+ 2 Mn2+ + 5 O2 + 8 H2O
Reagents and Chemicals
a. Provided
1. Stock KMnO4 solution.
2. H2S04 solution, 1 M.
3. H2O2 solution of unknown concentration.
b. Need Preparation
1. Standard oxalate solution (about 0.05 M), You should have enough
from previous experiment .
Procedure
1. Follow steps in experiment 9 to standardize the KMnO4 stock
solution.
2. Transfer exactly 10.00 mL of the H2O2 unknown sample into a 250 mL
conical flask followed by 50 mL of distilled water.
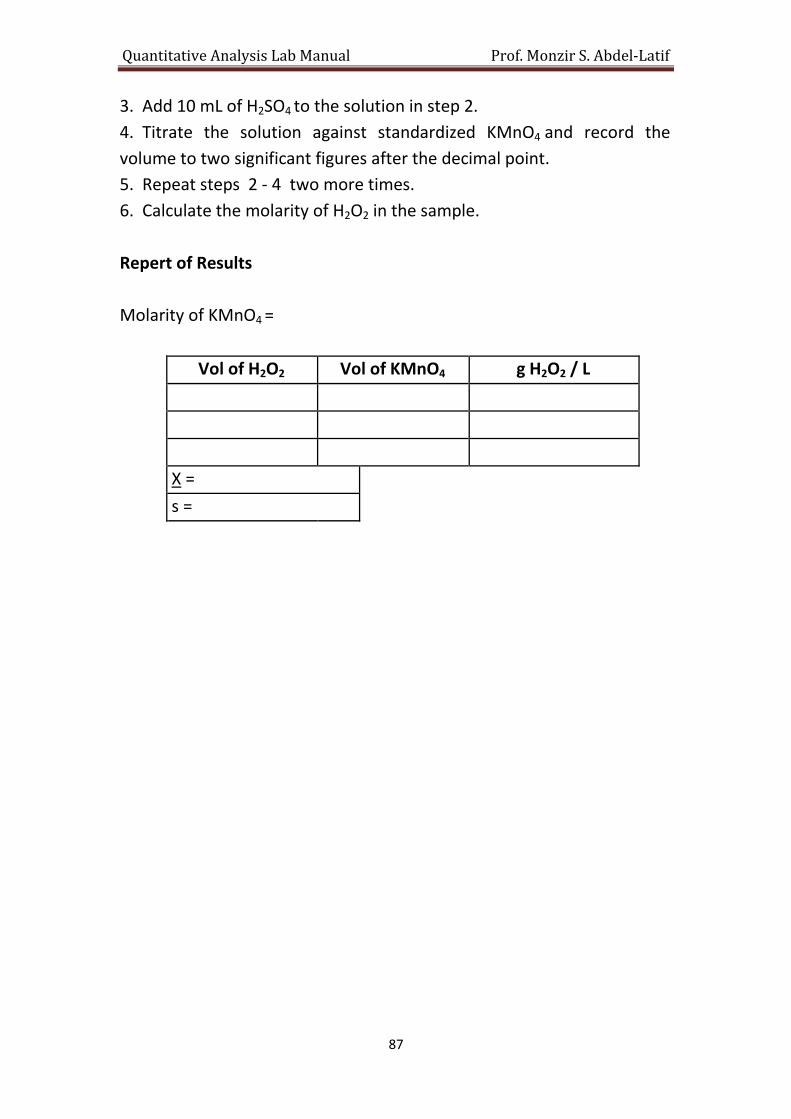
Quantitative Analysis Lab Manual Prof. Monzir S. Abdel-Latif
87
3. Add 10 mL of H2SO4 to the solution in step 2.
4. Titrate the solution against standardized KMnO4 and record the
volume to two significant figures after the decimal point.
5. Repeat steps 2 - 4 two more times.
6. Calculate the molarity of H2O2 in the sample.
Repert of Results
Molarity of KMnO4 =
Vol of H2O2 Vol of KMnO4 g H2O2 / L
X =
s =

Quantitative Analysis Lab Manual Prof. Monzir S. Abdel-Latif
88
Remarks and Observations

Quantitative Analysis Lab Manual Prof. Monzir S. Abdel-Latif
89
Experiment 11. Determination of Iron by Redox Titrations
Background
Iron (II) is oxidized by potassium dichromate to iron (III) after full
reduction of iron present.
The method is good for the determination of iron in ores or in
different types of salts. Usually, the sample is treated with a reducing
agent like Sn2+ and excess Sn2+ is oxidized by addition of HgCl2. The result
of the reaction is a white precipitate of Hg2Cl2. Excess HgCl2 does not
affect the reaction of iron (II) with dichromate. If a too large amount of
Sn2+ is added, heavy precipitate with some blackish particles (of Hg
metal) appear, in such a case, the sample should be discarded.
Reactions
Pretreatment Steps
2 Fe3+ + Sn2+ 2 Fe2+ + Sn4+
Sn2+ + 2 Hg2+ Hg22+ + Sn4+
Redox Reaction
6 Fe2+ + 14 H+ + Cr2O72- 6 Fe3+ + 2Cr3+ + 7 H2O
Reagents and Chemicals
a. Provided
1. Predried and desiccated iron sample.
2. Predried and desiccated K2Cr2O7 .
3. 0.1 M SnCl2 in 4 M HCl .
4. 0.1 M HgCl2 .
5. 1 : 1 HCl solution.

Quantitative Analysis Lab Manual Prof. Monzir S. Abdel-Latif
90
6. 1 : 1 H2SO4 solution.
7. 1 : 1 H3PO4 solution.
8. Sodium diphenylamine sulfonate indicator solution.
b. Need Preparation
1. Standard K2Cr2O7 solution. Weigh accurately about 1.25 g of
K2Cr2O7 that was dried and desiccated. Dissolve in about 100 mL of
distilled water and transfer to a 250 mL measuring flask and adjust the
volume to the mark using distilled water.
Procedure
1. Weigh out accurately three samples of the iron unknown. Check
with your instructor on the range allowed. The following steps
should be applied to each sample separately.
2. Add 10 mL of the HCl solution provided and heat the solution
gently. The solution should appear yellowish.
3. Add SnCl2 drop wise to the hot solution till the yellowish color
disappears. You should be very careful in this step and confine
excess SnCl2 to 1 or 2 drops only, otherwise you will discard the
solution later.
4. If the yellowish color reappears while heating carefully add some
more SnCl2 till the color disappears.
5. Stop heating at this point and wait till the solution cools down to
room temperature then add about 50 mL of distilled water followed
by 20 mL of HgCl2, a white precipitate should appear.
6. If no precipitate appears, insufficient SnCl2 was added and if a grey
precipitate is formed too much of SnCl2 was added. In both cases
you have to discard the sample and start over.
7. If a white precipitate is formed, add 150 mL of distilled water, 4 mL
of H2SO4, 12 mL of H3PO4 and 8-10 drops of the indicator.
8. Titrate against standard K2Cr2O7 and report the results as % Fe in
the sample.

Quantitative Analysis Lab Manual Prof. Monzir S. Abdel-Latif
91
Report of Results
Wt of Iron Sample Vol of K2Cr2O7 % Iron
X =
s =
Calculations
Molarity of K2Cr2O7, assuming that 1.25 g of K2Cr2O7 were dissolved
in a total volume of 250 mL: ��
��= � ∗ ���
1.25 ∗ 10�
294.18= � ∗ 250
M = 0.017 mol/L
% Fe can be calculated as follows:
Assume that 20 mL of K2Cr2O7 were needed for the oxidation of the
iron present:
���� ���� = 6 ∗ ���� �������
�� ����
�� ���� = 6 ∗ ������
�� ∗ ��������
�� ����
55.8 = 6 ∗ 0.017 ∗ 20.00
�� ���� = 114
% (����)= 114
����ℎ� �� ������ (��)∗ 100

Quantitative Analysis Lab Manual Prof. Monzir S. Abdel-Latif
92
Remarks and Observations

Quantitative Analysis Lab Manual Prof. Monzir S. Abdel-Latif
93
Experiment 12. Iodometric Titration of a Hypochlorite Sample
Background
Hypochlorite anions are good oxidizing agents that can oxidize I- into
I2 . The produced iodine can be titrated with standard solution of
thiosulfate which can be related to hypochlorite concentration. Since
the thiosulfate is not a primary standard, it is standardized against
KIO3 primary standard.
Reactions
Standardization Step
IO3- + 5 I- + 6 H+ 3 I2 + 3 H2O
I2 + 2 S2O32- 2 I- + S4O6
2-
Titration Step
ClO- + 2 I- + 2 H+ I2 + Cl- + H2O
The resulting iodine is titrated with standardized thiosulfate.
Reagents and Chemicals
a. Provided
1. Predried and desiccated KIO3 .
2. Predried and desiccated hypochlorite sample. Alternatively, the
solution of hypochlorite can be provided. Hypochlorite solutions can
cause severe irritation and burns when concentrated!!!
3. Predried and desiccated Na2S2O3.
4. 1 : 4 H2SO4 .
5. Chloroform.
6. Starch indicator.

Quantitative Analysis Lab Manual Prof. Monzir S. Abdel-Latif
94
7. Solid KI.
b. Need Preparation
1. 0.1 M Na2S2O3 solution. Weigh an appropriate amount that can
yield 500 mL solution, add 3 drops of chloroform.
2. 0.01 M KIO3 solution. Weigh accurately appropriate amount
necessary for preparation of 250 mL of the compound in distilled
water.
Procedure
a. Standardization of the thiosulfate solution
1. Transfer 10 mL of the KIO3 solution into a conical flask, add
about 2 g of KI, dissolve well and add 2 mL of the H2SO4 solution.
2. Rapidly titrate against the Na2S2O3 solution till the color of the
iodine becomes very faint.
3. Add 1 mL of starch indicator and continue titration till the blue
color of the indicator just disappears.
4. Calculate the molarity of the Na2S2O3 solution.
b. Determination of the ClO-
1. Weigh out an appropriate amount (check with your instructor)
or transfer exactly 10 mL of the ClO- solution.
2. Add about 2 g of KI, dissolve well and add about 2 mL of the
H2SO4 solution provided.
3. Rapidly titrate against the standardized Na2S2O3 solution till the
color of the I2 becomes very faint (pale yellow).
4. Add 1 mL of starch indicator and continue titration till the first
disappearance of the blue color.
5. Report your results as % ClO- (g ClO-/ 100mL).
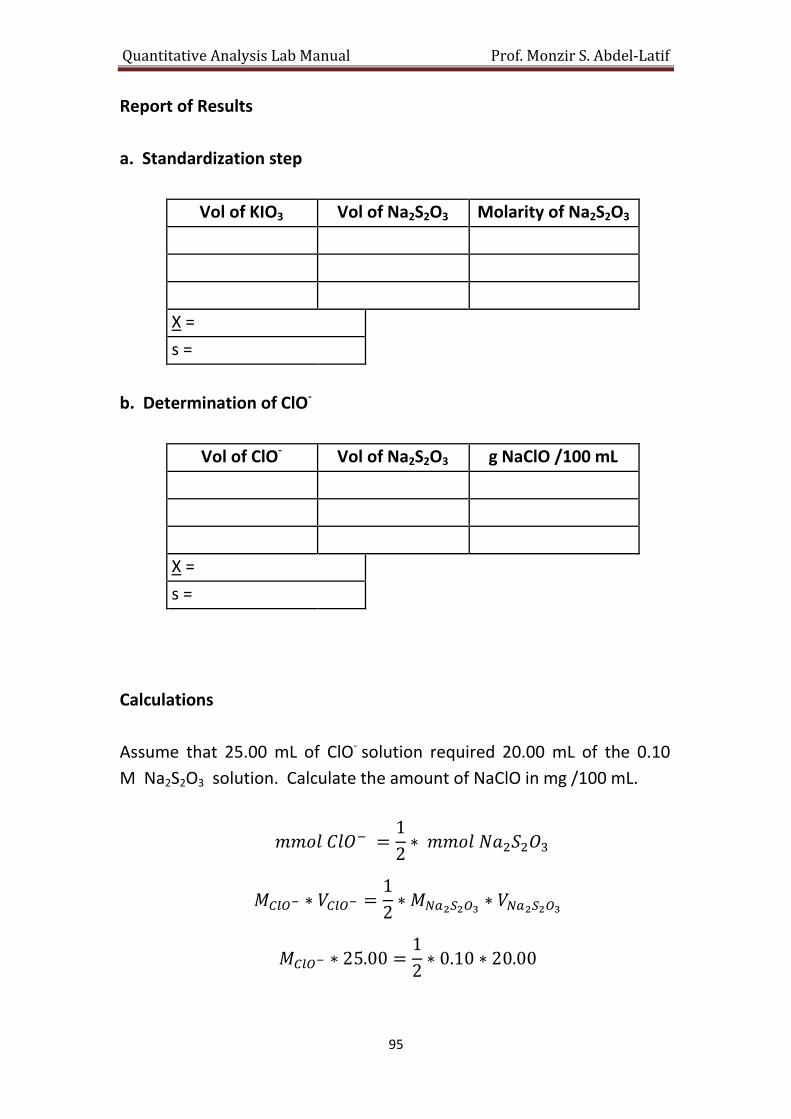
Quantitative Analysis Lab Manual Prof. Monzir S. Abdel-Latif
95
Report of Results
a. Standardization step
Vol of KIO3 Vol of Na2S2O3 Molarity of Na2S2O3
X =
s =
b. Determination of ClO-
Vol of ClO- Vol of Na2S2O3 g NaClO /100 mL
X =
s =
Calculations
Assume that 25.00 mL of ClO- solution required 20.00 mL of the 0.10
M Na2S2O3 solution. Calculate the amount of NaClO in mg /100 mL.
���� ���� =1
2∗ ���� �������
����� ∗ ����� =1
2∗ �������� ∗ ��������
����� ∗ 25.00 =1
2∗ 0.10 ∗ 20.00
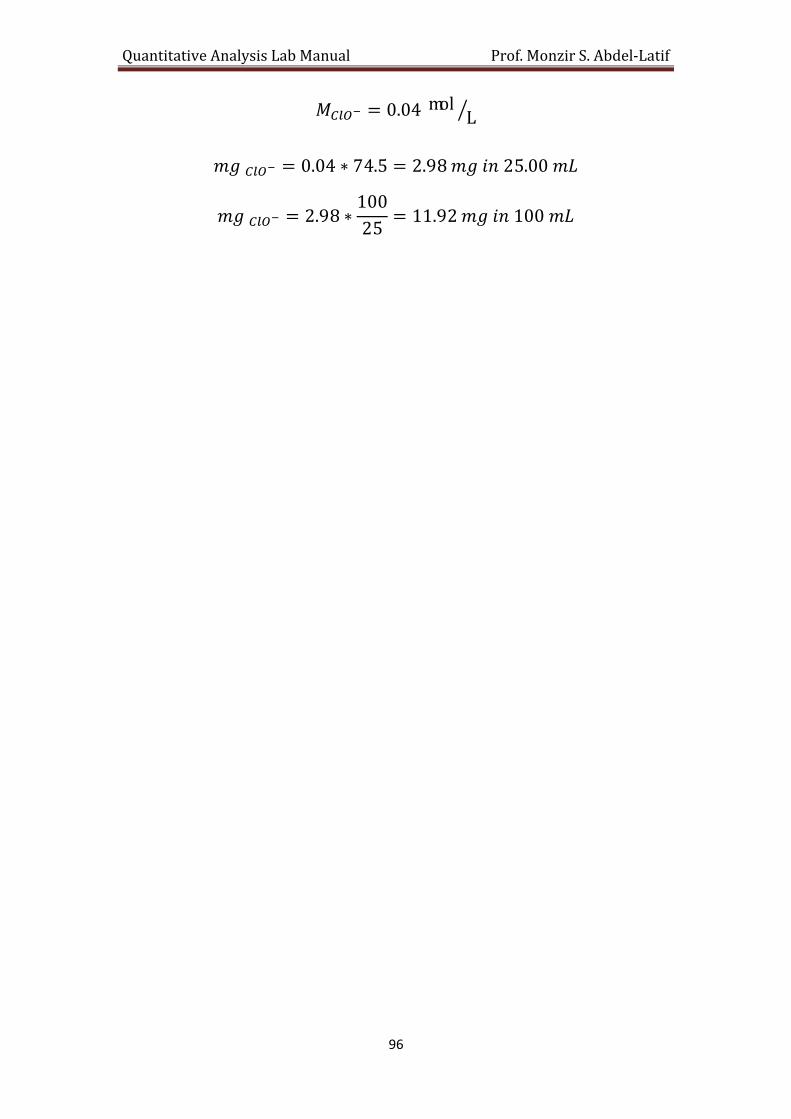
Quantitative Analysis Lab Manual Prof. Monzir S. Abdel-Latif
96
����� = 0.04 mol L�
�� ���� = 0.04 ∗ 74.5 = 2.98 �� �� 25.00 ��
�� ���� = 2.98 ∗100
25= 11.92 �� �� 100 ��

Quantitative Analysis Lab Manual Prof. Monzir S. Abdel-Latif
97
Remarks and Observations
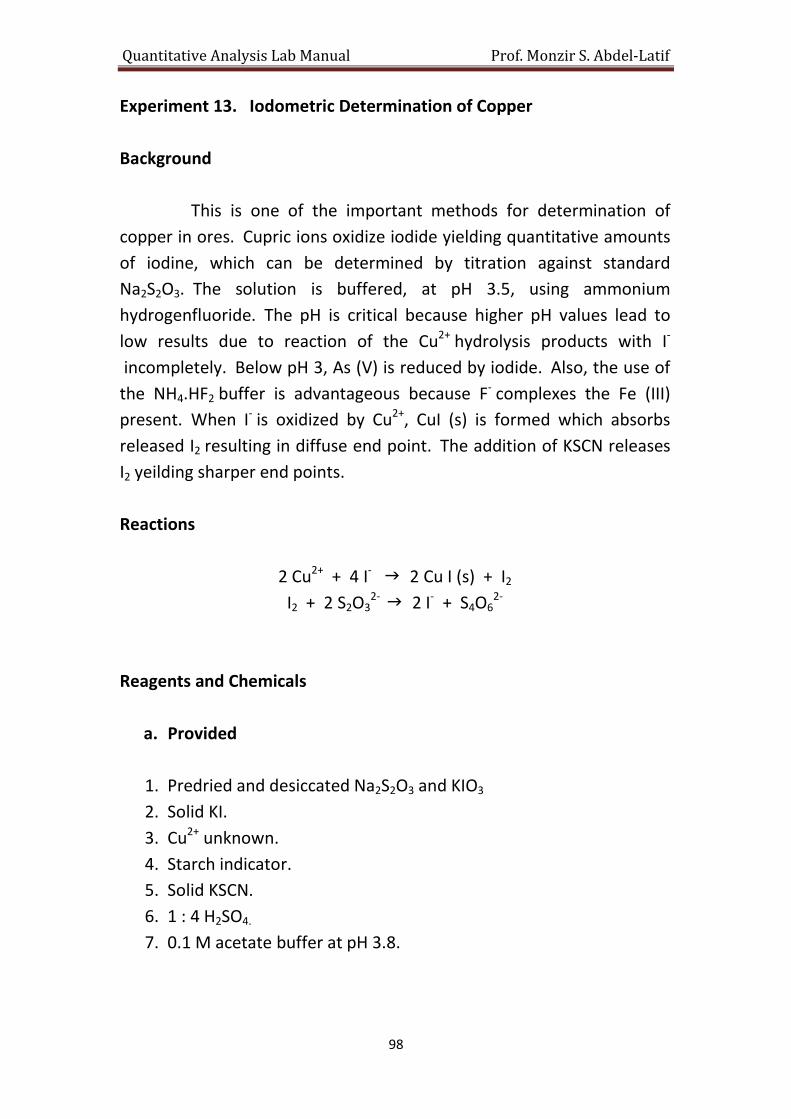
Quantitative Analysis Lab Manual Prof. Monzir S. Abdel-Latif
98
Experiment 13. Iodometric Determination of Copper
Background
This is one of the important methods for determination of
copper in ores. Cupric ions oxidize iodide yielding quantitative amounts
of iodine, which can be determined by titration against standard
Na2S2O3. The solution is buffered, at pH 3.5, using ammonium
hydrogenfluoride. The pH is critical because higher pH values lead to
low results due to reaction of the Cu2+ hydrolysis products with I-
incompletely. Below pH 3, As (V) is reduced by iodide. Also, the use of
the NH4.HF2 buffer is advantageous because F- complexes the Fe (III)
present. When I- is oxidized by Cu2+, CuI (s) is formed which absorbs
released I2 resulting in diffuse end point. The addition of KSCN releases
I2 yeilding sharper end points.
Reactions
2 Cu2+ + 4 I- 2 Cu I (s) + I2
I2 + 2 S2O32- 2 I- + S4O6
2-
Reagents and Chemicals
a. Provided
1. Predried and desiccated Na2S2O3 and KIO3
2. Solid KI.
3. Cu2+ unknown.
4. Starch indicator.
5. Solid KSCN.
6. 1 : 4 H2SO4.
7. 0.1 M acetate buffer at pH 3.8.
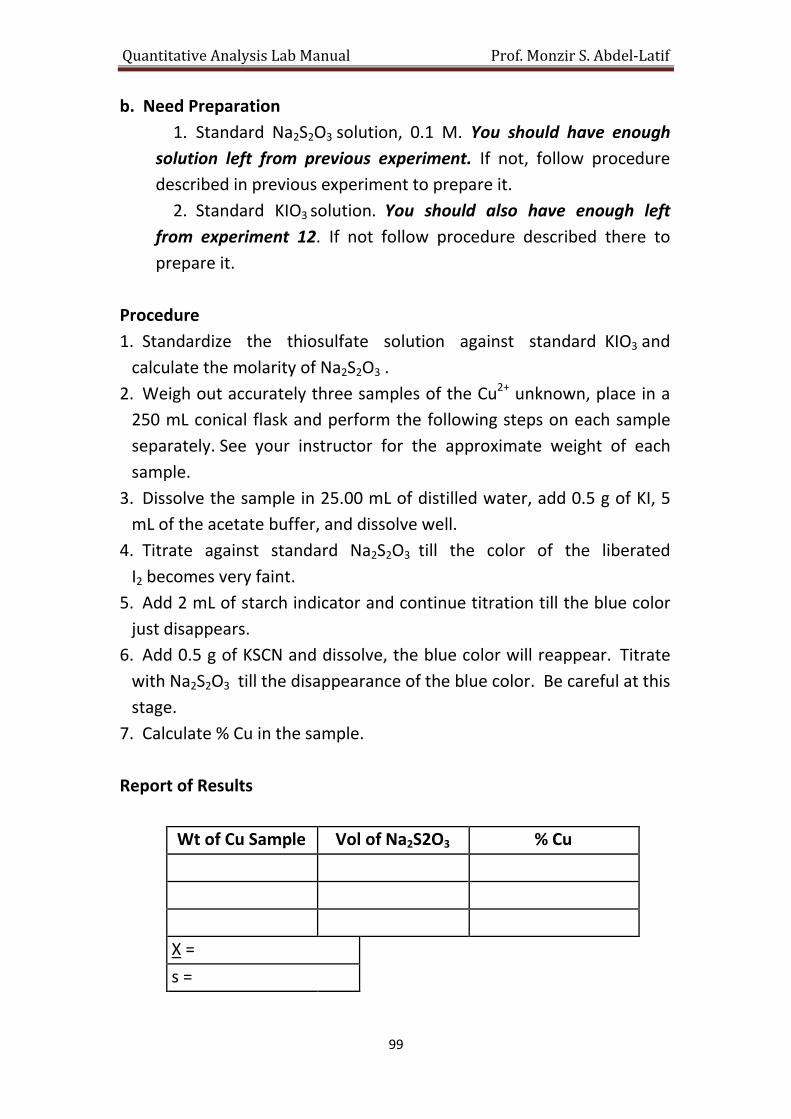
Quantitative Analysis Lab Manual Prof. Monzir S. Abdel-Latif
99
b. Need Preparation
1. Standard Na2S2O3 solution, 0.1 M. You should have enough
solution left from previous experiment. If not, follow procedure
described in previous experiment to prepare it.
2. Standard KIO3 solution. You should also have enough left
from experiment 12. If not follow procedure described there to
prepare it.
Procedure
1. Standardize the thiosulfate solution against standard KIO3 and
calculate the molarity of Na2S2O3 .
2. Weigh out accurately three samples of the Cu2+ unknown, place in a
250 mL conical flask and perform the following steps on each sample
separately. See your instructor for the approximate weight of each
sample.
3. Dissolve the sample in 25.00 mL of distilled water, add 0.5 g of KI, 5
mL of the acetate buffer, and dissolve well.
4. Titrate against standard Na2S2O3 till the color of the liberated
I2 becomes very faint.
5. Add 2 mL of starch indicator and continue titration till the blue color
just disappears.
6. Add 0.5 g of KSCN and dissolve, the blue color will reappear. Titrate
with Na2S2O3 till the disappearance of the blue color. Be careful at this
stage.
7. Calculate % Cu in the sample.
Report of Results
Wt of Cu Sample Vol of Na2S2O3 % Cu
X =
s =

Quantitative Analysis Lab Manual Prof. Monzir S. Abdel-Latif
100
Remarks and Observations

Quantitative Analysis Lab Manual Prof. Monzir S. Abdel-Latif
101
Chapter 6
EDTA TITRATIONS
Complexometric titrations have many applications, especially for
determination of metal ions. Ethylenediaminetetraacetic acid disodium
salt (EDTA) is the most widely used complexing agent for routine analysis
of water hardness and other applications. EDTA is a polydentate ligand
that is represented by the formula H4Y . Usually, EDTA titrations are
conducted in alkaline conditions under which EDTA will be present in
different forms including H4Y, H3Y-, H2Y2-, HY3-, and Y4- . Therefore,
controlling the pH is one major factor that affects complexation.
The total concentration of EDTA will be the sum of all equilibrium
species
CT = [H4Y] + [H3Y-] + [H2Y2-] + [HY3-] + [Y4-]
The fraction of any species can be found if desired where:
o = [H4Y]/CT
1 = [H3Y-]/CT
2 = [H2Y2-]/CT
3 = [HY3-]/CT
4 = [Y4-]/CT
Now, assume a divalent metal reacting with EDTA, Y4-, the following
equilibrium will be observed in alkaline medium, using Ca2+ as an
example:
Ca2+ + Y4- CaY2-
�� =[�����]
[����][���]

Quantitative Analysis Lab Manual Prof. Monzir S. Abdel-Latif
102
�� =[���]
��
[���]= �� ∗ ��
Y4- concentration is dependent on pH and , therefore, should be
calculated as follows:
�� =������������
[��]� + ���[��]�+ ������[�
�]�+ ���������[��]+ ������������
Titrimetric methods based on EDTA are simple and provide excellent
results. Usually, EDTA is the titrant except in case of a back titration. The
sample containing the metal ion to be determined is placed in a flask
together with a suitable indicator. The relationship
mmol (EDTA) = mmol (metal ion)
can be used for calculation of the metal ion concentration.
It is a common practice to express the concentration of the metal ion in
ppm units where:
��� = � ∗ �� ∗ 1000
The number of mgs of the metal ion present in 1 L of the solution gives
the ppm value.
Indicators for EDTA Titrations
Metal ion indicators form complexes with the metal ions
Mn+ + Inn- M-In
When EDTA is added, the weak M-In complex is destroyed and the free
In is released giving color at the end point.
Quantitative Analysis Lab Manual Prof. Monzir S. Abdel-Latif
103
Among the very important indicators that are routinely used, you will
encounter two indicators namely Muroxide and Eriochrome Black T
(Solochrome Black). However, there are many other indicators some of
them are very important because of their high selectivity towards
specific metal ions.
Preparation of an EDTA Standard Solution
Primary standards of EDTA cannot be prepared. EDTA solutions should
be standardized against CaCO3 or MgCl2 of very high purity. Water used
in EDTA solution preparations should be free from polyvalent metal ions
and preferrably distilled through all Pyrex glass. Calmagite is a suitable
indicator. The titration is conducted at a buffered solution at about pH
1O.
Sharpness of the End Point
The end point is affected by two major factors (beside the value of the
pH), the stability constant of the metal ion-EDTA complex and the
concentrations of the metal ion and EDTA. As the value of both factors
is increased, sharper end points are achieved. If either of the two
factors has a low value, end points of less sharpness result. For very low
stability constants diffuse end points are observed and large errors
should be expected.
Masking and Demasking Agents
Some metal ions that interfere in EDTA titrations can be masked by
addition of a suitable masking agent. The titration is performed, then if
desired, a demasking agent can be added to free the previously masked
metal ions so that they can be determined.
Usually, cadmium and zinc ions can be masked by the addition of
cyanide. If desired, Cd and Zn ions can be demasked by addition of
chloral hydrate or a 3:1 formaldehyde : acetic acid solution.

Quantitative Analysis Lab Manual Prof. Monzir S. Abdel-Latif
104
Back Titration Using EDTA
This is very important because, in some cases, there may not be a
suitable indicator or the MY2- complex is very weak. An excess of
standard EDTA is added and the extra EDTA is back titrated with
standard Mg2+ using a suitable indicator like Arsenazo I.
Calculations Involved in EDTA Titrations
As mentioned previously, this type of calculation is very simple. For
example:
In an experiment for the determination of Ca2+ in tap water, it was
observed that 75.0 mL of tap water required 15.0 mL of 0.05 M EDTA
solution. Calculate the concentration of Ca2+ expressed as ppm CaCO3 .
���� ���� = ���� ����
�������� ∗ ������ (��) �� ����
= �������� ∗ ������ (��) �� ����
�������� �� ���� =�������� ∗ ������ (��) ������
������ (��) �� �����
�������� �� ���� =15.0 ∗ 0.05
75.0= 0.01
���� ���� = ���� �����
��� = � ∗ �� ∗ 1000
��� ����� = 0.01 ∗ 100 ∗ 1000 = 1000
This is because Ca2+ forms a 1:1 complex with EDTA. In fact, EDTA forms
a 1:1 complex with all known divalent metal ions unless otherwise
indicated.
Quantitative Analysis Lab Manual Prof. Monzir S. Abdel-Latif
105
Applications
Experiment 14. Complexometric Determination of Total Hardness of
Water
Background
Water hardness is attributed to the presence of Ca2+ and Mg2+ and
usually their total concentration is a measure of water hardness. EDTA
forms complexes with both ions and the end point can be detected using
Eriochrome Black T or calmagite indicator. Results are reported as ppm
CaCO3.
Reactions
Ca2+ + H2Y2- CaY2- + 2 H+
Mg2+ + H2Y2- MgY2- + 2 H+
The titration is conducted at about pH 10, which can be achieved by
addition of ammonium buffer to the titration flask.
Reagents and Chemicals
a. Provided
1. Approximately 0.01 M EDTA solution containing about 0.1 % NaOH
and 0.01% MgCl2. 6H2O.
2. Eriochrome Black T indicator that is 0.5% (W/V) in ethanol.
3. Ammonium buffer at pH 10.
4. Primary standard CaCO3 (solid, Predried and desiccated).
5. 1 : 1 HCl solution.
b. Need Preparation
1. Standard Ca2+ solution, 0.01 M.

Quantitative Analysis Lab Manual Prof. Monzir S. Abdel-Latif
106
This can be prepared by weighing out about 0.1 - 0.15 g of CaCO3,
transfer to conical flask and add about 15 mL of HCl provided. Dilute
with 50 mL of distilled water and heat the solution to boiling in order to
remove CO2. Transfer to 500 mL measuring flask and dilute to volume.
Procedure
a. Standardization of EDTA Solution
1. Transfer exactly 25.00 mL of the Ca2+ standard solution into a
250 mL conical flask.
2. Add about 10 mL of the ammonium buffer, followed by 5 drops
of the Eriochrome Black T indicator.
3. Titrate against the EDTA solution and record the volume to two
significant figures after the decimal point.
4. Repeat steps 1-3 two more times.
5. Calculate the molarity of EDTA.
b. Determination of Water Hardness
1. Pipet exactly 50 mL of tap water into a 250 mL conical flask.
2. Add 10 mL of the ammonium buffer and 5 drops of the
Eriochrome Black T indicator.
3. Titrate against standard EDTA solution and record the volume.
4. Repeat steps 1-3 two more times.
5. Calculate the total hardness of water and report your results as
ppm CaCO3.
Report of Results
a. Standardization of EDTA Solution
Vol of EDTA Vol of Ca2+ Molarity of EDTA
X =
s =
Quantitative Analysis Lab Manual Prof. Monzir S. Abdel-Latif
107
b. Determination of Total Hardness of Water
Vol of Water
Sample
Vol of EDTA ppm CaCO3
X =
s =
It should be observed that this method gives the total Mg2+ and
Ca2+ present in the solution. However, results should be reported as
ppm CaCO3 since this is the unit, which is used by analytical laboratories
for comparative purposes.
Another important note concerns storage of standardized EDTA
solutions where these solutions should never be stored in soda based
glass. Preferably, polyethlene bottles should always be used.

Quantitative Analysis Lab Manual Prof. Monzir S. Abdel-Latif
108
Remarks and Observations

Quantitative Analysis Lab Manual Prof. Monzir S. Abdel-Latif
109
Experiment 15. Indirect Complexometric Determination of Cobalt
Background
Co2+ reacts with EDTA to form a complex at low pH. If an alkaline pH is
used, Co2+ precipitates as Co(OH)2 . However, Eriochrome Black T
indicator is not suilable at low pH values. Therefore, Co2+ is allowed to
form a complex with excess EDTA at low pH. The pH is then increased to
alkaline pH where the excess EDTA can be back-titrated with standard
Mg2+.
Reactions
Co2+ + H2Y2- (excess) CoY2- + 2 H+
(excess) H2Y2- + Mg2+ MgY2- + 2 H+
Reagents and Chemicals
a. Provided
1. Approximately 0.01 M EDTA solution.
2. Predried and desiccated MgCl2 . 6H2O
3. Eriochrome Black T indicator 0.5% (w/v) in ethanol.
4. Ammonium buffer, pH 10.
5. Co2+ solution of unknown concentration (~ 0.01-0.03M).
b. Need Preparation
1. Standard EDTA solution, 0.05 M.
The standardization of EDTA can be achieved simply by titration
against MgCl2. 6 H2O standard solution at pH 10 as follows:
Exactly 25.00 mL of Mg2+ (0.05 M) are transferred into a conical flask
(250 mL) and 10 mL of ammonium buffer are added, followed by 5
drops of the indicator. The solution is titrated against
Quantitative Analysis Lab Manual Prof. Monzir S. Abdel-Latif
110
standard Mg2+ and the experiment is repeated so that precise
results are obtaind.
2. Standard Mg2+ solution.
This solution can be prepared by weighing an appropriate amount of the
magnesium salt provided, transferring to a 250 mL measuring flask and
dissolution of the sample followed by adjustment of the volume to the
mark. The required concentration is approximately 0.0l M, which should
be exactly determined.
Procedure
1. Transfer exactly 10.00 mL of the Co2+ solution into a 250 mL
conical flask.
2. Add 10 mL of the standard 0.05 M EDTA solution and mix well.
2. Add 10 mL of the ammonium buffer, pH 10.
3. Add 5 drops of the Eriochrome Black T indicator.
4. Titrate against standard Mg2+ and record the volume to two
significant figures after the decimal point.
5. Repeat steps 1- 4 two more times.
6. Calculate the concentration of Co2+ in the solution and report
your results as ppm Co2+.
Report of Results
1. Standardization of EDTA Solution
Vol of Mg2+ Vol of EDTA Molarity of EDTA
X =
s =

Quantitative Analysis Lab Manual Prof. Monzir S. Abdel-Latif
111
2. Determination of Co2+
Vol of EDTA Vol of Mg2+ Molarity of Co2+
X =
s =
Calculations
Assume that 50 mL of 0.01 M EDTA solution were added to 25 mL of
Co2+ solution and the excess EDTA required 20 mL of 0.005 M
Mg2+solution. Calculate ppm Co2+ present.
���� ���� ������� = ���� ���� ����� − ���� ���� ��������
���� ���� ������� = ���� ��
�������� �������� = ���� �����
���� �� = ���� ���� ����� − ���� �����
��� ∗ ��� = ����� ∗ ����� − ������ ∗ ������
��� ∗ 25 = 0.01 ∗ 50 − 0.005 ∗ 20
��� = 0.016
��� = � ∗ �� ∗ 1000
��� ����� = 0.016 ∗ 58.9 ∗ 1000 = 942

Quantitative Analysis Lab Manual Prof. Monzir S. Abdel-Latif
112
Remarks and Observations

Quantitative Analysis Lab Manual Prof. Monzir S. Abdel-Latif
113
Experiment 16. Complexometric Determination of Zinc and
Magnesium in a Mixture
Background
EDTA form complexes with both Mg2+ and Zn2+ in solution. First, a
titration of the mixture will result in the determination of the
total amounts of the two cations. Zn2+ can be selectively masked with
the addition of CN- and Mg2+ can be determined by direct titration
against EDTA. Zn2+concentration can be determined by difference.
Reactions
Zn2+ + H2Y2- ZnY2- + 2 H+
Mg2+ + H2Y2- MgY2- + 2 H+
Reagents and Chemicals
a. Provided
1. A solution of Zn2+ and Mg2+ mixture of unknown concentration.
2. Stock EDTA solution (0.01 M).
3. Eriochrome Black T indicator.
4. Predried and desiccated MgCl2 . 6H2O.
5. Solid KCN (HIGHLY TOXIC!!).
6. Ammonium buffer at pH 10. 1 L of the buffer is composed of 6.4 g
of NH4Cl plus 57 mL of concentrated ammonia diluted with distilled
water.
b. Need Preparation
1. Standard EDTA solution. If you do not have enough from previous
experiments, follow procedure mentioned in experiment 15 to
standardize the EDTA stock solution.
2. Standard MgCl2. 6H2O solution. Same procedure as in experiment
15 if you do not have enough solution from previous experiments.

Quantitative Analysis Lab Manual Prof. Monzir S. Abdel-Latif
114
Procedure
a. Total Zn2+ and Mg2+
1. Pipet exactly 25.00 mL of the mixture into a 250 mL conical flask.
2. Add 10 mL of the buffer solution and 5 drops of the indicator.
3. Add 50 mL of standard EDTA solution. This is an excess of EDTA.
4. Perform a back titration of excess EDTA against standard MgCl2.
6H2O. This should enable you to calculate total amounts of
Mg2+ and Zn2+ present in the mixture.
5. Repeat steps 1-4 two more times and always record your volumes.
b. Mg2+ Determination
1. Pipet exactly 25.00 mL of the mixture into a 250 mL conical flask.
2. Add 10 mL of the buffer solution provided.
3. Add about 0.3 g of KCN and dissolve well.
4. Add 5 drops of the Eriochrome Black T indicator and titrate against
standard EDTA solution.
5. Repeat steps 1-4 two more times and record the volume of EDTA
solution consumed.
6. Calculate the amount of Zn2+ present in ppm units.
Report of Results
a. Total Zn2+ and Mg2+ in the mixture
Vol of EDTA
Added
Vol of MgCl2 Vol EDTA Eq to
Total
ppm
(Zn2++Mg+)
X =
s =

Quantitative Analysis Lab Manual Prof. Monzir S. Abdel-Latif
115
b. Zn2+ Determination
Vol of EDTA Vol of
Mixture
ppm Zn2+ ppm Mg+
X =
s =

Quantitative Analysis Lab Manual Prof. Monzir S. Abdel-Latif
116
Remarks and Observations

Quantitative Analysis Lab Manual Prof. Monzir S. Abdel-Latif
117
Chapter 7
PRECIPITATION TITRATIONS
In previous sections, different titrimetric procedures that take place in
solution were discussed. A special type of titrimetric procedures
involves the formation of precipitates during the course of a
titration. The titrant react with the analyte forming an insoluble
material and the titration continues till the very last amount of analyte is
consumed. The first drop of titrant in excess will react with an indicator
resulting in a color change and announcing the termination of the
titration.
Argentometric Titrations
The most widely applicable precipitation titrations involve the use of
silver nitrate with chlorides, bromides, iodides, and thiocyanate. Since
silver is always there, precipitation titrations are referred to as
Argentometric titrations. This implies that this type of titration is
relatively limited.
According to end point detection method, three main procedures are
widely used depending on the type of application. These are:
a. Mohr Method
This method utilizes chromate as an indicator. Chromate forms a
precipitate with Ag+ but this precipitate has a greater solubility than that
of AgCl, for example. Therefore, AgCl is formed first and after all Cl- is
consumed, the first drop of Ag+ in excess will react with the chromate
indicator giving a reddish precipitate.
2 Ag+ + CrO42- Ag2CrO4(s)

Quantitative Analysis Lab Manual Prof. Monzir S. Abdel-Latif
118
In this method, neutral medium should be used since, in alkaline
solutions, silver will react with the hydroxide ions forming AgOH. In
acidic solutions, chromate will be converted to dichromate. Therefore,
the pH of solution should be kept at about 7. There is always some error
in this method because a dilute chromate solution is used due to the
intense color of the indicator. This will require additional amount of
Ag+ for the Ag2CrO4 to form, thus a blank titration may be necessary.
b. Volhard Method
This is an indirect method for chloride determination where an excess
amount of standard Ag+ is added to the chloride solution containing
Fe3+as an indicator. The excess Ag+ is then titrated with standard SCN-
solution untill a red color is obtained which results from the reaction:
Fe3+(yellow) + SCN- Fe(SCN)2+ (red)
The indicator system is very sensitive and usually good results are
obtained. The medium should be acidic to avoid the formation of
Fe(OH)3 . However, the use of acidic medium together with added SCN-
titrant increase the solubility of the precipitate leading to significant
errors. This problem had been overcome by two main procedures:
The first includes addition of some nitrobenzene, which surrounds the
precipitate and shields it from the aqueous medium. The second
procedure involves filtration of the precipitate directly after
precipitation, which protects the precipitate from coming in contact
with the added SCN- solution.
C. Fajans Method
Fluorescein and its derivatives are adsorbed to the surface of colloidal
AgCl. After all chloride is used, the first drop of Ag+ will react with
fluorescein (FI-) forming a reddish color.
Ag+ + FI- AgFl(ads)

Quantitative Analysis Lab Manual Prof. Monzir S. Abdel-Latif
119
Since fluorescein is a weak acid, the pH of the solution should be slightly
alkaline to keep the indicator in the anion form but, at the same time, is
not alkaline enough to convert Ag+ into AgOH . Fluorescein derivatives
that are stronger acids than fluorescien (like eosin) can be used at acidic
pH without problems. This method is simple and results obtained are
reproducible.

Quantitative Analysis Lab Manual Prof. Monzir S. Abdel-Latif
120
Applications
Experiment 17. Determination of Chloride by Precipitation Titration
Background
As mentioned in the text, chloride reacts with silver ion to form a
precipitate. The end point can be detected by one of three methods,
namely Mohr, Volhard or Fajan's. This experiment is devised for the
application of these detection methods.
Reactions
Ag+ + Cl- AgCl(s)
Ag+ + SCN- Ag SCN(s)
Reagents and Chemicals
a. Provided
1. Chloride solution of unknown concentration.
2. Predried and desiccated AgNO3 . be careful !!
Do not allow this substance either in the solid or solution to come in
contact with your skin. Black stains that will persist for almost two
weeks will be formed.
3. 0.1% Dichlorofluorescein in 75% (v/v) ethanol.
4. 5% Dextrin solution.
5. 5 M HNO3 solution.
6. Potassium chromate indicator.
Quantitative Analysis Lab Manual Prof. Monzir S. Abdel-Latif
121
7. Predried and desiccated KSCN.
8. Nitrobenzene.
9. Ferric alum indicator.
b. Need Prepartion
1. Standard AgNO3 that is approximately 0.05M. (250
mL). Prepare by dissolving a precalculated amount in 250 mL of
distilled water.
2. Standard KSCN solution that is approximately 0.05 M (250
mL). Prepare by dissolving a suitable amount in 250 mL of
distilled water and standardize against standard AgNO3 solution
using ferric alum indicator.
Procedure
a. Using Mohr Method
1. Pipet exactly 10 mL of the chloride unknown into a 250 mL conical
flask.
2. Add 25 mL of distilled water and 0.5 mL of K2CrO4 indicator solution.
3. Titrate against standard AgNO3 solution and record the volume to
two significant figures after the decimal point.
4. Repeat steps 1-3 two more times and calculate the concentration of
chloride in the sample as ppm NaCl.
b. Using Volhard Method
1. Transfer exactly 10 mL of the chloride sample into a 250 mL conical
flask.
Quantitative Analysis Lab Manual Prof. Monzir S. Abdel-Latif
122
2. Add 25 mL of distilled water, 5 mL of the HNO3 solution provided,
and exactly 20 mL of standard AgNO3 solution.
3. Add 2 mL of nitrobenzene and shake vigorously. (you may need to
seal the flask with parafilm).
4. Add 2 mL of the ferric alm indicator and titrate against standard
KSCN solution and record the volume to two significant figures after
the decimal point.
5. Repeat steps 1-4 two more times and calculate the concentration of
chloride as ppm NaCl.
c. Using Fajans Method
1. Pipet exactly 10 mL of the chloride unknown sample into a 250 mL
conical flask.
2. Add 2 mL of dextrin solution followed by 4 drops of 0.1%
dichlorofluorescein indicator.
3. Titrate against standard AgNO3 solution till a permanent change in
the color of indicator is observed. Record the volume of
AgNO3 solution consumed.
4. Repeat steps 1-3 two more times and report your results as ppm
NaCl.
Report of Results
Note:
��� = � ∗ �� ∗ 1000

Quantitative Analysis Lab Manual Prof. Monzir S. Abdel-Latif
123
a. Mohr Method
Vol of Chloride Vol of AgNO3 ppm NaCl
X =
s =
b. Volhard Method
Vol of AgNO3 Vol of KSCN Vol AgNO3 Eq to
Chloride ppm NaCl
X =
s =
c. Fajnans Method
Vol of Chloride Vol of AgNO3 ppm NaCl
X =
s =

Quantitative Analysis Lab Manual Prof. Monzir S. Abdel-Latif
124
Remarks and Observations

Quantitative Analysis Lab Manual Prof. Monzir S. Abdel-Latif
125
Experiment 18. Determination of Sulfate by Precipitation Titration
Background
Ba2+ reacts with sulfate to form insoluble BaSO4 precipitate. In the
presence of alizarin red S indicator, the first excess of Ba2+ react with the
indicator yielding a pink complex. The titration is fast, reliable, and offer
results comparable to those obtained by gravimetry.
Reactions
Ba2+ + SO42- BaSO4 (s)
Reagents and Chemicals
a. Provided
1. Predried and desiccated sulfate sample.
2. Predried and desiccated BaCl2.2H2O.
3. 10% HCl solution (V/V).
4. Methanol.
5. 0.2% Aqueous solution of alizarin red S.
b. Need Preparation
1. 250 mL of the sulfate unknown. Prepare by accurately weighing
about 1.000 g of the sample. Transfer to 250 mL measuring flask,
dissolve in distilled water, and complete to the mark.

Quantitative Analysis Lab Manual Prof. Monzir S. Abdel-Latif
126
2. 250 mL of the BaCl2. 2H2O standard solution that is about 0.05
M. Appropriate amount of BaCl2 . 2H2O should be dissolved in some
distilled water, the pH is adjusted to 3-3.5 by dropwise addition of HCl,
and the volume is completed to the mark.
Procedure
1. Transfer exactly 25 mL of the sulfate unknown into a 250 mL
conical flask.
2. Add approximately 25 mL of H2O and 40 mL of methanol followed
by 2 drops of the indicator.
3. Add HCl solution provided dropwise till the indicator attains the
yellow color.
4. Perform a trial titration with rapid addition of standard barium
chloride and find the approximate volume of BaCl2 .
5. Repeat steps 1-3 and titrate against standard BaCl2 till about 90%
of BaCl2 necessary is added then add 3 more drops of the indicator.
6. Continue titration with dropwise addition of BaCl2 and vigorous
swirling. Allow about 5 seconds between addition of each
increment until a pale pink color is achieved.
7. Record the volume and repeat steps 1-6 (excluding step 4) two
more times.
8. Report your results as %S in the sample.

Quantitative Analysis Lab Manual Prof. Monzir S. Abdel-Latif
127
Report of Results
Vol of Sulfate Vol of BaCl2 Wt of S in 25 mL
X =
s
% S in the sample =

Quantitative Analysis Lab Manual Prof. Monzir S. Abdel-Latif
128
Remarks and Observations

Quantitative Analysis Lab Manual Prof. Monzir S. Abdel-Latif
129
Appendix

Quantitative Analysis Lab Manual Prof. Monzir S. Abdel-Latif
130
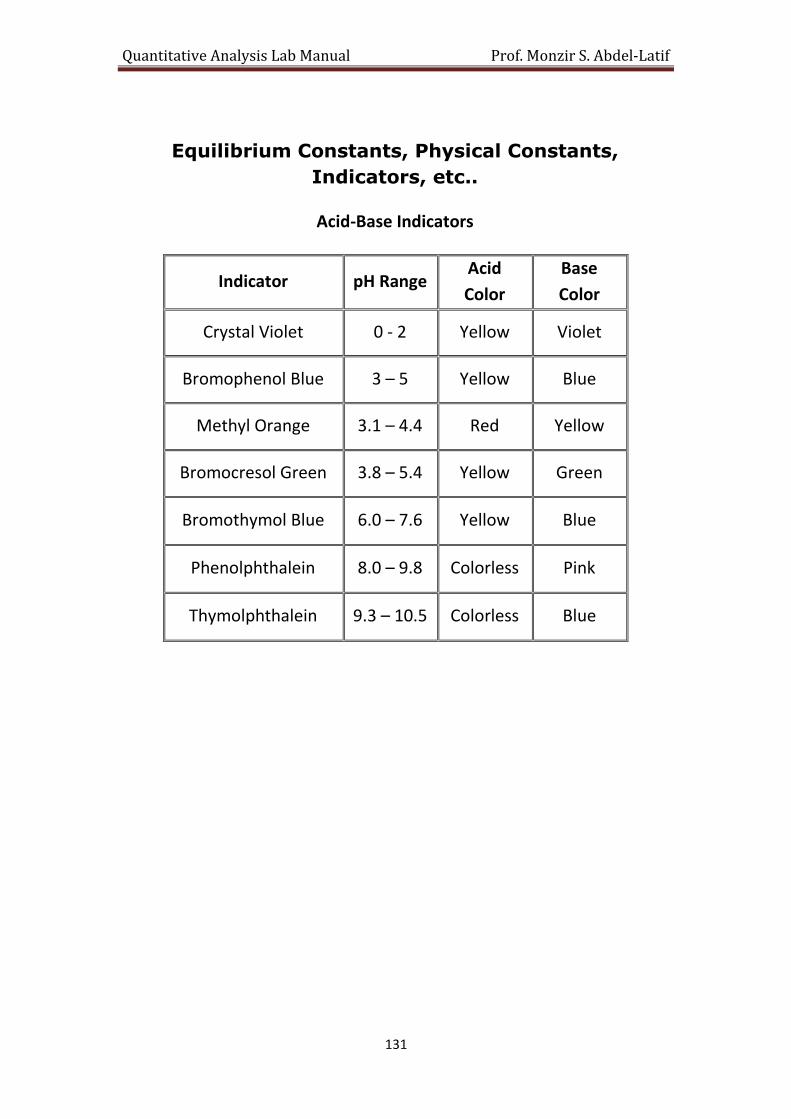
Quantitative Analysis Lab Manual Prof. Monzir S. Abdel-Latif
131
Equilibrium Constants, Physical Constants,
Indicators, etc..
Acid-Base Indicators
Indicator pH Range Acid
Color
Base
Color
Crystal Violet 0 - 2 Yellow Violet
Bromophenol Blue 3 – 5 Yellow Blue
Methyl Orange 3.1 – 4.4 Red Yellow
Bromocresol Green 3.8 – 5.4 Yellow Green
Bromothymol Blue 6.0 – 7.6 Yellow Blue
Phenolphthalein 8.0 – 9.8 Colorless Pink
Thymolphthalein 9.3 – 10.5 Colorless Blue
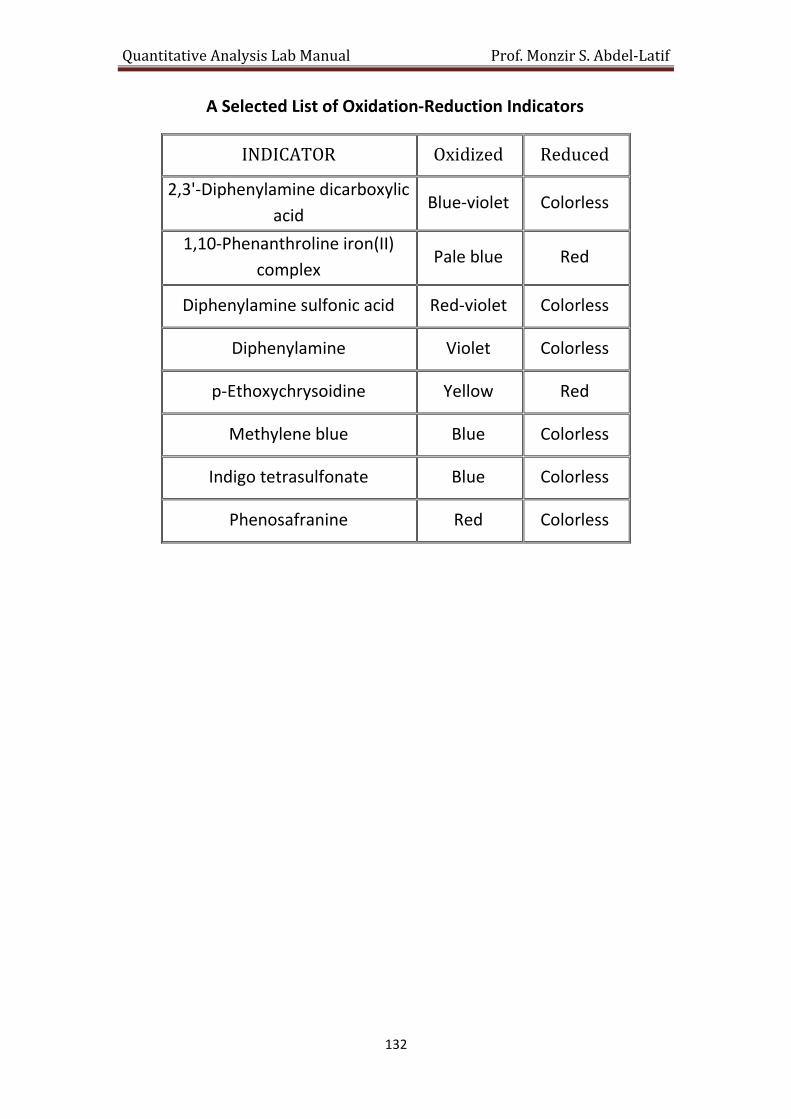
Quantitative Analysis Lab Manual Prof. Monzir S. Abdel-Latif
132
A Selected List of Oxidation-Reduction Indicators
INDICATOR Oxidized Reduced
2,3'-Diphenylamine dicarboxylic
acid Blue-violet Colorless
1,10-Phenanthroline iron(II)
complex Pale blue Red
Diphenylamine sulfonic acid Red-violet Colorless
Diphenylamine Violet Colorless
p-Ethoxychrysoidine Yellow Red
Methylene blue Blue Colorless
Indigo tetrasulfonate Blue Colorless
Phenosafranine Red Colorless

Quantitative Analysis Lab Manual Prof. Monzir S. Abdel-Latif
133
Ionization Constants of Aqueous Monoprotic Acids
Common Name Formula Constant pKa
acetic acid CH3COOH 1.75 x 10⁻⁵ 4.756
ammonium ion NH4+ 5.60 x 10⁻¹⁰ 9.252
benzoic acid C6H5COOH 6.31 x 10⁻⁵ 4.200
chloroacetic acid CH2ClCOOH 1.36 x 10⁻³ 2.866
cyanic acid HOCN 3.54 x 10⁻⁴ 3.451
dichloroacetic acid CHCl2COOH 5.68 x 10⁻² 1.246
dimethylammonium
ion
(H3C)2NH2+ 1.82 x 10⁻¹¹ 10.739
ethanol CH3CH2OH 1.31 x 10⁻¹⁴ 13.882
formic acid HCOOH 1.86 x 10⁻⁴ 3.732
hydrazoic acid HN3 2.37 x 10⁻⁵ 4.625
hydrocyanic acid HCN 5.85 x 10⁻¹⁰ 9.233
hydrofluoric acid HF 6.94 x 10⁻⁴ 3.159
hydroxylammonium
ion
HONH3+ 1.12 x 10⁻⁶ 5.951
hypochlorous acid HClO 2.81 x 10⁻⁸ 7.551
nitrous acid HNO2 5.98 x 10⁻⁴ 3.224
phenol C6H5OH 1.08 x 10⁻¹⁰ 9.968
pyridinium ion C5H5NH+ 6.80 x 10⁻⁶ 5.167
trimethylammonium
ion
(H3C)3NH+ 1.72 x 10⁻¹⁰ 9.763
water H2O 1.00 x 10⁻¹⁴ 13.994
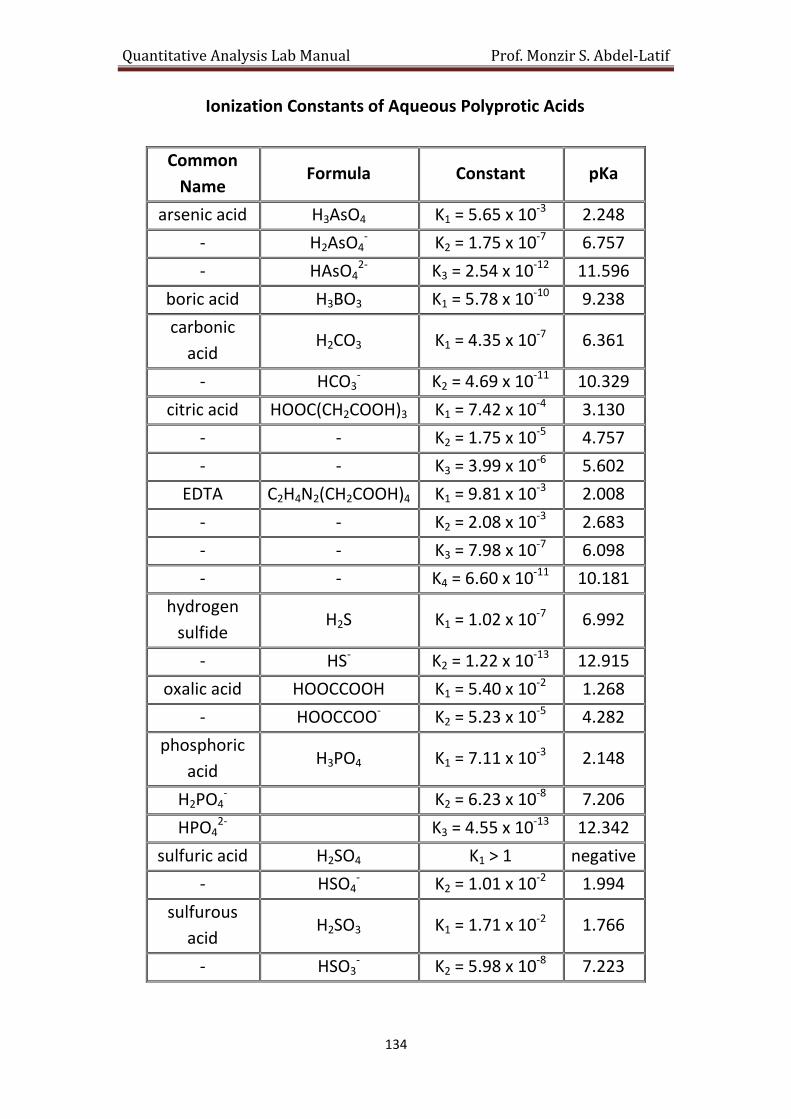
Quantitative Analysis Lab Manual Prof. Monzir S. Abdel-Latif
134
Ionization Constants of Aqueous Polyprotic Acids
Common
Name Formula Constant pKa
arsenic acid H3AsO4 K1 = 5.65 x 10⁻³ 2.248
- H2AsO4- K2 = 1.75 x 10⁻⁷ 6.757
- HAsO42- K3 = 2.54 x 10⁻¹² 11.596
boric acid H3BO3 K1 = 5.78 x 10⁻¹⁰ 9.238
carbonic
acid H2CO3 K1 = 4.35 x 10⁻⁷ 6.361
- HCO3- K2 = 4.69 x 10⁻¹¹ 10.329
citric acid HOOC(CH2COOH)3 K1 = 7.42 x 10⁻⁴ 3.130
- - K2 = 1.75 x 10⁻⁵ 4.757
- - K3 = 3.99 x 10⁻⁶ 5.602
EDTA C2H4N2(CH2COOH)4 K1 = 9.81 x 10⁻³ 2.008
- - K2 = 2.08 x 10⁻³ 2.683
- - K3 = 7.98 x 10⁻⁷ 6.098
- - K4 = 6.60 x 10⁻¹¹ 10.181
hydrogen
sulfide H2S K1 = 1.02 x 10⁻⁷ 6.992
- HS- K2 = 1.22 x 10⁻¹³ 12.915
oxalic acid HOOCCOOH K1 = 5.40 x 10⁻² 1.268
- HOOCCOO- K2 = 5.23 x 10⁻⁵ 4.282
phosphoric
acid H3PO4 K1 = 7.11 x 10⁻³ 2.148
H2PO4-
K2 = 6.23 x 10⁻⁸ 7.206
HPO42-
K3 = 4.55 x 10⁻¹³ 12.342
sulfuric acid H2SO4 K1 > 1 negative
- HSO4- K2 = 1.01 x 10⁻² 1.994
sulfurous
acid H2SO3 K1 = 1.71 x 10⁻² 1.766
- HSO3- K2 = 5.98 x 10⁻⁸ 7.223

Quantitative Analysis Lab Manual Prof. Monzir S. Abdel-Latif
135
Solubility Products of Slightly Soluble Salts
Compound Ksp Compound Ksp
AgBr 5.35 x 10⁻¹³ BaF2 1.84 x 10⁻⁷
Ag2CO3 8.45 x 10⁻¹² BaSO4 1.08 x 10⁻¹⁰
AgCl 1.76 x 10⁻¹⁰ CaCO3 4.96 x 10⁻⁹
Ag2CrO4 1.12 x 10⁻¹² CaF2 1.46 x 10⁻¹⁰
AgCN 5.97 x 10⁻¹⁷ CaSO4 7.10 x 10⁻⁵
AgI 1.18 x 10⁻¹⁶ CdS 1.40 x 10⁻²⁹
Ag3PO4 8.88 x 10⁻¹⁷ Ca(OH)2 4.68 x 10⁻⁶
Ag2SO4 1.20 x 10⁻⁵ CuC2O4 4.43 x 10⁻¹⁰
Ag2S 6.69 x 10-50 CuS 1.27 x 10-36
AgCNS 1.03 x 10⁻¹² Fe(OH)3 2.79 x 10-39
Al(OH)3 2. x 10-32 Hg2Br2 6.42 x 10⁻²³
BaCO3 2.58 x 10⁻⁹ Hg2Cl2 6.24 x 10⁻¹³
BaCrO4 1.17 x 10⁻¹⁰ HgS 1.55 x 10-52
KClO4 1.05 x 10⁻² PbCl2 1.78 x 10⁻⁵
MgCO3 6.82 x 10⁻⁶ PbS 9.05 x 10⁻²⁹
MgF2 7.42 x 10⁻¹¹ PbSO4 1.82 x 10⁻⁸
MgNH4PO4 2.1 x 10⁻¹³* SnS 3.25 x 10⁻²⁸
Mg(OH)2 5.61 x 10⁻¹¹ Zn(OH)2 4.13 x 10⁻¹⁷
MnS 4.65 x 10⁻¹⁴ ZnS 2.93 x 10⁻²⁵
NiS 1.07 x 10⁻²¹ PbCl2 1.78 x 10⁻⁵
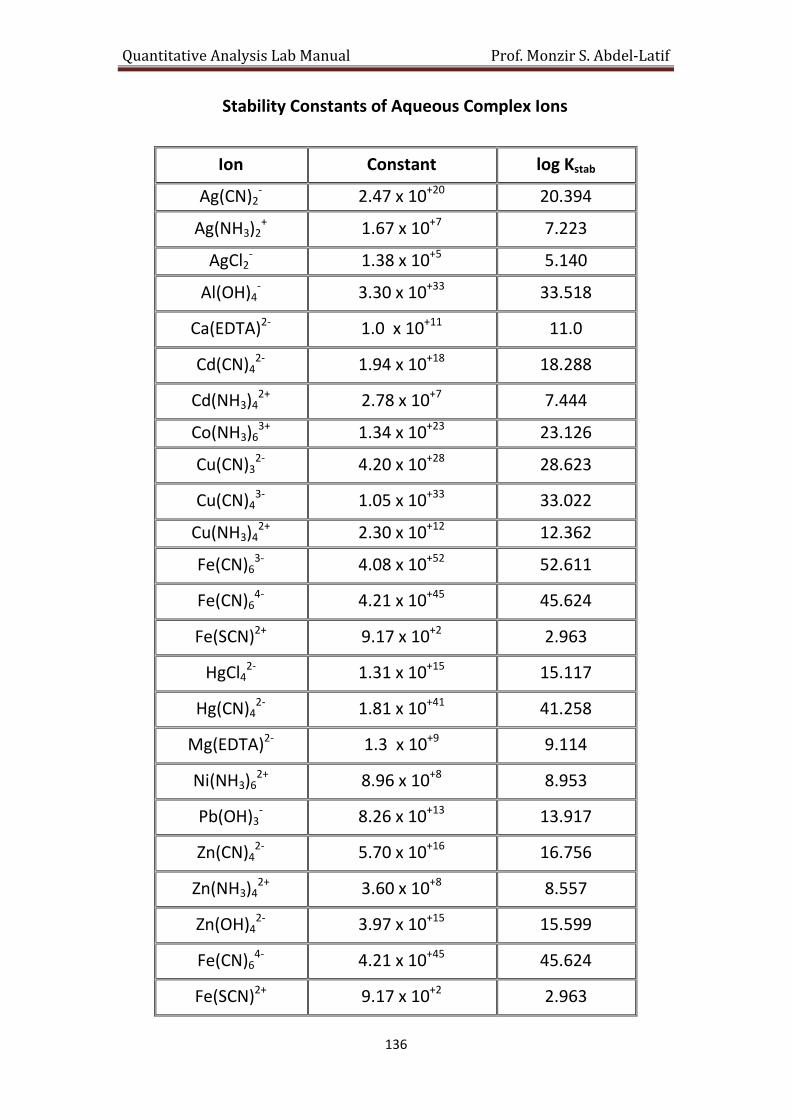
Quantitative Analysis Lab Manual Prof. Monzir S. Abdel-Latif
136
Stability Constants of Aqueous Complex Ions
Ion Constant log Kstab
Ag(CN)2- 2.47 x 10+20 20.394
Ag(NH3)2+ 1.67 x 10+7 7.223
AgCl2- 1.38 x 10+5 5.140
Al(OH)4- 3.30 x 10+33 33.518
Ca(EDTA)2- 1.0 x 10+11 11.0
Cd(CN)42- 1.94 x 10+18 18.288
Cd(NH3)42+ 2.78 x 10+7 7.444
Co(NH3)63+ 1.34 x 10+23 23.126
Cu(CN)32- 4.20 x 10+28 28.623
Cu(CN)43- 1.05 x 10+33 33.022
Cu(NH3)42+ 2.30 x 10+12 12.362
Fe(CN)63- 4.08 x 10+52 52.611
Fe(CN)64- 4.21 x 10+45 45.624
Fe(SCN)2+ 9.17 x 10+2 2.963
HgCl42- 1.31 x 10+15 15.117
Hg(CN)42- 1.81 x 10+41 41.258
Mg(EDTA)2- 1.3 x 10+9 9.114
Ni(NH3)62+ 8.96 x 10+8 8.953
Pb(OH)3- 8.26 x 10+13 13.917
Zn(CN)42- 5.70 x 10+16 16.756
Zn(NH3)42+ 3.60 x 10+8 8.557
Zn(OH)42- 3.97 x 10+15 15.599
Fe(CN)64- 4.21 x 10+45 45.624
Fe(SCN)2+ 9.17 x 10+2 2.963
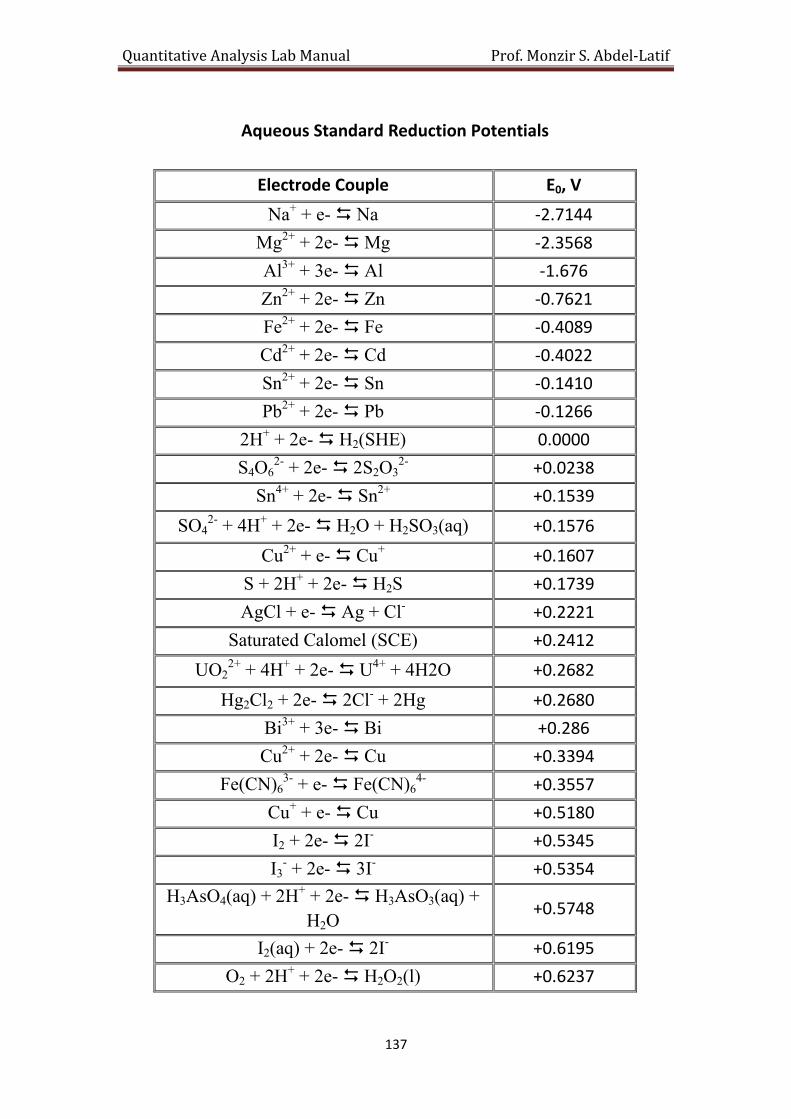
Quantitative Analysis Lab Manual Prof. Monzir S. Abdel-Latif
137
Aqueous Standard Reduction Potentials
Electrode Couple E0, V
Na+ + e- Na -2.7144
Mg2+ + 2e- Mg -2.3568
Al3+ + 3e- Al -1.676
Zn2+ + 2e- Zn -0.7621
Fe2+ + 2e- Fe -0.4089
Cd2+ + 2e- Cd -0.4022
Sn2+ + 2e- Sn -0.1410
Pb2+ + 2e- Pb -0.1266
2H+ + 2e- H2(SHE) 0.0000
S4O62- + 2e- 2S2O3
2- +0.0238
Sn4+ + 2e- Sn2+ +0.1539
SO42- + 4H+ + 2e- H2O + H2SO3(aq) +0.1576
Cu2+ + e- Cu+ +0.1607
S + 2H+ + 2e- H2S +0.1739
AgCl + e- Ag + Cl- +0.2221
Saturated Calomel (SCE) +0.2412
UO2
2+ + 4H+ + 2e- U4+ + 4H2O +0.2682
Hg2Cl2 + 2e- 2Cl- + 2Hg +0.2680
Bi3+ + 3e- Bi +0.286
Cu2+ + 2e- Cu +0.3394
Fe(CN)63- + e- Fe(CN)6
4- +0.3557
Cu+ + e- Cu +0.5180
I2 + 2e- 2I- +0.5345
I3- + 2e- 3I- +0.5354
H3AsO4(aq) + 2H+ + 2e- H3AsO3(aq) +
H2O +0.5748
I2(aq) + 2e- 2I- +0.6195
O2 + 2H+ + 2e- H2O2(l) +0.6237

Quantitative Analysis Lab Manual Prof. Monzir S. Abdel-Latif
138
Electrode Couple E0, V
O2 + 2H+ + 2e- H2O2(aq) +0.6945
Fe3+ + e- Fe2+ +0.769
Hg22+ + 2e- Hg +0.7955
Ag+ + e- Ag +0.7991
Hg2+ + 2e- Hg +0.8519
2Hg2+ + 2e- Hg2
2+ +0.9083
NO3- + 3H+ + 2e- HNO2(aq) + H2O +0.9275
VO2
+ + 2H+ + e- VO2+ + H2O +1.0004
HNO2(aq) + H+ + e- NO + H2O +1.0362
Br2(l) + 2e- 2Br- +1.0775
Br2(aq) + 2e- 2Br- +1.0978
2IO3- + 12H+ + 10e- 6H2O + I2 +1.2093
O2 + 4H+ + 4e- 2H2O +1.2288
MnO2 + 4H+ + 2e- Mn2+ + 2H2O +1.3601
Cl2 + 2e- 2Cl- +1.1406
MnO4- + 8H+ + 5e- 4H2O + Mn2+ +1.5119
2BrO3
- + 12H+ + 10e- 6H2O + Br2 +1.5131
Ce4+ + e- Ce3+ +1.7432

Quantitative Analysis Lab Manual Prof. Monzir S. Abdel-Latif
139
Values of Fundamental Physical Constants
Constant Value SI Unit
Avogadro 6.0221367 x 10+23 mol-1
Boltzmann 1.380658 x 10⁻²³ J/K
Faraday 96,485.309 C/mol
Planck 6.6260755 x 10⁻³⁴ J s
Rydberg 10973731.534 m-1
molar gas 8.3143510 J/K mol
elementary
charge 1.60217733 x 10⁻¹⁹ C
Absolute
temperature 273.1500 K
speed of light 299,792,458 m/s
atomic mass unit 1.6605402x 10⁻²⁷ kg
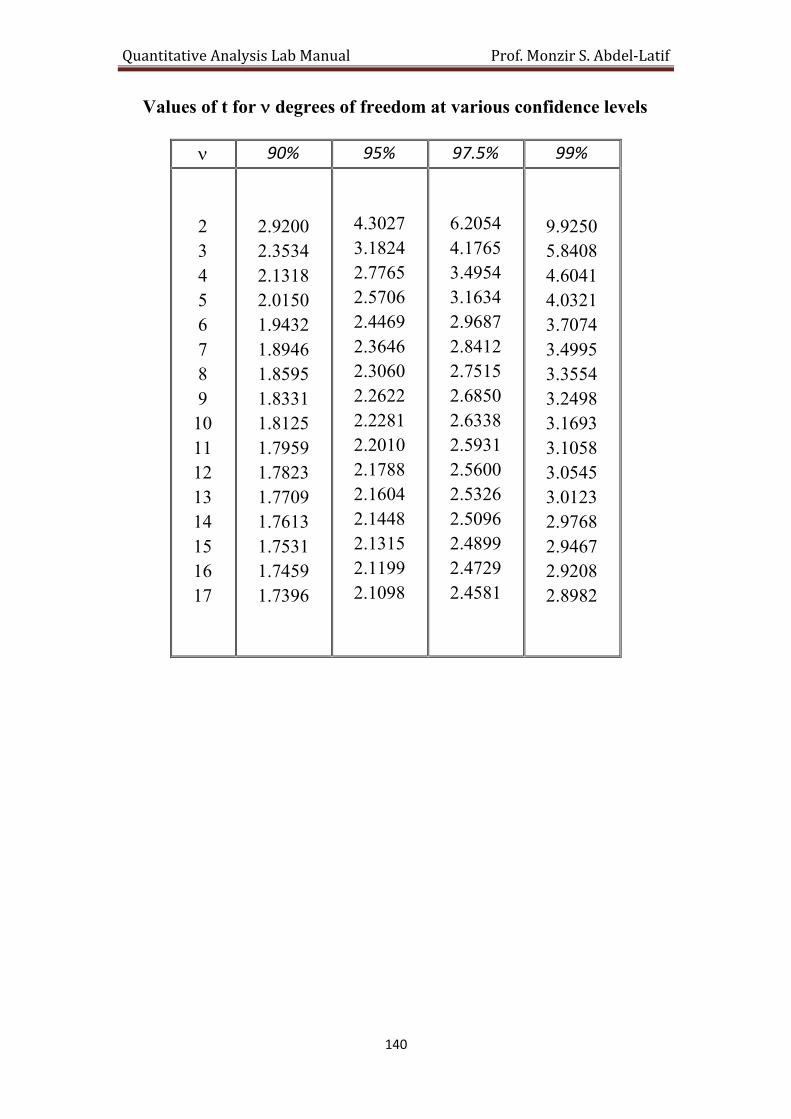
Quantitative Analysis Lab Manual Prof. Monzir S. Abdel-Latif
140
Values of t for degrees of freedom at various confidence levels
90% 95% 97.5% 99%
2
3
4
5
6
7
8
9
10
11
12
13
14
15
16
17
2.9200
2.3534
2.1318
2.0150
1.9432
1.8946
1.8595
1.8331
1.8125
1.7959
1.7823
1.7709
1.7613
1.7531
1.7459
1.7396
4.3027
3.1824
2.7765
2.5706
2.4469
2.3646
2.3060
2.2622
2.2281
2.2010
2.1788
2.1604
2.1448
2.1315
2.1199
2.1098
6.2054
4.1765
3.4954
3.1634
2.9687
2.8412
2.7515
2.6850
2.6338
2.5931
2.5600
2.5326
2.5096
2.4899
2.4729
2.4581
9.9250
5.8408
4.6041
4.0321
3.7074
3.4995
3.3554
3.2498
3.1693
3.1058
3.0545
3.0123
2.9768
2.9467
2.9208
2.8982

Quantitative Analysis Lab Manual Prof. Monzir S. Abdel-Latif
141
Values of F at the 95% Confidence Level
1
2
2 3 4 5 6 15
2 19.0 19.2 19.2 19.3 19.3 19.4
3 9.55 9.28 9.12 9.01 8.94 8.70
4 6.94 6.59 6.39 6.26 6.16 5.86
5 5.79 5.41 5.19 5.05 4.95 4.62
6 5.14 4.76 4.53 4.39 4.28 3.94
7 4.74 4.35 4.12 3.97 3.87 3.51
15 3.68 3.29 3.06 2.90 2.79 2.40
Rejection Quotient, Q, at Different Confidence Level
Number of
Observations
Confidence Level
90% 95% 99%
3 0.941 0.970 0.994
4 0.765 0.829 0.926
5 0.642 0.710 0.821
6 0.560 0.625 0.740
7 0.507 0.568 0.680
8 0.468 0.526 0.634
9 0.437 0.493 0.598
10 0.412 0.466 0.568