
QuantaSoft Version 1.7 Regulatory Edition Software
28
QuantaSoft ™ Version 1.7 Regulatory Edition Software Instruction Manual Catalog #186-4011
Transcript of QuantaSoft Version 1.7 Regulatory Edition Software

QuantaSoft™ Version 1.7 Regulatory Edition SoftwareInstruction Manual
Catalog #186-4011

Instruction Manual | i
Preface
Bio-Rad Technical SupportFor help and technical advice, please contact the Bio-Rad Technical Support department. In the United States, the Technical Support department is open Monday–Friday, 5:00 AM–5:00 PM, Pacific time.
Phone: 1-800-424-6723 Fax: 1-510-741-5802 Email: [email protected] (for U.S. and international customers)
Online technical support and worldwide contact information are available at www.consult.bio-rad.com.
Legal NoticesNo part of this publication may be reproduced or transmitted in any form or by any means, electronic or mechanical, including photocopy, recording, or any information storage or retrieval system, without permission in writing from Bio-Rad Laboratories.
Bio-Rad reserves the right to modify its products and services at any time. This instruction manual is subject to change without notice. Although prepared to ensure accuracy, Bio-Rad assumes no liability for errors, or for any damages resulting from the application or use of this information.
Excel, Windows, and Microsoft are trademarks of Microsoft Corporation. FAM and VIC are trademarks of Applera Corporation.
EvaGreen is a trademark of Biotium, Inc. Bio-Rad Laboratories, Inc. is licensed by Biotium, Inc. to sell reagents containing EvaGreen dye for use in real-time PCR, for research purposes only.
Bio-Rad’s thermal cyclers and real-time thermal cyclers are covered by one or more of the following U.S. patents or their foreign counterparts owned by Eppendorf AG: U.S. Patent Numbers 6,767,512 and 7,074,367.
This product and/or its use is covered by claims of U.S. patents, and/or pending U.S. and non-U.S. patent applications owned by or under license to Bio-Rad Laboratories, Inc. Purchase of the product includes a limited, non-transferable right under such intellectual property for use of the product for internal research purposes only. No rights are granted for diagnostic uses. No rights are granted for use of the product for commercial applications of any kind, including but not limited to manufacturing, quality control, or commercial services, such as contract services or fee for services. Information concerning a license for such uses can be obtained from Bio-Rad Laboratories. It is the responsibility of the purchaser/end user to acquire any additional intellectual property rights that may be required.
Copyright © 2016 by Bio-Rad Laboratories, Inc. All rights reserved.

ii | QuantaSoft Regulatory Edition Software
Preface
Safety and Regulatory Compliance This instrument has been tested and found to be in compliance with all applicable requirements of the following safety and electromagnetic standards:
■■ IEC 61010-1:2010 (3rd ed.), EN61010-1:2010 (3rd ed). Electrical Equipment for Measurement, Control, and Laboratory Use — Part 1: General requirements
■■ EN 61326-1:2006 (Class A). Electrical equipment for measurement, control, and laboratory use. EMC requirements, Part 1: General requirements
■■ UL 61010-1:2004, Laboratory equipment, Test & Measurement Equipment and Industrial Process Controls
■■ CAN/CSA 22.2 No 61010-1-04, Safety Requirements for Electrical. Equipment for Measurement, Control, and Laboratory Use, Part I: General. Requirements
This equipment generates, uses, and can radiate radiofrequency energy and, if not installed and used in accordance with the instruction manual, may cause harmful interference to radio communications. Operation of this equipment in a residential area is likely to cause harmful interference, in which case the user will be required to correct the interference at his own expense.
The CE mark indicates that the manufacturer ensures the product conforms with the essential requirements of the applicable EN directives.
The CSA mark indicates that a product has been tested to Canadian and U.S. standards, and it meets the requirements of those applicable standards.
This equipment has been tested and found to comply with the limits for a Class A digital device pursuant to Part 15 of the FCC Rules. These limits are designed to provide reasonable protection against harmful interference when the equipment is operated in a commercial environment.
The Waste Electrical and Electronic Equipment Directive symbol indicates that when the end-user wishes to discard this product, it must be sent to separate collection facilities for recovery and recycling.
Instrument Safety WarningsAlteration of this instrument voids the warranty and safety certification and creates a potential safety hazard. This instrument is intended for laboratory use only. Bio-Rad Laboratories is not responsible for any injury or damage caused by use of this instrument for purposes other than those for which it is intended, or by modifications of the instrument not performed by Bio-Rad Laboratories or an authorized agent. Follow the safety specifications listed here and throughout this manual. Use only the power cord supplied with the instrument, using only the plug adaptor that corresponds to the electrical outlets in your region. Use of unapproved supermixes may harm the instrument and voids the warranty.
PPE (Personal Protective Equipment) TrainingProper use of gloves is recommended with use of oils and sample plates. OSHA requirements for PPE are set forth in the Code of Federal Regulations (CFR) at 29 CFR 1910.132 (General requirements); 29 CFR 1910.138 (Hand protection); 29 CFR 1926.95 (Criteria for standard personal protective equipment). Any gloves with impaired protective ability should be discarded and replaced. Consider the toxicity of the chemicals and factors such as duration of exposure, storage, and temperature when deciding to reuse chemically exposed gloves. Features to aid glove selection for handling of machines, assays, oils, and cleaning solvents:
■■ Butyl gloves are made of a synthetic rubber and protect against peroxide, hydrofluoric acid, strong bases, alcohols, aldehydes, and ketones
■■ Natural (latex) rubber gloves are comfortable to wear and feature outstanding tensile strength, elasticity, and temperature resistance
■■ Neoprene gloves are made of synthetic rubber and offer good pliability, finger dexterity, high density, and tear resistance; they protect against alcohols, organic acids, and alkalis
■■ Nitrile gloves are made of copolymer and provide protection from chlorinated solvents such as trichloroethylene and tetrachloroethene; they offer protection when working with oils, greases, acids, and caustic substances

Instruction Manual | iii
Table of Contents
Chapter 1 Introduction . . . . . . . . . . . . . . . . . . . . . . . . . . . . . . . . . . . . . . . . . . . . . . . . . . . . . . . . . . . . . . . . . . . 1QuantaSoft™ Regulatory Edition Software . . . . . . . . . . . . . . . . . . . . . . . . . . . . . . . . . . . . . . . . . . . . . 1User Groups . . . . . . . . . . . . . . . . . . . . . . . . . . . . . . . . . . . . . . . . . . . . . . . . . . . . . . . . . . . . . . . . . . . 1
Chapter 2 Installation . . . . . . . . . . . . . . . . . . . . . . . . . . . . . . . . . . . . . . . . . . . . . . . . . . . . . . . . . . . . . . . . . . . . 3
Chapter 3 Using QuantaSoft Regulatory Edition Software . . . . . . . . . . . . . . . . . . . . . . . . . . . . . . . . . . . . . . . 53.1 Setup . . . . . . . . . . . . . . . . . . . . . . . . . . . . . . . . . . . . . . . . . . . . . . . . . . . . . . . . . . . . . . . . . . . . . . 6
3.1.1 Using the Well Editor . . . . . . . . . . . . . . . . . . . . . . . . . . . . . . . . . . . . . . . . . . . . . . . . . . . . . . 73.1.2 Using the Experiment Editor . . . . . . . . . . . . . . . . . . . . . . . . . . . . . . . . . . . . . . . . . . . . . . . . 8
3.2 Run . . . . . . . . . . . . . . . . . . . . . . . . . . . . . . . . . . . . . . . . . . . . . . . . . . . . . . . . . . . . . . . . . . . . . . . 93.3 Analyze . . . . . . . . . . . . . . . . . . . . . . . . . . . . . . . . . . . . . . . . . . . . . . . . . . . . . . . . . . . . . . . . . . . 10
3.3.1 Viewing Channel Data (1D Amplitude) . . . . . . . . . . . . . . . . . . . . . . . . . . . . . . . . . . . . . . . . 113.3.2 Viewing Clustering Plots (2D Amplitude) . . . . . . . . . . . . . . . . . . . . . . . . . . . . . . . . . . . . . . 133.3.3 Viewing Concentration Data (Concentration) . . . . . . . . . . . . . . . . . . . . . . . . . . . . . . . . . . . 143.3.4 Viewing Copy Number Data (Copy Number) . . . . . . . . . . . . . . . . . . . . . . . . . . . . . . . . . . . 143.3.5 Viewing Ratio Data (Ratio) . . . . . . . . . . . . . . . . . . . . . . . . . . . . . . . . . . . . . . . . . . . . . . . . . 153.3.6 Viewing Events (Events) . . . . . . . . . . . . . . . . . . . . . . . . . . . . . . . . . . . . . . . . . . . . . . . . . . . 15
Appendix A Ordering Information . . . . . . . . . . . . . . . . . . . . . . . . . . . . . . . . . . . . . . . . . . . . . . . . . . . . . . . . . . . 17

iv | QuantaSoft Regulatory Edition Software
Instruction Manual | 1
1 Introduction
QuantaSoft™ Regulatory Edition SoftwareQuantaSoft Regulatory Edition (RE) software provides comprehensive Title 21 CFR Part 11 compliance features. QuantaSoft RE software offers a complete set of compliance tools to meet the needs of regulated life science laboratories — it is designed to (i) restrict access to data creation and maintenance capabilities and (ii) maintain a permanent record of changes to data and reports. The following features integrate with compliance programs:
■ Security, access limitations, and authority checks allow control of which functions can be performed on a user-based level and record the name and date of the user making changes to the data file. Two levels of security permissions can be set in QuantaSoft RE using existing Windows Active Directory
■ Record protection prevents accidental or intentional unauthorized manipulation of data files generated with the software
■ Audit trails provide secure, computer-generated, time-stamped records to track actions that create or modify QuantaSoft RE data files
■ Electronic signatures are maintained in the audit trail
User GroupsThere are two levels of user access in QuantaSoft RE software: QuantaSoft administrator and QuantaSoft user. Administrator level access provides full software privileges, and user level access limits privileges to load, run, and visualize.
User groups of both types are created in the company domain. To access QuantaSoft RE software, a user must be a member of either group.
User authentication is required at critical points during QuantaSoft RE software use, namely when running a plate, saving a file, or exporting data (if enumerating a secure PDF).

2 | QuantaSoft Regulatory Edition Software
1 Introduction
A Windows Security box appears at each of these steps to prompt users to reenter their passwords to continue.
The following files have an embedded audit log:
■ qlps
■ qlts: can be viewed when the audit log is moved to the qlps at run time
Checksums determine if the audit trail has been compromised. Any changes affecting data are logged, including changes to well attributes or to threshold or clustering values. The log is presented for authentication each time a user runs a plate or saves or exports a data file, except at the completion of a run.

Instruction Manual | 3
2 Installation
QuantaSoft™ Regulatory Edition (RE) software is installed in the same manner as standard QuantaSoft software. However, because QuantaSoft RE provides additional security and data integrity, user groups must be created to manage user access. QuantaSoft RE cannot be launched (i) if not connected to a network using Windows Active Directory and (ii) if users have not been added to at least one of the user groups.
To install QuantaSoft Regulatory Edition software
Note: Do not install or run QuantaSoft RE software on the same computer as standard edition QuantaSoft software.
1. Before installing the software onto your computer, request the help of an IT administrator to add the two QuantaSoft user groups to your Windows domain. The IT administrator must also add the users to the these groups:
− QS Administrator — users with full access to software privileges
− QS User — users with limited access to software privileges (load, run, and visualize functions only)
2. Install the software from a local administrator account. From the Installer folder on the QuantaSoft Regulatory Edition Software disk, click setup. Click Yes when prompted to allow permission requests (this is standard Windows behavior when installing new software).
3. In the InstallShield Wizard, click Next to continue and follow the onscreen instructions. When installation is complete, click Finish.
Note: Only users added to the user groups listed above will have access to run QuantaSoft Regulatory Edition software.
4. Log in using your Windows username and password.
5. Review and accept the license agreement.

4 | QuantaSoft Regulatory Edition Software
2 Installation
Instruction Manual | 5
3 Using QuantaSoft™ Regulatory Edition Software
QuantaSoft Regulatory Edition (RE) software provides access to the three main steps of droplet analysis with one click in the left navigation bar, moving you through the entire workflow:
■ Setup — enter information about the samples, assays, and experiments (see Section 3.1)
■ Run — start the run and control the instrument, if needed (see Section 3.2)
■ Analyze — compute nucleic acid concentration (see Sections 3.3 and 3.4)
QuantaSoft RE software uses the following file types:
■ Template (*.qlts) — user-defined plate layout settings (no data) for reading a Droplet Digital™ PCR (ddPCR™) plate
■ Results (*.qlps) — user-defined plate layout settings and processed data for a ddPCR plate
Note: The .qlps and .qlts files generated by QuantaSoft RE software can be opened and read only by QuantaSoft RE software. QuantaSoft standard edition files cannot be opened with QuantaSoft RE, and regulatory edition files cannot be opened with standard edition.
■ Open nonsecure files with QuantaSoft Standard Edition software
■ Open secure files with QuantaSoft RE software
Log in to QuantaSoft RE software using your Windows username and password.
Note: Only users added to QuantaSoft user groups have access to run QuantaSoft Regulatory Edition software (see Chapter 2, Installation).

6 | QuantaSoft Regulatory Edition Software
3 Using QuantaSoft™ Regulatory Edition Software
3.1 SetupNote: You must have QuantaSoft administrator access is required for ddPCR plate setup. QuantaSoft RE software can load only plate templates that are in .qlts format. It will not load .csv or .qlt files.
QuantaSoft user access allows only loading of an existing template or .qlps file, starting or aborting a run, and analysis of data and viewing of files; it does not allow the setting of thresholds, deletion of plate attributes, or creation of templates.
To begin plate setup:
1. Click Setup to enter information about the samples, assays, and experiments.
■■ To open saved details (settings and data) from another experiment created in QuantaSoft RE, click Plate > Load and select the file
■■ To open a saved template for a plate map (settings only, no data), click Template > Load and select the file
■■ To create a new template, click Template > New
To overwrite the setup information for a plate that is open (experiment type and name, sample name, etc.), click Template > Load. In the Load template window, click Overwrite.
2. Enter the file name, then use the well editor (see Section 3.1.1) and experiment editor (see Section 3.1.2) to adjust the settings for your experiment. Click Options to access advanced options data analysis and setup (see Section 3.1.3).
QuantaSoft software Setup interface. The plate map is a diagram of the wells in the 96-well plate and contains information about the type of analysis, sample, and assay represented by that well. After a run, it also contains concentration data.
File nameOptions for advanced data analysis and setup
Load or create a template (settings only)
Plate mapAbort run or exit program
View and analyze data
Start the run
Define experiment settings
View log files
Load settings and data from previous experiments

Instruction Manual | 7
3.1 Setup
3.1.1 Using the Well EditorUse the well editor to define the settings (samples, experiment type, and detection type) for the plate. Sample and experiment types are color-coded and can be customized for easy reference in the plate map.
1. To open the well editor, double-click on the well(s) you wish to edit. Selected wells are highlighted in gray, and the well editor appears across the top of the interface.
■■ To select multiple wells, hold Ctrl and select the wells■■ To select wells in a continuous series (horizontal or vertical), hold Shift and select the
first and last wells■■ To select all wells in the plate, double-click in the top left corner of the plate■■ To select a row or column, double-click the letter or number for that row or column
2. In the Sample panel, enter the sample Name and select the Experiment from the dropdown menu.
■■ All saved experiments appear in the dropdown menu, along with the option to add experiment...
■■ The sample name is case-sensitive; only wells with identical sample names can be treated as merged wells during data analysis
■■ To create or edit an experiment, use the experiment editor (see Section 3.1.2)
3. Select the Supermix from the dropdown menu (required; selection cannot be changed after data collection).
Assay type options.
Well editor. Settings for rare event detection in a single sample are shown.
Unused — channel unused
Unknown — unknown experimental sample
Reference — reference gene or target (required for CNV, RED, or ratio calculations)
Positive — positive control
Negative — negative control
Blank — no sample; use for wells that will not be analyzed
NTC — no-template control
Reset — restore default settings
Apply — apply settings without exiting well editor
Cancel — close without saving changes
OK — save changes and close well editor

8 | QuantaSoft Regulatory Edition Software
3 Using QuantaSoft™ Regulatory Edition Software
Advanced options.
4. Define Target 1 (channel 1, the FAM channel) and Target 2 (channel 2, the VIC or HEX channel). Assign each assay a Name and sample Type.
Settings appear in the Applied Well Settings box as you enter them. When you are done, click Apply or OK to save the information. The settings appear in the well in the plate map.
Tips for QuantaSoft Administrators:You can change the selected well using the plate map without exiting the well editor.
To append sample or assay names with numbers incrementally through selected wells, select the Auto Inc checkbox next to Name.
Use standard Windows keyboard shortcuts for copying, pasting, and deleting selections (for example, use Ctrl+c to copy a selection, Ctrl+z to undo an operation).
Experiment editor. Options for a CNV experiment are shown.
Copy number options appear for CNV experiments only
Customize the color codes for experiments (for example, by experiment type, user, etc.)
3.1.2 Using the Experiment EditorQuantaSoft administrators can use the experiment editor to define the experiment type.
To open the experiment editor, select Experiment > add experiment... in the well editor or select New or Edit (then double-click on an experiment name) in the Experiments window under Setup. Four types of experiments are possible: absolute quantification (ABS), rare event detection (RED), copy number variation (CNV), and gene expression (GEX). A default list of experiments is supplied at installation, but a QuantaSoft administrator can create and save custom experiments; upgrade installations preserve current experiment lists.
Settings are summarized in the Applied Well Settings box as you enter them. Click Apply or OK to save the experiment information. The settings appear in the well in the plate map.
3.1.3 Using the Advanced Options
Click Options in the Setup window to see advanced options for data collection and analysis.
Export amplitude data for selected wells to a .csv file (one file for each well)
Select wells by row (checked) or by column (unchecked)
Set threshold display (color)

Instruction Manual | 9
3.2 Run
3.2 Run1. Click Run in the left navigation bar to start the run.
2. Enter your Windows username and password and click OK. In the audit trail, which appears for authentication, click Continue to Save....
3. In the Run Options window, select the detection chemistry:
− If a probe supermix is selected in the well editor, the probe dye sets appear. Select FAM/HEX or FAM/VIC
− If an EvaGreen supermix is selected, the EvaGreen dye set appears; the screen confirms the number of EvaGreen wells configured on the plate
Run options.
4. Up to 1 minute later, a green circle appears next to the abort button and flashes to indicate the run is in progress. Active and analyzed wells are also highlighted in green in the plate map.
5. As each well is analyzed, the data appear across the top navigation area. Once the run is complete, all data are reanalyzed for the final data file.
Well data stream Channel 1 histogram (events vs. amplitude)
Run indicator
Analyzed wells
Switch data views (charts to larger window)
Interface during an active run. Data for both detector channels are shown for the well being read.
Experiment
Conc. channel 1 unknown
Conc. channel 2 unknown
Sample name
Channel 1 (FAM) fluorescence vs. event number Channel 2 (VIC or HEX) fluorescence vs. event number
Channel 2 histogram (events vs. amplitude)

10 | QuantaSoft Regulatory Edition Software
3 Using QuantaSoft™ Regulatory Edition Software
3.3 AnalyzeIn the Setup window, load a plate (filename.qlps), then click Analyze to open and analyze the data. The data analysis interface is separated into three windows:
■ Results table — summarizes results for wells selected in the well selector
■ Well selector — enables selection of wells for targeted analysis
■ Processed data/graphical display — allows visualization of graphical data from selected wells
Data analysis interface. Data from a CNV analysis are shown.
Graphical data display
Results table Well selector
View table in graphical display window
Export data to .csv or secure .pdf file
Select data from detector channel(s) Toggle order in which channel data are displayed in the table
Display replicates separately, as merged wells (if Sample Name, Experiment, and Assay Name and Type all match across the wells), or both
Results table options. Data from a CNV analysis are shown.
Status options:
OK — automatic analysis successful
CHECK — automatic analysis unsuccessful; to view concentration, use manual analysis tools
Multi — data automatically analyzed as part of a multiwell selection
Manual — droplets analyzed manually
Y-axis display options
Copy graph to clipboard or print

Instruction Manual | 11
3.3 Analyze
3.3.1 Viewing Channel Data (1D Amplitude)Click 1D Amplitude to visualize the data collected from each channel of selected wells. Use the radio buttons to select the channels to be displayed. This tab also provides options for adjusting the thresholds used in assigning positives and negatives for each channel.
When viewing a single well, change the threshold using one of the following options:
■ Use the single-well threshold tool . The assigned threshold appears as a horizontal pink line
-Or-
■ Enter threshold values in the Set Threshold field
When viewing multiple wells, change the thresholds as follows:
■ Use the single-well threshold tool to change the threshold in a single well. Vertical yellow lines in the processed data plots show where droplet data from each well start and end, and the assigned threshold appears as a horizontal pink line
■ Use the multiwell threshold tool to change the threshold in all the wells (appears as a pink line in the plots)
■ To manually set threshold values for single or multiple wells, enter the values in the Set Threshold field below the plot and click Set Threshold or Enter
Click Auto Analyze to revert to automatic threshold settings and calculations. Threshold adjustments can also be made in the 2D Amplitude clustering plots (see Section 3.3.2).
Channel 1 vs. channel 2 clustering plot
Concentration dataPlot of measured copy numbers
Plot of # droplet events counted
Graphical data display options. A concentration plot from a CNV analysis is shown, with display options across the top.
Channel dataPlot of ratio of unknown:reference (a/b or a/[a+b])

12 | QuantaSoft Regulatory Edition Software
3 Using QuantaSoft™ Regulatory Edition Software
Channel 1 fluorescence amplitude vs. event number
Channel 2 fluorescence amplitude vs. event number
Channel 1 (FAM)histogram of events vs. amplitude
Channel 2 (VIC or HEX) histogram of events vs. amplitude
Viewing channel data for a single well. Processed data from both channels of a single well are shown. In channel 1, the single-well threshold tool is enabled (the threshold is shown by the pink line and the value in the Set Threshold field).
Channel selector
Viewing channel data for multiple wells. Processed data from both channels of multiple wells are shown. In channel 1, the single-well threshold tool is enabled (the threshold is indicated by the pink line and the value in the Set Threshold field; the status of that well in the results also shows Manual). In channel 2, the multiple threshold tool is enabled.
Threshold adjustment tool (single well)
Threshold adjustment tools
Reset automatic threshold settings
Y-axis log scale toggleThreshold settings
Channel 1 fluorescence amplitude vs. event number
Channel 2 fluorescence amplitude vs. event number
Channel 1 (FAM)histogram of events vs. amplitude
Channel 2 (VIC or HEX) histogram of events vs. amplitude
Channel selector
Reset automatic threshold settings
Y-axis log scale toggleThreshold settings

Instruction Manual | 13
3.3 Analyze
3.3.2 Viewing Clustering Plots (2D Amplitude)Click 2D Amplitude to view the channel 1 vs. channel 2 clustering plot and enable options for manually or automatically adjusting the thresholds used in assigning positives and negatives for each detection channel.
■ To reset automatic thresholds for positives and negatives, click Auto Analyze
■ To manually assign thresholds (QuantaSoft administrators only):
− Use the thresholding crosshair to assign classification regions for the whole plot (this is the only option in Heat Map mode)
− Use the ellipse, rectangle, or lasso threshold adjustment tool to classify a region of the plot. Click the tool, then click the region type in the working cluster selector. Use the tool to select the region within the plot
Tip:Mouse over any well in the well selector to preview data from that well in the clustering plot.
Viewing clustering plots. Threshold adjustment options available in the clustering plot are shown. Threshold values are indicated by the pink lines in the plot.
Threshold adjustment tools
Ch2 threshold
Ch 1 threshold
Working cluster selector
Ch1+/Ch2– Ch1+/Ch2+
Ch1–/Ch2– Ch1–/Ch2+
Ch1+/Ch2– Ch1+/Ch2+
Ch1–/Ch2+Ch1–/Ch2–
Reset automatic threshold settings
Threshold settings
Display multicolor heat map

14 | QuantaSoft Regulatory Edition Software
3 Using QuantaSoft™ Regulatory Edition Software
3.3.3 Viewing Concentration Data (Concentration)Concentration data for each target appear in the wells in the plate map and are tabulated in the results table. Click Concentration to visualize data in concentration plots. Use the radio buttons to select the channels displayed. Error bars reflect total error or Poisson 95% confidence limits. These data can be exported for analysis in other spreadsheet applications (for example, Microsoft Excel).
Toggle y-axis log scale Display data from single wells, merged data, or bothToggle x-axis values and well, name, or label display
Viewing concentration data. Data from absolute quantification are shown. Hover over data points to reveal well identity, concentration, and Poisson confidence limits. Solid data points indicate merged data; open data points (shown) indicate data from single wells.
The Copies/µL Well column displays the total amount of starting material in the ddPCR sample. The values shown reflect the product of the concentration (in copies per µL) multiplied by the 20 µl ddPCR reaction input used to make droplets. This value does not appear for merged well data.
This column is also exported in the *.csv file. The original concentration column and calculations remain unchanged.
3.3.4 Viewing Copy Number Data (Copy Number)Click Copy Number to view copy number for selected wells/samples.
Toggle well, name, or label display
Viewing copy number data. Hover over data points to reveal well identity, concentration, and Poisson confidence limits. Solid data points (not shown) indicate merged data; open data points (shown) indicate data from single wells.
Y2 Axis options:None — no Y2 axis
Ch2 — display Ch2 concentration
CNV — display copy number (CNV analysis only)
Ratio(a/b) — ratio (a/b) of unknown:reference
Fractional Abundance (a/a+b) — ratio (a/[a+b]) of unknown:reference; abundance
Inverse — inverse of ratio or fractional abundance
Select channel(s) to display

Instruction Manual | 15
3.3 Analyze
3.3.5 Viewing Ratio Data (Ratio)Click Ratio to view ratio data for selected wells/samples. Use the radio buttons to select a plot of the Ratio (unkown:reference) or Fractional Abundance (% of sample); select Inverse to apply the inverse of either.
Viewing ratio data. Data from absolute quantification are shown. Hover over data points to reveal well identity, concentration, and Poisson confidence limits. Select y log to convert the y-axis to logarithmic scale (shown). Solid data points (not shown) indicate merged data; open data points (shown) indicate data from single wells.
Toggle well, name, or label display
Select ratio or abundance plot, inverse ratios
3.3.6 Viewing Events (Events)Click Events to view the number of droplet events counted for selected wells/samples. Use the radio buttons to select the channels displayed. View positive, negative, or total droplet counts, or any combination of these.
Viewing event data. Data from a copy number variation experiment are shown.
Toggle well, name, or label display
Select events to display
Select channel(s) to display

16 | QuantaSoft Regulatory Edition Software
3 Using QuantaSoft™ Regulatory Edition Software

Instruction Manual | 17
A Ordering Information
QX200™ ddPCR™ System
Catalog # Description186-4001 QX200™ Droplet Digital™ PCR System,
includes droplet generator, droplet reader, laptop computer, software, associated component consumables
186-4002 QX200 Droplet Generator, includes droplet generator, 1 box of 24 cartridges, 1 pkg of 24 gaskets, 2 cartridge holders, 1 power cord
186-4003 QX200 Droplet Reader, includes droplet reader, ddPCR manual, 2 plate holders, USB cable, power cord
186-4007 Droplet Generator Cartridges and Gaskets, includes 5 pkg of 24 DG8™ cartridges, 5 pkg of 24 DG8 gaskets
186-4008 DG8 Cartridges for QX100™/QX200 Droplet Generator, 1 pkg of 24 cartridges
186-3009 DG8 Gaskets for QX100/QX200 Droplet Generator, 1 pkg of 24 gaskets
186-3051 DG8 Cartridge Holder
29711024 Droplet Reader Plate Holder
186-3005 Droplet Generation Oil for Probes, 10 x 7 ml
186-4005 Droplet Generation Oil for EvaGreen, 2 x 7 ml
186-4006 Droplet Generation Oil for EvaGreen, 10 x 7 ml
186-3004 ddPCR droplet Reader Oil, 2 x 1 L
ddPCR Reagents
Catalog # Description 186-3023 ddPCR Supermix for Probes (No dUTP),
2 ml (2 x 1 ml), 2x supermix
186-3024 ddPCR Supermix for Probes (No dUTP), 5 ml (5 x 1 ml), 2x supermix
186-3025 ddPCR Supermix for Probes (No dUTP), 25 ml (5 x 5 ml), 2x supermix
186-3026 ddPCR Supermix for Probes, 2 ml (2 x 1 ml), 2x supermix
186-3010 ddPCR Supermix for Probes, 5 ml (5 x 1 ml), 2x supermix
186-3027 ddPCR Supermix for Probes, 25 ml (5 x 5 ml), 2x supermix
186-3028 ddPCR Supermix for Probes, 50 ml (10 x 5 ml), 2x supermix
186-3021 One-Step RT-ddPCR Kit for Probes, 2 ml (2 x 1 ml), 200 x 20 µl reactions, 2x RT-ddPCR mix, includes 1 manganese acetate tube
186-3022 One-Step RT-ddPCR Kit for Probes, 5 ml (5 x 1 ml), 500 x 20 µl reactions, 2x RT-ddPCR mix, includes 2 manganese acetate tubes
186-4033 QX200™ ddPCR™ EvaGreen Supermix, 2 ml (2 x 1 ml), 200 x 20 µl reactions
186-4034 QX200 ddPCR EvaGreen Supermix, 5 ml (5 x 1 ml), 500 x 20 µl reactions
186-4035 QX200 ddPCR EvaGreen Supermix, 25 ml (5 x 5 ml), 2,500 x 20 µl reactions
18 | QuantaSoft Regulatory Edition Sotware
Ordering Information
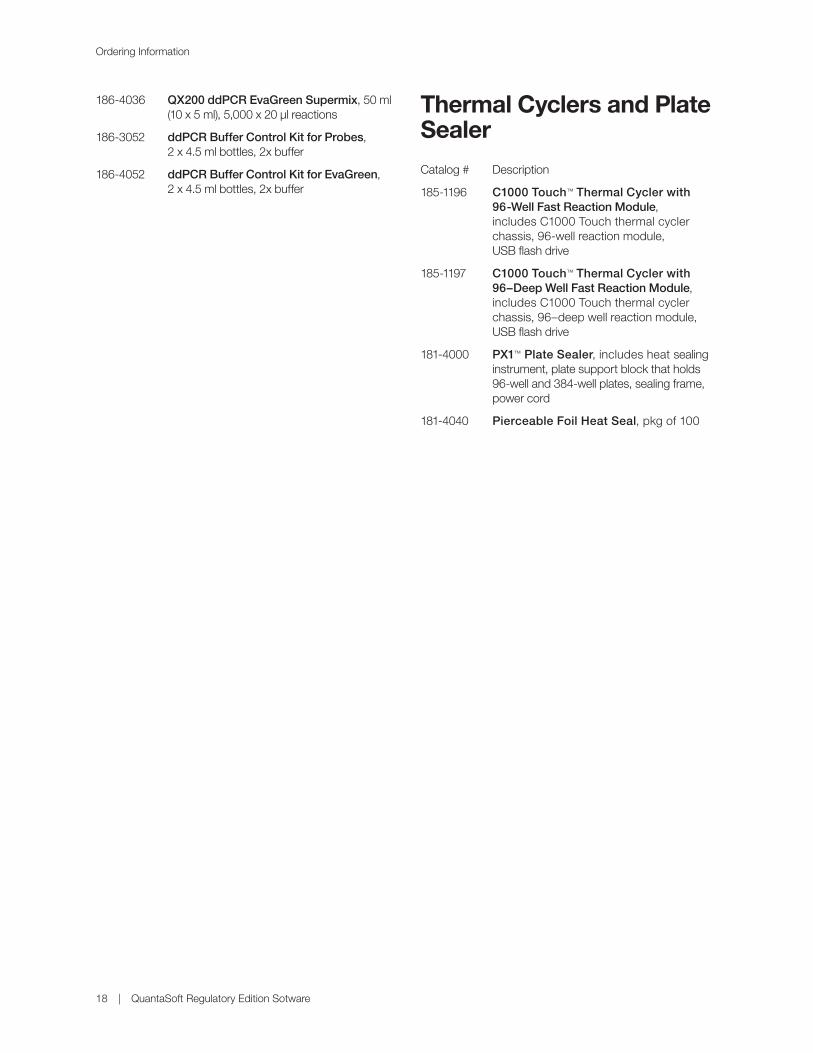
186-4036 QX200 ddPCR EvaGreen Supermix, 50 ml (10 x 5 ml), 5,000 x 20 µl reactions
186-3052 ddPCR Buffer Control Kit for Probes, 2 x 4.5 ml bottles, 2x buffer
186-4052 ddPCR Buffer Control Kit for EvaGreen, 2 x 4.5 ml bottles, 2x buffer
Thermal Cyclers and Plate Sealer
Catalog # Description
185-1196 C1000 Touch™ Thermal Cycler with 96-Well Fast Reaction Module, includes C1000 Touch thermal cycler chassis, 96-well reaction module, USB flash drive
185-1197 C1000 Touch™ Thermal Cycler with 96–Deep Well Fast Reaction Module, includes C1000 Touch thermal cycler chassis, 96–deep well reaction module, USB flash drive
181-4000 PX1™ Plate Sealer, includes heat sealing instrument, plate support block that holds 96-well and 384-well plates, sealing frame, power cord
181-4040 Pierceable Foil Heat Seal, pkg of 100

Instruction Manual | 19

20 | QuantaSoft Regulatory Edition Sotware

Instruction Manual | 21

D124049 Ver C (10047467) US/EG 0316 Sig 1215
Web site bio-rad.com USA 1 800 424 6723 Australia 61 2 9914 2800 Austria 43 1 877 89 01 177 Belgium 32 (0)3 710 53 00 Brazil 55 11 3065 7550 Canada 1 905 364 3435 China 86 21 6169 8500 Czech Republic 420 241 430 532 Denmark 45 44 52 10 00 Finland 358 09 804 22 00 France 33 01 47 95 69 65 Germany 49 89 31 884 0 Hong Kong 852 2789 3300 Hungary 36 1 459 6100 India 91 124 4029300 Israel 972 03 963 6050 Italy 39 02 216091 Japan 81 3 6361 7000 Korea 82 2 3473 4460 Mexico 52 555 488 7670 The Netherlands 31 (0)318 540 666 New Zealand 64 9 415 2280 Norway 47 23 38 41 30 Poland 48 22 331 99 99 Portugal 351 21 472 7700 Russia 7 495 721 14 04 Singapore 65 6415 3188 South Africa 27 (0) 861 246 723 Spain 34 91 590 5200 Sweden 46 08 555 12700 Switzerland 41 026 674 55 05 Taiwan 886 2 2578 7189 Thailand 66 662 651 8311 United Arab Emirates 971 4 8187300 United Kingdom 44 020 8328 2000
Bio-Rad Laboratories, Inc.
Life ScienceGroup