Quality by Design at a Biopharma CMO (Contract Manufacturing Organization)
27
Quality by Design QbD at a CMO Abhinav A. Shukla, Ph.D. Vice President Process Development & Manufacturing KBI Biopharma, Durham NC ACC/QbD Conference (Society for Biological Engineering, AIChE), Coronado Island, CA, 2013
-
Upload
kbi-biopharma -
Category
Health & Medicine
-
view
215 -
download
0
Transcript of Quality by Design at a Biopharma CMO (Contract Manufacturing Organization)
Quality by Design
QbD at a CMO
Abhinav A. Shukla, Ph.D. Vice President
Process Development & Manufacturing KBI Biopharma, Durham NC
ACC/QbD Conference (Society for Biological Engineering, AIChE), Coronado Island, CA, 2013
-Confidential-
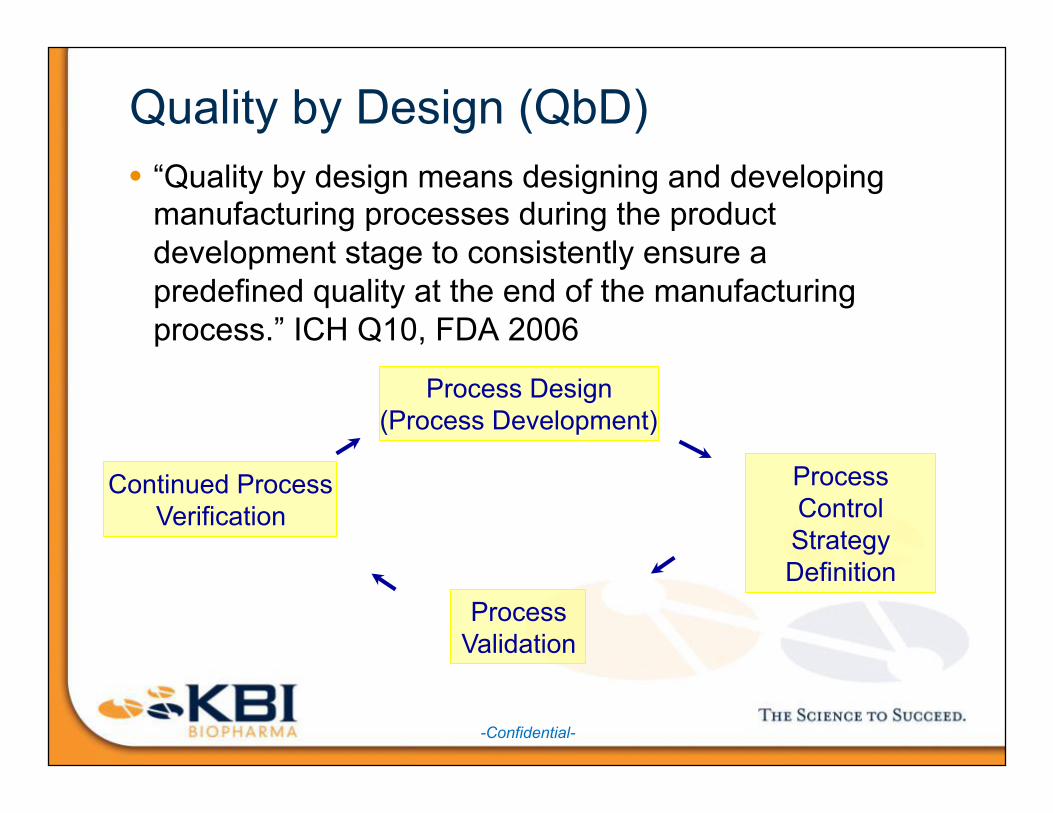
Quality by Design (QbD) • “Quality by design means designing and developing
manufacturing processes during the product development stage to consistently ensure a predefined quality at the end of the manufacturing process.” ICH Q10, FDA 2006
Process Design (Process Development)
Process Control Strategy Definition
Process Validation
Continued Process Verification

QbD
Critical Quality Attributes (CQAs)
Process Design Space
Linking CQAs to Clinical outcome

Development Phase • Utilizing the right set of analytical tools for in-process
testing and release • Characterization assays are equally important • Utilizing a broad set of tools up front gives the best
chance of determining CQAs & linking them to the process
-Confidential-
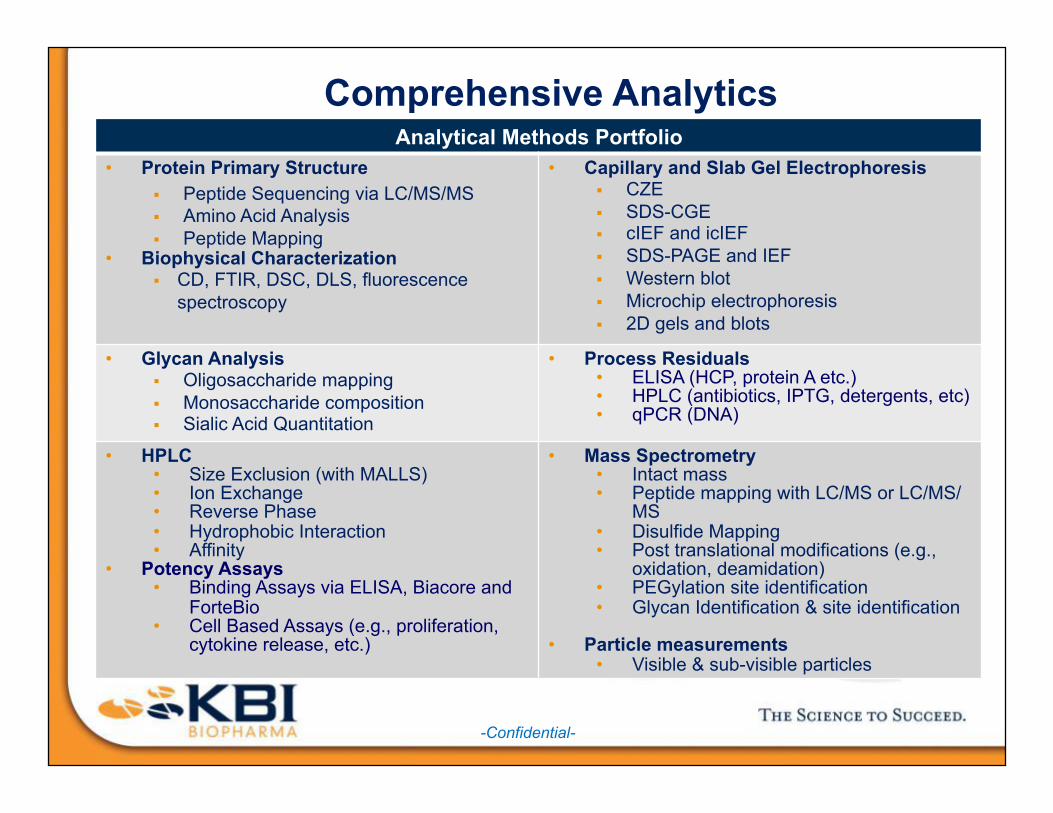
Analytical Methods Portfolio • Protein Primary Structure
§ Peptide Sequencing via LC/MS/MS § Amino Acid Analysis § Peptide Mapping
• Biophysical Characterization § CD, FTIR, DSC, DLS, fluorescence
spectroscopy
• Capillary and Slab Gel Electrophoresis § CZE § SDS-CGE § cIEF and icIEF § SDS-PAGE and IEF § Western blot § Microchip electrophoresis § 2D gels and blots
• Glycan Analysis § Oligosaccharide mapping § Monosaccharide composition § Sialic Acid Quantitation
• Process Residuals • ELISA (HCP, protein A etc.) • HPLC (antibiotics, IPTG, detergents, etc) • qPCR (DNA)
• HPLC • Size Exclusion (with MALLS) • Ion Exchange • Reverse Phase • Hydrophobic Interaction • Affinity
• Potency Assays • Binding Assays via ELISA, Biacore and
ForteBio • Cell Based Assays (e.g., proliferation,
cytokine release, etc.)
• Mass Spectrometry • Intact mass • Peptide mapping with LC/MS or LC/MS/
MS • Disulfide Mapping • Post translational modifications (e.g.,
oxidation, deamidation) • PEGylation site identification • Glycan Identification & site identification
• Particle measurements • Visible & sub-visible particles
Comprehensive Analytics
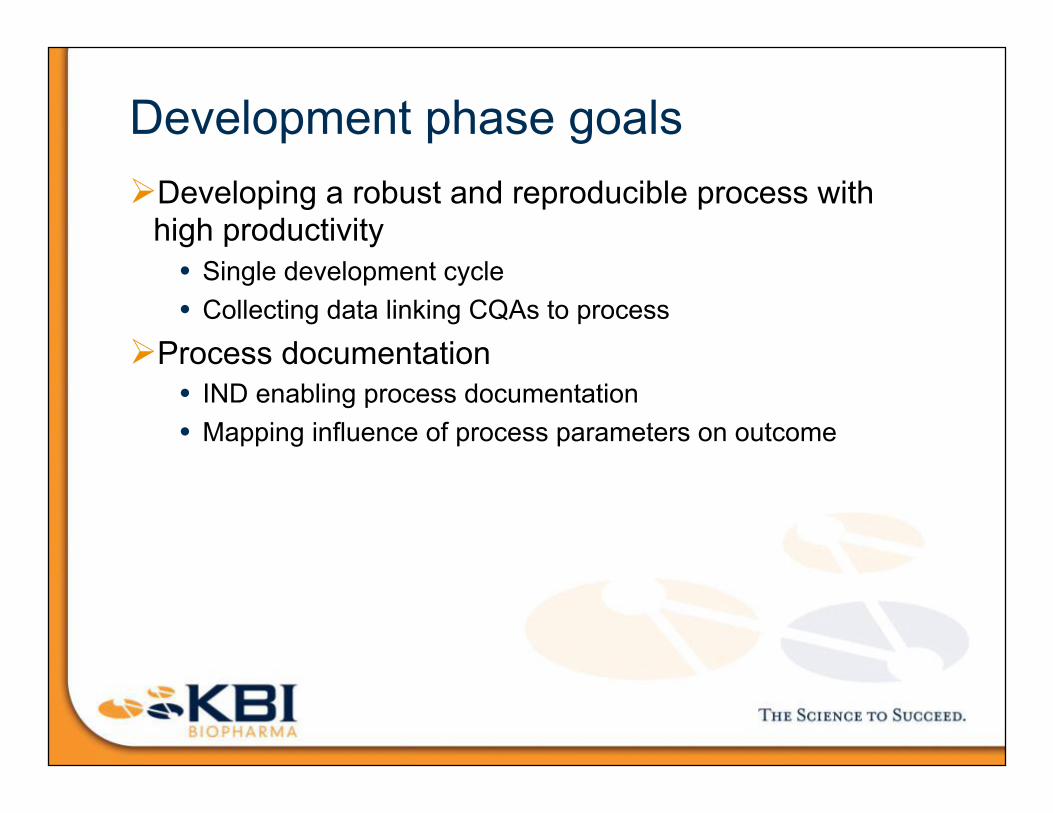
Development phase goals Ø Developing a robust and reproducible process with
high productivity • Single development cycle • Collecting data linking CQAs to process
Ø Process documentation • IND enabling process documentation • Mapping influence of process parameters on outcome
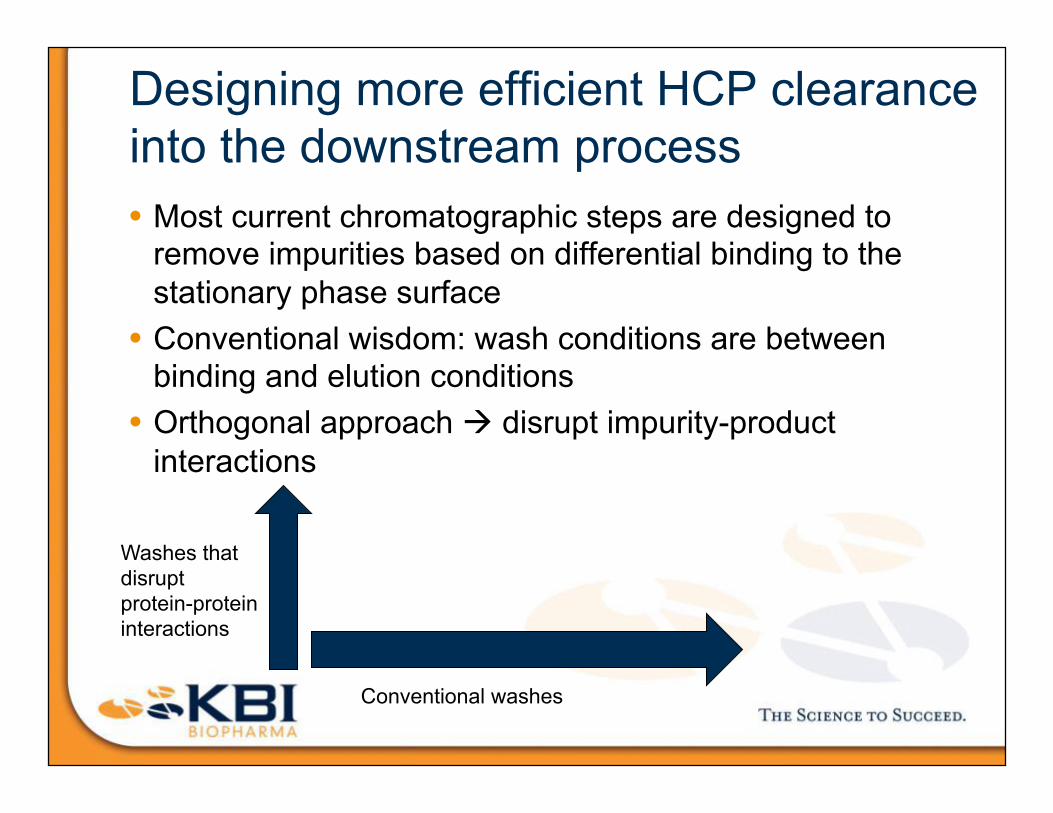
Designing more efficient HCP clearance into the downstream process • Most current chromatographic steps are designed to
remove impurities based on differential binding to the stationary phase surface • Conventional wisdom: wash conditions are between
binding and elution conditions • Orthogonal approach à disrupt impurity-product
interactions
Washes that disrupt protein-protein interactions
Conventional washes

8
Enhancing HCP clearance across Protein A • HCPs form a diverse set of impurities • HCP clearance is a key concern in biopharmaceutical
separation processes

-Confidential-
Enhancing HCP clearance across Protein A Washes can be developed to disengage HCPs from the product rather than disrupt product-Protein A ligand interactions
96
116359243
34655
935491
05000
100001500020000250003000035000400004500050000
Null supernatant MAbSelecteluate (load =
nullsupernatant)
MAbSelecteluate (load =
null supernatant+ product)
Prosep A eluate(load = null
supernatant)
Prosep A eluate(load = null
supernatant +product)
Hos
t Cel
l Pro
tein
s (n
g/m
L)
Normalized Yield vs. normalized CHOP for a variety of washes on MAbSelect Protein A
0%
20%
40%
60%
80%
100%
120%
140%
0% 20% 40% 60% 80% 100% 120%
Yield normalized to control experiment
CH
OP
(ppm
) nor
mal
ized
to
cont
rol e
xper
imen
t
Direction ofdesired trend
Biotechnology Progress, 24, 1115-1121, 2008.
Do HCPs co-elute with the product or co-associate with the product?

Enhancing HCP clearance across Protein A • Use washes at high pH (pH > 7) to preserve Protein A –
mAb interactions • Include selective modulators (moderate concentrations of
urea, ethylene glycol, salts, arginine) in washes to disrupt HCP-mAb interactions
Shukla, A., Hinckley, P. Host cell protein clearance during Protein A resin chromatography: development of an Improved wash step, Biotechnology Progress, 24, 1115-1121, 2008.
E v a lu a tio n o f in te rm e d ia te w a s h e s a t p H > 7 .0
0%
20%
40%
60%
80%
100%
120%
140%
0% 20% 40% 60% 80% 100% 120%
N o rm a liz e d yie ld % o f c o n tro l
No
rma
lize
d C
HO
P
(% o
f c
on
tro
l)

Mixed Mode Chromatography
• Takes advantage of more than one type of interaction • Can reduce process steps • Provides enhanced selectivity, “pseudo-affinity” • Several mixed mode resins have recently been developed with:
» Increased loading capacities » Higher ionic strength tolerance
+
+ +
+ + Mixed
Mode
GE Healthcare, Capto MMC ligand
Ionic interactions
Hydrophobic interactions
Hydrophobic interactions
Ionic interactions
GE Healthcare, Capto Adhere ligand

Log k’ vs Log [NaCl]
0.00
0.20
0.40
0.60
0.80
1.00
1.20
1.40
2.60 2.80 3.00 3.20 3.40 3.60
Log k'
Log [NaCl]
Lysozyme
pH 7.0
1M urea
5% ethylene glycol
50mM arginine
-‐0.40
-‐0.20
0.00
0.20
0.40
0.60
0.80
1.00
1.20
1.40
1.60
1.50 2.00 2.50
Log k'
Log [NaCl]
RNase
pH 7.0
1M urea
5% ethylene glycol
50mM arginine
-‐0.20
0.00
0.20
0.40
0.60
0.80
1.00
1.20
1.40
2.10 2.30 2.50 2.70
Log k'
Log [NaCl]
Monoclonal an6body
pH 7.0
1M urea
5% ethylene glycol
50mM arginine

Wash development on mixed mode
0
50
100
150
200
250
300
350
400
450
500
0.0% 20.0% 40.0% 60.0% 80.0% 100.0%
HCP (ppm
)
Recovery
Capto MMC HCP Clearance 25mM Tris pH 7.0 (baseline)
25mM Tris pH 7.0, 5% ethylene glycol
25mM Tris pH 7.0, 50mM arginine
25mM Tris pH 7.0, 50mM NaSCN
25mM Tris pH 7.0, 1M urea
25mM Tris pH 7.0, 1M ammonium sulfate
25mM Tris pH 7.0, 0.1M NaCl
25mM Tris pH 7.0, 0.5M ammonium sulfate
25mM Tris pH 7.0, 0.1M NaCl, 1M urea
25mM Tris pH 7.0, 0.1M NaCl, 1M urea, 5% ethylene glycol
25mM Tris pH 7.0, 0.1M NaCl, 1M urea, 5% glycerol
• Selective wash strategies can eliminate one chromatographic step in non-mAb processes • Designing quality into the process
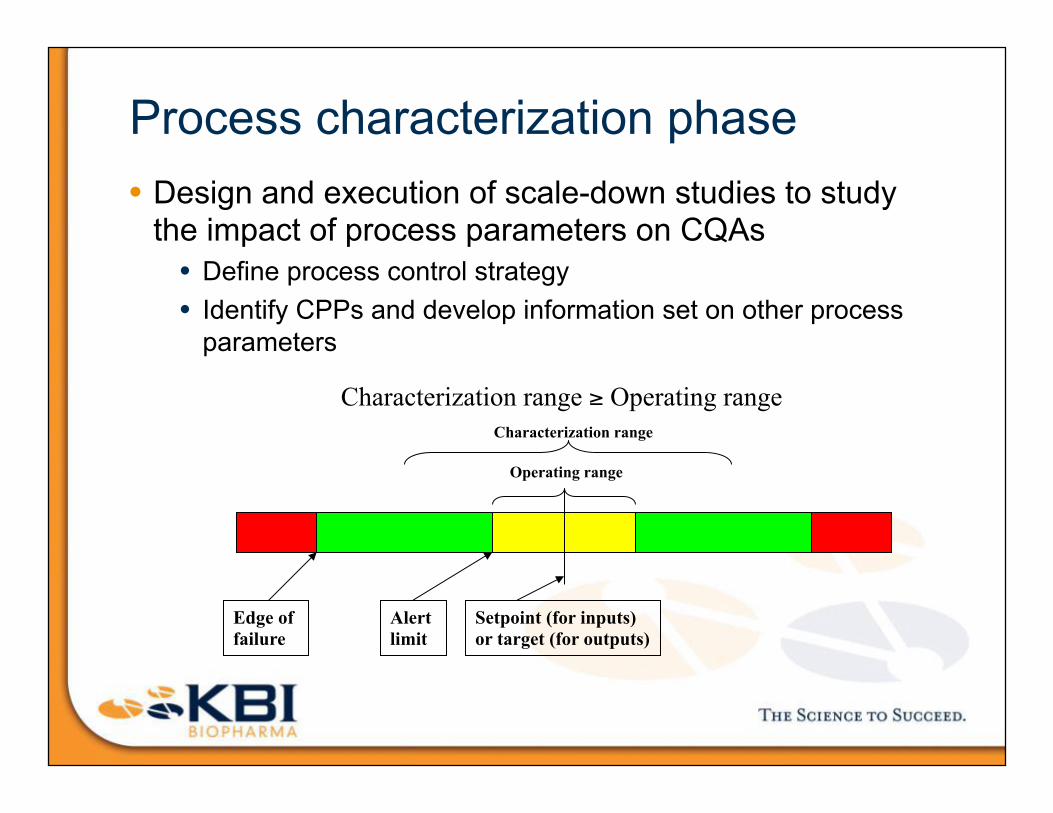
Process characterization phase • Design and execution of scale-down studies to study
the impact of process parameters on CQAs • Define process control strategy • Identify CPPs and develop information set on other process
parameters
Characterization range ≥ Operating range
Edge of failure
Alert limit
Setpoint (for inputs) or target (for outputs)
Operating range
Characterization range
-Confidential-
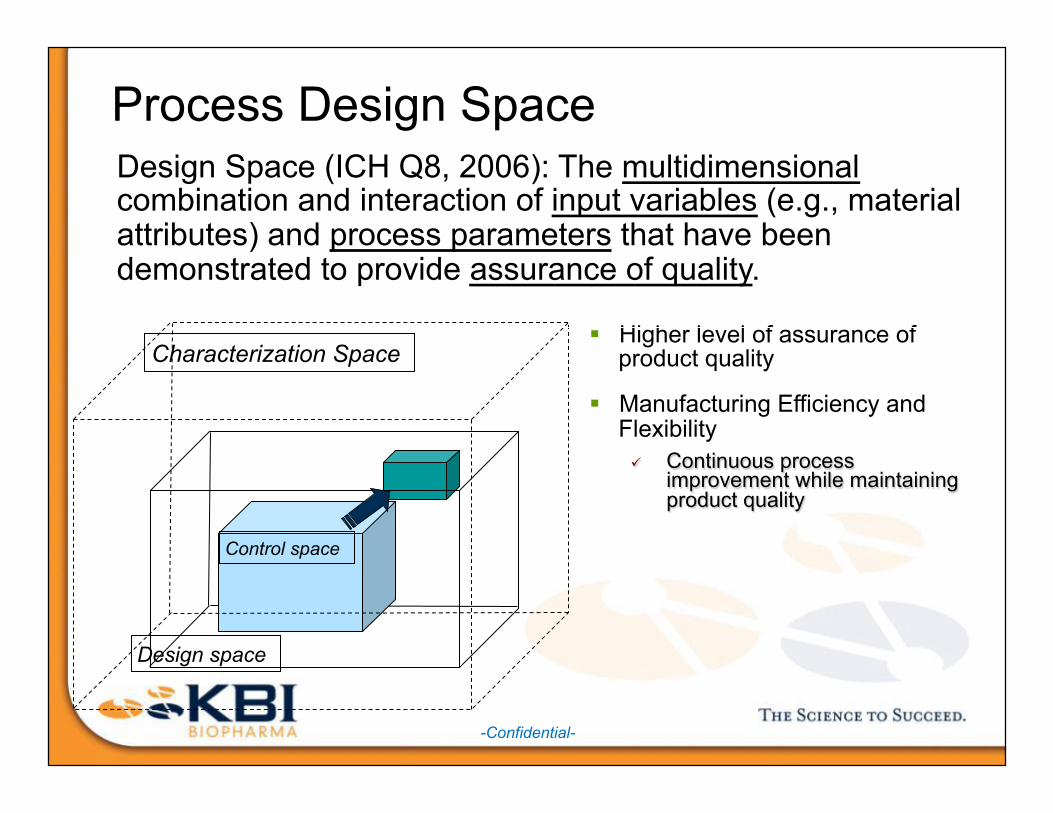
Process Design Space
§ Higher level of assurance of product quality
§ Manufacturing Efficiency and Flexibility ü Continuous process
improvement while maintaining product quality
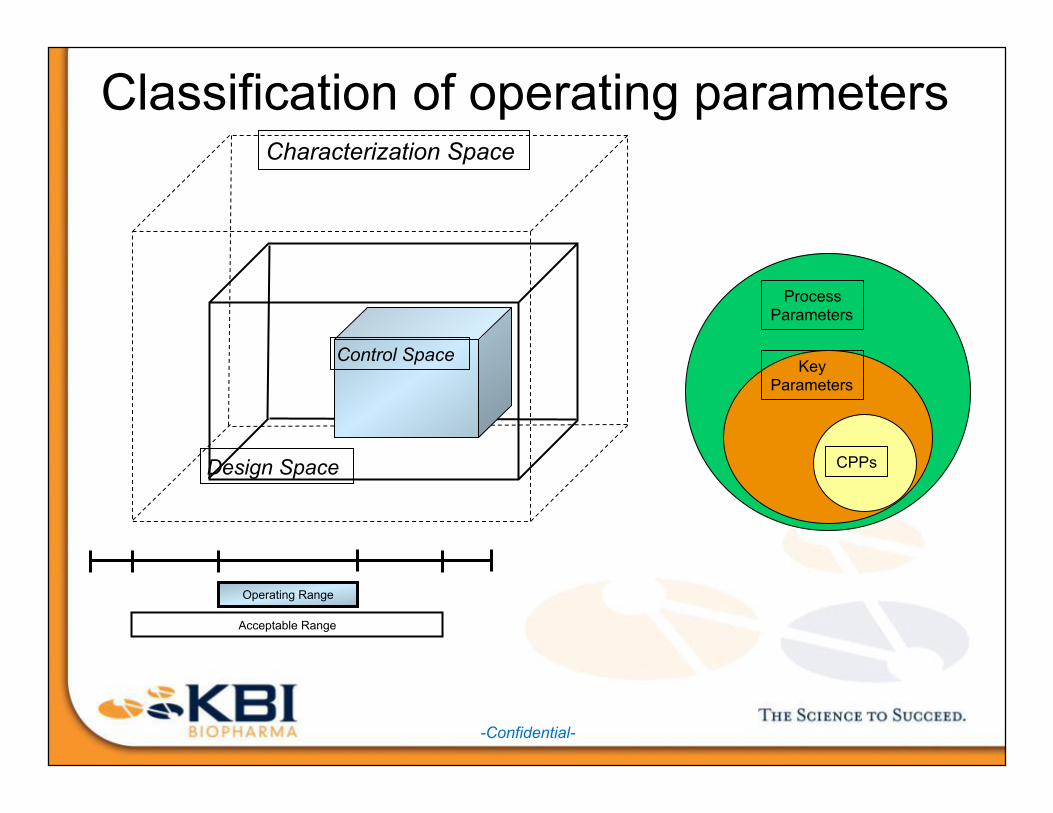
Characterization Space
Design space
Control space
Design Space (ICH Q8, 2006): The multidimensional combination and interaction of input variables (e.g., material attributes) and process parameters that have been demonstrated to provide assurance of quality.
-Confidential-
Classification of operating parameters Characterization Space
Control Space
Operating Range
Acceptable Range
Design Space
Process Parameters
Key Parameters
CPPs
-Confidential-
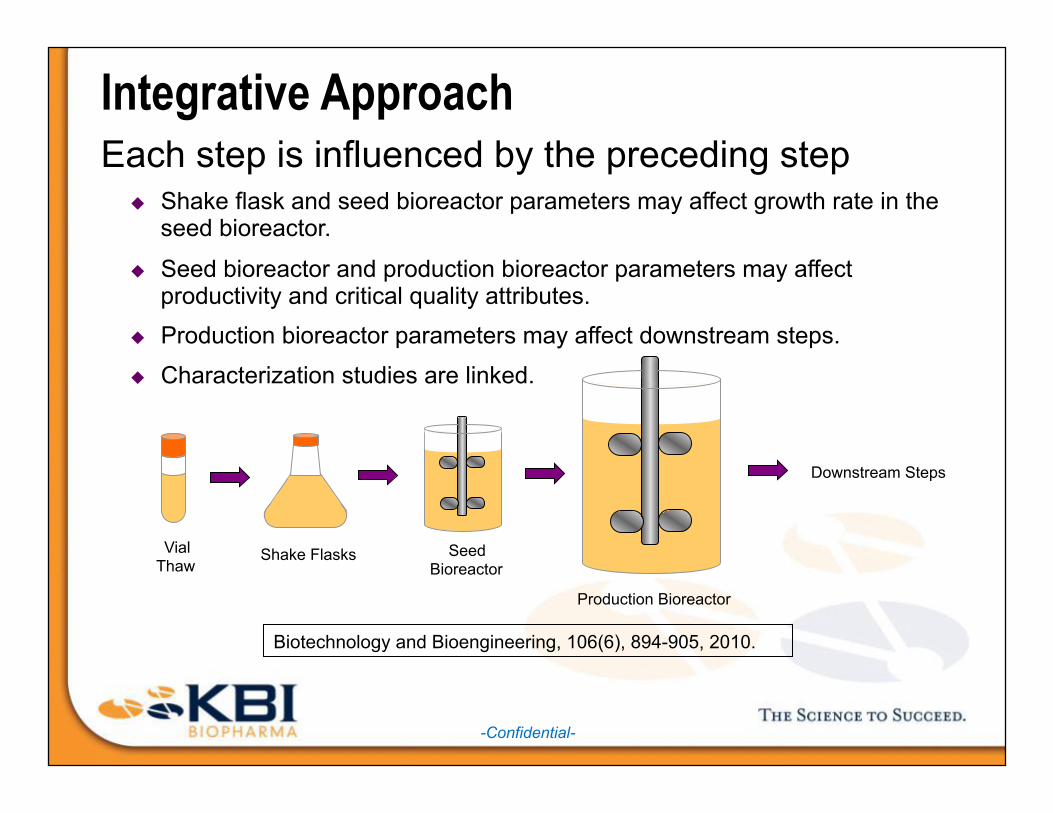
Integrative Approach Each step is influenced by the preceding step
u Shake flask and seed bioreactor parameters may affect growth rate in the seed bioreactor.
u Seed bioreactor and production bioreactor parameters may affect productivity and critical quality attributes.
u Production bioreactor parameters may affect downstream steps.
u Characterization studies are linked.
Vial Thaw
Shake Flasks Seed Bioreactor
Production Bioreactor
Downstream Steps
Biotechnology and Bioengineering, 106(6), 894-905, 2010.
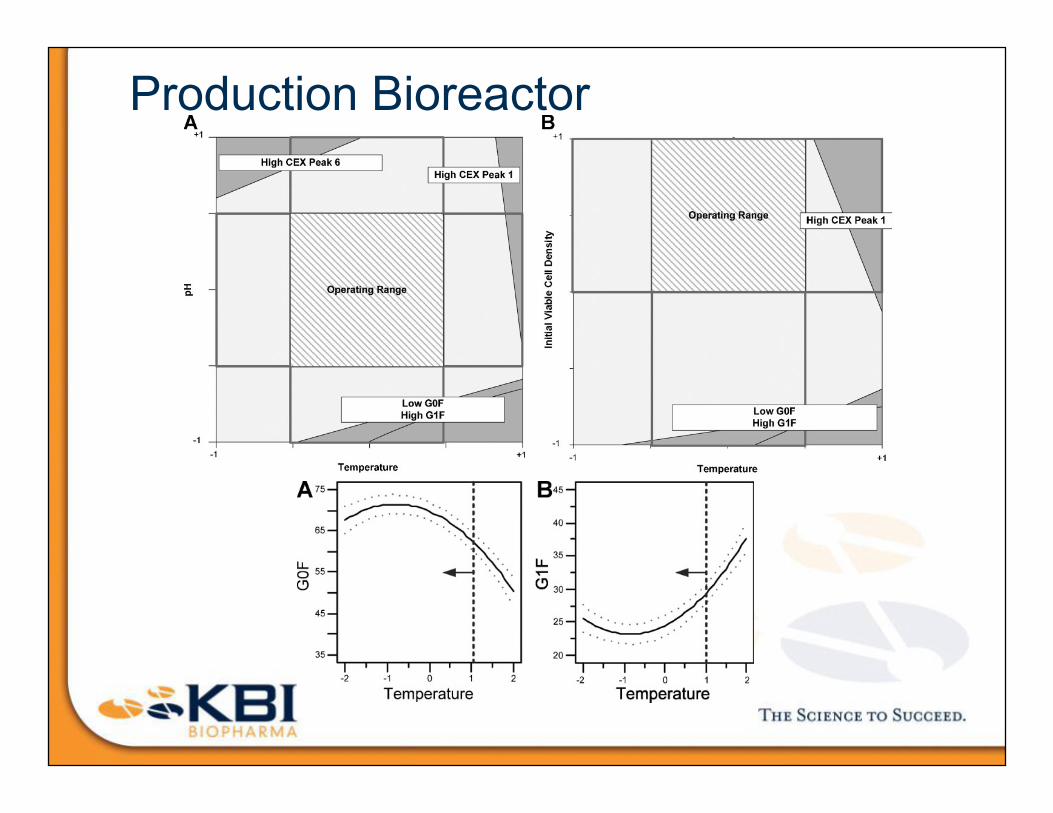
Production Bioreactor

-Confidential-
Establishing A Process Control Strategy
-Confidential-
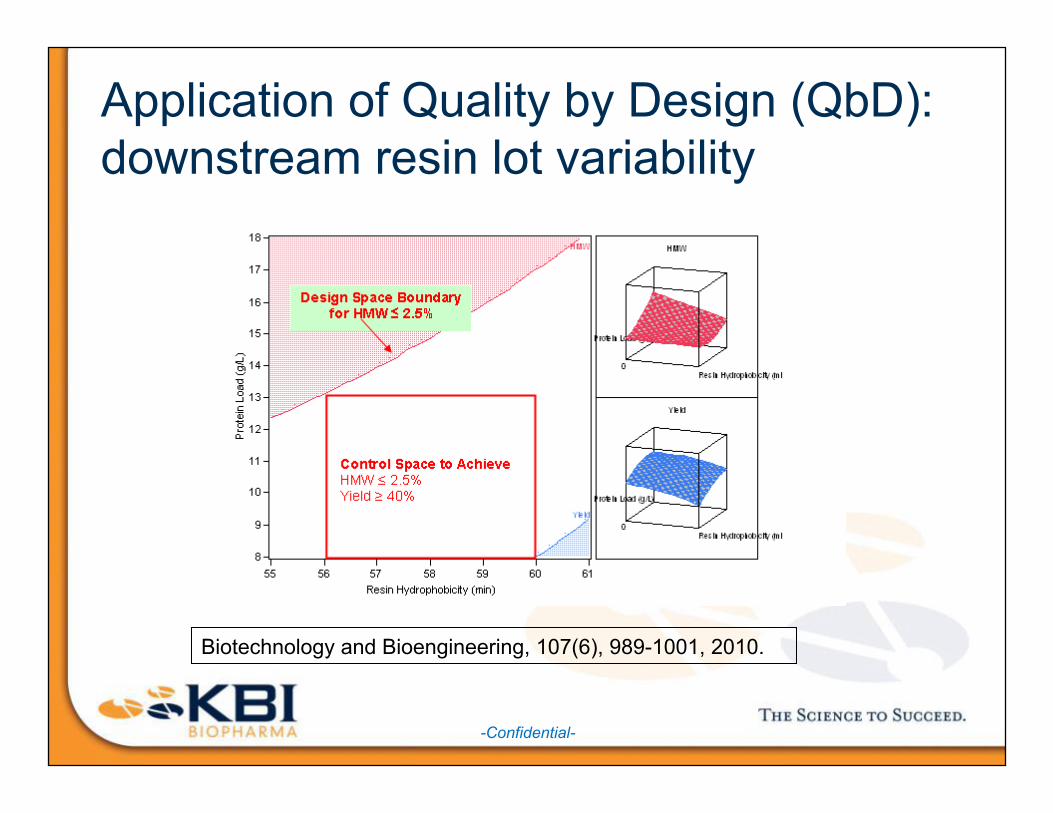
Application of Quality by Design (QbD): downstream resin lot variability
Biotechnology and Bioengineering, 107(6), 989-1001, 2010.
-Confidential-
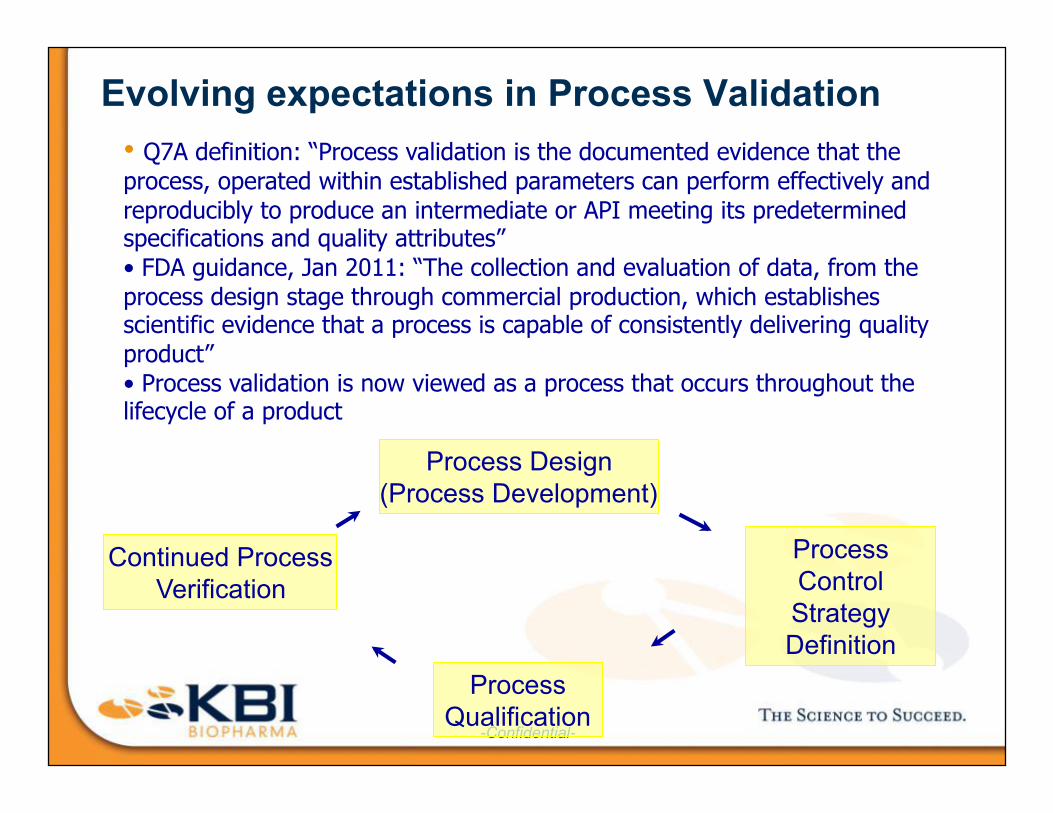
Evolving expectations in Process Validation
• Q7A definition: “Process validation is the documented evidence that the process, operated within established parameters can perform effectively and reproducibly to produce an intermediate or API meeting its predetermined specifications and quality attributes” • FDA guidance, Jan 2011: “The collection and evaluation of data, from the process design stage through commercial production, which establishes scientific evidence that a process is capable of consistently delivering quality product” • Process validation is now viewed as a process that occurs throughout the lifecycle of a product
Process Design (Process Development)
Process Control Strategy Definition
Process Qualification
Continued Process Verification
Scale-Down Process Validation Studies
• Scale-down validation studies in addition to large-scale process validation (conformance lots) • Probe extremes in the process and demonstrate them
to be acceptable • Examples
• Reprocessing validation – combine hold times with process conditions that create the greatest stress on the protein
• Intermediate hold times – combine hold times and demonstrate releasable drug substance
• Viral clearance studies • Impurity clearance studies

-Confidential-
Validation of Host Cell Protein Clearance
Harvest
Column 1
Column 2
Column 3
Worst-case C1 eluate
Worst-case C2 eluate
Harvest
Column 1
Column 2
Column 3
Harvest
Column 1
Column 2
Column 3
Spiking Strategy • Some CHOP species in harvest
may not be encountered by C2 and C3 in Mfg
• LVR could be overstated for C2 and C3
Worst-case Strategy • CHOP species in eluate is relevant
to the next step • More accurate evaluation of LRV • Need process characterization to
identify worst-case condition
By-pass Strategy • HCP species in load are relevant to
that process step in case the previous step is by-passed (e.g. “resin bed channeling”)
• Represents most “challenged” scenario
Biotechnol. Progr., 24(3), 615 – 622, 2008
Worst-case harvest
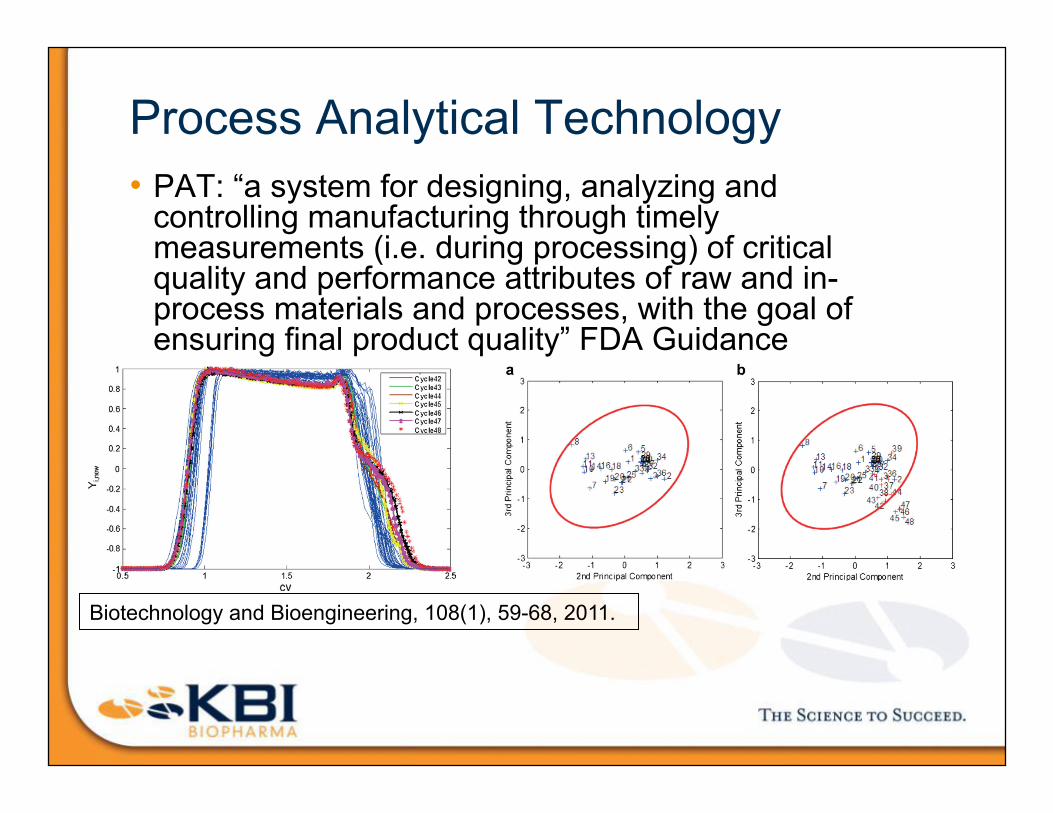
Process Analytical Technology • PAT: “a system for designing, analyzing and
controlling manufacturing through timely measurements (i.e. during processing) of critical quality and performance attributes of raw and in-process materials and processes, with the goal of ensuring final product quality” FDA Guidance
Biotechnology and Bioengineering, 108(1), 59-68, 2011.
-Confidential-
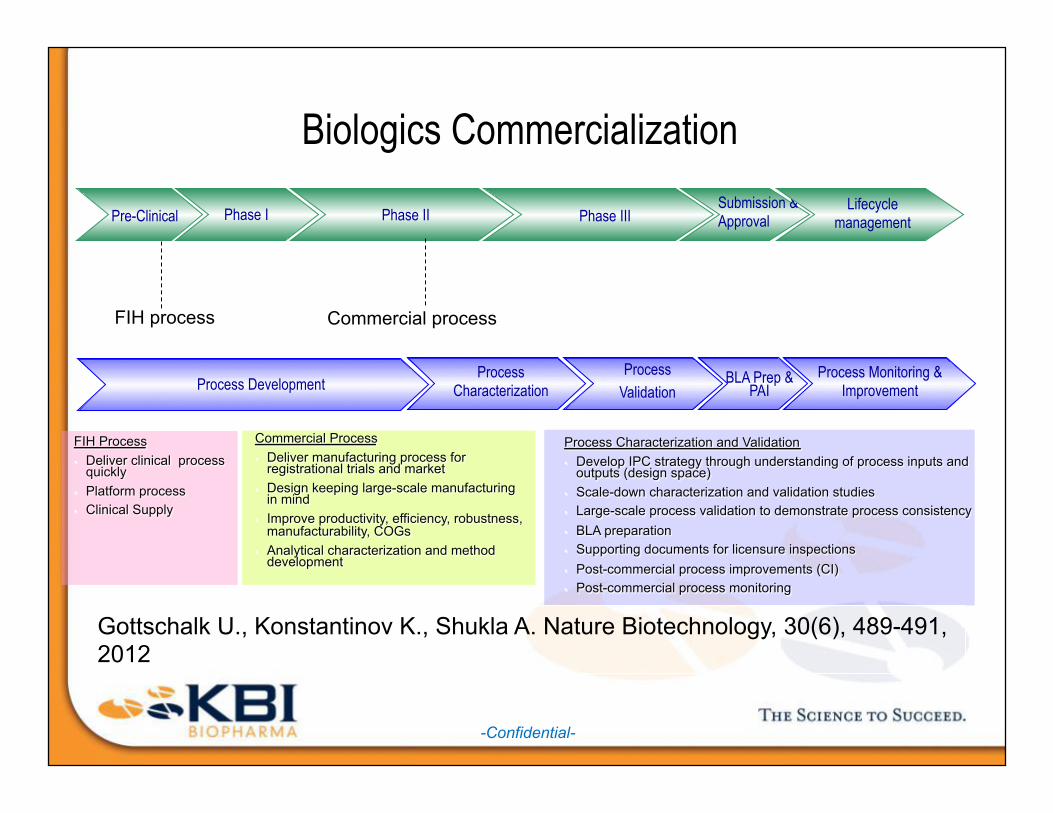
Biologics Commercialization
Pre-Clinical Phase I Phase II Phase III
Process Development Process
Characterization Process
Validation Process Monitoring &
Improvement
FIH Process • Deliver clinical process
quickly • Platform process • Clinical Supply
Submission & Approval
Lifecycle management
BLA Prep & PAI
Commercial Process • Deliver manufacturing process for
registrational trials and market • Design keeping large-scale manufacturing
in mind • Improve productivity, efficiency, robustness,
manufacturability, COGs • Analytical characterization and method
development
Process Characterization and Validation • Develop IPC strategy through understanding of process inputs and
outputs (design space) • Scale-down characterization and validation studies • Large-scale process validation to demonstrate process consistency • BLA preparation • Supporting documents for licensure inspections • Post-commercial process improvements (CI) • Post-commercial process monitoring
FIH process Commercial process
Gottschalk U., Konstantinov K., Shukla A. Nature Biotechnology, 30(6), 489-491, 2012
Why a CMO can lead to a stronger QbD package
• Expertise in developing, scaling up and operating processes for a wide variety of product types (mAbs, enzymes, cytokines, vaccines, novel scaffolds) • Focused expertise in analytical and process
development & cGMP manufacturing • Can lend experience from other programs so the
outcome is not a one-off exercise • Can complement client’s internal efforts on linking
CQAs to clinical outcome • Flexibility towards owning studies vs. executing them • Can help overcome resource crunch for a client
Conclusions • QbD guidance has evolved FDA expectations on what
is included in licensure filings • Increased emphasis on process understanding as a
basis for control • Increased emphasis on demonstrating control through
scale-down experimentation rather than conformance lots alone • Increased emphasis on understanding and mapping
process design space


![2010-11 - Live Stock Market updates for S&P BSE SENSEX ...€¦ · The Global Pharma outsourcing [Contract Research Organisation (CRO) & Contract Manufacturing (CMO)] market which](https://static.fdocuments.net/doc/165x107/5ed1c4241e37ad23791bf228/2010-11-live-stock-market-updates-for-sp-bse-sensex-the-global-pharma.jpg)