Quality at every step. - Polaris Bank Limited
187
Transcript of Quality at every step. - Polaris Bank Limited


Qualityat everystep.

MISSION
We will leverage our
knowledge of an ever -
changing world to
design innovative
solutions that
facilitate our customers'
enterprise

VISION
To be the preferred partner
providing superior financial
solutions for our customers
VALUES
Boldness
Sustainability
Innovative
Continous Learning
Trustworthy

POLARIS BANK ANNUAL REPORT & FINANCIAL STATEMENTS 2019
4
TABLE
of contents
NOTICE OF ANNUAL GENERAL MEETING 5
RESULTS AT A GLANCE 6
DIRECTORS AND ADVISERS 7
CORPORATE GOVERNANCE REPORT 9
SUSTAINABILITY REPORT 17
CHAIRMAN’S STATEMENT 26
MANAGING DIRECTOR’S STATEMENT 31
PROFILE OF DIRECTORS 39
REPORT OF THE DIRECTORS 44
REPORT OF THE INDEPENDENT CONSULTANT 47
STATEMENT OF DIRECTORS' RESPONSIBILITIES 48
INDEPENDENT AUDITOR’S REPORT 50
STATEMENT OF COMPREHENSIVE INCOME 56
STATEMENT OF FINANCIAL POSITION 57
STATEMENT OF CHANGES IN EQUITY 58-61
STATEMENT OF CASHFLOWS 62
NOTES TO THE FINANCIAL STATEMENTS 63-156
MANAGEMENT TEAM 159
PRODUCTS & SERVICES 162-174
CORPORATE DIRECTORY 176-182
PROXY FORM 183

POLARIS BANK ANNUAL REPORT & FINANCIAL STATEMENTS 2019
5
Date: May 28, 2020
Venue: The Head Office, Polaris Bank Limited 3, Akin Adesola Street, Victoria Island, Lagos.
Time: 11:00a.m.
ORDINARY BUSINESS
The following businesses will be transacted at the meeting as ordinary businesses:
1. To receive and consider the Audited Financial Statements for the period from September 21 to December 31,2018 and year
ended December 31,2019, together with the Reports of the Directors and Auditors, respectively
2. To re-elect Directors.
3. To appoint Messrs. PricewaterhouseCoopers as the Bank's Auditors.
4. To authorize the Directors to fix the remuneration of the Auditors.
SPECIAL BUSINESS
The following business will be transacted at the meeting as a special business:
5. To fix the Directors' fees for the year ending December 31, 2020 .
PROXY
A person entitled to attend and vote at the meeting is entitled to appoint a proxy to attend and vote in his / her stead. A proxy need not
be a member of the company. To be valid, the proxy form must be duly signed by the shareholder and stamped at the Stamp Duties
office and returned to the Company Secretariat of the Bank at 3, Akin Adesola Street, Victoria Island, Lagos, not less than 48 hours
before the date and time scheduled for the meeting.
NOTICE OF
annual generalmeeting
NOTICE IS HEREBY GIVEN to you that the Annual General Meeting of
Polaris Bank Limited will hold as follows:
BY THE ORDER OF THE BOARD
BABATUNDE OSIBODUGENERAL COUNSEL/COMPANY SECRETARYFRC/2016/NBA/000000154643, Akin Adesola Street, Victoria Island, Lagoswww.polarisbanklimited.com

POLARIS BANK ANNUAL REPORT & FINANCIAL STATEMENTS 2019
6
RESULTS AT A
glance
GROSS EARNINGS PROFIT BEFORE TAX PROFIT AFTER TAX
N150.36 billion N27.34 billion N26.29 billion
(All amounts in millions of Naira unless otherwise stated)
31 December
2019
21 September - 31
December
2018
31 December
2019
21 September - 31
December
2018
Major Income Statement items
Gross Earnings 150,361 37,392 150,848 37,392
Profit Before Tax 27,342 2,456 27,829 2,456
Profit After Tax 26,290 2,856 27,350 2,431
31 December
2019
31 December
2018
31 December
2019
31 December
2018
Major Statement of Financial Position items
Loans and Advances to customers 188,738 340,050 188,738 340,050
Deposits from customers 857,885 861,044 857,885 861,044
Total Assets 1,156,644 1,168,658 1,143,266 1,150,095
Total Liabilities 1,069,754 1,109,901 1,060,277 1,097,133
GROUP BANK
GROUP BANK

POLARIS BANK ANNUAL REPORT & FINANCIAL STATEMENTS 2019
7
DIRECTORS AND
advisersDIRECTORS APPOINTED BY CENTRAL BANK OF NIGERIA
DIRECTOR CAPACITY
1 Mr. Muhammad K. Ahmad, OON Chairman/Non-Executive Director
2 Mr. Adetokunbo M. Abiru Managing Director/CEO
3 Alhaji Abdullahi M. Umar Non-Executive Director
4 Mr. Austin E. Jo-Madugu Non-Executive Director
5 Mr. Bata G. Wakawa Non-Executive Director
6 Mr. Olu O. Odugbemi Non-Executive Director
7 Mr. Abdullahi S. Mohammed Executive Director
8 Mr. Innocent C. Ike Executive Director
GENERAL COUNSEL/
COMPANY SECRETARYMr. Babatunde Osibodu
FRC/2016/NBA/00000015464
REGISTERED OFFICE 3, Akin Adesola Street, Victoria Island,
Lagos
WEBSITE www.polarisbanklimited.com
TELEPHONE +(234) -1- 2701600
Landmark Towers
5B Water Corporation Drive,
Victoria Island, Lagos
www.pwc.com/ng
AUDITORS
PricewaterhouseCoopers
(Chartered Accountants)

CORPORATE GOVERNANCE REPORT
8

POLARIS BANK ANNUAL REPORT & FINANCIAL STATEMENTS 2019
9
As a private limited liability company, the Bank is required to
adhere to the CBN Code of Corporate Governance for Banks and
Discount Houses in Nigeria 2014, and more recently, the new
Nigerian Code of Corporate Governance 2018. As it continues to
institutionalise sound Corporate Governance, the Bank remains
committed to ensuring compliance with these Corporate
Governance regulations as well as other best practices.
Board Structure & Composition
The Board of Polaris Bank was appointed at the inception of the
Bank on September 21, 2018. As at December 31, 2019, the Board
was composed of eight (8) members. Five (5) of them were Non-
Executive Directors (NEDs) including the Chairman and the other
three (3) were Executive Directors (EDs), including the Managing
Director/Chief Executive Officer. Its members have varied
experiences in Finance and Accounting, Banking, Public Service,
Strategy & Innovation, Business Entrepreneurship, Risk
Management and Governance amongst others.
The positions of the Chairman and the Managing Director are
separate and held by two individuals, thereby ensuring that no
one individual has unfettered powers of decision making. The
Chairman provides overall leadership and direction to the Board.
His primary responsibility is to ensure effective operation of the
Board towards achieving the Bank’s strategic objectives,
including enhancing shareholder value. The Managing
Director/Chief Executive Officer is the Head of Management and
is responsible for the day-to-day management of the Bank
toward achieving its corporate objectives.
Furthermore, in the interest of safeguarding the objectivity and
independence of the Board, there are no two members of the
same family on the Board concurrently.
No changes took place in the structure of the Board during the
2019 Financial Year.
Roles and Responsibilities of the Board
The Board provides leadership and vision to the Company in a
manner that will enhance Shareholder value and ensure that the
Bank’s long-term vision is realised. Some decisions are reserved
for the Board, such as approval of corporate strategy and annual
budgets, approval of policies, risk management strategy,
succession planning and the appointment , training,
remuneration and replacement of Board members and senior
Management amongst others. The roles and responsibilities of
the Board are outlined below:
CORPORATE
governance reportFOR THE YEAR ENDED 31 DECEMBER 2019
A culture of alignment with sound Corporate Governance practices is pivotal to the success,and survival of an enterprise. Polaris Bank recognises this, and therefore ensures thatthere are effective governance policies, practices and structures in place to guide theaffairs of the enterprise. The activities of the organisation, including oversight byManagement and the Board of Directors are carried out in a manner consistent with theCorporate Governance principles of Fairness, Probity, Accountability, Responsibility, andTransparency.
The Chairman provides overall leadership and direction to the Board.

POLARIS BANK ANNUAL REPORT & FINANCIAL STATEMENTS 2019
10
. Defining levels of materiality, reserving specific powers
to itself and delegating other matters within authority
to Management;
. Retention of full and effective control over the Bank
and monitoring Management’s implementation of
Board plans and strategies;
. Ensuring ethical behaviour and compliance with
relevant laws and regulations, audit and accounting
principles, and the Bank’s governing documents;. Striving to act above and beyond the minimum
requirements and benchmark of international best
practices;
. Ensuring a healthy balance of the interests of all the
Bank’s relevant stakeholders;
. Being aware of, and committing to, the underlying
principles of good governance; and
. Approval of specific financial and non-financial
objectives and policies proposed by Management.
Appointment, Induction and Training of Board Members
The criteria for the appointment of members to the Board are laid
down in the Board Succession Planning Policy which is a formal,
transparent and rigorous process. New members are selected
based on their wealth of experience, relevant leadership skills,
integrity, meeting the fit and proper person criteria and
competence amongst others . The process of Board
appointments is not concluded until the nominees are duly
appointed/approved by the Central Bank of Nigeria (CBN) and
ratified by Shareholders in general meeting
Upon appointment to the Board, Directors are taken through a
formal induction process which is anchored by the Company
Secretary. The induction process is targeted at facilitating their
understanding of the Bank and the environment and markets in
which it operates. As part of the induction programme, Board
members are provided access to various materials such as
corporate information of the Bank, Minutes of Board and Board
Committee meetings, as well as Annual Reports and Accounts.
This is then followed by interactive sessions with key Senior
Management staff to deepen the Directors’ understanding of the
materials provided.
The Bank appreciates the crucial importance of continuous
learning to the effectiveness of the Board in the discharge of its
functions. Board members are therefore provided with relevant
training programmes.
Board Evaluation
In line with Corporate Governance regulations and best practices
in Corporate Governance, the Bank has a formal process for the
evaluation of the Board. Annually, an independent consultant is
engaged to conduct a performance evaluation of the Board as a
whole, its Committees, the Chairman and individual Directors.
The appraisal process involves a benchmark of the Bank’s
existing governance documentation, structure and practices,
with relevant Corporate Governance regulations and best
practices to enable the identification of governance gaps, one-
on-one interview sessions with the Directors, 360 degree
appraisal process for directors, and feedback sessions with the
Chairman, the Chief Executive Officer and the Company
Secretary.
The Board has engaged an independent consultant, KPMG
Professional Services, to carry out the annual Board and
Individual Performance Appraisal for the 2019 financial year.
The report of the Appraisal will be presented to the Bank’s
shareholders, and a copy will be sent to the Central Bank of
Nigeria (CBN) in line with regulation.
Shareholders
Polaris Bank is a private limited liability company, wholly owned
by the Assets Management Corporation of Nigerian, an agency of
the CBN.
The Board and Management of the Bank ensures an open line of
communication and full disclosure of all matters relating to the
Bank’s operations to AMCON and obtains approval of the agency
where required. The first Annual General Meeting (AGM) of the
Bank will be held in May 2020.
The Company Secretary
The Company Secretary is accountable to the Board as a whole
and advises the Board through the Chairman and the Managing
Director on all matters of governance, including their duties. He
ensures that the Board receives relevant information, including
agenda and documents for consideration at the Board and
Board Committee meetings. The Company Secretary ensures
that the Bank is in compliance with all regulatory and statutory
requirements.
CORPORATE GOVERNANCE REPORT
POLARIS BANK ANNUAL REPORT & FINANCIAL STATEMENTS 2019
11
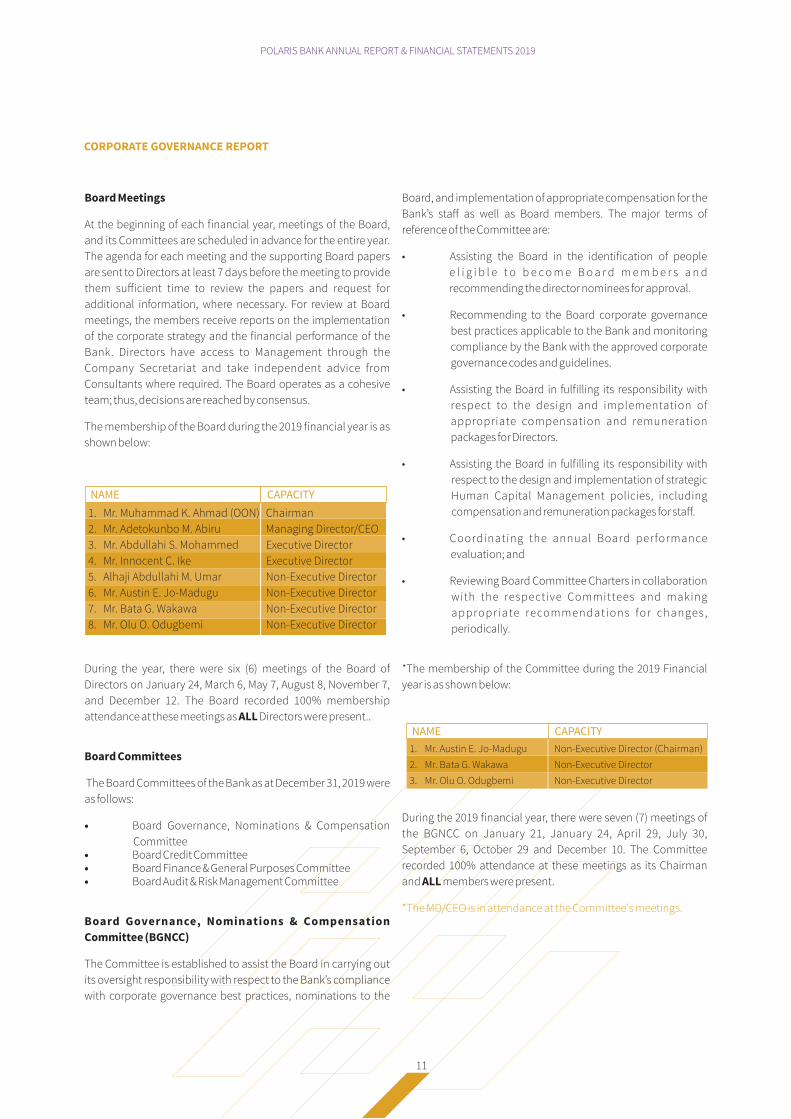
Board Meetings
At the beginning of each financial year, meetings of the Board,
and its Committees are scheduled in advance for the entire year.
The agenda for each meeting and the supporting Board papers
are sent to Directors at least 7 days before the meeting to provide
them sufficient time to review the papers and request for
additional information, where necessary. For review at Board
meetings, the members receive reports on the implementation
of the corporate strategy and the financial performance of the
Bank. Directors have access to Management through the
Company Secretariat and take independent advice from
Consultants where required. The Board operates as a cohesive
team; thus, decisions are reached by consensus.
The membership of the Board during the 2019 financial year is as
shown below:
During the year, there were six (6) meetings of the Board of
Directors on January 24, March 6, May 7, August 8, November 7,
and December 12. The Board recorded 100% membership
attendance at these meetings as ALL Directors were present..
Board Committees
The Board Committees of the Bank as at December 31, 2019 were
as follows:
• Board Governance, Nominations & Compensation
Committee • Board Credit Committee • Board Finance & General Purposes Committee • Board Audit & Risk Management Committee
Board Governance, Nominations & Compensation
Committee (BGNCC)
The Committee is established to assist the Board in carrying out
its oversight responsibility with respect to the Bank’s compliance
with corporate governance best practices, nominations to the
Board, and implementation of appropriate compensation for the
Bank’s staff as well as Board members. The major terms of
reference of the Committee are:
• Assisting the Board in the identification of people
e l i g i b l e t o b e c o m e B o a r d m e m b e r s a n d
recommending the director nominees for approval.
• Recommending to the Board corporate governance
best practices applicable to the Bank and monitoring
compliance by the Bank with the approved corporate
governance codes and guidelines.
• Assisting the Board in fulfilling its responsibility with
respect to the design and implementation of
appropriate compensation and remuneration
packages for Directors.
• Assisting the Board in fulfilling its responsibility with
respect to the design and implementation of strategic
Human Capital Management policies, including
compensation and remuneration packages for staff.
• Coordinating the annual Board performance
evaluation; and
• Reviewing Board Committee Charters in collaboration
with the respective Committees and making
appropriate recommendations for changes,
periodically.
*The membership of the Committee during the 2019 Financial
year is as shown below:
During the 2019 financial year, there were seven (7) meetings of
the BGNCC on January 21, January 24, April 29, July 30,
September 6, October 29 and December 10. The Committee
recorded 100% attendance at these meetings as its Chairman
and ALL members were present.
*The MD/CEO is in attendance at the Committee's meetings.
CORPORATE GOVERNANCE REPORT
1. Mr. Muhammad K. Ahmad (OON) Chairman
2. Mr. Adetokunbo M. Abiru Managing Director/CEO
3. Mr. Abdullahi S. Mohammed Executive Director
4. Mr. Innocent C. Ike Executive Director
5. Alhaji Abdullahi M. Umar Non-Executive Director
6. Mr. Austin E. Jo-Madugu Non-Executive Director
7. Mr. Bata G. Wakawa Non-Executive Director
8. Mr. Olu O. Odugbemi Non-Executive Director
NAME CAPACITY
1. Mr. Austin E. Jo-Madugu Non-Executive Director (Chairman)
2. Mr. Bata G. Wakawa Non-Executive Director
3. Mr. Olu O. Odugbemi Non-Executive Director
NAME CAPACITY

POLARIS BANK ANNUAL REPORT & FINANCIAL STATEMENTS 2019
12
Board Credit Committee (BCC)
The Committee is established to assist the Board in carrying out
its oversight responsibility with respect to the Bank’s credit policy
and reviewing all credits in excess of the limits delegated to
Management. It also recommends those above its approval limit
to the Board for approval. The major terms of reference include
the following:
• Reviewing the Bank’s Credit Policy, including defining
levels and limits of lending authority, and making
recommendations accordingly to the Board for
approval.
• Considering and approving credits in excess of
Management limits but within the limits set by the
Board and recommending those above its limit to the
Board for approval.
• Considering and approving all insider-related credit
applications, irrespective of the size, up to its approval
limit and recommending those above its limit to the
Board for approval.
• Considering and approving write-offs in excess of
Management limits but within the limits set by the
Board and recommending those above its limit to the
Board for approval.
• Monitoring loan quality through the review of quarterly
reports on facilities and potential loss forecasts.
• Reviewing fully provisioned loans and loan recovery
efforts from time to time.
• Approving credit guidelines for strategic plans and
projects.
The membership of the Committee during the 2019 financial year
is as shown below:
During the 2019 financial year, there were six (6) meetings of the
BCC on January 21, March 4, April 29, July 30, September 6, and
October 29. The Committee recorded 100% attendance at these
meetings as its Chairman and ALL members were present.
Board Finance & General Purposes Committee (BF&GPC)
The Committee is established to assist the Board in fulfilling its
oversight responsibilities with respect to strategic, financial and
corporate development matters. Its major terms of reference
include the following:
• Defining the strategic business focus and plans of the
Bank.
• Determining the policies, strategies and financial
objectives of the Bank, and overseeing and monitoring
the pursuit of these policies, strategies and financial
objectives.
• Overseeing the acquisition and disposal of any
significant asset or business of the Bank, subject to the
approval of the Board.
• Defining capital expenditure limits and approving all
capital expenditure within its limit and recommending
those above its limit to the Board for consideration and
approval.
• Reviewing and recommending to the Board for
approval, the procurement strategy and policy for the
Bank.
• Approving and recommending to the Board for
approval, the acquisition, establishment, disposal or
closure of any branch, business outlet of the Bank.
• Ensuring that all major contracts are carried out
according to the terms and conditions of the contract
agreements.
• Oversight responsibility in respect of the Bank’s
corporate strategy and material, financial and other
significant matters relating to the Bank’s annual
budget, capital investment policies, mergers and
acquisitions, and the Bank’s performance review, dra�,
amongst others.
The membership of the Committee during the 2019 financial year
is as shown below:
1. Mr. Bata G. Wakawa Non-Executive Director (Chairman)
2. Alhaji Abdullahi M. Umar Non-Executive Director
3. Mr. Austin E. Jo-Madugu Non-Executive Director
4. Mr. Adetokunbo M. Abiru Managing Director/CEO
5. Mr. Abdullahi S. Mohammed Executive Director
6. Mr. Innocent C. Ike Executive Director
NAME CAPACITY
1. Alhaji Abdullahi M. Umar Non-Executive Director (Chairman)
2. Mr. Austin E. Jo-Madugu Non-Executive Director
3. Mr. Olu O. Odugbemi Non-Executive Director
4. Mr. Adetokunbo M. Abiru Managing Director/CEO
5. Mr. Abdullahi S. Mohammed Executive Director
6. Mr. Innocent C. Ike Executive Director
NAME CAPACITY

POLARIS BANK ANNUAL REPORT & FINANCIAL STATEMENTS 2019
13
During the 2019 financial year, there were five (5) meetings of the
BF&GPC on January 22, April 30, July 31, September 6, and
October 30. The Committee recorded 100% attendance at these
meetings as its Chairman and ALL members were present.
Board Audit and Risk Management Committee (BARMC)
The Committee is established to assist the Board in fulfilling its
responsibility with respect of Audit & Risk Management. Its major
terms of reference include the following:
. Reviewing the integrity of the Bank’s financial
reporting and overseeing the independence and
objectivity of the external auditors.
• Assisting in the oversight of compliance with
regulatory requirements, and assessing qualifications
and independence of external auditor, as well as,
performance of the Bank’s internal audit function.
• Ensuring the development of a comprehensive
internal control framework for the Bank, providing
o v e rs i g h t o f M a n a ge m e n t ’s p ro ce s s fo r t h e
identification of significant fraud risks across the Bank
and ensuring that adequate prevention, detection and
reporting mechanisms are in place.
• Reviewing and recommending to the Board, the
appropriate risk management policy and framework,
including risk appetite and risk strategy, for the Bank.
• Ensuring the adequacy and effectiveness of risk
management and the controls in place, clearly
delineating the Bank’s overall risk tolerance level by
reviewing and approving risk limits.
• M o n i to r i n g a n d re v i e w i n g p e r i o d i ca l l y, t h e
implementation of the Bank’s risk management
strategy.
• Making recommendations on the appointment and
removal of the Chief Compliance Officer and the Chief
Internal Auditor.
*The membership of the Committee during the 2019 financial
year is as shown below:
During the 2019 financial year, there were four (4) meetings of the
BARMC on January 22, April 30, July 31, and October 30. The
Committee recorded 100% attendance at these meetings as its
Chairman and ALL members were present.
*The MD/CEO and other Executives are in attendance at the
Committee’s meetings.
In addition to their individual meetings, the BF&GPC and BARMC
also held joint meetings to consider matters such as the Bank’s
Budget and Accounts. The joint meetings were held on January
22 and December 10.
Remuneration of Directors
Only Non-Executive Directors are entitled to Directors’ Annual
Fees as well as Sitting Allowances for attendance at Board and
Committee meetings. Remuneration for Executive Directors
comprises a basic salary, allowances, performance incentive,
tied to the Bank’s performance.
The schedule of annual fees (excluding withholding tax at 10%)
paid to Non-Executive Directors for the year ended December 31,
2019 is as follows:
CORPORATE GOVERNANCE REPORT
1. Mr. Olu O. Odugbemi Non-Executive Director (Chairman)
2. Alhaji Abdullahi M. Umar Non-Executive Director
3. Mr. Bata G. Wakawa Non-Executive Director
NAME CAPACITY
S/N Fees & Allowances Amount
1. Annual Fee for Board Chairman N5m
2. Annual Fee for Non-Executive Directors N3.5m
3. Sitting Allowance for Board Committee Meetings N250,000
4. Sitting Allowance for Chairman of Board Committee Meetings N300,000
5. Sitting Allowance for Board of Directors Meetings N350,000
6. Sitting Allowance for Board Chairman N550,000

POLARIS BANK ANNUAL REPORT & FINANCIAL STATEMENTS 2019
14
Whistle-Blowing Policy
The Bank has established and implements a whistle-blowing
Policy which is an avenue for employees of the Bank,
stakeholders and the general public to report suspected or
known acts of fraud, malpractice, or other unethical activity.
The whistle-blowing framework includes a dedicated and active
email address to reach the Bank’s Chief Internal Auditor (CIA),
phone lines to the CIA and the CBN, and a conspicuous whistle-
blowing channel on the Bank’s website. Information on the
whistle blowing procedure is available to staff and customers
and also published in conspicuous places in the banking halls.
The whistle-blowing facility has the assurance of confidentiality
to protect the identity and interest of the whistle-blower. Periodic
reports on whistleblowing are presented to the Board of
Directors and sent to the CBN.
Disclosures
The Board has a policy of openness and transparency. Director-
related facilities are disclosed during consideration, and the
related party does not participate in the consideration of the
facility or remain in the Board room during the consideration. NoDirector of the Bank currently provides professional services to
the Bank.
During the 2019 Financial Year, the Bank incurred a CBN penalty
of N2million for delay in implementing two of the prior year's
recommendations from the external auditor's management
letter. The Bank was also fined the sum of N4million by the CBN
for writing-off interest portion of N2,067,685.00 on a legacy
insider-related loan to Onas Farms without prior CBN approval.
Management Committees
The Board delegates to Management, through the Managing
Director/CEO, all authority necessary for the day-to-day
management of the Bank. The Managing Director is the Head of
the Management team and has the discretion to request
Management Committees to take Management decisions and
actions that promote the corporate objectives of the Bank, with
due regard to Management’s limits as approved by the Board.
The Management Committees, composed of Management staff
selected according to their roles and responsibilities, all have
their Terms of Reference. Each Management Committee is
headed by a Chairman and has a Secretary appointed to perform
the secretarial functions for the Committee.
The standing Management Committees of the Bank are as
follows:
The Executive Committee (EXCO)
It is the highest-level Management Committee. It comprises the
Managing Director/CEO, as the Chairman, Executive Directors,
and Directorate Heads. Some of its Terms of Reference include:
• M a k i n g re co m m e n d a t i o n s o n t h e s t ra teg i c
development of the Bank in the areas of branch
expansion, branding and market presence.
• Considering of the financial performance of the Bank.
• Considering internal policies and processes and
making recommendations to the Board for approval.
• Considering the performance evaluation of staff and
issues of manpower planning, human capital and non-
human capital optimization.
• Ensuring that laid-down internal control procedures
are adequate and duly observed.
• Providing oversight function for the Bank’s accounting
and financial reporting, and its internal and external
audit.
• Reviewing the findings of any examination by
regulatory agencies, and any auditor observation,
including investigations.
• Monitoring and reviewing the effectiveness of the
Bank’s risk management systems and processes to
confirm its consistency with the Bank’s strategy and
business plan.
Assets & Liabilities Committee (ALCO)
The Committee is responsible for coordinating the Bank’s
borrowing and lending strategy, and funds acquisition to meet
profitability objectives as interest rates change. It monitors
actions by the regulators that may affect interest rates, and
impact of any policy change on the Bank’s business.
Criticized Assets Review Committee (CARC)
The Committee monitors the effectiveness and application of
credit risk management and ensures that all relevant
documentation pertaining to credit application and collateral
security are effected. It also reviews reports on challenged
accounts and oversees the development of loan loss provision
policy. It ensures that the systems established by Management to
identify credit risks, assess, manage and monitor loans are
operating effectively.
CORPORATE GOVERNANCE REPORT

POLARIS BANK ANNUAL REPORT & FINANCIAL STATEMENTS 2019
15
Tenders Committee (TC)
The Tenders Committee reviews the Bank’s tendering and
procurement policies and practices to ensure that the operating
policies and procedures relating to tendering and procurement
are recognised as “best practices”, and all Tenders are conducted
in a fair and ethical manner and that no conflict of interest exists
with any Director or employee connected to the tendering and
procurement process.
Disciplinary Committee (DC)
The Committee is responsible for considering complaints made
against staff members on matters relating to misconduct of staff,
in accordance with the Bank’s disciplinary framework. It also
r e v i e w s t h e D i s c i p l i n a r y R e g u l a t i o n s a n d m a k e s
recommendations for changes to Management.
Appeal Disciplinary Committee (ADC)
The Committee is established to review appeals from staff or ex-
staff on cases decided by the Disciplinary Committee.
Management Credit Committee (MCC)
The Committee is established to approve credits within its limit,
approve write-offs on excess interest and refund of interest within
its limit, and review fully provisioned loans and loan recovery
efforts, reports on credit quality, and policy procedure
adherence.
IT Steering Committee (ITSC)
The Committee is established to review, monitor and prioritize
major IT projects. It ensures that IT strategy is aligned with the
strategic goals of the Bank and procures business solutions that
leverage technology.
General Purposes Committee (GPC)
The Committee is established to carry out the following
functions:
• Provide oversight and direction for execution of
Investor Relations strategy and program such as
Financial Reporting & Stakeholder Engagement.
• Establish firm reputation for timely, transparent, and
reliable financial reporting/disclosure.
• Attract investors with long-term stake and ensure an
expanded & sustained access to lower-cost capital
from local and foreign financial markets.• Review and approve recommended processes and
present to EXCO for ratification.
• Ensure that process improvement activities are clearly
and functionally linked to the regional peculiarities
and strategic imperatives are capable of achieving the
key objectives of cost containment, service quality and
regularity compliance amongst others.
• Consider the Bank’s strategy towards CSR &
Sustainability related issues and monitor relevant
external developments.
• Consider and approve resource allocation for
identified and recommended CSR investments and
projects.
Product Development Committee (PDC)
The Committee is established to oversee the product
development process in the Bank. It defines the product
development process and strategy, reviews new products to
ensure alignment with the Bank’s strategic goals and objectives,
m o n i to rs t h e p e r fo r m a n ce o f p ro d u c t s a n d m a ke s
recommendations to Executive Management.
Process Review Committee (PRC)
The Committee is established to carry out comprehensive review
of processes designed by the Bank’s Business Process Re-
Engineering Team and make recommendations to Executive
Management. The Committee reviews process initiatives to
ensure that objectives of cost, service quality, speed and
regulatory compliance are achieved.
Polaris Bank appreciates the immense importance of sound
Corporate Governance in delivering value to its stakeholders and
building a sustainable enterprise. It therefore remains
committed to upholding the highest standards of Governance in
all the processes of the enterprise.
BY ORDER OF THE BOARD
BABATUNDE OSIBODUGENERAL COUNSEL/COMPANY SECRETARYFRC/2016/NBA/00000015464
Lagos, Nigeria February 13, 2020
CORPORATE GOVERNANCE REPORT
SUSTAINABILITYREPORT
16
POLARIS BANK ANNUAL REPORT & FINANCIAL STATEMENTS 2019
17
We believe that organizations that are genuinely concerned
about the environment and take active steps to manage the
environmental and social governance aspects of their activities
are best positioned to minimize risks and costs, capitalizing on a
plethora of opportunities to attract capital hence ensuring long-
term success of the organization. Our business activities and
operations at Polaris Bank have shi�ed from the regular business
model that focuses only on shareholder value and brand
acceptance; they are designed to ensure that we lend
responsibly, promote financial inclusion, encourage diversity,
invest in our employees, adhere to health and safety standards,
and reduce (or eliminate where possible) negative impact on the
environment, while continuing to grow a profitable and
sustainable business. Polaris Bank’s 2019 edition of the
Sustainability report reveals how the Bank’s policy and
framework aligns with its plan of building a world class work
environment. It also shows the general progress the Bank has
made to improve its agenda across the three stakeholder groups
– clients, people and community. In the area of Environmental,
Social and Governance (ESG), the Bank has steadily maintained a
robust management system by reviewing its Risk Assessment
Toolkit to meet industry and international standards.
OUR STRATEGY
As a principal financial Institution, Polaris Bank will continue to
focus on the importance of Sustainability to execute its business
activities and operations. The Bank recognizes the irrefutable
relationship between increasing the quality of life of people, the
long-term sustainable growth of its business activities &
operations and the environment where it operates. Hence,
sustainable activities of the Bank are woven around three
cardinal guidelines as indicated below:
1. Responsible Banking
2. Sustainable Economic growth
3. Community investments
RESPONSIBLE BANKING
Governance
The business priorit ies of the Bank with regards to
environmental, social and ethical issues are determined by the
Board Governance, Nomination and Compensation Committee.
The committee (through the Board, Audit and Risk Management
C o m m i t t e e ) a l s o i n t e g ra t e s t h e m a n a g e m e n t a n d
implementation of the Environmental and Social Risk
Management policy into the Bank’s business decisions.
The Environmental & Social Risk Management Framework
(ESRMF) sets out the agenda for consistent and systematic
management of E&S risks at Polaris Bank. It was built based on
Polaris Bank’s business principles and underlying commitment
to respect human rights and the environment.
The assessment portal has been continuously updated and
enhanced to screen qualifying transactions for environmental
and social risk towards efficient business decision making. The
portal is guided to ensure that the Bank’s risk management
processes are aligned with international best practice through
efficient internal standards and external collaborations such as
UNEPFI, IFC, ILO, Equator principles etc.
SUSTAINABILITY
report
At Polaris Bank, our commitment to sustainability reflects our values. Our strategy is focused primarily on responsible business practices which drive our role in ensuring long term economic development through the provision of sustainable financial products and advisory services. We are in active pursuits of the triple bottom line which consists of the three Ps: People, planet and profit.

POLARIS BANK ANNUAL REPORT & FINANCIAL STATEMENTS 2019
18
Employees
Polaris Bank is committed to the wellbeing of its employees
through effective engagements such as: health programmes,
trainings, competitive benefits and adequate compensation to
promote staff retention. As an equal opportunity employer, we
are passionate about providing a safe and conducive work
environment for all our employees.
In line with the commitment to harnessing our employees’
potential through continuous learning and development, the
Bank invested in various capacity building and employee
empowerment programmes focused on providing the required
support , solutions, knowledge and skills to meet the
developmental needs of the work force. This was achieved
through a detailed training curriculum which included
assessments to determine the level at which learning took place
and if set objectives were met.
The immense engagement drive influenced the behaviour of the
work force which resulted in enhanced work performance. Based
on the training policy of the Bank, all employees are entitled to a
variety of capacity building initiatives to boost their distinct
abilities. The Bank’s robust e-learning portal with a combination
of classroom learning enhances its vision for continuous
knowledge acquisition and professional development.
Gender, Diversity and Inclusion
Polaris Bank celebrates individuality and diversity and treats its
workforce equally with respect, dignity and fairness. In line with
best practices, the Bank offers equitable remuneration and
capacity development opportunities for all regardless of gender,
ethnicity, ideology or creed. Polaris Bank also ensures that
applications for employment by persons with disabilities are
given utmost consideration. In the event that any staff member
becomes physically challenged, appropriate training and
counselling sessions will be organized to guarantee continuous
employment with the Bank as required.
Health and Safety
The Bank has been successful in achieving a safe and healthy
working environment which is solely based on the shared
responsibilities of its employees.
Over the years, the Bank has maintained an enviable Health,
Safety and Environment (HSE) framework. The Bank is held
accountable for the enforcement of the HSE framework which is
cascaded to employees, customers and other stakeholders on
the Bank’s premises. Polaris Bank ensures adequate practices
and procedures which provides an appropriate working
environment for the workforce to deliver their utmost ability.
Polaris Bank remains ISO 22301 certified and operates within the
protocols: A Business Continuity Management certification
which ensures the timely resumption of business operations in
the event of an incident occurring and the protection of
personnel and the organization.
Malaria and Other Serious Diseases
One of Polaris Bank’s main goal is to ensure consistent
improvement in the well-being of the Bank’s workforce thereby
ensuring that employees are fit mentally, physically, emotionally
and are subsequently productive at optimal levels.
The Bank in partnership with some Health Management
Organizations (HMO) operates a structure where employees are
registered with hospitals under the insurance scheme to
undertake various health management issues like malaria to
other more serious ailments for them and their listed
dependents. An annual Health assessment week also held in the
Bank to reiterate the importance of healthy living for all staff.
Various Health topics have been used as themes for the week;
ranging from Physical Health, Mental Health, Healthy Living, and
Nutrition to Consistent Health checks.
The annual health week was held in November 2019 with the
theme: “PHYSICAL ACTIVITY – KEY TO ALL ROUND
WELLNESS”. The objective was to empower employees with
information on the importance of physical activity to all-round
wellness, give insights into how to incorporate more physical
activity in their work life, encourage and inspire a healthy lifestyle,
inform and educate on the dangers of a sedentary lifestyle vis-a
vis how to combat same.
HIV Testing, Confidentiality and Disclosure
Polaris Bank is known to regularly contribute to events that
provide sensitization for the Human Immunodeficiency
Virus/Acquired Immune Deficiency Syndrome (HIV/AIDS). As an
institution that shows great concern for the well-being of its staff,
the Bank takes initiatives that promote awareness, prevention
and management of the disease and also supports any
individual who is affected. In addition, the Bank encourages
nondiscrimination on HIV/AIDS particularly in the workplace and
does not require employees, their dependents, job applicants or
other third parties to undergo HIV testing as a precondition for
employment or receipt of benefits.
SUSTAINABILITY REPORT

POLARIS BANK ANNUAL REPORT & FINANCIAL STATEMENTS 2019
19
Code of ethics
For Polaris Bank, Sustainability is necessary to attract and retain
dedicated employees with a strong service mind-set for business
continuity and long-term performance. The Bank’s core values
which are the foundation for its culture as well as its procedures
are described in the Bank’s Code of Conduct which focuses on
areas of ethical risk. The Code which is attested at the beginning
of each year by every employee, provides guidance to help
employees recognize and deal with ethical issues, availing
mechanisms for employees to report unethical conduct and
foster a culture of honesty and accountability amongst its
employees.
Human Rights
As a reputable financial institution, Polaris Bank aims to set a
positive example of how to respect and promote human rights.
T h e B a n k h a s f a i r r e c r u i t m e n t p r a c t i c e s t h a t a r e
nondiscriminatory.
In addition, as part of our Social and Environmental Management
System, questions bothering on human rights has been
integrated into the Environmental & Social Risk Assessment
Portal. The Bank’s site visitation team also note human rights
issues as part of the system’s checklist to ensure our clients are
not violating human rights.
In Polaris Bank, the rights of the individual is demonstrated in
accordance with the 1948 Universal Declaration of Human Rights
(UDHR) as well as the International Labor Organizations (ILO)
standards regarding child and forced labor, the rights to organize
and bargain collectively, freedom of association, enhance social
protection and strengthen dialogue on work-related issues.
Collaboration
Organisations sign up for Sustainability partnerships to attain
greater accomplishments from such associations. Polaris Bank
appreciates the importance of working jointly with local and
international institutions that promote environmentally and
socially responsible economic development, while ensuring that
its activities do not undermine the ability of future generations to
meet their needs.
To this end, Polaris Bank is a member of some of the leading
global organisations in sustainability, which include the United
Nations Environment Programme and financial Institutions
(UNEP FI), Global Reporting Initiative (GRI) and Child & Youth
Finance International (CYFI). Polaris Bank is also the only
Nigerian bank represented in the GRI G4 Pioneer Group.
Environmental Responsibility
The Bank’s attention to environmental preservation cannot be
over-emphasized. This reflects in its steady commitment to
mitigating and possibly bringing to the barest minimum the
impact on the environment arising from its business decisions.
Our commitment to continuous vendor monitoring and
management programmes has been beneficial to its
environmental sustainability motives. We engaged the Bank’s
vendors in a capacity building workshop to develop skills and
provide necessary education in Environmental & Social Risk
(E&S) Management. This is reflected in the improved compliance
by vendors and suppliers to ethical business practices.
The Bank has also continuously reduced its negative impact on
the environment by reducing pollution caused by diesel usage
through the use of alternative sources of energy. More business
offices are being solar powered whilst also maintaining a strict
closing time of 6pm across all branches nationwide to reduce
energy consumption and carbon emission.
As a Bank we are also committed to reducing our carbon
footprint by ensuring the use of recycled paper at the same time
tracking printing costs and paper usage.
SUSTAINABLE ECONOMIC GROWTH
Access to Finance
Polaris Bank is committed to developing products and services
that improve accessibility to finance. The Bank takes pleasure in
understanding its customer’s needs and strives to surpass them
by undertaking a proactive customer engagement process using
different channels, publications, email alert/SMS, social media,
focus group, written communications, marketing calls,
advertising and business seminars.
The Bank has also provided various channel choices for
customers to ensure substantial access to Banking services at all
times for both the advantaged and disadvantaged individuals. In
order to ensure that possessing a disability is not a hindrance to
accessing our services, the Bank is currently upgrading more of
its branches to accommodate wheelchair access for the
physically challenged customers.
Polaris Bank has continually enhanced its credit process to fully
integrate the Environmental and Social Risk Analysis into the
lending, monitoring and reporting process for specific project-
finance transactions within a stipulated threshold.
SUSTAINABILITY REPORT

POLARIS BANK ANNUAL REPORT & FINANCIAL STATEMENTS 2019
20
Products and Innovation
At Polaris Bank, we constantly improve and expand the retail
portfolio with emphasis on driving transactional banking while
delivering outstanding customer service through the provision of
fast, secure, reliable and convenient electronic and retail banking
products, platforms and services. We have innovative products
and services designed to cater for all classes in the society.
Our team of experts have also simplified our services with
technology driven processes to enable more people have access
to financial services which encourages a positive and rewarding
savings culture. Highlights of some of our distinct Products and
Innovations include:
• Polaris Flex Salary Account: This is an account targeted
at salaried individuals who earn a monthly income of
up to N50,000.
• Polaris Ease Salary Account: This is an account
targeted at salaried individuals who earn a monthly
income of up to N100,000.
• Health Loan: Gives opportunity for SMEs in the Health
Sector to access finance for the daily running of their
business.
• Market Loan: Grants access to short term working
capital loan to SMEs who deal in fast moving consumer
goods in preapproved market locations
• Education Loan: Reviewed existing product in tune
with current market realities. Beneficiaries of Education loans are private nursery,
primary, secondary and tertiary institution
• Launched a capacity building program in partnership
with Facebook to train SMEs to leverage social media
as an access to market tool. Trained over 500 SMEs in 9
locations across 6 regions.
• Digital Salary Advance: the product enables salaried
employees who are eligible to access salary advance
via their phones by dialing USSD code *833*12.
• Short Term Asset Finance: This product is designed to
enable customers acquire choice consumer
household assets from pre-qualified merchants of the
Bank and enjoy a flexible and convenient repayment
plan
• Successful integration of Polaris Collect with Infinity
Systems on Ebonyi State IGR Collections and
commenced sensitization to enhance our market
share in the State.
• Implementation of the digital banking gateway
• Commenced pilot of the agency banking platform
(Surepadi)
COMMUNITY INVESTMENTS
Financial Literacy
The Bank believes sustainable economic development cannot
be achieved without the ability of customers to make informed
and effective decisions. Polaris Bank dedicates time and
resources to helping customers with the knowledge, skills and
confidence required to make financial decisions.
To demonstrate Polaris Bank’s commitment, its Sustainability
team working with the Products & Markets group across the
different geopolitical zones have delivered Financial Literacy
seminars/classes in several schools (primary and secondary) in
clusters every quarter across the nation over a period, in addition
to contributing various educational materials to school visited.
To date, the team has been able to reach over 80,000 students in
over 180 schools across major cities in Nigeria.
The Bank will continue to work with the CBN and use its
employees through volunteerism schemes for greater impact
and coverage through various initiatives in the year ahead.
Corporate Social Responsibility
At Polaris Bank, we believe that beyond the benefits of our
business to society, we have a critical role to play in providing
support systems and structures that enable individuals,
institutions and communities reach their full potentials.
Our commitment to this ideal thus runs just as deep as our
passion for creating value and is driven by the belief that building
a strong business and making the world a better place are
essential ingredients for long-term success.
Consistent with our Sustainability and CSR policy, our
interventions are driven by strategic focus and significant
investments in Education, Health & Safety, Women & Youth
Empowerment, Environment, Social infrastructure, Sports and
Cultural & Civic Projects; six areas which are essential pillars to
building a sustainable society.
It is for this reason that we have fully integrated corporate social
responsibility into our business model and continue to maintain
a clearly defined CSR strategy focused on championing
humanitarian causes and fostering initiatives that transform lives
and upli� communities.
SUSTAINABILITY REPORT

POLARIS BANK ANNUAL REPORT & FINANCIAL STATEMENTS 2019
21
In 2019, we continued to deepen the impact of our initiatives;
funding developmental projects, championing humanitarian
causes, expanding access to quality education, promoting
cultural heritage and creating opportunities for economic
empowerment. In this report, you will find testimonials that
reflect our progressive impact in enriching people’s lives. Details
of our initiatives include:
• Provided Prosthetic breasts and customized bras for
registered breast cancer survivors to ameliorate the
plight of those who have lost their self-confidence and
self-esteem as a result of stigmatization, following
mastectomy.
• Construction of Bank Road at Obafemi Awolowo
University (OAU): Provided seamless access to over
36,000 estimated population in the university
community
• Facilitated a worthwhile on-boarding experience for
over 6,500 fresh undergraduates: Partnered with
Obafemi Awolowo University (OAU) to organise their
Freshers’ Orientation Programme
• Sponsored 8 of the Bank's customers to FATE
Foundation: Built entrepreneurial capacity for eight
young entrepreneurs in an all-expense paid business
empowerment training
• Sponsored Afroprom for graduating students drawn
from select public and private secondary schools:
Facilitated a semi-formal black tie dance and
gathering of 3,000 graduating students drawn from
popular public and private secondary schools in Lagos
on the threshold of pursuing their dreams of Higher
Education.
• Donated towards the WIMBIZ 2019 Conference which
had over 1,700 women in attendance across various
sectors. The Bank sponsored 10 female staff members
to reaffirm its support for women
• Sponsored the Sisters’ Keepers Initiative, Kano maiden
workshop in Kano for Social Impact and Awareness on
right of Women and Girl Child: Reached over 400
women spanning across education, business and
politics with several account opening
• Sponsored Nigerian Artisans & Technicians 2019
Conference: Over 6,000 artisans present with strong
SME stakeholders/regulators (SMEDAN, FIRS, CPC &
Ministry of Labour) in attendance
• Partnered with Guild of Corporate Online Publishers to
organise the Annual Conference of the association:
Beyond deepening the knowledge of the publishers, it
also reinforced brand partnership with a critical media
stakeholder.
• Sponsored the 4th Lagos Digital NIPR Summit: The
Bank got extensive visibility on the sponsorship which
reinforced the brand perception of Polaris as a
knowledge driver in a knowledge economy.
• Sponsored Sarius Palmetum Garden Abuja in support
of Botanical Gardening with over 1000 classes of plants
which include 250 species of palm trees
• Sponsored the Head of Service Games (HOS Games),
Alausa, Lagos
CUSTOMERS’ COMPLAINTS AND PETITIONS
At Polaris Bank, our customers are fundamental to our business
and our commitment is to ensure we deliver an enjoyable and
satisfying banking experience to them.
The Bank deployed various feedback and engagement initiatives
geared towards obtaining direct feedback from customers on
their experiences and satisfaction levels with our products and
services across all our channels. This greatly assisted us in
improving our customers’ experience as well as strengthening
our relationships with them.
To further close the gap between our service delivery and
customer expectations, we carried out several reviews of our
business processes and service standards to increase value
creation and ensure a rewarding banking experience.
The improvement is expected to continue, as Polaris Bank
maintains a strong focus on surpassing customers’ expectations
while ensuring the swi� resolution of customer complaints
through prompt, impartial and fair investigations.
Complaint/Feedback Channels:
The Bank’s dedicated channels for the receipt and processing of
complaints include:
• Our 24/7 Contact Centre- The Yes Centre• Our Branches and Head Office• Customer Experience Management Department• Consumer Protection Department• Social media platforms including Twitter and
Facebook.
SUSTAINABILITY REPORT

POLARIS BANK ANNUAL REPORT & FINANCIAL STATEMENTS 2019
22
The Complaint Management system in the Bank has been set up
to:
• Ensure that all customers complaints received are
resolved promptly and satisfactorily.
• Ensure that customers’ concerns and complaints are
handled in line with our customer experience strategy
and relevant legal/regulatory requirements.
• Minimize reasons for complaints by learning from
them and improving on our products and services
The Consumer Protection desk has continued to perform its
mediation role between the Bank and its customers, thus
ensuring fair hearing and right to compensation as necessary.
This has been achieved by managing redress issues
professionally towards amicable resolution and customer
retention as well as continuous education on our products and
services, hence ensuring full consumer knowledge and
education. The desk has maintained its commitment to the apex
bank in line with its guidelines on resolution of complaints and
pursuit of Consumer Protection.
Complaints Report/Breakdown
The Bank received a total of 547,926 (Five Hundred and Forty
Seven Thousand, Nine Hundred and Twenty Six) complaints
which comprise of complaints logged on the Consumer
Complaints Management System (CCMS) and redress
complaints from the CBN within the review period (January -
December 2019) across various channels including Branches, Yes
Centre, Complaint Management and Consumer Protection desk.
From the 547,926 complaints received which also include the 382
petitions brought forward from December 2018, a total of 542,796
(Five Hundred and Forty-Seven Thousand, Seven Hundred and
Ninety-Six) were resolved satisfactorily while 5130 (Five
Thousand, One Hundred and Thirty) remained unresolved with
resolution efforts ongoing. Percentage of resolved complaints as
at 31st December 2019 stands at 99.06%.
Analysis of Complaints
Graphical Representation of Complaints
During the period under review, the sum of N52,507,993,857.15
(Fi�y two Billion, Five hundred and Seven Million, Nine Hundred
and Nine Three Thousand, Eight Hundred and Fi�y Seven Naira,
Fi�een Kobo) was claimed by various customers from petitions
reviewed. However, complaints involving the sum of
N51,495,530,627.23 were resolved, while the sum of
N124,319,369.79 was paid out as refunds.
SUSTAINABILITY REPORT
S/N Narration Total No. of Complaints
Total No. Resolved
Total No. Unresolved
1 Total 547,926 542,796 5,130
2 Percentage
Distribution 100% 99.06 0.94
99.060.94
No. of Complaints Recieved
Total No. Resolved Total No. Unresolved
S/N DESCRIPTION NUMBER AMOUNT CLAIMED (NGN)
Jan-Dec 2019 Oct-Dec 2018 2019 2019
AMOUNT REFUNDED (NGN)
Pending
Complaints
B/F
382 4021
2
3
4
5
Received
Complaints 547,544 1,917 52,507,993,857.15
Resolved
Complaints 542,796 1,822 51,495,530,627.23 124,319,369.79
Unresolved
Complaints
escalated
to CBN for
intervention
126 115
Unresolved
complaints
pending
with the
bank C/F
5,004 382
Tabular Breakdown of Customers’ complaints and claims

POLARIS BANK ANNUAL REPORT & FINANCIAL STATEMENTS 2019
23
Customers’ complaints and petitions received for the
period include but not limited to the following:
• Card ser vices, including, Card issuance, ATM
withdrawals, POS transactions etc.
• Internet Banking related issues
• Contentious withdrawals and charges
• General Account complaints.
Analysis of Fraud and Forgeries Return
During the period under review, the bank recorded 102 fraud
cases. The total amount involved is N1,914,982,813.00 and
$321,132.85. However, a total of N99,662,635.76 and $30,991.95
were lost and these are analyzed below:
SUSTAINABILITY REPORT
S/N Nature of fraud No of cases 31 December
2019
31 December
2019
1 ATM 15 11,129,098.96 991.95 10.36
2 Internet Banking 8 16,157,007.17 - 14.56
3 Mobile 20 19,201,282.50 - 17.30
4 Impersonation 13 18,062,221.90 - 16.28
5 Cheque Related 12 4,672,942.46 - 4.21
6 Outright the� 21 1,540,740.00 - 1.39
7 Cyber Fraud 2 3,743,039.14 - 3.37
8 General 11 25,156,303.63 30,000.00 32.53
Total 102 99,662,635.76 30,991.95 100.00
Amount lost (N) Amount lost ($) % Total (N)
11,490,863.13
16,157,007.17
19,201,282.50
18,062,221.90
4,672,942.46
1,540,740.00
3,743,039.14
36,097,303.63
110,965,399.93

CHAIRMAN’SSTATEMENT
24

25

POLARIS BANK ANNUAL REPORT & FINANCIAL STATEMENTS 2019
26
Today, I am delighted to note that Polaris Bank is strong, stable
and not only firmly on a path to sustainable profitability but
strongly positioned to be a future determining bank in the fast-
changing Financial Service space. We have laid a solid
foundation for an enduring, effective, efficient, agile, innovative
and resilient Bank and the performance numbers do bear me
witness.
Our Humble Beginning
When, pursuant to intervening action by the CBN, I assumed the
Chairmanship of the Board of the defunct Skye Bank PLC on July
4th, 2016, the task ahead of us appeared daunting. The bank was
groaning under the weight of non-performing loans and liquidity
pressures, the prudential ratios were a far cry from regulatory
compliance, services were below par, the I.T Infrastructure was
obsolete, staff morale was at its lowest ebb there was immense
pressure from both local and foreign lenders by recalling their
funds. To cap it all, some of the Bank’s major customers along
with key mandates had also taken a walk, as a flight to safety.
However, with the staunch support of the CBN, we were able to
turn around the fortunes of that bank following the decision of
the regulators to incorporate Polaris Bank to take over the assets
and some liabilities of Skye Bank and retain the same Board and
Management.
Polaris Bank was birthed on September 21, 2018 as a private
limited company, wholly owned by the Asset Management
Corporation of Nigeria (AMCON), and on the same day, it took
over the assets and some liabilities of the defunct Skye Bank. As
attested by the financial results being approved today, the story
is completely different. Most prudential ratios, including Capital
Adequacy and Liquidity, are firmly in compliance, all matured
obligations across currencies have been discharged, service
levels have improved tremendously, the technology platforms
and infrastructure are being upgraded and the workforce is well
motivated. Although there are still a few of the legacy challenges
that we are dealing with, we are confident that with your usual
support and the commitment of the Board and Management,
they will also soon be resolved. The progress made so far will
suffice to stand Polaris Bank out for all of history in Financial
Services Industry and in Academia as a classical model for
successful regulatory intervention. While acknowledging the
valued critical and unrelenting support received from our
regulators, the CBN and AMCON our owners, I must also express
my appreciation to my colleagues on the Board and the
Management of the Bank for the completely different story we
are telling today.
Operating Environment, Business Strategy and Business
Overview
The business environment is increasingly becoming challenging
to navigate. Economic growth has been very sluggish, and
businesses are not having the best of times. Regulatory demands
kept mounting, from rising prudential requirements, to thinning
charges and margins. In addition, the sphere of competition is
also widening beyond traditional financial institutions to include
existential threats from FInTechs and other non-traditional
players. Amid all of these, we remain confident that Polaris will
find, defend and be among the leading innovative banks in the
evolving order of financial service offerings.
CHAIRMAN’S
statement
It is with great pleasure that I present the 2019 Annual Reports and Accounts of our Bank. This is
our first full year of operations since Polaris Bank came into being and acquired the assets and
some of the liabilities of the defunct Skye Bank.

POLARIS BANK ANNUAL REPORT & FINANCIAL STATEMENTS 2019
27
Given the foregoing, it became clear early on in this assignment
that an overhaul of the business processes and strategy including
digital transformation was critical to turning the fortunes of
Polaris around and compete effectively and efficiently in the fast-
changing banking space. Working with top rated industry
consultants across disciplines such as business development,
technology, strategy and brand, we carved out a medium-term
corporate transformation program. This includes digital
transformation / technology refresh, Business strategy, Brand
and culture realignment. The implementation of all the
components of the corporate strategy has commenced and in
less than a year on the journey, significant milestones have been
achieved. Indeed, I am pleased to announce that we are ahead of
timelines on many of our performance benchmarks.
Although we are still on the corporate transformation journey,
initial results are very encouraging, and we are confident of even
more impressive outcomes on both the quantitative and
qualitative fronts going forward. Our customer service is
improving, and our target is to rank among the very best in the
industry in the not-too-distant future. Also, our digital platforms
are more stable, the foundation of our IT infrastructure has been
solidified and is infinitely more robust, and our customers 'overall experience has witnessed strong improvement. We are
winning market share and have started getting unsolicited
corresponding banking business offers from foreign lenders.
The financial results we posted in our first full year of operation is
a testimony to the progress we have made in our goal of
transforming the Bank. We posted ₦150.4bn in gross earnings,
N27.34bn in Profit Before Tax and ₦26.29bn in Profit A�er Tax.
Our deposits stood at N857.8bn and loan book at N261bn. Return
on Equity was at 33.0% and Return on Assets at 2.4%. The results
compare favourably with the best in the industry and I must seize
this opportunity to appreciate and congratulate the Board,
Management and indeed the entire staff of the Bank for a job well
done.
Corporate Governance
One of our very first action points on coming on-board was to put
in place a strong and transparent corporate governance
framework that ensures adequate Board oversight and more
importantly Board transparency and accountability. The Board is
supported by four Board committees, namely the Board
Governance, Nominations and Compensations Committee,
Board Audit and Risk Management Committee, Board Credit
Committee and Board Finance and General Purpose Committee,
each with direct oversight over their respective areas of
responsibilities. All capital expenditure above N100m requires
the approval of the Board Finance and General purpose
committee, and the Board Credit Committee is required to
approve any credit facility in excess of N500m. Furthermore, all
policy documents underlying the Bank's operations require
Board approval to become effective. These are just a few of the
measures put in place to entrench corporate governance and
promote Board accountability.
Responsibility to Our Society
At Polaris, we are deeply committed to the well-being of the
society where we operate, and this is demonstrated by our robust
CSR budget. Our operations are wholly guided by strict
considerations for environmental protection and we do not
support any business whose activities are inimical to
environmental and societal well-being. The Bank is a signatory to
the United Nations Environmental Program – Financial Initiative
(UNEP-FI), the body responsible for coordinating sustainable
banking practices. The Chief Executive Officer, Mr. Tokunbo
Abiru, is also a nominated champion for gender equality,
�HeforShe” by the Lagos State Ministry for Women's Affairs in
collaboration with the United Nations. Our commitment to
promoting financial literacy is demonstrated through our annual
participation in the Global Money week campaign, an annual
financial awareness campaign which inspires children and
young people to learn about money, saving, creating livelihoods,
gaining employment and becoming entrepreneurs. Amid many
other Corporate Social Responsibility (CSR) activities we are
involved in, we supported government efforts toward fighting the
COVID-19 pandemic by donating fully accessorized hospital beds
to the Lagos state Government and Nigeria Centre for Decease
Control (NCDC). We also supported the Private Sector coalition
effort towards combating the virus.
CHAIRMAN’S STATEMENT
the progress we have made in our
goal of transforming the Bank.
We posted ₦150.4bn in gross
earnings, N27.34bn in Profit Before
Tax and ₦26.29bn in Profit A�er Tax.

POLARIS BANK ANNUAL REPORT & FINANCIAL STATEMENTS 2019
28
What the Future holds
The horizon was very hazy when we started this journey, but
today, you will agree with me that the future of this enterprise is
much more promising. We are advancing in our corporate
transformation Journey toward making Polaris a digital bank
that will not only compete but lead the frontier of innovations. We
will continue to invest in Technology, strengthen our Cyber
security capabilities and broaden product offerings to the unique
needs of the banking public. While acknowledging that COVID-
19 has dampened the business climate, casting a shadow of
recession on economic outlook, Polaris will continue to fashion
appropriate strategic responses to weather the storm of the
pandemic. We are optimistic about the evolving strength and
profile of the brand we are building for sustainable wealth
creation for maximum value realization.
On behalf of the Board and Management, I thank you for the
opportunity given to us to serve and the confidence reposed on
us. I also appreciate the immense contributions of our most
valued asset (our staff for their support, dedication and
productivity) during this reporting period.
Thank you all.
CHAIRMAN’S STATEMENT
While acknowledging that COVID-19
has dampened the business
climate, casting a shadow of
recession on economic outlook,
Polaris will continue to fashion
appropriate strategic responses to
weather the storm of the pandemic

MANAGING DIRECTOR’SSTATEMENT
29

30
POLARIS BANK ANNUAL REPORT & FINANCIAL STATEMENTS 2019
31
A Challenging beginning
When Polaris Bank took over the assets and some liabilities of the
defunct Skye Bank in September 2018 and we assumed its affairs,
we were clear on the enormity of task ahead of us and the
directions in which we must move. The defunct Bank was
challenged on many fronts; prudential ratios (including liquidity
and capital adequacy) were out of compliance, the financial
position statement was not in a good state, there were non-
performing loans (NPL) challenges , core technology
infrastructure and many related applications were obsolete,
customer’s experience was sub-optimal and staff morale could
be a lot better. Despite all these challenges, we also saw
possibilities, hidden potentials of a brand that could redefine the
banking landscape, compete and challenge the very best in the
in the industry and we set out on a journey to make that happen.
Our Vision - Corporate Transformation
We engaged leading consultants for clear and concise
articulation of the vision we have for Polaris Bank. This requires
complete enterprise transformation with a medium-term
strategy broken down into; revamping our information
technology infrastructure, redefining the business strategy, re-
projecting the brand and digital transformation. We have
achieved significant mileage on this Corporate Transformation
journey, and you will agree with me that the early signs are very
promising. While we are repositioning our I.T infrastructure to
world class standards, we are equally implementing a robust
digital transformation to actualize our vision of making Polaris a
truly digital Bank. Given the demographics of this environment,
we primarily pursued a retail banking strategy, with focus on
growth sectors in the commercial banking space with cautious
play in Corporate Banking. With all these transformational
initiatives ongoing, very soon, we are confident Polaris will
assume a pride of place in the industry, leading innovation and
delivering world-class customer experience leveraging cutting-
edge technology. We have also deepened our product offering to
address the unique needs of different customer segments across
age, geography, gender and business types. To further reinforce
the evolving brand value in the mind of the banking public, we
are re-projecting our brand identity both in the virtual and
physical environment.
Our Performance and Our Business
A review of the result shows positive performance across all
financial indices, an early validation of the corporate
transformation journey the Bank embarked upon. Amidst stiff
competition, challenging regulatory and harsh macro-economic
conditions, the Bank posted ₦150.4bn in gross earnings in its first
full year of operation. PBT stood at N27.34bn and PAT at N26.29n.
By refocusing on deposits sources, our deposit declined
marginally to N857.8billion from N861b at which we closed our
first three months of operation in December 2018 following our
resolve to rebalance the deposit portfolio toward more stable
and less expensive retail deposits.
MANAGING DIRECTOR’S
statement
Let me start by expressing my sincere gratitude to our primary regulator, the Central Bank of
Nigeria (CBN), and AMCON for the opportunity and privilege to lead the Management team of this
fledging institution. I am equally grateful to the Board, under the Chairmanship of Mr.
Muhammad Kabiru Ahmad, for its leadership and invaluable support that has helped to bring
Polaris to where it is today. I also commend the entire workforce of the Bank for commitment
and sense of dedication to duty and together we will continue to deepen Polaris footprints on
the history of corporate transformation in Nigeria.
Amidst stiff competition, challenging regulatory and
harsh macro-economic conditions, the Bank posted
₦150.4bn
POLARIS BANK ANNUAL REPORT & FINANCIAL STATEMENTS 2019
32
The loan book closed the year at N261bn. Our Return on Equity
(ROE) and while Return on Assets (ROA) were also very decent at
33.0% and 2.4% respectively (both are above industry average)
Underpinning our financial performance is the implementation
of our corporate transformation program. Thus, our retail
business is anchored on our capability to provide value to
individuals and small businesses. The retail products are
therefore designed and customized across variants of individual
current accounts, savings and investment accounts, debit and
credit cards, financial inclusion products as well as consumer
and personal loans.
Our SME Banking franchise, on the other hand, incorporates
current accounts, deposits investments, overdra�s, loans and
other credit facilities including foreign currency and derivative
products tailored to meet unique customer needs and
conditions. We have expanded the frontiers of our retail product
offerings to the needs and yearnings of today’s market to include
Payday Loan, Cluster Lending, Personal Home Loan and Asset
Finance Loan. The Bank Introduced SME products targeted at
high growth sectors of the economy i.e. Market and Health Sector
Loans for traders, hospitals, pharmacies and diagnostic
laboratories. We are also partnering with Fintechs to further
broaden the reach and span of our credit products.
We recognize the rapid technological and digital evolution
financial service space is witnessing not only in Nigeria but
globally. Beyond Technology being a tool for offering traditional
banking services, it has come to radically overhaul traditional
banking processes and structure. As such, the Bank is upgrading
its I.T infrastructure and applications to world class standards.
We have also strengthened our personnel capacity in the digital
banking space accordingly and have upgraded our mobile and
internet banking apps, improved the offerings via our USSD
platform, *833#, deployed many POS terminals, replaced old
ATMs etc. we are gaining traction on our agency banking offering,
“Sure padi”, targeted at promoting financial inclusion which
launched early this year. All of these have started yielding fruits in
improved efficiency, service delivery and enhanced customer
experience. We are also seeing sustained growth in transaction
volumes, revenue lines, industry position and market share
across all electronic platforms.
The Bank and Our Society
At Polaris Bank, we believe our long-term success is tied to the
well-being of the society where we operate. Our commitment to
social responsibility runs just as deep as our passion for creating
value. Consistent with our Sustainability and CSR policy, our
interventions are driven by strategic focus and significant
investments in Education, Health & Safety, Women & Youth
Empowerment, Environment, Social infrastructure, Sports and
Cultural & Civic Projects; six areas which are essential pillars to
building a sustainable society.
In out short existence, we are fast becoming associated with
bodies and initiatives that promote the cause of our environment
and humanity at large. The Bank operates strictly on sustainable
banking principles and any business we commit funding to must
have come out clean on our environmental and social impact
screening. The Bank is a signatory to the United Nations
Environmental Program – Financial Initiative (UNEP-FI), the body
responsible for coordinating sustainable banking practices. As
the Chief Executive Officer and in recognition of the Bank’s
commitment to sustainable banking practices, I was nominated
a gender equality champion, “HeforShe” by the Lagos State
Ministry for Women’s Affairs in collaboration with UN Women.It is for this reason that we have fully integrated corporate social
responsibility into our business model and continue to maintain
a clearly defined CSR strategy focused on championing
humanitarian causes and fostering initiatives that transform lives
and upli� communities. In 2019, we continued to deepen the
impact of our initiatives; funding developmental projects,
championing humanitarian causes, expanding access to quality
education, promoting cultural heritage and creating
opportunities for economic empowerment.
Our People
The Bank’s Human resource remains its priority. In a world where
change is constant, having the right people in the right roles is key
to how we create more value for all our stakeholders. Human
resource acquisitions, deployments and development therefore
becomes a critical part of the transformation journey. This has
led to several initiatives developed to harness the Bank’s
potentials with the aim of achieving our corporate objective
using a two-pronged approach; leveraging talent acquisition for
strategic roles as well as rejigging our Learning & Development
curriculum. Our success in 2019 is down to the hard work of
thousands of talented and dedicated staff. Throughout the year,
we remained focused on building an inclusive Bank with equal
opportunities regardless of gender, ethnicity or background.
Each employee’s is provided required trainings and tools
required to discharge his or her responsibilities. Although our
work environment is very professional, nonetheless, every staff is
made to feel at home while at work. We are also very conscious of
not breeding a toxic environment that could be psychologically
depressing on one hand and inimical to productivity on the
other. Working with leading Human Resource consultants,
Officers within the Assistant Manager to Senior Manager cadre
are now fully equipped with leadership skills through the Polaris
Management Development Programme.
MANAGING DIRECTOR’S STATEMENT

POLARIS BANK ANNUAL REPORT & FINANCIAL STATEMENTS 2019
33
Empowered for the Future
Looking back at how far we have come in this short time, you will
agree with me that we have marched on confidently, writing one
of the most challenging but successful business turnaround
stories in corporate Nigeria and particularly in the financial
services industry. Looking ahead, we have laid a solid foundation
for a brand that stands out and built to deliver sustainable
growth for decades to come. Our long-term commitment to
supporting our customers, opening doors to new opportunities
for our communities and enabling businesses to thrive remains
just as strong. We are excited by our goal to become a ‘Top Retail
and digitally led Bank’ in Nigeria, and in getting there, we will
continue to leverage our knowledge and design innovative
solutions that facilitate our customer’s enterprise. The signs so
far have been ver y encouraging and with sustained
implementation of our corporate strategy, we are sure of
becoming the preferred Partner providing superior financial
solutions to our Customers. At Polaris, we are not afraid to be
different from the pack.
Thank you.
MANAGING DIRECTOR’S STATEMENT
Our long-term commitment to
supporting our customers, opening
doors to new opportunities for our
communities and enabling
businesses to thrive remains just
as strong.

BOARD OF DIRECTORS
34

MR. MUHAMMAD K. AHMAD, OON CHAIRMAN
MR. ADETOKUNBO M. ABIRUMANAGING DIRECTOR/CEO
35

ALHAJI ABDULLAHI M. UMAR
NON-EXECUTIVE DIRECTOR
MR. BATA G. WAKAWA
NON-EXECUTIVE DIRECTOR
MR. AUSTIN E. JO-MADUGU
NON-EXECUTIVE DIRECTOR
MR. OLU O. ODUGBEMI
NON-EXECUTIVE DIRECTOR
36

MR. INNOCENT C. IKE
EXECUTIVE DIRECTOR
MR. ABDULLAHI S. MOHAMMED
EXECUTIVE DIRECTOR
BABATUNDE OSIBODUGENERAL COUNSEL/COMPANY SECRETARY
37

38

POLARIS BANK ANNUAL REPORT & FINANCIAL STATEMENTS 2019
39
MUHAMMAD K. AHMAD, OON Chairman
Muhammad K. Ahmad, OON, has over 35 years' distinguished
experience leading and working in various public sector
organisations and financial services institutions in Nigeria.
As the pioneer Director General and Chief Executive Officer of the
Nat ional Pension Commission, Ahmad oversaw the
establishment and growth of the Pension industry in Nigeria.
Prior to that, he had worked as a Bank Supervisor at the Nigeria
Deposit Insurance Corporation (NDIC) where he rose to become a
Director and member of the Interim Management Board, and at
the Central Bank of Liberia.
Ahmad is Chairman of the Board of Directors of Polaris Bank
Limited, an Independent Non-Executive Director of MTN Nigeria
Communications Plc; Chairman of the Board of Credent Capital
Advisory and the Board of International Energy Assurance; a
member of the Governing Council of Pan African University; and
President of Council of the Board of Society for Corporate
Governance Nigeria.
He is the founder of Jewel Development Foundation, a graduate
assistant platform, and Certium Consulting, a strategy advisory
and business applications company. He was a member of the
Boards of Directors of FBN Holdings PLC, and FATE Foundation, a
non-profit private sector-led organisation whose mission is to
foster wealth creation by enabling aspiring and emerging
Nigerian entrepreneurs.
Ahmad chairs the Technical Committee of the National Council
on Privatisation (NCP) of which the Vice President of Nigeria is the
chairman. He chaired the Technical Committee of the Financial
Reporting Council of Nigeria, which produced the Nigerian Code
of Corporate Governance 2018.
Ahmad chaired the Technical Committee that produced the
North East Transformation Strategy (NESTS), a medium-term
Regional Development Strategy, for the sustainable socio-
economic transformation and reconstruction of the Region, a
strategy promoted by the six Governors of the constituent states
of the region. He also assisted in the development of the Buhari
Plan, which was initiated by the Federal Government of Nigeria to
provide a framework for coordinating all initiatives and
interventions by various actors for early recovery and sustainable
development of the North East region. Ahmad currently
coordinates and leads a team to develop Borno 2045
Development Plan.
He has a Masters Diploma in Innovation and Strategy from
University of Oxford and has also attended courses and programs
in various first-rate business and management schools,
including Harvard Business School, IMD and INSEAD.
Ahmad was honored by the Federal Government of Nigeria with
the award of the Officer of the Order of the Niger (OON) in
recognition of his stellar contributions to the development of the
public and private sectors in the country
PROFILE OF
directors
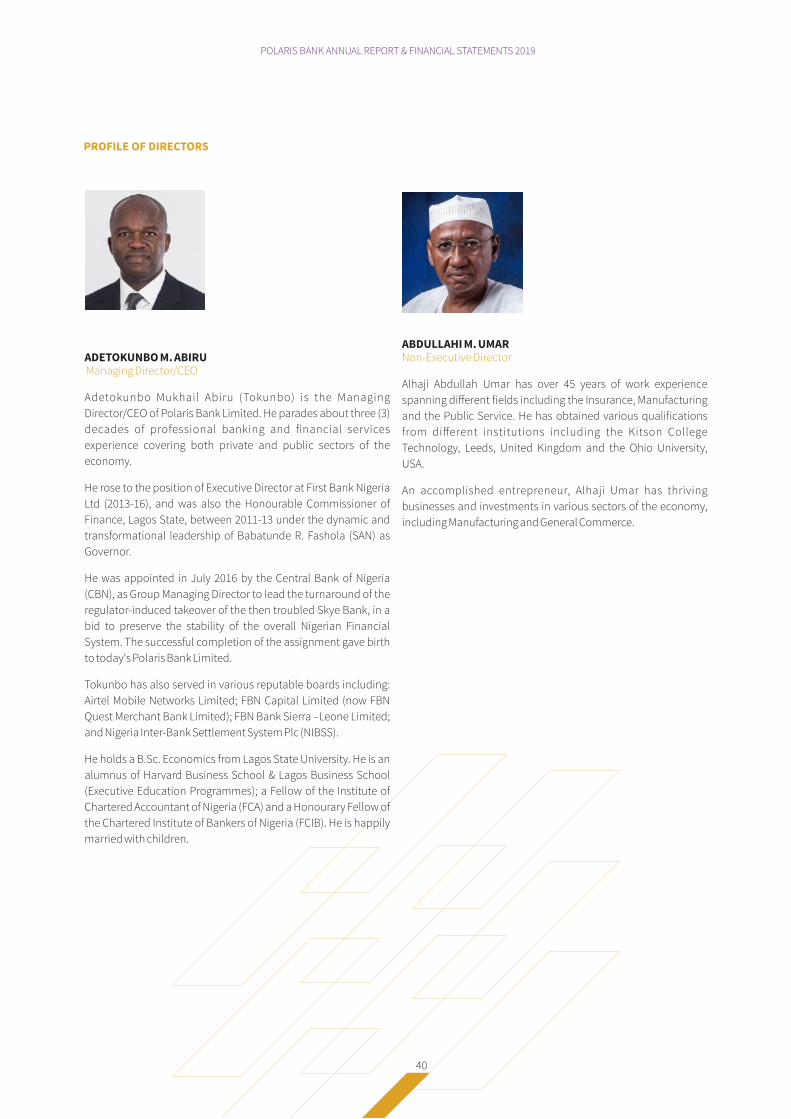
POLARIS BANK ANNUAL REPORT & FINANCIAL STATEMENTS 2019
40
ADETOKUNBO M. ABIRU Managing Director/CEO
Adetokunbo Mukhail Abiru (Tokunbo) is the Managing
Director/CEO of Polaris Bank Limited. He parades about three (3)
decades of professional banking and financial services
experience covering both private and public sectors of the
economy.
He rose to the position of Executive Director at First Bank Nigeria
Ltd (2013-16), and was also the Honourable Commissioner of
Finance, Lagos State, between 2011-13 under the dynamic and
transformational leadership of Babatunde R. Fashola (SAN) as
Governor.
He was appointed in July 2016 by the Central Bank of Nigeria
(CBN), as Group Managing Director to lead the turnaround of the
regulator-induced takeover of the then troubled Skye Bank, in a
bid to preserve the stability of the overall Nigerian Financial
System. The successful completion of the assignment gave birth
to today's Polaris Bank Limited.
Tokunbo has also served in various reputable boards including:
Airtel Mobile Networks Limited; FBN Capital Limited (now FBN
Quest Merchant Bank Limited); FBN Bank Sierra –Leone Limited;
and Nigeria Inter-Bank Settlement System Plc (NIBSS).
He holds a B.Sc. Economics from Lagos State University. He is an
alumnus of Harvard Business School & Lagos Business School
(Executive Education Programmes); a Fellow of the Institute of
Chartered Accountant of Nigeria (FCA) and a Honourary Fellow of
the Chartered Institute of Bankers of Nigeria (FCIB). He is happily
married with children.
ABDULLAHI M. UMARNon-Executive Director
Alhaji Abdullah Umar has over 45 years of work experience
spanning different fields including the Insurance, Manufacturing
and the Public Service. He has obtained various qualifications
from different institutions including the Kitson College
Technology, Leeds, United Kingdom and the Ohio University,
USA.
An accomplished entrepreneur, Alhaji Umar has thriving
businesses and investments in various sectors of the economy,
including Manufacturing and General Commerce.
PROFILE OF DIRECTORS

POLARIS BANK ANNUAL REPORT & FINANCIAL STATEMENTS 2019
41
AUSTIN E. JO-MADUGUNon- Executive Director
Mr. Austin Jo-Madugu is an alumnus of Ahmadu Bello University,
Zaria, BSc, Sociology, First Class Honours, 1976 and New York
University, Stern's School of Business, New York, MBA, 1982. He
was at St. Paul 's College, Kufena Zaria from 1966 to 1972 for both
his O' and A' levels before proceeding to the university. He began
his working life at the Centre for Management Development,
Lagos in 1977 as a Management Trainee. His banking career
started at Chase Merchant Bank in 1983 in Credit and Marketing.
He also worked at UBA and at the Bank of Industry from where he
retired as General Manager, Operations in 2012. Mr. Jo-Madugu has attended various local and international
e xe c u t i v e p ro g ra m m e s i n c l u d i n g t h o s e a t I N S E A D ,
Fontainebleau, France; Columbia University Business School,
New York, USA and the Philippines Development Finance
Institute, Manila, Philippines. He is member of the Institute of
Directors and Nigerian Institute of Management. He is from Kogi
State and is happily married with children.
BATA G. WAKAWANon- Executive Director
Mr. Bata Garba Wakawa has over 23 years of banking experience.
He obtained a B.Sc. Hons degree in Business Administration from
the prestigious Ahmadu Bello University, Zaria in 1982 and an
MBA degree from Bayero University, Kano in March 1996. His full time banking career started when he le� Borno State Civil
Service in 1984 for Central Bank of Nigeria on a senior supervisor
grade until June 1986 when he joined UBA PLC.
He rose through the ranks whilst being responsible for
Commercial Banking, Monitor ing and Control (R isk
Management), Inspection, Reconciliation and Control,
Transaction banking, Branch Co-ordination and Control and
Area Office Administration in Jos, Abuja and the 6 states of the
North East geo-political region. He voluntarily retired in
November 2007 as Senior Branch Cluster Manager in charge of all
branches in Borno and Yobe States.
He has attended several management, professional and
leadership trainings both locally and abroad.
Mr. Wakawa is from Borno State and happily married with
children.
PROFILE OF DIRECTORS

POLARIS BANK ANNUAL REPORT & FINANCIAL STATEMENTS 2019
42
OLU O. ODUGBEMINon-Executive Director
Olu Odugbemi FCA, FCTI. Agronomist, Economist, Auditor,
Chartered Accountant, Ex banker and Financial consultant. Olu is
an alumni of INSEAD Fontainebleau, France Strategic
Management Services and 1991 British Council ODASS Scholar.
He holds B.Sc (First Class Hons, GPA 6.8/7.0), University of Ibadan;
M.Sc (Distinction Hons, 1992) Imperial College, University of
London and 1999 SAP FI/CO R3 Certification from SAP Academy
Woodmead, Johannesburg. He is a Fellow, Institute of Chartered
Accountants and Chartered Institute of Taxation of Nigeria.
His multidisciplinary educational background is complemented
by over 25 years of cross functional business experience in Audit
and Management consulting, Treasury & FI Relationship
management, Corporate Finance, Strategy, Retail and Corporate
Banking garnered in Deloitte, Touche & International (now
Akintola Williams Deloitte & Co) and three top ranking Nigerian
Banks namely Ecobank Plc., Citizens International Bank and UBA
Plc.
Olu was involved in the design of the Legal and Operational
framework for Central Securities Clearing System (1994/97), and
he participated in several landmark transactions such as the
$1.0bn syndication for NLNG project trains 4 & 5, $160million
syndicated Senior Secured Facility for Bonny Gas Transport;
USD50million short term note issuance facility for two leading
MNOCs; and the Syndication of $230m term facility for a leading
IPP in Lagos working with three leading international financial
institutions namely FMO, Afrexim and Banque Belgolaise in
perhaps the most successful power transaction of that nature in
the country to date.
At UBA Plc, Olu served at management level for nine years and
was at various times Senior Manager, Strategy (1997), Head, Oil &
Gas Upstream (1999), Sector Head, Power (2002), Sector Head,
Mortgage Banking and Divisional Head, UBA Home Loans (2005).
He worked with the Mckinsey team in Project Quest (2001) to cra�
UBA Corporate and Retail Strategy and played a central role as
Strategy team member in the UBA/STB merger integration in
April 2005. He disengaged from UBA Plc. In February 2006 to
pursue personal interest in Financial Consulting.
Olu is a consultant to several local and multinational companies
in the financial sector space and is happily married with a
daughter.
ABDULLAHI S. MOHAMMEDExecutive Director
Abdullahi Sarki Mohammed was born in Kano and had his early
education between Kano and Kaduna States before proceeding
to the Bowling Green State University, Ohio USA for his Bachelor
and Masters Degrees. He returned to Nigeria in 1987 to
commence his career with Cement Company of Northern Nigeria
Plc., Sokoto, where he served as a Staff Development and
Training Senior Instructor. He subsequently joined Century
Merchant Bank Limited in 1991 as an Officer and Head of Treasury
Department of Kano Area Office. During his stint at Century
Merchant Bank he had the responsibility of establishing the
business operation in the Federal Capital Territory, Abuja.
Abdullahi later in 1995 moved to Kakawa Discount House Ltd. as
an Admin Manager. In 1998, he went to establish the Abuja Area
Office where he was overseeing the 19 northern states. In 1999, he
took up appointment as the Commissioner for Works, Housing
and Transport in Kano State and Member, Kano State Executive
Council. He was also at various times, the relief commissioner in
the Ministries of Health and Water Resources. He later returned to
Kakawa Discount House Ltd. until 2003 when he joined First Bank
of Nigeria Ltd. where he rose to become a Deputy General
Manager in 2013. He was at various times in First Bank
responsible for the Bank's Business Development in Benue, Kogi,
Nasarawa, Niger, Kano, and Jigawa States as well as FCT – Abuja,
until his appointment as the Group Head in Charge of
Commercial Banking in the North overseeing commercial
Banking Business in the whole of Northern Nigeria.
Abdullahi was the Executive Director in charge of Abuja &
Northern Business Directorate of the erstwhile Skye Bank, a
position he continues to hold on the Board of Polaris Bank
Limited. He has also served as Director on the Board of Skye Bank
Guinea Ltd and Trustfund Pensions Ltd.
Abdullahi has attended courses both in Nigeria and Overseas
including those at the London Business School and the
prestigious INSEAD. He is also member of the 37th SMP of the
Lagos Business School and Honorary Senior Member of CIBN. He
is an avid golf player and happily married with children.
PROFILE OF DIRECTORS

POLARIS BANK ANNUAL REPORT & FINANCIAL STATEMENTS 2019
43
INNOCENT C. IKEExecutive Director
Innocent is a leading finance and banking professional with over
three decades of outstanding career in leading commercial
banks in Nigeria. He has been involved in developing and
executing major corporate transformation and turn-around
projects in the nation's financial services industry leveraging a
combination of deep industry knowledge as well as the
application of relevant technologies and innovation.
He was appointed Executive Director (Technology & Services) in
the defunct Skye Bank Plc in July 2016, following the Central Bank
of Nigeria's intervention in the bank. He was, subsequently
reappointed in the same capacity in Polaris Bank Limited in
September 2018, upon the acquisition of the assets and some
liabilities of the defunct Skye Bank Plc by Polaris Bank. He
currently leads the bank's on-going Digital Transformation
Project while also overseeing the South-South/South-East
Directorate.
Prior to his appointment on the Board of Skye Bank, Innocent
was an Executive Director in Keystone Bank Limited, where he
recorded outstanding contributions and achievements resulting
in the successful turn-around, repositioning and eventual
divestment of the bank by the Assets Management Corporation
of Nigeria (AMCON).
Before joining the Board of Keystone Bank in August 2014,
Innocent had played key roles in the growth and transformation
of Access Bank Plc, where, during a ten-year span, he rose to
become a General Manager with responsibilities in the Corporate
& Commercial Banking Divisions, and was at various times
responsible for the Federal Capital Territory and the South-South
Regions of the Bank.
Innocent has also been Chairman of Skye Bank Gambia Limited,
and is currently a director of Mainone Cable Company Limited,
Unified Payments Systems Limited and Pay Attitude Global
Limited.
To prepare him for a successful career in the financial services
industry and leadership roles in the corporate world, Innocent
had acquired very sound professional training and exposure in
some of Nigeria's most reputable financial institutions. He
worked in the erstwhile Fortune international Bank Plc as well as
GT Bank Plc. where he spent most of the early years of his career
and occupied several key and sensitive positions in Treasury,
Currency Trading, Commercial Banking as well as Banking
Operations Units. He equally trained and qualified as a Chartered
Accountant in the international accounting firm of Deloitte,
where he handled key audit and consulting assignments.
Innocent, a graduate of Accounting from the University of Lagos,
where he was the Best Graduating Student in 1988, is a Fellow of
the Institute of Chartered Accountants of Nigeria (ICAN), a
Certified IFRS expert and an Honorary Senior Member of the
Chartered Institute of Bankers of Nigeria (CIBN). He holds an
Executive Certificate in Strategy & Innovation from MIT Sloan
School of Management, Boston and has at various times
attended global management and leadership programs in
world-class institutions including Harvard Business School,
Wharton Business School, International Management
Development Institute (IMD) Switzerland, etc. He is also a
Member of Institute of Directors (IOD).
Innocent is blessed with a lovely wife and four wonderful
children.
RECOMMENDATION FOR RE-ELECTION OF NON-EXECUTIVE
DIRECTORS
In accordance with the provisions of Section 259 of the
Companies and Allied Matters Act, 2004, at the first Annual
General Meeting all the directors shall retire from office, and at
the Annual General Meeting in every subsequent year, one-third
of the directors for the time-being shall retire from office.
The 2020 Annual General Meeting of the Bank, being its first, all
the Non-executive Directors shall retire from office and being
eligible, will present themselves for re-election. Their
individual/peer evaluation conducted as part of the annual
Board evaluation for the years ended December 31, 2018 and
December 31, 2019 were satisfactory.
PROFILE OF DIRECTORS

POLARIS BANK ANNUAL REPORT & FINANCIAL STATEMENTS 2019
44
CORPORATE STRUCTURE AND BUSINESS
Polaris Bank Limited is a private limited liability company
incorporated as Polaris Limited on September 14, 2018 and re-
named as Polaris Bank Limited, by special resolution on
September 21, 2018, in accordance with the provisions of the
Companies and Allied Matters Act, 1990. It was issued a banking
license on September 21, 2018 to carry on Commercial Banking
Business on National Basis. The Head Office of the Bank is
situated at No. 3, Akin Adesola Street, Victoria Island, Lagos.
Polaris Bank Limited was established by the Central Bank of
Nigeria (CBN), in consultation with the Nigeria Deposit Insurance
Corporation (NDIC). The Bank was therefore established to
assume all the assets and some of the liabilities of Skye Bank,
and was fully capitalized by the Asset Management Company of
Nigeria (AMCON), an agency of the CBN.
Polaris Bank leverages past lessons, and therefore has a culture
of entrenching sound corporate governance and risk
management practices. Also, the Bank recognizes that excellent
service delivery through innovation of products and services that
are well adapted to the needs of its retail, commercial and
corporate customers, is pivotal to its growth in market influence.
These are in turn driven by cutting edge Information Technology
and a digitalized system, in view of the evolving role of
Technology as not only an enabler of business, but also, as
business in itself. The Bank therefore continuously invests in
digital transformation and upgrades in line with the changing
environment, to meet its overarching goal of excellent service
delivery.
The Bank’s consolidated financial statements have been
prepared in accordance with the International Financial
Reporting Standard (IFRS) and extant CBN regulations.
1. OPERATING RESULTS
2. ANALYSIS OF SHAREHOLDING
The Bank’s authorized share capital is N25,000,000,000 divided
into 25,000,000,000 ordinary shares of N1 each. The issued
shares are 25,000,000,000. The fully paid-up share capital is
N25,000,000,000
The Bank’s shares are wholly owned by AMCON through the
following nominees:
REPORT OF THE
directorsFOR THE YEAR ENDED DECEMBER 31, 2019
In compliance with the Companies & Allied Matters Act, the Directors of Polaris Bank Limited arepleased to present to members the audited financial statements of the Bank for the year ended
31 December 2019.
Group Bank
31 December
2019
21 September -
31 December
2018
31 December
2019
21 September -
31 December
2018
Gross earnings 150,361 37,392 150,848 37,392
Profit before tax 27,342 2,456 27,829 2,456
Tax (479) (25) (479) (25)
Profit a�er tax 26,863 2,431 27,350
Continuing operations 26,863 2,431 27,350 2,431
Discontinued operations ( 573) 425 - -
S/N Nominee No. of Shares Held % of Shares Held
1. Alpharea Limited 12,500,000,000 50
2. Omicron Fox Limited 12,500,000,000 50

POLARIS BANK ANNUAL REPORT & FINANCIAL STATEMENTS 2019
45
3. DIRECTORS
The following were Directors of the Bank who served during the
period under review:
4. DIRECTORS’ FEES
The Annual Fees for the Chairman was proposed at N5million,
while the fees for other Directors was proposed at N3.5million
each. Only Non-Executive Directors are entitled to Annual fees.
5. PROPERTY, PLANT AND EQUIPMENT
Details of changes in fixed assets during the year are shown in the
note to the financial statements on page 139. In the opinion of
Directors, the market value of the Bank’s properties is not less
than the value shown in the financial statements.
6. DIRECTORS’ INTERESTS
As at December 31, 2019, the Directors held no interests in the
issued Share Capital of the Bank, directly or indirectly, the Bank
being wholly owned by AMCON through nominees.
7. EMPLOYMENT & EMPLOYEE RELATIONSHIP
Polaris Bank recognises that its employees have the ability to
significantly impact productivity, customer satisfaction,
retention, growth and its bottom line, and that an organization is
only as good as its people. These realities guide its strategy to
attract, develop, engage and retain talents, and the Bank is fully
committed to creating a work environment that enables
employees to realize their full potential and improve
organizational performance. As part of our efforts to motivate
staff adequately, substantial rewards are made available to staff
members who perform excellently, in accordance with the Bank’s
Rewards and Recognition policy.
The Executive Management of the Bank operates an open-door
policy and employees can approach them to express their
concerns and their viewpoints confidently. In addition, the Bankhas a Whistleblowing Policy, through which employees can draw
attention to various issues. Employees also have access to the
telephone numbers and mailing addresses of all other staff
members.
Code of Conduct & Ethics
Polaris Bank employees are bound by the Bank’s Code of
Conduct & Ethics, which is attested to at the point of
employment, as well as annually by all employees. The Bank’s
Directors are bound by the CBN Code of Conduct for Directors,
which is also annually attested to by all Directors.
Employment of Disabled Persons
Polaris Bank is an equal opportunity employer. It appreciates the
fact that disabled people can participate in, and contribute to
society in all aspects of life, and therefore provides equal
opportunities for disabled persons, ensuring that there is no
discrimination against them on recruitment for employment,
determination of salaries, promotion and other benefits. The
Bank also considers of utmost importance, the welfare and
rehabilitation of staff members who may unfortunately become
disabled during the course of their working life. Currently, there
are no disabled employees in the Bank.
Occupational Health and Safety
Polaris Bank ensures that occupational, health and safety risks
are managed and controlled adequately and that there is full
compliance with core standards on the subject. The Bank has a
formal Policy on Health, Safety and Environment. Fire prevention
and fire-fighting equipment are installed in strategic locations of
the premises and regular fire drills are carried out bankwide. Also,
the Bank provides an organised health scheme platform to all
levels of staff through partnerships with various Health
Management Organisations.
The Group operates both a Personal Accident and Workmen’s
Compensation insurance covers for the benefit of its employees.
It also operates a contributory pension plan in line with the
Pension Reform Act, 2004.
Welfare of Employees
A healthy and motivated workforce is at the forefront of the
Bank’s goals, given its impact on employee productivity. In
addition to an effective health insurance scheme operated by the
Bank for its employees and their immediate family members, the
Bank organizes periodic health checks and counseling for
employees. Regular fitness exercises are held to inspire physical
activity which is key to all-round wellness. There are also regular
health talks and education on healthy living through invaluable
information shared on the Bank’s
REPORT OF THE DIRECTORS
NAME CAPACITY
1. Mr. Muhammad K. Ahmad Chairman
2. Mr. Adetokunbo M. Abiru MD/CEO
3. Mr. Abdullahi S. Mohammed Executive Director
4. Mr. Innocent C. Ike Executive Director
5. Alhaji Abdullahi M. Umar Non-Executive Director
6. Mr. Austin E. Jo-Madugu Non-Executive Director
7. Mr. Bata G. Wakawa Non-Executive Director
8. Mr. Olu O. Odugbemi Non-Executive Director
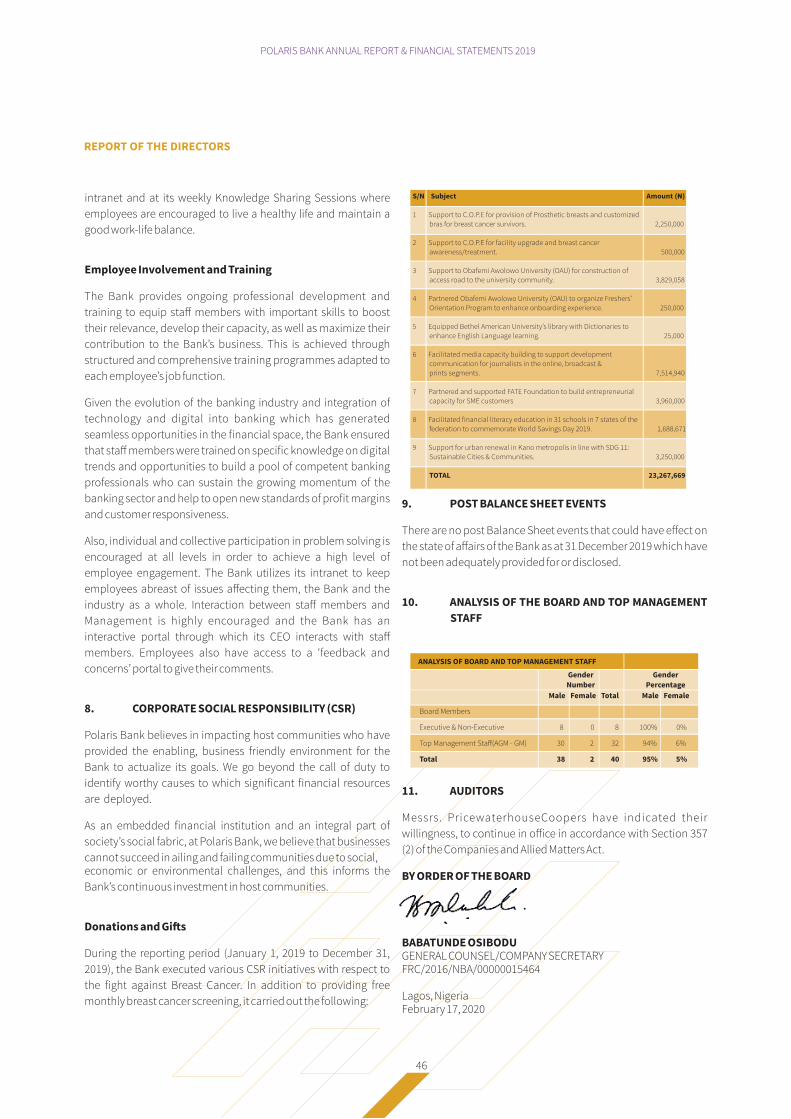
POLARIS BANK ANNUAL REPORT & FINANCIAL STATEMENTS 2019
46
intranet and at its weekly Knowledge Sharing Sessions where
employees are encouraged to live a healthy life and maintain a
good work-life balance.
Employee Involvement and Training
The Bank provides ongoing professional development and
training to equip staff members with important skills to boost
their relevance, develop their capacity, as well as maximize their
contribution to the Bank’s business. This is achieved through
structured and comprehensive training programmes adapted to
each employee’s job function.
Given the evolution of the banking industry and integration of
technology and digital into banking which has generated
seamless opportunities in the financial space, the Bank ensured
that staff members were trained on specific knowledge on digital
trends and opportunities to build a pool of competent banking
professionals who can sustain the growing momentum of the
banking sector and help to open new standards of profit margins
and customer responsiveness.
Also, individual and collective participation in problem solving is
encouraged at all levels in order to achieve a high level of
employee engagement. The Bank utilizes its intranet to keep
employees abreast of issues affecting them, the Bank and the
industry as a whole. Interaction between staff members and
Management is highly encouraged and the Bank has an
interactive portal through which its CEO interacts with staff
members. Employees also have access to a ‘feedback and
concerns’ portal to give their comments.
8. CORPORATE SOCIAL RESPONSIBILITY (CSR)
Polaris Bank believes in impacting host communities who have
provided the enabling, business friendly environment for the
Bank to actualize its goals. We go beyond the call of duty to
identify worthy causes to which significant financial resources
are deployed.
As an embedded financial institution and an integral part of
society’s social fabric, at Polaris Bank, we believe that businesses
cannot succeed in ailing and failing communities due to social,economic or environmental challenges, and this informs the
Bank’s continuous investment in host communities.
Donations and Gi�s
During the reporting period (January 1, 2019 to December 31,
2019), the Bank executed various CSR initiatives with respect to
the fight against Breast Cancer. In addition to providing free
monthly breast cancer screening, it carried out the following:
9. POST BALANCE SHEET EVENTS
There are no post Balance Sheet events that could have effect on
the state of affairs of the Bank as at 31 December 2019 which have
not been adequately provided for or disclosed.
10. ANALYSIS OF THE BOARD AND TOP MANAGEMENT
STAFF
11. AUDITORS
Messrs. PricewaterhouseCoopers have indicated their
willingness, to continue in office in accordance with Section 357
(2) of the Companies and Allied Matters Act.
BY ORDER OF THE BOARD
BABATUNDE OSIBODUGENERAL COUNSEL/COMPANY SECRETARYFRC/2016/NBA/00000015464
Lagos, NigeriaFebruary 17, 2020
S/N Subject Amount (N)
1 Support to C.O.P.E for provision of Prosthetic breasts and customized
bras for breast cancer survivors. 2,250,000
2 Support to C.O.P.E for facility upgrade and breast cancer
awareness/treatment. 500,000
3 Support to Obafemi Awolowo University (OAU) for construction of
access road to the university community. 3,829,058
4 Partnered Obafemi Awolowo University (OAU) to organize Freshers’
Orientation Program to enhance onboarding experience. 250,000
5 Equipped Bethel American University’s library with Dictionaries to
enhance English Language learning. 25,000
6 Facilitated media capacity building to support development
communication for journalists in the online, broadcast &
prints segments. 7,514,940
7 Partnered and supported FATE Foundation to build entrepreneurial
capacity for SME customers 3,960,000
8 Facilitated financial literacy education in 31 schools in 7 states of the
federation to commemorate World Savings Day 2019. 1,688,671
9 Support for urban renewal in Kano metropolis in line with SDG 11:
Sustainable Cities & Communities. 3,250,000
TOTAL 23,267,669
REPORT OF THE DIRECTORS
ANALYSIS OF BOARD AND TOP MANAGEMENT STAFF
Gender
Number
Male Female Total
Gender
Percentage
Male Female
Board Members
Executive & Non-Executive 8 0 8 100% 0%
Top Management Staff(AGM - GM) 30 2 32 94% 6%
Total 38 2 40 95% 5%

POLARIS BANK ANNUAL REPORT & FINANCIAL STATEMENTS 2019
47

POLARIS BANK ANNUAL REPORT & FINANCIAL STATEMENTS 2019
48
· Proper accounting records are maintained;
· Applicable accounting standards are followed;
· Suitable accounting policies are adopted and consistently applied;
· Judgments and estimates made are reasonable and prudent;
· The going concern basis is used, unless it is inappropriate to presume that the Bank will continue in business; and
· Internal control procedures are instituted which as far as reasonably possible, safeguard the assets of the Bank and
prevent and detect fraud and other irregularities.
The Directors accept responsibility for the preparation of the financial statements in accordance with the International Financial
Reporting Standards (IFRS) and in the manner required by the Companies and Allied Matters Act, the Financial Reporting Council
of Nigeria Act 2011, the Banks and other Financial Institutions Act, the Central Bank of Nigeria Prudential guidelines and other
relevant regulations issued by the Central Bank of Nigeria.
The Directors accept responsibility for the maintenance of accounting records that may be relied upon in the preparation of the
financial statements as well as adequate systems of financial control.
Nothing has come to the attention of the Directors to indicate that the Group will not remain a going concern for at least twelve
months from the date of this statement.
SIGNED ON BEHALF OF THE BOARD OF DIRECTORS BY:
IN RELATION TO THE FINANCIAL STATEMENTS FOR THE YEAR ENDED DECEMBER 31, 2019
MR ADETOKUNBO M. ABIRU
MANAGING DIRECTOR
FRC/2017/ICAN/00000016556
February 13, 2020
MR MUHAMMAD K. AHMAD, OON
CHAIRMAN
FRC/2017/IODN/0000002581
February 13, 2020
STATEMENT OF DIRECTORS’
responsibilities
In accordance with the provisions of the Companies and Allied Matters Act and the Banks and
Other Financial Institutions Act, the Directors are responsible for the preparation of the financial
statements which give a true and fair view of the state of affairs of the Bank and of the profit or
loss for the period 1 January 2019 to 31 December 2019 and in so doing they ensure that:
INDEPENDENT AUDITORSREPORT
49

POLARIS BANK ANNUAL REPORT & FINANCIAL STATEMENTS 2019
50
Our opinion
In our opinion, the consolidated and separate financial
statements give a true and fair view of the consolidated and
separate financial position of Polaris Bank Limited (“the bank”)
and its subsidiaries (together “the group”) as at 31 December
2019, and of their consolidated and separate financial
performance and their consolidated and separate cash flows for
the year then ended in accordance with International Financial
Reporting Standards and the requirements of the Companies
and Allied Matters Act, the Banks and Other Financial Institutions
Act and the Financial Reporting Council of Nigeria Act.
What we have audited
Polaris Bank Limited’s consolidated and separate financial
statements comprise: . the consolidated and separate statements of
comprehensive income for the year ended 31
December 2019;
. the consolidated and separate statements of financial
position as at 31 December 2019;
. the consolidated and separate statements of changes
in equity for the year then ended;
. the consolidated and separate statements of cash
flows for the year then ended; and
. the notes to the consolidated and separate financial
statements, which include a summary of significant
accounting policies.
Basis for opinion
We conducted our audit in accordance with International
Standards on Auditing (ISAs). Our responsibilities under those
standards are further described in the Auditor’s responsibilities
for the audit of the consolidated and separate financial
statements section of our report.
We believe that the audit evidence we have obtained is sufficient
and appropriate to provide a basis for our opinion.
Independence
We are independent of the Group in accordance with the
International Code of Ethics for Professional Accountants
(including International Independence Standards), i.e. the IESBA
Code issued by the International Ethics Standards Board for
Accountants. We have fulfilled our other ethical responsibilities
in accordance with the IESBA Code.
Key audit matters
Key audit matters are those matters that, in our professional
judgment, were of most significance in our audit of the
consolidated and separate financial statements of the current
period. These matters were addressed in the context of our audit
of the consolidated and separate financial statements as a
whole, and in forming our opinion thereon, and we do not
provide a separate opinion on these matters.
INDEPENDENT AUDITOR’S
reportTO THE MEMBERS OF POLARIS BANK LIMITED
Report on the audit of the consolidated and separate financial statements

POLARIS BANK ANNUAL REPORT & FINANCIAL STATEMENTS 2019
51
Impairment allowance on loans and advances N 73 billion (
See note 2.6, 6 and 21)
Gross loans and advances as at 31 December 2019 was N 261
billion and related impairment allowance was N 73 billion.
We focused on this area because of the significant value of loans
and advances and because the directors make significant
judgement in measuring credit risk of loans and advances.
Key areas of judgement include:
. Determination of the criteria for assessing significant
increase in credit risk (SICR) and definition of default;
. Determination of the appropriateness of the expected
credit loss model used to determine the credit loss
estimate;
. Determination of forward looking information applied
within the expected credit loss models;
. Segmentation of the portfolio to reflect shared risk;
. Determination of the 12 month and lifetime probability
of default (PD);
. Determination of the lifetime exposure at default (EAD)
as well as assessing the credit conversion factor ;and
. Estimation of loss given default (LGD) by considering
collateral values having adjusted for haircut and time
value of money as well as estimation of the amount
and timing of recoveries on unsecured exposures.
This is considered a key audit matter in the consolidated and
separate financial statements
How our audit addressed the key audit matter
We adopted a full substantive approach in assessing the loan loss
impairment made by directors.
We assessed directors staging criteria against its actual
experience, the provisions of IFRS 9, “Financial instruments” as
well as the days past due presumption for significant increase in
credit risk and determination of default.
We applied a risk based testing approach to evaluate the
reasonableness of directors staging by selecting a sample of
credit facilities and reviewing related customer files and account
statements.
We checked the details of the borrowers’ account history, the
nature of the facility, the industry and other factors that could
indicate deterioration in the financial condition of the borrowers
and their capacity to repay.
For other facilities not subjected to detailed review of customer
files, we assessed a sample from this population for impairment
triggers using computer assisted audit techniques. Using our
credit modelling experts we:
. Reviewed management’s definition of default to
ensure that it considers both quantitative and
qualitative factors, is consistent with internal risk
management processes, considers the backstop
criteria and is also in line with regulatory requirements;
. Re v i e w e d m o d e l m et h o d o l o g y a d o p te d b y
management in estimating the risk parameters, input
models, as well as the ECL calculation engine for
reasonableness;
. Assessed the reasonableness of forward looking
information incorporated into the impairment
calculations by corroborating management’s
assumptions using publicly available information
from external sources;
. Challenged directors judgement on portfolio
segmentation to ensure segmentation of portfolio to
reflect shared risk; and
. We independently determined the PD, EAD and LGD
using management data.
. We reviewed the CCF applied in modelling the EAD for
undrawn commitments, as well as the uncrystallised
exposures for offbalance sheet facilities
We tested the valuation of collaterals by evaluating the valuation
reports and assessing directors overlays made on the
recoverability of collateral considering the current economic
condition and the state of the assets held as collateral.
We reviewed the IFRS 9 disclosures for reasonableness.
Other information
The directors are responsible for the other information. The other
information obtained at the date of this auditor’s report are
General information, Report of the Directors, Statement of
Directors’ responsibilities, Sustainability Report and Value added
statement but does not include the consolidated and separate
financial statements and our auditor’s report thereon.
Our opinion on the consolidated and separate financial
statements does not cover the other information and we do not
express an audit opinion or any form of assurance conclusion
thereon.
INDEPENDENT AUDITOR’S REPORT

POLARIS BANK ANNUAL REPORT & FINANCIAL STATEMENTS 2019
52
In connection with our audit of the consolidated and separate
financial statements, our responsibility is to read the other
information and, in doing so, consider whether the other
information is materially inconsistent with the consolidated and
separate financial statements or our knowledge obtained in the
audit, or otherwise appears to be materially misstated.
If, based on the work we have performed on the other
information that we obtained prior to the date of this auditor’s
report, we conclude that there is a material misstatement of this
other information, we are required to report that fact. We have
nothing to report in this regard.
Responsibilities of the directors and those charged with
governance for the consolidated and separate financial
statements
The directors are responsible for the preparation of the
consolidated and separate financial statements that give a true
and fair view in accordance with International Financial
Reporting Standards and the requirements of the Companies
and Allied Matters Act, the Financial Reporting Council of Nigeria
Act, the Banks and Other Financial Institutions Act, and for such
internal control as the directors determine is necessary to enable
the preparation of consolidated and separate financial
statements that are free from material misstatement, whether
due to fraud or error.
In preparing the consolidated and separate financial statements,
the directors are responsible for assessing the Group’s ability to
continue as a going concern, disclosing, as applicable, matters
related to going concern and using the going concern basis of
accounting unless the directors either intend to liquidate the
Group or to cease operations, or have no realistic alternative but
to do so.
Those charged with governance are responsible for overseeing
the Group’s financial reporting process.
Auditor’s responsibilities for the audit of the consolidated
and separate financial statements
Our objectives are to obtain reasonable assurance about
whether the consolidated and separate financial statements as a
whole are free from material misstatement, whether due to fraud
or error, and to issue an auditor’s report that includes our
opinion. Reasonable assurance is a high level of assurance, but is
not a guarantee that an audit conducted in accordance with ISAs
will always detect a material misstatement when it exists.
Misstatements can arise from fraud or error and are considered
material if, individually or in the aggregate, they could reasonably
be expected to influence the economic decisions of users taken
on the basis of these consolidated and separate financial
statements.
As part of an audit in accordance with ISAs, we exercise
professional judgment and maintain professional scepticism
throughout the audit. We also:
. Identify and assess the risks of material misstatement
of the consolidated and separate financial statements,
whether due to fraud or error, design and perform
audit procedures responsive to those risks, and obtain
audit evidence that is sufficient and appropriate to
provide a basis for our opinion. The risk of not
detecting a material misstatement resulting from
fraud is higher than for one resulting from error, as
fraud may involve collusion, forgery, intentional
omissions, misrepresentations, or the override of
internal control.
. Obtain an understanding of internal control relevant to
the audit in order to design audit procedures that are
appropriate in the circumstances, but not for the
purpose of expressing an opinion on the effectiveness
of the Group’s internal control.
. Evaluate the appropriateness of accounting policies
used and the reasonableness of accounting estimates
and related disclosures made by the directors.
. Conclude on the appropriateness of the directors’ use
of the going concern basis of accounting and, based on
the audit evidence obtained, whether a material
uncertainty exists related to events or conditions that
may cast significant doubt on the Group’s ability to
continue as a going concern. If we conclude that a
material uncertainty exists, we are required to draw
attention in our auditor’s report to the related
disclosures in the consolidated and separate financial
statements or, if such disclosures are inadequate, to
modify our opinion. Our conclusions are based on the
audit evidence obtained up to the date of our auditor’s
report. However, future events or conditions may
cause the Group to cease to continue as a going
concern.
. Evaluate the overall presentation, structure and
content of the consolidated and separate financial
statements, including the disclosures, and whether
the consolidated and separate financial statements
represent the underlying transactions and events in a
manner that achieves fair presentation.
INDEPENDENT AUDITOR’S REPORT

POLARIS BANK ANNUAL REPORT & FINANCIAL STATEMENTS 2019
53
. Obtain sufficient appropriate audit evidence regarding
the financial information of the entities or business
activities within the Group to express an opinion on
the consolidated and separate financial statements.
We are responsible for the direction, supervision and
performance of the group audit. We remain solely
responsible for our audit opinion.
We communicate with those charged with governance
regarding, among other matters, the planned scope and timing
of the audit and significant audit findings, including any
significant deficiencies in internal control that we identify during
our audit.
From the matters communicated with those charged with
governance, we determine those matters that were of most
significance in the audit of the consolidated and separate
financial statements of the current period and are therefore the
key audit matters. We describe these matters in our auditor’s
report unless law or regulation precludes public disclosure about
the matter or when, in extremely rare circumstances, we
determine that a matter should not be communicated in our
report because the adverse consequences of doing so would
reasonably be expected to outweigh the public interest benefits
of such communication.
Report on other legal and regulatory requirements
The Companies and Allied Matters Act and the Banks and Other
Financial Institutions Act require that in carrying out our audit we
consider and report to you on the following matters. We confirm
that:
i) we have obtained all the information and explanations
which to the best of our knowledge and belief were
necessary for the purposes of our audit;
ii) the bank has kept proper books of account, so far as
appears from our examination of those books and
returns adequate for our audit have been received
from branches not visited by us;
iii) the bank’s statement of financial position and
statement of comprehensive income are in agreement
with the books of account;
iv) the information required by Central Bank of Nigeria
Circular BSD/1/2004 on insider related credits is
disclosed in Note 40.7 to the consolidated and
separate financial statements; and
v) as disclosed in Note 43.2 to the consolidated and
separate financial statements, the bank paid penalties
in respect of contraventions of certain sections of the
Banks and Other Financial Institutions Act and
relevant circulars issued by the Central Bank of Nigeria
during the year ended 31 December 2019.
INDEPENDENT AUDITOR’S REPORT
For: PricewaterhouseCoopers 15 April 2020
Chartered Accountants
Lagos, Nigeria
Engagement Partner: Samuel Abu
FRC/2013/ICAN/ 00000001495


CONSOLIDATED AND SEPARATEFINANCIAL STATEMENTSFOR THE YEAR ENDED 31 DECEMBER 2019
55

POLARIS BANK ANNUAL REPORT & FINANCIAL STATEMENTS 2019
56
STATEMENT OF COMPREHENSIVE INCOMEFor the year ended 31 December 2019
(All amounts in millions of Naira unless otherwise stated)
Group Group Bank 21 September - 21 September -31
December 31 December31
December 31 December
2019 2018 2019 2018
Notes
Interest income on amortized cost financial assets 7 131,650 24,374 131,650 24,374Interest income on fair value through profit/loss 8 1,961 215 1,961 215Interest expense 9 (45,814) (15,212) (45,814) (15,212)
Net interest income 87,797 9,377 87,797 9,377Impairment loss on loans and other financial assets 14 (14,126) (2,796) (14,126) (2,796)
73,671 6,581 73,671 6,581
Net fee and commission income 10 & 11 8,536 2,159 8,536 2,159Net trading and foreign exchange income 12 950 8,820 950 8,820Other operating income 13 3,997 1,066 4,484 1,066
Net operating profit 87,154 18,626 87,641 18,626
Employee benefit costs 15 (26,428) (6,606) (26,428) (6,606)Administration and general expenses 16 (28,863) (8,457) (28,863) (8,457)Depreciation and amortisation 17 (4,521) (1,107) (4,521) (1,107)
Profit before tax 27,342 2,456 27,829 2,456
Taxation 34 (479) (25) (479) (25)
Profit for the period from continuing operations 26,863 2,431 27,350 2,431
Profit/ (loss) for the period from discontinued operations (573) 425 - -
Profit for the period 26,290 2,856 27,350 2,431
Profit attributable to:Owners of the Bank 26,211 2,777 27,350 2,431
Continuing operations 26,863 2,431 27,350 2,431Discontinued operations (652) 346 - -
Non-controlling interests 79 79 - -Continuing operations - - - -Discontinued operations 79 79 - -
26,290 2,856 27,350 2,431Other comprehensive income:Items that may be subsequently reclassified to
profit or lossCurrency translation differences arising from foreign
operations (388) 1,880 - -Items that will not be reclassified to profit or
loss
Net gains on investments in equity instruments
designated at fair value through other
comprehensive income 2,677 98 2,677 98
Other comprehensive income for the period,
net of tax 2,289 1,978 2,677 98
Total comprehensive income for the period 28,579 4,834 30,027 2,529
Total comprehensive income attributable to:
Owners of the bank 28,500 4,755 30,027 2,529Continuing operations 29,152 4,409 30,027 2,529Discontinued operations (652) 346 - -
Non-controlling interests 79 79 - -Continuing operations - - - -Discontinued operations 79 79 - -
28,579 4,834 30,027 2,529
The accompanying notes form an integral part of these financial statements
Bank

POLARIS BANK ANNUAL REPORT & FINANCIAL STATEMENTS 2019
57
STATEMENT OF FINANCIAL POSITIONAs at 31 December 2019
(All amounts in millions of Naira unless otherwise stated)
AssetsCash and balances with central banksDue from banks and other financial institutionsFinancial assets held at fair value through
profit or lossLoans and advances to customersInvestment securities: - Amortised cost - Fair value through other comprehensive
Income (FVTOCI)Assets pledged as collateralPrepayment and other assetsOther loans and receivablesRight of use assetsProperty, plant and equipmentIntangible assets
Assets classified as held for sale
Total assets
LiabilitiesDue to other financial institutionsDeposits from customersLease liabilitiesBorrowings from local and foreign
institutionsCurrent tax liabilityAccruals and other liabilitiesRetirement benefit obligation
Liabilities classified as held for sale
Total liabilities
EquityShare capitalShare premiumRetained earningsReorganisation reserveOther reserves
Non-controlling interest
Total equity
Total equity and liabilities
Mr Muhammad K. Ahmad, OON Mr Adetokunbo. M. Abiru Mr Pius OlaoyeChairman Managing Director / CEOFRC NO: 2017/IODN/0000002581
The accompanying notes form an integral part of these financial statements
Chief Financial Officer FRC No: 2016/ICAN/00000014239 FRC No: 2017/ICAN/00000016556
The financial statements were approved and authorised for issue by the Board of Directors on 13 February 2020 and
signed on its behalf by:
Group Group Bank Bank
31 December 31 December 31 December 31 December2019 2018 2019 2018
26,484 28,026 26,484 28,02662,076 68,966 62,076 68,966
1,264 57 1,264 57188,738 340,050 188,738 340,050
517,071 531,805 517,071 531,805
17,362 14,634 17,362 14,63442,084 58,262 42,084 58,26248,046 54,795 48,046 55,580
182,594 - 182,594 -3,637 - 3,637 -
51,623 48,311 51,623 48,311180 284 180 284
1,141,159 1,145,190 1,141,159 1,145,975
15,485 23,468 2,107 4,120
1,156,644 1,168,658 1,143,266 1,150,095
- 25 - 25857,885 861,044 857,885 861,044
2,645 - 2,645 -
100,920 137,694 100,920 137,694819 365 819 365
97,945 97,076 97,997 97,99411 11 11 11
1,060,225 1,096,215 1,060,277 1,097,133
9,529 13,686 - -
1,069,754 1,109,901 1,060,277 1,097,133
25,000 25,000 25,000 25,000873,450 873,450 873,450 873,450
3,467 (26,004) 4,395 (26,215)(848,017) (848,017) (848,017) (848,017)
31,796 32,767 28,161 28,74485,696 57,196 82,989 52,962
Notes1819
2021
22
23242525b262829
30
313227
33343536
30
37a37b
37e37c
37d 1,194 1,561 - -
86,890 58,757 82,989 52,962
1,156,644 1,168,658 1,143,266 1,150,095

(All a
mounts
in m
illions o
f N
air
a u
nle
ss o
therw
ise s
tate
d)
Gro
up
Sh
are
Sh
are
Sta
tuto
ryR
eg
ula
tory
Tra
nsla
tio
nFair
Valu
eR
eta
ined
Reo
rgan
isati
on
In
terv
en
tio
n
fun
dN
on
-
co
ntr
ollin
gTo
tal
cap
ital
pre
miu
mre
serv
ere
serv
ere
serv
eR
eserv
eEarn
ing
sre
serv
ere
serv
eTo
tal
inte
rest
Eq
uit
y
At
01
Jan
uary
20
19
25
,00
08
73
,45
08
57
27
,91
73
,89
59
8(2
6,0
04
)(8
48
,01
7)
-5
7,1
96
1,5
61
58
,75
7
Pro
fit
for
the p
eriod
--
--
--
26,2
11
26,2
11
79
26,2
90
Oth
er
co
mp
reh
en
siv
e in
co
me,
net
of
tax
Tra
nsla
tion r
eserv
e-
--
-(3
88)
--
-(3
88)
-(3
88)
Net
gain
s o
n investm
ents
in e
quity
instr
um
ents
desig
nate
d a
t FV
TO
CI
--
--
-2,6
77
--
-2,6
77
-2,6
77
To
tal o
ther
co
mp
reh
en
siv
e
inco
me
--
--
(3
88
)2
,67
7-
--
2,2
89
-2
,28
9
To
tal co
mp
reh
en
siv
e in
co
me
--
--
(3
88
)2
,67
72
6,2
11
--
28
,50
07
92
8,5
79
Tra
nsacti
on
s w
ith
ow
ners
Elim
ination o
f non-c
ontr
ollin
g
inte
rest
at
dis
posal of subsid
iary
--
--
--
--
-(4
46)
(446)
Tra
nsfe
rs for
the p
eriod
--
9,5
73
(27,9
17)
-3,2
60
-15,0
85
--
-
To
tal tr
an
sacti
on
s w
ith
ow
ners
--
9,5
73
(2
7,9
17
)-
-3
,26
0-
15
,08
5-
(4
46
)(4
46
)
Bala
nce a
t 3
1 D
ecem
ber
20
19
25
,00
08
73
,45
01
0,4
30
-3
,50
72
,77
53
,46
7(8
48
,01
7)
15
,08
58
5,6
97
1,1
94
86
,89
0
Att
rib
uta
ble
to
eq
uit
y h
old
ers
of
the p
are
nt
ST
AT
EM
EN
T O
F C
HA
NG
ES
IN
EQ
UIT
YFo
r th
e ye
ar
end
ed 3
1 D
ece
mb
er 2
019
PO
LAR
IS B
AN
K A
NN
UA
L R
EP
OR
T &
FIN
AN
CIA
L ST
ATE
ME
NTS
201
9
58

ST
AT
EM
EN
T O
F C
HA
NG
ES
IN
EQ
UIT
YFo
r th
e ye
ar
end
ed 3
1 D
ece
mb
er 2
019
PO
LAR
IS B
AN
K A
NN
UA
L R
EP
OR
T &
FIN
AN
CIA
L ST
ATE
ME
NTS
201
9
59
(All a
mounts
in m
illions o
f N
air
a u
nle
ss o
therw
ise s
tate
d)
Gro
up
Sh
are
Sh
are
Sta
tuto
ryR
eg
ula
tory
Tra
nsla
tio
nFair
Valu
e
Accu
mu
late
dR
eo
rgan
isati
on
No
n-
co
ntr
ollin
gTo
tal
cap
ital
pre
miu
mre
serv
ere
serv
ere
serv
eR
eserv
elo
ss
reserv
eTo
tal
inte
rest
Eq
uit
y
At
21
Sep
tem
ber
20
18
--
--
1,9
52
-(8
6)
(8
48
,01
7)
(8
46
,15
1)
1,5
38
(8
44
,61
3)
Pro
fit
for
the p
eriod
--
--
--
2,8
56
2,8
56
(79)
2,7
77
Oth
er
co
mp
reh
en
siv
e in
co
me,
net
of
tax
Tra
nsla
tion r
eserv
e-
--
-1,9
43
--
1,9
43
102
2,0
45
Net
gain
s o
n investm
ents
in e
quity
instr
um
ents
desig
nate
d a
t FV
TO
CI
--
--
-98
--
98
-98
To
tal o
ther
co
mp
reh
en
siv
e
inco
me
--
--
1,9
43
98
--
2,0
41
10
22
,14
3
To
tal co
mp
reh
en
siv
e in
co
me
--
--
1,9
43
98
2,8
56
-4
,89
72
34
,92
0
Tra
nsacti
on
s w
ith
ow
ners
Issue o
f share
s t
o A
MC
ON
25,0
00
873,4
50
--
--
898,4
50
898,4
50
Tra
nsfe
rs for
the p
eriod
--
857
27,9
17
-(2
8,7
74)
--
--
To
tal tr
an
sacti
on
s w
ith
ow
ners
25
,00
08
73
,45
08
57
27
,91
7-
-(2
8,7
74
)-
89
8,4
50
-8
98
,45
0
Bala
nce a
t 3
1 D
ecem
ber
20
18
25
,00
08
73
,45
08
57
27
,91
73
,89
59
8(2
6,0
04
)(8
48
,01
7)
57
,19
61
,56
15
8,7
57
Att
rib
uta
ble
to
eq
uit
y h
old
ers
of
the p
are
nt

(All a
mounts
in m
illions o
f N
aira u
nle
ss o
therw
ise s
tate
d)
Ban
k
Sh
are
Sh
are
Sta
tuto
ryR
eg
ula
tory
Fair
valu
eR
eta
ined
R
eo
rgan
isati
on
In
terv
en
tio
n
fun
d
cap
ital
pre
miu
mre
serv
ere
serv
ere
serv
eearn
ing
sre
serv
ere
serv
eTo
tal
At
01
Jan
uary
20
19
25
,00
08
73
,45
07
29
27
,91
79
8(2
6,2
15
)(8
48
,01
7)
-5
2,9
62
Pro
fit
for
the p
eriod
--
--
-27,3
50
--
27,3
50
Oth
er
co
mp
reh
en
siv
e in
co
me/
(lo
ss),
net
of
tax:
Net
gain
s o
n investm
ents
in e
quity instr
um
ents
desig
nate
d a
t FV
TO
CI
--
--
2,6
77
--
-2,6
77
To
tal o
ther
co
mp
reh
en
siv
e in
co
me/
(lo
ss)
--
--
2,6
77
--
-2,6
77
To
tal co
mp
reh
en
siv
e in
co
me
--
--
2,6
77
27
,35
0-
-3
0,0
27
Tra
nsacti
on
s w
ith
ow
ners
Tra
nsfe
rs for
the p
eriod
--
9,5
73
(27,9
17)
-3,2
60
-15,0
85
-
To
tal tr
an
sacti
on
s w
ith
Ow
ners
--
9,5
73
(2
7,9
17
)-
3,2
60
15
,08
5-
Bala
nce a
t 3
1 D
ecem
ber
20
19
25
,00
08
73
,45
01
0,3
02
-2
,77
54
,39
5(8
48
,01
7)
15
,08
58
2,9
89
Att
rib
uta
ble
to
eq
uit
y h
old
ers
ST
AT
EM
EN
T O
F C
HA
NG
ES
IN
EQ
UIT
YFo
r th
e ye
ar
end
ed 3
1 D
ece
mb
er 2
019
PO
LAR
IS B
AN
K A
NN
UA
L R
EP
OR
T &
FIN
AN
CIA
L ST
ATE
ME
NTS
201
9
60

(All a
mounts
in m
illions o
f N
aira u
nle
ss o
therw
ise s
tate
d)
Ban
k
Sh
are
Sh
are
Sta
tuto
ryR
eg
ula
tory
Fair
valu
eA
ccu
mu
late
d
Reo
rgan
isati
on
cap
ital
pre
miu
mre
serv
ere
serv
ere
serv
elo
ss
reserv
eTo
tal
At
21
Sep
tem
ber
20
18
--
--
-(8
48
,01
7)
(8
48
,01
7)
Pro
fit
for
the p
eriod
--
--
-2,4
31
2,4
31
Oth
er
co
mp
reh
en
siv
e in
co
me/
(lo
ss),
net
of
tax:
Net
gain
s o
n investm
ents
in e
quity instr
um
ents
desig
nate
d a
t FV
TO
CI
--
--
98
-98
To
tal o
ther
co
mp
reh
en
siv
e in
co
me/
(lo
ss)
--
--
98
-98
To
tal co
mp
reh
en
siv
e in
co
me
--
--
98
2,4
31
2,5
29
Tra
nsacti
on
s w
ith
ow
ners
Issue o
f share
s t
o A
MC
ON
25,0
00
873,4
50
--
-898,4
50
Tra
nsfe
rs f
or
the p
eriod
729
27,9
17
(28,6
46)
-
To
tal tr
an
sacti
on
s w
ith
Ow
ners
25
,00
08
73
,45
07
29
27
,91
7-
(2
8,6
46
)8
98
,45
0
Bala
nce a
t 3
1 D
ecem
ber
20
18
25
,00
08
73
,45
07
29
27
,91
79
8(2
6,2
15
)(8
48
,01
7)
52
,96
2
Att
rib
uta
ble
to
eq
uit
y h
old
ers
ST
AT
EM
EN
T O
F C
HA
NG
ES
IN
EQ
UIT
YFo
r th
e ye
ar
end
ed 3
1 D
ece
mb
er 2
019
PO
LAR
IS B
AN
K A
NN
UA
L R
EP
OR
T &
FIN
AN
CIA
L ST
ATE
ME
NTS
201
9
61

POLARIS BANK ANNUAL REPORT & FINANCIAL STATEMENTS 2019
62
STATEMENT OF CASH FLOWSFor the year ended 31 December 2019
(All amounts in millions of Naira unless otherwise stated)
Group Group Bank Bank31 December 31 December 31 December 31 December
2019 2018 2019 2018
Operating activities Note
Net cash used in operating activities 38 (68,722) 19,899 (68,722) 19,899
Investing activities
Acquisition of investment securities (715,493) (487,816) (715,493) (487,816)Interest received on investment securities 73,659 281 73,659 281
Dividend received 484 196 484 196Acquisition of property and equipment (9,649) (503) (9,649) (503)
Proceeds from the sale of property and equipment 252 302 252 302
Acquisition of intangible assets (127) (9) (127) (9)Net proceeds from disposal of subsidiaries 2,363 - 2,363
Payment for Right of Use asset (554) - (554) -
Proceeds from disposed and matured investment
securities
750,764 90,411 750,764 90,411
Net cash used in investing activities 101,699 (397,138) 101,699 (397,138)
Cash flows from financing activities
Interest paid on interest bearing borrowings (5,049) (3,418) (5,049) (3,418)Proceeds from shares issued - 898,450 - 898,450Repayment of interest bearing borrowings (37,598) (516,094) (37,598) (516,094)
Net cash provided by financing activities (42,647) 378,938 (42,647) 378,938
Net decrease in cash and cash equivalents (9,670) 1,700 (9,670) 1,700
Opening cash and cash equivalents 96,992 93,682 96,992 93,682Effect of exchange rate fluctuations on cash held 1,238 1,610 1,238 1,610
Net decrease in cash and cash equivalents (9,670) 1,700 (9,670) 1,700
Cash and cash equivalents at
31 December
18.1 88,560 96,992 88,560 96,992

POLARIS BANK ANNUAL REPORT & FINANCIAL STATEMENTS 2019
63
NOTES TO THE FINANCIAL STATEMENTSFor the year ended 31 December 2019
(All amounts in millions of Naira unless otherwise stated)
1
2
2.1
2.2
2.2(a)
Reporting entity
Summary of significant accounting policies
Statement of compliance
The consolidated and separate financial statements of the Bank and the Group for the year ended 31 December 2019 have been
prepared in accordance with International Financial Reporting Standards (IFRS) as issued by the International Accounting Standards
Board (IASB), and the interpretations of these standards, issued by the International Financial Reporting Interpretations Committee
(IFRIC).
Basis of preparation
The accompanying financial statements comprise the financial statements of Polaris Bank Limited (referred to as the "Bank" or "the
Parent") and its subsidiaries (referred to together as "the Group"). The Bank is a company incorporated in Nigeria under the Companies
and Allied Matters Act.
These consolidated and separate financial statements for the year ended 31 December 2019, are prepared for the Bank and the Group
respectively. The Bank and the Group are primarily involved in wholesale, corporate and retail banking and mortgage financing.
These financial statements were authorised for issue by the Board of Directors on 13 February 2020.
The principal accounting policies adopted in the preparation of these consolidated and separate financial statements are set out below.
These policies are applicable to both the Bank and Group financial statements and have been consistently applied.
These financial statements comprise the statement of comprehensive income, the statement of financial position, the statement of
changes in equity, the statement of cash flow and the notes.
The preparation of financial statements in conformity with IFRS requires the use of certain critical accounting estimates. It also requires
management to exercise its judgment in the process of applying the Group’s accounting policies. Changes in assumptions may have a
significant impact on the financial statements in the period the assumptions changed. Management believes that the underlying
assumptions are appropriate and that the Group’s financial statements therefore present the financial position and results fairly. The
areas involving a higher degree of judgment or complexity, or areas where assumptions and estimates are significant to the
consolidated financial statements, are disclosed in Note 6.
Basis of measurement
These financial statements have been prepared in accordance with the going concern principle under the historical cost convention
except for the following:
-Derivative financial instruments which are measured at fair value.
-Non derivative financial instruments, carried at fair value through profit or loss, are measured at fair value.
-Fair value through other comprehensive income (FVOCI), financial assets are measured at fair value through equity.
-Assets and liabilities held for trading are measured at fair value.
-Assets and liabilities held for principal and interest payments are measured at amortised cost.
New and amended standards and interpretations
IFRS 16 Leases
The Bank had to change its accounting policies as a result of adopting IFRS 16. The Bank elected to adopt the new rules retrospectively
but recognised the cumulative effect of initially applying the new standard on 1 January 2019. This note is disclosed in note 26.
Leases- Accounting policy from 1 January 2019:
The Bank leases several assets including buildings. Lease terms are negotiated on an individual basis and contain different terms and
conditions, including extension options. The lease period ranges from 1 year to 40 years. The lease agreements do not impose any
covenants, however, leased assets may not be used as security for borrowing purposes. Contracts may contain both lease and non-
lease components. The bank has elected not to separate lease and non lease components and instead accounts for these as a single
lease component. From 1 January 2019, leases are recognised as a right-of-use asset and a corresponding liability at the date at which
the leased asset is available for use by the Bank. Assets and liabilities arising from lease are initially measured on a present value basis.
The following standards and interpretations apply for the first time to financial reporting periods
commencing on or after 1 January 2019:
Polaris Bank Limited commenced banking operations on September 21, 2018 after it took over and assumed ownership of assets and
certain liabilities of Skye Bank Plc. The Bank was issued operating license by the Central Bank of Nigeria (CBN) whilst the operating license
of Skye Bank was revoked by the Central Bank of Nigeria. The address of the Bank's registered office is 3 Akin Adesola Street, Victoria
Island, Lagos.
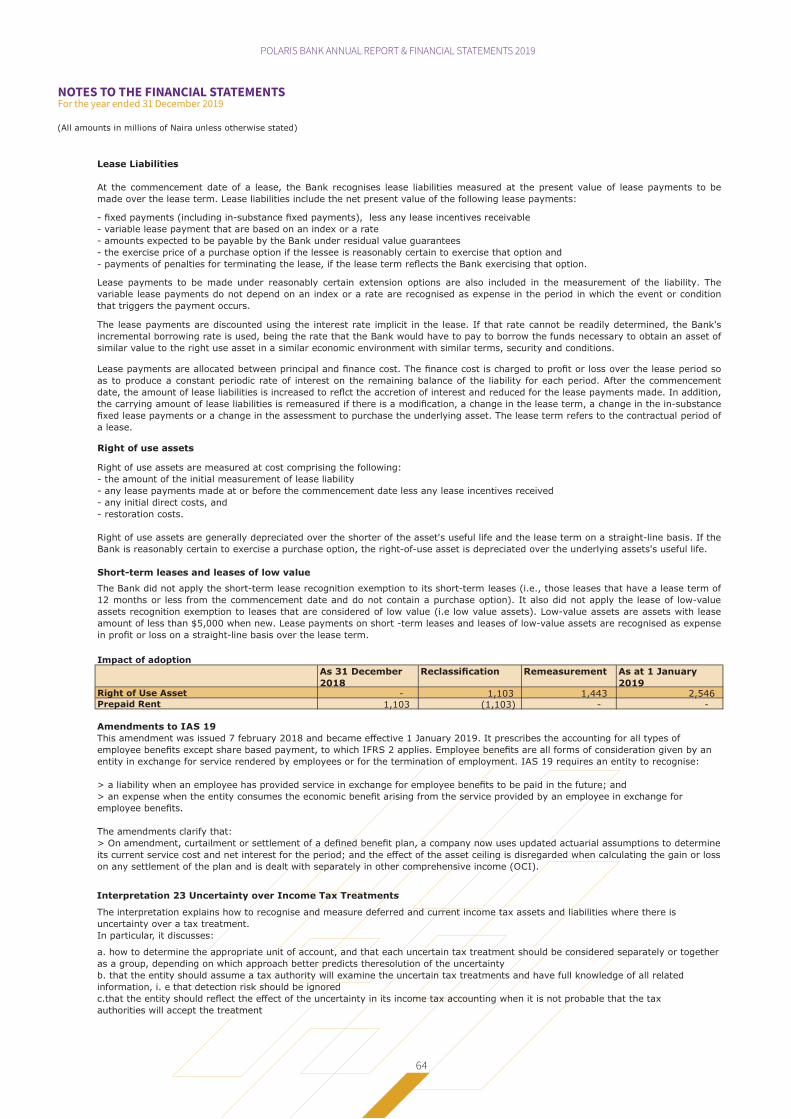
POLARIS BANK ANNUAL REPORT & FINANCIAL STATEMENTS 2019
64
NOTES TO THE FINANCIAL STATEMENTSFor the year ended 31 December 2019
(All amounts in millions of Naira unless otherwise stated)
Lease Liabilities
At the commencement date of a lease, the Bank recognises lease liabilities measured at the present value of lease payments to be
made over the lease term. Lease liabilities include the net present value of the following lease payments:
- fixed payments (including in-substance fixed payments), less any lease incentives receivable
- variable lease payment that are based on an index or a rate
- amounts expected to be payable by the Bank under residual value guarantees
- the exercise price of a purchase option if the lessee is reasonably certain to exercise that option and
- payments of penalties for terminating the lease, if the lease term reflects the Bank exercising that option.
Lease payments to be made under reasonably certain extension options are also included in the measurement of the liability. The
variable lease payments do not depend on an index or a rate are recognised as expense in the period in which the event or condition
that triggers the payment occurs.
The lease payments are discounted using the interest rate implicit in the lease. If that rate cannot be readily determined, the Bank's
incremental borrowing rate is used, being the rate that the Bank would have to pay to borrow the funds necessary to obtain an asset of
similar value to the right use asset in a similar economic environment with similar terms, security and conditions.
Lease payments are allocated between principal and finance cost. The finance cost is charged to profit or loss over the lease period so
as to produce a constant periodic rate of interest on the remaining balance of the liability for each period. After the commencement
date, the amount of lease liabilities is increased to reflct the accretion of interest and reduced for the lease payments made. In addition,
the carrying amount of lease liabilities is remeasured if there is a modification, a change in the lease term, a change in the in-substance
fixed lease payments or a change in the assessment to purchase the underlying asset. The lease term refers to the contractual period of
a lease.
Right of use assets
Right of use assets are measured at cost comprising the following:
- the amount of the initial measurement of lease liability
- any lease payments made at or before the commencement date less any lease incentives received
- any initial direct costs, and
- restoration costs.
Right of use assets are generally depreciated over the shorter of the asset's useful life and the lease term on a straight-line basis. If the
Bank is reasonably certain to exercise a purchase option, the right-of-use asset is depreciated over the underlying assets's useful life.
Short-term leases and leases of low value
The Bank did not apply the short-term lease recognition exemption to its short-term leases (i.e., those leases that have a lease term of
12 months or less from the commencement date and do not contain a purchase option). It also did not apply the lease of low-value
assets recognition exemption to leases that are considered of low value (i.e low value assets). Low-value assets are assets with lease
amount of less than $5,000 when new. Lease payments on short -term leases and leases of low-value assets are recognised as expense
in profit or loss on a straight-line basis over the lease term.
Impact of adoption
As 31 December
2018
Reclassification Remeasurement As at 1 January
2019Right of Use Asset - 1,103 1,443 2,546 Prepaid Rent 1,103 (1,103) - -
The interpretation explains how to recognise and measure deferred and current income tax assets and liabilities where there is
uncertainty over a tax treatment.
In particular, it discusses:
a. how to determine the appropriate unit of account, and that each uncertain tax treatment should be considered separately or together
as a group, depending on which approach better predicts theresolution of the uncertainty
b. that the entity should assume a tax authority will examine the uncertain tax treatments and have full knowledge of all related
information, i. e that detection risk should be ignored
c.that the entity should reflect the effect of the uncertainty in its income tax accounting when it is not probable that the tax
authorities will accept the treatment
Amendments to IAS 19
This amendment was issued 7 february 2018 and became effective 1 January 2019. It prescribes the accounting for all types of
employee benefits except share based payment, to which IFRS 2 applies. Employee benefits are all forms of consideration given by an
entity in exchange for service rendered by employees or for the termination of employment. IAS 19 requires an entity to recognise:
> a liability when an employee has provided service in exchange for employee benefits to be paid in the future; and
> an expense when the entity consumes the economic benefit arising from the service provided by an employee in exchange for
employee benefits.
The amendments clarify that:
> On amendment, curtailment or settlement of a defined benefit plan, a company now uses updated actuarial assumptions to determine
its current service cost and net interest for the period; and the effect of the asset ceiling is disregarded when calculating the gain or loss
on any settlement of the plan and is dealt with separately in other comprehensive income (OCI).
Interpretation 23 Uncertainty over Income Tax Treatments

POLARIS BANK ANNUAL REPORT & FINANCIAL STATEMENTS 2019
65
NOTES TO THE FINANCIAL STATEMENTSFor the year ended 31 December 2019
(All amounts in millions of Naira unless otherwise stated)
2.2.1
2.2.2
2.3
(a)
Foreign currency translation
Except where indicated, financial information presented in Naira has been rounded to the nearest million.
Prepayment Features with Negative Compensation – Amendments to IFRS 9
The narrow-scope amendments made to IFRS 9 Financial Instruments in October 2017 enable entities to measure certain prepayable
financial assets with negative compensation at amortised cost. These assets, which include some loan and debt securities, would
otherwise have to be measured at fair value through profit or loss. To qualify for amortised cost measurement, the negative
compensation must be ‘reasonable compensation for early termination of the contract’
and the asset must be held within a ‘held to collect’ business model.
Translation differences on non-monetary assets and liabilities such as equities held at fair value through profit or loss are recognised in
profit or loss as part of the fair value gain or loss. Translation differences on non-monetary financial assets measured at fair value, such
as equities classified as fair value through OCI, are included in other comprehensive income.
Items included in the consolidated financial statements of each of the Group's entities are measured using the currency of the primary
economic environment in which the entity operates (the “functional currency”). The consolidated financial statements are presented in
Nigerian Naira (“N”), which is the Group’s presentation currency.
(b)
Foreign currency transactions, that is transactions denominated or that require settlement in a foreign currency, are translated into the
functional currency using the exchange rates prevailing at the dates of the transactions. Monetary items denominated in foreign
currency are translated using the closing rate as at the reporting date. Non-monetary items measured at historical cost denominated in
a foreign currency are translated with the exchange rate as at the date of initial recognition; non-monetary items in a foreign currency
that are measured at fair value are translated using the exchange rates at the date when the fair value was determined.
Foreign exchange gains and losses resulting from the settlement of foreign currency transactions and from the year end translation of
monetary assets and liabilities denominated in foreign currencies are recognised in the Statement of Comprehensive Income, except
when deferred in other comprehensive income as qualifying cash flow hedging instruments and qualifying net investment hedging
instruments.
All foreign exchange gains and losses recognised in the income statement are presented net in the Income Statement. Foreign
Transactions and balances
Accounting policies
The Group has adopted all the relevant standards applicable from the date of its incorporation.
Functional and presentation currency
New standards and interpretations not yet adopted
Certain new accounting standards and interpretation have been published that are not mandatory for 31 December 2019 and have not
been early adopted by the Group.
IFRS 17 – Insurance Contracts
IFRS 17 was issued in May 2017 and applies to annual reporting periods beginning on or after 1 January 2021. The new IFRS 17
standard establishes the principles for the recognition, measurement, presentation and disclosure of insurance contracts within the
scope of the Standard. The objective of IFRS 17 is to ensure an entity provides relevant information that faithfully represents those
contracts. This information gives a basis for users of financial statements to assess the effect that insurance contracts have on the
entity's financial position, financial performance and cashflows. This standard does not impact the Group in anyway as the Bank and its
subsidiary companies do not engage in insurance business.
Definition of Material –Amendments to IAS 1 and IAS 8
The IASB has made amendments to IAS 1 Presentation of Financial Statements and IAS 8 Accounting Policies, Changes in Accounting
Estimates and Errors which use a consistent definition of materiality throughout International Financial Reporting Standards and the
Conceptual Framework for Financial Reporting, clarify when information is material and incorporate some of the guidance in IAS 1 about
immaterial information
Definition of a Business – Amendments to IFRS 3
The amended definition of a business requires an acquisition to include an input and a substantive process that together significantly
contribute to the ability to create outputs. The definition of the term ‘outputs’ is amended to focus on goods and services provided to
customers, generating investment income and other income, and it excludes returns in the form of lower costs and other economic
Changes in the fair value of monetary securities denominated in foreign currency measured at fair value through OCI are analysed
between translation differences resulting from changes in the amortised cost of the security and other changes in the carrying amount
of the security. Translation differences related to changes in amortised cost are recognised in profit or loss, and other changes in
carrying amount are recognised in other comprehensive income.

POLARIS BANK ANNUAL REPORT & FINANCIAL STATEMENTS 2019
66
NOTES TO THE FINANCIAL STATEMENTSFor the year ended 31 December 2019
(All amounts in millions of Naira unless otherwise stated)
(c)
2.4
Subsidiaries
Subsidiaries are all entities (including structured entities) over which the Group has control. The Group controls an entity when the
Group is exposed to, or has rights to, variable returns from its involvement with the entity and has the ability to affect those returns
through its power over the entity. Subsidiaries are fully consolidated from the date on which control is transferred to the group. They
are deconsolidated from the date that control ceases.
Acquisition-related costs are expensed as incurred. If the business combination is achieved in stages, the acquisition date carrying value
of the acquirer’s previously held equity interest in the acquiree is re-measured to fair value at the acquisition date; any gains or losses
arising from such re-measurement are recognised in profit or loss.
Inter-company transactions, balances and unrealised gains on transactions between Group companies are eliminated. Unrealised losses
are also eliminated. When necessary, amounts reported by subsidiaries have been adjusted to conform with the Group’s accounting
policies. Accounting policies of the subsidiaries have been changed where necessary to reflect the accounting policies of the group.
Basis of consolidation
The financial statements of the subsidiaries used to prepare the consolidated financial statements were prepared as of the parent
company’s reporting date.
Group companies (foreign operations)
Transactions with non-controlling interests that do not result in loss of control are accounted for as equity transactions – that is, as
transactions with the owners in their capacity as owners. The difference between fair value of any consideration paid and the relevant
share acquired of the carrying value of net assets of the subsidiary is recorded in equity. Gains or losses on disposals to non-controlling
interests are also recorded in equity.
Any contingent consideration to be transferred by the Group is recognised at fair value at the acquisition date. Subsequent changes to
the fair value of the contingent consideration that is deemed to be an asset or liability is recognised in accordance with IFRS 9 either in
profit or loss or as a change to other comprehensive income. Contingent consideration that is classified as equity is not re-measured,
and its subsequent settlement is accounted for within equity.
The Group applies the acquisition method to account for business combinations. The consideration transferred for the acquisition of a
subsidiary is the fair value of the assets transferred, the liabilities incurred to the former owners of the acquiree and the equity interests
issued by the Group. The consideration transferred includes the fair value of any asset or liability resulting from a contingent
consideration arrangement. Identifiable assets acquired and liabilities and contingent liabilities assumed in a business combination are
measured initially at their fair values at the acquisition date. The Group recognises any non-controlling interest in the acquiree on an
acquisition-by-acquisition basis, either at fair value or at the non-controlling interest’s proportionate share of the recognised amounts of
acquiree’s identifiable net assets. Investment in subsidiaries are reported at cost less impairment (if any) in the separate financial
statements of the Bank.
Changes in ownership interests in subsidiaries without change of control
The results and financial position of all the Group entities (none of which has the currency of a hyper-inflationary economy) that have a
functional currency different from the presentation currency are translated into the presentation currency as follows:
• assets and liabilities for each statement of financial position presented are translated at the closing rate at the date of that
statement of financial position;
• income and expenses for each income statement are translated at average exchange rates (unless this average is not a reasonable
approximation of the cumulative effect of the rates prevailing on the transaction dates, in which case income and expenses are
translated at the dates of the transactions); and
• all resulting exchange differences are recognised in other comprehensive income.
Exchange differences arising from the above process are reported in shareholders' equity as 'Foreign currency translation reserve'.
On consolidation, exchange differences arising from the translation of the net investment in foreign entities, and of borrowings and
other currency instruments designated as hedges of such investments, are taken to 'Other comprehensive income'. When a foreign
operation is disposed of, or partially disposed of, such exchange differences are recognised in the consolidated income statement as
part of the gain or loss on sale. Goodwill and fair value adjustments arising on the acquisition of a foreign entity are treated as assets
and liabilities of the foreign entity and translated at the closing rate.

POLARIS BANK ANNUAL REPORT & FINANCIAL STATEMENTS 2019
67
NOTES TO THE FINANCIAL STATEMENTSFor the year ended 31 December 2019
(All amounts in millions of Naira unless otherwise stated)
Capital reorganisation
2.5 Current and deferred income tax
Current income tax
Deferred income tax
When the Group ceases to have control, any retained interest in the entity is remeasured to its fair value at the date when control is
lost, with the change in carrying amount recognised in profit or loss. The fair value is the initial carrying amount for the purposes of
subsequently accounting for the retained interest as an associate, joint venture or financial asset. In addition, any amounts previously
recognised in other comprehensive income in respect of that entity are accounted for as if the Group had directly disposed of the
related assets or liabilities. This may mean that amounts previously recognised in other comprehensive income are reclassified to profit
or loss.
Common control transactions
The current income tax charge is calculated on the basis of the applicable tax laws in the respective jurisdiction and it consists of
Company Income Tax, Education Tax and NITDEF Tax. Company Income Tax is assessed at 30% statutory rate of total profit,
Education Tax is computed as 2% of assessable profit while NITDEF tax is a 1% levy on Profit Before Tax of the Bank. The Group
periodically evaluates positions taken in tax returns; ensuring information disclosed are in agreement with the underlying tax liability
which has been adequately provided for in the financial statements.
Deferred income tax assets and liabilities are offset when there is a legally enforceable right to offset current tax assets against current
tax liabilities and when the deferred income taxes assets and liabilities relate to taxes levied by the same taxation authority on either
the same taxable entity or different taxable entities where there is an intention to settle the balances on a net basis.
The tax expense for the period comprises current and deferred tax. Tax is recognised in the income statement, except to the extent
that it relates to items recognised in other comprehensive income or directly in equity. In this case, the tax is also recognised in other
comprehensive income or directly in equity, respectively.
Deferred income tax assets are recognised only to the extent that it is probable that future taxable profit will be available against which
the temporary differences can be utilised. Deferred income tax liabilities are provided on taxable temporary differences arising from
investments in subsidiaries, associates and joint arrangements, except for deferred income tax liability where the timing of the reversal
of the temporary difference is controlled by the Group and it is probable that the temporary difference will not reverse in the
foreseeable future.
Deferred income tax assets are recognised on deductible temporary differences arising from investments in subsidiaries, associates and
joint arrangements only to the extent that it is probable the temporary difference will reverse in the future and there is sufficient
taxable profit available against which the temporary difference can be utilised.
Disposal of subsidiaries
Deferred income tax is provided in full, using the liability method, on temporary differences arising between the tax bases of assets and
liabilities and their carrying amounts in the consolidated financial statements. However, deferred tax liabilities are not recognised if they
arise from the initial recognition of goodwill; deferred income tax is not accounted for if it arises from initial recognition of an asset or
liability in a transaction other than a business combination that at the time of the transaction affects neither accounting nor taxable
profit or loss. Deferred income tax is determined using tax rates (and laws) that have been enacted or substantially enacted by the end
of the reporting period and are expected to apply when the related deferred income tax asset is realized or the deferred income tax
liability is settled.
When there is Capital reorganisation, the Group recognizes the assets and liabilities of the defunct entity in its consolidated financial
statements at their pre-combination carrying amounts. The assets and liabilities are not remeasured to fair values but are recognised at
their book values on the date of the reorganisation.
Business combinations in which all of the combining entities or businesses are ultimately controlled by the same party or parties both
before and after the business combination (and where that control is not transitory) are referred to as common control transactions.
The Group accounts for the transaction at book values in its consolidated financial statements. The book values of the acquired entity
are the consolidated book values as reflected in the group annual financial statements. The excess of the cost of the transaction over
the Group’s proportionate share of the net asset value acquired in common control transactions, will be allocated to the existing
business combination reserve in equity. Where comparative periods are presented, the financial statements and financial information
are not restated.

POLARIS BANK ANNUAL REPORT & FINANCIAL STATEMENTS 2019
68
NOTES TO THE FINANCIAL STATEMENTSFor the year ended 31 December 2019
(All amounts in millions of Naira unless otherwise stated)
2.6 Financial assets and liabilities
2.6.1 Financial assets
(a) Debt instruments
Debt instruments are those instruments that meet the definition of a financial liability from the issuer's perspective, such as loans,
government and corporate bonds and trade receivables purchased from clients in factoring arrangements without recourse. Debt
investment securities
Classification and subsequent measurement of debt instruments depend on:
(i) the Group's business model for managing the asset; and
(ii) the Cash flow characteristics of the asset.
Based on these factors, the Group classifies its debt instruments into one of the following three measurement categories:
Amortised cost: Assets that are held for collection of contractual cash flows where those cash flows represent solely payments of
principal and interest (SPPI), and that are not designated at FVTPL, are measured at amortised cost. The carrying amount of these
assets is adjusted by any expected credit loss allowance recognised and measured as described in note 2.6.1 (f). Interest income from
these financial assets is included in 'interest income' using the effective interest rate method.
Fair value through other comprehensive income (FVOCI): Financial assets that are held for collection of contractual cash flows
and for selling the assets, where the assets' cash flows represent solely payments of principal and interest, and that are not designated
at FVTPL, are measured at fair value. Movements in the carrying amount are taken through OCI, except for the recognition of
impairment gains or losses, interest revenue and foreign exchange gains and losses on the instrument's amortised cost which are
recognised in profit or loss.
Fair value through profit or loss: Assets that do not meet the criteria for amortised cost or FVOCI are measured at fair value
through profit or loss. A gain or loss on a debt investment that is subsequently measured at fair value through profit or loss and is not
part of a hedging relationship is recognised in profit or loss and presented in the profit or loss statement within 'Net trading income and
foreign exchange income' in the period in which it arises.
SPPI: Where the business model is to hold assets to collect contractual cash flows or to collect contractual cash flows and sell, the
Group assesses whether the financial instruments' cash flows represent solely payments of principal and interest (the 'SPPI test'). In
making this assessment, the Group considers whether the contractual cash flows are consistent with a basic lending arrangement i.e.
interest includes only consideration for the time value of money, credit risk, other basic lending risks and a profit margin that is
consistent with a basic lending arrangement. Where the contractual terms introduce exposure to risk or volatility that are inconsistent
with a basic lending arrangement, the related financial asset is classified and measured at fair value through profit or loss.
The Group reclassifies debt investments when and only when its business model for managing those assets changes. The reclassification
takes place from the start of the first reporting period following the change. Such changes are expected to be very infrequent and none
occurred during the period.
Business model: the business model reflects how the Group manages the assets in order to generate cash flows. That is, whether the
Group's objective is solely to collect the contractual cash flows from the assets or is to collect both the contractual cash flows and cash
flows arising from the sale of assets. If neither of these is applicable (e.g. financial assets are held for trading purposes), then the
financial assets are classified as part of 'other' business model and measured at FVTPL. Factors considered by the Group in determining
the business for a group of assets include past experience on how the cash flows for these assets were collected, how the assets
performance is evaluated and reported to key management personnel, how risks are assessed and managed and how managers are
compensated. For example, the Group's business model for the mortgage loan book is to hold to collect contractual cash flows.
The Group classifies its financial instruments in the following categories: at fair value through profit or loss (FVTPL), amortised costs
and fair value through other comprehensive income (FVOCI). The Group's financial assets classified as amortised cost includes loans
and advances to customers; other loans and receivables; and investment securities. The classification depends on the purpose for which
the financial assets were acquired and their characteristics.
Initial recognition and measurement
Financial assets and financial liabilities are recognised when the entity becomes a party to the contractual provisions of the instrument.
Regular way purchases and sales of financial assets are recognised on settlement-date on which the Group commits to purchase or sell
the asset. At initial recognition, the group measures a financial asset at its fair value plus, in the case of a financial asset not at fair
value through profit or loss (FVPL), transaction costs that are directly attributable to the acquisition of the financial asset. Transaction
costs of financial assets carried at FVPL are expensed in profit or loss.

POLARIS BANK ANNUAL REPORT & FINANCIAL STATEMENTS 2019
69
NOTES TO THE FINANCIAL STATEMENTSFor the year ended 31 December 2019
(All amounts in millions of Naira unless otherwise stated)
(b) Equity Instruments
Equity instruments are instruments that meet the definition of equity from the issuer's perspective; that is, instruments that do not
contain a contractual obligation to pay and that evidence a residual interest in the issuer's net assets. Examples of equity instruments
include basic ordinary shares.
The Group subsequently measures all equity investments at fair value through profit or loss, except where the Group's management
has elected, at initial recognition, to irrevocably designate an equity investment at fair value through other comprehensive income.
When this is election is used, fair value gains and losses are recognised in OCI and are not subsequently reclassified to profit or loss,
including on disposal. Impairment losses (and reversal of impairment losses) are not reported separately from other changes in fair
value. Dividends, when representing a return on such investments, continue to be recognised in profit or loss as other income when the
Group's right to receive payment is established.
Gains and losses on equity investments at FVTPL are included in the 'Net trading income' line in the statement of comprehensive
income.
(d) Modification of loans
• Significant change in the interest rate.
• Change in the currency the loan is denominated in.
(e ) Derecognition other than on a modification
• Significant extension of the loan term when the borrower is not in financial difficulty.
• Insertion of collateral, other security or credit enhancements that significantly affect the credit risk associated with the loan.
If the terms are substantially different, the Group derecognises the original financial asset and recognises a 'new' asset at fair value and
recalculates a new effective interest rate for the asset. The date of renegotiation is consequently considered to be the date of initial
recognition for impairment calculation purposes, including for the purpose of determining whether a significant increase in credit risk
has occurred. However, the Group also assesses whether the new financial asset recognised is deemed to be credit-impaired at initial
recognition, especially in circumstances where the renegotiation was driven by the debtor being unable to make the originally agreed
payments. Differences in the carrying amount are also recognised in profit or loss as a gain or loss on derecogntion.
If the terms are not substantially different, the renegotiation or modification does not result in derecognition, and the Group
recalculates the gross carrying amount based on the revised cash flows of the financial asset and recognises a modification gain or loss
in profit or loss. The new gross carrying amount is recalculated by discounting the modified cash flows at the original effective interest
rate (or credit-adjusted effective interest rate for purchased or originated credit-impaired financial assets).
Financial assets, or a portion thereof, are derecognised when the contractual rights to receive the cash flows from the assets have
expired, or when they have been transferred and either (i) the Group transfers substantially all the risks and rewards of ownership, or
(ii) the Group neither transfers nor retains substantially all the risks and rewards of ownership and the Group has not retained control.
The Group enters into transactions where it retains the contractual rights to receive cash flows from assets but assumes a contractual
obligation to pay those cash flows to other entities and transfers substantially all of the risks and rewards. These transactions are
accounted for as 'pass through' transfers that result in derecognition if the Group:
(i) Has no obligation to make payments unless it collects equivalent amounts from the assets;
(ii) Is prohibited from selling or pledging the assets; and
(iii) Has an obligation to remit any cash it collects from the assets without material delay.
The Group sometimes renegotiates or otherwise modifies the contractual cash flows of loans to customers. When this happens, the
Group assesses whether or not the new terms are substantially different to the original terms. The Group does this by considering,
among others, the following factors:
( c) Impairment
The Group assesses on a forward - looking basis the expected credit losses ('ECL') associated with its debt instruments carried at
amortised cost and FVOCI and with the exposure arising from loan commitments and financial guarantee contracts. The Group
recognises a loss allowance for such losses at each reporting date. The measurement of ECL reflects:
• An unbiased and probability-weighted amount that is determined by evaluating a range of possible outcomes;
• The time value of money; and
• Reasonable and supportable information that is available without undue cost or effort at the reporting date about past events, current
conditions and forecasts of future economic conditions.
• If the borrower is in financial difficulty, whether the modification merely reduces the contractual cash flows to the amounts the
borrower is expected to be able to pay
• Whether any substantial new terms are introduced, such as a profit share/equity based return that substantially affects the risk profile
of the loan.
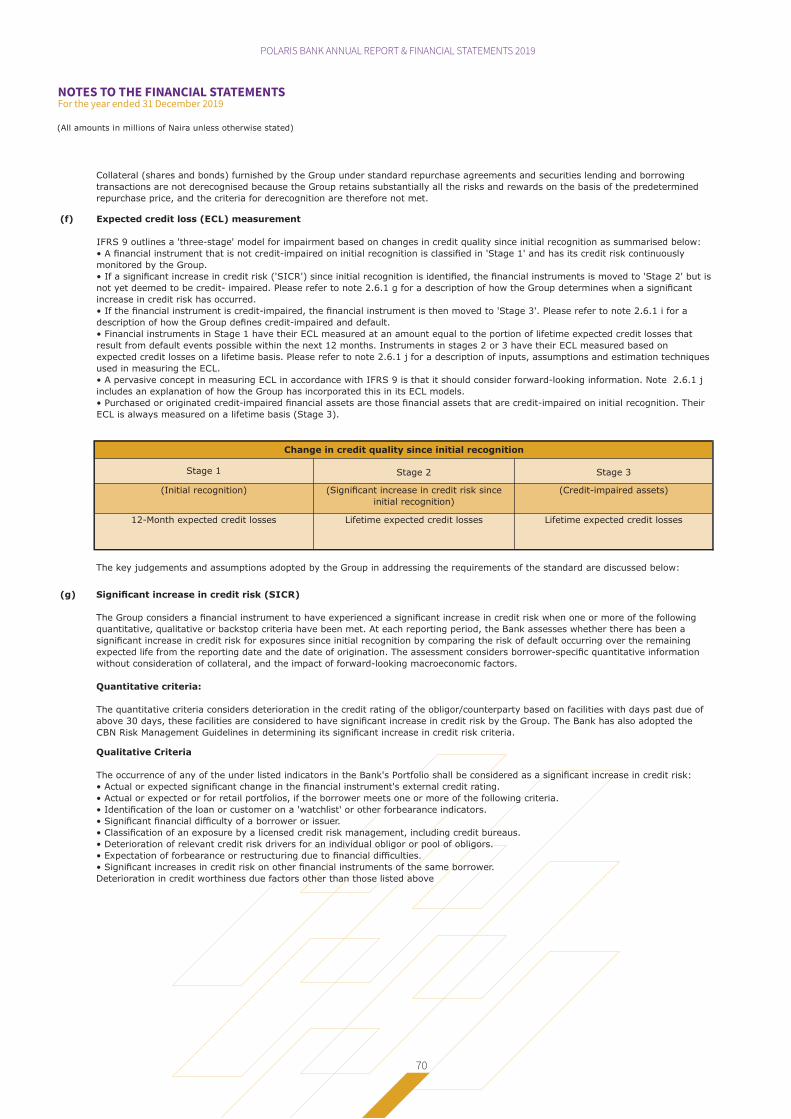
POLARIS BANK ANNUAL REPORT & FINANCIAL STATEMENTS 2019
70
NOTES TO THE FINANCIAL STATEMENTSFor the year ended 31 December 2019
(All amounts in millions of Naira unless otherwise stated)
(f)
Stage 1
(Initial recognition)
12-Month expected credit losses
(g)
Lifetime expected credit losses
(Credit-impaired assets)
Lifetime expected credit losses
Collateral (shares and bonds) furnished by the Group under standard repurchase agreements and securities lending and borrowing
transactions are not derecognised because the Group retains substantially all the risks and rewards on the basis of the predetermined
repurchase price, and the criteria for derecognition are therefore not met.
(Significant increase in credit risk since
initial recognition)
Change in credit quality since initial recognition
Significant increase in credit risk (SICR)
The Group considers a financial instrument to have experienced a significant increase in credit risk when one or more of the following
quantitative, qualitative or backstop criteria have been met. At each reporting period, the Bank assesses whether there has been a
significant increase in credit risk for exposures since initial recognition by comparing the risk of default occurring over the remaining
expected life from the reporting date and the date of origination. The assessment considers borrower-specific quantitative information
without consideration of collateral, and the impact of forward-looking macroeconomic factors.
Quantitative criteria:
The quantitative criteria considers deterioration in the credit rating of the obligor/counterparty based on facilities with days past due of
above 30 days, these facilities are considered to have significant increase in credit risk by the Group. The Bank has also adopted the
CBN Risk Management Guidelines in determining its significant increase in credit risk criteria.
Qualitative Criteria
The occurrence of any of the under listed indicators in the Bank's Portfolio shall be considered as a significant increase in credit risk:
• Actual or expected significant change in the financial instrument's external credit rating.
• Actual or expected or for retail portfolios, if the borrower meets one or more of the following criteria.
• Identification of the loan or customer on a 'watchlist' or other forbearance indicators.
• Significant financial difficulty of a borrower or issuer.
• Classification of an exposure by a licensed credit risk management, including credit bureaus.
• Deterioration of relevant credit risk drivers for an individual obligor or pool of obligors.
• Expectation of forbearance or restructuring due to financial difficulties.
• Significant increases in credit risk on other financial instruments of the same borrower.
Deterioration in credit worthiness due factors other than those listed above
The key judgements and assumptions adopted by the Group in addressing the requirements of the standard are discussed below:
Expected credit loss (ECL) measurement
IFRS 9 outlines a 'three-stage' model for impairment based on changes in credit quality since initial recognition as summarised below:
• A financial instrument that is not credit-impaired on initial recognition is classified in 'Stage 1' and has its credit risk continuously
monitored by the Group.
• If a significant increase in credit risk ('SICR') since initial recognition is identified, the financial instruments is moved to 'Stage 2' but is
not yet deemed to be credit- impaired. Please refer to note 2.6.1 g for a description of how the Group determines when a significant
increase in credit risk has occurred.
• If the financial instrument is credit-impaired, the financial instrument is then moved to 'Stage 3'. Please refer to note 2.6.1 i for a
description of how the Group defines credit-impaired and default.
• Financial instruments in Stage 1 have their ECL measured at an amount equal to the portion of lifetime expected credit losses that
result from default events possible within the next 12 months. Instruments in stages 2 or 3 have their ECL measured based on
expected credit losses on a lifetime basis. Please refer to note 2.6.1 j for a description of inputs, assumptions and estimation techniques
used in measuring the ECL.
• A pervasive concept in measuring ECL in accordance with IFRS 9 is that it should consider forward-looking information. Note 2.6.1 j
includes an explanation of how the Group has incorporated this in its ECL models.
• Purchased or originated credit-impaired financial assets are those financial assets that are credit-impaired on initial recognition. Their
ECL is always measured on a lifetime basis (Stage 3).
Stage 2 Stage 3

POLARIS BANK ANNUAL REPORT & FINANCIAL STATEMENTS 2019
71
NOTES TO THE FINANCIAL STATEMENTSFor the year ended 31 December 2019
(All amounts in millions of Naira unless otherwise stated)
(h)
(i)
(j)
The ECL is determined by projecting the PD, LGD and EAD for each future month and for each individual exposure or collective
segment. These three components are multiplied together and adjusted for the likelihood of survival (i.e. the exposure has not prepaid
or defaulted in an earlier month). This effectively calculates an ECL for each future month, which is then discounted back to the
reporting date and summed. The discount rate used in the ECL calculation is the original effective interest rate.
The Lifetime PD is developed by applying a maturity profile to the current 12M PD. The maturity profile looks at how defaults develop
on a portfolio from the point of initial recognition throughout the lifetime of the loans. The maturity profile is based on historical
observed data and is assumed to be the same across all assets within a portfolio and credit grade band. This is supported by historical
analysis.
The criteria above have been applied to all financial instruments held by the Group and are consistent with the definition of default used
for internal credit risk management purposes. The default definition has been applied consistently to model the Probability of Default
(PD), Exposure at Default (EAD) and Loss given Default (LGD) throughout the Group's expected loss calculations. An instrument is
considered to no longer be in default (i.e. to have cured) when it no longer meets any of the default criteria for a consecutive period of
six months. This period of six months has been determined based on an analysis which considers the likelihood of a financial instrument
returning to default status after cure using different possible cure definitions.
Low Credit risk exemption
The Group has not used the low credit risk exemption for any financial instruments apart from Debt investment securities (FGN treasury
bills and bonds) and balances due from other banks in the period ended 31 December 2019.
Definition of default and credit-impaired assets
The Group defines a financial instrument as in default, which is fully aligned with the definition of credit-impaired, when it meets one or
more of the following criteria:
Quantitative criteria
The borrower is more than 90 days past due on its contractual payments.
Qualitative criteria
The borrower meets unlikeliness to pay criteria, which indicates the borrower is in significant financial difficulty. These are instances
where:
• The borrower is in long-term forbearance
• The borrower is deceased
• The borrower is insolvent
• The borrower is in branch of financial covenant(s)
• An active market for that financial asset has disappeared because of financial difficulties
• Concessions have been made by the lender relating to the borrower's financial difficulty
• It is becoming probable that the borrower will enter bankruptcy
• Financial assets are purchased or originated at a deep discount that reflects the incurred credit losses.
Measuring ECL - Explanation of inputs, assumptions and estimation techniques
The Expected Credit Loss (ECL) is measured on either a 12-month (12M) or Lifetime basis depending on whether a significant increase
in credit risk has occurred since initial recognition or whether an asset is considered to be credit-impaired. Expected credit losses are
the discounted product of the Probability of Default (PD), Exposure at Default (EAD), and Loss Given Default (LGD), defined as follows:
• EAD is based on the amounts the Group expects to be owed at the time of default, over the next 12 months (12M EAD) or over the
remaining lifetime (Lifetime EAD). For example, for a revolving commitment, the Group includes the current drawn balance plus any
further amount that is expected to be drawn up to the current contractual limit by the time of default, should it occur.
• Loss Given Default (LGD) represents the Group's expectation of the extent of loss on a defaulted exposure. LGD varies by type of
counterparty, type and seniority of claim and availability of collateral or other credit support. LGD is expressed as a percentage loss per
unit of exposure at the time of default (EAD). LGD is calculated on a 12-month or lifetime basis, where 12-month LGD is the percentage
of loss expected to be made if the default occurs in the next 12 months and Lifetime LGD is the percentage of loss expected to be made
if the default occurs over the remaining expected lifetime of the loan.
• The PD represents the likelihood of a borrower defaulting on its financial obligation (based on the "Definition of default and credit-
impaired" above), either over the next 12 months (12M PD), or over the remaining lifetime (Lifetime PD) of the obligation.

POLARIS BANK ANNUAL REPORT & FINANCIAL STATEMENTS 2019
72
NOTES TO THE FINANCIAL STATEMENTSFor the year ended 31 December 2019
(All amounts in millions of Naira unless otherwise stated)
(k)
(l)
Macroeconomic variables incorporated in the ECL models
The Group relies on a broad range of forward looking information as economic inputs, such as: GDP growth. The inputs and models
used for calculating expected credit losses may not always capture all characteristics of the market at the date of the financial
statements. To reflect this, qualitative adjustments or overlays may be made as temporary adjustments using expert credit judgement.
The macro-economic parameters used are the same across risk management and capital planning process. See note 3.1.3iv for
additional details.
Forward-looking information incorporated in the ECL models
The assessment of SICR and the calculation of ECL both incorporate forward-looking information. The Group has performed historical
analysis and identified the key economic variables impacting credit risk and expected credit losses for each portfolio.
These economic variables and their associated impact on the PD, EAD and LGD vary by financial instrument. Expert judgement has also
been applied in this process. Forecasts of these economic variables (the "base economic scenario") are provided by the Predictive
Analytics' team on a quarterly basis and provide the best estimate view of the economy over the next four years. The impact of these
economic variables on the PD, EAD and LGD has been determined by performing statistical analysis to understand the impact that
changes in these variables have had historically on default rates and on the components of LGD and EAD.
In addition to the base economic scenario, the Predictive Analytics' team also provide other possible scenarios along with scenario
weightings. The number of other scenarios used is set based on the analysis of each major product type to ensure non-linearieties are
captured. The number of scenarios and their attributes are reassessed at each reporting date. At the reporting period, for all portfolios,
the Group concluded that three scenarios appropriately captured non-linearities.The scenario weightings are determined by a
combination of statistical analysis and expert credit judgement, taking account of the range of possible outcomes each chosen scenario
is representative of. The assessment of SICR is performed using the Lifetime PD under each of the base, and the other scenarios,
multiplied by the associated scenario weighting, along with qualitative and backstop indicators. This determines whether the whole
financial instrument is in Stage 1, Stage 2 or Stage 3 and hence whether 12-month or lifetime ECL should be recorded. Following this
assessment, the Group measures ECL as either a probability weighted 12 month ECL (Stage 1), or a probability weighted lifetime ECL
(Stages 2 and 3). These probability-weighted ECLs are determined by running each scenario through relevant ECL model and
The 12-month and lifetime EADs are determined based on the expected payment profile, which varies by product type.
• For amortising products and bullet repayment loans, this is based on the contractual repayments owed by the borrower over a 12
month or lifetime basis. This will also be adjusted for any expected prepayments made by a borrower. Early repayment/refinance
assumptions are also incorporated into the calculation.
• For revolving products, the exposure at default is predicted by taking current drawn balance and adding a "credit conversion factor"
which allows for the expected drawdown of the remaining limit by the time of default. These assumptions vary by product type and
current limit utilisation band, based on analysis of the Group's recent default data.
To estimate expected credit loss for off balance sheet exposures, credit conversion factor (CCF) is usually computed. CCF is a modelled
assumption which represents the proportion of any undrawn exposure that is expected to be drawn prior to a default event occuring. It
is a factor that coverts an off balance sheet exposure to its credit exposure equivalent.
The 12-month and lifetime LGDs are determined based on the factors which impact the recoveries made post default. These vary by
product type.
• For secured products, this is primarily based on collateral type and projected collateral values, historical discounts to market/book
values due to forced sales, time to repossession and recovery costs observed.
• For unsecured products, LGD's are typically set at product level due to the limited differentiation in recoveries achieved across
different borrowers. These LGD's are influenced by collection strategies, including contracted debt sales and price.

POLARIS BANK ANNUAL REPORT & FINANCIAL STATEMENTS 2019
73
NOTES TO THE FINANCIAL STATEMENTSFor the year ended 31 December 2019
(All amounts in millions of Naira unless otherwise stated)
2.6.2
(ii) Derecognition
Financial liabilities are derecognised when they are extinguished (i.e. when the obligation specified in the contract is discharged,
cancelled or expires).
The exchange between the Group and its original lenders of debt instruments with substantially different terms, as well as substantial
modifications of the terms of existing financial liabilities, are accounted for as an extinguishment of the original financial liability and the
recognition of a new financial liability. The terms are substantially different if the discounted present value of the cash flows under the
new terms, including any fees paid net of any fees received and discounted using the original effective interest rate, is at least 10%
different from the discounted present value of the remaining cash flows of the original financial liability. In addition, other qualitative
factors, such as the currency that the instrument is denominated in, changes in the type of interest rate, new conversion features
attached to the instrument is denominated in, changes in the type of interest rate, new conversion features attached to the instrument
and change in covenants are also taken into consideration. If an exchange of debt instruments or modification of term is accounted for
as an extinguishment, any costs or fees incurred are recognised as part of the gain or loss on the extinguishment. If the exchange or
modification is not accounted for as an extinguishment, any cost of fees incurred adjust the carrying amount of the liability and are
amortised over the remaining term of the modified liability.
Financial guarantee contracts and loan commitments
Financial guarantee contracts are contracts that require the issuer to make specified payments to reimburse the holder for a loss its
incurs because a specified debtor fails to make payments when due, in accordance with the terms of a debt instrument. Such financial
guarantees are given to banks, financial institutions and others on behalf of customers to secure loans, overdrafts and other banking
facilities.
Financial guarantee contracts are initially measured at fair value and subsequently measured at the higher of:
i) The amount of the loss allowance; and
ii) The premium received on initial recognition less income recognised in accordance with the principles of IFRS 15.
Loan commitments provided by the Group are measured as the amount of the loss allowance. The Group has not provided any
commitment to provide loans at a below-market interest rate, or that can be settled net in cash or by delivering or issuing another
financial instrument.
For loan commitments and financial guarantee contracts, the loss allowance is recognised as a provision. However, for contracts that
include both a loan and an undrawn commitment and the Group cannot separately identify the expected credit losses on the undrawn
commitment component from those on the loan component, the expected credit losses on the undrawn commitment are recognised
together with the loss allowance for the loan. To the extent that the combined expected credit losses exceed the gross carrying amount
of the loan, the expected credit losses are recognised as a provision.
Financial Liabilities
(i) Classification and subsequent measurement
In the current period, financial liabilities are classified and subsequently measured at amortised cost, except for:
Financial liabilities at fair value through profit or loss: this classification is applied to derivatives, financial liabilities held for trading (e.g.
short positions in the trading booking) and other financial liabilities designated as such at initial recognition. Gains or losses on financial
liabilities designated at fair value through profit or loss are presented partially in other comprehensive income (the amount of change in
the fair value of the financial liability that is attributable to changes in the credit risk of that liability, which is determined as the amount
that is not attributable to changes in market conditions that give rise to market risk) and partially profit or loss (the remaining amount
of change in the fair value of the liability). This is unless such a presentation would create, or enlarge, an accounting mismatch, in
which case the gains and losses attributable to changes in the credit risk of the liability are also presented in profit or loss;
• Financial liabilities arising from the transfer of financial assets which did not qualify for derecognition whereby a financial liability is
recognised for the consideration received for the transfer. In subsequent periods, the Group recognises any expense incurred on the
financial liability; and
• Financial guarantee contracts and loan commitments

POLARIS BANK ANNUAL REPORT & FINANCIAL STATEMENTS 2019
74
NOTES TO THE FINANCIAL STATEMENTSFor the year ended 31 December 2019
(All amounts in millions of Naira unless otherwise stated)
2.7 Offsetting financial instruments
2.8 Assets pledged as collateral
2.9 Interest income and expense
a
2.10 Fees and commission income
2.11 Net trading and foreign exchange income
Interest income and expense for all interest-earning and interest bearing financial instruments are recognised in the income statement
within 'interest income' and 'interest expense' using the effective interest method. The effective interest rate is the rate that exactly
discounts the estimated future cash payments and receipts through the expected life of the financial asset or liability (or, where
appropriate, the next re-pricing date) to the carrying amount of the financial asset or liability. When calculating the effective interest
rate, the Group estimates future cash flows considering all contractual terms of the financial instruments but not future credit losses.
Financial assets and liabilities are offset and the net amount reported in the statement of financial position when the Group has a legally
enforceable right to set off the recognised amounts and there is an intention to settle on a net basis or realise the asset and settle the
liability simultaneously. The legally enforceable right must not be contingent on future events and must be enforceable in the normal
course of business and in the event of default, insolvency or bankruptcy of the counterparty.
Income and expenses are presented on a net basis only when permitted under IFRSs or for gains and losses arising from a group of
similar transactions such as in the Group's trading activity.
Financial assets transferred to external parties that do not qualify for de-recognition are reclassified in the statement of financial
position from investment securities to assets pledged as collateral, if the transferee has received the right to sell or re-pledge them in
the event of default from agreed terms.
Initial recognition of assets pledged as collateral is at fair value, whilst subsequent measurement is based on the classification of the
financial asset. Assets pledged as collateral are either designated as FVOCI or amortised cost. Where the assets pledged as collateral
are designated as FVOCI, subsequent measurement is at fair-value through OCI. Assets pledged as collateral are measured at
amortised cost.
a) POCI (Purchased or originated credit-impaired) financial assets, for which the original credit-adjusted effective interest rate is applied
to the amortised cost of the financial asset.
b) Financial assets that are not 'POCI' but have subsequently become credit-impaired (or stage 3), for which interest revenue is
calculated by applying the effective interest rate to their amortised cost (i.e. net of the expected credit loss provision)
The calculation of the effective interest rate includes contractual fees paid or received, transaction costs, and discounts or premiums
that re an integral part of the effective interest rate.
Transaction costs are incremental costs that are directly attributable to the acquisition, issue or disposal of a financial asset or liability.
Interest income and expense presented in the income statement include:
• Interest on financial assets and liabilities measured at amortised cost is calculated on an effective interest rate basis.
• Interest on financial assets and liabilities measured at FVTPL is calculated on an effective interest rate basis.
Net trading income and foreign exchange income comprises net fair value changes in held for trading securities, net fair value gain on
derivative instrument, and foreign exchange translation and trading gains/losses.
Fees and commission that are integral to the effective interest rate on a financial asset are included in the measurement of the effective
interest rate. Fees, such as processing and management fees charged for assessing the financial position of the borrower, evaluating
and reviewing guarantee, collateral and other security, negotiation of instruments’ terms, preparing and processing documentation and
finalising the transaction are an integral part of the effective interest rate on a financial asset or liability and are included in the
measurement of the effective interest rate of financial assets or liabilities.
Other fees and commissions which relates mainly to transaction and service fees, including loan account structuring and service fees,
investment management and other fiduciary activity fees, sales commission, placement line fees, syndication fees and guarantee
issuance fees are recognised as the related services are provided or performed.
Interest income is calculated by applying the effective interest rate to the gross carrying amount of financial assets, except for:

POLARIS BANK ANNUAL REPORT & FINANCIAL STATEMENTS 2019
75
NOTES TO THE FINANCIAL STATEMENTSFor the year ended 31 December 2019
(All amounts in millions of Naira unless otherwise stated)
2.12 Dividend income
2.13 Impairment of non-financial assets
2.14 Non-current assets (or disposal groups) held for sale
2.15 Leases
Non-current assets (or disposal groups) are classified as assets held for sale when their carrying amount is to be recovered principally
through a sale transaction and a sale is considered highly probable. They are stated at the lower of carrying amount and fair value less
costs to sell.
Leases of property, plant and equipment where the group, as lessee, has substantially all the risks and rewards of ownership are
classified as finance leases. Finance leases are capitalised at the lease's inception at the fair value of the leased property or, if lower,
the present value of the minimum lease payments. The corresponding rental obligations, net of finance charges, are included in other
short-term and long-term payables. Each lease payment is allocated between the liability and the finance cost. The finance cost is
charged to the profit or loss over the lease period so as to produce a constant periodic rate of interest on the remaining balance of the
liability for each period.
The property, plant and equipment acquired under finance leases is depreciated over the asset's useful life or over the shorter of the
asset's useful life and the lease term if there is no reasonable certainty that the group will obtain ownership at the end of the lease
term. Leases in which a significant portion of the risks and rewards of ownership are not transferred to the group as lessee are
classified as operating leases. Lease income from operating leases where the group is a lessor is recognised in income on a straight-line
basis over the lease term. The respective leased assets are included in the balance sheet based on their nature.
Any impairment loss in a disposal group is allocated first to goodwill and then to the remaining assets and liabilities on a prorata basis
except that loss is allocated to inventories, deferred tax assets, employee benefits and investment property which continue to be
measured in accordance with the group's accounting policies.
The recoverable amount of an asset or cash-generating unit is the greater of its value in use and its fair value less costs to sell. In
assessing value in use, the estimated future cash flows are discounted to their present value using a pre-tax discount rate that reflects
current market assessments of the time value of money and the risks specific to the asset.
An impairment loss is recognised in the income statement if the carrying amount of an asset or its cash generating unit exceeds its
recoverable amount. A cash generating unit is the smallest identifiable asset group that generates cash flows that largely are
independent from other assets and groups. Impairment losses recognised in respect of cash-generating units are allocated first to
reduce the carrying amount of any goodwill allocated to the units and then to reduce the carrying amount of the other assets in the unit
(group of units) on a pro rata basis.
The carrying amounts of the Group’s non-financial assets are reviewed at each reporting date to determine whether there is any
indication of impairment. If any such indication exists then the asset’s recoverable amount is estimated. For goodwill and intangible
assets that have indefinite useful lives or that are not available for use, the recoverable amount is estimated each year.
Dividend income is recognised when the right to receive income is established. Dividends are reflected as a component of other
operating income.

POLARIS BANK ANNUAL REPORT & FINANCIAL STATEMENTS 2019
76
NOTES TO THE FINANCIAL STATEMENTSFor the year ended 31 December 2019
(All amounts in millions of Naira unless otherwise stated)
2.16 Property, plant and equipment
i. Recognition and measurement
ii. Subsequent costs
iii. Depreciation
iv. Derecognition
Capital work in progress is not depreciated. Upon completion it is transferred to the relevant asset category. Depreciation methods,
useful lives and residual values are reassessed at each reporting date.
An item of property and equipment is derecognised on disposal or when no future economic benefits are expected from its use or
disposal. Any gain or loss arising on de-recognition of the asset (calculated as the difference between the net disposal proceeds and the
carrying amount of the asset) is included in the income statement in the year the asset is derecognised.
Depreciation rates, methods and the residual values underlying the calculation of depreciation of items of property, plant and equipment
are kept under review on an annual basis to take account of any change in circumstances.
Depreciation begins when an asset is available for use and ceases at the earlier of the date that the asset is derecognised or classified
as held for sale in accordance with IFRS 5. A non-current asset or disposal group is not depreciated while it is classified as held for sale.
Depreciation is recognised in the income statement on a straight-line basis to write down the cost of each asset, to their residual values
over the estimated useful lives of each part of an item of property, plant and equipment. Leased assets under finance lease are
depreciated over the shorter of the lease term and their useful lives.
The cost of replacing part of an item of property, plant or equipment is recognised in the carrying amount of the item if it is probable
that the future economic benefits embodied within the part will flow to the Group and its cost can be measured reliably. The carrying
amount of the replaced part is derecognised. All other repairs and maintenance are charged to the income statement during the
financial period in which they are incurred.
The Group recognizes items of property, plant and equipment at the time the cost is incurred. These costs include costs incurred initially
to acquire or construct an item of property, plant and equipment as well as the costs of its dismantlement, removal or restoration, the
obligation for which an entity incurs as a consequence of using the item during a particular period.
The assets’ carrying values and useful lives are reviewed, and written down if appropriate, at each reporting date. Assets are impaired
whenever events or changes in circumstances indicate that the carrying amount is less than the recoverable amount.
Items of property and equipment are measured at cost less accumulated depreciation and impairment losses. Cost includes
expenditures that are directly attributable to the acquisition of the asset. When parts of an item of property or equipment have different
useful lives, they are accounted for as separate items (major components) of property and equipment.
The estimated useful lives for the current and comparative periods are as follows:
Leasehold land and buildings - Over the shorter of the useful life of 50 years or lease term
Leasehold improvements - Over the shorter of the useful life of 50 years or lease term
Motor vehicles - 4 years
Computer hardware - 3 years
Furniture and fittings - 5 years
Plant and machinery - 5 years
POLARIS BANK ANNUAL REPORT & FINANCIAL STATEMENTS 2019
77
NOTES TO THE FINANCIAL STATEMENTSFor the year ended 31 December 2019
(All amounts in millions of Naira unless otherwise stated)
2.17 Intangible assets
Goodwill
Software
Subsequent expenditure on software assets is capitalised only when it increases the future economic benefits embodied in the specific
asset to which it relates. All other expenditure is expensed as incurred.
Goodwill arises on the acquisition of subsidiaries and represents the excess of the cost of the acquisition over the Group's interest in the
net fair value of the identifiable assets, liabilities and contingent liabilities of the acquired subsidiaries at the date of acquisition. When
the excess is negative, it is recognised immediately in profit or loss. Goodwill on acquisition of subsidiaries is included in intangible
assets.
Goodwill impairment reviews are undertaken annually or more frequently if events or changes in circumstances indicate a potential
impairment. The carrying value of the CGU containing the goodwill is compared to the recoverable amount, which is the higher of value
in use and the fair value less costs of disposal. Any impairment is recognised immediately as an expense and is not subsequently
reversed. Gains and losses on the disposal of an entity include the carrying amount of goodwill relating to the entity sold.
Amortisation method, useful lives, and residual values are reviewed at each financial year-end and adjusted if appropriate.
Amortisation is recognised in profit or loss on a straight-line basis over the estimated useful life of the software, from the date that it is
available for use since this most closely reflects the expected pattern of consumption of the future economic benefits embodied in the
asset. The estimated useful life of software is 3 years.
For the purpose of impairment testing, goodwill acquired in a business combination is allocated to each of the CGUs, or groups of CGUs,
that is expected to benefit from the synergies of the combination. Each unit or group of units to which the goodwill is allocated
represents the lowest level within the entity at which the goodwill is monitored for internal management purposes. Goodwill is
monitored at the operating segment level.
Software acquired by the Group is stated at cost less accumulated amortisation and accumulated impairment losses. Expenditure on
internally developed software is recognised as an asset when the Group is able to demonstrate its intention and ability to complete the
development and use the software in a manner that will generate future economic benefits, and can reliably measure the costs to
complete the development.
Development costs previously expensed cannot be capitalised. The capitalised costs of internally developed software include all costs
directly attributable to developing the software and capitalised borrowing costs, and are amortised over its useful life. Internally
developed software is stated at capitalised cost less accumulated amortisation and impairment.

POLARIS BANK ANNUAL REPORT & FINANCIAL STATEMENTS 2019
78
NOTES TO THE FINANCIAL STATEMENTSFor the year ended 31 December 2019
(All amounts in millions of Naira unless otherwise stated)
2.18 Employee benefits
Defined contribution plans
Defined benefit plans
Termination benefits
Short-term employee benefits
2.19 Provisions
2.20 Financial guarantees
Short-term employee benefit obligations are measured on an undiscounted basis and are expensed as the related service is provided. A
liability is recognised for the amount expected to be paid under short-term cash bonus or profit-sharing plans if the Group has a present
legal or constructive obligation to pay this amount as a result of past service provided by the employee and the obligation can be
estimated reliably.
A provision for restructuring is recognised when the Group has approved a detailed and formal restructuring plan, and the restructuring
either has commenced or has been announced publicly. The Group recognizes no provision for future operating losses.
Termination benefits are recognised as an expense when the Group is demonstrably committed, without realistic possibility of
withdrawal, to a formal detailed plan to terminate employment before the normal retirement date. Termination benefits for voluntary
redundancies are recognised if the Group has made an offer encouraging voluntary redundancy, it is probable that the offer will be
accepted, and the number of acceptances can be estimated reliably.
A provision is recognized if, as a result of a past event, the Group has a present legal or constructive obligation that can be estimated
reliably, and it is probable that an outflow of economic benefits will be required to settle the obligation. Provisions are determined by
discounting the expected future cash flows at a pre-tax rate that reflects current market assessments of the time value of money and,
where appropriate, the risks specific to the liability.
Past-service costs are recognised immediately in the income statement. The net interest cost is calculated by applying the discount rate
to the net balance of the defined benefit obligation. This cost is included in employee benefit expense in the income statement.
A defined contribution plan is a pension plan under which the Group pays fixed contributions to a separate entity. The Group has no
legal or constructive obligations to pay further contributions if the fund does not hold sufficient assets to pay all employees the benefits
relating to employee service in the current and prior periods.
A defined benefit plan is a pension plan that defines an amount of pension benefit that an employee will receive on retirement, usually
dependent on one or more factors, such as age, years of service and compensation. The liability recognised in the statement of financial
position in respect of defined benefit pension plans is the present value of the defined benefit obligation at the end of the reporting
period. The defined benefit obligation is calculated annually by independent actuaries using the projected unit credit method. The
present value of the defined benefit obligation is determined by discounting the estimated future cash outflows using interest rates of
high-quality corporate bonds that are denominated in the currency in which the benefits will be paid, and that have terms to maturity
approximating the terms of the related pension liability.
A provision for onerous contracts is recognised when the expected benefits to be derived by the Group from a contract are lower than
the unavoidable cost of meeting its obligations under the contract. The provision is measured at the present value of the lower of the
expected cost of terminating the contract and the expected net cost of continuing with the contract. Before a provision is established,
the Group recognises any impairment loss on the assets associated with that contract.
Actuarial gains and losses arising from experience adjustments and changes in actuarial assumptions are charged or credited to equity
in other comprehensive income in the period in which they arise.
For defined contribution plans, the Group pays contributions to publicly or privately administered pension fund administrators (PFA) on
a mandatory, contractual or voluntary basis. The Group has no further payment obligations once the contributions have been paid. The
contributions are recognised as employee benefit expense in the income statement when they are due. Prepaid contributions are
recognised as an asset to the extent that a cash refund or a reduction in the future payments is available.
Financial guarantee contracts are contracts that require the issuer to make specified payments to reimburse the holder for a loss it
incurs because a specified debtor fails to make payments when due in accordance with the terms of a debt instrument.
Financial guarantees are initially recognised in the consolidated financial statements at their fair values on the date that the guarantee
was given; and the initial fair value amortised over the life of the financial guarantee. The guarantee liability is subsequently carried at
the higher of this amortised amount and the present value of any expected payment (when a payment under the guarantee has
become probable).
The current service cost of the defined benefit plan, recognised in the income statement in employee benefit expense, except where
included in the cost of an asset, reflects the increase in the defined benefit obligation resulting from employee service in the current
year, benefit changes curtailments and settlements.

POLARIS BANK ANNUAL REPORT & FINANCIAL STATEMENTS 2019
79
NOTES TO THE FINANCIAL STATEMENTSFor the year ended 31 December 2019
(All amounts in millions of Naira unless otherwise stated)
2.21 Share capital
Ordinary shares are classified as equity.
Share issue costs
Dividends on the Bank's ordinary shares
2.22 Borrowings
2.23 Discontinued operations
2.24 Repossessed Collateral
In certain circumstances, property is repossesed following the foreclosure on loans that are in default. Repossessed properties are
measured at the lower of carrying amount and fair value less costs to sell and reported within 'Prepayments and other assets'.
The Group presents discontinued operations in a separate line in the consolidated income statement if an entity or a component of an
entity has been disposed of or is classified as held for sale and:
(a) Represents a separate major line of business or geographical area of operations;
(b) Is part of a single co-ordinated plan to dispose of a separate major line of business or geographical area of operations; or
(c) Is a subsidiary acquired exclusively with a view to resale (for example, certain private equity investments).
Net profit from discontinued operations includes the net total of operating profit and loss before tax from operations, including net gain
or loss on sale before tax or measurement to fair value less costs to sell and discontinued operations tax expense. A component of an
entity comprises operations and cash flows that can be clearly distinguished, operationally and for financial reporting purposes, from the
rest of the Group´s operations and cash flows. If an entity or a component of an entity is classified as a discontinued operation, the
Group restates prior periods in the consolidated income statement.
Incremental costs directly attributable to the issue of new shares or options or to the acquisition of a business are shown in equity as a
deduction, net of tax, from the proceeds.
Dividends on the Bank's ordinary shares are recognised in equity in the period in which they are approved by the Bank’s shareholders.
Dividends for the year that are declared after the date of the consolidated statement of financial position are dealt with in the
subsequent events note.
Once classified as held for sale or distribution, intangible assets and property, plant and equipment are no longer amortised or
depreciated, and any equity accounted investee is no longer equity accounted.
Impairment losses on initial classification as held for sale or distribution and subsequent gains and losses on re-measurement are
recognised in the income statement. Gains are not recognised in excess of any cumulative impairment loss.
Non-current assets, or disposal groups comprising assets and liabilities, that are expected to be recovered primarily through sale or
distribution rather than through continuing use, are classified as held for sale or distribution. Immediately before classification as held
for sale or distribution, the assets, or components of a disposal group, are re-measured in accordance with the Group’s accounting
policies. Thereafter generally the assets, or disposal group, are measured at the lower of their carrying amount and fair value less costs
to sell. Any impairment loss on a disposal group is allocated first to goodwill, and then to the remaining assets and liabilities on pro rata
basis, except that no loss is allocated to inventories, financial assets, deferred tax assets, employee benefit assets, investment property
or biological assets, which continue to be measured in accordance with the Group’s accounting policies.
Borrowings are recognised initially at fair value, net of transaction costs incurred. Borrowings are subsequently carried at amortised
cost; any difference between the proceeds (net of transaction costs) and the redemption value is recognised in the income statement
over the period of the borrowings using the effective interest method.
Fees paid on the establishment of borrowings are recognised as transaction costs of the borrowing to the extent that it is probable that
some or all of the facility will be drawn down. In this case, the fee is deferred until the draw-down occurs. To the extent that there is no
evidence that it is probable that some or all of the facility will be drawn down, the fee is capitalised as a pre-payment for liquidity
services and amortised over the period of the facility to which it relates.
No dividends has been proposed by management for the current period.
Where the Bank or any member of the Group purchases the Bank’s equity share capital (treasury shares), the consideration paid,
including any directly attributable incremental costs (net of income taxes) is deducted from equity attributable to the Bank’s equity
holders until the shares are cancelled or reissued. Where such ordinary shares are subsequently reissued, any consideration received,
net of any directly attributable incremental transaction costs and the related income tax effects, is included in equity attributable to the
company’s equity holders.

POLARIS BANK ANNUAL REPORT & FINANCIAL STATEMENTS 2019
80
NOTES TO THE FINANCIAL STATEMENTSFor the year ended 31 December 2019
(All amounts in millions of Naira unless otherwise stated)
3 Financial risk management
The following section discusses the Group's risk management policies. The measurement of ECL under IFRS 9 uses the
information and approaches that the Group uses to manage credit risk, though certain adjustments are made in order to
comply with the requirements of IFRS 9. The approach taken for IFRS 9 measurement purposes is discussed separately in
note 2.6.1.
The need for proper risk management cannot be over emphasized hence the Group recognises the need to invest in
establishing appropriate structures, develop its personnel and deploy the right technology to support its risk practices which
will further strengthen risk management values and beliefs across board. The Group's aim is to achieve an appropriate
balance between risk and return while minimising potential adverse effects on the Group's financial performance.
Risk management is at the center of the Group's operations. The Group practices a robust risk management system which
embodies proactive identification measurement, treatment, monitoring and reporting of all material risks to which it is
exposed. The Group is primarily exposed to credit, market and operational risks. Other risks faced by the group include but is
not limited to liquidity, settlement, reputational, legal, strategic and compliance risks. The management of these risks is in
unison with the Group’s capital management in general and the Group’s strategic objectives in particular.
The Enterprise Wide Risk Management Directorate is responsible for carrying out risk management in line with global best
practice and with the ultimate objective of delivering value to the Group’s shareholders. The risk management practice
adopted begins with establishing a general context from policy and guidance notes approved by the Board of Directors. The
practice further cascades into risk identification, risk analysis, evaluation, mitigation and communication.
The communication of risks helps to inculcate homogenous risk principles shared across the Group that eventually shapes in
general, risk awareness and response. A common risk management language improves the risk culture of the group hence
making everybody a stake holder in the risk process. The Group’s risk management is organised along the three line of
defense shown in the figure below:
These risk organisations are geared towards protection of the Group's Customer deposits, ensure optimum Capital
Management and boost risk adjusted profit margins for the enhancement of Shareholders value. The dynamic nature of risks
is a basis for the regular review of risk management policies and systems by the Group for effective and relevance. This
makes risk management in the Group, a veritable tool for decision making since is aligns with the prevailing market
conditions.
BUSINESS UNITS
- Interface with customers
- Risk origination
CONTROL GROUPS
- Provide risk oversight
- Provide controls
INTERNAL AUDIT
- Validation
-Assurance of risk management
processes

POLARIS BANK ANNUAL REPORT & FINANCIAL STATEMENTS 2019
81
NOTES TO THE FINANCIAL STATEMENTSFor the year ended 31 December 2019
(All amounts in millions of Naira unless otherwise stated)
Enterprise risk management framework
Polaris Bank has an enterprise risk management structure that aligns its practice within the strategy and regulatory standards
for capital management. It spells out the risk types, policies within which they are treated and the metrics for their
management and/or control. The Board has the overall responsibility for risk management within the Bank. The Board
enhances value for shareholders through various committees that includes but is not restricted to the committees shown in
the diagram below:
The Committees at Board and Management levels are responsible for reviewing and recommending risk management policies,
procedures and profiles including risk philosophy, risk appetite and risk tolerance of the Group. The oversight functions cut
across all risk areas. The Committees monitor the Group's plans and progress towards meeting regulatory Risk-Based
Supervision requirements and implementation of Basel precepts as well as the overall Regulatory and Economic Capital
Adequacy. Other functions of these Committees include:
Risk Management Philosophy
Group defines risk management philosophy as the set of values, attitudes and practices that shows how it would perceive and
or respond to any risk to which it is exposed. The principles that guide the management of risk across the Group are:
1. A general acceptance that enterprise risk-management is mandatory, and not optional.
2. Retention of ownership and accountability for risk and risk management right from the business unit or other unit where it
was first identified.
3. Striking a conservative balance between risk and reward. This is achieved by aligning risk appetite with business strategy,
diversifying risk, pricing risk appropriately, mitigating risk through preventive and detective controls and updating risk
registry.
4. Making risk management a shared responsibility .All business segments are responsible for active management of their
risks, with direction and oversight provided by the Risk Management Group, and other corporate support groups.
5. Risk knowledge and understanding as a basis for decision making. The enterprise performs a rigorous assessment of risks
in relationships, products, transactions and other business activities.
6. Avoidance of activities that are not consistent with our Values, Code of Conduct or Policies - This contributes to the
protection of our reputation and the uniformity of our principles.
7. Focus on clients as an act of good risk management. We know our clients, build a relationship with them and ensure that
the services we provide are suitable for and understood by them.
BOARD OF DIRECTORS
INTERNAL AUDITORS EXTERNAL AUDITORS
BOARD AUDIT AND RISK MANAGEMENT
COMMITTEE
MANAGEMENT RISK COMITTEE
MANAGEMENT CREDIT COMMITTEE
ASSETS AND LIABILITY COMMITTEE
BOARD CREDIT COMMITEE

POLARIS BANK ANNUAL REPORT & FINANCIAL STATEMENTS 2019
82
NOTES TO THE FINANCIAL STATEMENTSFor the year ended 31 December 2019
(All amounts in millions of Naira unless otherwise stated)
COMMITTEE
Board Audit & Risk
Board Audit &
Risk Management
Management Risk
Management
Credit
Assets and
Liability
Board Credit
Risk Organization and Governance
Diagram 1: Risk Organisation
RESPONSIBILITY
The Board at all times ensures that a systematic, documented assessment of the processes and outcomes surrounding key
risks is undertaken. It also ensures the regular review of risk management systems and policies to reflect prevailing realities.
Provision of validation, assurance, independence and objectivity of the
internal and external auditors.
Definition of the Bank’s risk appetite and the provision of appropriate
structure and resources for the identification, assessment, measurement,
monitoring and control of risks across the group.
Planning, management and control of the Bank`s overall risks.
Oversees credit approval that falls within the mandated approval limit.
Reviews and recommendation of credit policy direction to the BCC
Ensures adequate liquidity to meet the Bank’s funding need as well as
management of the interest rate and foreign exchange risk.
Provision of oversight for the Bank’s lending process, including its credit
policy, framework and strategy
The Group’s structure defines responsibility for risk management across all levels of authority. The Board of Directors, through
its various committees, articulates the vision, sets the tone and provides strategic direction for the management of risk across
the Group. Executive Management transforms the strategic direction and policies set by the Board into procedures and
processes, they institute an effective hierarchy to execute and implement the policies.
Board of Directors
Board Audit & Risk Management Commi�ee
BUSINESS UNITS
Extern
al Au
dit
Inte
rnal A
ud
it
Management Commi�ee
Board Credit Commi�ee
Management Credit Commi�ee
Asset and Liability Management
Commi�ee
Risk Management Commi�ee
Enterprise Risk Management
Credit Risk Management
Market Risk Management
Opera�onal Risk Management
Co
mp
lian
ce
Finan
ce
The Enterprise Risk Management Group, headed by a General Manager, who reports to the Board through the Managing
Director/CEO, has the primary responsibility of managing these risks on a day today basis and maintains a consolidated and
holistic view of the different risk types.

POLARIS BANK ANNUAL REPORT & FINANCIAL STATEMENTS 2019
83
NOTES TO THE FINANCIAL STATEMENTSFor the year ended 31 December 2019
(All amounts in millions of Naira unless otherwise stated)
Diagram 2: The Enterprise Risk Management Organogram
The Bank’s Enterprise risk management is made up of credit, market and operational risks with the operational risk further
encompassing strategic and legal risks. MIS and Predictive analytics operate independently of the three major risk classes.
The credit analysis team through the Chief Credit Officer reports to the Directorate Head Risk Management.
MD/CEO
Directorate Head /Chief Risk Officer
ComplianceDepartment
Remedial Assets
Head, Credit Risk
Por�olio Planning, MIS and
Market Risk Opera�onal Risk
Loan Review
Credit Admin & Compliance
Collateral Review
Retail Risk
Predic�ve Analy�cs
Strategic Risk
ALM
& TradeLiquidity Risk
Chief Credit OfficerOpera�onal Risk
Management
Compliance Risk
Legal Risk
BCP
IT Risk
CreditAnalysis
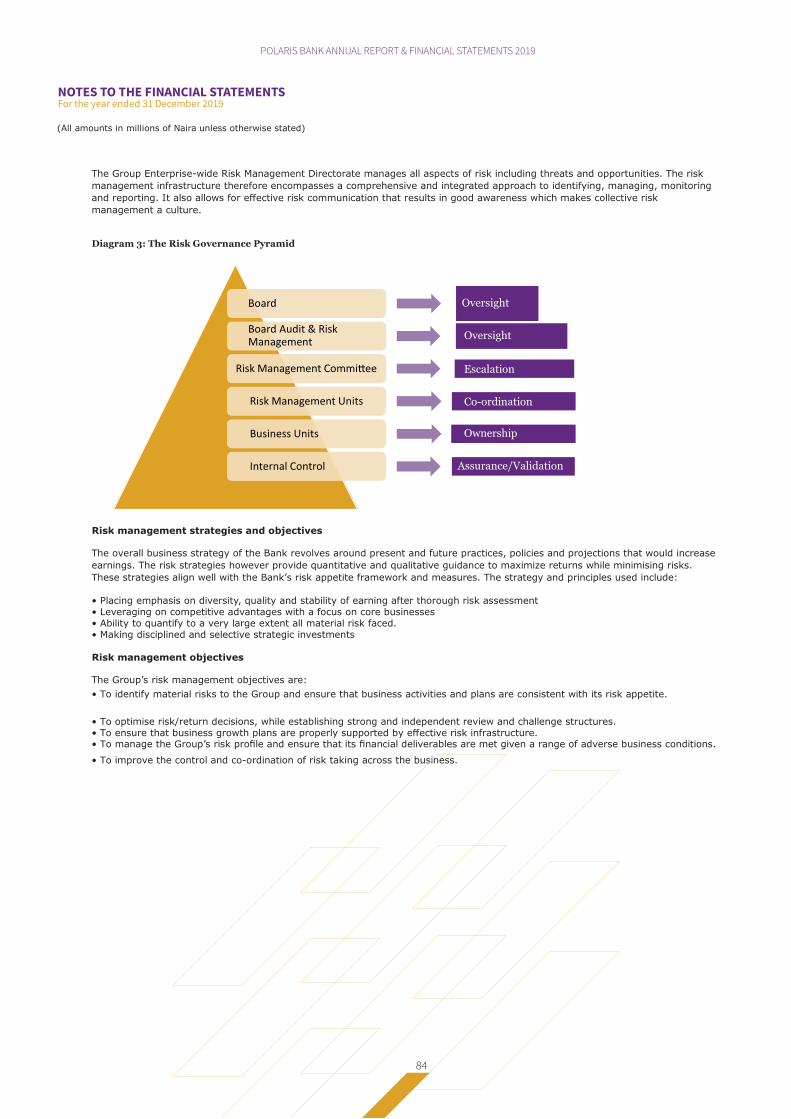
(All amounts in millions of Naira unless otherwise stated)
Risk management strategies and objectives
Risk management objectives
• To optimise risk/return decisions, while establishing strong and independent review and challenge structures.• To ensure that business growth plans are properly supported by effective risk infrastructure.
• To improve the control and co-ordination of risk taking across the business.
The Group Enterprise-wide Risk Management Directorate manages all aspects of risk including threats and opportunities. The risk
management infrastructure therefore encompasses a comprehensive and integrated approach to identifying, managing, monitoring
and reporting. It also allows for effective risk communication that results in good awareness which makes collective risk
management a culture.
Diagram 3: The Risk Governance Pyramid
The overall business strategy of the Bank revolves around present and future practices, policies and projections that would increase
earnings. The risk strategies however provide quantitative and qualitative guidance to maximize returns while minimising risks.
These strategies align well with the Bank’s risk appetite framework and measures. The strategy and principles used include:
• To manage the Group’s risk profile and ensure that its financial deliverables are met given a range of adverse business conditions.
• Placing emphasis on diversity, quality and stability of earning after thorough risk assessment• Leveraging on competitive advantages with a focus on core businesses• Ability to quantify to a very large extent all material risk faced.• Making disciplined and selective strategic investments
The Group’s risk management objectives are:
• To identify material risks to the Group and ensure that business activities and plans are consistent with its risk appetite.
Board
Board Audit & Risk Management
Risk Management Commi�ee
Risk Management Units
Business Units
Internal Control
Oversight
Oversight
Escalation
Co-ordination
Ownership
Assurance/Validation
POLARIS BANK ANNUAL REPORT & FINANCIAL STATEMENTS 2019
84
NOTES TO THE FINANCIAL STATEMENTSFor the year ended 31 December 2019

POLARIS BANK ANNUAL REPORT & FINANCIAL STATEMENTS 2019
85
NOTES TO THE FINANCIAL STATEMENTSFor the year ended 31 December 2019
(All amounts in millions of Naira unless otherwise stated)
Scope of Polaris Bank's Risk Management
Credit risk
Market risk
Liquidity risk
Compliance risk
Strategic risk
Risk Appetite
Risk Management Methodology
The Group uses risk methodologies that cut across the 4T’s of response. The type of risk determines whether it would be
transferred, tolerated, treated or terminated. The major risks however fall under the treatment methodology. The Bank manages
risk to derive value for all stakeholders. Its sets about achieving this by formulating policies and procedures that guides actions and
reactions. Some of the policies and procedures are shown in the diagram below:
The policies sets the tone but to ensure adherence, several exception reports on customers and activities of the Group are
generated by the various audit control units for management’s decision making. These include:
Potential loss owing to obligor default
Risk that value of on and off-balance sheet positions of a financial institution will be adversely affected by
movements in market rates or prices.
Potential loss arising from inability to meet obligations, or fund increases in assets as they fall due without
incurring unacceptable cost or losses.
Potential loss arising from non-compliance with laws, regulations, standards or code of conducts of local
industry regulators.
Potential loss arising from current and prospective impact on earnings or capital due to:
i) Adverse business decisions
ii) Improper implementation of decisions
iii) Lack of responsiveness to industry changes
• Monthly Management Profitability Reports (MPR) for the marketing teams
• Monthly Operations Performance Reports (OPR) for the support teams
• Quarterly Business Profitability Review
• Annual Bank-wide performance appraisal systems
“In the Pursuit of the Group’s objectives of maximizing its earnings and shareholders value, the Group exhibits a “moderate”
appetite for risk. This measure is quantified by the various board approved risk limits/thresholds and reflected in the Group’s culture
as well as its approach to Business.”
Our Risk Appetite Statement defines the amount and type of risk the Group is willing to accept in the pursuit of its strategic
objectives, while recognising a range of possible outcomes as business plans are implemented. In arriving at the risk appetite, the
enterprise risk framework which is approved by the Board Audit Risk Management Committee combines a top-down view of its
capacity to take risk with a bottom-up view of the business risk profile requested and recommended by each business area. The
Group defines its risk appetite at the enterprise level as well as across different risk areas using qualitative and quantitative measures.
Po
lici
es a
nd
pro
ced
ure
s
ERM
Credit
Human Resources
Standard operations
IT
FX Exposure
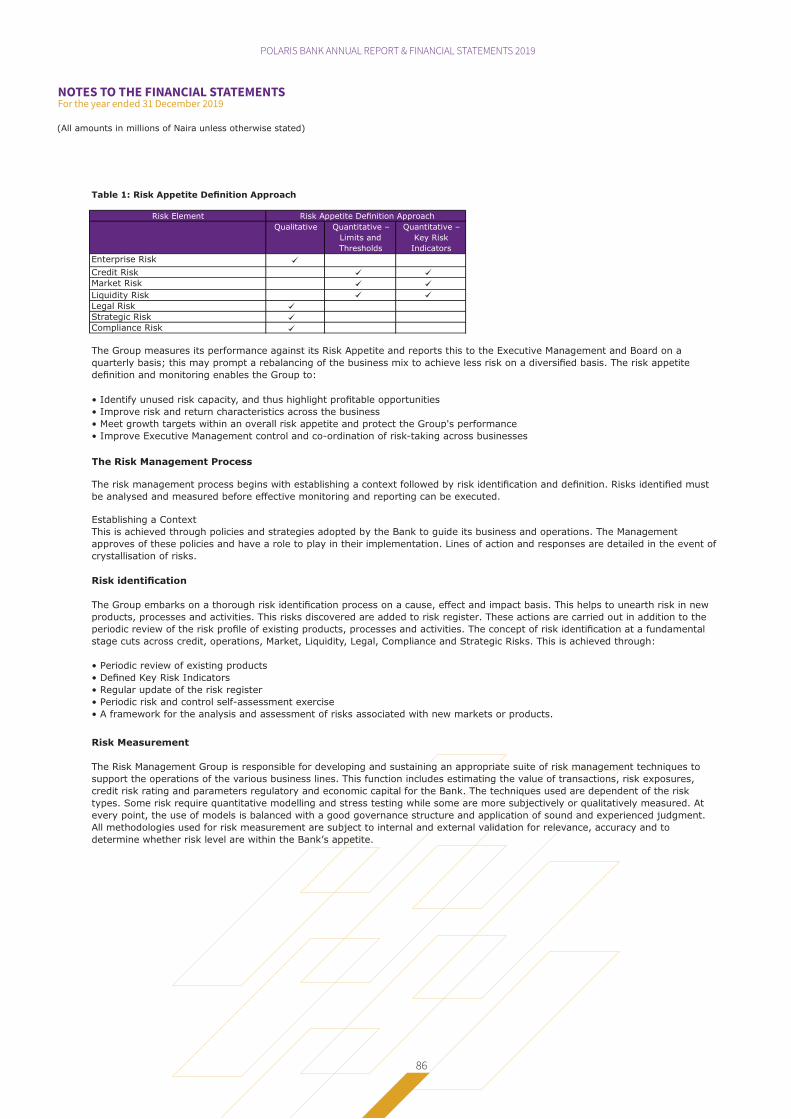
POLARIS BANK ANNUAL REPORT & FINANCIAL STATEMENTS 2019
86
NOTES TO THE FINANCIAL STATEMENTSFor the year ended 31 December 2019
(All amounts in millions of Naira unless otherwise stated)
Table 1: Risk Appetite Definition Approach
The risk management process begins with establishing a context followed by risk identification and definition. Risks identified must
be analysed and measured before effective monitoring and reporting can be executed.
Establishing a Context
This is achieved through policies and strategies adopted by the Bank to guide its business and operations. The Management
approves of these policies and have a role to play in their implementation. Lines of action and responses are detailed in the event of
crystallisation of risks.
Risk identification
The Group embarks on a thorough risk identification process on a cause, effect and impact basis. This helps to unearth risk in new
products, processes and activities. This risks discovered are added to risk register. These actions are carried out in addition to the
periodic review of the risk profile of existing products, processes and activities. The concept of risk identification at a fundamental
stage cuts across credit, operations, Market, Liquidity, Legal, Compliance and Strategic Risks. This is achieved through:
• Periodic review of existing products
• Defined Key Risk Indicators
• Regular update of the risk register
• Periodic risk and control self-assessment exercise
• A framework for the analysis and assessment of risks associated with new markets or products.
Risk Measurement
The Risk Management Group is responsible for developing and sustaining an appropriate suite of risk management techniques to
support the operations of the various business lines. This function includes estimating the value of transactions, risk exposures,
credit risk rating and parameters regulatory and economic capital for the Bank. The techniques used are dependent of the risk
types. Some risk require quantitative modelling and stress testing while some are more subjectively or qualitatively measured. At
every point, the use of models is balanced with a good governance structure and application of sound and experienced judgment.
All methodologies used for risk measurement are subject to internal and external validation for relevance, accuracy and to
determine whether risk level are within the Bank’s appetite.
The Group measures its performance against its Risk Appetite and reports this to the Executive Management and Board on a
quarterly basis; this may prompt a rebalancing of the business mix to achieve less risk on a diversified basis. The risk appetite
definition and monitoring enables the Group to:
• Identify unused risk capacity, and thus highlight profitable opportunities
• Improve risk and return characteristics across the business
• Meet growth targets within an overall risk appetite and protect the Group's performance
• Improve Executive Management control and co-ordination of risk-taking across businesses
The Risk Management Process
Qualitative Quantitative –
Limits and
Thresholds
Quantitative –
Key Risk
Indicators
Risk Element Risk Appetite Definition Approach
Strategic Risk
Compliance Risk
Enterprise Risk
Credit Risk
Market Risk
Liquidity Risk
Legal Risk

POLARIS BANK ANNUAL REPORT & FINANCIAL STATEMENTS 2019
87
NOTES TO THE FINANCIAL STATEMENTSFor the year ended 31 December 2019
(All amounts in millions of Naira unless otherwise stated)
Risk monitoring and Reporting
Monitoring is a very important part of the risk management process. It helps to ensure that business activities are within the
approved limits of guideline. It also aligns the transactions to the Bank’s strategies and risk appetite. Where there is a breach, such
is reported to senior management and/or the Board depending on the limit of guideline.
Reporting helps to capture the collective measures of risk across products and businesses in compliance or in breach of the policies,
limits and guidelines. They also provide a clear statement of the amounts, types, and sensitivities of the various risks in the Bank’s
portfolios. Senior Management and the Board use this information to understand the Bank’s risk profile and the performance of the
portfolios. Reports and rendered daily, weekly, monthly, quarterly, semi -annually or annually depending on the risk and recipient.
The control functions also work independently to review risk practices in line with the framework. They also submit reports that are
used to check if the risk reports are reflective of the actual practices.
• Sensitivity Analysis and Stress Testing
The Group conducts sensitivity analysis and stress test to estimate the potential impact of risk levels on income and capital as a
result of fluctuations in market conditions, liquidity and other risk factors. This gives the Bank an idea of its expected and
unexpected losses. The results from different areas (credit, market, operational liquidity etc.) are consolidated at an enterprise
level. Enterprise-wide stress testing is also integrated with both the strategic and financial planning processes. It is developed with
input from a broad base of stakeholders, and results are integrated into management decision-making processes for capital,
funding, market risk limits, and credit risk strategy. The development and review of this exercise is subject to formalized policies
and approval from senior management.
Models are veritable tools used for stress test and other quantitative risk measures. They help achieve outputs like Expected
Losses(EL), Unexpected Losses(UL), stressed non-performing loans, Exposure at Default(EAD), Probability of Default(PD), Loss
Given Default(LGD), Value at Risk (VaR), duration, maturity gap and rating grades. Since these models have become a vital part of
decision making, the Banks manages the risk inherent in their usage by validation, and revalidation internally and by reputable
External Consultants. In addition, staff are trained to use these models to achieve a high level of accuracy. The models are also
frequently used to reflect prevailing risk factors and best practice.
Basel and Capital Management
Polaris Bank is in the forefront of Basel implementation and it is constantly building resource capacity for the migration to the
internal rating based approach of capital management.
The Basel II regulatory capital framework governs minimum regulatory capital requirements .This framework is organised under
three pillars:
Pillar 1: The Bank uses Basel and CBN compliant methodologies and parameters to calculate its minimum capital requirements while
putting in place measures to achieve the regulatory capital figures stipulated by Basel and CBN
Pillar 2: This pillar contains the internal capital adequacy and assessment process (ICAAP). It is a formal internal assessment of
capital adequacy in relation to strategies, risk appetite, and actual risk profile. It is also a regulatory requirement. To this end, the
Bank has an ICAAP Committee charged with producing the ICAAP report on an annual basis as required by the regulators. The Bank
also has a Capital Management Committee that allocates capital after proper reviews of risk profile and concentration vis a vis
return.
Pillar 3: The Bank is transparent in all its process and reports its business operations in a precise manner. It enhances public
disclosure (both quantitative and qualitative) of specific details of risks being assumed, and how capital and risk are being managed
under the Basel framework.
The CBN specifies approaches for quantifying the risk weighted assets for credit, market and operational risk for the purpose of
determining regulatory capital. Although the computations are consistent with the requirements of Pillar 1 Basel II Accord, certain
sections have been adjusted to reflect the peculiarities of the Nigerian environment. In compliance with CBN, the Bank has adopted
the Standardized approach in determining capital charge for credit risk and market risk while capital charge for operational risk was
determined using Basic Indicator Approach (BIA).

POLARIS BANK ANNUAL REPORT & FINANCIAL STATEMENTS 2019
88
NOTES TO THE FINANCIAL STATEMENTSFor the year ended 31 December 2019
(All amounts in millions of Naira unless otherwise stated)
Management of Credit Risk
Credit risk is the risk of an economic loss arising from the failure of a counterparties to fulfil its contractual obligations; its effect is
measured by the cost of replacing cash flows if the other party defaults.
Credit Risk Guiding Principles
Credit Risk Management in the Group is guided by the following principles:
a. A strategic rather than a purely opportunistic approach in the creation of its credit risk portfolio.
b. Clear articulation of policy guidelines on exposures, concentrations, pricing, collateral, customer-product matrices and portfolio
liquidity.
c. Maintenance of an integrated tracking system to measure actual against targeted risk asset composition and close monitoring of
risk, return and asset quality indicators.
d. The Group shall work to minimize the risk arising from a build-up of concentration in its Credit Risk Asset portfolio in any sector,
obligor or industry.
e. Portfolio liquidity and flexibility shall be important balancing elements in the creation of Credit Risk Assets by the Group.
f. Loan pricing for each exposure shall be determined by the obligor’s risk profile as represented by his risk rating.
g. Irrespective of the rewards, the Group will always put Credit Risk before pecuniary considerations.
h. The Group shall not engage in lending activities where though the returns look promising, the purpose of the loan and or its
source of repayment are unknown or at best speculative.
The Management of Credit Risk occurs broadly on 3 levels: the Board level, Management level and Risk Management Group level.
At the Board level, Credit Risk is managed by the Board Credit Committee and Board Audit & Risk Management Committee with the
following roles:
i. Regular and ad-hoc review and approval of Credit Risk Strategy
ii. Approval of the Group’s Credit Risk Appetite
iii. Monitoring the effectiveness of the Group’s Credit Risk Measurement and Control Systems
iv. Custody of the Group’s Credit Risk Framework
v. Approval of credit requests above Management Credit Committee limits
vi. Approval of the Group’s Credit Risk Rating Systems
vii. Monitoring compliance to portfolio concentration limits
At the Management level, Credit Risk is managed by the Management Risk Committee(MRC), Management Credit Committee
(MCC), the Portfolio Planning Committee (PPC) and the Rating Committee.
The role of the MCC includes among others:
a. Approval of credit facility requests within the limits of management but above the limits of various Business Unit Heads (including
the Managing Director).
b. Review and recommendation for approval to the Board Credit Committee on credit facilities above Management limit.
c. Review and recommendation to the Board Credit Committee of Credit Policies and Standards.
Credit risk is the risk of suffering financial loss, should any of the Group's customers, client or market counterparties fail to fulfil
their contractual obligations to the Group. Credit risk arises mainly from interbank, commercial and consumer loans and advances,
and loan commitments arising from such lending activities, but can also arise from credit enhancement provided, such as credit
derivatives (credit default swaps), financial guarantees, letters of credit, endorsements and acceptances.
Credit risk is the single largest risk within the Group, being an integral part of the Group’s business activities and is inherent in
traditional products – loans, commitments to lend and contingent liabilities, such as letters of credit – and in “traded products” such
as repurchase agreements (repos and reverse repos). The Group is also exposed to credit risks arising from investments in debt
securities and other exposures arising from its trading activities - trading exposures.
The Group defines credit risk as the risk that its customers will be unable or unwilling to pay interest, and/or principal or fail to
perform their obligations as specified in the loan contract engaged between the customer and the Group.
Credit Risk Management

POLARIS BANK ANNUAL REPORT & FINANCIAL STATEMENTS 2019
89
NOTES TO THE FINANCIAL STATEMENTSFor the year ended 31 December 2019
(All amounts in millions of Naira unless otherwise stated)
Credit Origination
The role of the Portfolio Planning Committee includes among others:
a. Review and recommendation for approval to the Board Audit and Risk Management Committee, the Group’s portfolio limit
concentration policy for sector, industry, region, product type, customer type and obligor rating.
b. Review and recommendation for approval to the Board Risk Management Committee, any changes in the Group’s portfolio limit
concentration policy.
c. Monitoring of the actual portfolio concentration limits against targeted performance.
d. Supervision of stress tests for the Group’s Credit Risk portfolio.
The credit risk assessment of loan exposures is centralized in a Credit Analysis team, headed by the Chief Credit Officer, who
reports to the CEO and Board of Directors through the Chief Risk Officer.
There are various levels of filtration in the process of creating credit risk asset in the Group including;
i. Clearly defined exposure concentration limits
ii. Originated transactions going through Centralized Sector Analysts for quality assurance
iii. The extensive use of the rating mechanism to objectively set Risk Acceptance Criteria
iv. Defined Target Markets indicating preferred sectors and obligors for whom credit assets can be created.
The credit approval process flow is depicted below:
The Centralized Specialist Analyst role is a risk management function, and all credits are reviewed for quality assurance, risk
acceptance criteria and conformity with portfolio strategy before being recommended for further processing and approvals along the
designated business line. Approval limits are delegated within the various underwriting levels based on loan value and collateral
arrangement. This assurance process is well institutionalized.
Credit Risk Monitoring
Credit risk monitoring is the responsibility of the Loan Review Department which also reports to the Managing Director (MD) and
Board through the Chief Risk Officer, the activity is carried out both at the individual obligor level (covering on and off balance sheet
exposures) and overall portfolio level.
The overriding objective of credit risk monitoring is to ensure that the quality of the Group's credit portfolio is tracked on a day to
day basis so as to take prompt and appropriate remedial measures as soon as any deterioration or potential deterioration is
identified.
Acct Officer Team Leader
BDM/
Business
Unit
Head
Centralised
Specialist Analyst Maker/
Checker
Under-writers
1-7
Legal Maker/
Checker
Credit Admin
Maker/
Checker
Draw-
down
Maker/
Checker
LOAN DISB’MENT
CREDITAPPROVAL
Activates:
• Credit Rating• Transaction Rating
• This is Limit Based
• Underwriting Levels 1-6;
Level 1- Regional ManagerLevel 2- Head of DirectorateLevel 3- GMDLevel 4- MCCLevel 5- BCCLevel 6- BOD
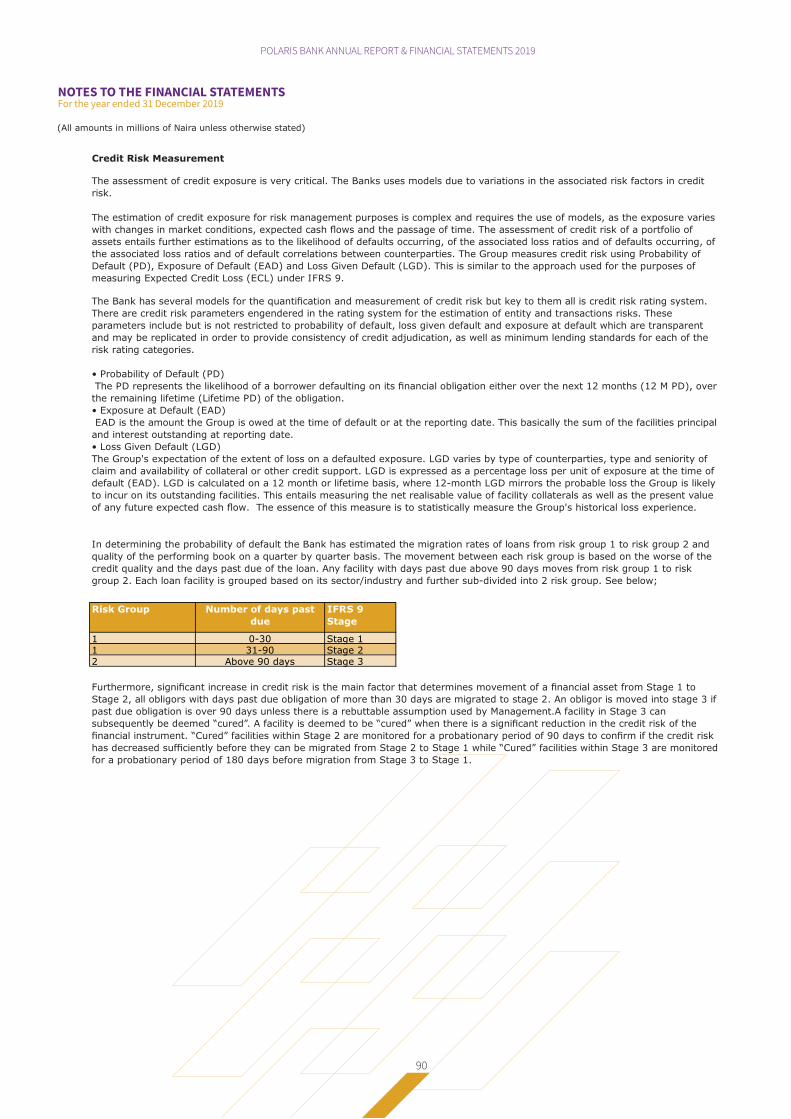
POLARIS BANK ANNUAL REPORT & FINANCIAL STATEMENTS 2019
90
NOTES TO THE FINANCIAL STATEMENTSFor the year ended 31 December 2019
(All amounts in millions of Naira unless otherwise stated)
The assessment of credit exposure is very critical. The Banks uses models due to variations in the associated risk factors in credit
risk.
Credit Risk Measurement
In determining the probability of default the Bank has estimated the migration rates of loans from risk group 1 to risk group 2 and
quality of the performing book on a quarter by quarter basis. The movement between each risk group is based on the worse of the
credit quality and the days past due of the loan. Any facility with days past due above 90 days moves from risk group 1 to risk
group 2. Each loan facility is grouped based on its sector/industry and further sub-divided into 2 risk group. See below;
Furthermore, significant increase in credit risk is the main factor that determines movement of a financial asset from Stage 1 to
Stage 2, all obligors with days past due obligation of more than 30 days are migrated to stage 2. An obligor is moved into stage 3 if
past due obligation is over 90 days unless there is a rebuttable assumption used by Management.A facility in Stage 3 can
subsequently be deemed “cured”. A facility is deemed to be “cured” when there is a significant reduction in the credit risk of the
financial instrument. “Cured” facilities within Stage 2 are monitored for a probationary period of 90 days to confirm if the credit risk
has decreased sufficiently before they can be migrated from Stage 2 to Stage 1 while “Cured” facilities within Stage 3 are monitored
for a probationary period of 180 days before migration from Stage 3 to Stage 1.
The estimation of credit exposure for risk management purposes is complex and requires the use of models, as the exposure varies
with changes in market conditions, expected cash flows and the passage of time. The assessment of credit risk of a portfolio of
assets entails further estimations as to the likelihood of defaults occurring, of the associated loss ratios and of defaults occurring, of
the associated loss ratios and of default correlations between counterparties. The Group measures credit risk using Probability of
Default (PD), Exposure of Default (EAD) and Loss Given Default (LGD). This is similar to the approach used for the purposes of
measuring Expected Credit Loss (ECL) under IFRS 9.
The Bank has several models for the quantification and measurement of credit risk but key to them all is credit risk rating system.
There are credit risk parameters engendered in the rating system for the estimation of entity and transactions risks. These
parameters include but is not restricted to probability of default, loss given default and exposure at default which are transparent
and may be replicated in order to provide consistency of credit adjudication, as well as minimum lending standards for each of the
risk rating categories.
• Probability of Default (PD)
The PD represents the likelihood of a borrower defaulting on its financial obligation either over the next 12 months (12 M PD), over
the remaining lifetime (Lifetime PD) of the obligation.
• Exposure at Default (EAD)
EAD is the amount the Group is owed at the time of default or at the reporting date. This basically the sum of the facilities principal
and interest outstanding at reporting date.
• Loss Given Default (LGD)
The Group's expectation of the extent of loss on a defaulted exposure. LGD varies by type of counterparties, type and seniority of
claim and availability of collateral or other credit support. LGD is expressed as a percentage loss per unit of exposure at the time of
default (EAD). LGD is calculated on a 12 month or lifetime basis, where 12-month LGD mirrors the probable loss the Group is likely
to incur on its outstanding facilities. This entails measuring the net realisable value of facility collaterals as well as the present value
of any future expected cash flow. The essence of this measure is to statistically measure the Group's historical loss experience.
Risk Group IFRS 9
Stage
1 Stage 11 Stage 22 Stage 3
Number of days past
due
0-3031-90
Above 90 days

POLARIS BANK ANNUAL REPORT & FINANCIAL STATEMENTS 2019
91
NOTES TO THE FINANCIAL STATEMENTSFor the year ended 31 December 2019
(All amounts in millions of Naira unless otherwise stated)
Authority limits on credit
Legal Lending Limits
Credit Approval Limits
Collateral policies
- Cash and Government Securities
- Shares and Stocks of Listed Companies and Financial Guarantees- Plant and Equipment- Properties/Real Estates- General Inventories and Receivables- Letter of Lien and Documents of title to goods
- Other Assets
S/N Collateral Type Coverage
(%)1 Cash 110
2 Shares 150
3 Property 150
4 Leases 120
5 Financial Guarantees 100
6 Government Securities 110
7 Other Assets 150
8 Insurance 120
9 Stocks and Goods 150
10 Invoice Discounting 130
11 130
12 Bank Guarantee 100
The Group only accepts collaterals that are enforceable and must fall under any of the following categories:
While these collaterals are acceptable to the Group, they must provide adequate cover for the proposed facility and must be easy to
transfer to the Group, with good legal documentation. They must also be easily realisable, with very stable value outlook.
The approved collateral coverage ratio for the Group’s facilities is as stated below:
Stocks/Goods (Trade
Finance only)
- Single Obligor Limit: The total outstanding statutory exposure for any single person or group of connected persons shall not
exceed 20% of the shareholders fund unimpaired by losses.
- Public Sector Limit: The total outstanding exposures (on and off balance sheet) to all tiers of government and their agencies shall
not at any point exceed 10% of the Bank’s credit portfolio.
- Large Exposure Limits: Aggregate large exposures in the Group shall not exceed eight times (8X) the shareholders fund
unimpaired by losses. A large exposure is defined as an outstanding exposure to a single obligor that is at least 10% of the Bank
shareholders fund unimpaired by losses.
- Specialized Loan limits: The total specialized loans in the portfolio of credit exposure (both on and off balance sheet) must not
exceed 20% of total outstanding.
- Group Approval Limits: Group approvals shall be required in respect of credit exposures that are in excess of the approved
individual credit approval authority. Group approval authority shall be defined at the following levels:
* The Board of Directors (BOD)
* Board Credit Committee (BCC)
* Management Credit Committee (MCC)
The Group has a structured Credit Risk Collateral Management system, which continuously ensures the eligibility, adequacy and
quality of collaterals used as mitigants for credit exposures. The objective of which, is to ensure that the Group has a fall-back
position for all classes of its assets.
Our collateral management system is guided by the collateral policy, which is a part of the Credit Policy and dictates amongst other
things; the continuous review of collateral values to reflect prevailing market conditions and economic realities, the legal perfection
of all pledged collateral and insurance coverage of all pledged collateral, with the Group stated as First Loss Payee.
Approval Levels Obligor limits
Full Board of Directors Above N1.5 billion subject to the Bank's single obligor limit of 20% of shareholders
fund unimpaired by losses
Board Credit Committee Above N500 million and up to N1.5 billion
Managing Director Up to N150 million
Branch/Group/Divisional Heads/ED As delegated by the Managing Director/CEO
Management Credit Committee Above N150 million and up to N500 million

POLARIS BANK ANNUAL REPORT & FINANCIAL STATEMENTS 2019
92
NOTES TO THE FINANCIAL STATEMENTSFor the year ended 31 December 2019
(All amounts in millions of Naira unless otherwise stated)
Credit collateral
Write-off policy
The Group writes off financial assets, in whole or in part, when it has exhausted all practical recovery efforts and has concluded
there is no reasonable expectation of recovery. Loans (and the related impairment allowance accounts) are normally written off,
either partially or in full, when there is no realistic prospect of recovery. Where loans are secured, this is generally after receipt of
any proceeds from the realization of security. In circumstances where the net realizable value of any collateral has been determined
and there is no reasonable expectation of further recovery, write off may be earlier. Subsequent recoveries of amounts previously
written off are credited to the the statement of comprehensive income.
The Group may write-off financial assets that are still subject to enforcement activity. The outstanding contractual amounts of such
assets written off during the period ended 31 December 2019 was N726 million. The Group still seeks to recover amounts it is
legally owed in full, but which have been partially written off due to no reasonable expectation of recovery.
Loans to individuals or sole proprietors must be secured by tangible, marketable collateral that has a market value that is supported
by a valuation report from a registered estate valuer who is acceptable to the Group. The collateral must also be easy to check and
easy to dispose of. This collateral must be in the possession of, or pledged to, the Group. Client’s account balances must be within
the scope of cover provided by its collateral.
The Group ensures that each credit is reviewed and granted based on the strength of the borrowers’ cash flow. However, the Group
also ensures its credit facilities are well secured as a second way out. The policies that guide collateral for facilities are embedded
within the Group’s credit policy guide. These include the following policy statements amongst others:
The main collateral types acceptable to the Bank for loans and advances include:
All collateral offered must have the following attributes:
• There must be good legal title
• The title must be easy to transfer
• It should be easy and relatively cheap to value
• The value should be appreciating or at least stable
• The security must be easy to sell.
The Group has not included collaterals not easily convertible into cash in calculation of its expected credit loss. All collateral must be
protected by insurance. Exceptions include cash collateral, securities in safe keeping, indemnity or guarantees, or where our interest
is general (for instance in a negative pledge). The insurance policy has to be issued by an insurer acceptable to the Bank. All cash
collateralized facilities shall have a 20% margin to provide cushion for interest and other charges i.e. only 80% of the deposit or
cash collateral may be availed to an obligor.
• Mortgages over residential properties
• Charges over business premises, fixed and floating assets as well as inventory.
• Charges over financial instruments such as equities, treasury bills etc.
The fair values of collaterals are based upon last annual valuation undertaken by independent valuers on behalf of the Bank. The
valuation techniques adopted for properties are based upon fair values of similar properties in the neighbourhood taking into
cognizance the advantages and disadvantages of the comparatives over the subject property and any other factor which can have
effect on the valuation e.g. subsequent movements in house prices, after making allowance for dilapidations. The fair values of
nonproperty collaterals (such as equities, bond, treasury bills, etc.) are determined with reference to market quoted prices or
market values of similar instrument. There were no repossessed collateral during the period.
The same fair value approach is used in determining the collaterals value in the course of sale or realisation.

POLARIS BANK ANNUAL REPORT & FINANCIAL STATEMENTS 2019
93
NOTES TO THE FINANCIAL STATEMENTSFor the year ended 31 December 2019
(All amounts in millions of Naira unless otherwise stated)
3. Financial risk management
3.1 Credit risk
3.1.1a Maximum exposure to credit risk for financial assets
Group and Bank
31 December 31 December
2019 2018
1,264 57
Other Assets (Cash reserve with CBN) 37,698 37,446
2019
Stage112-month ECL
Stage 2Lifetime ECL
Stage 3Lifetime ECL
Total
Term loans 127,571 241 83,823 211,635
Overdrafts 13,342 128 36,303 49,773
Gross Carrying amount 140,913 369 120,126 261,408
Loss Allowance (3,172) (41) (69,457) (72,670)
Carrying amount 137,741 328 50,669 188,739
Investment securities
561,145 - - 561,145
Loss allowance (1,990) - - (1,990)
Carrying amount 559,155 - - 559,155
Other assets (excluding restricted cash) - - 13,006 13,006
Other loans and receivables 182,594 - - 182,594
Loss allowance - - (4,191) (4,191)
Carrying amount 182,594 - 8,815 191,409
Balances with central banks 3,396 - - 3,396
Loss allowance - - - -
Carrying amount 3,396 - - 3,396
Due from banks and other financial institutions 62,076 - - 62,076
Loss allowance - - - -
Carrying amount 62,076 - - 62,076
2018
Stage112-month ECL
Stage 2Lifetime ECL
Stage 3Lifetime ECL
Total
Term loans 163,803 5,709 74,348 243,860
Overdrafts 11,424 399 278,880 290,703
Gross Carrying amount 175,227 6,108 353,228 534,563
Loss Allowance (15,822) (2,982) (175,708) (194,513)
Carrying amount 159,405 3,126 177,520 340,050
Investment securities
590,483 - - 590,483
Loss allowance (416) - - (416)
Carrying amount 590,067 - - 590,067
Other assets (excluding restricted cash) - - 18,471 18,471
Loss allowance - - (7,812) (7,812)
Carrying amount - - 10,659 10,659
The following table contains an analysis of the maximum credit risk exposure from financial assets not subject to impairment.
The Group's maximum exposure to credit risk for the period 1 January 2019 to 31 December 2019 is represented by the carrying
amounts of the financial assets in the statement of financial position.
Maximum exposure to credit risk - Financial instruments not subject to impairment
Group and Bank
Investment securities: Amortised Costs and
Assets pledged as Collateral
Financial assets held at fair value through profit or loss
Maximum exposure to credit risk - Financial instruments subject to impairment
The following table contains an analysis of the credit risk exposure of financial instruments for which an ECL allowance is recognised.
The gross carrying amount of financial assets below also represents the Group's maximum exposure to credit risk on these assets.
Group and Bank
Investment securities: Amortised Costs and
Assets pledged as Collateral
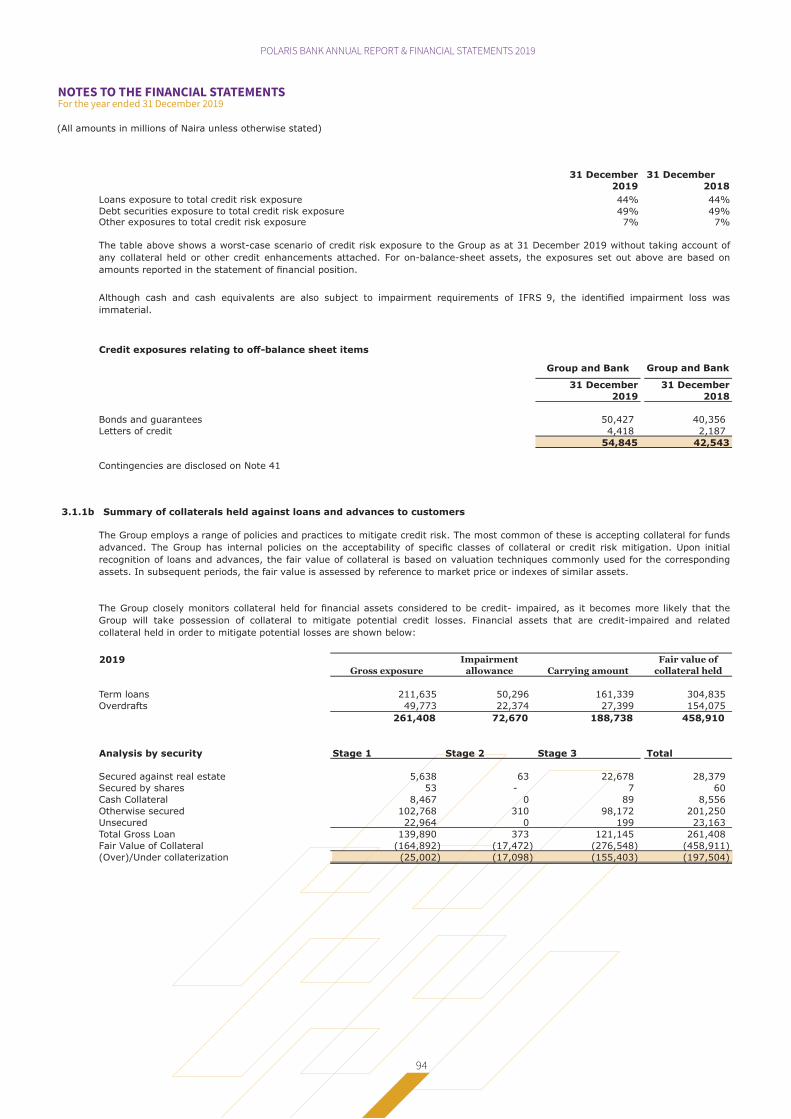
POLARIS BANK ANNUAL REPORT & FINANCIAL STATEMENTS 2019
94
NOTES TO THE FINANCIAL STATEMENTSFor the year ended 31 December 2019
(All amounts in millions of Naira unless otherwise stated)
31 December 31 December
2019 2018
Loans exposure to total credit risk exposure 44% 44%
49% 49%Other exposures to total credit risk exposure 7% 7%
Credit exposures relating to off-balance sheet items
Group and Bank Group and Bank
31 December 31 December
2019 2018
Bonds and guarantees 50,427 40,356
Letters of credit 4,418 2,187
54,845 42,543
Contingencies are disclosed on Note 41
3.1.1b Summary of collaterals held against loans and advances to customers
2019Gross exposure
Impairment allowance Carrying amount
Fair value of collateral held
Term loans 211,635 50,296 161,339 304,835
Overdrafts 49,773 22,374 27,399 154,075
261,408 72,670 188,738 458,910
Analysis by security Stage 1 Stage 2 Stage 3 Total
Secured against real estate 5,638 63 22,678 28,379
Secured by shares 53 - 7 60
Cash Collateral 8,467 0 89 8,556
Otherwise secured 102,768 310 98,172 201,250
Unsecured 22,964 0 199 23,163
Total Gross Loan 139,890 373 121,145 261,408
Fair Value of Collateral (164,892) (17,472) (276,548) (458,911)
(Over)/Under collaterization (25,002) (17,098) (155,403) (197,504)
The Group employs a range of policies and practices to mitigate credit risk. The most common of these is accepting collateral for funds
advanced. The Group has internal policies on the acceptability of specific classes of collateral or credit risk mitigation. Upon initial
recognition of loans and advances, the fair value of collateral is based on valuation techniques commonly used for the corresponding
assets. In subsequent periods, the fair value is assessed by reference to market price or indexes of similar assets.
The Group closely monitors collateral held for financial assets considered to be credit- impaired, as it becomes more likely that the
Group will take possession of collateral to mitigate potential credit losses. Financial assets that are credit-impaired and related
collateral held in order to mitigate potential losses are shown below:
The table above shows a worst-case scenario of credit risk exposure to the Group as at 31 December 2019 without taking account of
any collateral held or other credit enhancements attached. For on-balance-sheet assets, the exposures set out above are based on
amounts reported in the statement of financial position.
Although cash and cash equivalents are also subject to impairment requirements of IFRS 9, the identified impairment loss was
immaterial.
Debt securities exposure to total credit risk exposure

POLARIS BANK ANNUAL REPORT & FINANCIAL STATEMENTS 2019
95
NOTES TO THE FINANCIAL STATEMENTSFor the year ended 31 December 2019
(All amounts in millions of Naira unless otherwise stated)
2018 Gross exposure Impairment allowance
Carrying amount Fair value of collateral held
Term loans 243,860 69,599 174,261 345,607
Overdrafts 290,703 124,914 165,789 496,515
534,563 194,513 340,050 842,122
Analysis by security Stage 1 Stage 2 Stage 3 Total
Secured against real estate 3,078 121 27,634 30,833
Secured by shares 31 - 8 39
Cash Collateral 6,469 43 5 6,517
Otherwise secured 73,888 5,897 120,936 200,721
Unsecured 92,358 47 204,048 296,453
Total Gross Loan 175,824 6,108 352,631 534,563
Fair Value of Collateral (317,367) (58,739) (466,017) (842,123)
(Over)/Under collaterization (141,543) (52,631) (113,386) (307,560)
3.1.2 Credit quality of financial assets using external ratings
Group Bank
31 December 31 December
2019 2019
Sovereign ratings
- Nigeria (B+) S&P 3,396 3,396
3,396 3,396
Group Bank
31 December 31 December
2018 2018
Sovereign ratings
- Nigeria (B+) S&P 6,013 6,013
6,013 6,013
Group Bank
31 December 31 December
2019 2019
Counterparties with external credit rating (S&P)
- A+ 426 426
- A 14,790 14,790
- BBB+ 45,269 45,269
- BBB 1,085 1,085
- BB+ 5,009 5,009
- BB 68 68
- B 312 312
- Default 138 138
67,097 67,097
The credit quality of financial assets with reference to external ratings has been shown below. This information is provided for balances
due from banks and financial institutions and debt investment securities.
The credit quality of balances due from banks and other financial institutions are assessed by reference to external credit ratings
information about counterparty default rates.
Balances with Central Bank
The credit quality of balances with the Central Bank are assessed by reference to external credit ratings information aboutcounterparty default rates.
Due from other banks and other financial institutions

POLARIS BANK ANNUAL REPORT & FINANCIAL STATEMENTS 2019
96
NOTES TO THE FINANCIAL STATEMENTSFor the year ended 31 December 2019
(All amounts in millions of Naira unless otherwise stated)
Group Bank
31 December 31 December
2018 2018
Counterparties with external credit rating (S&P)
- A+ 32,779 32,779
- A 39,404 39,404
- A- 3,285 3,285
- BBB+ 763 763
- B+ 518 518
- BB- 52 52
- B 368 368
77,169 77,169
Financial assets held at fair value through profit or loss
Group Bank
31 December 31 December
2019 2019
Sovereign ratings
- Nigeria (B+) S&P 1,264 1,264
1,264 1,264
Group Bank
31 December 31 December
2018 2018
Sovereign ratings
- Nigeria (B+) S&P 57 57
57 57
Investment securities - Debt
Group Bank
31 December 31 December
2019 2019
Sovereign ratings
- Nigeria (B+) S&P 517,071 517,071
517,071 517,071
Group Bank
31 December 31 December
2018 2018
Sovereign ratings
- Nigeria (B+) S&P 531,805 531,805
531,805 531,805
The credit quality of debt investment securities (amortized cost investments) are assessed by reference to external credit ratings
information about counterparty default rates.

POLARIS BANK ANNUAL REPORT & FINANCIAL STATEMENTS 2019
97
NOTES TO THE FINANCIAL STATEMENTSFor the year ended 31 December 2019
(All amounts in millions of Naira unless otherwise stated)
Assets pledged as collateral
Group Bank
31 December 31 December
2019 2019
Sovereign ratings
- Nigeria (B+) S&P 41,674 41,674
-Other Sovereign Ratings
AA 410 410
42,084 42,084
Group Bank
31 December 31 December
2018 2018
Sovereign ratings
- Nigeria (B+) S&P 50,449 50,449
-Other Sovereign Ratings
AA 323 323
BBB 7,531 7,531
58,303 58,303
Other Assets
Group Bank
31 December 31 December
2019 2019
- Unrated 50,704 50,704
50,704 50,704
Group Bank
31 December 31 December
2018 2018
- Unrated 60,676 60,676
60,676 60,676
Other loans and receivables
Group Bank
31 December 31 December
2019 2019
Sovereign ratings
- Nigeria (B+) S&P 182,594 182,594
182,594 182,594
3.1.3 Credit Risk concentration
Concentration risk refers to the risk arising from an uneven distribution of counterparties within a credit portfolio or from concentration
in sectors, geographical locations etc. which poses a potential threat to the solvency of the counterparty.
The Group recognizes that concentration risk may exist among loans, which though may have been prudently underwritten, are
collectively sensitive to the same economic and financial or business development events, such that a negative development affecting
these factors may cause loans to perform as if it were a single, large exposure.
The Group complies with regulatory portfolio concentration limits as determined by the CBN. The Group sets internal
thresholds, which are more conservative than the regulatory limits and this acts as a buffer to ensure compliance. In addition to
regulatory limits, the Group uses risk-based measurement systems to define a variety of concentration thresholds for its credit
portfolio. These include; sectors, geographical locations, strategic business units etc.
The Group employs its management information system in monitoring these limits and remedial actions are set in motion at
determined thresholds other tools employed in measuring risk concentrations include, HHI index and GINI coefficient.
Concentration of credit risk arise from financial instruments that have similar characteristics and are affected similarly by changes in
economic or other conditions. This information has been provided along geographical areas and economic sectors.

(All a
mounts
in m
illions o
f N
air
a u
nle
ss o
therw
ise s
tate
d)
3.
Fin
an
cia
l R
isk M
an
ag
em
en
t con
tin
ued
3.1
.3i
Con
cen
trati
on
of
risks o
f fi
nan
cia
l assets
wit
h c
red
it r
isk e
xp
osu
re
31
Decem
ber
20
19
Cre
dit
Ris
k c
on
cen
trati
on
by g
eog
rap
hy r
ela
tin
g t
o o
n-b
ala
nce s
heet
Cash a
nd b
ala
nces w
ith c
entr
al banks
3,3
96
-3,3
96
3,3
96
-3,3
96
Due f
rom
banks a
nd o
ther
financia
l in
stitu
tions
18,9
39
43,1
37
62,0
76
18,9
39
43,1
37
62,0
76
Fin
ancia
l assets
held
at
fair v
alu
e t
hro
ugh p
rofit
or
loss
68,9
66
-68,9
66
1,2
64
-1,2
64
Loans a
nd a
dvances t
o c
usto
mers
: -
Term
loans
211,6
35
-211,6
35
211,6
35
-211,6
35
- O
verd
raft
49,7
73
-49,7
73
49,7
73
-49,7
73
Investm
ent
securities
- A
mort
ized C
ost
Investm
ents
517,0
71
-517,0
71
517,0
71
-517,0
71
- F
air v
alu
e t
hro
ugh O
CI
Investm
ents
17,3
62
-17,3
62
17,3
62
-17,3
62
Asset
ple
dged a
s c
ollate
ral -
debt
securities
42,0
84
-42,0
84
42,0
84
-42,0
84
Oth
er
loans a
nd r
eceiv
able
s182,5
94
-182,5
94
182,5
94
-182,5
94
Oth
er
assets
46,5
13
-46,5
13
45,9
56
557
46,5
13
1,1
58,3
33
4
3,1
37
1,2
01,4
70
1,0
90,0
74
4
3,6
94
1,1
33,7
68
Cre
dit
Ris
k c
on
cen
trati
on
by g
eog
rap
hy r
ela
tin
g t
o o
ff-b
ala
nce s
heet
Bonds a
nd g
uara
nte
es
50,4
27
-50,4
27
50,4
27
- 5
0,4
27
Lett
ers
of
cre
dit
4,4
18
-4,4
18
4,4
18
- 4,4
18
5
4,8
45
-
5
4,8
45
5
4,8
45
-
5
4,8
45
The f
ollow
ing t
able
bre
aks d
ow
n t
he G
roup’s
cre
dit e
xposure
(w
ithout
takin
g into
account
any c
ollate
ral held
or
oth
er
cre
dit s
upport
), a
s c
ate
gorised b
y g
eogra
phic
al re
gio
n a
s a
t th
e r
eport
ing
date
. For
this
table
, th
e G
roup h
as a
llocate
d e
xposure
s t
o r
egio
ns b
ased o
n t
he c
ountr
y o
f dom
icile o
f its c
ounte
rpart
ies.
Gro
up
Ban
kW
ith
in N
igeri
aO
uts
ide
Nig
eri
aTota
l
Wit
hin
Nig
eri
aO
uts
ide
Nig
eri
aTota
l
NO
TE
S T
O T
HE
FIN
AN
CIA
L S
TA
TE
ME
NT
SFo
r th
e ye
ar
end
ed 3
1 D
ece
mb
er 2
019
PO
LAR
IS B
AN
K A
NN
UA
L R
EP
OR
T &
FIN
AN
CIA
L ST
ATE
ME
NTS
201
9
98

NO
TE
S T
O T
HE
FIN
AN
CIA
L S
TA
TE
ME
NT
SFo
r th
e ye
ar
end
ed 3
1 D
ece
mb
er 2
019
PO
LAR
IS B
AN
K A
NN
UA
L R
EP
OR
T &
FIN
AN
CIA
L ST
ATE
ME
NTS
201
9
99
(All a
mounts
in m
illions o
f N
air
a u
nle
ss o
therw
ise s
tate
d)
31
Decem
ber
20
18
Cre
dit
Ris
k c
on
cen
trati
on
by g
eog
rap
hy r
ela
tin
g t
o o
n-b
ala
nce s
heet
Cash a
nd b
ala
nces w
ith c
entr
al banks
6,0
13
-6,0
13
6,0
13
-6,0
13
Due f
rom
banks a
nd o
ther
financia
l in
stitu
tions
21,6
21
47,3
45
68,9
66
21,6
21
47,3
45
68,9
66
Fin
ancia
l assets
held
at
fair v
alu
e t
hro
ugh p
rofit
or
loss
57
-57
57
-57
Loans a
nd a
dvances t
o c
usto
mers
: -
Term
loans
243,8
60
-243,8
60
243,8
60
-243,8
60
- O
verd
raft
290,7
03
-290,7
03
290,7
03
-290,7
03
Investm
ent
securities
- A
mort
ized C
ost
Investm
ents
531,8
05
-531,8
05
531,8
05
-531,8
05
- F
air v
alu
e t
hro
ugh O
CI
Investm
ents
14,6
34
14,6
34
14,6
34
-14,6
34
Asset
ple
dged a
s c
ollate
ral -
debt
securities
58,3
03
-58,3
03
58,3
03
-58,3
03
Oth
er
assets
52,0
79
52,0
79
52,8
64
-52,8
64
1,2
19,0
75
47,3
45
1,2
66,4
20
1,2
19,8
60
47,3
45
1,2
67,2
05
Cre
dit
Ris
k c
on
cen
trati
on
by g
eog
rap
hy r
ela
tin
g t
o o
ff-b
ala
nce s
heet
Bonds a
nd g
uara
nte
es
40,3
56
10,0
71
50,4
27
40,3
56
-
4
0,3
56
Lett
ers
of
cre
dit
2,1
87
2,2
31
4,4
18
2,1
87
-
2,1
87
42,5
43
12,3
02
54,8
45
42,5
43
-
4
2,5
43
Wit
hin
Nig
eri
aO
uts
ide
Nig
eri
aTota
l
Gro
up
Ban
kW
ith
in N
igeri
aO
uts
ide
Nig
eri
aTota
l

NO
TE
S T
O T
HE
FIN
AN
CIA
L S
TA
TE
ME
NT
SFo
r th
e ye
ar
end
ed 3
1 D
ece
mb
er 2
019
PO
LAR
IS B
AN
K A
NN
UA
L R
EP
OR
T &
FIN
AN
CIA
L ST
ATE
ME
NTS
201
9
100
(All a
mounts
in m
illions o
f N
air
a u
nle
ss o
therw
ise s
tate
d)
3.1
.3ii.
In
du
str
y s
ecto
rs
Cre
dit
Ris
k c
on
cen
trati
on
s b
y in
du
str
y r
ela
tin
g t
o o
n-b
ala
nce s
heet
item
s
Gro
up
an
d B
an
k
31
Decem
ber
20
19
Secto
rG
enera
l Com
merc
e-
-
-
7
,944
517,0
71
-
-
-
525,0
15
Manufa
ctu
ring
-
-
-
2
1,9
61
-
-
-
-
2
1,9
61
Oil &
Gas
-
-
-
4
1,6
07
-
-
-
-
4
1,6
07
Reta
il-
-
-
20,2
53
-
-
-
-
2
0,2
53
Serv
ices
-
6
2,0
76
-
96,9
73
-
14,4
74
-
8,8
15
182,3
38
Public S
ecto
r
3,3
96
-
68,9
66
-
-
29,9
00
182,5
94
3
7,6
97
322,5
53
To
tal
3,3
96
6
2,0
76
6
8,9
66
188,7
38
517,0
71
4
4,3
74
182,5
94
4
6,5
12
1
,113,7
27
Cre
dit
Ris
k c
on
cen
trati
on
s b
y in
du
str
y r
ela
tin
g t
o o
ff-b
ala
nce s
heet
item
s
Gro
up
an
d B
an
k
31
Decem
ber
20
19
Genera
l C
om
merc
e13,7
07
76
13,7
83
13,7
07
-
13,7
07
Manufa
ctu
ring
18,0
67
4,3
27
22,3
94
18,0
67
4,3
47
22,4
14
Oil &
Gas
3,0
37
-
3,0
37
3,0
37
-
3,0
37
Reta
il-
-
-
-
-
-
Serv
ices
15,6
15
15
15,6
30
15,6
15
72
15,6
87
Tota
l
5
0,4
26
4,4
18
5
4,8
44
5
0,4
26
4,4
19
5
4,8
45
The f
ollow
ing t
able
bre
aks d
ow
n t
he G
roup’s
cre
dit e
xposure
at
gro
ss a
mounts
(w
ithout
takin
g into
account
any c
ollate
ral held
or
oth
er
cre
dit s
upport
), a
s c
ate
gori
sed b
y t
he B
ank's
defined industr
y s
ecto
r.
Gro
up
Bala
nces h
eld
wit
h C
en
tral
Ban
k
Du
e f
rom
ban
ks
an
d o
ther
fin
an
cia
l
insti
tuti
on
s
Fin
an
cia
l assets
measu
red
thro
ug
h F
VT
PL
Lo
an
s a
nd
Ad
van
ces t
o
cu
sto
mers
Fin
an
cia
l assets
measu
red
at
am
ort
ized
co
st
Asset
ple
dg
ed
as c
ollate
ral -
deb
t secu
riti
es
Oth
er
assets
To
tal
Oth
er
loan
s a
nd
receiv
ab
les
Ban
kB
on
ds a
nd
gu
ara
nte
es
Lett
ers
of
cre
dit
Tota
lB
on
ds a
nd
gu
ara
nte
es
Lett
ers
of
cre
dit
Tota
l

NO
TE
S T
O T
HE
FIN
AN
CIA
L S
TA
TE
ME
NT
SFo
r th
e ye
ar
end
ed 3
1 D
ece
mb
er 2
019
PO
LAR
IS B
AN
K A
NN
UA
L R
EP
OR
T &
FIN
AN
CIA
L ST
ATE
ME
NTS
201
9
101
(All a
mounts
in m
illions o
f N
air
a u
nle
ss o
therw
ise s
tate
d)
Cre
dit
Ris
k c
on
cen
trati
on
s b
y in
du
str
y r
ela
tin
g t
o o
n-b
ala
nce s
heet
item
s
Gro
up
an
d B
an
k
31
Decem
ber
20
18
Secto
rG
enera
l Com
merc
e-
--
1
0,2
65
239
- -
1
0,5
04
Manufa
ctu
ring
--
- 3
1,5
07
--
-
3
1,5
07
Oil &
Gas
--
- 365,9
00
--
-
365,9
00
Reta
il-
--
6
,478
--
-
6
,478
Serv
ices
- 6
8,9
66
- 120,0
82
-7,5
31
52,0
79
248,6
58
Public S
ecto
r 6
,013
- 57
-531,5
66
50,7
72
-
588,4
08
--
--
--
--
To
tal
6
,013
6
8,9
66
57
534,2
32
531,8
05
5
8,3
03
5
2,0
79
1
,251,4
55
Cre
dit
Ris
k c
on
cen
trati
on
s b
y in
du
str
y r
ela
tin
g t
o o
ff-b
ala
nce s
heet
item
s
Gro
up
an
d B
an
k
31
Decem
ber
20
18
Genera
l C
om
merc
e2,7
27
1,8
57
4,5
84
2,7
27
1,8
57
4,5
84
Manufa
ctu
ring
16,6
24
172
16,7
96
16,6
24
172
16,7
96
Oil &
Gas
14,2
92
-14,2
92
14,2
92
-14,2
92
Reta
il-
--
--
-
Serv
ices
6,7
13
159
6,8
72
6,7
13
159
6,8
72
Tota
l 4
0,3
56
2
,18
8
4
2,5
44
4
0,3
56
2
,18
8
4
2,5
44
Bala
nces h
eld
wit
h C
en
tral
Ban
k
Du
e f
rom
ban
ks
an
d o
ther
fin
an
cia
l
insti
tuti
on
s
Lo
an
s a
nd
Ad
van
ces t
o
cu
sto
mers
Fin
an
cia
l assets
measu
red
at
am
ort
ized
co
st
Asset
ple
dg
ed
as c
ollate
ral -
deb
t secu
riti
es
Oth
er
assets
To
tal
Bon
ds a
nd
gu
ara
nte
es
Lett
ers
of
cre
dit
Tota
lB
on
ds a
nd
gu
ara
nte
es
Lett
ers
of
cre
dit
Tota
l
Gro
up
Ban
k
Fin
an
cia
l assets
measu
red
thro
ug
h F
VT
PL

NO
TE
S T
O T
HE
FIN
AN
CIA
L S
TA
TE
ME
NT
SFo
r th
e ye
ar
end
ed 3
1 D
ece
mb
er 2
019
PO
LAR
IS B
AN
K A
NN
UA
L R
EP
OR
T &
FIN
AN
CIA
L ST
ATE
ME
NTS
201
9
102
(All a
mounts
in m
illions o
f N
air
a u
nle
ss o
therw
ise s
tate
d)
3.1
.3.i
iiC
red
it R
isk c
on
cen
trati
on
by g
eog
rap
hy o
f lo
an
s a
nd
ad
van
ces t
o c
usto
mers
by p
rod
ucts
31
Decem
ber
20
19
Term
loans
161,3
39
-
161,3
39
161,3
39
-
161,3
39
Overd
raft
s27,3
99
-
27,3
99
27,3
99
-
27,3
99
188,7
38
-
188,7
38
188,7
38
-
188,7
38
Cate
gori
zati
on
of
Lo
an
s a
nd
Ad
van
ces
The t
able
belo
w a
naly
ses t
he G
roup's
Loans a
nd a
dvances b
ased o
n t
he c
ate
gorization b
y P
erf
orm
ance o
f th
e L
oans a
nd t
he a
llow
ances t
aken o
n t
hem
31
Decem
ber
20
19
Term
loan
Sta
ge 1
127,5
71
2,7
31
127,5
71
2,7
31
Sta
ge 2
241
11
241
11
Sta
ge 3
83,8
23
47,5
54
83,8
23
47,5
54
21
1,6
35
50
,29
62
11
,63
55
0,2
96
Overd
raft
Sta
ge 1
13,3
42
442
13,3
42
442
Sta
ge 2
128
29
128
29
Sta
ge 3
36,3
03
21,9
03
36,3
03
21,9
03
49
,77
32
2,3
74
49
,77
32
2,3
74
26
1,4
08
72
,67
02
61
,40
87
2,6
70
Gro
up
Ban
k
Gro
up
Ban
kW
ith
in N
igeri
aO
uts
ide
Nig
eri
aTota
lW
ith
in N
igeri
aO
uts
ide
Nig
eri
aTota
l
EX
PO
SU
RE
EC
LE
XP
OS
UR
EE
CL

NO
TE
S T
O T
HE
FIN
AN
CIA
L S
TA
TE
ME
NT
SFo
r th
e ye
ar
end
ed 3
1 D
ece
mb
er 2
019
PO
LAR
IS B
AN
K A
NN
UA
L R
EP
OR
T &
FIN
AN
CIA
L ST
ATE
ME
NTS
201
9
103
(All a
mounts
in m
illions o
f N
air
a u
nle
ss o
therw
ise s
tate
d)
31
Decem
ber
20
18
Term
loans
243,8
60
-
243,8
60
243,8
60
-
243,8
60
Overd
raft
s290,7
03
-
290,7
03
290,7
03
-
290,7
03
534,5
63
-
534,5
63
534,5
63
-
534,5
63
Cate
gori
zati
on
of
Lo
an
s a
nd
Ad
van
ces
The t
able
belo
w a
naly
ses t
he G
roup's
Loans a
nd A
dvances b
ased o
n t
he c
ate
gorization b
y P
erf
orm
ance o
f th
e L
oans a
nd t
he a
llow
ances t
aken o
n t
hem
31
Decem
ber
20
18
Term
loan
Sta
ge 1
163,7
93
14,7
30
163,7
93
14,7
30
Sta
ge 2
5,7
09
2,8
17
5,7
09
2,8
17
Sta
ge 3
59,6
92
44,7
57
59,6
92
44,7
57
22
9,1
94
62
,30
42
29
,19
46
2,3
04
Overd
raft
Sta
ge 1
12,1
39
790
12,1
39
790
Sta
ge 2
399
157
399
157
Sta
ge 3
292,8
31
131,2
62
292,8
31
131,2
62
30
5,3
69
13
2,2
09
30
5,3
69
13
2,2
09
53
4,5
63
19
4,5
13
53
4,5
63
19
4,5
13
3.1
.3iv
.D
isclo
su
res o
f vari
ou
s f
acto
rs t
hat
imp
act
the E
CL a
s a
t 3
1 D
ecem
ber
20
19
These facto
rs r
evolv
es a
round:
i iiApplication o
f vary
ing h
air
cut
to u
nderl
yin
g c
ollate
ral and furt
her
dis
counting w
ith t
heir
respective E
IR
iii
The v
ari
ous a
ssum
ptions u
nder
the d
iffere
nt
scenari
os a
re a
s p
resente
d b
elo
w
Scen
ari
oP
eri
od
1P
eri
od
2P
eri
od
3P
eri
od
4G
DP g
row
th r
ate
(%
)U
ptu
rn2.4
%3.0
2%
3.9
8%
4.0
5%
Base
2.3
%2.5
5%
3.3
0%
3.2
0%
Dow
ntu
rn1.1
%2.1
0%
2.6
0%
2.3
5%
Base
Up
sid
eD
ow
nsid
e
50%
25%
25%
Gro
up
Gro
up
Ban
kW
ith
in N
igeri
aO
uts
ide
Nig
eri
aTota
lW
ith
in N
igeri
aO
uts
ide
Nig
eri
aTota
l
EX
PO
SU
RE
EC
LE
XP
OS
UR
EE
CL
Ban
k
Application o
f vary
ing forw
ard
lookin
g info
rmation in r
ela
tion t
o u
nderl
yin
g m
acro
econom
ic a
ssum
ptions a
nd t
he d
egre
e o
f re
sponsiv
eness o
f th
e O
bligors
to t
he a
ssum
ptions a
t diff
ere
nt
degre
e o
f N
orm
al,
Dow
ntu
rn a
nd u
ptu
rn s
cenari
os.
The k
ey d
rivers
for
cre
dit r
isk for
the B
ank is t
he G
DP g
row
th r
ate
.
Pre
dic
ted r
ela
tionship
s b
etw
een t
he k
ey indic
ato
rs a
nd d
efa
ult a
nd loss r
ate
s o
n v
ari
ous p
ort
folios o
f financia
l assets
have b
een d
evelo
ped b
ased o
n a
naly
sin
g h
isto
rical data
over
4 y
ears
.
The w
eig
htings a
ssig
ned t
o e
ach e
conom
ic s
cenari
o d
uri
ng t
he p
eri
od w
ere
as follow
s;
Dis
counting o
f th
e e
xpecte
d futu
re c
ashflow
s fro
m indiv
idual O
bligors
with r
espective e
ffective inte
rest
rate
(EIR
) on t
he s
et
futu
re d
ate
s t
o p
resent
valu
e.

POLARIS BANK ANNUAL REPORT & FINANCIAL STATEMENTS 2019
104
NOTES TO THE FINANCIAL STATEMENTSFor the year ended 31 December 2019
(All amounts in millions of Naira unless otherwise stated)
3.1.4
Loans and advances to customers
a
Impairment
on stage 1-
12 months
ECL
Impairment
on stage 2-
Lifetime ECL
Not Credit
Impaired
Impairment
on stage 3 -
Lifetime ECL
Credit
Impaired
Total
Gross carrying amount as at 1 January 2019 175,825 6,107 352,631 534,563 Transfer from Stage 1 to Stage 2 (7,791) 7,791 - -
Transfer from Stage 1 to Stage 3 (3,654) - 3,654 -
Write-offs - - (726) (726)
FX and other movements (23,467) (13,529) (235,433) (272,429)
Total Gross 140,913 369 120,126 261,408
Loss Allowance as at 1 January 2019 15,519 2,975 176,019 194,513 Write-offs - - (726) (726)
Net movement (12,347) (2,934) (105,836) (121,117)
` 3,172 41 69,457 72,670
Impairment
on stage 1-
12 months
ECL
Impairment
on stage 2-
Lifetime ECL
Not Credit
Impaired
Impairment
on stage 3 -
Lifetime ECL
Credit
Impaired
Total
Gross carrying amount as at 21 September 2018 205,063 3,914 733,605 942,582 Transfer from Stage 1 to Stage 2 (2,193) 2,193 - (0)
Transfer from Stage 1 to Stage 3 (27,045) - 27,045 0
Write-offs - - (435,155) (435,155)
FX and other movements - - 27,136 27,136
Total Gross 175,825 6,107 352,631 534,563
Loss Allowance as at 21 September 2018 8,015 238 594,593 602,846 Write-offs - - (435,155) (435,155)
Net movement 7,504 2,737 16,581 26,822
Total Allowance 15,519 2,975 176,019 194,513
Group & BankReconciliation of Gross loans and advances

POLARIS BANK ANNUAL REPORT & FINANCIAL STATEMENTS 2019
105
NOTES TO THE FINANCIAL STATEMENTSFor the year ended 31 December 2019
(All amounts in millions of Naira unless otherwise stated)
b Investment Securities
Impairment
on stage 1-
12 months
ECL
Impairment
on stage 2-
Lifetime ECL
Not Credit
Impaired
Impairment
on stage 3 -
Lifetime ECL
Credit
Impaired
Total
Gross carrying amount as at 1 January 2019 531,805 - 531,805
New financial assets originated or purchased (12,743) - (12,743)
Total Gross Amortised cost Investments 519,062 - - 519,062
Loss Allowance as at 1 January 2019 1,949 1,949
Charge for the year 41 41
1,990 - - 1,990
Assets pledged as collaterals
Gross carrying amount as at 1 January 2019 58,303 - 58,303
Financial assets that have been derecognised (16,219) (16,219)
Total Gross 42,084 - - 42,084
Loss Allowance as at 1 January 2019 41 - - 41
Impairment write-back (41) - - (41)
- - - -
Impairment
on stage 1-
12 months
ECL
Impairment
on stage 2-
Lifetime ECL
Not Credit
Impaired
Impairment
on stage 3 -
Lifetime ECL
Credit
Impaired
Total
Gross carrying amount as at 21 September 2018 925,572 - - 925,572
New financial assets originated or purchased (393,767) - - (393,767)
Total Gross Amortised cost Investments 531,805 - - 531,805
Loss Allowance as at 21 September 2018 1,575 - - 1,575
Financials assets that have been de-recognised during the period 374 - - 374
1,949 - - 1,949
Assets pledged as collaterals
Gross carrying amount as at 21 September 2018 58,544 - - 58,544
Financial assets that have been derecognised (241) (241)
Total Gross 58,303 - - 58,303
Loss Allowance as at 21 September 2018 24 - - 24
New financial assets originated or purchased 17 - - 17
41 - - 41
The loss allowance recognised in the period is impacted by a variety of factors, as described below:
• Transfers between Stage 1 and Stages 2 or 3 due to financial instruments experiencing significant increases (or decreases) of
credit risk or becoming credit-impaired in the period, and the consequent 'step up' between 12-month and Lifetime ECL;
• Impact on the measurement of ECL due to changes in PDs, EADs and LGDs in the period, arising from regular refreshing of inputs
to models;
• Financial assets derecognised during the period and write-offs of allowances related to assets that were written off during the
period.
Group & Bank
Reconciliation of Investment securities- Amortised Costs &
Assets pledged as collaterals
Reconciliation of Investment securities- Amortised Costs &
Assets pledged as collaterals

POLARIS BANK ANNUAL REPORT & FINANCIAL STATEMENTS 2019
106
NOTES TO THE FINANCIAL STATEMENTSFor the year ended 31 December 2019
(All amounts in millions of Naira unless otherwise stated)
3.1.5 Sensitivity analysis
a Sensitivity of expected credit loss - probability at default (PD)
31 December 31 December
2019 2018
Pre tax Pre tax
Increase 5,704 755
Decrease (6,149) (761)
(445) (6)
b Sensitivity of expected credit loss - loss given default (LGD)
31 December 31 December
2019 2018
Pre tax Pre tax
Increase 538 9,724
Decrease (538) (9,724)
- -c Sensitivity of expected credit loss- GDP Growth rate
31 December 31 December
2019 2018
Pre tax Pre tax
Increase (4) 82
Decrease 4 (82)
- -
Group & Bank
The most significant assumptions affecting the ECL allowance are the following; probability of default, loss given default and macro-
economic variables. Therefore changes to these key variables would directly impact the exposure at default as at reporting date.
The Group in assessing the sensitivity of the Group's profit to fluctuation in GDP growth rate, assumed a 0.5% change in the GDP
growth rate. The chosen change in this macro-economic variable was then applied to the bank's loan portfolio as at the end of year.
The determination of the Group's macro-economic variable is explained in the financial risk management- credit risk measurement
section.
Group & Bank
The Group carried out the following activities in assessing the sensitivity of the Group’s profit to fluctuations in the probability of
default.
The determination of the Group's probability of default (PD) is explained in the financial risk management - credit risk measurement
section.
As at 31 December 2019, if the probability of default increased or decreased by 0.5%, with all other variables (exposure at default
and loss given default) held constant, the impact on impairment charge, which ultimately affects loss before tax and exposure at
default, would have been as set out in the tables below:
The Group in assessing the sensitivity of the Group’s profit to fluctuations in the loss given default, assumed a 0.5% change in the
loss given default. The chosen change in the loss given default was then applied to the bank's loan portfolio as at end of the year.
The determination of the group's loss given default (LGD) is explained in the financial risk management - credit risk measurement
section.
As at 31 December 2019, if the loss given default increased or decreased by five percept, with all other variables (exposure at
default, probability of default) held constant, the impact on impairment charge, which ultimately affects loss before tax and
exposure at default, would have been as set out in the tables below:
Group & Bank

NO
TE
S T
O T
HE
FIN
AN
CIA
L S
TA
TE
ME
NT
SFo
r th
e ye
ar
end
ed 3
1 D
ece
mb
er 2
019
PO
LAR
IS B
AN
K A
NN
UA
L R
EP
OR
T &
FIN
AN
CIA
L ST
ATE
ME
NTS
201
9
107
(All a
mounts
in m
illions o
f N
aira u
nle
ss o
therw
ise s
tate
d)
3.
Fin
an
cia
l R
isk M
an
ag
em
en
t co
nti
nu
ed
3.1
.6D
eb
t secu
riti
es
The t
able
belo
w s
how
s a
naly
sis
of
the G
ross d
ebt
securities into
the d
iffere
nt
cla
ssifi
cations:
31
Decem
ber
20
19
Fin
an
cia
l assets
held
at
fair
valu
e
thro
ug
h p
rofi
t o
r
loss
Fin
an
cia
l
assets
held
at
Am
ort
ised
co
st
Assets
ple
dg
ed
as c
ollate
ral
To
tal
Fin
an
cia
l
assets
held
at
fair
valu
e
thro
ug
h p
rofi
t
or
loss
Fin
an
cia
l
assets
held
at
Am
ort
ised
co
st
Assets
ple
dg
ed
as c
ollate
ral
To
tal
Federa
l govern
ment
bonds
-
56,9
84
14,0
64
71,0
48
-
56,9
84
14,0
64
71,0
48
Sta
te g
overn
ment
bonds
-
9
,114
410
9
,524
-
9
,114
410
9,5
24
Corp
ora
te b
onds
-
1
,674
-
1
,674
-
1
,674
-
1,6
74
Tre
asury
bills
1
,264
449,3
66
27,6
10
478,2
40
1
,264
449,3
66
27,6
10
478,2
40
Euro
bond
-
1
,923
-
1
,923
-
1
,923
-
1,9
23
1
,26
4
5
19
,06
1
4
2,0
84
5
62
,40
9
1
,26
4
5
19
,06
1
4
2,0
84
5
62
,40
9
Gro
up
Ban
k
The G
roup a
nd B
ank's
investm
ent
in r
isk-f
ree G
overn
ment
securities c
onstitu
tes 9
9%
of
debt
instr
um
ents
port
folio.
Investm
ent
in c
orp
ora
te a
nd e
uro
bonds a
ccounts
for
the o
uts
tandin
g 1
%.
31
Decem
ber
20
18
Fin
an
cia
l assets
held
at
fair
valu
e
thro
ug
h p
rofi
t o
r
loss
Fin
an
cia
l
assets
held
at
Am
ort
ised
co
st
Assets
ple
dg
ed
as c
ollate
ral
To
tal
Fin
an
cia
l
assets
held
at
fair
valu
e
thro
ug
h p
rofi
t
or
loss
Fin
an
cia
l
assets
held
at
Am
ort
ised
co
st
Assets
ple
dg
ed
as c
ollate
ral
To
tal
Federa
l govern
ment
bonds
-
34,7
62
25,9
92
60,7
54
-
34,7
62
25,9
92
60,7
54
Sta
te g
overn
ment
bonds
-
16,4
26
323
16,7
49
-
16,4
26
323.0
0 16,7
49
Corp
ora
te b
onds
-
1
,814
-
1
,814
-
1
,814
- 1,8
14
Tre
asury
bills
57
480,7
52
24,4
57
505,2
66
57
480,7
52
24,4
57
505,2
66
Euro
bond
-
-
7
,531
7
,531
-
-
7,5
31
7,5
31
5
7
5
33
,75
4
5
8,3
03
5
92
,11
4
5
7
5
33
,75
4
5
8,3
03
5
92
,11
4
Gro
up
Ban
k

POLARIS BANK ANNUAL REPORT & FINANCIAL STATEMENTS 2019
108
NOTES TO THE FINANCIAL STATEMENTSFor the year ended 31 December 2019
(All amounts in millions of Naira unless otherwise stated)
3.2 Liquidity Risk
Liquidity Risk management process
31 December 31 December
2019 2018
At 31 December % %
Average for the year 82 58
Maximum for the year 89 77
Minimum for the year 79 17
Polaris Bank contingency funding plan
In ensuring adequate liquidity at all times, the Group maintains sizeable portfolio of highly marketable securities (mostly
government papers) that can be easily liquidated as protection against any unforeseen interruption to cash flow and
funding obligations. The liquid assets held for managing liquidity risk comprise of:
• Cash and balances with the Central Bank;
• Government Bonds and Treasury Bills
• Highly liquid instruments in the Group’s trading portfolio.
The Group’s liquidity related behaviour is strictly guided by the Board approved liquidity management policy. The policy
defines specific limit that will ensure adequate liquidity position at all times. Maturity re-pricing schedules, projected
liquidity position as well as stress tested liquidity outlook are generated weekly by the Liquidity Risk team for ALCO’s
decision making.
Funding sources are reviewed regularly by the Liquidity Risk Management team to ensure adequate funding diversification
by currency, geography, provider, product and term to maturity. Contingency funding arrangements are also in place as
way-out strategies in the unlikely condition of bank specific liquidity stress / local or global systemic liquidity shocks.
Liquidity risk is the risk that the Group does not have sufficient resources to meet its obligations when they fall due or will
have to meet such obligations at an excessive cost. This may be as a result of high cash outflows such as huge customer
withdrawals, cash requirements from contractual commitments, debt maturities that would deplete available cash
resources for client lending, trading activities and investments. Liquidity risks are categorized into funding liquidity risk –
inability to meet financial obligation as they fall due and market liquidity risk – inability to liquidate financial asset at a fair
market price.
The measure of the Group’s liquidity is the ratio of its liquid assets to total customer deposits. Liquidity management is
operated in a centralized governance control process that covers the entire Group’s liquidity risk management activities.
This is an oversight responsibility of the Asset and Liability Committee (ALCO), discharged through the Market and Liquidity
Risk management function. The Market and Liquidity Risk team monitors the inherent risk and threats to the bank's
immediate and future liquidity conditions, engaging stress testing under normal and severe market scenario as a tool. On
the other hand, Treasury Group ensure adequate funding over with sizeable buffer over regulatory minimum on a
continuous and sustainable basis. The market risk team, which ensures compliance to the board-approved liquidity
management policy, is independent of the funding function.
Details of the reported Bank ratio of net liquid assets to deposits from customers at the reporting date and during the year
were as follows:
Polaris Bank Contingency Funding Plan (CFP) serves as a way-out strategy under stress liquidity situations. The plan
consists of a set of policies and procedures that shall serve as blue print for the Bank to meet its funding needs in a timely
manner under adverse stress conditions. For effectiveness, this plan shall represent estimate of balance sheet changes that
may result from a liquidity, credit and/or market events.
The MD/CEO or the ALCO Chairman are the only persons authorized to activate the CFP. Execution of the Plan involves
funding and non-funding activities.
In the event of a liquidity squeeze, the Bank possesses a Crisis Management Committee that is comprised of heads of
departments of critical departments and is headed by the MD/CEO.

POLARIS BANK ANNUAL REPORT & FINANCIAL STATEMENTS 2019
109
NOTES TO THE FINANCIAL STATEMENTSFor the year ended 31 December 2019
(All amounts in millions of Naira unless otherwise stated)
3.2 Liquidity Risk
3.2.1 Liquidity Risk Measurement
• Cash and balances with the Central Bank;
• Government Bonds and Treasury Bills
• Highly liquid instruments in the Group’s trading portfolio
• Short term liabilities include local currency deposits from customers.
Assets & Liability Mix 31 December 31 December
2019 2018
Asset components % Proportion % Proportion % Proportion
Cash 4% 26,484 5% 28,026
Cash reserve 6% 37,698 6% 37,446
Treasury bills 77% 450,630 80% 480,809
FGN bonds & other certificates 10% 56,984 6% 34,762
Placements 3% 17,000 3% 19,700
Total 100 588,796 100 600,743
Liability components % Proportion % Proportion % Proportion
Current deposits 31% 265,045 32% 279,819
Savings deposits 20% 167,679 18% 154,536
Term deposits 34% 294,457 35% 303,913
Domiciliary deposits 15% 130,704 15% 122,776
Total 100 857,885 100 861,044
The measure of the Group’s liquidity is the ratio of its liquid assets to total customer deposits.
The liquid assets held for managing liquidity risk comprise:
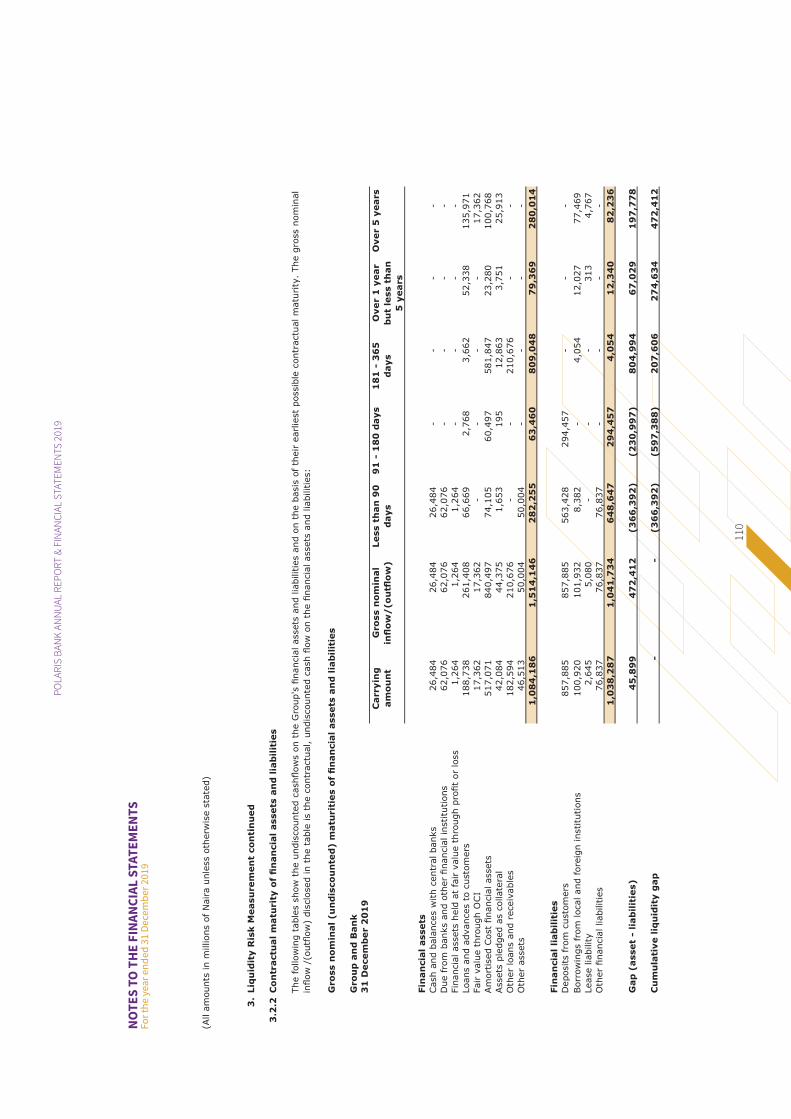
NO
TE
S T
O T
HE
FIN
AN
CIA
L S
TA
TE
ME
NT
SFo
r th
e ye
ar
end
ed 3
1 D
ece
mb
er 2
019
PO
LAR
IS B
AN
K A
NN
UA
L R
EP
OR
T &
FIN
AN
CIA
L ST
ATE
ME
NTS
201
9
110
(All a
mounts
in m
illions o
f N
aira u
nle
ss o
therw
ise s
tate
d)
3.
Liq
uid
ity R
isk M
easu
rem
en
t co
nti
nu
ed
3.2
.2C
on
tractu
al
matu
rity
of
fin
an
cia
l assets
an
d l
iab
ilit
ies
Gro
ss n
om
inal
(u
nd
isco
un
ted
) m
atu
riti
es o
f fi
nan
cia
l assets
an
d l
iab
ilit
ies
Gro
up
an
d B
an
k
31
Decem
ber
20
19
Carr
yin
g
am
ou
nt
Gro
ss n
om
inal
infl
ow
/(o
utfl
ow
)
Less t
han
90
days
91
- 1
80
days
18
1 -
36
5
days
Over
1 y
ear
bu
t le
ss t
han
5 y
ears
Over
5 y
ears
Fin
an
cia
l assets
Cash a
nd b
ala
nces w
ith c
entr
al banks
26,4
84
26,4
84
26,4
84
--
--
Due fro
m b
anks a
nd o
ther
financia
l in
stitu
tions
62,0
76
62,0
76
62,0
76
--
--
Fin
ancia
l assets
held
at
fair v
alu
e t
hro
ugh p
rofit
or
loss
1,2
64
1,2
64
1,2
64
--
--
Loans a
nd a
dvances t
o c
usto
mers
188,7
38
261,4
08
66,6
69
2,7
68
3,6
62
52,3
38
135,9
71
Fair v
alu
e t
hro
ugh O
CI
17,3
62
17,3
62
--
--
17,3
62
Am
ort
ised C
ost
financia
l assets
517,0
71
840,4
97
74,1
05
60,4
97
581,8
47
23,2
80
100,7
68
Assets
ple
dged a
s c
ollate
ral
42,0
84
44,3
75
1,6
53
195
12,8
63
3,7
51
25,9
13
Oth
er
loans a
nd r
eceiv
able
s182,5
94
210,6
76
--
210,6
76
--
Oth
er
assets
46,5
13
50,0
04
50,0
04
--
--
1,0
84
,18
6
1,5
14
,14
6
2
82
,25
5
6
3,4
60
80
9,0
48
7
9,3
69
28
0,0
14
Fin
an
cia
l li
ab
ilit
ies
Deposits fro
m c
usto
mers
857,8
85
857,8
85
563,4
28
294,4
57
--
-
Borr
ow
ings fro
m local and fore
ign institu
tions
100,9
20
101,9
32
8,3
82
-4,0
54
12,0
27
77,4
69
Lease lia
bility
2,6
45
5,0
80
--
-313
4,7
67
Oth
er
financia
l liabilitie
s
76,8
37
76,8
37
76,8
37
--
--
1,0
38
,28
7
1,0
41
,73
4
6
48
,64
7
29
4,4
57
4,0
54
1
2,3
40
8
2,2
36
Gap
(asset
- li
ab
ilit
ies)
45
,89
9
4
72
,41
2
(3
66
,39
2)
(2
30
,99
7)
8
04
,99
4
67
,02
9
1
97
,77
8
Cu
mu
lati
ve l
iqu
idit
y g
ap
-
-
(
36
6,3
92
)
(5
97
,38
8)
2
07
,60
6
2
74
,63
4
4
72
,41
2
The follow
ing t
able
s s
how
the u
ndis
counte
d c
ashflow
s o
n t
he G
roup's
financia
l assets
and lia
bilitie
s a
nd o
n t
he b
asis
of th
eir e
arlie
st
possib
le c
ontr
actu
al m
atu
rity
. The g
ross n
om
inal
inflow
/(o
utfl
ow
) dis
clo
sed in t
he t
able
is t
he c
ontr
actu
al, u
ndis
counte
d c
ash fl
ow
on t
he fi
nancia
l assets
and lia
bilitie
s:

NO
TE
S T
O T
HE
FIN
AN
CIA
L S
TA
TE
ME
NT
SFo
r th
e ye
ar
end
ed 3
1 D
ece
mb
er 2
019
PO
LAR
IS B
AN
K A
NN
UA
L R
EP
OR
T &
FIN
AN
CIA
L ST
ATE
ME
NTS
201
9
111
(All a
mounts
in m
illions o
f N
aira u
nle
ss o
therw
ise s
tate
d)
3.2
.2C
on
tractu
al
matu
rity
of
fin
an
cia
l assets
an
d lia
bil
itie
s (
Co
nti
nu
ed
)
Gro
up
an
d B
an
k
31
Decem
ber
20
18
Carr
yin
g
am
ou
nt
Gro
ss n
om
inal
infl
ow
/(o
utfl
ow
)
Less t
han
90
days
91
- 1
80
days
18
1 -
36
5
days
Over
1 y
ear
bu
t le
ss t
han
5 y
ears
Over
5 y
ears
Fin
an
cia
l assets
Cash a
nd b
ala
nces w
ith c
entr
al banks
28,0
26
28,0
26
28,0
26
--
--
Due fro
m b
anks a
nd o
ther
financia
l in
stitu
tions
68,9
66
68,9
66
68,9
66
--
--
Fin
ancia
l assets
held
at
fair v
alu
e t
hro
ugh p
rofit
or
loss
57
57
57
--
--
Loans a
nd a
dvances t
o c
usto
mers
340,0
50
757,7
67
114,0
29
5,1
67
40,2
21
59,4
29
538,9
21
Fair v
alu
e t
hro
ugh O
CI
14,6
34
14,6
34
--
--
14,6
34
Am
ort
ised C
ost
financia
l assets
531,8
05
639,9
79
97,1
50
1,7
68
438,8
79
15,0
40
87,1
42
Assets
ple
dged a
s c
ollate
ral
58,3
03
98,0
24
3,6
51
430
28,4
15
8,2
86
57,2
42
Oth
er
assets
52,0
79
52,0
79
52,0
79
1,0
93
,92
0
1
,65
9,5
32
3
63
,95
8
7
,36
5
5
07
,51
5
8
2,7
55
6
97
,93
9
Fin
an
cia
l liab
ilit
ies
Due t
o o
ther
financia
l in
stitu
tions
25
25
25
--
--
Deposits fro
m c
usto
mers
861,0
44
861,1
94
845,1
61
7,0
19
9,0
14
--
Borr
ow
ings fro
m local and fore
ign institu
tions
137,6
94
135,7
26
200
3,6
43
39,3
94
11,6
95
80,7
94
Oth
er
financia
l liabilitie
s
73,6
96
73,6
96
73,6
96
1,0
72
,45
9
1
,07
0,6
41
9
19
,08
2
1
0,6
62
4
8,4
08
1
1,6
95
8
0,7
94
Gap
(asset
- liab
ilit
ies)
2
1,4
61
5
88
,89
1
(5
55
,12
4)
(3
,29
7)
4
59
,10
7
7
1,0
60
6
17
,14
6
Cu
mu
lati
ve l
iqu
idit
y g
ap
-
-
(5
55
,12
4)
(5
58
,42
1)
(
99
,31
4)
(2
8,2
54
)
5
88
,89
2

NO
TE
S T
O T
HE
FIN
AN
CIA
L S
TA
TE
ME
NT
SFo
r th
e ye
ar
end
ed 3
1 D
ece
mb
er 2
019
PO
LAR
IS B
AN
K A
NN
UA
L R
EP
OR
T &
FIN
AN
CIA
L ST
ATE
ME
NTS
201
9
112
(All a
mounts
in m
illions o
f N
aira u
nle
ss o
therw
ise s
tate
d)
3.2
.3R
ep
ricin
g p
eri
od
of
fin
an
cia
l assets
an
d l
iab
ilit
ies
Gro
up
an
d B
an
k
31
Decem
ber
20
19
Carr
yin
g
am
ou
nt
To
tal
Less t
han
90
days
91
- 1
80
days
18
1 -
36
5
days
Over
1 y
ear
bu
t le
ss t
han
5 y
ears
Over
5 y
ears
Fin
an
cia
l assets
Cash a
nd b
ala
nces w
ith c
entr
al banks
26,4
84
26,4
84
26,4
84
-
-
-
-
Due fro
m b
anks a
nd o
ther
financia
l in
stitu
tions
62,0
76
62,0
76
62,0
76
-
-
-
-
Fin
ancia
l assets
held
at
fair v
alu
e t
hro
ugh p
rofit
or
loss
1,2
64
1,2
64
1,2
64
-
-
-
-
Loans a
nd a
dvances t
o c
usto
mers
188,7
38
261,4
08
66,6
69
2,7
68
3,6
62
52,3
38
135,9
71
Fair v
alu
e t
hro
ugh O
CI
17,3
62
17,3
62
-
-
-
-
17,3
62
Am
ort
ised C
ost
Investm
ents
517,0
71
840,4
97
74,1
05
60,4
97
581,8
47
23,2
80
100,7
68
Assets
ple
dged a
s c
ollate
ral
42,0
84
44,3
75
1,6
53
195
12,8
63
3,7
51
25,9
13
Oth
er
loans a
nd r
eceiv
able
s182,5
94
210,6
76
--
210,6
76
--
Oth
er
assets
46,5
13
50,0
04
50,0
04
-
-
-
-
1,0
84
,18
6
1,5
14
,14
6
2
82
,25
5
6
3,4
60
80
9,0
48
7
9,3
69
28
0,0
14
Fin
an
cia
l li
ab
ilit
ies
Due t
o o
ther
financia
l in
stitu
tions
--
--
--
-
Deposits fro
m c
usto
mers
857,8
85
857,8
85
311,5
78
9,2
46
7,6
04
529,4
57
-
Borr
ow
ings fro
m local and fore
ign institu
tions
100,9
20
101,9
32
8,3
82
-4,0
54
12,0
27
77,4
69
Lease lia
bility
2,6
44
5,0
80
-
-
-
313
4,7
67
Oth
er
financia
l liabilitie
s
76,8
37
76,8
37
76,8
37
-
-
-
-
1,0
38
,28
6
1,0
41
,73
4
3
96
,79
7
9,2
46
1
1,6
58
54
1,7
97
8
2,2
36
45
,90
0
4
72
,41
2
(1
14
,54
2)
5
4,2
14
79
7,3
90
(4
62
,42
8)
1
97
,77
8
\
The t
able
belo
w indic
ate
s t
he e
arlie
st
tim
e t
he G
roup c
an v
ary
the t
erm
s o
f th
e u
nderlyin
g fi
nancia
l asset
or
liabilitie
s a
nd a
naly
ze t
he G
roup’s
inte
rest
rate
ris
k e
xposure
on a
ssets
and lia
bilitie
s w
hic
h a
re inclu
ded a
t carr
yin
g a
mount
and c
ate
gorised b
y t
he e
arlie
r of contr
actu
al re
–pricin
g o
r m
atu
rity
date
s.

NO
TE
S T
O T
HE
FIN
AN
CIA
L S
TA
TE
ME
NT
SFo
r th
e ye
ar
end
ed 3
1 D
ece
mb
er 2
019
PO
LAR
IS B
AN
K A
NN
UA
L R
EP
OR
T &
FIN
AN
CIA
L ST
ATE
ME
NTS
201
9
113
(All a
mounts
in m
illions o
f N
aira u
nle
ss o
therw
ise s
tate
d)
3.2
.3R
ep
ricin
g p
eri
od
of
fin
an
cia
l assets
an
d l
iab
ilit
ies (
Co
nti
nu
ed
)
Gro
up
an
d B
an
k
31
Decem
ber
20
18
Carr
yin
g
am
ou
nt
To
tal
Less t
han
90
days
91
- 1
80
days
18
1 -
36
5
days
Over
1 y
ear
bu
t le
ss t
han
5 y
ears
Over
5 y
ears
Fin
an
cia
l assets
Cash a
nd b
ala
nces w
ith c
entr
al banks
28,0
26
28,0
26
28,0
26
-
-
-
-
Due fro
m b
anks a
nd o
ther
financia
l in
stitu
tions
68,9
66
68,9
66
68,9
66
-
-
-
-
Fin
ancia
l assets
held
at
fair v
alu
e t
hro
ugh p
rofit
or
loss
57
57
57
-
-
-
-
Loans a
nd a
dvances t
o c
usto
mers
340,0
50
340,0
50
63,0
61
7,6
66
28,7
49
98,8
02
141,7
72
Fair v
alu
e t
hro
ugh O
CI
14,6
34
14,6
34
-
-
-
-
14,6
34
Am
ort
ised C
ost
Investm
ents
531,8
05
531,8
05
94,3
68
100,0
95
296,2
97
5,6
13
35,4
31
Assets
ple
dged a
s c
ollate
ral
58,2
62
58,2
62
2,2
99
23,7
65
5,9
72
26,2
26
Oth
er
assets
52,0
79
52,0
79
52,0
79
-
-
-
-
1,0
93
,87
9
1,0
93
,87
9
3
08
,85
6
10
7,7
61
34
8,8
12
11
0,3
87
21
8,0
64
Fin
an
cia
l li
ab
ilit
ies
Due t
o o
ther
financia
l in
stitu
tions
25
25
25
-
-
-
-
Deposits fro
m c
usto
mers
861,0
44
861,0
44
845,1
61
7,0
19
8,8
64
00
Borr
ow
ings fro
m local and fore
ign institu
tions
137,6
94
137,6
94
200
3,6
43
39,3
94
13,6
63.0
580,7
94
Oth
er
financia
l liabilitie
s
97,0
76
66,7
51
66,7
51
-
-
-
-
1,0
95
,83
9
1,0
65
,51
4
9
12
,13
7
1
0,6
62
4
8,2
58
1
3,6
63
8
0,7
94
(1
,96
0)
28
,36
5
(6
03
,28
1)
9
7,0
99
30
0,5
53
9
6,7
23
13
7,2
70

POLARIS BANK ANNUAL REPORT & FINANCIAL STATEMENTS 2019
114
NOTES TO THE FINANCIAL STATEMENTSFor the year ended 31 December 2019
(All amounts in millions of Naira unless otherwise stated)
3.3 Market Risk
Market Risk Management Framework Overview
The Group’s market risk management framework clearly articulates underlining principles that drives the design and
implementation of its market risk exposure management process, which seeks to contain such exposures within its market risk
appetite.
The Bank has developed encompassing processes for effective identification, assessment, monitoring and control of market risks
inherent in its business which is supported by enabling technology, policies/methodologies and tools. Market risk exposure
assessment is a periodic activity guided by Board approved policies and risk limits within which all exposures are contained. The
guiding policies and limits are reviewed periodically to ensure continuous relevance to the fast changing conditions of the
increasingly dynamic market place.
Market risk is the risk of loss in on or off balance sheet positions, as a result of adverse movement in foreign exchange rate,
interest rate, equity or commodity prices. Polaris Bank’s market risk exposures are largely interest and exchange rate induced,
while equity and commodity prices exposures are non-proprietary. Its Market Risk management is a centralized, independent
middle office function responsible for the day to day management which entails risk identification, measurement, monitoring
controlling and reporting.
The Bank has developed encompassing processes for effective identification, assessment, monitoring and control of market risks
inherent in the Bank’s business operations. Its risk management framework is supported by enabling policies/methodologies and
tools to facilitate linkages and to achieve its risk management objectives including market risk related ones.
The market risk management strategy clearly articulates underlining principles that drives the design and implementation of its
exposure management processes, which seek to contain such exposures within a set Board appetite, guided by operational policies.
The independent Market and Liquidity risk function reports daily to the Chief Risk Officer, weekly to Asset-Liability Committee and
quarterly to both the Management and the Board Risk Committees.
Market Risk Measurement:
Adequate risk assessment is critical for effective management. The Bank applies the Value at Risk (VaR) model to measure trading
market risk exposure of the entire trading portfolio. The VaR model runs largely on the variance co-variance method of
computation but is also complemented by historical simulation as well as Expected Shortfall methodologies where key assumption
of the former method prove unsatisfactory. The model (variance co-variance), stated at 99% confidence level over a day horizon,
applies the Exponential Weighted Moving Average (EWMA) model for volatility assessment thereby enhancing the speed of
response to changes in market factors.
Value at risk assessment is undertaken at the portfolio level, which takes cognizance of the risk-reduction benefit of asset returns
correlation. All the model outputs are back tested for accuracy, reliability and predictive power assessment. In addition, periodic
stress tests are also conducted to estimate potential losses in severe market conditions by stressing risk drivers within and
sometimes beyond historically observed levels.
The integrity of the VAR model is validated via back-testing model over a reasonable period (minimum of 250 days). Although a
valuable guide to risk, VAR is always viewed in the context of its limitations i.e.
• The use of historical data as a proxy for estimating future events may not be reflective of the growing complexities and changes
in the interactions of market drivers.
• The holding period assumption may also be flawed particularly in times of market illiquidity when it takes much longer to liquidate
positions
• The likely size of losses under the permissible 1% violation is not stated, which might exceed the Bank’s loss threshold
In adjusting for these limitations, the Bank has, in addition to stress testing, adopted the expected shortfall model, to gain a
statistical sense of the likely size of the extreme loss events. VaR is also assessed at 99% confidence interval and a 10-day holding
period as additional stress factor.

NO
TE
S T
O T
HE
FIN
AN
CIA
L S
TA
TE
ME
NT
SFo
r th
e ye
ar
end
ed 3
1 D
ece
mb
er 2
019
PO
LAR
IS B
AN
K A
NN
UA
L R
EP
OR
T &
FIN
AN
CIA
L ST
ATE
ME
NTS
201
9
115
(All a
mounts
in m
illions o
f N
aira u
nle
ss o
therw
ise s
tate
d)
Mark
et
Ris
k M
an
ag
em
en
t Fra
mew
ork
Overv
iew
RIS
K
SO
UR
CE
S
MR
DA
TA
RE
PO
SIT
OR
Y
INT
ER
NA
L A
ND
EX
TE
RN
AL
RE
PO
RT
ING
LIM
IT M
AN
AG
EM
EN
T
EC
ON
OM
IC C
AP
ITA
L C
HA
RG
E
RE
GU
LA
TO
RY
CA
PIT
AL
CH
AR
GE
MA
RK
ET
RIS
K M
AN
AG
EM
EN
T F
RA
ME
WO
RK
PR
OC
ES
SE
SS
TR
UC
TU
RE
CU
LT
UR
ES
TR
AT
EG
Y
RIS
K
IDE
NT
IFIC
AT
ION
RIS
K
CO
NT
RO
L
RIS
K
FIN
AN
CIN
G
RISK APPETITE
INT
ER
NA
L D
AT
A
SO
UR
CE
EX
TE
RN
AL
DA
TA
SO
UR
CE
CO
MP
LIA
NC
E
INT
ER
NA
L A
UD
IT
RIS
K
AS
SE
SS
ME
NT
S
MA
RK
ET
RIS
K D
AT
AR
EF
ER
EN
CE
DA
TA
RIS
K
ME
AS
UR
EM
EN
TP
OR
TF
OL
IO
VA
LU
AT
ION
PE
OP
LE
PR
OC
ES
SE
SS
YS
TE
MS
TR
AD
ING
MA
ND
AT
E
ST
AN
DA
RD
ISE
D/
INT
ER
NA
L B
AS
ED
AP
PR
OA
CH
RISK APPETITE
POLARIS BANK ANNUAL REPORT & FINANCIAL STATEMENTS 2019
116
NOTES TO THE FINANCIAL STATEMENTSFor the year ended 31 December 2019
(All amounts in millions of Naira unless otherwise stated)
3. Financial Risk management continued
3.3 Market Risk3.3.1 Market Risk measurement techniques
Exposure to market risks - trading portfolios
a Exposure to Interest Rate Risk
FGN BOND TRADING:The portfolio consists of eight(8) actively traded instruments with maturities ranging from 2 to 20years. Decline in
price volatile resulted in reduction in risk profile of the portfolio. The Value at risk (VaR), at 99% confidence interval and one day
horizon, as year-end was 1.08% compared that of the preceding year of 7.2%. The maximum VaR recorded was 3.66%, minimum was
0.38% and an average of 1.30%. Relative to other traded instruments, the bond portfolio recorded the lowest risk profile through the
year.
Treasury Bills Trading: Increased volatility at the shorter end of the curve (less than one year) increased the risk profile of the Treasury
Bills portfolio. The portfolio highest VaR (99% confidence interval, 1 day holding period) was 4.40%, lowest at 0.20% and average
1.23% of position size.
Typically, the Bank trades in the following financial instruments:
1. Treasury bills
2. Bonds
3. Foreign currencies
4. Money market products
The principal risk to which the bank's non trading portfolios are exposed to , is the risk of loss from fluctuations in the future cash flows
or fair values of financial instruments because of change in market interest rates. Interest rate risk is managed principally using interest
rate gaps. Below are some of the key variables used in quantifying, monitoring, controlling and reporting market risk exposure (traded
and non traded) across the group:
• Open position assessment: - for trading and currency risk exposures.
• Value at Risk model (VaR) - for trading and currency risk exposures
• Expected shortfall - for trading and currency risk exposures
• Interest and exchange rate sensitivity - For balance sheet level interest and exchange rate exposures assessment
• Stress testing - Both trading and non-trading exposures.
The Group applies a Value at Risk (VAR) methodology to its trading portfolios (including assets and liabilities that are designated at fair
value) to estimate the market risk exposures of open positions.
VAR is a statistically based estimate of the potential loss on the current portfolio from adverse market movements. It expresses the
‘maximum’ amount the Group might lose, at certain level of confidence (often 99%) given a time horizon (usually 1 day). There is
therefore a specified statistical probability (1%) that actual loss may be greater than the VAR estimate. The VAR model assumes a
certain ‘holding period’ until positions can be closed (1 day). The likely estimate of the size of 1% expected violation of the VaR number
is accessed via stress testing. VaR also assumes that market moves occurring over this holding period will follow a similar pattern to
those that have occurred in the past.
Traded Instruments: The instruments the bank's trade in are strictly provided for in the trading policy which include: Federal
Government securities and foreign currencies. The policy also clarifies requirements for trading in new products as well as position and
loss limits at dealers and product levels.
FX Trading Activities: - The Bank currency trading activity is limited to trading Naira/USD currency pair throughout the financial year.
Volatility levels spiked in the year on the back of sustained pressure on the local currency, interventions and continuous changes in the
markets operational policies . Trading activities in USD/NGNcurrency pair recorded the highest VaR figure (99% confidence interval one
day horizon) of 0.85% of the position size, minimum of 0.16% and average of 0.46%.
The integrity of the VAR model is validated via back-testing model over a reasonable period. Although a valuable guide to risk, VAR is
always viewed in the context of its limitations i.e.
• The use of historical data as a proxy for estimating future events may not be reflective of the growing complexities and changes in the
interactions of market drivers.
• The holding period assumption may also be flawed particularly in times of market illiquidity when it takes much longer to liquidate
positions
• The likely size of losses under the permissible 1% violation is not stated, which might exceed the bank’s loss threshold
In adjusting for these limitations, the Group has, in addition to stress testing, adopted the expected shortfall model, to gain a statistical
sense of the likely size of the extreme loss events. VaR is also assessed at 99% confidence interval and a 10-day holding period as
additional stress factor.

POLARIS BANK ANNUAL REPORT & FINANCIAL STATEMENTS 2019
117
NOTES TO THE FINANCIAL STATEMENTSFor the year ended 31 December 2019
(All amounts in millions of Naira unless otherwise stated)
Period ended 31 December 2019
Treasury bills FX
Maximum 8.15% 0.79%
Minimum 0.31% 0.13%
Average 1.36% 0.33%
Exposure to market risks - non-trading portfolios
Group Group Bank Bank
31 December 31
December
31 December 31 December
2019 2018 2019 2018Pre tax Pre tax
Decrease
Assets (2,693) (2,210) (2,693) (2,210)
Liabilities 2,817 2,689 2,817 2,689
124 479 124 479 Increase
Assets 2,693 2,210 2,693 2,210
Liabilities (2,817) (2,689) (2,817) (2,689)
(124) (479) (124) (479)
Components of Balance Sheet Interest Rate sensitivity
Group Group Bank Bank
31 December 31
December
31 December 31 December
2019 2018 2019 2018
Pre tax Pre tax Pre tax Pre tax
Decrease
Financial assets
Due from banks and other financial institutions (168) (172) (168) (172)
Loans and advances to customers (435) (496) (435) (496)
Amortised cost financial assets (2,010) (1,485) (2,010) (1,485)
Assets pledged as collateral (80) (56) (80) (56)
(2,693) (2,209) (2,693) (2,209)Financial liabilities
Deposits from customers 2,817 2,582 2,817 2,582
Borrowings from local and foreign institutions - 108 0 108
2,817 2,690 2,817 2,690
Total 124 481 124 481
Non trading interest rate risk exposures resides on the Group’s balance sheet, resulting from disproportionate impact of interest rate
changes on cash flows arising from asset and liability maturity mismatches leading to volatilities in net interest margin.
VaR ANALYSIS
The table below shows the result of interest rate sensitivity by applying a change of a 100 basis points. The impact on profit or loss is as
follows:
At 31 December 2019, if interest rates had been 100 basis points higher/lower with all other variables held constant, other components
of equity would have been N124 million lower for the Bank. Foreign borrowing has been excluded from the analysis as they are not
considered sensitive to local rate changes.
The aggregated figures presented above are further analysed into their various components as shown in the following tables:
Decisions on interest rate direction is the responsibility of the ALCO, who works with the risk team in the day to day monitoring and
forecasting of market directions, based on macro-economic fundamentals, market dynamics and the monetary/fiscal policy objectives.
Interest rate risk exposure is occasioned by timing differences and optionalities in the maturities of assets and liabilities on the banking
book. Trading book exposures on the other hand is due to proprietary positions in rate and price sensitive financial assets in the
secondary market. These exposures are managed independently by the Market Risk Management function via appropriate policies,
procedures and models aided by technology.

POLARIS BANK ANNUAL REPORT & FINANCIAL STATEMENTS 2019
118
NOTES TO THE FINANCIAL STATEMENTSFor the year ended 31 December 2019
(All amounts in millions of Naira unless otherwise stated)
Group Group Bank Bank
31 December 31
December
31 December 31 December
2019 2018 2019 2018Increase
Financial assets
Due from banks and other financial institutions 168 172 168 172
Loans and advances to customers 435 496 435 496
- Amortised cost financial assets 2,010 1,485 2,010 1,485
Assets pledged as collateral 80 56 80 56
2,693 2,209 2,693 2,209 Financial liabilities
Deposits from customers (2,817) (2,582) (2,817) (2,582)
Borrowings from local and foreign institutions (108) - (108)
Lease liability - - - -
(2,817) (2,690) (2,817) (2,690)
Total (124) (481) (124) (481)
Group Group Bank Bank
31
December
31
December
31
December
31
December
2019 2018 2019 2018
Pre tax Pre tax Pre tax Pre tax
Decrease 10.4 10.3 10.4 10.3
Increase (10.4) (10.3) (10.4) (10.3)
- - - -
b Foreign Exchange Risk
c Price Risk
The Group operates internationally and is exposed to foreign exchange risk arising from various currency exposures primarily with
respect to the US dollar, UK pound and Euro. Foreign exchange risk represents exposures to changes in the values of current holdings
and future cash flows denominated in other currencies. The types of instruments exposed to this risk include investments in foreign
subsidiaries, foreign currency-denominated loans and securities, future cash flows in foreign currencies arising from foreign exchange
transactions, foreign currency denominated debt.
In view of the current devaluation of naira, the Bank also ensures that currency trading limits are in line with market realities, foreign
currency lending and funding is subject to approvals by top management. In this case the bank makes use of limits and management
action triggers for strict adherence to the Bank’s internal policies and risk appetite. Further, management ensures that repricing of the
assets is in line with market realities.
The Group maintains strict policy guidance for all its foreign currency related activities, and Board approval is required where business
exigencies necessitate currency exposure creation, which must still be contained within permissible threshold and adequately mitigated.
The Group ensures that foreign currencies denominated assets are matched with foreign currency denominated liabilities to reduce
currency risk exposure (exchange exposure gap). Periodic reports on the Group’s foreign currency exposure are rendered up to the
Board level. In line with the Basel II provision, both trading and non-trading currency exposures are treated as trading positions, and
are therefore subject to fair valuation relative to prevailing market exchange rate (mark-to-market).
Cash flow interest rate risk: This risk arises from the timing differences of exposure of interest rate sensitive assets and liabilities to
changes in market interest rates. The Group manages the cash flow interest rate risk by matching floating rate assets to floating rate
liabilities as much as feasible, while residual exposures are actively managed via different market instruments including interest rate
swaps where practicable.
At 31 December 2019, if interest rates on borrowed funds at amortised cost increased or reduced by 50 basis points with all other
variables held constant, the effect on profit or loss would have been as set out below:
To manage its price risk arising from investments in equity securities, the Group diversifies its portfolio. Diversification of the portfolio is
done in accordance with the limits set by the group.
The Group’s exposure to equity securities price risk arises from investments held by the Group and classified in the balance sheet either
as at fair value through other comprehensive income (FVOCI)

POLARIS BANK ANNUAL REPORT & FINANCIAL STATEMENTS 2019
119
NOTES TO THE FINANCIAL STATEMENTSFor the year ended 31 December 2019
(All amounts in millions of Naira unless otherwise stated)
Price sensitivity analysis for financial instruments measured at FVOCI:
Group Group Bank Bank
31D ecember 31D ecember 31D ecember 31D ecember
2019 2018 2019 0
Unquoted Equity at FVOCI 17,352 14,634 17,352 14,63417,352 14,634 17,352 14,634
Impact on Other
comprehensive
income:
Unfavourable change @ 2% decrease in unobservable inputs (120) (101) (120) (101)
Favourable change @ 2% increase in unobservable inputs 71 60 71 60
3. Financial Risk Management continued
3.3.2 Sensitivity of foreign exchange currencies and impact on profit and equity
Group Group Bank Bank
31 December 31 December 31 December 31 December
2019 2018 2019 2018
Pre tax Pre tax
Dollar
Naira strengthens 1,846 2,666 1,846 2,666
Naira weakens (1,846) (2,666) (1,846) (2,666)
Pounds
Naira strengthens (79) (80) (79) (5)
Naira weakens 79 80 79 5
Euro
Naira strengthens (89) (10) (89) (31)
Naira weakens 89 10 89 31
The Group carried out the following in determining sensitivity of the Group's profit to fluctuations in exchange rate of foreign
currencies:
- Daily foreign exchange rates were obtained and trended
- A reasonably possible change of +/-N10 was determined based on the distribution of one year daily change in exchange rates.
- The chosen reasonable change in exchange rates was then applied to the bank's foreign currency position as at end of the
period.
At 31 December 2019, a change of +/-N10 against the foreign currency with all other variables held constant, the loss for the year
would have increased/(decreased) as set out in the table below mainly as a result of foreign exchange gains or losses on the
translation.
Equity price risk is the risk that the fair value of equities decreases as a result of changes in the level of equity indices and
individual stocks. The non-trading equity price risk exposure arises from equity securities classified as FVOCI. Sensitivity analysis for
the Group's equity securities is shown below.

NO
TE
S T
O T
HE
FIN
AN
CIA
L S
TA
TE
ME
NT
SFo
r th
e ye
ar
end
ed 3
1 D
ece
mb
er 2
019
PO
LAR
IS B
AN
K A
NN
UA
L R
EP
OR
T &
FIN
AN
CIA
L ST
ATE
ME
NTS
201
9
120
(All a
mounts
in m
illions o
f N
air
a u
nle
ss o
therw
ise s
tate
d)
3.
Fin
an
cia
l R
isk M
an
ag
em
en
t co
nti
nu
ed
The t
able
belo
w s
um
marizes t
he G
roup's
financia
l assets
and fi
nancia
l liabilitie
s a
t gro
ss a
mount,
cate
gorised b
y c
urr
ency:
Fin
an
cia
l in
str
um
en
ts b
y c
urr
en
cy
Gro
up
an
d B
an
k
31
Decem
ber
20
19
To
tal
Nair
aU
SD
GB
PEu
roFin
an
cia
l assets
Cash a
nd b
ala
nces w
ith c
entr
al banks
26,4
84
16,3
41
7,1
13
405
2,6
25
Due f
rom
banks a
nd o
ther
financia
l in
stitu
tions
62,0
76
18,9
38
40,5
88
845
1,7
05
Fin
ancia
l assets
at
fair
valu
e t
hro
ugh p
rofit
or
loss
1,2
64
1,2
64
--
-Loans a
nd a
dvances t
o c
usto
mers
188,7
38
150,2
49
38,4
47
-42
Fair
valu
e t
hro
ugh O
CI
investm
ents
29,4
60
29,4
60
--
- -
Am
ort
ised c
ost
investm
ents
514,7
83
514,7
83
--
-Assets
ple
dged a
s c
ollate
ral
44,3
74
43,9
64
410
--
Oth
er
loans a
nd r
eceiv
able
s182,5
94
182,5
94
--
-O
ther
assets
46,5
13
46,5
13
--
-
1,0
96,2
86
1,0
04,1
06
8
6,5
58
1,2
50
4,3
72
Fin
an
cia
l liab
ilit
ies
Due t
o o
ther
financia
l in
stitu
tions
--
--
-D
eposits f
rom
custo
mers
857,8
85
800,0
44
55,2
09
1,9
68
664
Borr
ow
ings f
rom
local and f
ore
ign institu
tions
100,9
20
77,4
77
23,4
43
--
Lease lia
bility
2,6
44
2,6
44
--
-O
ther
liabilitie
s76,8
37
76,8
37
--
-
1,0
38,2
86
9
57,0
02
7
8,6
52
1,9
68
664
Gro
up
an
d B
an
k
31
Decem
ber
20
18
To
tal
Nair
aU
SD
GB
PEu
roFin
an
cia
l assets
Cash a
nd b
ala
nces w
ith c
entr
al banks
28,0
26
26,9
71
896
84
75
Due f
rom
banks a
nd o
ther
financia
l in
stitu
tions
68,9
66
1,8
60
64,4
04
288
2,4
14
Fin
ancia
l assets
at
fair
valu
e t
hro
ugh p
rofit
or
loss
57
57
--
-Loans a
nd a
dvances t
o c
usto
mers
340,0
50
205,0
45
163,1
85
-50
Fair
valu
e t
hro
ugh O
CI
investm
ents
17,3
61
17,3
61
--
- -
Am
ort
ised c
ost
investm
ents
531,8
05
531,8
05
--
-Assets
ple
dged a
s c
ollate
ral
58,3
03
50,7
72
7,5
31
--
Oth
er
assets
52,0
79
52,0
79
--
-
1,0
96,6
47
8
85,9
50
236,0
16
372
2,5
39
Fin
an
cia
l liab
ilit
ies
Due t
o o
ther
financia
l in
stitu
tions
25
25
--
-D
eposits f
rom
custo
mers
861,0
44
801,2
45
57,0
78
2,0
35
686
Borr
ow
ings f
rom
local and f
ore
ign institu
tions
137,6
94
86,6
45
51,0
49
Oth
er
liabilitie
s97,0
76
97,0
76
--
-
1,0
95,8
39
9
84,9
91
108,1
27
2,0
35
686

POLARIS BANK ANNUAL REPORT & FINANCIAL STATEMENTS 2019
121
NOTES TO THE FINANCIAL STATEMENTSFor the year ended 31 December 2019
(All amounts in millions of Naira unless otherwise stated)
4.1 Operational Risk
Insigni�icant Minor Moderate Major Signi�icant
Certainly Medium Medium High High High
Highly Likely Medium Medium Medium High High
Likely Low Low Medium Medium High
Unlikely Low Low Medium Medium Medium
Highly Unlikely
Low Low Low Medium Medium
Polaris Bank defines Operational Riskas the risk of loss resulting from inadequate or failed internal processes, people and systems
or from external events. Reputational risk and strategic risk are, in line with general market convention, excluded from the
definition of operational risk.
Operational Risk exists in the natural course of the Bank’s business activity. It is not an objective to eliminate all exposure to
operational risk as this would be neither commercially viable nor indeed possible. The Bank's approach to managing operational risk
is to adopt fit-for-purpose operational risk practices that assist business line management in understanding their inherent risk and
reducing their risk profiles in line with the Bank's risk tolerance, while maximizing their operational performance and efficiency.
The Bank has set minimum requirements for managing Operational Risk through the Bank’s Risk Management and Governance
standards. These requirements have been fully implemented and embedded across the Bank's operations. In addition to meeting
the Bank minimum standards, the operational risk framework sets out a structured and consistent approach for managing
operational risk across the Bank. The risk management approach involves identifying, assessing, measuring, managing, mitigating,
and monitoring the risks associated with operations, enabling comprehensive analysis and reporting of the Bank's operational risk
profile.
The framework is based on the following core components:
1. Risk Identification and Control Methodology: This facilitates the identification of risks and the management thereof across each
business and operational function.
2. Risk and Control Self-Assessments: Each Strategic Business and Support Unit is required to analyse its business activities and
critical processes to identify the key operational risks to which it is exposed, and assess the adequacy and effectiveness of its
controls. For any area where management concludes that the level of residual risk is beyond an acceptable level, it is required to
define corrective action plans to reduce the level of risk. The assessments are facilitated, monitored and challenged by the
Operational Risk Management Department working hand in hand with Process or Business owners who also double as Risk
Champions to each business.
Risk evaluation involves measuring identified risks based on the probability of a loss event occurring (PE) (that is, likelihood) and
the loss given an event (LGE) (that is, impact) using a 5 X 5 Matrix as shown in the table below:
FrequencySeverity
3. Risk Register
Polaris Bank maintains a Risk Register that contains all the identified risks and controls for the different activities/ processes.
This register is populated with the risks identified from previous risk identification exercises (RCSA) and updated frequently as new
risks are identified. The Risk Register is however subject to regular reviews as indicated by the Operational Risk Management
Department.
4. Key Risk Indicators
Based on the key risks and controls identified above, relevant indicators are used to monitor key business environment and
internal control factors that may influence the Bank's operational risk profile. Each indicator has trigger thresholds to provide early-
warning signals of potential risk exposures and/or a potential breakdown of controls.
5. Operational Risk Incidents
Incident management involves the capturing, reporting and management of loss incidents across the Bank. The definition of
operational risk incidents includes not only events resulting in actual loss, but those resulting in non-financial impacts and near
misses. This process is intended to enable the root cause of individual incidents, or trends of incidents, to be analysed and actions
taken to reduce the exposure or to enhance controls. All Operational Risk incidents relating to the Bank's operations are
consolidated within a central database, which is also integrated with risk and control self-assessments and indicators.
The Management of Operational Risk Incidents also includes an Issues and Action Plan phase whereby Corrective Action Plans
(CAP) are developed based on results of root cause analyses of various incidents; responsibilities are assigned while timelines for
resolutions are also agreed.

POLARIS BANK ANNUAL REPORT & FINANCIAL STATEMENTS 2019
122
NOTES TO THE FINANCIAL STATEMENTSFor the year ended 31 December 2019
(All amounts in millions of Naira unless otherwise stated)
7. Polaris Bank Business Continuity Plan
The Polaris Bank Business Continuity Plan (BCP) contains actions developed to maintain or resume critical operations, including
services to customers, in the event of abnormal/unintended disruption to business. The BCP includes the step by step procedures
for handling major disasters as well as prolonged business interruptions spanning a specified period. This Business Continuity Plan
satisfies the Bank‘s commitment to a practical Enterprise Risk Management approach to support business objectives, and optimize
risk management capabilities by identifying potential threats and impacts and building resilience to ensure the Bank can respond
immediately and effectively to a major incident with minimal disruption to its normal business process.
It also satisfies regulatory requirements from the Central Bank of Nigeria (CBN) which stipulates that Commercial Financial
Institutions must put in place a Business Continuity Plan duly approved by the Management of the Bank within a fixed time frame.
This document is also in line with ISO22301, an international standard that emphasizes the need for a well-defined incident
response structure.
The Bank possesses a Disaster Recovery team headed by the MD/CEO.
Managing Operational Risk
The primary responsibility for managing operational risk forms part of the day-to-day responsibilities of management and
employees at all levels. Business line management is ultimately responsible for owning and managing risks resulting from their
activities. The risks are managed where they arise.
The operational risk management function is independent of business line management and is part of the second line of defense. It
is organized as follows:
• A central function that provides bank wide oversight and reporting. It is also responsible for developing and maintaining the
Operational Risk Management Framework.
• The primary oversight body for operational risk is the Risk Management Committee (RMC), which reports to the Board Risk
Management Committee (BRMC) and ultimately, the Board.
6. Reporting
Operational risk reports are produced on both a regular and on event-driven basis. The reports include a profile of the key risks to
business units' achievement of their business objectives, relevant control issues and operational risk incidents. Specific reports are
prepared on a regular basis for the relevant business unit committees and for the Bank Operational Risk Committee.
5. Operational Risk Incidents
Incident management involves the capturing, reporting and management of loss incidents across the Bank. The definition of
operational risk incidents includes not only events resulting in actual loss, but those resulting in non-financial impacts and near
misses. This process is intended to enable the root cause of individual incidents, or trends of incidents, to be analysed and actions
taken to reduce the exposure or to enhance controls. All Operational Risk incidents relating to the Bank's operations are
consolidated within a central database, which is also integrated with risk and control self-assessments and indicators.
The Management of Operational Risk Incidents also includes an Issues and Action Plan phase whereby Corrective Action Plans
(CAP) are developed based on results of root cause analyses of various incidents; responsibilities are assigned while timelines for
resolutions are also agreed.

POLARIS BANK ANNUAL REPORT & FINANCIAL STATEMENTS 2019
123
NOTES TO THE FINANCIAL STATEMENTSFor the year ended 31 December 2019
(All amounts in millions of Naira unless otherwise stated)
4.2 Capital Management
Capital Risk Management
Group Group Bank Bank
31 31
December
31
December
31
December
2019 2018 2019 2018
Tier 1 capital
Share capital 25,000 25,000 25,000 25,000
Share premium 873,450 873,450 873,450 873,450 Statutory reserves 10,430 857 10,302 729 Retained earnings 3,467 (26,004) 4,395 (26,215)Reorganisation reserve (848,017) (848,017) (848,017) (848,017)Non-Controlling Interest 1,194 1,561 - -
Total 65,524 26,847 65,130 24,947 Add/(less)
Intangible assets (179) (284) (179) (284)
Adjusted Total qualifying Tier 1 capital 65,344 26,563 64,950 24,663
Tier 2 capital
Other Qualifying Capital 3,507 3,895 - - Fair value reserves 2,775 98 2,775 98 Adjusted Total qualifying Tier 2 capital 6,282 3,993 2,775 98
Total regulatory capital 71,626 30,556 67,726 24,762
Total risk-weighted assets 488,268 792,978 489,425 793,469
Capital Ratios
14.67% 3.85% 13.84% 3.12%
13.38% 3.35% 13.27% 3.11%
Capital management is central to the Group’s financial stability and sustainability. The Group endeavours to maintain the appropriate
level of capital that is adequate to support our risk profile, regulatory requirements and business needs.
The Group’s Capital Management philosophy is to optimize its capital structure given the peculiarities of its risk profile, by maintaining
adequate levels of capital to cater for all unexpected losses, beyond meeting regulatory requirements. This philosophy guides the Group's
Internal Capital Adequacy Assessment Process (ICAAP), which sets internal capital targets and defines strategies for achieving those
targets consistent with our risk appetite, business plans and operating environment. As part of this process, we have implemented a
program of enterprise-wide stress testing to evaluate the income and capital (economic and regulatory) impacts of several potential
stress events.
In the Group, capital allocations are approved at the Board level and are monitored daily by the Group’s management.
The Central Bank of Nigeria (CBN) has an oversight function and monitors all banks operating in Nigeria to ensure compliance with
capital adequacy requirements. At every point in time, the Group ensures that it has sufficient capital above the regulatory capital to
hedge against any unanticipated shocks.
The Group’s regulatory capital comprises of two tiers:
• Tier 1 capital: share capital (net of any book values of the treasury shares), statutory reserve, non-controlling interest, retained
earnings, reserves created by appropriations of retained earnings and other disclosed reserves. The book value of goodwill is deducted in
arriving at Tier 1 capital.
• Tier 2 capital: qualifying subordinated debt, unrealized gains arising on the fair valuation of equity instruments held as fair value
through OCI. Investments in capital of other banks and financial institutions are deducted from Tier 1 and Tier 2 capital to arrive at the
regulatory capital.
Capital Adequacy Ratio
The Capital Adequacy Ratiois the quotient of the capital base of the Group and the Group's risk weighted asset base. The Central Bank of
Nigeria prescribed a minimum limit of 10% of total qualifying capital/total risk weighted capital/total risk weighted assets as a measure
of capital adequacy
Total regulatory capital expressed as a
percentage of total risk-weighted assets
The table below summarises the composition of regulatory capital and the ratios of the bank for the years presented below.
Total tier 1 capital expressed as a percentage
of risk-weighted assets

NO
TE
S T
O T
HE
FIN
AN
CIA
L S
TA
TE
ME
NT
SFo
r th
e ye
ar
end
ed 3
1 D
ece
mb
er 2
019
PO
LAR
IS B
AN
K A
NN
UA
L R
EP
OR
T &
FIN
AN
CIA
L ST
ATE
ME
NTS
201
9
124
(All a
mounts
in m
illions o
f N
air
a u
nle
ss o
therw
ise s
tate
d)
5Fair
valu
es o
f fi
nan
cia
l assets
an
d l
iab
ilit
ies
Acco
un
tin
g c
lassifi
cati
on
, m
easu
rem
en
t b
asis
an
d f
air
valu
es
The t
able
s b
elo
w s
ets
out
the G
roup's
cla
ssifi
cation o
f each c
lass o
f financia
l assets
and lia
bilitie
s a
nd t
heir fair v
alu
es.
All fair v
alu
e m
easure
ments
are
recurr
ing.
Gro
up
an
d B
an
k
31
Decem
ber
20
19
Fair
valu
e
thro
ug
h
pro
fit
or
loss
Am
ort
ized
Co
sts
Fair
valu
e
thro
ug
h
OC
I
Oth
er
fin
an
cia
l
liab
ilit
ies a
t
am
ort
ised
co
st
To
tal
carr
yin
g
am
ou
nt
Level
1Level
2Level
3Fair
valu
e
Fin
an
cia
l assets
Cash a
nd b
ala
nces w
ith c
entr
al banks
26,4
84
--
26,4
84
-26,4
84
-
26,4
84
Due fro
m b
anks a
nd o
ther
financia
l in
stitu
tions
62,0
76
--
62,0
76
-62,0
76
-
62,0
76
Fin
ancia
l assets
at
fair v
alu
e t
hro
ugh p
rofit
or
loss
1,2
64
--
-
1
,264
1,2
64
--
1,2
64
Loans a
nd a
dvances t
o c
usto
mers
188,7
38
--
188,7
38
-261,4
08
- 261,4
08
Fair
Valu
e t
hro
ugh O
CI
-
- E
quity investm
ent
measure
d a
t fa
ir v
alu
e17,3
62
-
17,3
62
--
17,3
62
17,3
62
Am
ort
ised C
ost
Investm
ents
-
- T
reasury
bills
447,0
78
--
447,0
78
455,1
02
--
455,1
02
- C
orp
ora
te b
onds
1,6
74
--
1,6
74
--
1,6
74
1,6
74
- S
tate
govern
ment
bonds
9,1
14
--
9,1
14
-10,1
35
-
10,1
35
- F
edera
l govern
ment
bonds
56,9
84
--
56,9
84
57,4
51
--
57,4
51
Assets
ple
dged a
s c
ollate
ral
-
- T
reasury
bills
29,9
00
--
29,9
00
27,8
37
--
27,8
37
- F
edera
l govern
ment
bonds
14,0
64
--
14,0
64
13,6
42
--
13,6
42
- S
tate
govern
ment
bonds
410
--
410
-410
-
410
Oth
er
loans a
nd r
eceiv
able
s182,5
94
--
182,5
94
-182,5
94
--
Oth
er
assets
47,3
54
-
47,3
54
-47,3
54
47,3
54
-
1,2
64
1,0
66,4
70
1
7,3
62
-
1,0
85,0
96
555,2
96
543,1
07
248,9
84
1
,164,7
93
Fin
an
cia
l li
ab
ilit
ies
Due t
o o
ther
financia
l in
stitu
tions
--
--
-
--
-
-
Deposits a
nd o
ther
accounts
--
-857,8
85
857,8
85
--
857,8
85
857,8
85
Borr
ow
ings fro
m local and fore
ign b
anks/I
nstitu
tions
--
-100,9
20
100,9
20
--
100,9
20
100,9
20
Lease lia
bility
2
,644
-
-
2,6
44
-
-
2,6
44
2,6
44
Oth
er
liabilitie
s
--
-97,2
56
97,2
56
--
97,2
56
97,2
56
-
2,6
44
-
1
,056,0
61
1
,058,7
05
-
-
1
,058,7
05
1
,058,7
05
Carr
yin
g a
mo
un
tFair
valu
e

NO
TE
S T
O T
HE
FIN
AN
CIA
L S
TA
TE
ME
NT
SFo
r th
e ye
ar
end
ed 3
1 D
ece
mb
er 2
019
PO
LAR
IS B
AN
K A
NN
UA
L R
EP
OR
T &
FIN
AN
CIA
L ST
ATE
ME
NTS
201
9
125
(All a
mounts
in m
illions o
f N
air
a u
nle
ss o
therw
ise s
tate
d)
Gro
up
an
d B
an
k
31
Decem
ber
20
18
Fair
valu
e
thro
ug
h
pro
fit
or
loss
Am
ort
ized
Co
sts
Fair
valu
e
thro
ug
h
OC
I
Oth
er
fin
an
cia
l
liab
ilit
ies a
t
am
ort
ised
co
st
To
tal
carr
yin
g
am
ou
nt
Level
1Level
2Level
3Fair
valu
e
Fin
an
cia
l assets
Cash a
nd b
ala
nces w
ith c
entr
al banks
-28,0
26
--
28,0
26
-28,0
26
-
28,0
26
Due fro
m b
anks a
nd o
ther
financia
l in
stitu
tions
-68,9
66
--
68,9
66
-68,9
66
-
68,9
66
Fin
ancia
l assets
at
fair v
alu
e t
hro
ugh p
rofit
or
loss
57
--
-
57
57
--
57
Loans a
nd a
dvances t
o c
usto
mers
340,0
50
--
340,0
50
--
340,2
00
340,2
00
Fair
Valu
e t
hro
ugh O
CI
-
-
- E
quity investm
ent
measure
d a
t fa
ir v
alu
e-
-14,6
34
-
14,6
34
--
14,6
34
14,6
34
Am
ort
ised C
ost
Investm
ents
-
-
- T
reasury
bills
-480,7
52
--
480,7
52
474,3
93
--
474,3
93
- C
orp
ora
te b
onds
-1,8
14
--
1,8
14
-1,8
24
1,8
24
- S
tate
govern
ment
bonds
-16,4
26
--
16,4
26
-28,2
62
-
28,2
62
- F
edera
l govern
ment
bonds
-34,7
62
--
34,7
62
29,1
32
--
29,1
32
Assets
ple
dged a
s c
ollate
ral
-
- T
reasury
bills
-24,4
57
--
24,4
57
23,9
98
--
23,9
98
- F
edera
l govern
ment
bonds
-25,9
92
--
25,9
92
29,6
91
--
29,6
91
- S
tate
govern
ment
bonds
-323
--
323
-451
-
451
- E
uro
bonds
-7,5
31
--
7,5
31
-7,0
77
-
7
,077
Oth
er
assets
-52,0
79
--
52,0
79
-52,0
79
52,0
79
-
57
1,0
81,1
78
1
4,6
34
-
1,0
95,8
69
557,2
71
134,6
07
406,9
13
1
,098,7
91
Fin
an
cia
l li
ab
ilit
ies
Due t
o o
ther
financia
l in
stitu
tions
--
-25
25
-25
-
25
Deposits a
nd o
ther
accounts
--
-861,0
44
861,0
44
-861,0
44
861,0
44
Borr
ow
ings fro
m local and fore
ign b
anks/I
nstitu
tions
--
-137,6
94
137,6
94
137,6
94
137,6
94
Lease lia
bility
Oth
er
liabilitie
s
--
-76,8
37
76,8
37
-76,8
37
76,8
37
-
-
- 1
,075,6
00
1
,075,6
00
-
2
5
1
,075,5
75
1
,075,6
00
Carr
yin
g a
mo
un
tFair
valu
e

POLARIS BANK ANNUAL REPORT & FINANCIAL STATEMENTS 2019
126
NOTES TO THE FINANCIAL STATEMENTSFor the year ended 31 December 2019
(All amounts in millions of Naira unless otherwise stated)
5 Fair values of financial assets and liabilities continued
Fair value of financial assets and liabilities carried at fair value
Recognised fair value measurements
There were no transfers between
Fair value of financial assets and liabilities not carried at fair value
i Cash and balances with central banks and due from banks and other financial institutions
ii Investment securities and assets pledged as collateral
iii Loans and advances to customers
The fair value for financial assets and liabilities that are not carried at fair value were determined respectively as follows:
The Group adopts a single approach in fair valuing its risk assets. This entails valuing all facilities with variable and fixed
interest rates using the discounted cash flow approach (Level 3). The Group’s variable rate facilities are indexed to the
Central Bank of Nigeria Monetary Policy Rate or Nigeria Interbank Offering Rate, with a spread to cover for the inherent
risk of individual facilities.
Financial instruments at fair value (including those held at fair value through profit or loss and fair value through OCI)
are either priced with reference to a quoted market price for that instrument or by using a valuation model. Where the
fair value is calculated using a valuation model, the methodology is to calculate the expected cash flows under the terms
of each specific contract and then discount these values back to a present value. The expected cash flows for each
contract are determined either directly by reference to actual cash flows implicit in observable market prices or through
modelling cash flows using appropriate financial markets pricing models. Wherever possible these models use as their
basis observable market prices and rates including, for example, interest rate yield curves, equities and prices.
The carrying amount of cash and balances with central banks and due from banks and other financial institutions are
reasonable approximation of their fair value.
The fair value for investment securities is based on market prices from financial market dealer price quotations. Where
this information is not available, fair value is estimated using quoted market prices for securities with similar credit,
maturity and yield characteristics.
The group's policy is to recognise transfers into and transfers out of fair value hierachy levels as at the end of the
reporting period.
Level 1: The fair value of financial instruments traded in active markets (such as publicly traded equity securities) is based on
quoted market prices at the end of the reporting period. The quoted market price used for financial assets held by the group is the
current market price. These instruments are included in level 1.
Level 2: The fair value of financial instruments that are not traded in an active market is determined using valuation
techniques which maximise the use of observable market data and rely as little as possible on entity-specific estimates.
If all significant inputs required to fair value an instrument are observable, the instrument is included in level 2. In
valuing the bonds classified as level 2, the price of the assets obtained from an over the counter sercurities exchange
was adopted in arriving at the fair value. It was categorised under level 2 of the fair value hierachy because the price
obtained was an indicative price due to the fact that the market for the instrument is not very active. No adjustment was
made to the input price.
Level 3: If one or more of the significant inputs is not based on observable market data, the instrument is included in
level 3.
POLARIS BANK ANNUAL REPORT & FINANCIAL STATEMENTS 2019
127
NOTES TO THE FINANCIAL STATEMENTSFor the year ended 31 December 2019
(All amounts in millions of Naira unless otherwise stated)
iv Other assets
v Deposit from customers
vi Borrowings from local and foreign banks/institutions
vii Other liabilities
The estimated fair value of fixed interest-bearing borrowings not quoted in an active market is based on discounted cash
flows using the contractual interest rates for these debts over their remaining maturity.
The carrying amount of financial assets in other liabilities is a reasonable approximation of fair value.
The bulk of these financial assets have short (less than 3 months) maturities with the carrying amounts of the financial
assets being a reasonable approximation of fair value.
Fair values of customers’ deposits have been determined using discounted cash flow techniques applying the rates on
deposits of similar maturities and terms to discount the contractual cash flows.

POLARIS BANK ANNUAL REPORT & FINANCIAL STATEMENTS 2019
128
NOTES TO THE FINANCIAL STATEMENTSFor the year ended 31 December 2019
(All amounts in millions of Naira unless otherwise stated)
6
a
b
c
d
Management is required to make judgements concerning the cause, timing and amount of impairment. In the identification of impairment
indicators, management considers the impact of changes in current competitive conditions, cost of capital, availability of funding, technological
obsolescence, discontinuance of services and other circumstances that could indicate that impairment exists. The Group applies the impairment
assessment to its separate cash generating units. This requires management to make significant judgements and estimates concerning the
existence of impairment indicators, separate cash generating units, remaining useful lives of assets, projected cash flows and net realisable
values. Management’s judgement is also required when assessing whether a previously recognised impairment loss should be reversed.
Deferred tax assets are recognised for deductible temporary differences, unused tax losses and unused tax credits to the extent that it is probable
that taxable profit will be available against which losses can be utilised. Management judgement is required to determine the amount of deferred
tax assets that can be recognised, based on the likely timing and level of future taxable profits together with future tax planning strategies, the
group assessed the probability of expected future taxable profits based on the expected profit for the next five years. Details of the Group's
recognised and unrecognised deferred tax assets and liabilities are as disclosed in note 33.
Determination of impairment of property, plant and equipment and intangible assets
Depreciation and carrying value of property, plant and equipment
The estimation of the useful lives of assets is based on management’s judgement. Any material adjustment to the estimated useful lives of items
of property and equipment will have an impact on the carrying value of these items.
Significant accounting judgments, estimates and assumptions
Allowances for credit losses
The measurement of the expected credit loss allowance for Debt financial assets measured at amortised cost is an area that requires the use of
complex models and significant assumptions about future economic conditions and credit behaviour (e.g. the likelihood of customers defaulting
and the resulting losses). Explanation of the inputs, assumptions and techniques used in measuring ECL is further detailed in note 2.6.1j.
A number of significant judgements are also required in applying the accounting requirements for measuring ECL, such as:
• Determining criteria for significant increase in credit risk;
• Choosing appropriate models and assumptions for the measurement of ECL;
• Establishing the number and relative weightings of forward-looking scenarios for each type of product/market and the associated ECL; and
• Establishing groups of similar financial assets for the purposes of measuring ECL.
In assessing the need for collective loan loss allowances, management considers factors such as credit quality, portfolio size, concentrations, and
economic factors. In order to estimate the required allowance, assumptions are made to define the way expected credit losses are modelled and
to determine the required input parameters, based on historical experience and current economic conditions. The accuracy of the allowances
depends on how well future cash flows and model assumptions are determined. Please refer to note 3 for sensitivity analysis of the expected
credit loss to changes to the loss given default (LGD) and probability of default (PD).
Deferred tax assets and unrecognised tax losses
The Group’s financial statements and its financial results are influenced by accounting policies, assumptions, estimates and management
judgement, which necessarily have to be made in the course of preparation of the consolidated financial statements. The Group makes estimates
and assumptions that affect the reported amounts of assets and liabilities within the next financial year. All estimates and assumptions required in
conformity with IFRS are best estimates undertaken in accordance with the applicable standard. Estimates and judgements are evaluated on a
continuous basis, and are based on past experience and other factors, including expectations with regard to future events. Accounting policies
and management’s judgements for certain items are especially critical for the Group’s results and financial situation due to their materiality.
The significant judgements made by management in applying the Group's accounting policies and the key sources of estimation uncertainty in
these financial statements, which together are deemed critical to the Group's results and financial position, are as follows:
POLARIS BANK ANNUAL REPORT & FINANCIAL STATEMENTS 2019
129
NOTES TO THE FINANCIAL STATEMENTSFor the year ended 31 December 2019
(All amounts in millions of Naira unless otherwise stated)
e
i
Description
2019 2018Valuation
technique
Unobservable
inputs
Range of
unobservable
inputs
Relationship of
unobservable
inputs to fair
value
Nigeria Interbank
Settlement Systems5,973 5,628
Adjusted fair
value
comparison
approach
Median Price to
earnings (P/E)
ratio of similar
comparable
companies
P/E ratio 25.25x
Illiquidity ratio
19.2%
The higher the
P/E ratio of
similar trading
companies, the
higher the fair
value
Unified Payment
Services Limited7,547 6,912
Adjusted fair
value
comparison
approach
Median Price to
earnings (P/E)
ratio of similar
comparable
companies
P/E ratio 17.06x
Illiquidity ratio
19.2%
The higher the
EV/EBITDA ratio
of similar trading
companies, the
higher the fair
value
AFREXIM Bank 3,431 1,885
Adjusted fair
value
comparison
approach
Median Price to
Net book value
(P/BV) ratio of
similar
comparable
companies
P/BV 1.12X
Illiquidity ratio
19.2%
The higher the
P/E ratio of
similar trading
companies, the
higher the fair
value
FMDQ OTC
Securities Exchange350 199
Adjusted fair
value
comparison
approach
Median Price to
earnings (P/E)
ratio of similar
comparable
companies
P/E ratio 9.43x
Illiquidity ratio
19.2%
The higher the
P/E ratio of
similar trading
companies, the
higher the fair
valueSANEF (Shared
Agent Network
Expansion Facility
50 -
17,351 14,624
The fair value of financial instruments that are not traded in an active market is determined by using valuation techniques. These valuation
techniques maximise the use of observable market data where it is available and rely as little as possible on entity specific estimates. If all
significant inputs required to fair value an instrument are observable, the instrument is included in level 2.
The Group uses widely recognised valuation models for determining the fair value of its financial assets. The fair values of unquoted equity
investments have been generally derived using the adjusted fair value comparison approach. Quoted price per earning or price per book value,
enterprise value to EBITDA ratios of comparable entities in a similar industry were obtained and adjusted for key factors to reflect estimated
ratios of the investment being valued.
Financial instruments in Level 2
Bank
Valuation of financial instruments
Information about fair value measurements using significant unobservable inputs (Level 2)
Adjusting factors used are the Illiquidity Discount which assumes a reduced earning on a private entity in comparison to a publicly quoted entity
and the Haircut adjustment which assumes a reduced earning for an entity located in Nigeria contributed by lower transaction levels in
comparison to an entity in a developed or emerging market. The unobservable inputs used entails Average P/B multiples of comparable
companies and Median of Enterprise value to EBITDA ratio (EV/EBITDA) of similar comparable companies.
The Group’s accounting policy on fair value measurements is discussed under note 2.6. The Group measures fair values using the following
hierarchy of methods.
POLARIS BANK ANNUAL REPORT & FINANCIAL STATEMENTS 2019
130
NOTES TO THE FINANCIAL STATEMENTSFor the year ended 31 December 2019
(All amounts in millions of Naira unless otherwise stated)
Interest income
Group Group Bank Bank
21 September - 21 September -
31 December 31 December 31 December 31 December
2019 2018 2019 20187 Interest income on amortized cost instruments
Loans and advances to customers:
- Term loans 48,125 7,151 48,125 7,151
- Overdraft 3,943 1,929 3,943 1,929
Cash and short term funds 1,513 131 1,513 131
Investment securities 78,069 15,163 78,069 15,163
131,650 24,374 131,650 24,374
8 Interest income on FVTPL instruments
Investment securities 1,961 215 1,961 215
Total 133,611 24,589 133,611 24,589
9 Interest expense
Group Group Bank Bank
21 September - 21 September -
31 December 31 December 31 December 31 December
2019 2018 2019 2018
Savings deposits 4,540 1,077 4,540 1,077
Time deposits 31,654 10,100 31,654 10,100
Interbank takings 230 49 230 49
Borrowed funds 5,085 2,958 5,085 2,958
Current deposits 4,054 1,028 4,054 1,028Leases 251 - 251 -
45,814 15,212 45,814 15,212
10 Fee and commission income
Group Group Bank Bank
21 September - 21 September -
31 December 31 December 31 December 31 December
2019 2018 2019 2018
Current account maintenance charges 1,728 498 1,728 498
Commission on telex transfer 2,061 481 2,061 481
Commission on off-balance sheet transactions 216 41 216 41
Remittances fees 2,795 621 2,795 621
Letters of credit commission and fees 242 138 242 138
Commission on cheque book issued 375 122 375 122
Card related commission 3,521 758 3,521 758
Collection revenue 527 184 527 184
Other fee and commission income 338 74 338 74
11,803 2,917 11,803 2,917 Timing of revenue recognition
At a point in time 9,284 2,257 9,284 2,257
Over the life 2,519 660 2,519 660

POLARIS BANK ANNUAL REPORT & FINANCIAL STATEMENTS 2019
131
NOTES TO THE FINANCIAL STATEMENTSFor the year ended 31 December 2019
(All amounts in millions of Naira unless otherwise stated)
11 Fee and Commission expense
Group Group Bank Bank
21 September - 21 September -
31 December 31 December 31 December 31 December
2019 2018 2019 2018
NEFT/NIBSS transfer charges 164 48 164 48
E banking expense 3,003 680 3,003 680
Other fee and commission expense 100 30 100 30
3,267 758 3,267 758
11.1 Net fee and Commission income 8,536 2,159 8,536 2,159
12 Net trading and Foreign Exchange
IncomeGroup Group Bank Bank
21 September - 21 September -
31 December 31 December 31 December 31 December
2019 2018 2019 2018
Foreign exchange translation gains (unrealised) 450 8,788 450 8,788
Net fair value changes in FVTPL securities
(Treasury bills)
500 32 500 32
950 8,820 950 8,820
13 Other Operating Income
Group Group Bank Bank
21 September - 21 September -
31 December 31 December 31 December 31 December
2019 2018 2019 2018
484 196 484 196
Rental income 180 40 180 40
Recoveries on loans previously written off 3,155 425 3,155 425
Gain on disposal of subsidiary - - 487 -
Gain on disposal of property and equipment 65 191 65 191
Sundry income 113 214 113 214
3,997 1,066 4,484 1,066
14 Impairment loss on loans and other financial assets
Group Group Bank Bank
21 September - 21 September -
31 December 31 December 31 December 31 December
2019 2018 2019 2018
Impairment charge on other assets (Note 25) 1,166 1,387 1,166 1,387
Impairment charge on loans and advances (Note 21) 14,276 4 14,276 4
Impairment charge on Investment securities - 416 - 416
Impairment reversal on contingents (1,316) - (1,316) -
Loss on disposal of equity instruments - 989 - 989
14,126 2,796 14,126 2,796
15 Employee benefit costs
Group Group Bank Bank
21 September - 21 September -
31 December 31 December 31 December 31 December
2019 2018 2019 2018
Wages and salaries 25,223 6,377 25,223 6,377
Defined contribution 452 120 452 120
Other staff cost (note 15.1) 125 66 125 66
Termination expenses 628 43 628 43
26,428 6,606 26,428 6,606
Dividend income on fair value through OCI investments

POLARIS BANK ANNUAL REPORT & FINANCIAL STATEMENTS 2019
132
NOTES TO THE FINANCIAL STATEMENTSFor the year ended 31 December 2019
(All amounts in millions of Naira unless otherwise stated)
15.1 Other staff cost
15.2 Employees and directors
a Employees
The average number of persons employed by the Group during the period was as follows:
Group Group Bank Bank
21 September - 21 September -
31 December 31 December 31 December 31 December
2019 2018 2019 2018Executive directors 3 3 3 3Management 119 126 119 126Non-management 2,390 2,552 2,390 2,552
2,512 2,681 2,512 2,681
Group Group Bank Bank
21 September - 21 September -
31 December 31 December 31 December 31 December
2019 2018 2019 2018
N300,001 - N2,000,000 - - - -N2,000,001 - N2,800,000 216 217 216 217N2,800,001 - N3,500,000 - 0 - 0N3,500,001 - N4,000,000 345 247 345 247N4,000,001 - N5,500,000 787 884 787 884N5,500,001 - N6,500,000 0 0N6,500,000 - N7,800,000 444 515 444 515N7,800,001 - N9,000,000 256 471 256 471N9,000,001 and above 461 344 461 344
2,509 2,678 2,509 2,678
b Directors' emoluments
Group Group Bank Bank
21 September - 21 September -
31 December 31 December 31 December 31 December
2019 2018 2019 2018
Fees and sitting allowances 55 2 55 2
Other directors' expenses and benefits 102 38 102 38
Total directors' related expenses (note 16) 157 40 157 40
Executive compensation 198 50 198 50
355 90 355 90
Chairman 9 1 9 1
Highest paid director 84 21 84 21
Other staff cost represent benefits accruing to employees with respect to loans granted at below market interest rate
The number of employees of the Group, other than directors, who received emoluments in the following ranges (excluding pension
contributions and certain benefits) were:
Remuneration paid to the Directors was:
Fees and other emoluments disclosed above include amounts paid to:

POLARIS BANK ANNUAL REPORT & FINANCIAL STATEMENTS 2019
133
NOTES TO THE FINANCIAL STATEMENTSFor the year ended 31 December 2019
(All amounts in millions of Naira unless otherwise stated)
Group Group Bank Bank
21 September - 21 September -
31 December 31 December 31 December 31 December
2019 2018 2019 2018
N5,000,001 and N10,000,000 1 6 1 6N10,000,001 and N20,000,000 4 1 4 1N20,000,001 and above 3 1 3 1
8 8 8 8
16 Administration and general expenses
Group Group Bank Bank
21 September - 21 September -
31 December 31 December 31 December 31 December
2019 2018 2019 2018
Advertising and business promotion 441 306 441 306
Communication and operational cost 180 47 180 47
Insurance costs 499 121 499 121
Legal and professional fees 1,988 174 1,988 174
NDIC insurance premium 5,034 1,512 5,034 1,512
Repairs and maintenance 3,868 1,047 3,868 1,047
Transport, travel, accommodation 552 91 552 91
Stationery and printing 536 137 536 137
Security expenses 1,320 341 1,320 341
Training expenses 833 43 833 43
Contract services 4,586 1,396 4,586 1,396
Charities and donations 119 8 119 8
Directors' related expenses 157 40 157 40
AMCON sinking fund expenses 3,960 1,080 3,960 1,080
Utilities 837 197 837 197
Office expenses 755 210 755 210
Newspapers and periodicals 11 3 11 3
Operational and other losses 488 761 488 761
Rents and rates 293 306 293 306
Auditors remuneration 210 90 210 90
Cash shipment services 1,048 265 1,048 265
Subscriptions 233 45 233 45
Other administrative expenses 915 237 915 237
28,863 8,457 28,863 8,457
17 Depreciation and amortisation
Group Group Bank Bank
21 September - 21 September -
31 December 31 December 31 December 31 December
2019 2018 2019 2018
Depreciation of property, plant and
equipment (note 28)
3,877 1,012 3,877 1,012
Depreciation of right of use ssset (note 27) 413 - 413 -
Amortisation of intangible assets (note 29) 231 95 231 95
4,521 1,107 4,521 1,107
The number of directors who received fees and other emoluments (excluding pension contributions and certain benefit) in the following
ranges was:
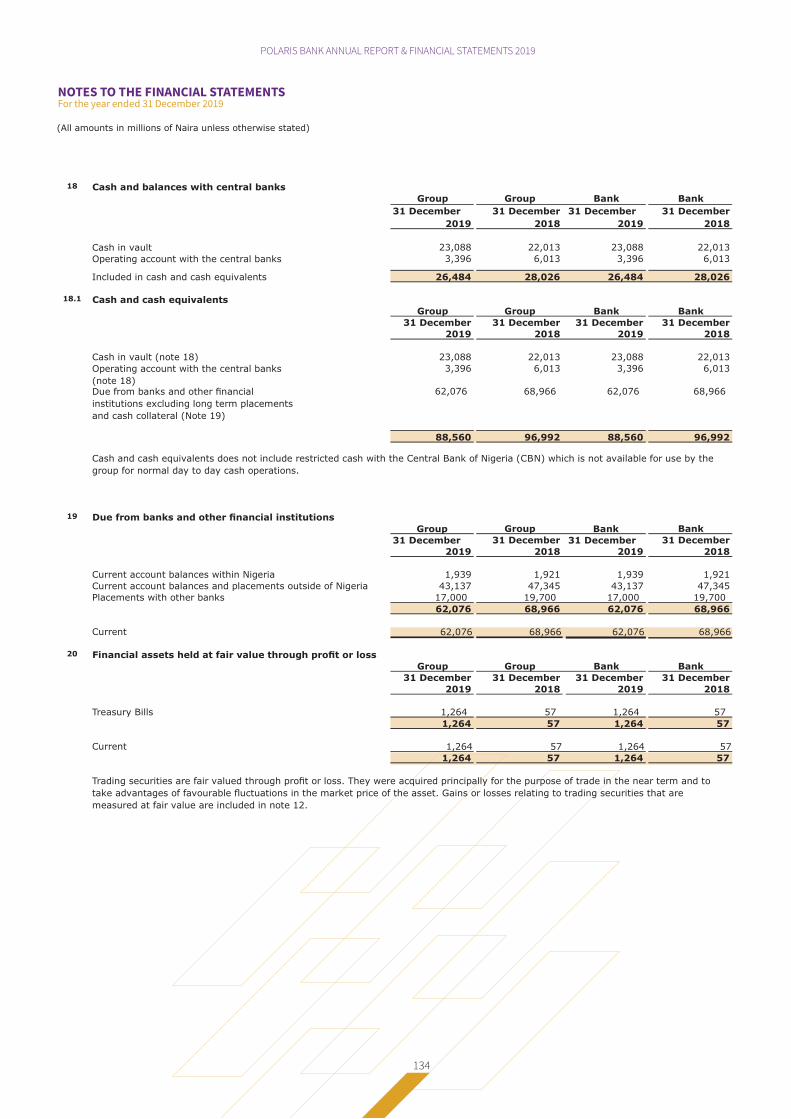
POLARIS BANK ANNUAL REPORT & FINANCIAL STATEMENTS 2019
134
NOTES TO THE FINANCIAL STATEMENTSFor the year ended 31 December 2019
(All amounts in millions of Naira unless otherwise stated)
18 Cash and balances with central banks
Group Group Bank Bank
31 December 31 December 31 December 31 December
2019 2018 2019 2018
Cash in vault 23,088 22,013 23,088 22,013
Operating account with the central banks 3,396 6,013 3,396 6,013
Included in cash and cash equivalents 26,484 28,026 26,484 28,026
18.1 Cash and cash equivalents
Group Group Bank Bank
31 December 31 December 31 December 31 December
2019 2018 2019 2018
Cash in vault (note 18) 23,088 22,013 23,088 22,013
Operating account with the central banks
(note 18)
3,396 6,013 3,396 6,013
Due from banks and other financial
institutions excluding long term placements
and cash collateral (Note 19)
62,076 68,966 62,076 68,966
88,560 96,992 88,560 96,992
19 Due from banks and other financial institutions
Group Group Bank Bank
31 December 31 December 31 December 31 December
2019 2018 2019 2018
Current account balances within Nigeria 1,939 1,921 1,939 1,921
Current account balances and placements outside of Nigeria 43,137 47,345 43,137 47,345
Placements with other banks 17,000 19,700 17,000 19,700
62,076 68,966 62,076 68,966
Current 62,076 68,966 62,076 68,966
20 Financial assets held at fair value through profit or loss
Group Group Bank Bank
31 December 31 December 31 December 31 December
2019 2018 2019 2018
Treasury Bills 1,264 57 1,264 57
1,264 57 1,264 57
Current 1,264 57 1,264 57
1,264 57 1,264 57
Trading securities are fair valued through profit or loss. They were acquired principally for the purpose of trade in the near term and to
take advantages of favourable fluctuations in the market price of the asset. Gains or losses relating to trading securities that are
measured at fair value are included in note 12.
Cash and cash equivalents does not include restricted cash with the Central Bank of Nigeria (CBN) which is not available for use by the
group for normal day to day cash operations.
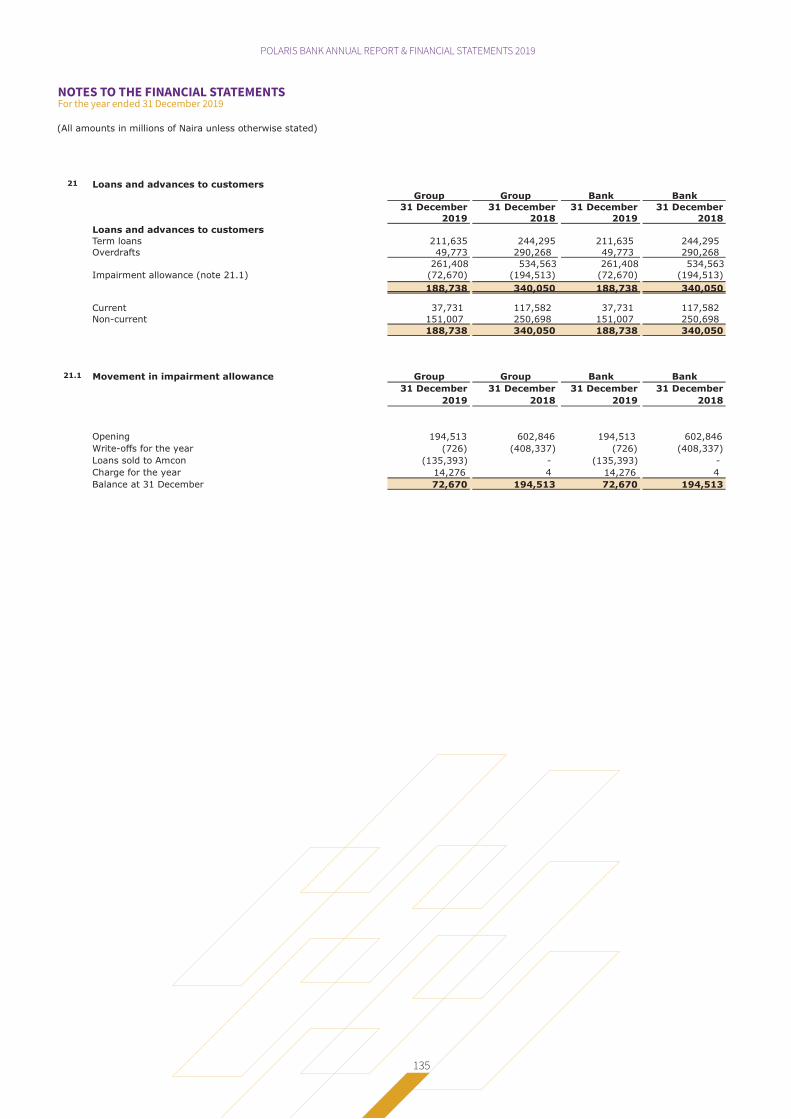
POLARIS BANK ANNUAL REPORT & FINANCIAL STATEMENTS 2019
135
NOTES TO THE FINANCIAL STATEMENTSFor the year ended 31 December 2019
(All amounts in millions of Naira unless otherwise stated)
21 Loans and advances to customers
Group Group Bank Bank
31 December 31 December 31 December 31 December
2019 2018 2019 2018
Loans and advances to customers
Term loans 211,635 244,295 211,635 244,295
Overdrafts 49,773 290,268 49,773 290,268
261,408 534,563 261,408 534,563 Impairment allowance (note 21.1) (72,670) (194,513) (72,670) (194,513)
188,738 340,050 188,738 340,050
Current 37,731 117,582 37,731 117,582
Non-current 151,007 250,698 151,007 250,698
188,738 340,050 188,738 340,050
21.1 Movement in impairment allowance Group Group Bank Bank
31 December 31 December 31 December 31 December
2019 2018 2019 2018
Opening 194,513 602,846 194,513 602,846
Write-offs for the year (726) (408,337) (726) (408,337)
Loans sold to Amcon (135,393) - (135,393) -
Charge for the year 14,276 4 14,276 4
Balance at 31 December 72,670 194,513 72,670 194,513

POLARIS BANK ANNUAL REPORT & FINANCIAL STATEMENTS 2019
136
NOTES TO THE FINANCIAL STATEMENTSFor the year ended 31 December 2019
(All amounts in millions of Naira unless otherwise stated)
22 Investments held at amortised cost
Group Group Bank Bank
31 December 31 December 31 December 31 December
2019 2018 2019 2018
Treasury bills 449,366 480,752 449,366 480,752
Federal Government of Nigeria bonds 56,984 34,762 56,984 34,762
Corporate bonds 1,674 1,814 1,674 1,814State Government bonds 9,114 16,426 9,114 16,426Eurobonds 1,923 - 1,923 -
519,061 533,754 519,061 533,754 Impairment of debt securities (1,990) (1,949) (1,990) (1,949)
517,071 531,805 517,071 531,805
Current 456,563 478,940 456,563 478,940
Non-current 60,508 52,865 60,508 52,865
517,071 531,805 517,071 531,805 Movement in impairment of debt securities :
Opening Balance 1,949 1,575 1,949 1,575
Charge for the year 41 374 41 374
Closing Balance 1,990 1,949 1,990 1,949
23 Investment securities at fair value through other
comprehensive incomeGroup Group Bank Bank
31 December 31 December 31 December 31 December
2019 2018 2019 2018
Quoted equity investment 10 - 10 -Unquoted equity investment 17,352 14,634 17,352 14,634
17,362 14,634 17,362 14,634
24 Assets pledged as collateral
Group Group Bank Bank
31 December 31 December 31 December 31 December
2019 2018 2019 2018
Federal Government of Nigeria Bonds 14,064 25,992 14,064 25,992
Treasury bills 27,610 24,457 27,610 24,457
State Government of Nigeria Bonds 410 323 410 323 Euro Bonds - 7,531 - 7,531
42,084 58,303 42,084 58,303
Impairment on assets pledged as collaterals - (41) - (41)
42,084 58,262 42,084 58,262
Current 27,679 24,419 27,679 24,419
Non current 14,405 33,843 14,405 33,843
42,084 58,262 42,084 58,262
The related liability for assets pledged as collateral
include:Borrowings (Note 32)
Bank of industry 4,317 5,899 4,317 5,899 Afrexim 7,461 36,233 7,461 36,233
11,778 42,132 11,778 42,132
The assets pledged as collateral include assets pledged to third parties under secured borrowing with the related liability disclosed above.
Also included in pledged assets are assets pledged as collateral or security deposits to clearing house and payment agencies ( CBN
Clearing, SystemSpec, Interswitch, FMDQ and Etranzact). The pledges have been made in the normal course of business of the Bank. In
the event of default, the pledgee has the right to realise the pledged assets.
In connection with the Bank’s financing and trading activities, the Bank has pledged assets to secure its borrowings. The Bank is not
allowed to pledge these assets as security for other borrowings or to sell them to another entity. The carrying values of the Group's
pledged assets are as follows:
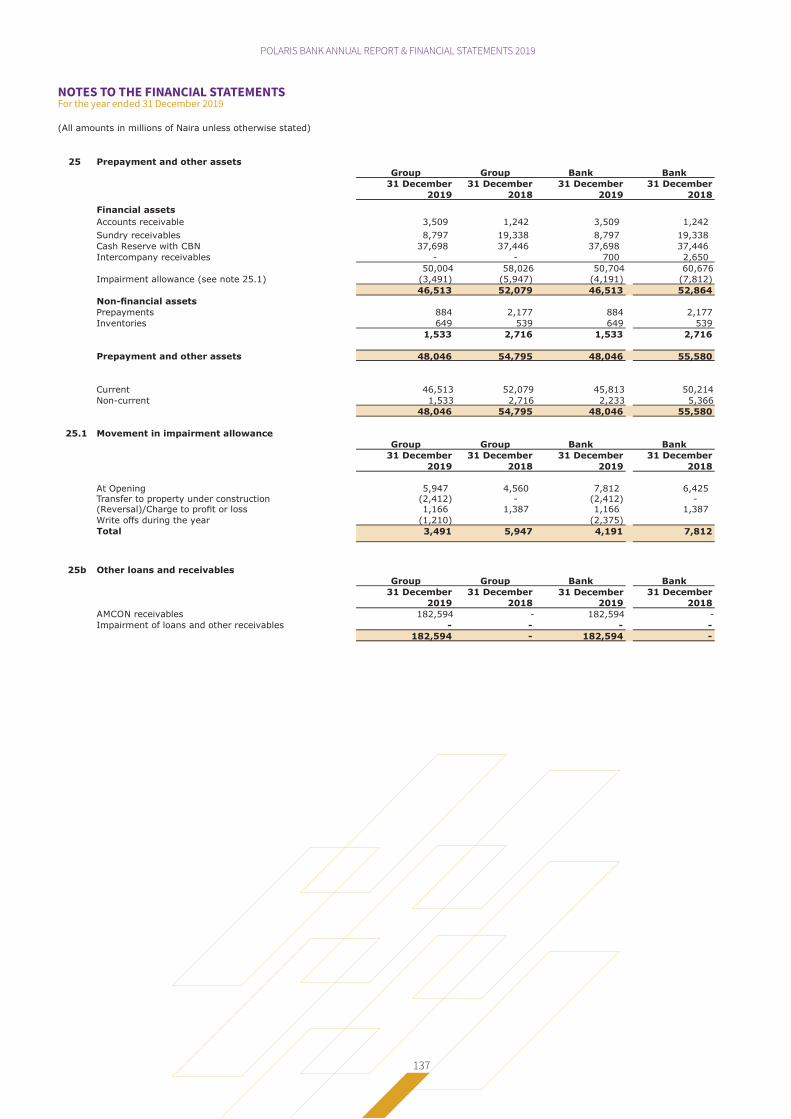
POLARIS BANK ANNUAL REPORT & FINANCIAL STATEMENTS 2019
137
NOTES TO THE FINANCIAL STATEMENTSFor the year ended 31 December 2019
(All amounts in millions of Naira unless otherwise stated)
25 Prepayment and other assets
Group Group Bank Bank
31 December 31 December 31 December 31 December
2019 2018 2019 2018
Financial assets
Accounts receivable 3,509 1,242 3,509 1,242
Sundry receivables 8,797 19,338 8,797 19,338
Cash Reserve with CBN 37,698 37,446 37,698 37,446
Intercompany receivables - - 700 2,650
50,004 58,026 50,704 60,676 Impairment allowance (see note 25.1) (3,491) (5,947) (4,191) (7,812)
46,513 52,079 46,513 52,864 Non-financial assets
Prepayments 884 2,177 884 2,177
Inventories 649 539 649 539
1,533 2,716 1,533 2,716
Prepayment and other assets 48,046 54,795 48,046 55,580
Current 46,513 52,079 45,813 50,214
Non-current 1,533 2,716 2,233 5,366
48,046 54,795 48,046 55,580
25.1 Movement in impairment allowance
Group Group Bank Bank
31 December 31 December 31 December 31 December
2019 2018 2019 2018
At Opening 5,947 4,560 7,812 6,425Transfer to property under construction (2,412) - (2,412) -(Reversal)/Charge to profit or loss 1,166 1,387 1,166 1,387
Write offs during the year (1,210) (2,375)
Total 3,491 5,947 4,191 7,812
25b Other loans and receivables
Group Group Bank Bank
31 December 31 December 31 December 31 December
2019 2018 2019 2018
AMCON receivables 182,594 - 182,594 - Impairment of loans and other receivables - - - -
182,594 - 182,594 -

POLARIS BANK ANNUAL REPORT & FINANCIAL STATEMENTS 2019
138
NOTES TO THE FINANCIAL STATEMENTSFor the year ended 31 December 2019
26 Right of Use Assets
Building TotalN'm N'm
Opening balance as at 1 January 2019 2,546 2,546
Additions during the year 1,504 1,504Closing balance as at 31 December 2019 4,050 4,050
Depreciation - -
Opening balance as at 1 January 2019 413 413Charge for the year 413 413
Closing balance as at 31 December 2019Net book value as at 31 December 2019 3,637 3,637
27 Lease liabilities
i Lease liabilitiesN'm
Opening balance as at 1 January 2019 1,443
Additions 951
Interest expense 251Closing balance as at 31 December 2019 2,645
Current lease liabilities 5
Non-current lease liabilities 2,6402,645
ii Amounts recognised in the statement of profit or loss
N'm
Depreciation charge of right-of-use assets 413
Interest expense 251
664
The total cash outflow for leases as at December 2019 was N553 million.
iii)
Less than
6 months
6-12
months
Between
1 and 2
years
Between
2 and 5
years Above 5 years
Total contractual
cashflows Carrying amount
Lease liability - - - 313 4,767 5,080 2,645
This note provides information for leases where the Bank is a lessee.
Liquidity risk (maturity analysis of lease liabilities)
(All amounts in millions of Naira unless otherwise stated)

NO
TE
S T
O T
HE
FIN
AN
CIA
L S
TA
TE
ME
NT
SFo
r th
e ye
ar
end
ed 3
1 D
ece
mb
er 2
019
PO
LAR
IS B
AN
K A
NN
UA
L R
EP
OR
T &
FIN
AN
CIA
L ST
ATE
ME
NTS
201
9
139
(All a
mounts
in m
illions o
f N
aira u
nle
ss o
therw
ise s
tate
d)
28
Pro
pert
y,
pla
nt
an
d e
qu
ipm
en
t
Gro
up
an
d B
an
k
Leaseh
old
lan
d &
bu
ild
ing
s
Leaseh
old
imp
rovem
en
ts
Pla
nt
&
mach
inery
Fu
rnit
ure
&
fitt
ing
s
Mo
tor
veh
icle
s
Co
mp
ute
r
hard
ware
Pro
pert
y u
nd
er
co
nstr
ucti
on
To
tal
Co
st
As a
t 01 J
anuary
2019
35,9
16
18,6
22
16,0
47
2,9
89
3,5
79
15,9
94
4,6
61
97,8
08
Additio
ns
100
32
1,1
86
42
660
659
6,9
70
9,6
49
Dis
posals
/Write
-offs
-(1
5)
(295)
(17)
(380)
(230)
(181)
(1
,118)
Recla
ssifi
cation fro
m a
sset
held
for
sale
1
37
-
-
-
-
-
-
1
37
Recla
ssifi
cation
(
8)
-
(1
3)
-
-
21
-
-
At
31
Decem
ber
20
19
3
6,1
45
1
8,6
39
16,9
25
3
,014
3,8
59
16,4
44
11,4
50
106,4
76
Accu
mu
late
d d
ep
recia
tio
n
As a
t 01 J
anuary
2019
3,6
77
10,7
46
13,9
00
2,8
52
3,4
21
14,9
02
-49,4
98
Charg
e for
the y
ear
607
1,2
42
986
77
233
732
-3,8
77
Dis
posals
-(1
5)
(292)
(18)
(380)
(229)
-(9
34)
Impairm
ent
-
-
-
-
-
-
2,4
12
2,4
12
At
31
Decem
ber
20
19
4,2
84
1
1,9
73
14,5
94
2
,911
3,2
74
15,4
05
2,4
12
54,8
53
N2.4
12 b
n r
ela
tes t
o im
pairm
ent
of pro
pert
ies u
nder
constr
uction t
hat
have b
ecom
e o
bsole
te
Net
bo
ok a
mo
un
t at
31
Decem
ber
20
19
31
,86
1
6
,66
6
2
,33
1
1
03
5
85
1,0
39
9,0
38
5
1,6
23
Leaseh
old
lan
d &
bu
ild
ing
s
Leaseh
old
imp
rovem
en
ts
Pla
nt
&
mach
inery
Fu
rnit
ure
&
fitt
ing
s
Mo
tor
veh
icle
s
Co
mp
ute
r
hard
ware
Pro
pert
y u
nd
er
co
nstr
ucti
on
To
tal
Co
st
As a
t 21 S
epte
mber
2018
3
5,8
92
1
8,6
15
15,9
93
2
,991
3,6
19
15,9
19
4,3
88
97,4
17
Additio
ns
2
4
7
7
0
2
-
126 2
73 5
02
Dis
posals
/Write
-offs
-
-
(1
6)
(4
) (4
0)
(
51)
-
(
111)
At
31 D
ecem
ber
2018
35,9
16
18,6
22
16,0
47
2,9
89
3,5
79
15,9
94
4,6
61
97,8
08
Accum
ula
ted d
epre
cia
tion
As a
t 21 S
epte
mber
2018
3,5
26
1
0,3
92
13,6
58
2
,832
3,3
93
14,7
68
-
48,5
69
Charg
e for
the y
ear
1
51
3
54
2
53
23
6
8
164
-
1,0
12
Dis
posals
-
-
(1
0)
(4
) (4
0)
(
30)
-
(
84)
At
31
Decem
ber
20
18
3,6
77
1
0,7
46
1
3,9
01
2
,85
1
3,4
21
1
4,9
02
-
4
9,4
97
Net
bo
ok a
mo
un
t at
31
Decem
ber
20
18
32
,23
97
,87
62
,14
61
38
15
81
,09
24
,66
14
8,3
11

POLARIS BANK ANNUAL REPORT & FINANCIAL STATEMENTS 2019
140
NOTES TO THE FINANCIAL STATEMENTSFor the year ended 31 December 2019
(All amounts in millions of Naira unless otherwise stated)
29 Intangible assets Bank
Computer Computer
software software
Cost
At 1 January 2019 9,653 9,653
Additions 127 127
At 31 December 2019 9,780 9,780
Amortisation
At 1 January 2019 (9,369) (9,369)
Amortisation charge (231) (231)
At 31 December 2019 (9,600) (9,600)
Net book value
At 31 December 2019 180 180
Cost
At 21 September 2018 9,644 9,644
Additions 9 9
At 31 December 2018 9,653 9,653
Amortisation
At 21 September 2018 (9,274) (9,274)
Amortisation charge (95) (95)
At 31 December 2018 (9,369) (9,369)
Net book value
At 31 December 2018 284 284
*Intangible assets are all externally generated
Group

POLARIS BANK ANNUAL REPORT & FINANCIAL STATEMENTS 2019
141
NOTES TO THE FINANCIAL STATEMENTSFor the year ended 31 December 2019
(All amounts in millions of Naira unless otherwise stated)
30 Assets classified as held for sale and discontinued operations
Group Group Bank Bank
31 December 31 December 31 December 31 December
2019 2018 2019 2018
Non-current assets held for sale (note 30a) - 137 - 137Discontinued operations (note 30b) - - 2,107 3,983Assets of disposal group held for sale 15,485 23,331 - -
Total assets classified as held for sale 15,485 23,468 2,107 4,120
Liabilities of disposal group held for sale 9,529 13,686 - -
a
b Discontinued operations
Name Country of
incorporation
and place of
business
Nature of
business
Proportion of
ordinary shares
directly held by
parent (%)
Proportion of
ordinary
shares held
by non-
controlling
interests (%)
Carrying
amount
• Skye Bank Guinea Guinea Banking 73 27 1,156
• Skye Finance and Investment Ltd Dublin Financial
services
100 - 9
• Mainstreet Bank Estate Company Ltd Nigeria Property
development
100 - 500
• Mainstreet Securities Ltd Nigeria Financial
services
94 6 442
2,107
The table below shows the total non-controlling interest for the period:
Skye Bank
Guinea
Mainstreet
Securities Ltd
Total
1,124 70 1,194
On 19 February 2016, the board of the defunct Skye Bank approved the disposal of the Group's entire interest in all of its subsidiaries. As
at 31 December 2019, the sale of Four(4) subsidiaries have been completed.
In September 2018, the directors of Skye Finance and Investments Limited (SFIL), the Irish entity, resolved to place the company into
voluntary members liquidation at a board meeting. The affairs of the company was thus handed over to the liquidator.
Consequently, the associated assets and the liabilities of the unsold subsidiaries and SFIL have been presented as held for sale having met
all the conditions to be classified as such in accordance with IFRS 5 as the carrying amount is expected to be recovered principally by a sale
rather than through continuing use. These subsidiaries include:
Assets classified as held for sale as at 31 December 2018 were transferred to Property Plant and Equipment (See note 28) in 2019.

POLARIS BANK ANNUAL REPORT & FINANCIAL STATEMENTS 2019
142
NOTES TO THE FINANCIAL STATEMENTSFor the year ended 31 December 2019
(All amounts in millions of Naira unless otherwise stated)
31 December 31 December
2019 2018
Net interest income 711 1,238
Net fee and commission income 338 458
Other operating income 278 188
- 856
Operating expenses (1,142) (2,315)
Profit Before Tax of discontinued operations 185 425 Loss on sale of subsidiaries (see note 30c below) (757) - Taxation - - Profit After Tax of discontinued operations (572) 425
Exchange differences on translation of discontinued operations - 1,880
Other comprehensive income from discontinued operations - 1,880
Net cash inflow/(outflow) from operating activities 78 492
Net cash inflow/(outflow) from investing activities (560) (418)
Net cash inflow/(outflow) from financing activities (1,367) 79
The assets and liabilities of the subsidiaries held for sale are as follows;
Skye Bank
Guinea
Mainstreet
Securities
Limited
MBL Estate Total
Cash and Cash
Equivalent
2,469 675 17 3,161
Investment Securities 6,714 2,271 - 8,985
Loans and advances 1,837 - - 1,837
Other Assets and
receivables
224 (69) 1,265 1,420
Investment
Properties
- - - -
Property, Plant &
Equipment
81 - - 81
Intangible Assets - 1 - 1
Total Assets 11,325 2,878 1,282 15,485
Deposits 6,196 3 6,199
Due to other banks - - -
Current tax liabilities 39 416 455
Deferred Taxation 0 - -
Other Liabilities 926 1,231 652 2,809
Retirement Benefit
Obligation
- - 65 - 65
Total Liabilities 7,161 1,715 652 9,528
Financial risk management disclosures for non-current assets and non-current liabilities held for sale
The summarised results from discontinued operations which have been included in the consolidated income statement are as follows:
In accordance with IFRS 5, the assets and liabilities held for sale were carried at the lower of their fair value less costs to sell and carrying
amount. The financial assets are cash and balance balances, Loans and advances to customers, investment securities and other assets.
The loan facilities of the discontinued operations are spread across sectors in the following percentages of: 63% in the corporate sector,
27% in the retail sector and 10% in the commercial sector. Collateral held against this exposure includes: properties, cash and other
enhancements. Most of the assets and liabilities mature within six months and as such fair value approximated carrying amount.
Investment in securities are trading instruments which are highly liquid and actively traded with maturity of 1 year. Cash and balances with
banks consist of balances held with foreign banks and unrestricted balances with central bank.

POLARIS BANK ANNUAL REPORT & FINANCIAL STATEMENTS 2019
143
NOTES TO THE FINANCIAL STATEMENTSFor the year ended 31 December 2019
(All amounts in millions of Naira unless otherwise stated)
c Details of sale of subsidiary
The book value of the net assets for the subsidiaries disposed at the date of disposal is as follows:
Skye bank
Gambia
Skye bank
Sierra-Leone
Total
Cash & balance with host Central Bank 656 312 968
Due from bank 612 983 1,595
Placements 1,971 460 2,431
Investment Securities - 1,884 1,884
Loans and Advances 194 778 972
Other Assets 111 324 435
Property Plant and Equipments 1,316 42 1,358
Intangible 216 - 216
Deferred tax asset - 139 139
Total Assets 5,076 4,922 9,998
Deposits from customers 2,830 2,067 4,897
Due to banks 124 - 124
Current income tax 2 - 2
Deferred income Tax 12 - 12
Accruals and other liabilities 635 909 1,544
Total Liabilities 3,603 2,976 6,579
Net assets of disposal group 1,473 1,946 3,419
The profit/ (loss) on the disposed subsidiaries is as follows:
Group
Gambia Sierra-Leone Total
Proceeds from sale of subsidiaries 719 1918 2,637
Disposal cost (243) (31) (274)Net proceeds from sale of subsidiaries 476 1887 2363Fair value of NCI 280 19 299Net assets of subsidiaries at disposal (1,472) (1,947) (3,419)Loss on sale (716) (41) (757)
Bank
31 December
2019
Proceeds from sale of subsidiaries 2,637Disposal cost (274)Net proceeds from sale of subsidiaries 2,363Carrying amount of investments 1,876Profit on sale 487
31 December
2019
Polaris bank fully disposed two of its subsidiaries: Skye bank Gambia and Skye bank Sierra-leone. The sale was effective 1 January 2019
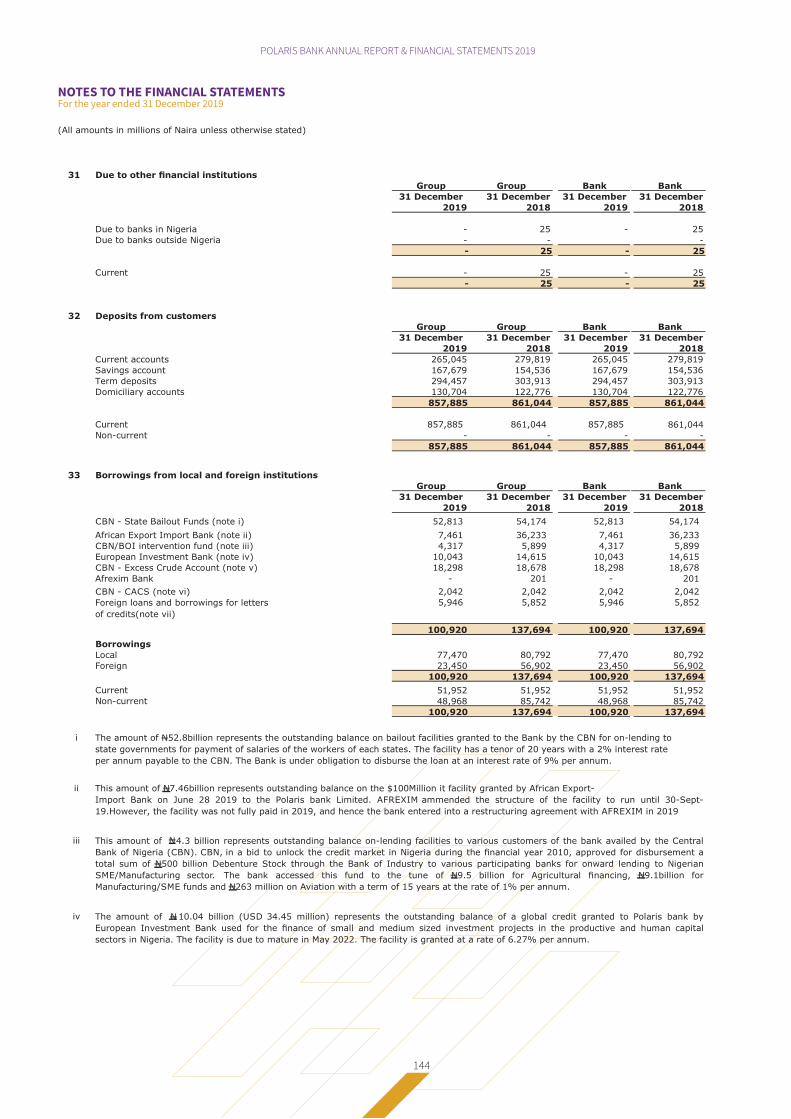
POLARIS BANK ANNUAL REPORT & FINANCIAL STATEMENTS 2019
144
NOTES TO THE FINANCIAL STATEMENTSFor the year ended 31 December 2019
(All amounts in millions of Naira unless otherwise stated)
31 Due to other financial institutions
Group Group Bank Bank
31 December 31 December 31 December 31 December
2019 2018 2019 2018
Due to banks in Nigeria - 25 - 25
Due to banks outside Nigeria - - -
- 25 - 25
Current - 25 - 25
- 25 - 25
32 Deposits from customers
Group Group Bank Bank
31 December 31 December 31 December 31 December
2019 2018 2019 2018
Current accounts 265,045 279,819 265,045 279,819
Savings account 167,679 154,536 167,679 154,536
Term deposits 294,457 303,913 294,457 303,913
Domiciliary accounts 130,704 122,776 130,704 122,776
857,885 861,044 857,885 861,044
Current 857,885 861,044 857,885 861,044 Non-current - - - -
857,885 861,044 857,885 861,044
33 Borrowings from local and foreign institutions
Group Group Bank Bank
31 December 31 December 31 December 31 December
2019 2018 2019 2018
CBN - State Bailout Funds (note i) 52,813 54,174 52,813 54,174
African Export Import Bank (note ii) 7,461 36,233 7,461 36,233
CBN/BOI intervention fund (note iii) 4,317 5,899 4,317 5,899
European Investment Bank (note iv) 10,043 14,615 10,043 14,615
CBN - Excess Crude Account (note v) 18,298 18,678 18,298 18,678
Afrexim Bank - 201 - 201
CBN - CACS (note vi) 2,042 2,042 2,042 2,042
5,946 5,852 5,946 5,852
100,920 137,694 100,920 137,694
Borrowings
Local 77,470 80,792 77,470 80,792
Foreign 23,450 56,902 23,450 56,902
100,920 137,694 100,920 137,694
Current 51,952 51,952 51,952 51,952 Non-current 48,968 85,742 48,968 85,742
100,920 137,694 100,920 137,694
Foreign loans and borrowings for letters
of credits(note vii)
i
ii
iii
iv
state governments for payment of salaries of the workers of each states. The facility has a tenor of 20 years with a 2% interest rate
per annum payable to the CBN. The Bank is under obligation to disburse the loan at an interest rate of 9% per annum.
This amount of N4.3 billion represents outstanding balance on-lending facilities to various customers of the bank availed by the Central
Bank of Nigeria (CBN). CBN, in a bid to unlock the credit market in Nigeria during the financial year 2010, approved for disbursement a
total sum of N500 billion Debenture Stock through the Bank of Industry to various participating banks for onward lending to Nigerian
SME/Manufacturing sector. The bank accessed this fund to the tune of N9.5 billion for Agricultural financing, N9.1billion for
Manufacturing/SME funds and N263 million on Aviation with a term of 15 years at the rate of 1% per annum.
This amount of N7.46billion represents outstanding balance on the $100Million it facility granted by African Export-
Import Bank on June 28 2019 to the Polaris bank Limited. AFREXIM ammended the structure of the facility to run until 30-Sept-
19.However, the facility was not fully paid in 2019, and hence the bank entered into a restructuring agreement with AFREXIM in 2019
The amount of 10.04 billion (USD 34.45 million) represents the outstanding balance of a global credit granted to Polaris bank by
European Investment Bank used for the finance of small and medium sized investment projects in the productive and human capital
sectors in Nigeria. The facility is due to mature in May 2022. The facility is granted at a rate of 6.27% per annum.
The amount of N52.8billion represents the outstanding balance on bailout facilities granted to the Bank by the CBN for on-lending to
N
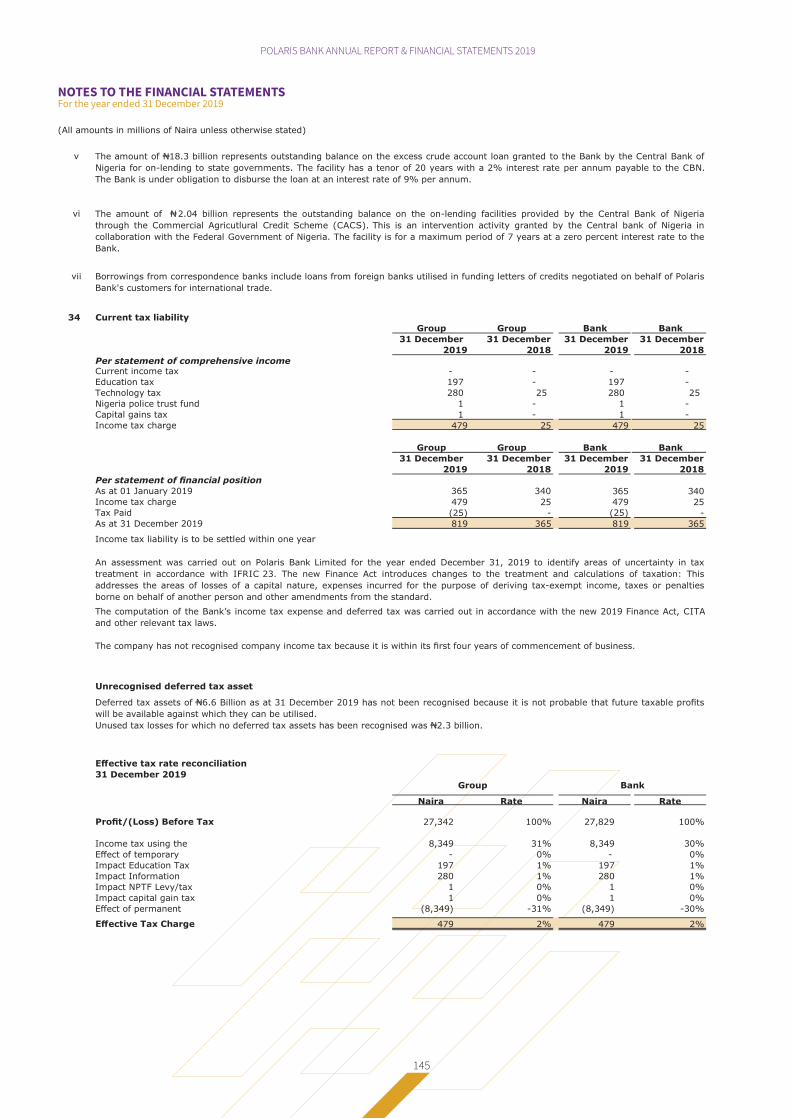
POLARIS BANK ANNUAL REPORT & FINANCIAL STATEMENTS 2019
145
NOTES TO THE FINANCIAL STATEMENTSFor the year ended 31 December 2019
(All amounts in millions of Naira unless otherwise stated)
v The amount of N18.3 billion represents outstanding balance on the excess crude account loan granted to the Bank by the Central Bank of
Nigeria for on-lending to state governments. The facility has a tenor of 20 years with a 2% interest rate per annum payable to the CBN.
The Bank is under obligation to disburse the loan at an interest rate of 9% per annum.
vi
vii
34 Current tax liability
Group Group Bank Bank
31 December 31 December 31 December 31 December
2019 2018 2019 2018
Per statement of comprehensive incomeCurrent income tax - - - -
Education tax 197 - 197 -
Technology tax 280 25 280 25
Nigeria police trust fund 1 - 1 -
Capital gains tax 1 - 1 -
Income tax charge 479 25 479 25
Group Group Bank Bank
31 December 31 December 31 December 31 December
2019 2018 2019 2018
Per statement of financial position
As at 01 January 2019 365 340 365 340 Income tax charge 479 25 479 25 Tax Paid (25) - (25) - As at 31 December 2019 819 365 819 365
Unrecognised deferred tax asset
Effective tax rate reconciliation
31 December 2019
Naira Rate Naira Rate
Profit/(Loss) Before Tax 27,342 100% 27,829 100%
Income tax using the 8,349 31% 8,349 30%
Effect of temporary - 0% - 0%
Impact Education Tax 197 1% 197 1%
Impact Information 280 1% 280 1%
Impact NPTF Levy/tax 1 0% 1 0%
Impact capital gain tax 1 0% 1 0%
Effect of permanent (8,349) -31% (8,349) -30%
Effective Tax Charge 479 2% 479 2%
BankGroup
Borrowings from correspondence banks include loans from foreign banks utilised in funding letters of credits negotiated on behalf of Polaris
Bank's customers for international trade.
Income tax liability is to be settled within one year
The computation of the Bank’s income tax expense and deferred tax was carried out in accordance with the new 2019 Finance Act, CITA
and other relevant tax laws.
The company has not recognised company income tax because it is within its first four years of commencement of business.
An assessment was carried out on Polaris Bank Limited for the year ended December 31, 2019 to identify areas of uncertainty in tax
treatment in accordance with IFRIC 23. The new Finance Act introduces changes to the treatment and calculations of taxation: This
addresses the areas of losses of a capital nature, expenses incurred for the purpose of deriving tax-exempt income, taxes or penalties
borne on behalf of another person and other amendments from the standard.
The amount of 2.04 billion represents the outstanding balance on the on-lending facilities provided by the Central Bank of Nigeria
through the Commercial Agricutlural Credit Scheme (CACS). This is an intervention activity granted by the Central bank of Nigeria in
collaboration with the Federal Government of Nigeria. The facility is for a maximum period of 7 years at a zero percent interest rate to the
Bank.
Deferred tax assets of N6.6 Billion as at 31 December 2019 has not been recognised because it is not probable that future taxable profits
will be available against which they can be utilised.
Unused tax losses for which no deferred tax assets has been recognised was N2.3 billion.
N

POLARIS BANK ANNUAL REPORT & FINANCIAL STATEMENTS 2019
146
NOTES TO THE FINANCIAL STATEMENTSFor the year ended 31 December 2019
(All amounts in millions of Naira unless otherwise stated)
35 Accruals and other liabilitiesGroup Group Bank Bank
31 December 31 December 31 December 31 December
2019 2018 2019 2018
Financial liabilities
Accounts payable 39,163 37,382 39,215 37,382
Customer deposits for letters of credit 699 5,112 699 5,112
Manager's cheque 4,884 5,249 4,884 5,249
AMCON Payable 20,496 14,356 20,496 14,356
Deposit held for sale of subsidiaries 7,106 6,920 7,106 6,920
Uncleared effects 8 276 8 276
Cash card collection settlement 4,429 4,401 4,429 4,401
76,785 73,696 76,837 73,696 Non-financial liabilities
Litigation claims provision (35(i)) 7,559 7,059 7,559 7,059
Other credit balances 11,727 13,131 11,727 14,049
Off Balance Sheet ECL allowance 1,874 3,190 1,874 3,190
21,160 23,380 21,160 24,298
97,945 97,076 97,997 97,994
Current 37,614 36,038 37,614 36,038 Non-current 60,331 61,038 60,383 61,956
97,945 97,076 97,997 97,994
35 (i) Movement in litigation claims provision
Group Group Bank Bank
31 December 31 December 31 December 31 December
2019 2018 2019 2018
Opening balance 7,059 7,059 7,059 7,059 Additional provision 500 - 500 - Closing balance - 7,559 7,059 7,559 7,059
36 Retirement benefit obligation
Group Group Bank Bank
31 December 31 December 31 December 31 December
2019 2018 2019 2018
Defined benefit contribution 11 11 11 11
11 11 11 11
37 Share capital and reserves
a Share capital
Group Group Bank Bank
31 December 31 December 31 December 31 December
2019 2018 2019 2018
Authorised
25,000 25,000 25,000 25,000
Issued and fully paid
Group Bank
31 December 31 December
2019 2018
Opening 25,000 - Shares issued to AMCON - 25,000 Balance, end of year 25,000 25,000
b) Share premium
Share premium is the excess paid by shareholders over the nominal value of their shares
25 billion ordinary shares of N1 each
(31 December 2019: 25 billion ordinary
shares of N1 each)
The movement on the issued and fully paid up share capital account during the year was as follows:

POLARIS BANK ANNUAL REPORT & FINANCIAL STATEMENTS 2019
147
NOTES TO THE FINANCIAL STATEMENTSFor the year ended 31 December 2019
(All amounts in millions of Naira unless otherwise stated)
c) Other reserves
i Statutory reserve
ii Small and medium scale industries equity investment scheme (SMEEIS) reserves
iii Fair value reserve
iv Regulatory reserve
v Translation reserve
vi Intervention fund reserve
d Non-controlling interest
e Reorganisation reserve
38 Cash generated from operations
Group Group Bank Bank
31 December 31 December 31 December 31 December
2019 2018 2019 2018
Operating Profit before tax 27,342 2,456 27,829 2,456
Adjustments for:
Depreciation of property and equipment 4,290 1,012 4,290 1,012
Amortisation of intangible assets 231 95 231 95
Profit from sale of subsidiary - - (487) -
(65) (191) (65) (191)
Fair value gain on OCI financial instruments - (98) - (98)
(500) (32) (500) (32)
Impairment on financial assets 14,126 420 14,126 420
Net (gain)/loss on sale of FVOCI investments - 989 - 989
Net interest income (86,284) (9,377) (86,284) (9,377)
Unrealised foreign exchange gain on revaluation (450) (8,788) (450) (8,788)
Dividend income (484) (196) (484) (196)
(41,794) (12,323) (41,794) (12,323)Changes in operating assets and liabilities
1,254 431 1,254 431
Pledged assets - 28,806 - 28,806
6,510 29,484 6,510 19,589
7,677 (3,811) 7,677 (3,811)
Changes in operating liabilities
(3,129) (9,375) (3,129) (9,375)
Accruals and other liabilities 1,319 594 1,319 594
Interest paid on deposits (40,533) (4,140) (40,533) (4,140)
Interest received on loans and advances 128 - 128
(68,697) 19,899 (68,697) 19,899
(25) - (25) -
Net cash used in operating activities (68,722) 19,899 (68,722) 19,899
This represents 10% of the Gross revenue of the bank.
The banking regulations require the bank and other banking subsidiaries of the bank to make an annual appropriation to a statutory
reserve. An appropriation of 30% of profit after taxation is made if the statutory reserve is less than the paid-up share capital and 15% of
profit after taxation if the statutory reserve is greater than the paid up share capital.
Statutory reserves also include other reserves as stipulated by the banking regulations.
The SMEEIS reserve is maintained to comply with the Central Bank of Nigeria (CBN) requirement that all licensed banks set aside a portion
of the profit after taxation in a fund to be used to finance equity investments in qualifying small and medium scale enterprises. Under the
terms of the guideline (amended by CBN letter dated 11 July 2006), the contributions will be 10% of profit after taxation and shall continue
after the first 5 years but banks’ contributions shall thereafter reduce to 5% of profit after taxation. However, this is no longer mandatory.
The small and medium scale industries equity investment scheme reserves are non-distributable. No appropriations was made to the
SMEEIS reserve during the period.
The risk regulatory risk reserves warehouses the difference between the allowance for impairment losses on balance on loans and advances
based on Central Bank of Nigeria prudential guidelines and Central Bank of the foreign subsidiaries regulations, compared with the
expected credit loss model used in calculating the impairment under IFRSs.
This represents the group's share of exchange differences relating to the translation of the results and net assets of the group’s foreign
operations.
Prepayments and other assets
Net fair value loss/(gain) on financial
assets held at fair value through profit
The fair value reserve includes the net cumulative change in the fair value of FVTOCI investments.
Loans and advances to customers
Deposits from customers
Financial assets held at fair value
Reconciliation of profit before tax to
cash generated from operations:
Income tax paid
Gain on disposal of property and
This represents the net liabilty assumed by Polaris Bank Limited in line with its establishment as a bridge bank to assume the assets and
liabilities of Skye Bank Plc. The net liability assumed was transferred to reorganisation reserves.
This represents the non-controlling interest's (NCI) portion of the net assets of the Group.

POLARIS BANK ANNUAL REPORT & FINANCIAL STATEMENTS 2019
148
NOTES TO THE FINANCIAL STATEMENTSFor the year ended 31 December 2019
(All amounts in millions of Naira unless otherwise stated)
39 Related parties
(a) Subsidiaries
(b) Transactions with key management personnel
40 Related party transactions
40.1 Transaction with Parent Company
31 December 31 December
2019 2018
Parent company deposit held within the Bank 14,142 94 Receivable from AMCON 182,593 -
The Group is controlled by the Asset Management Corporation of Nigeria who is also the ultimate parent.
Transactions between Polaris Bank and its subsidiaries also meet the definition of related party transactions.
Where these are eliminated on consolidation, they are not disclosed in the consolidated financial statements but
are disclosed in the books of the Bank.
The Group's key management personnel, and persons connected with them, are also considered to be related
parties. The definition of key management includes the close members of family of key personnel and any entity
over which they exercise control. The key management personnel have been identified as executive and non-
executive directors of the Group as well as their close family members. Close members of family are those family
members who may be expected to influence, or be influenced by that individual in their dealings with Polaris Bank
Ltd and its subsidiaries.
Balances and transactions between the Bank, its parent and its subsidiaries, which are related parties of the Bank,
have been eliminated on consolidation and are not disclosed in this note. Details of transactions between the Group
and other related parties are disclosed below.
Parties are considered to be related if one party has the ability to control the other party or to exercise significant
influence over the other party in making financial and operational decisions, or one other party controls both. The
definition includes subsidiaries, associates, joint ventures and the Group's pension schemes, as well as key
management personnel.
Bank
40.2 Key management compensation
Group Group Bank Bank
31 December 31 December 31 December 31 December
2019 2018 2019 2018
Short-term employee benefits 355 90 355 90
355 90 355 90
The compensation paid to key management is shown below:

POLARIS BANK ANNUAL REPORT & FINANCIAL STATEMENTS 2019
149
NOTES TO THE FINANCIAL STATEMENTSFor the year ended 31 December 2019
(All amounts in millions of Naira unless otherwise stated)
40.3 Companies'/directors' related deposit liabilities
31 December 31 December
2019 2018
Balance, beginning of year 47 28
Deposits received during the year 1,253 1,140
Deposits repaid during the year (1,247) (1,121)
Balance, end of year 53 47
40.4 Subsidiaries deposit account balances
Name of company 31 December 31 December
2019 2018
Mainstreet Bank Estate Company Ltd 15 15
Mainstreet Securities Ltd 2 119
Skye Bank Guinea 365 359
Skye Finance and Investment Limited Dublin 1,251 1,182
1,633 1,675
40.5 Loans and advances to related parties
31 December 31 December
2019 2018
Loans outstanding at 1 January 328,965 288,111
Loans issued during the year 259 30
Exchange difference/Accrued interest Capitalized 30,510 40,842
Loan repayments during the year (16) (18)
Transferred to AMCON (325,371) -
Loans Outstanding as 31 December 2019 34,347 328,965
40.6 Other transactions with related parties
31 December 31 December
2019 2018
Interest income 2 6
Interest expense 84 228
Fee and commission income 1 1
Interest rates charged on balances outstanding are at rates that would be charged in the normal course of business.
Directors (and close family
members)
Directors (and close family
members)
Directors (and close family
members)

NO
TE
S T
O T
HE
FIN
AN
CIA
L S
TA
TE
ME
NT
SFo
r th
e ye
ar
end
ed 3
1 D
ece
mb
er 2
019
PO
LAR
IS B
AN
K A
NN
UA
L R
EP
OR
T &
FIN
AN
CIA
L ST
ATE
ME
NTS
201
9
150
(All a
mounts
in m
illions o
f N
air
a u
nle
ss o
therw
ise s
tate
d)
40
.7In
sid
er
rela
ted
cre
dit
s
31
Decem
ber
20
19
Nam
e o
f co
mp
an
y/
ind
ivid
ual
Nam
e o
f re
late
d in
tere
st
Rela
tio
nsh
ip to
Rep
ort
ing
In
sti
tuti
on
Typ
e A
mo
un
t Lo
an
sta
tus
Co
llate
ral p
erf
ecti
on
sta
tus
Natu
re o
f secu
rity
an
d s
ecu
rity
sta
tus
Abim
bola
Izu
Abim
bola
Izu
Ex-D
irecto
rM
ort
gage L
oan
103
Lost
Not
Applicable
Legal m
ort
gage &
Dom
icilitio
n
Abim
bola
Izu
Abim
bola
Izu
Ex-D
irecto
rTe
rm L
oan
17
Lost
Not
Applicable
Legal m
ort
gage &
Dom
icilitio
n
Dem
anta
Nig
eria L
imited
Mrs
Ibiy
e E
kong
Ex-D
irecto
rC
/A B
al
112
Lost
Not
Perf
ecte
d
Legal m
ort
gage
Dotu
n A
deniy
iD
otu
n A
deniy
iEx-D
irecto
rM
ort
gage L
oan
27
Lost
Not
Applicable
Legal m
ort
gage &
Dom
icilitio
n
Hom
e A
nd Y
ou L
imited
Tokunbo M
. Abir
uD
irecto
rO
verd
raft
0 P
erf
orm
ing
Perf
ecte
d
Debentu
re
Ib.
Ele
ct.
Dis
tr.
Mkt.
Co.
Ltd
Tunde A
yeni
Ex-D
irecto
rC
/A B
al
7 P
erf
orm
ing
Not
Applicable
Fets
Flo
at
Account
Tunde A
yeni
Ex-D
irecto
rC
/A B
al
209
Perf
orm
ing
Not
Applicable
Ibiy
e E
kong
Ibiy
e E
kong
Ex-D
irecto
rM
ort
gage L
oan
4 L
ost
Not
Applicable
Legal m
ort
gage
Ibiy
e E
kong
Ibiy
e E
kong
Ex-D
irecto
rAuto
Loan
4 L
ost
Not
Applicable
Lie
n o
n A
sset
New
cro
ss E
xplo
ration a
nd P
roduction
Jason F
adeyi
Ex-D
irecto
rTerm
Loan
13,0
51
Watc
hlist
Perf
ecte
d
Debentu
re o
n A
ssets
of
the
Com
pany
New
cro
ss E
xplo
ration a
nd P
roduction
Jason F
adeyi
Ex-D
irecto
rC
/A B
al
6,7
47
Watc
hlist
Perf
ecte
d
Debentu
re o
n A
ssets
of
the
Com
pany
Sanni Adebayo L
ate
ef
Sanni Adebayo L
ate
ef
Ex-D
irecto
rM
ort
gage L
oan
73
Lost
Not
Applicable
Legal m
ort
gage &
Dom
icilitio
n
Theodora
Am
aka O
nw
ughalu
Theodora
Am
aka O
nw
ughalu
Ex-D
irecto
rM
ort
gage L
oan
19
Lost
Not
Applicable
Legal m
ort
gage &
Dom
icilitio
n
Tim
oth
y A
O
gunta
yo
Tim
oth
y A
O
gunta
yo
Ex-D
irecto
rM
ort
gage L
oan
100
Lost
Not
Applicable
Legal m
ort
gage &
Dom
icilitio
n
Yedc-E
mcon C
apm
i A/C
Tunde A
yeni
Ex-D
irecto
rC
/A B
al
0 L
ost
Not
Applicable
Legal m
ort
gage &
Dom
icilitio
n
20
,47
3
The
Gro
up
gra
nte
dvari
ous
cre
dit
facilitie
sto
com
panie
sw
hose
dir
ecto
rsare
als
odir
ecto
rsof
Pola
ris
Bank
Plc
.at
rate
sand
term
scom
para
ble
tooth
er
facilitie
sin
the
Gro
up's
port
folio.
An
aggre
gate
of
billion
was
outs
tandin
g o
n t
hese f
acilitie
s a
t th
e e
nd o
f th
e p
eri
od.
This
dis
clo
sure
is in c
om
pliance w
ith t
he r
equir
em
ents
of
the B
ankin
g a
nd O
ther
Fin
ancia
l In
stitu
tions A
ct
(BO
FIA
). T
he t
able
belo
w p
rovid
es f
urt
her
deta
ils:
N20.4
7
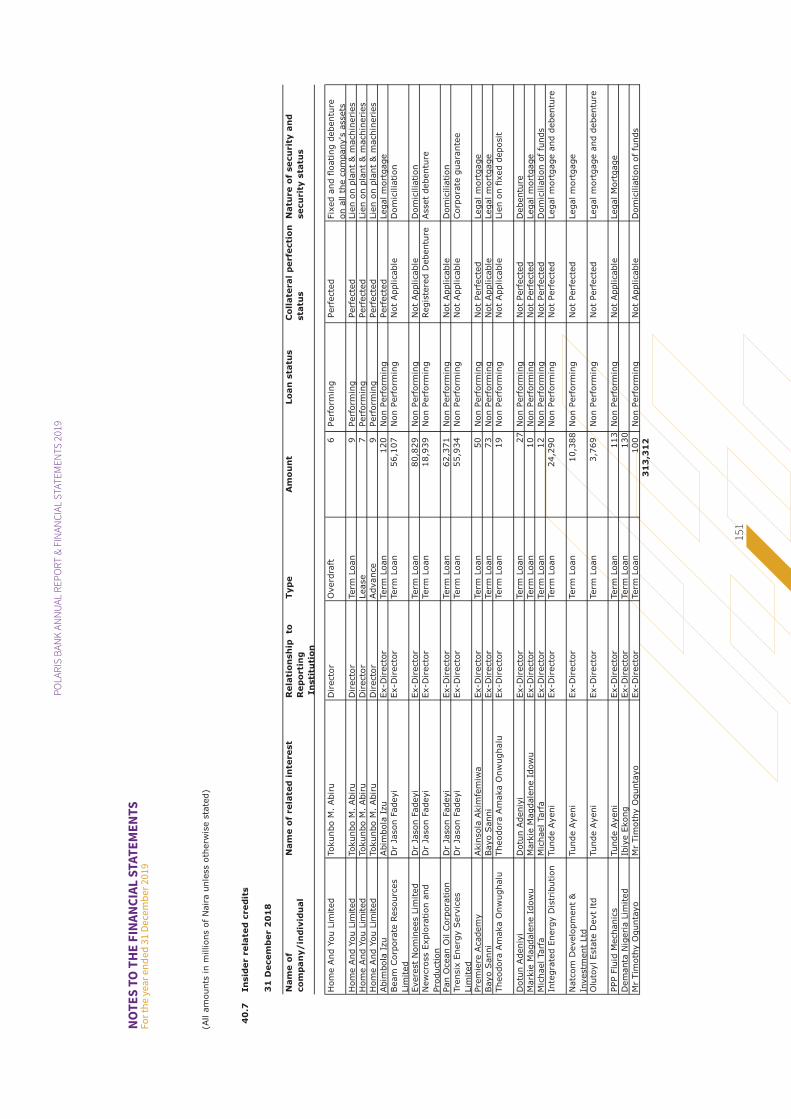
NO
TE
S T
O T
HE
FIN
AN
CIA
L S
TA
TE
ME
NT
SFo
r th
e ye
ar
end
ed 3
1 D
ece
mb
er 2
019
PO
LAR
IS B
AN
K A
NN
UA
L R
EP
OR
T &
FIN
AN
CIA
L ST
ATE
ME
NTS
201
9
151
(All a
mounts
in m
illions o
f N
air
a u
nle
ss o
therw
ise s
tate
d)
40
.7In
sid
er
rela
ted
cre
dit
s
31
Decem
ber
20
18
Nam
e o
f
co
mp
an
y/
ind
ivid
ual
Nam
e o
f re
late
d i
nte
rest
Rela
tio
nsh
ip
to
Rep
ort
ing
In
sti
tuti
on
Typ
eA
mo
un
tLo
an
sta
tus
Co
llate
ral
perf
ecti
on
sta
tus
Natu
re o
f secu
rity
an
d
secu
rity
sta
tus
Hom
e A
nd Y
ou L
imited
Tokunbo M
. Abir
uD
irecto
rO
verd
raft
6
Perf
orm
ing
Perf
ecte
d
Fix
ed a
nd fl
oating d
ebentu
re
on a
ll t
he c
om
pany's
assets
Hom
e A
nd Y
ou L
imited
Tokunbo M
. Abir
uD
irecto
rTerm
Loan
9
Perf
orm
ing
Perf
ecte
d
Lie
n o
n p
lant
& m
achin
eri
es
Hom
e A
nd Y
ou L
imited
Tokunbo M
. Abir
uD
irecto
rLease
7
Perf
orm
ing
Perf
ecte
d
Lie
n o
n p
lant
& m
achin
eri
es
Hom
e A
nd Y
ou L
imited
Tokunbo M
. Abir
uD
irecto
rAdvance
9
Perf
orm
ing
Perf
ecte
d
Lie
n o
n p
lant
& m
achin
eri
es
Abim
bola
Izu
Abim
bola
Izu
Ex-D
irecto
rTerm
Loan
120
Non P
erf
orm
ing
Perf
ecte
d
Legal m
ort
gage
Beam
Corp
ora
te R
esourc
es
Lim
ited
Dr
Jason F
adeyi
Ex-D
irecto
rTerm
Loan
56,1
07
Non P
erf
orm
ing
Not
Applicable
D
om
icilia
tion
Evere
st
Nom
inees L
imited
Dr
Jason F
adeyi
Ex-D
irecto
rTerm
Loan
80,8
29
Non P
erf
orm
ing
Not
Applicable
D
om
icilia
tion
New
cro
ss E
xplo
ration a
nd
Pro
duction
Dr
Jason F
adeyi
Ex-D
irecto
rTerm
Loan
18,9
39
Non P
erf
orm
ing
Regis
tere
d D
ebentu
re
Asset
debentu
re
Pan O
cean O
il C
orp
ora
tion
Dr
Jason F
adeyi
Ex-D
irecto
rTerm
Loan
62,3
71
Non P
erf
orm
ing
Not
Applicable
D
om
icilia
tion
Tre
nsix
Energ
y S
erv
ices
Lim
ited
Dr
Jason F
adeyi
Ex-D
irecto
rTerm
Loan
55,9
34
Non P
erf
orm
ing
Not
Applicable
Corp
ora
te g
uara
nte
e
Pre
mie
re A
cadem
yAkin
sola
Akim
fem
iwa
Ex-D
irecto
rTerm
Loan
50
Non P
erf
orm
ing
Not
Perf
ecte
d
Legal m
ort
gage
Bayo S
anni
Bayo S
anni
Ex-D
irecto
rTerm
Loan
73
Non P
erf
orm
ing
Not
Applicable
Legal m
ort
gage
Theodora
Am
aka O
nw
ughalu
Theodora
Am
aka O
nw
ughalu
Ex-D
irecto
rTerm
Loan
19
Non P
erf
orm
ing
Not
Applicable
Lie
n o
n fi
xed d
eposit
Dotu
n A
deniy
iD
otu
n A
deniy
iEx-D
irecto
rTerm
Loan
2
7 N
on P
erf
orm
ing
Not
Perf
ecte
d
Debentu
re
Mark
ie M
agdale
ne I
dow
uM
ark
ie M
agdale
ne I
dow
u
Ex-D
irecto
rTerm
Loan
10
Non P
erf
orm
ing
Not
Perf
ecte
d
Legal m
ort
gage
Mic
hael Ta
rfa
Mic
hael Ta
rfa
Ex-D
irecto
rTerm
Loan
12
Non P
erf
orm
ing
Not
Perf
ecte
d
Dom
icilia
tion o
f fu
nds
Inte
gra
ted E
nerg
y D
istr
ibution
Tunde A
yeni
Ex-D
irecto
rTerm
Loan
24,2
90
Non P
erf
orm
ing
Not
Perf
ecte
d
Legal m
ort
gage a
nd d
ebentu
re
Natc
om
Develo
pm
ent
&
Investm
ent
Ltd
Tunde A
yeni
Ex-D
irecto
rTerm
Loan
1
0,3
88 N
on P
erf
orm
ing
Not
Perf
ecte
d
Legal m
ort
gage
Olu
toyl Esta
te D
evt
ltd
Tunde A
yeni
Ex-D
irecto
rTerm
Loan
3,7
69
Non P
erf
orm
ing
Not
Perf
ecte
d
Legal m
ort
gage a
nd d
ebentu
re
PPP F
luid
Mechanic
sTunde A
yeni
Ex-D
irecto
rTerm
Loan
1
13 N
on P
erf
orm
ing
Not
Applicable
Legal M
ort
gage
Dem
anta
Nig
eri
a L
imited
Ibiy
e E
kong
Ex-D
irecto
rTerm
Loan
1
30
Mr
Tim
oth
y O
gunta
yo
Mr
Tim
oth
y O
gunta
yo
Ex-D
irecto
rTerm
Loan
100
Non P
erf
orm
ing
Not
Applicable
D
om
icilia
tion o
f fu
nds
31
3,3
12

POLARIS BANK ANNUAL REPORT & FINANCIAL STATEMENTS 2019
152
NOTES TO THE FINANCIAL STATEMENTSFor the year ended 31 December 2019
(All amounts in millions of Naira unless otherwise stated)
40.8 Risk assets outstanding
Directors' off balance-sheet engagement
Name of
company/Individual
Name of related interest Type Loan status Collateral
perfection
status
Nature of security
and security status
31
December
2019
31
December
2018
Home and You Mr. Tokunbo Abiru Bank Guarantee Performing Not perfected Legal mortgage 181 131
Ibadan Electricity Distribution
Co
Mr. Tunde Ayeni Bank Guarantee Lost N/A Cash backed 10,980 10,980
Yola Electricity Distribution
Co
Mr. Tunde Ayeni Bank Guarantee Lost N/A Guarantee 2,715 2,715
Metropolitan Construction
Coy Ltd
Alh. Musiliu Smith Advance Payment
Guarantee
- 819
Natcom Development &
Investment Ltd
Mr. Tunde Ayeni Bank Guarantee - 1,010
13,876 15,655
41 Contingent liabilities and commitments
41.1 Legal proceedings
41.2 Capital commitments
41.3
Group Group Bank Bank
31 December 31 December 31 December 31 December
2019 2018 2019 2018
Performance bonds and 50,427 40,356 50,427 40,356
Letters of credit 4,418 2,187 4,418 2,187
54,845 42,543 54,845 42,543
In the normal course of business, the Group is party to financial instruments with off-balance sheet risk - acceptances, performance bonds and indemnities. The
instruments are used to meet the credit and other financial requirements of customers.
Guarantees and letters of credit are given as security to support the performance of a customer to third parties. As the Group will only be required to meet these
obligations in the event of the customer’s default, the cash requirements of these instruments are expected to be considerably below their nominal amounts.
Other contingent liabilities include transaction related customs and performances bond and are, generally, commitments to third parties which are not directly
dependent on the customer’s creditworthiness. Documentary credits commit the Group to make payments to third parties, on production of documents, which are
usually reimbursed immediately by customers. The following tables summarises the nominal principal amount of contingent liabilities and commitments.
Off-balance sheet engagements
There were contingent liabilities in respect of claims and litigations against the Group as at 31 December 2019 amounting to billion. These claims arose in
the normal course of business and are being contested by the Group. The solicitors of the Group are of the view that probable liability which may arise from the
cases pending against the bank is not likely to exceed N 7.8 billion. This probable liability has been fully provided for. (Please refer to note 35)
At the balance sheet date, the Group had no capital commitments in respect of authorized and contracted capital projects for information technology equipment
and software.
N212

POLARIS BANK ANNUAL REPORT & FINANCIAL STATEMENTS 2019
153
NOTES TO THE FINANCIAL STATEMENTSFor the year ended 31 December 2019
(All amounts in millions of Naira unless otherwise stated)
42 Statement of prudential adjustment
Total impairment Total Total impairment Total
Provision per CBN Guidelines 70,007 70,007 254,579 254,579
Impairment allowance per IFRS 100,607 100,607 226,662 226,662
Amount required in regulatory risk reserve - - 27,917 27,917
43 Events after the reporting period
43.1
43.2
Regulatory Body
Central Bank of Nigeria
Central Bank of Nigeria
43.3
The reconciliation between the CBN recommended provisions and that under IFRS is as shown in the table below:
The new Finance Act was signed into law on 13th January 2020 and is the basis upon which the Bank's tax was calculated.
20182019
Contraventions of the Banks and Other Financial Institutions Act of Nigeria and CBN circulars
Sum of N2 million relating to failure of the bank to implement
two of the prior year's recommendations from the external
auditor's management letter.
Sum of N4 million relating to the bank writing-off an insider
related loan to Onas Farms Limited without CBN approval.
Infraction
For the contraventions mentioned above, the bank was fined in year 2020
A novel strain of coronavirus (COVID-19) that first surfaced in China was classified as a pandemic by the World Health Organization
on March 11, 2020, impacting countries globally. The potential impacts from COVID-19 remain uncertain, including, among other
things, on economic conditions, businesses and consumers.
The Nigerian financial industry is committed to preserving confidence, financial stability and support for the economy. The Central
Bank has committed over N3.5 trillion in stimulus and various moratorium arrangements for loans to the Nigerian economy to
ameliorate the pains arising from the COVID-19 health and economic crisis. The Federal Government and the private sector have also
committed to provide support required to raise public awareness as well as the resources to combat this deadly disease.
The Bank plans to restructure certain credit facilities in line with pronouncement of the Central Bank of Nigeria . Also in the short
term, the Bank would only continue to advance credit facilities to companies whose services have been defined as essential by the
government.
The directors of the Bank are confident that the Bank will continue to operate in the forseeable future as the banking activities are
essential. The Bank continues to operate and serve its customers.

POLARIS BANK ANNUAL REPORT & FINANCIAL STATEMENTS 2019
154
NOTES TO THE FINANCIAL STATEMENTSFor the year ended 31 December 2019
(All amounts in millions of Naira unless otherwise stated)
44 Segment reporting
44.1 Operating segments by business segment
Retail banking
Commercial banking
Treasury, Corporate and Investment banking
The Bank is divided into three main business segments, as described below, which are the Bank's strategic
business units. The strategic business units offer varied products and services and are managed separately based
on the Bank Management's structure.
Operating segments are reported in accordance with the internal reports provided to the Bank's Executive
Management Committee which is responsible for allocating resources to the operating segments and assessing its
performance.
Retail banking incorporates private banking services, private customer current accounts, deposits, investment
savings products, custody, credit and debit cards, consumer loans and mortgages.
Commercial banking incorporates direct debit facilities, current accounts, deposits, overdrafts, loan and other
credit facilities, foreign currency and derivative products.
Treasury, corporate and investment banking incorporates financial instruments trading, structured financing and
corporate leasing.
No single external customer accounts for 10% or more of the Bank’s revenue.
Information regarding the results of each reportable segment is included below. Performance is measured based
on segment profit before income tax, as included in the internal management reports that are reviewed by the
Executive Management Committee. Segment profit is used to measure performance as management believes that
such information is the most relevant in evaluating the results of certain segments relative to other entities that
operate within these industries. Inter-segment pricing is determined on an arm’s length basis.
The measurement policies the Bank uses for segment reporting are the same as those used in its financial
statements. There have been no changes from prior periods in the measurement methods used to determine
reported segment profit or loss.

(All amounts in millions of Naira unless otherwise stated)
Bank
31 December 2019Treasury
corporate
Retail
banking
Commercial
banking
Total
Revenue:Derived from external customers 51,269 42,349 57,230 150,848
Derived from other business segments - - - -
Total revenue 51,269 42,349 57,230 150,848
Interest expenses (8,596) (12,746) (24,472) (45,814)
Fee and commission
expenses
(688) (1,438) (1,141) (3,267)
Net Operating Income 41,985 28,165 31,617 101,767
Expense:Employee benefit and compensation cost (5,582) (11,627) (9,219) (26,428)
Administration and general expenses (6,527) (11,939) (10,397) (28,863)
(11,901) (463) (1,762) (14,126)
(865) (2,039) (1,617) (4,521)
Total cost (24,875) (26,068) (22,995) (73,938)
17,109 2,097 8,622 27,829
Income tax expense (294) (37) (148) (479)
16,815 2,060 8,474 27,350
AssetsLoans and advances to customers 63,875 25,013 99,851 188,738
Others 921,617 14,146 18,765 954,528
Total assets 985,492 39,159 118,616 1,143,266
LiabilitiesDeposits from customers 59,759 385,518 412,609 857,885
Others 96,797 3,662 101,933 202,392
Total liabilities 156,556 389,180 514,542 1,060,277
Revenue is made up of : 131,650
Interest income on fair value through profit/loss 1,961
Net fee and commission 11,803
Other operating income 4,484
Net trading and foreign 950
150,848
Loan impairment charges and impairment charges
on other financial assets
Depreciation and amortisation
Profit before income tax from reportable segments
Profit after income tax from reportable
segments
Interest income on amortized cost financial assets
POLARIS BANK ANNUAL REPORT & FINANCIAL STATEMENTS 2019
155
NOTES TO THE FINANCIAL STATEMENTSFor the year ended 31 December 2019

POLARIS BANK ANNUAL REPORT & FINANCIAL STATEMENTS 2019
156
NOTES TO THE FINANCIAL STATEMENTSFor the year ended 31 December 2019
(All amounts in millions of Naira unless otherwise stated)
Other National Disclosures
31
December
31
December
31
December
31
December
Group 2019 % 2019 % 2018 % 2018 %
Gross income 150,361 150,848 37,392 37,392
Interest expense (45,814) (45,814) (15,212) (15,212)
104,547 105,034 22,180 22,180
Administrative overheads:
- Local (32,130) (32,130) (9,215) (9,215)
- Foreign - - - -
Value added 72,417 72,904 12,965 12,965
Distribution
Employees
- Wages & salaries and other staff cost 26,428 36% 26,428 36% 6,606 51% 6,606 51%
Government
- Taxation 479 1% 479 1% 25 0% 25 0%
The future
- Asset replacement (depreciation) 4,290 6% 4,290 6% 1,012 8% 1,012 8%
- Local
- Asset replacement (amortisation) 231 0% 231 0% 95 1% 95 1%
- Local
- Impairment loss 14,126 20% 14,126 19% 2,796 22% 2,796 22%
- Expansion (transfers to reserves) 26,863 37% 27,350 38% 2,431 19% 2,431 19%
72,417 100% 72,904 100% 12,965 100% 12,965 100%
Group BankGroup Bank

157

MANAGEMENT
TEAM
158

POLARIS BANK ANNUAL REPORT & FINANCIAL STATEMENTS 2019
159
MANAGEMENT
team
1
2
3
4
5
6
7
8
9
10
11
12
13
14
15
16
17
18
1920
21
2223
24
2526
27
2829
30
First Name
Adetokunbo
Innocent
Abdullahi
Segun
Femi
Kolade
Olurotimi
Charles
Charles
Babatunde
Olufemi
Pius
Titi
HassanAdebimpe Oluwabunmi
Ayobamidele Abayomi
Taiwo
Anthony U
Chukwuma PatrickRaphael
Peter
OsazuwaRasheed Adesoye
Olusegun Nelson
RotimiOlayemi
Kayode
OlayinkaOmoyele
Ajodo Egbunu
Surname
Abiru
Ike
Mohammed
Opeke
Aribaloye
Ojo-osagie
Omotayo
Udogu
Oso
Osibodu
Olanihun
Olaoye
Abiodun
Umar
Ihekuna
Adeyinka
Olupeka
Anichebe
UmunnaAbiaziem
Falohun
IgbinobaYusuf
Tawoju
AwosikaNasiru
Oladipo
ObikanyeAdewole
Ocheja
Grade
MD/CEO
ED
ED
GM
GM
GM
GM
DGM
DGM
DGM
DGM
DGM
DGM
DGM
DGM
DGM
AGM
AGM
AGMAGM
AGM
AGMAGM
AGM
AGMAGM
AGM
AGMAGM
AGM
Branch
Head Office
Head Office
Head Office
Head Office
Head Office
Head Office
Head Office
Head Office
Head Office
Head Office
Head Office
Head Office
Head Office
Head Office
Head Office
Head Office
Head Office
Head Office
Head OfficeHead Office
Head Office
Head OfficeHead Office
Head Office
Head OfficeHead Office
Head Office
Head OfficeHead Office
Head Office
Department
Executive Office
Technology & Services
Commercial Banking
Commercial Banking
Enterprise-Wide Risk Management
Commercial Banking
Internal Audit Group
Commercial Banking
Loan Recovery & Remedial AssetsCompany Secretariat
Commercial Banking
Financial Control
Resources Group
Commercial Banking
Products & Markets Development
Digital Banking Group
Human Capital Management
Commercial Banking
Commercial BankingCommercial Banking
Risk Management Group
Commercial BankingCommercial Banking
Legal
Internal Control GroupInternal Audit Group
Commercial Banking
Commercial BankingTreasury
Corporate Banking Group
Job Function
Managing Director/CEO
Executive Director, Technology & Services
Executive Director, Abuja & Northern BusinessDirectorate Head, Lagos Business
Directorate Head, Enterprise-Wide Risk ManagementDirectorate Head, South-West & Kwara Business
Chief Internal Auditor
Group Head, South-East 2 Business Area
Acting Chief Compliance Officer
Company Secretary/Legal Counsel
Group Head, Ikeja/Lagos Public Sector BusinessChief Financial Officer
Group Head, Resources Group
Group Head, North-West Group I
Group Head, Products & Markets Developments
Chief Digital Officer
Group Head, Human Capital Management
Group Head, South East I
Group Head, Apapa BusinessGroup Head, South-South Business Area
Risk Management Group
Group Head, AbujaGroup Head, South West II
Head, Legal Services
Group Head, Internal ControlHead, Branch and HO Field Audit
Group Head, Island Business
Group Head, North-EastAg. Treasurer
Group Head, Corporate Banking Group
Group Head, Branch Coordination
Group Head, North-Central BusinessHead, Lagos Public Sector I
Ag. Chief Information Officer
Group Head, South West IGroup Head, Ibadan Business Area
Head, Lagos Public Sector II
Head, SME Banking & Money Transfer
Group Head, Delta Business Area
Head, IT Services & Operations
Group Head, Edo Business Area
Head, Domestic Operations & Ag. Group Head, Central Operations
Branch Coordination
Commercial BankingPublic Sector Group
Information Technology
Commercial BankingCommercial Banking
Public Sector Group
Products & Market Development.Commercial Banking
Information Technology
Commercial Banking
Domestic Operations
Head Office
Head OfficeHead Office
Head Office
Head OfficeHead Office
Head Office
Head Office
Head Office
Head Office
Head Office
Head Office
AGM
AGMAGM
AGM
AGMSM
SM
SM
SM
SM
SM
SM
Obitayo
AbdulsalamAmbode
Nnoli
AkoredeOgidan
Ashiru
Faleye
Ofili
Ogunnubi
Emeribe
Ayinuola
Tolulope
IshakaOlufemi
Tagbo
Abimbola AliAdebukola
Olanrewaju Bankole
Lekan
Veronica Z
Israel
Chinyere L
Tunde Folorunso
31
3233
34
3536
37
38
39
40
41
42

POLARIS BANK ANNUAL REPORT & FINANCIAL STATEMENTS 2019
160
Loan Recovery & Remedial Assets
Country MD, Skye Bank Guinea
Head, Corporate Banking Oil & Gas/Telecomms
Group Head, International OperationsExecutive Assistant to the GMD/CEO
Group Head, North-West Group II
Group Head, Mainland BusinessTeam Lead, Agencies & Parastatals
Head, Strategic Brand Management
Chief Credit Officer
Head. Customer Experience Management / Ag. Head, Corporate Planning & StrategyHead, E-Business
Head, Digital Banking Unit/Agile Coach
Head, Revenue Collections & Franchise
Head, IT Governance & Enterprise Architecture
Loan Recovery & Remedial Assets
International Subsidiaries
Corporate Banking Group
International OperationsExecutive Office
Commercial Banking
Commercial BankingPublic Sector Group
Strategic Brand ManagementRisk Management Group
Corporate Planning & Strategy
Business
Digital Banking Group
Revenue Collections
Information Technology
E-
Head Office
Guinea
Head Office
Head OfficeHead Office
Head Office
Head OfficeHead Office
Head Office
Head Office
Head Office
Head Office
Head Office
Head Office
Head Office
SM
SM
SM
SMSM
SM
SMSM
SM
SM
SM
SM
SM
SM
SM
Aworekun
Akinbamidele
Alu
AdesanyaFolahan
Badru
Richard-edetSoyannwo
Ezurike
Idowu
Oluyadi
Alli
Daniels
Isiaka
Phillips
Oluwatosin Luqman
Abimbola
Adetutu
AyotundeIsaac
Muntaka Ahmed
VivianAwujoola Yewande
Nduneche
Hakeem Abayomi
Bukola
Abiodun
Peter AkinolaAdekunle Tajudeen
Olusegun Bamidele
43
44
45
4647
48
4950
51
52
53
54
55
56
57

PRODUCTS &
SERVICES
161

POLARIS BANK ANNUAL REPORT & FINANCIAL STATEMENTS 2019
162
DIGITAL BANKING
products
CARDS
VERVE DEBIT CARD
The Polaris Bank Verve Card is a Naira denominated card. The card is issued to customers in mass
market segment. It is linked to the cardholders current and/or saving account and allows the
cardholder spend directly from his account.
Transaction Daily Limits Charges
Withdrawals NGN 150,000 within Nigeria
Free on Polaris ATMs, First 3 withdrawals on
other ATMs are free every month, N65
charge for every other withdrawal
Point of Sale NGN 1,000,000 Within Nigeria Free
Online NGN 500,000 Within Nigeria Free
NAIRA DEBIT CARD (STANDARD AND GOLD)
The Polaris Bank Debit Card is globally accepted as a means of payment at over 24 million merchant
locations and over one million ATMs worldwide in more than 220 countries.
The card is issued to customers in all other account segments except the mass affluent. It is linked to
the cardholders current and/or saving account and allows the cardholder spend directly from his
account.
It can be used to make payments on the all channels that is ATM, POS and Online
Debit Standard Mastercard
Visa Classic NGN Debit
Visa Gold USD Debit
Transaction Daily Limits Charges
Withdrawals NGN 160,000 within Nigeria
Point of Sale NGN 1,000,000 Within Nigeria Free
Online NGN 500,000 Within Nigeria Free
Free on Polaris ATMs, First 3 withdrawals on
other ATMs are free every month, N65
charge for every other withdrawal

POLARIS BANK ANNUAL REPORT & FINANCIAL STATEMENTS 2019
163
DIGITAL BANKING PRODUCTS
MASTERCARD PLATINUM NAIRA DEBIT CARD
The MasterCard Platinum debit card is a Naira denominated card, linked directly to a customers
current or savings account. The card is issued to customers in the Mass Affluent segments and
provides customers with higher spend limits among other benefits.
The product feature is benchmarked against global standards with very competitive pricing.
Transaction Daily Limits Charges
Withdrawals NGN 150,000 within Nigeria
Free on Polaris ATMs, First 3 withdrawals on
other ATMs are free every month, N65
charge for every other withdrawal
Point of Sale NGN 1,000,000 Within Nigeria Free
Online NGN 500,000 Within Nigeria Free
PREPAID CARDS
Polaris Xplorer prepaid card is a Naira denominated card that is pre-loaded with customer’s funds
and can only be used locally in Nigeria.
It is not directly linked to a customers current or savings account, but linked to an internal float
account used to hold the funds loaded on the card.
The card is issued in partnership with organizations and businesses. Hence, the card can be a co-
brand, carrying logos and trademarks of both Polaris and partnering business.
Features of the prepaid cards:• In–Store loyalty card
• Fuel card to monitor fuel expenses by an organization
• Gi� card/affinity card as rewards to customers
• Club/Membership card and access card
• Student and Staff ID cards
VISA NAIRA CREDIT CARD The Polaris Naira credit card is an internationally accepted card with a revolving credit limit. It is a
convenient means of paying for goods and services. The Polaris Naira Credit card is offered in the
following variants:
Visa Classic Naira Credit Card:for individuals whose net monthly salary is between N250,000 and N749,000
Visa Gold Naira Credit Card:for individuals whose net monthly salary is between NGN750,000 and NGN1,249,000
Visa Platinum Credit Card: for individuals whose net monthly salary is NGN1,250,000 and above
VISA CLASSIC NAIRA CREDIT CARD:
VISA GOLD NAIRA CREDIT CARD:
VISA PLATINUM CREDIT CARD
Card Scheme Visa
Validity Period 3 YearsInterest Free Period 45 days
Currency Naira
CollateralSalary domiciliation
Repayment options
10% monthly minimum
Target Market Salary earners
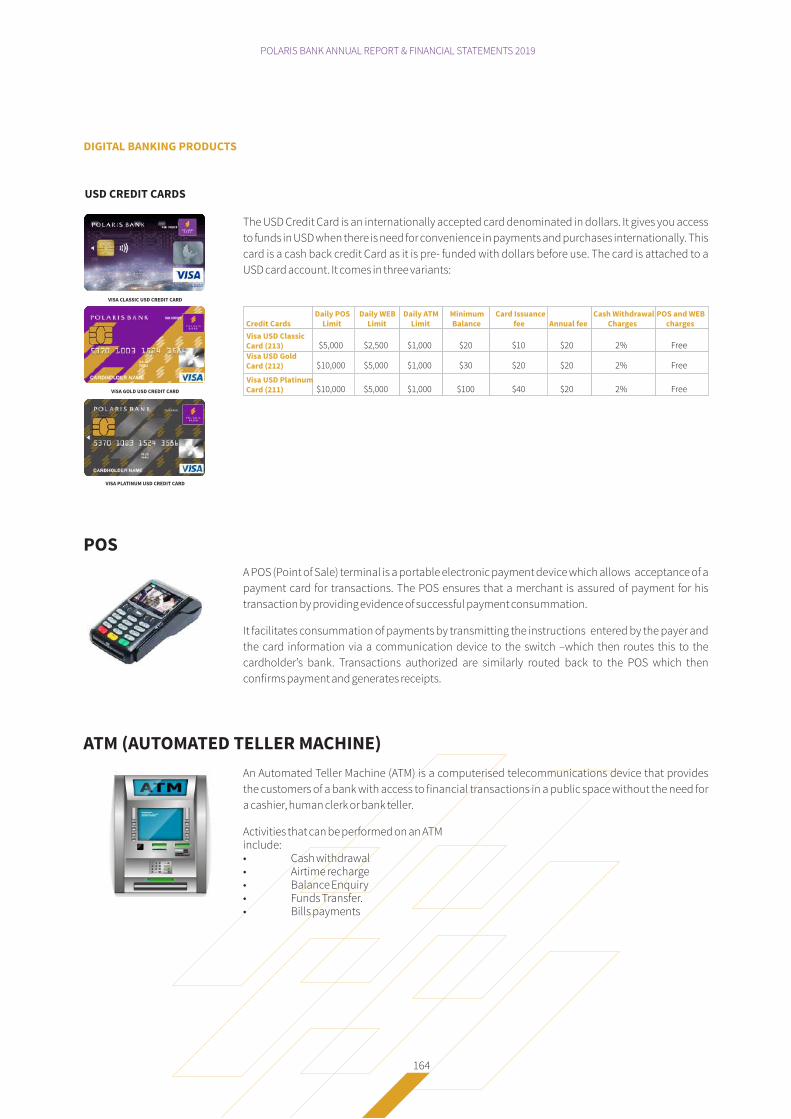
POLARIS BANK ANNUAL REPORT & FINANCIAL STATEMENTS 2019
164
DIGITAL BANKING PRODUCTS
USD CREDIT CARDS
The USD Credit Card is an internationally accepted card denominated in dollars. It gives you access
to funds in USD when there is need for convenience in payments and purchases internationally. This
card is a cash back credit Card as it is pre- funded with dollars before use. The card is attached to a
USD card account. It comes in three variants:
VISA CLASSIC USD CREDIT CARD
VISA GOLD USD CREDIT CARD
VISA PLATINUM USD CREDIT CARD
Credit Cards Daily POS
LimitDaily WEB
LimitDaily ATM
LimitMinimum Balance
Card Issuance fee Annual fee
Cash Withdrawal Charges
POS and WEB charges
Visa USD Classic Card (213) $5,000 $2,500 $1,000 $20 $10 $20 2% FreeVisa USD Gold Card (212) $10,000 $5,000 $1,000 $30 $20 $20 2% Free
Visa USD Platinum Card (211) $10,000 $5,000 $1,000 $100 $40 $20 2% Free
POS
A POS (Point of Sale) terminal is a portable electronic payment device which allows acceptance of a
payment card for transactions. The POS ensures that a merchant is assured of payment for his
transaction by providing evidence of successful payment consummation.
It facilitates consummation of payments by transmitting the instructions entered by the payer and
the card information via a communication device to the switch –which then routes this to the
cardholder’s bank. Transactions authorized are similarly routed back to the POS which then
confirms payment and generates receipts.
ATM (AUTOMATED TELLER MACHINE)
An Automated Teller Machine (ATM) is a computerised telecommunications device that provides
the customers of a bank with access to financial transactions in a public space without the need for
a cashier, human clerk or bank teller.
Activities that can be performed on an ATMinclude:• Cash withdrawal• Airtime recharge • Balance Enquiry• Funds Transfer.• Bills payments

POLARIS BANK ANNUAL REPORT & FINANCIAL STATEMENTS 2019
165
DIGITAL BANKING PRODUCTS
PolarisMobile
PolarisMobile is a secure, flexible and innovative mobile banking solution enriched with
personalized features to meet customers’ daily banking needs on the go.
Target Market: All retail customers (with smart phones)
This new Mobile App is built to be SAFER. Secure. Available. Flexible. Easy. Reliable
Features of Platform
Registration Options:. Account. Debit Card. In-BranchNote: Registration is FREE!!!
Limit Increase (up to N5m) :. Debit Card . In-Branch. Token
Account Overview:. All accounts linked
to same CIF. Hide/Show Balance (under Profile
Settings)
Send Money:. To Polaris Bank. Other Banks
(including MFBs, PMBs
etc)
Open AccountSME Enrolment
Registration Options:. Airtime Top-up. Data Top-up
Bills Payment. Utilities . Cable TV. Lotteries & Betting. Over 1,000 others
Locations:. Polaris ATMs . Polaris Branches
Receipts:. Download. MyBank Statement. Share via social
media
Block Cards
Stop Cheques

SurePadi is the Bank’s Agent Banking channel used to: expand demand for banking services;
(customer acquisition) decongest bank branches; reduce the cost to serve; and achieve financial
inclusion. It also holds a promise of a low-cost means of market penetration by banks and other
financial institutions, especially into the rural areas.
POLARIS BANK ANNUAL REPORT & FINANCIAL STATEMENTS 2019
166
DIGITAL BANKING PRODUCTS
The bank’s USSD Platform to perform electronic transactions without internet
Existing Features
. Buy Airtime/Data
. Send Money
. PayDay Loans
. Pay Bills
. Check Balance
. Block Account
. Change/Forget PIN
. Opt in/Opt out
. Default daily limit – N20k
. Increased daily limit (up to N100k) with 2FA – Token/last 6 digits of Card PAN
. WAEC/JAMB PIN (Note: This is a seasonal service)
PolarisXperience
PolarisXperience is the online Banking solution of the Bank that enables single-view of a
customer’s entire banking world. Benefits. Convenient. Easy to use. Safe and secure. Consistent customer experience across multiple devices. Reliability. Simplicity
Service Offerings. Transfers (Inter/ Intra) & Int’l transfers through FX direct. Airtime Top–up ( Self and third party). Bills Payment. Mini Statement. Set up standing instructions for periodic transfers. Block lost/stolen cards. Stop Cheque
Agent Banking

POLARIS BANK ANNUAL REPORT & FINANCIAL STATEMENTS 2019
167
DIGITAL BANKING PRODUCTS
PolarisPayx
This is a Web-based, online real-time Electronic Payment processing platform that facilitates intra-
bank and inter-bank payments. The solution provides an efficient and effective online real-time
platform for managing instant debit and credit transactions and suitable for staff salary payments,
contractor payments, supplier payments, standing order payments and host of bulk payments,
subscriptions and fees. This solution will enable your organization make bulk or individual
payments to beneficiaries across Nigerian Banks with instant credit.
Features and benefits
. PolarisPayx provides an efficient and effective online real-time platform for managing
payments to one or many beneficiaries.
. Accounts can be credited irrespective of bank where they are domiciled
. Real-time online reporting of transaction status
. The solution offers ease of transacting for organizations by enabling them pay
employees, suppliers and other creditors from the comfort of their offices without issuing
cheques
. It saves time, reduces the costs of administration and ensures immediate credit to
beneficiaries
. It eradicates the challenges associated with returned cheques and reduces considerably
the administrative activities and errors involved in cheque management
. Highly secured payment platform
Aggregate Payment Gateway
Offers a consolidation of all major payment gateways (Interswitch Web, Paystack Web, Flutterwave
Rave and Quickteller Instant Transfer) into one universal and simplified platform. It allows
Merchants and Developers access to all the payment gateways from the single connection API
provided.
This means web merchants are able to switch based on pricing, settlement, international
acceptance or support from the providers. APG will also be attractive to other bank’s customers
since they don’t need to have an account with the bank for the integration and it will also open up a
business opportunity to cross sell the bank’s other products to these categories of merchants.

POLARIS BANK ANNUAL REPORT & FINANCIAL STATEMENTS 2019
168
DIGITAL BANKING PRODUCTS
College PayCollegePay is a collection, monitoring and reporting solution deployed to Schools to receive
payments from their students across various bank branches nationwide.
It is used to facilitate payments of school fees and other related payments to schools via various
channels (web, bank branch, ATM, POS) on the Interswitch network.
With CollegePay, students can make payments using cash, cheques, internal transfers, bank dra�s
at the bank branch; debit and prepaid cards on the web & ATM channels.
The Schools can log into the reporting portal and view all payments from a single source/ view
immediately they are paid irrespective of the bank or branch where the payment was made.
Polaris Open APIOpen API is a product of the Bank that provides third-party financial service providers safe access to
consumer banking, transaction, and other financial data from the banks and non-financial
institutions through the use of a standardized set of APIs. This platform allows us to provide
requisite solution to Fintechs and third party in a secure and controlled manner so that they can
innovate more, leveraging our services and we generate revenue in turn
Polaris CollectPolaris collect is an online real-time electronic collection platform that facilitates collections across
all Polaris bank branches nationwide. It is fully scalable and can be customized for your
organization. Payments made at bank Synchronizes with a central transaction reporting portal
where your organization can view reports and ascertain payments made.
The Polaris Collect platform will provide accurate information to your organization as it pertains to
what Payment was made, who paid, where it was paid, when it was paid, who received the payment
and how much was paid at every point in time. Payment information will also be available for
viewing online real-time via a web based access granted to authorize users at customer’s
organization
Features and Benefits
. Online real-time consolidated report of all payments made across all Polarisbank
branches
. The reports can be downloaded for internal reconciliation
. The solution provides an audit trail and a log of all successful transactions
. E-receipt generation
. Guarantees Complete financial control
. Highly secured collections solution

POLARIS BANK ANNUAL REPORT & FINANCIAL STATEMENTS 2019
169
LIABILITY
products
POLARIS WISE ACCOUNT
This is a high yield hybrid-savings account that enables
customers enjoy higher interest rate, subject to maintenance of a
minimum balance.
Target Market. Civil servants . Businessmen . Lawyers . Medical Doctors. Other prospects in the emerging middle class segment
Benefits/Features. Minimum opening and operating balance of N10,000. Interest rate of 4.5% p.a. on accounts with average
monthly balance of N100,000 & above.. Default interest rate of 4.05% p.a. on accounts with
average monthly balances below N100,000.. Maximum of 3 withdrawals monthly; Interest forfeiture
if withdrawal exceeds three (3) times in a month. Acceptance of other bank cheques above N2million
with references; and below N2million without
references. Debit card issuance. Non-clearing Cheque book issuance. Access to e-channel platforms.
ACCOUNT OPENING DOCUMENTATION. Account opening form. Signature mandate card. 1 passport photograph. Valid means of identification (Int'l passport, Driver’s
license, National ID, Voter’s card). Utility bill (PHCN, Water bill, Waste disposal bill,
tenement, etc.). Resident permit (for expatriates). Reference forms (for cheques above N2million). Premises visitation report. Bank Verification Number (BVN) of Applicant.
POLARIS PEARL ACCOUNT
This is a gender based product designed to cater to the banking
needs of the ever yday woman with special focus on
Professionals, Entrepreneurs and Home makers. The account
can be opened as Savings or Current.
Target Market. Professional women. Women in business. Home makers
Benefits/Features
SAVINGS:. Zero opening and operating balance. Default savings interest rate of 4.05%. Maximum of 4 withdrawals monthly; Interest forfeiture
if withdrawal exceeds four (4) times in a month. Issuance of customized debit cards . Access to Polaris merchant discounts at dedicated
stores. Access to Polaris Women Online community platform. Access to loans. Access to e-channel platforms.
CURRENT:. Minimum opening balance of N5,000. Zero operating balance. Discounted CAM fee of 50k/mille. Customized Visa Signature card available on request. Access to Polaris merchant discounts at dedicated
stores. Access to Polaris Women Online community platform. Access to loans. Access to e-channel platforms. Customized cheque book available on request.
POLARIS BANK ANNUAL REPORT & FINANCIAL STATEMENTS 2019
170
LIABILITY PRODUCTS
POLARIS SELECT ACCOUNT - CURRENT
This is a premium banking product designed for high net worth
customers, with monthly income of N750,000 and above.
Target Market. High Net Worth Individuals. Individuals that embark on frequent foreign trips and
vacations. Middle to upper-middle level managers and
professionals.. High ranking civil/public servants.
Benefits/Features. Minimum opening balance of N200,000.00. Zero operating balance. Zero Account Maintenance Charge on balances of
N200,000 and above. . CAM fee of N1/per mille on accounts with balances less
than N200,000.. No limit on number of monthly withdrawals.. Free Priority Pass Membership with 2 free lounge
usages at over 1,000 Airport lounges in the world.. Advisory services.. Access to Visa Signature Card (on invitation). Card issuance - Master Card Platinum Debit Card/Visa. Clearing cheque book issuance. Access to e-channel platforms.
ACCOUNT OPENING DOCUMENTATION. Account opening form. Signature mandate card. 1 passport photograph. Valid means of identification (Int'l passport, Driver’s
license, National ID, Voter’s card) Utility bill (PHCN,
Water bill, Waste disposal bill, Tenement, etc.). Resident permit (for expatriates). Reference forms. Premises visitation report. Bank Verification Number (BVN) of Applicant.
No limit on
number
of monthly
withdrawals.

POLARIS BANK ANNUAL REPORT & FINANCIAL STATEMENTS 2019
171
SME
banking
POLARIS BUSINESS ADVANTAGE ACCOUNT - CURRENT
This is a current account specially designed for SMEs to provide
them banking services and solutions to nurture their business for
growth.
Target MarketSmall & Medium Enterprises.
Benefits/Features. Account opening balance of N10,000. Zero minimum operating Balance. Account Maintenance Charge of N1/mille on all debit
transactions. Free Polaris Business Sales record book. Access to business loans. Dedicated Relationship Manager. Access to Internet banking.
POLARIS BUSINESS ADVANTAGE ACCOUNT - EXCEL
This is a premium business account for SMEs with monthly
turnover limit of N500million and above.
Target MarketSMEs with monthly turnover limit of N500million and above.
Benefits/Features. Minimum opening and operating balance of N500,000. CAM fee of N1/mille when minimum operating balance
covenant is breached.. Access to business loans. Dedicated Relationship Manager. Access to Internet banking.
ACCOUNT OPENING DOCUMENTATION - SME
LIMITED LIABILITY COMPANIES
. Account opening form.
. Two suitable reference
. Board resolution to open account.
. One recent passport photographs of each signatory.
. Certified True Copy of Certificate of Incorporation/Registration of Business Name
. Certified True Copy of Memorandum and Article of
Association.. Certified True Copy of form C07/CAC7 (particulars of
Directors) and C02/CAC2 (Allotment of stares).. Residence permit issued by the immigration
Authorities (Expatriates).. Valid Means of Identification. Current paid utility bill (not more than 3 months). Premises visitation Report. Evidence of Registration with Special Control Unit on
Money Laundering (SCUML) for all Designated
Nonfinancial Businesses and Professionals (DNFBP)-
Where applicable. Tax Identification Number (TIN). Legal Search Report. BVN details required
REGISTERED BUSINESS NAMES
. Account opening application form
. One recent passport photographs of each signatory.
. Two suitable reference forms
. Certified copy of certificate of registration of Business
Name. Copy of Forms for application for Registration of
Business Name. Legal Search report. Valid Means of Identification. Current paid utility bill (not more than 3 months). Residence permit issued by the immigration
Authorities (Expatriates).. Premises visitation report. Evidence of Registration with Special Control Unit on
Money Laundering (SCUML) for all Designated
Nonfinancial Businesses and Professionals (DNFBP)-
Where applicable

POLARIS BANK ANNUAL REPORT & FINANCIAL STATEMENTS 2019
172
PERSONAL
bankingLOAN PRODUCTS
PERSONAL TERM LOAN
Personal Term Loan is designed to enable salaried employees
access funds to meet urgent personal needs and conveniently
spread repayments.
Target MarketIndividuals in paid employment with organizations on the Bank’s
approved employer list, whose salaries are domiciled with
Polaris Bank.
Product Variants . Personal Term Loan Buy-Over. Personal Term Loan Top-Up. School Fees Loan. Travel Loan
Unique Selling Points. Minimum loan amount of N100,000. Flexible repayment plan. Competitive pricing. No equity contribution required.
PERSONAL TERM LOAN: BUY-OVER
Personal Term Loan Buy-Over variant is targeted at customers
whose salaries are domiciled with other Banks and who have
Personal Term Loan with these banks, but are willing to transfer
their salary account and the loan obligation to Polaris Bank.
Buy-Over requests may be processed as Plain Buy-Over or a Top-
up Buy-Over, based on customers’ request and DSR capacity.
NB: Only performing loans from other banks can be considered
under the Buy-Over option.
PERSONAL TERM LOAN: TOP-UP
Personal Term Loan Top-Up variant is targeted at existing
Personal Term Loan obligors with Polaris Bank, who have good
credit history on current loan repayment obligations, and have
room to increase their existing exposure within the applicable
DSR.
NB: . Existing loan being proposed for top-up should have
run for a minimum of 6 months’ post disbursement. . The existing loan must be liquidated with proceeds
from disbursement of the new loan, while the
customer is credited with the balance.. Customers requesting for Top-up must have good
credit history on past and current loan repayment
obligations.. Where loan being proposed for top-up has run for more
than one year, letter of introduction/undertaking must
be revalidated i.e. represented as part of required
documentation.
POLARIS SALARY ADVANCE
Polaris Salary Advance is designed to enable salaried employees
get up to 50% of their net monthly salary to meet basic needs,
before their next payday. The product is accessible via
convenient digital channels such as USSD and mobile. Target MarketIndividuals in paid employment whose salaries are domiciled
with Polaris Bank. Unique Selling Points . Smart and Convenient Banking. Attractive pricing. Maximum obligor limit of N500,000. Access up to 50% of salary amount. 30 days tenor or next salary date.

AUTO LOAN
The product is designed to part-finance the acquisition of brand
new vehicles for personal use.
Target Market. Individuals in paid employment with organizations on
the Bank’s approved employer list, whose salaries are
domiciled with Polaris Bank.. Self-employed customers with verifiable source of
income. Unique Selling Points. Maximum limit of N40million for salaried employees
and N20million for self-employed customers.. Minimum equity contribution of 10% for salaried
employees (Tier 1) and 20% for salaried employees
(Tier 2 & 3) and self employed.. Maximum tenure of 48 months.. Flexible repayment plan.
ASSET FINANCE
This product is designed to enable salaried employees acquire
household assets from pre-qualified merchants of the Bank, and
enjoy flexible/convenient repayments. Target Market. Individuals in paid employment with organizations on
the Bank’s approved employer list, whose salaries are
domiciled with Polaris Bank.
. Individuals in paid employment with organizations on
the Bank’s approved employer list, whose salaries are
not domiciled with Polaris Bank, but whose employers
are willing to deduct repayments at source from salary
throughout the loan tenor. Unique Selling Points. Minimum loan amount of N50,000. Maximum obligor limit of N1,000,000. Maximum tenor of up to 12 months. Flexible repayment plan. Reduced interest rate.. Variety of assets to choose from.
MORTGAGE LOAN
The Personal Home Loan product is designed to fund the outright
acquisition of already built residential properties for individuals.
Target Market. Individuals in paid employment with organizations on
the Bank’s approved employer list, whose salaries are
domiciled with Polaris Bank.. Self-employed customers with verifiable source of
income.
Unique Selling Points. Maximum obligor limit of up to N100million, subject to
DSR & property location.. Maximum tenor of 180months [15years]. DSR: 33.3% for Income bands of N0 - N500,000; 40% for
Income bands of N501,000 - N1,999,000 and 50% for
Income bands of N2million and above.. Equity contribution: 20% for salaried employees and
30% for Self Employed.. Joint Mortgage option available . Competitive pricing . Flexible repayment plan
SME BANKING LOAN PRODUCTS
MARKET LOAN
The market loan is a short term overdra� facility with a maximum
limit of N5million and tenor of up to 180days (with a 30days clean
up cycle) targeted at traders who deal in fast moving consumer
goods (FMCG)
Target MarketTraders who deal in fast moving consumer goods
Summary of key features & benefits. Loan type –Overdra�. Tenor - up to 180 days (with 30 days clean up cycle). Loan amount - maximum of 5million naira. Competitive Interest rate . Flexible collateral requirements to suit your business. Onboarding on Polaris Bank digital platforms. Access to capacity building programs powered by
Polaris Bank. Dedicated Relationship manager. Financial Advisory
HEALTH LOAN
The Polaris Health Sector Loan is an asset product targeted at
Private Hospitals, Pharmacies, Medical Laboratories and
Diagnostic Centres to support funding needs of SME’s in the
health sector.
Target Market. Private hospitals, Pharmacies , Medical laboratories
and diagnostic centres etc
Summary of key features & benefits. Maximum obligor limit of up to N100million, subject to
DSR & property location.. Maximum amount of N50million depending on the
loan purpose.. Tenor of 180 days for overdra� facility, 24 months for
Term Loan and up to 48 months depending on the cost
of asset/equipment financed.
POLARIS BANK ANNUAL REPORT & FINANCIAL STATEMENTS 2019
173

POLARIS BANK ANNUAL REPORT & FINANCIAL STATEMENTS 2019
174
. Competitive Interest rate
. Flexible collateral requirements to suit your business.
. Free onboarding on Polaris Bank digital platforms.
. Access to capacity building programs powered by
Polaris Bank
Target Market. Private hospitals, Pharmacies , Medical laboratories
and diagnostic centres etc
Summary of key features & benefits. Maximum obligor limit of up to N100million, subject to
DSR & property location.. Maximum amount of N50million depending on the
loan purpose.. Tenor of 180 days for overdra� facility, 24 months for
Term Loan and up to 48 months depending on the cost
of asset/equipment financed.. Competitive Interest rate. Flexible collateral requirements to suit your business.. Free onboarding on Polaris Bank digital platforms.. Access to capacity building programs powered by
Polaris Bank
EDUCATION LOAN
Polaris Education Loan is a product designed to cater to the
financial needs of Educational Institution. Beneficiaries of this
offering include private Primary, Secondary and Tertiary
institutions. It is available to both new to bank and existing
customers Target Market. Private Nursery, Primary, Secondary and Tertiary
institutions
Summary of key features & benefits. Maximum amount of N100million.. Tenor of 90days for overdra� facility, 12 months for
Term Loan and 36months for asset financing.. Competitive Interest rate Management fee of 1% flat on
the facility amount payable upfront.. Swi� turn-around time in loan processing. Access to facilities with minimal collateral.. Ability to purchase assets which will serve as collateral
for the loan.. Access to other value offerings which include, salary
loans to your staff members, deployment of digital
payment solutions etc.

CORPORATE
DIRECTORY
175

POLARIS BANK ANNUAL REPORT & FINANCIAL STATEMENTS 2019
176
CORPORATE
directory
S/N Name Of Institution Address
1 CITIBANK,NEW YORK 399,PARK AVENUE,NEW YORK NY 10043,USA
2 FIRST BANK UK 28 FINSBURY CIRCUS LONDON EC2M 7DT
3 STANDARD CHARTERED BANK
LONDON I, ALDEMANBURY SQUARE , LONDON,EC2V 7SB
4 BANQUE LIBANO FRANCAIS 5,RUE DE ROME,BEIRUT LIBERTY PLAZA,
LEBANON HAMRA-BP:11-0808 BEYROUTH,LIBAN
5 BYBLOS BANK LONDON BYBLOS TOWER,ELIAS SARKIS AVENUE
ASHRAFIEH, BEIRUT, LEBANON
6 FIRST RAND BANK SOUTH AFRICA 1 MERCHANT PLACE CNR , FREDMAN DRAND
RIVONA ROAD, SANDTON,2196
7 BHF BANK GERMANY AKTIENGESELLSCHAFT BOCKENHEIMER
LANDSTRASSE 10 60323 FRANKFURT GERMANY
8 BANK OF BEIRUT 17 A CURZON STREET LONDON W1J 5HS
UNITED KINGDOM
9 UNITED BANK FOR AFRICA, I, ROCKEFELLER PLAZA 8TH FLOOR, NEW YORK,
NEW YORK NY 10020
10 ZENITH BANK UK 39 CORNHILL LONDON EC3V 3ND,UK
11 ACCESS BANK UK 1 CORNHILL LONDON EC3V 3ND,UK
CORRESPONDENT BANKING RELATIONSHIPS

POLARIS BANK ANNUAL REPORT & FINANCIAL STATEMENTS 2019
177
S/N Head Office Locations Address
1 Akin Adesola Head Office 3 Akin Adesola Street, Victoria Island , Lagos
2 Churchgate Street PC 28, Churchgate Street, Victoria Island, Lagos
3 Adeola Hopewell 708/709, Adeola Hopewell Street, Victoria Island, Lagos
HEAD OFFICE AND REGIONAL OFFICES
CORPORATE DIRECTORY

POLARIS BANK ANNUAL REPORT & FINANCIAL STATEMENTS 2019
178
BRANCH NETWORK
S/N STATE BRANCH NAME ADDRESS
1 ABIA EZIUKWU 3 / 4 EZIUKWE ROAD, ABA
2 ABIA JUBILEE RD ABA 82,JUBILEE ROAD. ABA
3 ABIA UMUAHIA OWERRI ROAD BY OBOWO STREET, OPPOSITE SHOPRITE
4 ABIA UMUAHIA BRANCH* 3,LIBRARY AVENUE UMUAHIA
5 ABIA ARIARIA ABA BRANCH* 246,FAULKS ROAD. ABA
6 ABIA ST. MICHAEL BRANCH 10,ST MICHAEL ROAD ABA
7 ADAMAWA JIMETA BRANCH YOLA No 20, YOLA ROAD, OPPOSITE FCE, JIMETA
8 ADAMAWA MUBI BRANCH NO. 1,AHMADU BELLO WAY, ADJACENT EMIR OF MUBI HOUSE.
LOKUWA, MUBI NORTH LOCAL GOVERNMENT AREA
9 ADAMAWA YOLA 27, GALADIMA AMINU WAY JIMETA
10 AKWA IBOM PRINCE UTUKS 5B PRINCE UTUKS STREET OFF ABAK ROAD
11 AKWA IBOM UYO 2 56, NWANIBA STREET UYO
12 AKWA IBOM UYO BRANCH 2,IKOT-EKPENE ROAD. UYO
13 AKWA IBOM EKET BRANCH* 8A,GRACEBILL ROAD EKET
14 ANAMBRA AWKA 258 ZIK AVENUE ROAD
15 ANAMBRA BRIDGE HEAD MKT C. ONITSHA 50/51 UGA ROAD ONITSHA
16 ANAMBRA BRIDGEHEAD 42 PORT HARCOURT STREET,FEGGE
17 ANAMBRA NEW MARKET ROAD 13 NEW MARKET ROAD ONITSHA
18 ANAMBRA NKPOR BRANCH 4,NWOSA LANE,NKPOR-JUNCTION NKPOR
19 ANAMBRA NNEWI 13 EDO EZEMEWI STREET
20 ANAMBRA OBOSI 3 onyekwere zone ugwuagba obosi
21 ANAMBRA OKEKE STREET BRANCH 55M,OKEKE STREET AWKA
21 ANAMBRA ONITSHA BRIGHT STR 5, BRIGHT STREET. ONITSHA
23 ANAMBRA ONITSHA HEAD BRIDGE B/1,NIGER BRIDGE, INDUS -LAYOUT. ONITSHA
24 BAUCHI BAUCHI NO. 21, AHMED ABDULKADIR ROAD, BAUCHI
25 BAUCHI YAKUBU ROAD 5,YAKUBU ROAD. BAUCHI
26 BAYELSA YENAGOA 196 MBIAMA/YENAGOA
27 BENUE GBOKO BRANCH BCC FACTORY YANDEV GBOKO
28 BENUE MAKURDI* 34,IYORCHIA AYU ROAD. MAKURDI
29 BENUE MAKURDI 88 OTUKPO ROAD OPPOSITE JOSEPH S.T. TARKA HALL
30 BORNO BIU NO. 2, DAMATURU ROAD, BIU TOWN
31 BORNO MAIDUGURI NO. 1, KIRIKASA ROAD BESIDE CBN OFFICE, MAIDUGURI
32 BORNO MAIDUGURI BRANCH 1, KIRIKASSAMA ROAD. MAIDUGURI
33 CROSS RIVERS CALABAR 41, MURTALA MUHAMMED WAY
34 CROSS RIVERS NELSON MANDELA BRANCH 4,NELSON MANDELA ROAD. CALABAR
35 DELTA AGBOR BRANCH 114,OLD BENIN-AGBOR ROAD AGBOR
36 DELTA ALADJA BRANCH DELTA STATE STEEL COMPANY,POB 472 WARRI
37 DELTA ASABA 228, NNEBISI ROAD
38 DELTA ASABA MAIN BRANCH 3 EZENEI ANENUE ASABA
39 DELTA EFFURUN BRANCH 33, OLD SAPELE ROAD WARRI. EFFURUN
40 DELTA OBIARUKU BRANCH 123,OLD SAPELE AGBOR ROAD. OBIARUKU
41 DELTA WARRI 88 A EFFURUN/SAPELE ROAD
42 EBONYI ABAKALIKI PLOT 254 AFIKPO ROAD ABAKALIKI
43 EDO AGENEBODE BRANCH NEW AUCHI ROAD AGENEBODE
44 EDO AKPAKPAVA 100, AKOKPAVA RD. P.O. BOX 356, BENIN CITY
45 EDO BENIN MAIN BRANCH 2,KINGS SQUARE. BENIN CITY
46 EDO EKENWAN BRANCH BENIN 130,EKENWA RD,BY AGHO JUNCTION BENIN
47 EDO FORESTRY 1, Forestry Road, by Ring Road, Benin City,
48 EDO IKPOBA SLOPE BENIN 124,AKPAKPAVA ROAD. BENIN CITY
49 EDO SAPELE 143, SAPELE ROAD
50 EDO UGBOWO 218, UGBOWO LAGOS ROAD
51 EKITI ADO EKITI ORERE OWU STREET P.M.B. 5320 ADO EKITI
52 ENUGU ENUGU MAIN BRANCH 36,OKPARA AVENUE. ENUGU
53 ENUGU OGUI RD ENUGU 96 OGUI ROAD
54 ENUGU OKPARA AVENUE PLOT 3D OKPARA AVENUE
55 ENUGU 9TH MILE BRANCH* 47A,OLD ONITSHA ROAD,9THMILE
56 FCT ABUJA MAIN BRANCH 3, KAURA NAMODA CLOSEAREA 3 GARKI
57 FCT AMINU KANO PLOT 1145 AMINU KANO CRESCENT WUSE II, GARKI
58 FCT ASOKORO PLOT 71 YAKUBU GOWON CRESCENT ASOKORO
59 FCT BWARI ALONG NIGERIA LAW SCHOOL, BWARI
60 FCT CBD2 (Millenium Builder Plaza) 251, Herbert Macaulay Way,
Opposite NNPC Towers Central Business District
61 FCT GARKI PLOT 557 GIMBIYA STREET OFF A/BELLO WAY
62 FCT GRAND SQUARE PLOT 270 GRAND SQUARE BUILDING
63 FCT GWAGWALADA GWAGWALADA CENTRAL AREA DISTRICT FCT GWAGWALADA
64 FCT GWARINPA 3RD AVENUE, GWARIMPA
65 FCT KUBWA 137 GADO NASCO ROAD KUBWA
66 FCT LIFE CAMP No 1, STK Ukaga Road, off Obafemi Awolowo Way, Mbora District, LifeCamp
67 FCT LUGBE PLOT 255/15 FEDERAL HOUSING ESTATE
68 FCT MAITAMA 31, Aguiyi Ironsi Street, Maitama
69 FCT MARARABA NO 27 JOS-KEFFI ROAD
70 FCT MPAPE BRANCH PLOT NO .MF/33 MPAPE LAYOUT
71 FCT NASS National Assembly Complex, Three Arms Zone
72 FCT SHERATON HOTEL BRANCH SHOP NO 10 WITHIN SHERATON HOTEL, NO 1 LADI KWALI RD WUSE ZONE4
73 FCT WUSE PLOT 1949 DALABA ST.,WUSE ZONE 5
74 FCT KARU* KARU/JIKOYI ROAD. OPPOSITE CBN ESTATE, KARU
75 GOMBE GOMBE NO 4, NEW MARKET ROAD
CORPORATE DIRECTORY

POLARIS BANK ANNUAL REPORT & FINANCIAL STATEMENTS 2019
179
76 GOMBE GOMBE BRANCH PLOT 42, GWANI ROAD
77 IMO MGBIDI BRANCH 65,OWERRI/ONITSHA ROAD. MGBIDI
78 IMO OWERRI 107A DOUGLAS ROAD
79 IMO WHETHERAL ROAD BRANCH 23, WHETHERAL ROAD OWERRI
80 IMO OWERRI TETLOW 178,TETLOW ROAD OWERRI
81 IMO UMUELEMAI BRANCH OLD OKIGWE-UMUAHIA ROAD UMUELEMAI, MBANO
82 IMO URUALLA BRANCH AKWA-ORLU ROAD, URUALLA,IDEATO NORTH LGA
83 JIGAWA DUTSE No 8/9 SANI ABACHA WAY, OPPOSITE PENSION HOUSE, DUTSE
84 JIGAWA GUMEL BRANCH 2 KANO ROAD, OPP. GUMEL POST OFFICE,GUMEL
85 JIGAWA HADEJIA No. 92 MALLAM MADORI ROAD, HADEJIA
86 JIGAWA KAZAURE BRANCH* KANTIN-DAURA ROAD, KAZAURE
87 KADUNA AHMADU BELLO WAY 15/17 AHMADU BELLO WAY
88 KADUNA KACHIA 3 KACHIA ROAD
89 KADUNA KADUNA BYEPASS BRANCH 512A NNAMDI AZIKIWE WAY BY KAGORO CLOSE, KADUNA BYEPASS, TUNDUN WADA
90 KADUNA KADUNA MAIN BRANCH PLOT 1472, MOGADISHU LAYOUT
91 KADUNA KADUNA RACE COURSE 4/6 RACE COURSE MURTALA MOHAMMED WAY
92 KADUNA ZARIA 28 PARK ROAD, ZARIA
93 KANO BAYERO UNIVERSITY KANO BAYERO UNIVERSITY,OLD CAMPUS
94 KANO BELLO RD, KANO 4E,BELLO ROAD
95 KANO DAWANAU MARKET KANO ALONG KANO-KATSINA EXPRESS WAY, DAWANUA MARKET, DAWANAU
96 KANO FRANCE ROAD 8 France Road, Sabon Gari
97 KANO GEZAWA BRANCH NO 9, GUMEL ROAD,GEZAWA TOWN. GEZAWA
98 KANO IBRAHIM TAIWO ROAD 70 IBRAHIM TAIWO RD
99 KANO KANO LAGOS STR BRANCH 9B, LAGOS STREET
100 KANO KURA BRANCH KANO 32KM ALONG KADUNA -KANO EXPRESS WAY ZARIA ROAD ,KURA TOWN
101 KANO MM WAY KANO 1 MURITALA MOHAMMED WAY OPPOSITE KANO CLUB
102 KANO KATSINA RD BRANCH 17, KATSINA ROAD
103 KATSINA KATSINA PLOT B4, IBB WAY
104 KATSINA KATSINA BRANCH 201, IBB WAY
105 KATSINA MALUMFASHI BRANCH FUNTUA/YASHE ROAD,BESIDE ABA NIGERIA LTD, MALUMFASHI
106 KEBBI BIRNIN KEBBI 1 UMARU GWANDU ROAD
107 KEBBI EMIR HARUNA ROAD BRANCH 43, EMIR HARUNA ROAD. BIRNIN KEBBI
108 KOGI AYANGBA BRANCH KM 1, ANKPA ROAD AYANGBA
109 KOGI LOKOJA NO. 433 IBB WAY,OLD LOKOJA-OKENE ROAD, BEFORE SPECIALIST HOSPITAL LOKOJA
110 KOGI ANKPA BRANCH* NO1,LOCAL GOVT SECRETARIAT ROAD ANKPA
111 KOGI IDAH BRANCH* NO.24 AYEGBA OMA-IDOKO ROAD IDAH
112 KWARA ILORIN 20, COMMERCIAL LAYOUT ILORIN
113 KWARA ILORIN MAIN BRANCH 4, MURTALA MOHAMMED ROAD. ILORIN
114 KWARA UNIILORIN UNIVERSITY OF ILORIN MAIN SITE,ILORIN
115 KWARA JEBBA BRANCH N0 1 JEBBA PAPER MILL ROAD JEBBA
116 LAGOS 1ST AVENUE House 1, 200 ROAD, FIRST AVENUE, FESTAC TOWN
117 LAGOS ADEMOLA ADETOKUNBO 50, ADETOKUNBO ADEMOLA STREET, VICTORIA ISLAND
118 LAGOS ADENIRAN OGUNSANYA 81, ADENIRAN OGUNSANYA STREET,
119 LAGOS ADEOLA HOPEWELL 708/709 ADEOLA HOPEWELL STREET
120 LAGOS ADEOLA ODEKU PLOT 232B ADEOLA ODEKU STREET, VICTORIA ISLAND
121 LAGOS ADMIRALTY WAY BRANCH BLOCK A10,PLOT 5, ADMIRALTY LEKKI PHASE 1 LEKKI
122 LAGOS AGO PALACE WAY BRANCH 64 AGO PALACE WAY
123 LAGOS AJOSE ADEOGUN 287 AJOSE ADEOGUN STREET, VICTORIA ISLAND
124 LAGOS AKIN ADESOLA BRANCH 3 AKIN ADESOLA STREET. VICTORIA ISLAND
125 LAGOS AKOWONJO 35 SHASHA ROAD BY AKOWONJO ROUNDABOUTAKOWONJO
128 LAGOS ALFRED REWANE BRANCH 5,ALFRED REWANE ROAD IKOYI
129 LAGOS ALLEN 89, ALLEN AVENUE, ALADE BUS STOP, IKEJA
130 LAGOS APAPA ROAD 125A, APAPA ROAD, EBUTE METTA
131 LAGOS ASPAMDA Hall 2, Olusegun Obasanjo Plaza, Aspamda Market, TRADE FAIR COMPLEX,BADAGRY EXP. WAY, OJO
132 LAGOS AWOLOWO ROAD 81 AWOLOWO ROAD OPPOSITE DOCULAND, ETIOSA LGA IKOYI
133 LAGOS BADAGRY SEME-BORDER EXPRESS ROAD,BADAGRY ROUNDABOUT AREA BADAGRY LAGOS
134 LAGOS BBA ATIKU HALL COMPLEX, BALOGUN BUSINESS ASSOCIATION, BESIDE ANAMBRA PLAZA, INTERNATIONAL TRADE
FAIR COMPLEX, BADAGRY EXPRESSWAY
135 LAGOS BROAD STR BRANCH 51/55 BROAD STREET
136 LAGOS CITYHALL 207 IGBOSERE ROAD, LAGOS ISLAND (LAGOS HIGHCOURT)
137 LAGOS COMPUTER VILLAGE 4 OREMEJI STREET OFF SIMBIAT ABIOLA ROAD
138 LAGOS CREEK ROAD 34, CREEK ROAD,
139 LAGOS DOPEMU 120 LAGOS ABEOKUTA EXP WAY ADE- ADU BUS STOP AGEGE
140 LAGOS EGBE 105, EGBE ROAD , ORI OKE BUSTOP, EJIGBO
141 LAGOS EPE 12, AYETORO ROAD, EPE
142 LAGOS FATAI ATERE 11/12 FATAI ATERE WAY MUSHIN MUSHIN
143 LAGOS IDOLUWO 15, IDOLUWO STREET
144 LAGOS IGANMU BRANCH PLOT 14,JIMOH ODUTOLA STREET OFF ERIC MOORE IGANMU
145 LAGOS IJU 118 IJU ROAD FAGBA
146 LAGOS IKEJA ADENIYI JONES IKEJA PLAZA, 81, MOBOLAJI BANK ANTHONY WAY
147 LAGOS IKEJA ISAAC JOHN 47, ISAAC JOHN STREET,GRA IKEJA
148 LAGOS IKEJA PLAZA IKEJA PLAZA, 81, MOBOLAJI BANK ANTHONY WAY
149 LAGOS IKORODU MAIN 21 AYANGBURIN ROAD, IKORODU GARAGE ROUND ABOUT,IKORODU
150 LAGOS IKORODU SEC. IKORODU LOCAL GOVT. SECRETARIAT, OPPOSITE GENERAL HOSPITAL, IKORODU
151 LAGOS IKOTA SHOPPING COMPLEX ROAD 5,IKOTAT S/COMPLEX KM22 EPE EXP WAY
152 LAGOS IKOTUN 16, IDIMU-IKOTUN ROAD, COLLEGE BUS STOP, IKOTUN
153 LAGOS ILUPEJU BRANCH 6, INDUSTRIAL AVENUE ILUPEJU
154 LAGOS INTL AIRPORT 60 INTERNATIONAL AIRPORT ROAD MAFOLUKU JUNCTION
155 LAGOS ISHERI-OJODU 783,SOMIDE ODUJINRIN AVENUE,OMOLE PHASE 2,OFF ISHERI OLOWORA ROAD,OJODU BERGER
CORPORATE DIRECTORY

POLARIS BANK ANNUAL REPORT & FINANCIAL STATEMENTS 2019
180
156 LAGOS ISOLO 27 MUSHIN RD. ISOLO
157 LAGOS KETU 520 IKORODU ROAD P.O. BOX 3480 KETU
158 LAGOS KOFO ABAYOMI 78/84,KOFO ABAYOMI AVENUE. APAPA
159 LAGOS KUDIRAT ABIOLA WAY PLOT 32 KUDIRAT ABIOLA ROAD,OREGUN
160 LAGOS LUTH LAGOS UNIVERSITY TEACHING HOSPITAL, IDI ARABA
161 LAGOS MAGODO 14 CMD ROAD MAGODO
162 LAGOS MARINA 30 MARINA , LAGOS ISLAND
163 LAGOS MATORI 2/4 JIMADE CLOSE,OFF LADIPO STREET
164 LAGOS MONTGOMERY 2, MONTGOMERY ROAD, YABA
165 LAGOS NAHCO BLK.2,WING A,M/M INTERNATIONAL AIRPORT
166 LAGOS OGBA 37/38 OGBA-ISHERI ROAD, OGBA IKEJA
167 LAGOS OGUDU 161, OGUDU ROAD, OGUDU OJOTA
168 LAGOS OJUELEGBA BRANCH 68,OJUELEGBA ROAD. SURULERE
169 LAGOS OKE-ARIN 60, KOSOKO STREET, OKE-ARIN, LAGOS ISLAND
170 LAGOS OPEBI 46 OPEBI ROAD, SALVATION BUS STOP IKEJA
171 LAGOS OSAPA LONDON 14 LEKKI EPE EXPRESSWAY, OSAPA LONDON
172 LAGOS OSOLO WAY 26 OSOLO WAY AJAO ESTATE
173 LAGOS SANGO OTA KM 37, LAGOS/ABEOKUTA EXPRESS RD. TEMIDIRE BUSTOP SANGO OTTA
174 LAGOS SHOMOLU 6 BAJULAIYE ROAD BESIDE MR BIGGS SHOMOLU
175 LAGOS POLARIS HOUSE PLOT 5, COMMERCIAL SCHEME, OPPOSITE IKEJA CITY MALL, CBD ALAUSA IKEJA
176 LAGOS ST. GREGORY ROAD/GLOVER ROAD 22 ST.GREGORY ROAD,OFF AWOLOWO ROAD, IKOYI (CLOSE TO ST GREGORY COLLEGE OBALENDE)
177 LAGOS TOYIN STREET 13 TOYIN STREET, IKEJA
178 LAGOS VICTORIA ISLAND BRANCH PC 28, CHURCHGATE STREET VICTORIA ISLAND
179 LAGOS WAREHOUSE RD 48 WAREHOUSE ROAD APAPA
180 LAGOS WHARF RD 28, WHARF ROAD, APAPA
181 LAGOS ALABA BRANCH* PLOT 1A, BLOCK C LSDPC INDUSTRIAL ESTATE, AMUWO ODOFIN
182 LAGOS FESTAC BRANCH* 2ND AVENUE ROAD,HOUSE NO-12 FESTAC
183 LAGOS IKOYI BRANCH* 27,KEFFI STREET S/W IKOYI
184 LAGOS ISA-WILLIAMS BRANCH* 182/184 BROAD STREET, LAGOS ISLAND
185 NASARAWA LAFIA NO 10 JOS ROAD, OPPOSITE STATE CID OFFICE BESIDE TA'AL CONFERENCE HOTEL LAFIA
186 NIGER BIDA BRANCH 1,ZUNGERU ROAD. BIDA
187 NIGER EBITU UKIWE BRANCH 1A , OLD AIRPORT ROAD MINNA
188 NIGER MINNA 151, BOSSO ROAD, MINNA
189 NIGER SULEJA MAIN BRANCH 1, NEW MARKET ROAD. SULEJA
190 OGUN IJEBU IGBO NO. 70 ADEBOYE ROAD, OKE SOPEN, IJEBU IGBO
191 OGUN IJEBU ODE 81, ABEOKUTA RD. P.M.B.2062 IJEBU ODE
192 OGUN ILARO 52 PMB,ONA OLA QUARTERS ,JUBILEE FLAT BUS STOP YEWA SOUTH LOCAL GOVERNMENT ,ILARO
193 OGUN OBA LIPEDE OBA LIPEDE ULTRA MODERN MARKET, KUTO ABEOKUTA
194 OGUN OKE ILEWO 65B, LALUBU STREET OKE-IKEWO, ABEOKUTA
195 OGUN SAGAMU NO 169, AKARIGBO ROAD, SABO AREA, SAGAMU
196 OGUN SAPON 15, SOKENU ROAD OKE IJEUN P.M.B. 3036 ABEOKUTA
197 OGUN OTTA* KM2, ABEOKUTA EXPRESS WAY OTTA
198 ONDO AKUNGBA P.M.B. 02 IKARE RD. AKUNGBA AKOKO
199 ONDO OBA ADESIDA 92, OBA ADESIDA ROAD, AKURE
200 ONDO IDANRE JIGBOKE QUARTER P.M.B. 502 IDANRE
201 ONDO IKARE JUBILLE ROAD P.M.B. 255 IKARE
202 ONDO ILE-OLUJI TEMIDIRE STREET P.M.B. 711 ILE OLUJI
203 ONDO OKITIPUPA IKOYA/OKITIPUPA ROAD, OKITIPUPA
204 ONDO YABA ONDO 23A YABA ROAD P.M.B. 544
205 ONDO OWO 19, OKE OGUN STREET P.M.B. 1016
206 ONDO OYEMEKUN NO 49 ADEGBOLA JUNCTION, OYEMEKUN ROAD
207 OSUN ALEKUWODO 30 ALEKUWODO ROAD OKEFIA
208 OSUN BOWEN UNIVERSITY BOWEN UNIVERSITY, CAMPUS,
209 OSUN ESA-OKE BRANCH IJEBU-IJESHA ROAD, MARKET SQUARE, ESA -OKE
210 OSUN FAGBEWESA 56, FAGBEWESA ST. OSOGBO
211 OSUN ILA-ORANGUN OKE EJIBO BEFORE ADEKUNKE JUNCTION ILA ORANGUN
212 OSUN ILESA 343, AKURE RD. OKESHA, ILESA
213 OSUN OAU OAU P.M.B.17 OAU, ILE IFE
214 OSUN OBA ADEREMI ROAD 2 OBA ADEREMI ROAD ILE IFE
215 OSUN OSOGBO BRANCH OPPOSITE FAKUNLE COMPREHENSIVE HIGH SCHOOL ,OLAIYA BUSTOP,OSOGBO
216 OSUN EDE TIMI OJA TIMI EDE,BESIDE OBA TIMI PALACE ,EDE
217 OSUN OAU TEACHING HOSPITAL* OAU TEACHING HOSP,COMPLEX ILE-IFE
218 OYO AGBOWO TRANS AMUSEMENT PARK, UI EXPRESS, BODIJA, IBADAN
219 OYO AGODI OPP STATE SECRETARIAT AGODI, CUSTOM BUS STOP, AGODI, IBADAN
220 OYO CHALLENGE ORITA CHALLENGE OPPOSITE ORITA POLICE STATION ALONG NEW-GARRAGE ROAD IBADAN
221 OYO ERUWA HOSPITAL RD STREET, ERUWA
222 OYO IBADAN MAIN BRANCH 3, BANK ROAD, CENTRAL BUSINESS DISTRICT STREET, DUGBE IBADAN
223 OYO IWO ROAD IBADAN OPP YIDI PRAYING GROUND,CIVIC CENTRE BUS STOP GATE, IBADAN
224 OYO ABAYOMI IWO ROAD E9/857B, IWO ROAD AGODI. IBADAN, BA IBRAHIM WAY, DAMATURU.
225 OYO LEBANON 17 LEBANON STREET,OLD GBAGI MARKET
226 OYO MONATAN ADEX BUS-STOP,OPP TOTAL FILLING STATION ,MONATAN .IBADAN
227 OYO OBA ADEBIMPE BESIDE CBN, OPP COCOA MALL BUS STOP,OBA ADEBIMPE RD. IBADAN
228 OYO OGBOMOSHO OJU-ODO APAKE STREET, OGBOMOSHO
229 OYO RING RD IBADAN BESIDE LISTER BUILDING, HIGH COURT BUS STOP, RING ROAD,IBADAN
230 OYO SAKI OPP. SHAKI WEST LG. AJEGUNLE STREET, SHAKI
231 OYO UNIVERSITY OF IBADAN ORITA UI BESIDE UNIVERSITY OF IBADAN FIRST GATE, IBADAN
232 OYO LISTER OPP ADEOYO ROUNDABOUT, BAYSE ONE BUS STOP,RING ROAD IBADAN
233 PLATEAU JOS NO 2 GBADAMOSI CLOSE, OFF MURITALA MOHD WAY, BRITISH AMERICAN JUNCTION, JOS
234 PLATEAU KURU NO 2 NIPSS PLAZA PLATEAU WAY, NIPSS KURU JOS SOUTH
235 PLATEAU M/M WAY JOS BRANCH 23,MURTALA MOHAAMED WAY. JOS
CORPORATE DIRECTORY

POLARIS BANK ANNUAL REPORT & FINANCIAL STATEMENTS 2019
181
236 RIVERS AGIP AGIP JUNCTION/IKWERRE ROAD
237 RIVERS GARRISON 2,CHOBA ST., 89 ABA ROAD,GARRISON JUNCTION
238 RIVERS IGWURUTA BRANCH 100 AIRPORT ROAD IGWURUTA ROUND ABOUT PORT HARCOURT IKWERRE LGA
239 RIVERS IKWERRE 67, IKWERRE ROAD, MILE 1, DIOBU,
240 RIVERS NCHIA ELEME BRANCH 2,REFINERY ROAD, NCHIA ELEME NCHIA
241 RIVERS OKPORO 119 OKPORO ROAD
242 RIVERS OLU OBASANJO 143 OLU OBASANJO WAY
243 RIVERS ONNE POLARIS BANK LTD NPA-FLT TERMINAL ROAD ONE, ONNE ROUND ABOUT ELEME LGA
244 RIVERS PORT HARCOURT MAIN 26, ABA ROAD. PORT HARCOURT
245 RIVERS RSS BLOCK C, RIVERS SECRETARIAT
246 RIVERS RUMUOLA BRANCH 204, ABA ROAD PORT HARCOURT
247 RIVERS STATION RD BRANCH 1,STATION ROAD PORT HARCOURT
248 RIVERS TRANS AMADI PLOT 270, TRANS AMADI INDUSTRIAL LAYOUT,
249 RIVERS TRANS-AMADI 112,TRAN-AMADI INDUSTRIAL LAYOUT PORT HARCOURT
250 SOKOTO SANI ABACHA WAY SOKOTO 16 SANI ABACHA WAY FORMERLY KANO ROAD
251 SOKOTO SOKOTO MAIN BRANCH 3,MAIDUGURI ROAD. SOKOTO
252 SOKOTO UDUS BRANCH SOKOTO* USMAN DANFODIYO UNIVERSITY, WAMMAKO LOCAL GOVERNMENT AREA
253 TARABA JALINGO HAMMARUWA WAY, OPP. OCEANIC & UNION BANK
254 YOBE DAMATURU PLOT 582A NJIWAJI LAYOUT, BUKAR AB
255 ZAMFARA GUSAU 58, CANTEEN AREA, GUSAU
256 ZAMFARA GUSAU BRANCH 10,CANTEEN ROAD. GUSAU
*THE ASTERISKED BRANCHES WHICH WERE OPEN AS AT DECEMBER 21, 2019, HAVE SUBSEQUENTLY BEEN CLOSED.
CORPORATE DIRECTORY

POLARIS BANK ANNUAL REPORT & FINANCIAL STATEMENTS 2019
182
CASH CENTRES
S/N STATE CASH CENTER ADDRESS
1 ABIA ABIA POLY CASH CENTRE ABIA POLYTECHNIC WITHIN THE SCHOOL PREMISES
2 ABIA CEMETRY CASH CENTRE 12 DURU STREET CEMETRY MARKET ABA
3 ABIA ELECTRICAL CASH CENTER ELECTRICAL MARKET OBOSI, ALONG ONITSHA-OWERRI RD EXPRESS WAY
4 ABIA JOHNSON STREET NO 9 JOHNSON STREET, GBO PLAZA, INSIDE MAIN MARKET, ONITSHA MAIN MARKET
5 ADA MAWA MODIBO ADAMA CASH CENTRE NO 70 MODIBO ADAMA WAY YOLA TOWN
6 ADAMAWA MONDAY MARKET CASH CENTRE AHMADU BELLO WAY, MONDAY MARKET MAIDUGURI
7 AKWA IBOM UNI UYO CASH CENTRE UNIVERSITY OG UYO ANNEX, IKPE ROAD, UYO
8 AKWA IBOM IKOT EKPENE CASH CENTRE IKOT EKPENE POST OFFICE BUILDING OLD STADIUM ROAD
9 BORNU UNI MAIDUGURI UNIVERSITY OF MAIDUGURI, PMB 1069, BAMA ROAD
10 DELTA NOVENA CASH CENTER NOVENA UNIVERSITY, AMAI
11 EBONYI FMC ABAKALIKI/ FETHA FEDERAL MEDICAL CENTRE - I, OFF EBONYI STATE GOVT HOUSE ROUND ABOUT, ABAKALIKI
12 EDO UPPER SAKPONBA CASH CENTRE 64, UPPER SAKPONBA ROAD, BENIN-CITY
13 ENUGU ENUGU NORTH ENUGU NORTH CASH CENTER
14 JIGAWA FMC CASH CENTRE BIRNIN KUDU FEDERAL MEDICAL CENTRE, BIRNIN KUDU
15 KWARA COLLEGE OF EDUCATION ILORIN KWARA STATEE COLLEGE OF EDUCATION ILORIN
16 LAGOS CAMPBELL 1/5 ODUNLAMI STREET, CMS BUS-STOP MARINA
17 LAGOS HERBERT MACAULAY 14 HUGHES AVENUE, ALAGOMEJI BUS STOP, ALAGOMEJI ,YABA
18 LAGOS IKEJA HIGH COURT IKEJA HIGH COURT PREMISES,OBA AKINJOBI STR IKEJA G.R.A
19 LAGOS LASPOTECH CC LAGOS STATE POLYTECHNIC, IKORODU CAMPUS
20 LAGOS AYOBO CC AYOBO IPAJA LOCAL COUNCIL DEV. AREA , IGBOGILA B/STOP, IPAJA
21 LAGOS ALABA CASH CENTER D329 ELECTRICAL SECTION, ALABA INTERNATIONAL MARKET, OJO
22 LAGOS MMIA STALL 007 ARRIVAL HALL, GROUND FLOOR MURITALA MUHAMMED INTERNATIONAL AIRPORT
23 LAGOS KAIRO BLOCK P FIRST FLOOR, KAIRO MARKET, ABIBATU MOGAJI, OSHODI
24 LAGOS ALUMINIUM CC 1, IFELODUN STREET; ALUMINIUM VILLAGE DOPEMU
25 LAGOS ARTICLES CASH CENTRE ARTICLES DEALERS ASSOCIATION MARKET, OPPOSITE TRADE FAIR COMPLEX, LAGOS BADAGRY EXPRESS WAY, OJO
26 LAGOS NAFBASE SAM ETHNAM (NIGERIA) AIRFORCE BASE, PWD BUS STOP, IKEJA
27 LAGOS NAHCO CASH CENTER 1ST FLOOR DOCUMENTATION HALL, NAHCO HEAD QUARTERS IKEJA
28 LAGOS OJOKORO CC 9/11 BOLA AHMED TINUBU ROAD, IJAIYE OJOKORO
29 LAGOS ONIRU BLOCK 8 OLD SECRETARIAT(MVAA) OBA AKINJOBI STR IKEJA
30 LAGOS NIGER HOUSE 62/64 CAMPBELL STREET, LAGOS ISLAND (LAGOS ISLAND MATERNITY)
31 LAGOS SAHCOL SAHCOL CARGO COMPLEX, NAHCO B/S, NAHCO IKEJA
32 LAGOS SATELLITE CASH CENTRE NO 3, NITEL ROAD , SATELLITE TOWN
33 LAGOS SEME NO 4, BANKS AVENUE SEME-BORDER PORT, SEME BORDER
34 LAGOS SIFAX CASH CENTER NO 1 DELE BAKARE STREET, SIFAX BONDED TERMINAL , OFF APAPA OSHODI EXPRESSWAY TRINITY BUS-STOP OLODI APAPA
35 LAGOS SURULERE LG CASH CENTRE SURULERE LOCAL GOVT SECRETARIAT, 14, JAMES ROBERTSON ROAD, ONILE-GOGORO, SURULERE
36 LAGOS YABATECH YABA COLLEGE OF TECHNOLOGY, YABA
37 LAGOS ODUNADE CASH CENTRE 100 MARKET STREET ODUNADE
38 LAGOS OTO AWORI KLM 25 BADAGRY EXPRESS WAY,IJANIKIN, ILEOBA BUS STOP
39 NASARAWA LAFIA MARKET CASH CENTER LAFIA MODERN MARKET, BESIDE LAFIA EAST PRIMARY SCHOOL,MAKURDI ROAD, LAFIA
40 OGUN BISHOP'S COURT/MAKUN 84, BISHOP'S COURT BUILDING, EWUSI STREET, MAKUN, SAGAMU
41 OGUN FEDERAL POLY, ILARO CASH CENTRE THE FEDERAL POLYTECHNIC ILARO, OPPOSITE PAVILION BUILDING
42 OGUN OOU MAIN CAMPUS, OLABISI ONABANJO UNIVERSITY, AGO IWOYE
43 OGUN TASUED 1 PROF OYESIKU SHOPPING MALL TAI SOLARIN UNIVERSITY OF EDUCATION, IJAGUN IJEBU ODE
44 OGUN ITORI OPPOSITE FORMER DIVISIONAL POLICE STATION, OLD ABEOKUTA-LAGOS ROAD, ITORI, EWEKORO L.G
45 ONDO ACE(ADEYEMI COLLEDGE OF EDU) ADEYEMI COLLEGE OF EDUCATION
46 ONDO IWARO OKA CASH CENTRE OWALUSI QUARTERS IWARO OKA
47 OSUN EDE POLY POLY EDE CAMPUS, EDE
48 OSUN OSCOED CASH CENTRE OSCOED ILESA
49 OSUN IFON OSUN ILOBU ROAD IFON-OSUN
50 OYO AGBENI AMUNIGUN MARKET, AGBENI IBADAN
51 OYO IGBOORA SAGANUN IGBOORA
52 OYO NEW GBAGI NEW GBAGI MARKET, IBADAN
53 OYO POLY IBADAN THE POLYTECHNIC IBADAN
54 RIVERS GARRISON BIR RIVERS BOARD OF INT. REVENUE
55 RIVERS NNPC 4-9 MOSCOW ROAD, PORT HARCOURT
56 RIVERS ELF CASH CENTRE TOTAL E&P PREMISES, PLOT 25 TRANS AMADI INDUSTRIAL LAYOUT, MOTHERCAT BUS STOP, OBIO AKPOR LGA
57 RIVERS ONNE CASH CENTER POLARIS BANK LTD NPA-FLT TERMINAL ROAD ONE, ONNE ROUND ABOUT ELEME LGA
58 RIVERS PHRC POLARIS BANK LTD PORT HARCOURT REFINING COMPANY LTD, REFINERY ROAD ALESA ELEME LGA
59 RIVERS PPMC POLARIS BANK LTD, PPMC DEPOT, ALONG REFINERY ROAD ALESA ELEME LGA
60 RIVERS RUST CASH CENTER(RIVERS STATE UNI POLARIS BANK LTD, RIVERS UNIVERSITY CAMPUS UST ROUND ABOUT MILE 4 OBIO/AKPOR LGA
61 RIVERS RVHA (RIVERS STATE HOUSE OF ASSEM RIVERS STATE HOUSE OF ASSEMBLY COMPLEX, #12 MOSCOW ROAD PORT HARCOURT CITY LGA
62 RIVERS TRANS AMADI CASH CENTRE 5 TRANS AMADI ROAD, PORT HARCOURT
63 SOKOTO SOKOTO HOUSE OF ASSEMBLY, SOKOTO SOKOTO STATE HOUSE OF ASSEMBLY COMPLEX,KADUNA ROAD
64 TARABA FCE (FED COLL. OF EDU) CASH CENTRE/ NO. 1, BALI ROAD, ARDO KOLA, SUNKANI JALINGO
65 ZAMFARA YERIMA BAKURA SPECIALIST HOSPITAL, YERIMA BAKURA SPECIALIST HOSPITAL, TUDUN WADA GUSAU
66 ZAMFARA FEDERAL MEDICAL CENTRE, GUSAU FEDERAL MEDICAL CENTRE, ALONG BYEPASS ROAD, GUSAU
CORPORATE DIRECTORY

S/N ORDINARY BUSINESS FOR AGAINST
1 To receive and consider the Audited Financial Statements for the period
September 21 to December 31, 2018 and the year ended December 31,
2019 together with the Reports of the Directors and Auditors, respectively.
2 . To re-elect Directors:
a. Muhammad K. Ahmad, OON
b. Alhaji Abdullahi M. Umar
c. Mr. Austin Jo-Madugu
d. Mr. Bata G. Wakawa
e. Mr. Olu Odugbemi
3. To appoint Messrs. PricewaterhouseCoopers as the Bank's Auditors
4. To authorize Directors to fix the remuneration of the Auditors
SPECIAL BUSINESS
5. To fix Directors' remuneration
PROXY FORMI, ………………………………………………………… of…………………………..................................
being a member of Polaris Bank Limited hereby appoint…………………………………………......
………………………………………………………..of……………………………………………….…
………………………………………………………….to act as my proxy, to vote for me and on my
behalf at the Annual General Meeting of the Bank to be held on …………………, and at
every adjournment thereof.
As Witness under my hand this ………………………day of……………………..2020
………………………………….
Signed
Please indicate with an “X” in the appropriate box how you wish your votes to be cast on the resolutions set out above. Unless otherwise instructed, the proxy will vote or abstain from voting at his / her discretion.
183

184


![Technical Bulletin - Polaris - Polaris 9300 Sport & Polaris 9300xi Sport[1]](https://static.fdocuments.net/doc/165x107/553b235d4a7959d8258b463f/technical-bulletin-polaris-polaris-9300-sport-polaris-9300xi-sport1.jpg)