Quality Assessment for Short Oligonucleotide Microarray...
24
Quality Assessment for Short Oligonucleotide Microarray Data Julia BRETTSCHNEIDER Department of Statistics University of Warwick Coventry CV4 7AL, U.K. Division of Cancer Care & Epidemiology Cancer Research Institute and Department of Community Health & Epidemiology Queen’s University Kingston, Ontario K7L 3N6, Canada ([email protected] ) François COLLIN Department of Statistics University of California at Berkeley Berkeley, CA 94720 Benjamin M. BOLSTAD Department of Statistics University of California at Berkeley Berkeley, CA 94720 Terence P. SPEED Department of Statistics University of California at Berkeley Berkeley, CA 94720 and Bioinformatics Division Walter and Eliza Hall Institute Victoria 3050, Australia Quality of microarray gene expression data has emerged as a new research topic. As in other areas, microarray quality is assessed by comparing suitable numerical summaries across microarrays, so that outliers and trends can be visualized and poor-quality arrays or variable-quality sets of arrays can be iden- tified. Because each single array comprises tens or hundreds of thousands of measurements, the challenge is to find numerical summaries that can be used to make accurate quality calls. Toward this end, several new quality measures are introduced based on probe-level and probeset-level information, all obtained as a byproduct of the low-level analysis algorithms RMA/fitPLM for Affymetrix GeneChips. Quality land- scapes spatially localize chip or hybridization problems. Numerical chip quality measures are derived from the distributions of normalized unscaled standard errors and relative log expressions. Quality of chip batches is assessed by residual scale factors. These quality assessment measures are demonstrated on a variety of data sets, including spike-in experiments, small lab experiments, and multisite studies. They are compared with Affymetrix’s individual chip quality report. KEY WORDS: Affymetrix chip; Microarray; Normalized unscaled standard error; Quality control; Rel- ative log expression; Residual scale factor. 1. INTRODUCTION With the introduction of microarrays, biologists have seen entire laboratories shrink to matchbox size. This article invites quality researchers to join scientists on their fantastic journey into the world of microscopic high-throughput measurement technologies. Building a biological organism as laid out by the genetic code is a multistep process with room for variation at each step. The first steps, as described by the “central dogma of molecular biology,” are genes (and DNA sequence in general), their transcripts, and proteins. Substantial factors contributing to variation in gene structure and transcript abundance include cell type, developmental stage, genetic background, and en- vironmental conditions. Connecting molecular observations to the state of an organism is of central interest in molecular biol- ogy. This includes the study of gene and protein functions and interactions and their alteration in response to changes in envi- ronmental and developmental conditions. Traditional methods in molecular biology generally work on a “one gene (or protein) in one experiment” basis. With the invention of microarrays, huge numbers of such macromolecules now can be monitored in one experiment. The most common kinds are gene expres- sion microarrays, which measure the mRNA transcript abun- dance for tens of thousands of genes simultaneously. For biologists, this high-throughput approach has opened up entirely new avenues of research. Rather than experimentally confirming the hypothesized role of a certain candidate gene in a certain cellular process, they can use genome-wide compar- isons to screen for all genes potentially involved in that process. One of the first examples of such an exploratory approach is the expression profiling study of mitotic yeast cells by Cho et al. (1998), which determined a set of a few hundred genes involved in the cell cycle and triggered a cascade of articles re- analyzing the data or replicating the experiment. Microarrays have become a central tool in cancer research initiated by the © 2008 American Statistical Association and the American Society for Quality TECHNOMETRICS, AUGUST 2008, VOL. 50, NO. 3 DOI 10.1198/004017008000000334 241
Transcript of Quality Assessment for Short Oligonucleotide Microarray...

Quality Assessment for Short OligonucleotideMicroarray Data
Julia BRETTSCHNEIDER
Department of StatisticsUniversity of Warwick
Coventry CV4 7AL, U.K.
Division of Cancer Care & EpidemiologyCancer Research Institute
andDepartment of Community Health & Epidemiology
Queen’s UniversityKingston, Ontario K7L 3N6, Canada([email protected])
François COLLIN
Department of StatisticsUniversity of California at Berkeley
Berkeley, CA 94720
Benjamin M. BOLSTAD
Department of StatisticsUniversity of California at Berkeley
Berkeley, CA 94720
Terence P. SPEED
Department of StatisticsUniversity of California at Berkeley
Berkeley, CA 94720and
Bioinformatics DivisionWalter and Eliza Hall Institute
Victoria 3050, Australia
Quality of microarray gene expression data has emerged as a new research topic. As in other areas,microarray quality is assessed by comparing suitable numerical summaries across microarrays, so thatoutliers and trends can be visualized and poor-quality arrays or variable-quality sets of arrays can be iden-tified. Because each single array comprises tens or hundreds of thousands of measurements, the challengeis to find numerical summaries that can be used to make accurate quality calls. Toward this end, severalnew quality measures are introduced based on probe-level and probeset-level information, all obtained asa byproduct of the low-level analysis algorithms RMA/fitPLM for Affymetrix GeneChips. Quality land-scapes spatially localize chip or hybridization problems. Numerical chip quality measures are derivedfrom the distributions of normalized unscaled standard errors and relative log expressions. Quality of chipbatches is assessed by residual scale factors. These quality assessment measures are demonstrated on avariety of data sets, including spike-in experiments, small lab experiments, and multisite studies. They arecompared with Affymetrix’s individual chip quality report.
KEY WORDS: Affymetrix chip; Microarray; Normalized unscaled standard error; Quality control; Rel-ative log expression; Residual scale factor.
1. INTRODUCTION
With the introduction of microarrays, biologists have seenentire laboratories shrink to matchbox size. This article invitesquality researchers to join scientists on their fantastic journeyinto the world of microscopic high-throughput measurementtechnologies. Building a biological organism as laid out by thegenetic code is a multistep process with room for variation ateach step. The first steps, as described by the “central dogma ofmolecular biology,” are genes (and DNA sequence in general),their transcripts, and proteins. Substantial factors contributingto variation in gene structure and transcript abundance includecell type, developmental stage, genetic background, and en-vironmental conditions. Connecting molecular observations tothe state of an organism is of central interest in molecular biol-ogy. This includes the study of gene and protein functions andinteractions and their alteration in response to changes in envi-ronmental and developmental conditions. Traditional methodsin molecular biology generally work on a “one gene (or protein)in one experiment” basis. With the invention of microarrays,
huge numbers of such macromolecules now can be monitoredin one experiment. The most common kinds are gene expres-sion microarrays, which measure the mRNA transcript abun-dance for tens of thousands of genes simultaneously.
For biologists, this high-throughput approach has opened upentirely new avenues of research. Rather than experimentallyconfirming the hypothesized role of a certain candidate gene ina certain cellular process, they can use genome-wide compar-isons to screen for all genes potentially involved in that process.One of the first examples of such an exploratory approach isthe expression profiling study of mitotic yeast cells by Choet al. (1998), which determined a set of a few hundred genesinvolved in the cell cycle and triggered a cascade of articles re-analyzing the data or replicating the experiment. Microarrayshave become a central tool in cancer research initiated by the
© 2008 American Statistical Association andthe American Society for Quality
TECHNOMETRICS, AUGUST 2008, VOL. 50, NO. 3DOI 10.1198/004017008000000334
241

242 JULIA BRETTSCHNEIDER ET AL.
discovery and redefinition of tumor subtypes based on molecu-lar signatures (see, e.g., Perou et al. 2000; Alizadeh et al. 2000;Ramaswamy and Golub 2002; Yeoh et al. 2002). In Section 2we explain different kinds of microarray technologies in moredetail and describe their current applications in life sciences re-search.
A DNA microarray consists of a glass surface with numerousdistinct fragments of DNA, called probes, attached at fixed po-sitions. A fluorescently labelled sample containing a mixtureof unknown quantities of DNA molecules, the target, is ap-plied to the microarray. Under the right chemical conditions,single-stranded fragments of target DNA will base-pair withthe probes that are their complements, with great specificity.This reaction, called hybridization, is the reason why DNA mi-croarrays work. The fixed probes are either fragments of DNA,called complementary DNA (cDNA), obtained from messengerRNA (mRNA), or short fragments known to be complementaryto part of a gene, spotted onto the glass surface, or synthesizedin situ. The point of the experiment is to quantify the abundancein the target of DNA complementary to each particular probe;the hybridization reaction, followed by scanning, allows this tobe done on a very large scale. The raw data produced in a mi-croarray experiment consist of scanned images, with the imageintensity in the region of a probe proportional to the amountof labelled target DNA that base-pairs with that probe. In thisway the abundance of thousands of DNA fragments in a targetsample can be measured. Microarrays based on cDNA or longoligonucleotide probes typically use just one or a few probesper gene. The same probe sequence spotted in different loca-tions, or probe sequences complementary to different parts ofthe same gene, can be used to give within-array replication.Short oligonucleotide microarrays typically use a larger num-ber per gene, for example, 11 for the HU133 Affymetrix arrayper gene. Such a set of 11 is called a probeset for that gene.The probes in a probeset are arranged randomly over the array.In the biological literature, microarrays also are referred to as(gene) chips or slides.
When the first microarray platforms were introduced in theearly 1990s, the most intriguing fact about them was the sheernumber of genes that could be assayed simultaneously. Assaysthat used to be done one gene at a time suddenly could be pro-duced for thousands of genes at once. A decade later, high-density microarrays would even fit entire genomes of higherorganisms. After the initial euphoria, the research communitybecame aware that findings based solely on microarray mea-surements were not always as reproducible as they would haveliked, and that studies with inconclusive results were quite com-mon. With this high-throughput measurement technology be-coming established in many branches of life sciences research,scientists in both academic and corporate environments raisedtheir expectations concerning the validity of the measurements.Data quality issues are now frequently addressed at meetingsof the Microarray Gene Expression Database group. The Mi-croarray Quality Control Project, a community-wide effort, un-der the auspices of the US Food and Drug Administration, isaiming to establish operational metrics to objectively assess theperformance of seven microarray platforms and develop mini-mal quality standards. Their assessment is based on the perfor-mance of a set of standardized external RNA controls. The first
formal results of this project have been published in a series ofarticles in the September 2006 issue of Nature Biotechnology.
Assessing the quality of microarray data has emerged as anew research topic for statisticians. In this article we concep-tualize microarray data quality issues from a perspective thatincludes the technology itself as well as their practical use bythe research community. We characterize the nature of microar-ray data from a quality assessment perspective and explain thedifferent levels of microarray data quality assessment. We thenfocus on short oligonucleotide microarrays to develop a set ofspecific statistical data quality assessment methods includingboth numerical measures and spatial diagnostics.
Assumptions and hopes about the quality of the measure-ments have become a major issue in microarray purchasing. De-spite their substantially higher costs, Affymetrix short oligonu-cleotide microarrays have become a widespread alternative tocDNA chips. Informally, they are considered the industry stan-dard microarray platform. More recently, Agilent’s noncontactprinted high-density cDNA microarrays and Illumina’s bead ar-rays have fueled the competition for high-quality chips. Scien-tists feel the need for systematic quality assessment methodsto allow them to compare different laboratories, different chipgenerations, or different platforms. They lack good methods forselecting chips of sufficiently high quality to be included in sta-tistical data analysis beyond preprocessing. We have observedthe following questionable practices in the recent past:
• Skipping hybridization quality assessment (QA)/qualitycontrol (QC) all together
• Discarding entire batches of chips after the detection of afew poor-quality chips
• Basing hybridization QA/QC on raw data rather than ondata that already had large-scale technical biases removed
• Delaying any QA/QC until all hybridizations are com-pleted, thereby losing the opportunity to remove specificcauses of poor quality at an early stage
• Focusing on validation by another measurement technol-ogy such as quantitative polymerase chain reaction (PCR)in publication requirements, rather than addressing thequality of the microarray data in the first place
• Merging data of variable quality into one database, withthe inherent risk of swamping it with poor-quality data(produced at a faster rate due to fewer replicates, fewerquality checks, less redoing of failed hybridizations, etc.).
The community of microarray users has not yet agreed ona framework to measure accuracy or precision in microarrayexperiments. Without universally accepted methods for qualityassessment and guidelines for acceptance, statisticians’ judg-ments about data quality may be perceived as arbitrary by ex-perimentalists. Users’ expectations as to the level of gene ex-pression data quality vary substantially. They can depend ontime frame and financial constraints, as well as on the purposeof their data collection. Shewhart (1939, p. 120) explained thestandpoint of the applied scientist:
He knows that if he were to act upon the meagre evidence sometimes availableto the pure scientist, he would make the same mistakes as the pure scientistmakes in estimates of accuracy and precisions. He also knows that through hismistakes someone may lose a lot of money or suffer physical injury or both.[. . . ] He does not consider his job simply that of doing the best he can with theavailable data; it is his job to get enough data before making this estimate.
TECHNOMETRICS, AUGUST 2008, VOL. 50, NO. 3

QUALITY ASSESSMENT FOR SHORT OLIGONUCLEOTIDE MICROARRAY DATA 243
Following this philosophy, microarray data used for medical di-agnostics should meet high quality standards. In contrast, for astudy of the etiology of a complex genetic disease in a hetero-geneous population, one may decide to tolerate lower standardsat the level of individual microarrays and invest the resourcesin a larger sample size. Scientists need informative quality as-sessment tools to allow them to choose the most appropriatetechnology and optimal experimental design for their precisionneeds, within their time and budget constraints.
The explicit goals of quality assessment for microarraysare manifold. Which goals can be envisioned depends on theresources and time horizon and on the kind of user: singlesmall user, big user, core facility, multicenter study, or “re-searcher into quality.” The findings can be used to simply ex-clude chips from further study or to recommend that samplesbe reprocessed. They can be embedded in a larger data qualitymanagement and improvement plan. Typical quality phenom-ena to look for include the following:
• Outlier chips• Trends or patterns over time• Effects of particular hybridization conditions and sample
characteristics• Changes in quality between batches of chips, cohorts of
samples, laboratory sites, and so on• Systematic quality differences between subgroups of a
study.
Some aspects of quality assessment and control for cDNAmicroarrays have been discussed in the literature. Beissbarthet al. (2000) and Finkelstein et al. (2002) emphasized theneed for quality control and replication. Wang, Ghosh, andGuo (2001) defined a quality score for each spot based on in-tensity characteristics and spatial information, whereas Hau-taniemi et al. (2003) approached this with Baysian networks.Smyth, Yang, and Speed (2003) and Ritchie et al. (2006) sug-gested explicit statistical quality measures based on individualspot observations using the image analysis software Spot fromYang, Buckley, and Speed (2001). Model, König, Piepenbrock,and Adorjan (2002) applied multivariate statistical process con-trol to detect single outlier chips. The preprocessing and datamanagement software package arrayMagic of Buness, Hu-ber, Steiner, Sultmann, and Poustka (2005) includes quality di-agnostics. The book by Zhang, Shmulevich, and Astola (2004)is a comprehensive collection of quality assessment and con-trol issues concerning the various stages of cDNA microarrayexperiments, including sample preparation, all from an experi-mentalist’s perspective. Novikov and Barillot (2005) suggestedspot quality scores based on the variance of the ratio estimatesof replicates (on the same chip or on different chips). Spatialbiases also have been addressed. In examining the relationshipbetween signal intensity and print order, Smyth (2002) revealeda plate effect. The normalization methodology of Yang et al.(2002) incorporated spatial information, such as print-tip groupor plate, to remove spatial biases created by the technologi-cal processes. Kluger, Yu, Qian, and Gerstein (2003) and Qian,Kluger, Yu, and Gerstein (2003) found pairwise correlations be-tween genes due to their relative positioning of spots on theslide and suggested a localized mean normalization method toadjust for this. Tom, Gilks, Brooke-Powell, and Ajioka (2005)
proposed a method of identifying poor-quality spots and of ad-dressing this by assigning quality weights. Reimers and Wein-stein (2005) developed an approach for the visualization andquantitation of regional bias applicable to both cDNA andAffymetrix microarrays.
For Affymetrix arrays, the GCOS commercial software(Affymetrix, Inc. 2004) includes a quality report with a dozenscores for each microarray (see Sec. 3.2). None of these makesuse of the gene expression summaries directly, and there are nouniversally recognized guidelines as to which range should beconsidered good quality for each of the GCOS quality scores.Users of short oligonucleotide chips have found the quality pic-ture delivered by the GCOS quality report to be incomplete orinsufficiently sensitive, and rarely helpful in assigning causes topoor quality. The literature on quality assessment and controlfor short oligonucleotide arrays remains sparse, although theimportance of the topic has been stressed in numerous places,and some authors have addressed specific issues. An algorithmfor probeset quality assessment has been suggested by Bol-stad (2003). Naef, Socci, and Magnasco (2003) transferred theweight of a measurement to a subset of probes with optimallinear response at a given concentration. Gautier, Moller, Friis-Hansen, and Knudsen (2004b) investigated the effect of up-dating the mapping of probes to genes on the estimated ex-pression values. Smith and Hallett (2004) defined four typesof degenerate probe behavior based on free energy computa-tions and pattern recognition. Finkelstein (2005) evaluated theAffymetrix quality reports of more than 5,000 chips collectedby St. Jude Children’s Research Hospital over a three-year pe-riod and linked some quality trends to experimental conditions.Hu, Greenwood, and Beyene (2005) extended traditional effectsize models to combine data from different microarray exper-iments, incorporating a quality measure for each gene in eachstudy. The detection of specific quality issues, such as the ex-traction, handling and amount of RNA, has been studied byseveral authors (e.g., Archer, Dumur, Joel, and Ramakrishnan2006; Dumur et al. 2004; Schoor et al. 2003; Thach et al. 2003).
Before deriving new methods for assessing microarray dataquality, we relate the issue to established research into dataquality from other academic disciplines, emphasizing the par-ticular characteristics of microarray data (Sec. 3.1). A concep-tual approach to the statistical assessment of microarray dataquality is suggested in Section 3.2, followed by a summary ofthe existing quality measures for Affymetrix chips.
The theoretical basis of this article is Section 4, where weintroduce new numerical and spatial quality assessment meth-ods for short oligonucleotide arrays. Two important aspects ofour approach are that the quality measures are based on all ofthe data from the array, and the quality measures are computedafter hybridization and data preprocessing.
More specifically, we make use of probe-level and probeset-level quantities obtained as byproducts of preprocessing basedon Robust Multichip Analysis (RMA) and fitting of probe-levellinear models (fitPLM) presented by Irizarry et al. (2003); Bol-stad, Collin, Simpson, Irizarry, and Speed (2004), and Gautier,Cope, Bolstad, and Irizarry (2004a).
Our quality landscapes serve as tools for visual qualityinspection of the arrays after hybridization. These are two-dimensional pseudoimages of the chips based on probe-level
TECHNOMETRICS, AUGUST 2008, VOL. 50, NO. 3
244 JULIA BRETTSCHNEIDER ET AL.
quantities, namely the weights and residuals computed byRMA/fitPLM. These quality landscapes allow us to immedi-ately relate quality to an actual location on the chip, a crucialstep in detecting special causes for poor chip quality. Our nu-merical quality assessment is based on two distributions com-puted at the probeset level, the normalized unscaled standarderror (NUSE) and relative log expression (RLE). If a certainfairly general biological assumption is fulfilled, these distribu-tions can be interpreted for chip quality assessment. We sug-gest ways of conveniently visualizing and summarizing thesedistributions for larger chip sets and of relating this quality as-sessment to other factors in the experiment, to permit the de-tection of special causes for poor quality to reveal biases. Thequality of gene expression data can be assessed on various lev-els, including those of probeset, chip, and batch of chips. Weintroduce the residual scale factor (RSF), a measure of chipbatch quality. This allows us to compare quality across batchesof chips within an experiment or across experiments. All ofour measures can be computed for all available types of shortoligonuceotide chips given the raw data (CEL file) for each chipand the matching chip description (CDF) file. Software pack-ages for this have been described by Bolstad et al. (2005) andare available at www.bioconductor.org.
In Section 6 we extensively illustrate and evaluate our qualityassessment methods on the experimental microarray data setsdescribed in Section 5. To reflect the fact that quality assess-ment is a necessary and fruitful step in studies of any kind, weuse a variety of data sets, involving tissues ranging from fruitfly embryos to human brains and from academic, clinical, andcorporate laboratories. We show how quality trends and pat-terns can be associated with sample characteristics and/or ex-perimental conditions, and we compare our measures with theAffymetrix GCOS quality report.
2. BACKGROUND: MICROARRAY TECHNOLOGYAND APPLICATIONS IN BIOMEDICAL RESEARCH
After the hunt for new genes dominated genetics in the 1980sand 1990s, there has been a remarkable shift in molecular biol-ogy research goals toward a comprehensive understanding ofthe function of macromolecules on different levels in a biolog-ical organism. How and to what extent do genes control theconstruction and maintenance of the organism? What is therole of intermediate gene products such as RNA transcripts?How do the macromolecules interact with others? The lattermay refer to horizontal interaction, such as genes with genesor proteins with proteins, or to vertical interaction, such as be-tween genes and proteins. Genomics and proteomics—in pro-fessional slang summarized as “omics sciences”—have startedto put an emphasis on functions. At the same time, these re-search areas have become more quantitative and have broad-ened the perspective in the sense of observing huge numbers ofmacromolecules simultaneously. These trends have been drivenby recent biotechnological inventions, the most prominent onesbeing microarrays. With these high-throughput molecular mea-surement instruments, the relative concentration of huge num-bers of macromolecules can be obtained simultaneously in oneexperiment. This section gives an overview of the biologicalbackground and the applications of microarrays in biomedical
research. For an extended introduction to omics sciences andmicroarray-based research, we refer to the excellent collectionsof articles in the three Nature Genetics supplements The Chip-ping Forecast I, II, and III (1999, 2002, 2005) and to the recentreview article by Hoheisel (2006).
2.1 Gene Expression and Construction ofBiological Organisms
Although genes are popularly believed to act deterministi-cally—once they are put into place, they function in a prepro-grammed, straightforward way—for biologists, the effect of agene is variable. Most cells in an organism contain essentiallythe same set of genes. However, they look and act differentlydepending on which organ they belong to, the state of the organ(e.g., healthy vs. diseased), the cell developmental stage, or thephase of the cell cycle. This is predominantly the result of dif-ferences in the abundance, distribution, and state of the cells’proteins. According to the central dogma of molecular biology,the production of proteins is controlled by DNA. (For simplic-ity, the exceptions to this rule are omitted here.) Proteins arepolymers built up from 20 different kinds of amino acids. Genesare transcribed into DNA-like macromolecules called mRNA,which shuttle from the chromosomes to the ribosomes. Theretranslation occurs, converting mRNA into the amino acid chainsthat fold into proteins.
The term gene expression is defined as the relative concen-tration of mRNA and protein produced by that gene. Dependingon the context, however, it often is used to refer to only one ofthe two. The gene expression profile of a type of cell usuallyrefers to the relative abundance of each of the mRNA speciesin the total cellular mRNA population. From a practical stand-point, particularly in many areas of medical research, proteinabundance is seen as generally more interesting than mRNAabundance. The measurement of protein abundances, however,remains much more difficult to measure on a large scale thanmRNA abundance.
2.2 Microarray Gene Expression Measurementand Applications
There is one property that is peculiar to nucleic acids: theircomplementary structure. DNA is reliably replicated by sepa-rating the two strands and complementing each of the singlestrands to give a copy of the original DNA. The same mecha-nism can be used to detect a particular DNA or RNA sequencein a mixed sample. The first tool for measuring gene expressionin a sample of cells was introduced in 1975. The Southern blot(named for its inventor) is a multistage laboratory procedurethat produces a pattern of bands representing the activity of asmall set of preselected genes. During the 1980s, spotted arrayson nylon holding bacterial colonies carrying different genomicinserts were introduced. In the early 1990s, the latter were ex-changed for preidentified cDNAs. The introduction of gene ex-pression microarrays on glass slides in the mid-1990s brought asubstantial increase in feature density. With the new technology,gene expression measurements could be obtained in parallel forthousands of genes. Modern microarray platforms can assessthe expression levels of tens of thousands of genes simultane-ously.
TECHNOMETRICS, AUGUST 2008, VOL. 50, NO. 3

QUALITY ASSESSMENT FOR SHORT OLIGONUCLEOTIDE MICROARRAY DATA 245
A gene expression microarray is a small piece of glass ontowhich a priori known DNA fragments called probes are at-tached at fixed positions. In a chemical process called hy-bridization, the microarray is brought into contact with materialfrom a sample of cells. Each probe binds to its complementarycounterpart, a complementary RNA (cRNA) or DNA (cDNA)copy of mRNA from the sample, which we refer to as target.The hybridization reaction product is made visible using fluo-rescent dyes or other (e.g., radioactive) markers, which are ap-plied to the sample before hybridization. The readout of the mi-croarray experiment is a scanned image of the hybridized chip.Microarrays are specially designed to interrogate the genomesof particular organisms, and so there are yeast, fruit fly, worm,and human arrays, to name just a few.
There are three major platforms for microarray-based geneexpression measurement: spotted two-color cDNA arrays, longoligonucleotide arrays, and short oligonucleotide arrays. In theplatform-specific parts of this article, we focus on the latter. Ona short oligonucleotide microarray, each gene is represented onthe array by a probeset that uniquely identifies the gene. Theindividual probes in the set are chosen to have relatively uni-form hybridization characteristics. In the Affymetrix HU133arrays, for example, each probeset consists of 11–20 probesequence pairs. Each pair consists of a perfect match (PM)probe, a 25-base-long oligonucleotide that matches a part of thegene’s sequence, and a corresponding mismatch (MM) probe,which has the same sequence as the PM but with the cen-ter base flipped to its complementary letter. The MM probesare intended to give an estimate of the random hybridizationand cross-hybridization signals, see Lockhart et al. (1996), Lip-shutz, Fodor, Gingeras, and Lockhart (1999), for more details.Other Affymetrix gene expression arrays may differ from theHU133 in the number of probes per probeset. Exon arrays donot have MM probes. Most of the arrays produced by Nim-blegen are composed from 60mer probes, but some use 25merprobes. The number of probes per probeset is adapted to the to-tal number of probesets on the array to make optimal use of thespace.
2.3 Applications of Gene Expression Microarrays inBiomedical Research
Besides being more efficient than the classical gene-by-geneapproach, microarrays open up entirely new avenues for re-search. They offer a comprehensive and cohesive approach tomeasuring the activity of the genome. In particular, this fostersthe study of interactions. A typical goal of a microarray-basedresearch project is the search for genes that behave differentlyin different cell populations. Some of the most common exam-ples for comparisons are diseased versus healthy cells, injuredversus healthy tissue, young versus old organism, and treatedversus untreated cells. More explicitly, life sciences researcherstry to find answers to questions such as the following: Whichgenes are affected by environmental changes or in response toa drug? How do the gene expression levels differ across variousmutants? What is the gene expression signature of a particulardisease? Which genes are involved in each stage of a cellularprocess? Which genes play a role in the development of an or-ganism? Which genes vary their activity with time?
2.4 Other Kinds of Microarrays and Their Applications
The principle of microarray measurement technology hasbeen used to assess molecules other than mRNA. A num-ber of platforms are currently at various stages of develop-ment (see Hoheisel 2006). SNP chips, which detect single nu-cleotide polymorphisms, are an example of a well-developedmicroarray-based genotyping platform. CGH arrays, basedon comparative genome hybridization, permit the analysis ofchanges in gene copy number for huge numbers of probes si-multaneously. A recent modification, representational oligonu-cleotide microarray analysis (ROMA), offers substantially bet-ter resolution. Both SNP chips and CGH arrays are genome-based methods, which, in contrast to the gene expression-basedmethods, can exploit the stability of DNA. The most commonapplication of these technologies is in the localization of dis-ease genes based on association with phenotypic traits. Anti-body protein chips are used to determine the level of proteins ina sample by binding them to antibody probes immobilized onthe chip. This technology is still considered semiquantitative,because the different specificities and sensitivities of the anti-bodies can lead to an inhomogeneity between measurementsthat so far cannot be corrected for. The applications of pro-tein chips are similar to those of gene expression microarrays,except that the measurements are taken one step further down-stream. More recent platforms address multiple levels at thesame time. ChIP-on-chip, also known as genome-wide locationanalysis, is a technique for isolating and identifying the DNAsequences occupied by specific DNA-binding proteins in cells.
2.5 Statistical Challenges
The still-growing list of statistical challenges stimulated bymicroarray data is a tour d’horizon in applied statistics (see,e.g., Speed 2003; McLachlan, Do, and Ambroise 2004; Witand McClure 2004 for broad introductions). From a statisticalstandpoint, a microarray experiment has three main challenges:(a) measurement process as multistep biochemical and techno-logical procedure (array manufacturing, tissue acquisition, sam-ple preparation, hybridization, scanning), with each step con-tributing to the variation in the data; (b) huge numbers of mea-surements of different (correlated) molecular species obtainedin parallel; and (c) unavailability of gold standards covering arepresentative part of these species. Statistical methodology hasbeen developed primarily for gene expression microarrays, butmost of the conceptual work applies directly to many kinds ofmicroarrays, and many of the actual methods can be transferredto other microarray platforms with the characteristics listed ear-lier.
The first steps of the data analysis, often referred to aspreprocessing or low-level analysis, are the most platform-dependent tasks. For two-color cDNA arrays, these include im-age analysis (see, e.g., Yang et al. 2001) and normalization(see, e.g., Yang et al. 2002). For short oligonucleotide chipdata, these include normalization (see, e.g., Bolstad, Irizarry,Astrand, and Speed 2003) and the estimation of gene expressionvalues (see, e.g., Li and Wong 2001; Irizarry et al. 2003; subse-quent work by these groups). Questions regarding the design of
TECHNOMETRICS, AUGUST 2008, VOL. 50, NO. 3

246 JULIA BRETTSCHNEIDER ET AL.
micorarray experiments are relevant mostly for two-color plat-forms (see, e.g., Speed 2003, chap. 2; Kerr 2003; and furtherreferences there).
Analysis beyond the preprocessing steps is often referred toas downstream analysis. The main goal is to identify genes thatact differently in different types of samples. Exploratory meth-ods, such as classification and cluster analysis, have quicklygained popularity for microarray data analysis. (For reviewson such methods from a statistical standpoint, see, e.g., Speed2003, chaps. 2 and 3 and McLachlan et al. 2004, chap. 3.)At the other end of the spectrum, hypothesis-driven inferen-tial statistical methods are now well established. This approachtypically takes a single-gene perspective in the sense that itsearches for individual genes that are expressed differentiallyacross changing conditions (see, e.g., Dudoit, Yang, Speed, andCallow 2002). The main challenge is the imprecision of thegene-specific variance estimate, a problem that has been tackledby strategies incorporating a gene-unspecific component intothe estimate (see, e.g., Efron, Tibshirani, Storey, and Tusher2001; Lönnstedt and Speed 2002; Cui, Hwang, Qiu, Blades, andChurchill 2005 and references therein; Tai and Speed 2006 forthe case of microarray time course data). Testing thousands ofpotentially highly correlated genes simultaneously with only afew replicates raises a substantial multiple-testing problem thathas been systematically addressed by various authors incorpo-rating the Benjamini and Hochberg false discovery rate (FDR)(see, e.g., Storey 2003; Dudoit, Shaffer, and Boldrick 2003).The joint analysis of predefined groups of genes based on apriori knowledge has become an established alternative to thegenome-wide exploratory approaches and gene-by-gene analy-sis (see, e.g., Subramanian et al. 2005; Bild et al. 2006).
Although methodology for microarray data analysis is a fast-growing research area, the epistemologic foundation of this re-search area has gaps. Among other issues, Mehta, Tanik, andAllison (2004) addressed the problem of simultaneous valida-tion of research results and research methods. Allison, Cui,Page, and Sabripour (2006) reviewed the main approaches tomicroarray data analysis developed to date and attempted tounify them. Many software packages for microarray data analy-sis have been made publicly available by academic researchers.In particular, there is the BioConductor project, a community-wide effort to maintain a collection of R packages for genomicsapplications available at www.bioconductor.org. Many of themain packages have been described by Gentleman, Carey, Hu-ber, Irizarry, and Dudoit (2005).
3. MICROARRAYS AND DATA QUALITY
3.1 Characteristics of High-Throughput Molecular Data
Data quality is a well-established aspect of many quantita-tive research fields. The most striking difference between as-sessing the quality of a measurement and assessing the qual-ity of a manufactured item is the additional layer of uncer-tainty. Concerns about the accuracy of measurements have along tradition in physics and astronomy; the entire third chap-ter of the classic book by Shewhart (1939) is devoted to thisfield. Biometrics, psychometrics, and econometrics developedaround similar needs, and many academic fields have grown a
strong quantitative branch. All of them face data quality ques-tions. Clinical trials is a field that is increasingly aware of thequality of large data collections (see Gassman, Owen, Kuntz,Martin, and Amoroso 1995 and other papers in this special is-sue). With its recent massive move into the quantitative field,functional genomics gave birth to what some statisticians callgenometrics. We now touch on the major points that character-ize gene expression microarray data from a QA/QC standpoint.These points apply to other high-dimensional molecular mea-surements as well.
Unknown Kind of Data. As a new technology in the stilllargely unknown terrain of functional genomics, microarraysproduce data sets with few known statistical properties, includ-ing shape of the distribution, magnitude and variance of thegene expression values, and nature of the correlation betweenthe expression levels of different genes. This limits access toexisting statistical methods.
Simultaneous Measurements. Each microarray producesmeasurements for thousands of genes simultaneously. If justone gene at a time was measured, then some version of Shew-hart control charts could no doubt monitor quality. If a smallnumber of genes was measured, then multivariate extensions ofcontrol charts might be adequate. In a way, the use of controlgenes is one attempt by biologists to scale down the task to asize that can be managed by these classical approaches. Controlgenes, however, cannot be considered typical representatives ofthe set of all the genes on the arrays. Further complicating theassessment are two different sources of correlation of gene ex-pression measures, namely the biological interaction of genesand the common measurement process. Biologically meaning-ful correlations between genes can potentially “contaminate”hybridization quality assessment.
Multidisciplinary Teams. Microarray experiments are typ-ically planned, conducted, and evaluated by a team that mayinclude scientists, statisticians, technicians, and physicians. Inthe interdisciplinarity of data production and handling, they aresimilar to large data sets in other research areas. For surveydata, Groves (1987) delineated the risks associated with such a“mélange of workers.” Among other things, he mentioned radi-cally different purposes, lack of communication, disagreementson the priorities among the components of quality, and concen-tration on the “error of choice” in their respective discipline.
The encouragement of close cooperation between scientistsand statisticians to promote measurement quality goes all theway back to Shewhart (1939, p.70):Where does the statistician’s work begin? [. . . ] before one turns over any sam-ple of data to the statistician for the purpose of setting tolerances he should firstask the scientist (or engineer) to cooperate with the statistician in examiningthe available evidence of statistical control. The statistician’s work solely as astatistician begins after the scientist has satisfied himself through the applica-tion of control criteria that the sample has arisen under statistically controlledconditions.
Systematic Errors. As pointed out by Loebl (1990) and, inthe context of clinical trials, by Marinez, McMahan, Barnwell,and Wigodsky (1984), systematic errors in large data sets aremuch more relevant than random errors. Microarrays typicallyare used in studies involving different experimental or obser-vational groups. Quality differences between the groups are apotential source of confounding.
Heterogenous Quality in Data Collections. Often microar-ray data from different sources are merged into a single datacollection. This includes different batches of chips within the
TECHNOMETRICS, AUGUST 2008, VOL. 50, NO. 3

QUALITY ASSESSMENT FOR SHORT OLIGONUCLEOTIDE MICROARRAY DATA 247
same experiment, data from different laboratories participatingin a single collaborative study, and data from different researchteams sharing their measurements with the wider community.Depending on the circumstances, the combination of data typi-cally takes place on one of the following levels: raw data, pre-processed data, gene expression summaries, or lists of selectedgenes. Typically, no quality measures are attached to the data.Even if data are exchanged at the level of CEL files, hetero-geneity can cause problems. Some laboratories filter out chipsor reprocess the samples that were hybridized to chips that didnot pass screening tests, whereas others do not. These are de-cision processes that ideally should follow the same criteria.The nature of this problem is well known in data bank qualityor data warehousing (see, e.g., Wang, Storey, and Firth 1995;Wang 2001; Redman 1992).
Reusing Shared Data. Gene expression data usually aregenerated and used to answer a particular set of biological ques-tions. Data are now often being placed on the Web to enable thegeneral community to verify the analysis and try alternative ap-proaches to the original biological question. Data also may finda secondary use in answering modified questions. The shiftedfocus potentially requires a new round of QA/QC as precisionneeds change and artifacts and biases that did not interfere withthe original goals of the experiment may do so now.
Across-Platform Comparison. Shewhart (1939, p. 112) val-ued the consistency between different measurement meth-ods over consistency in repetition. For microarrays, consis-tency between the measurements of two or more platforms(two-color cDNA, long oligonucleotide, short oligonucleotide[Affymetrix], commercial cDNA [Agilent], and real-time PCR)on RNA from the same sample has been addressed in a num-ber of publications. Some of the earlier studies found little orno agreement (e.g., Kuo, Jenssen, Butte, Ohno-Machado, andKohane 2002; Rogojina, Orr, Song, and Geisert 2003; Jarvi-nen et al. 2004; Zhu, Ping, Shinohara, Zhang, and Baba 2005),whereas others reported mixed results (e.g., Yuen, Wurmbach,Pfeffer, Ebersole, and Sealfon 2002; Barczak et al. 2003; Wooet al. 2004). More recent studies improved the agreement be-tween platforms by controlling for other factors. Shippy et al.(2004) and Yauk, Berndt, Williams, and Douglas (2004) re-stricted comparisons to subsets of genes above the noise level.Mecham et al. (2004) used sequence-based matching of probesinstead of gene identifier-based matching. Irizarry et al. (2005),Wang, He, Band, Wilson, and Liu (2005), and Thompson et al.(2005) used superior preprocessing methods and systematicallydistinguished the laboratory effect from the platform effect(see Draghici, Khatri, Eklund, and Szallasi 2006; Thompsonet al. 2005 for detailed reviews and further references). ForAffymetrix arrays, Woo et al. (2004), Dobbin et al. (2005), andStevens and Doerge (2005) found interlaboratory differences tobe manageable. However, merging data from different gener-ations of Affymetrix arrays is not as straightforward as mightbe expected (e.g., Nimgaonkar et al. 2003; Morris, Yin, Bag-gerly, Wu, and Zhang 2004; Mitchell et al. 2004; Hwang, Kong,Greenberg, and Park 2004; Kong et al. 2005).
3.2 Assessment of Microarray Data Quality
Quality assessment for microarray data can be studied on atleast seven levels:
(1) The raw chip (prehybridization)(2) The sample(3) The experimental design(4) The multistep measurement process(5) The raw data (posthybridization)(6) The statistically preprocessed microarray data(7) The microarray data as entries in a databank.
The last two items are the main focus of this article. The qual-ity of the data after statistical processing (which includes back-ground adjustment, normalization, and probeset summariza-tion) is greatly affected but not entirely determined by the qual-ity of the preceeding five aspects.
The raw microarray data (5) are the result of a multistep pro-cedure. In the case of the expression microarrays, this includesconverting mRNA in the sample to cDNA, labelling the targetmRNA through an in vitro transcription step, fragmenting andthen hybridizing the resulting cRNA to the chip, washing andstaining, and finally scanning the resulting array. Temperatureduring storage and hybridization, the amount of sample, andmixing during hybridization all have a substantial impact onthe quality of the outcome. Seen as a multistep process (4), thequality management for microarray experiments has much incommon with chemical engineering, where numerous interwo-ven quality indicators must be integrated (see, e.g., Mason andYoung 2002). The designer of the experiment (3) aims to mini-mize the impact of additional experimental conditions (e.g., hy-bridization date) and to maximize accuracy and precision forthe quantities having the highest priority, given the primary ob-jectives of the study. Sample quality (2) is a topic in its ownright, strongly tied to the organism and to the institutional set-ting of the study. The question of how sample quality is re-lated to the microarray data has been investigated by Jones et al.(2006) based on various RNA quality measures and chip qualitymeasures, including both Affymetrix scores and our scores. Thechip before hybridization (1) is a manufactured item. The clas-sical theory of quality control for industrial mass productionfounded by Shewhart (1939) provides the appropriate frame-work for assessing chip quality before hybridization.
The Affymetrix GCOS software presents some chipwidequality scores in the Expression Report (RTP file). Theyalso can be computed by the BioConductor R package sim-pleaffy by Wilson and Miller (2005). The document “QCand Affymetrix data” contained in that package discusses theirapplication. The quantities listed next are the most commonlyused ones from the Affymetrix report (descriptions and guide-lines from Affymetrix, Inc. 2001, 2004). Whereas some rangesfor the values are suggested, the manuals mainly emphasize theimportance of consistency of the scores within a set of jointlyanalyzed chips using similar samples and experimental con-ditions. The users also are encouraged to evaluate the scoresjointly. The most common GCOS quality scores are the follow-ing:
• Average Background. The average of the lowest 2% cellintensities on the chip. Affymetrix does not issue officialguidelines but mentions that values typically range from20 to 100 for arrays scanned with the GeneChip Scanner3000. A high background indicates the presence of non-specific binding of salts and cell debris to the array.
TECHNOMETRICS, AUGUST 2008, VOL. 50, NO. 3

248 JULIA BRETTSCHNEIDER ET AL.
• Raw Q (Noise). Measure of the pixel-to-pixel variation ofprobe cells on the chip. The main factors contributing toNoise values are electrical noise of the scanner and sam-ple quality. Older recommendations give a range of 1.5–3.Newer sources, however, do not issue official guidelinesbecause of the strong scanner dependence. They recom-mend that data acquired from the same scanner be checkedfor comparability of Noise values.
• Percent Present. The percentage of probesets called Pre-sent by the Affymetrix detection algorithm. This value de-pends on multiple factors including cell/tissue type, bi-ological or environmental stimuli, probe array type, andoverall quality of RNA. Replicate samples should havesimilar Percent Present values. Extremely low PercentPresent values indicate poor sample quality. A general ruleof thumb is human and mouse chips typically have 30–40Percent Present, and yeast and Escherichia coli have 70–90 Percent Present.
• Scale Factor. Multiplicative factor applied to the signalvalues to make the 2% trimmed mean of signal valuesfor selected probesets equal to a constant. For the HU133chips, the default constant is 500. No general recommen-dation for an acceptable range is given, because the ScaleFactors depend on the constant chosen for the scaling nor-malization (depending on user and chip type).
• GAPDH 3′ to 5′ ratio (GAPDH 3′/5′). Ratio of the inten-sity of the 3′ probe set to the 5′ probe set for the GAPDHgene. It is expected to be an indicator of RNA quality. Thevalue should not exceed 3 (for the single-cycle assay).
4. METHODS: A MICROARRAY QUALITYASSESSMENT TOOLKIT
Perfect Match
The distribution of the (raw) PM values. Whereas we do notconsider this a full quality assessment measure, it can indicateparticular phenomena such as brightness or dimness of the im-age, or saturation. Using this tool in combination with otherquality measures can help detect and exclude technological rea-sons for poor quality. A convenient way to look at the PM distri-butions for a number of chips is to use boxplots. Alternatively,the data can be summarized on the chip level by two single val-ues: the median of the PM of all probes on the chip, abbreviatedMed(PM), and the interquartile range of the PM of all probeson the chip, denoted by IQR(PM).
Our other assessment tools use probe-level and probeset-level quantities obtained as a byproduct of preprocessing algo-rithms developed by Irizarry et al. (2003), Bolstad et al. (2004),and Gautier et al. (2004a). We now recall the basics about theRobust Multichip Analysis (RMA) model (and refer the readerto the foregoing articles for details). Consider a fixed probe-set. Let yij denote the intensity of probe j from this probeset onchip i, usually already background-corrected and normalized.RMA is based on the model
log2 yij = μi + αj + εij, (1)
with αj a probe affinity effect, μi representing the log scale ex-pression level for chip i, and εij an iid centered error with stan-dard deviation σ . For identifiability of the model, we impose
a zero-sum constraint on the αjs. The number of probes in theprobeset depends on the kind of chip (e.g., 11 for the HU133chip). For a fixed probeset, model (1) can be fit robustly usingthe iteratively reweighted least squares (IRLS) algorithm whichdelivers a probeset expression index μ̂i for each chip.
The analysis produces residuals rij and weights wij attachedto probe j on chip i. The weights are used in the IRLS algorithmto achieve robustness. Probe intensities that are discordant withthe rest of the probes in the set are deemed less reliable anddownweighted. The collective behavior of all the weights (orall the residuals) on a chip is our starting point for developingposthybridization chip quality measures. We begin with an ex-planation of a “geographic” approach—images of the chips thathighlight potential poorly performing probes—and then con-tinue with a discussion of numerical quality assessment meth-ods.
Quality Landscapes
An image of a hybridized chip can be constructed by shadingthe positions in a rectangular grid according to the magnitudeof the PM in the corresponding position on the actual chip. Inthe same way, the positions can be colored according to probe-level quantities other than the simple intensities. A typical colorcode uses shades of red for positive residuals and shades of bluefor negative ones, with darker shades corresponding to higherabsolute values. Shades of green are used for the weights, withdarker shades indicating lower weights. Because the weightsare in a sense the reciprocals of the absolute residuals, the over-all information gained from these two types of quality land-scapes is the same. In some particular cases, the sign of theresiduals can help detect patterns that otherwise would havebeen overlooked.
If no colors are available, then gray-level images are used.This has no further implications for the weight landscapes. Forthe residual landscapes, note that red and blue shades are trans-lated into similar gray levels, so the sign of the residuals is lost.Positive and negative residuals can be plotted on two separateimages to avoid this problem.
Normalized Unscaled Standard Error
Fix a probeset. Let σ̂ be the estimated residual standard devi-ation in model (1) and let Wi = ∑
j wij be the total probe weight(of the fixed probeset) in chip i. The expression value estimatefor the fixed probeset on chip i, and its standard error are givenby
μ̂i =∑
j
log2 yij · wij
Wiand SE(μ̂i) =
σ̂
√∑j w2
ij
Wi. (2)
The residual standard deviations vary across the probesetswithin a chip. They provide an assessment of overall goodnessof fit of the model to probeset data for all chips used to fit themodel, but provide no information on the relative precision ofestimated expressions across chips. The latter, however, is ourmain interest when we compare the quality of a chip with thequality of other chips in the same experiment. Replacing the σ̂
by 1 gives what we call the unscaled standard error (USE) of
TECHNOMETRICS, AUGUST 2008, VOL. 50, NO. 3

QUALITY ASSESSMENT FOR SHORT OLIGONUCLEOTIDE MICROARRAY DATA 249
the expression estimate. Another source of heterogeneity is thenumber of “effective” probes, in the sense of being given sub-stantial weight by the fitting procedure for model (1). That thisnumber varies across probesets is obvious when different num-bers of probes per probeset are used on the same chip. Anotherreason is dysfunctional probes, that is, probes with high vari-ability, low affinity, or a tendency to cross-hybridize. To com-pensate for this kind of heterogeneity, we divide the USE byits median over all chips and call this the normalized unscaledstandard error (NUSE),
NUSE(μ̂i) = USE(μ̂i)
Medianι{USE(μ̂ι)}
=√∑
j w2ij
Wi
/
Medianι
{√∑
j w2ιj
Wι
}
. (3)
An interpretation for the NUSE of a fixed probeset becomesapparent after rewriting the USE in the form
USE(μ̂i)2 =
∑
j
(wij
Wi
)2
. (4)
This can be thought of as the sum of the squares of the relativeeffectiveness of the probes contributing to the probeset sum-mary for this chip. Its square root, normalized across all of thechips, is the NUSE.
The NUSE values fluctuate around 1. Chip quality statementscan be made based on the distribution of all of the NUSE val-ues of one chip. As with the PM distributions, we can conve-niently look at NUSE distributions as boxplots, or we can sum-marize the information on the chip level by two single values:the median of the NUSE over all probesets in a particular chip,Med(NUSE), and the interquartile range of the NUSE over allprobesets in the chip, IQR(NUSE).
Relative Log Expression
We first need a reference chip. This is typically the medianchip, which is constructed probeset by probeset as the medianexpression value over all chips in the experiment. (Such a com-putationally constructed reference chip is sometimes called a“virtual chip.”) To compute the relative log expression (RLE)for a fixed probeset, take the difference of its log expression onthe chip to its log expression on the reference chip. Note thatthe RLE is not tied to the RMA, but can be computed from anyexpression value summary. The RLE measures how much themeasurement of the expression of a particular probeset in a chipdeviates from measurements of the same probeset in other chipsof the experiment.
Again, we can conveniently look at the distributions as box-plots, or we can summarize the information on the chip levelby two single values: the median of the RLE over all probe-sets in a particular chip, Med(RLE), and the interquartile rangeof the RLE over all probesets in the chip, IQR(RLE). The lat-ter is a measure of deviation of the chip from the median chip.A priori, this includes both biological and technical variability.In experiments where it can be assumed that
the majority of genes are not biologically affected, (5)
IQR(RLE) is a measure of technical variability in that chip.Even if biological variability is present for most genes,IQR(RLE) is still a sensitive detector of sources of technicalvariability that are larger than biological variability. Med(RLE)is a measure of bias. In many experiments there are reasons tobelieve that
the number of up-regulated genes
≈ the number of down-regulated genes. (6)
In that case any deviation of Med(RLE) from 0 is an indicatorof a bias caused by the technology. The interpretation of theRLE depends on the assumptions (5) and (6) on the biologicalvariability in the data set, but it provides a measure that is con-structed independently of the quality landscapes and the NUSE.
For quality assessment, we summarize and visualize theNUSE, RLE, and PM distributions. We found series of box-plots to be very convenient way to glance over sets of up to100 chips. Outlier chips as well as trends over time or patternrelated to time can be easily spotted. For detecting systematicquality differences related to circumstances of the experimentor properties of the sample, it is helpful to color the boxes ac-cordingly. Typical coloring is according to groups of the exper-iment, sample cohort, laboratory site, hybridization date, timeof day, or a property of the sample (e.g., time in freezer). Toquickly review the quality of larger sets of chips, shorter sum-maries such as the aforementioned median or the interquartilerange of PM, NUSE, and RLE. These single-value summariesat the chip level also are useful for comparing our quality mea-sures with other chip quality scores in scatterplots or for plot-ting our quality measures against continuous parameters relatedto the experiment or the sample. Again, the additional use ofcolors can draw attention to systematic quality changes due totechnical conditions.
Whereas the RLE is a form of absolute measure of quality,the NUSE is not. The NUSE has no units. It is designed to detectdifferences between chips within a batch. However, the mag-nitudes of these differences have no interpretation beyond thebatch of chips analyzed together. We now describe a way toattach a quality assessment to a set of chips as a whole. It isbased on a common residual factor for a batch of jointly ana-lyzed chips. The fitting procedure for RMA estimates a com-mon residual scale factor. It enables us to compare quality be-tween different experiments or between subgroups of chips inone experiment. It has no meaning for single chips.
Residual Scale Factor
This is a quality measure for batches of chips. It does notapply to individual chips, but assesses the quality of batchesof chips. The batches can be a series of experiments or sub-groups of one experiment (defined by, e.g., cohort, experimen-tal conditions, sample properties, or diagnostic groups). Tocompute the residual scale factor (RSF), assume that the dataare background-corrected. Because the background correctionworks on a chip-by-chip basis, it does not matter whether thecomputations were done simultaneously for all batches of chipsor individually. For the normalization, however, we need to findone target distribution to which we normalize all of the chips in
TECHNOMETRICS, AUGUST 2008, VOL. 50, NO. 3

250 JULIA BRETTSCHNEIDER ET AL.
all of the batches. This is important, because the target distribu-tion determines the scale of intensity measures being analyzed.We then fit the model (1) to each batch separately. The algo-rithm delivers, for each batch, a vector of the estimated residualscales for all the probesets. We can now boxplot them to com-pare quality between batches of chips. The median of each iscalled the RSF. A vector of residual scales is a heterogeneousset. To remove the heterogeneity, we can divide the RSF probe-set by probeset, by the median over the estimated scales fromall of the batches. This leads to alternative definitions of theforegoing quantities, which we call normalized residual scalesand the normalized residual scale factor (NRSF). The normal-ization leads to more discrimination between the batches buthas the drawback of having no units.
Software for the computation and visualization of the qualitymeasures and the interpretation of the statistical plots has beendiscussed by Bolstad et al. (2005). The code is publicly avail-able at www.bioconductor.org in the R package affyPLM. Thepackage also contains the function fitPLM for fitting probe-level linear models of the kind described by formula (1) as wellas extensions of it. Note that the implementation of the NUSEin affyPLM differs slightly from formula (3). It is based on the“true” standard error as derived from M-estimation theory in-stead of the total weight expression in formula (2). However,the difference is small enough to not matter for any of the ap-plications of the NUSE in chip quality assessment.
5. DATA SETS
Affymetrix HU95 Spike-In Experiments
Here 14 human cRNA fragments corresponding to transcriptsknown to be absent from RNA extracted from pancreas tissuewere spiked into aliquots of the hybridization mix at differ-ent concentrations, which we call chip patterns. The patternsof concentrations from the spike-in cRNA fragments acrossthe chips form a latin square. The chip patterns are denotedby A, B, . . . , S and T, with A, . . . , L occurring just once andM and Q being repeated four times each. Chip patterns N, O,and P are the same as that pattern M, while patterns R, S,and T are the same as Q. Each chip pattern was hybridizedto three chips selected from three different lots, referred to as-the L1521, L1532, and L2353 series. (See www.affymetrix.com/support/technical/sample.data/datasets.affx for further detailsand data download.) For this article we use the data from the24 chips generated by chip patterns M, N, O, P, Q, R, S, T withthree replicates each.
St. Jude Children’s Research Hospital LeukemiaData Collection
The study by Yeoh et al. (2002) was conducted to deter-mine whether gene expression profiling could enhance risk as-signment for pediatric acute lymphoblastic leukemia (ALL).The risk of relapse plays a central role in tailoring therapy in-tensity. A total of 389 samples were analyzed for the study,from which high-quality gene expression data were obtainedon 360 samples. Distinct expression profiles identified each
of the prognostically important leukemia subtypes, includ-ing T–ALL, E2A–PBX1, BCR–ABL, TEL–AML1, MLL re-arrangement, and hyperdiploid > 50 chromosomes. In addition,another ALL subgroup was identified based on its unique ex-pression profile. Ross et al. (2003) reanalyzed 132 cases ofpediatric ALL from the original 327 diagnostic bone marrowaspirates using the higher-density HU133A and B arrays. Theselection of cases was based on having sufficient numbers ofeach subtype to build accurate class predictions, rather than re-flecting the actual frequency of these groups in the pediatricpopulation. The follow-up study identified additional markergenes for subtype discrimination and improved the diagnosticaccuracy. The data from these studies are publicly available assupplementary data.
Fruit Fly Mutant Pilot Study
Gene expression of nine fruit fly mutants were screened us-ing Affymetrix DrosGenome1 arrays. The mutants are charac-terized by various forms of dysfunctionality in their synapses.RNA was extracted from fly embryos, pooled, and labelled.Three to four replicates per mutant were hybridized on six dif-ferent days. In most cases, technical replicates were hybridizedon the same day. The data were collected by Tiago Magalhãesin the Goodman Lab at the University of California at Berkeley,to gain experience with the new microarray technology.
Fruit Fly Time Series
A large population of wild-type (Canton-S) fruit flies wassplit into 12 cages and allowed to lay eggs, which were trans-ferred into an incubator and aged for 30 minutes. From that timeonward, at the end of each hour for the next 12 hours, embryosfrom one plate were washed on the plate, dechorionated, andfrozen in liquid nitrogen. Three independent replicates were hy-bridized for each time point. Because each embryo sample con-tained a distribution of different ages, they examined the distri-bution of morphological stage-specific markers in each sampleto correlate the time-course windows with the nonlinear scaleof embryonic stages. RNA was extracted, pooled, labeled, andhybridized to Affymetrix DrosGenome1 arrays. Hybridizationwas done on two different days. This data set was collected byPavel Tomanc̆ák in the Rubin Laboratory at the University ofCalifornia at Berkeley, as a part of a comprehensive study onspatial and temporal patterns of gene expression in fruit fly de-velopment (Tomanc̆ák et al. 2002). The raw microarray data(CEL files) are publically available at the project’s website,www.fruitfly.org/cgi-bin/ex/insitu.pl.
Pritzker Data Collection
The Pritzker neuropsychiatric research consortium usesbrains obtained at autopsy from the Orange County Coroner’sOffice through the Brain Donor Program at the University ofCalifornia at Irvine, Department of Psychiatry. RNA samplesare obtained from the left sides of the brains. Labeling of to-tal RNA, chip hybridization, and scanning of oligonucleotidemicroarrays are carried out at independent sites (University ofCalifornia at Irvine, University of California at Davis, and Uni-versity of Michigan). Hybridizations are done on HU95 and
TECHNOMETRICS, AUGUST 2008, VOL. 50, NO. 3

QUALITY ASSESSMENT FOR SHORT OLIGONUCLEOTIDE MICROARRAY DATA 251
later generations of Affymetrix chips. In this article we evaluatethe quality of data used in two early studies by the Pritzker con-sortium. The gender study by Vawter et al. (2004) is motivatedby gender difference in prevalence for some neuropsychiatricdisorders. The raw data set has HU95 chip data on 13 subjectsin 3 regions (anterior cingulate cortex, dorsolateral prefrontalcortex, and cortex of the cerebellar hemisphere). The mood dis-order study described by Bunney et al. (2003) is based on agrowing collection of gene expression measurements in ulti-mately 25 regions. Each sample was prepared and then split sothat it could be hybridized to the chips at both Michigan andeither Irvine or Davis.
6. RESULTS
We start by illustrating our quality assessment methods onthe well-known Affymetrix spike-in experiments. The qualityof these chips is well above what can be expected from an aver-age lab experiment. We then proceed with data collected in sci-entific studies from a variety of tissue types and experimentaldesigns. We highlight different aspects of quality analysis meth-ods throughout this section. We compare our quality analysisresults with the Affymetrix quality report for several sections ofthe large, publicly available St. Jude Children’s Research Hos-pital gene expression data collection.
(A) Outlier in the Affymetrix Spike-In Experiments
This collection comprises 24 HU95A chips from the Af-fymetrix spike-in data set. All but the spike-in probesets areexpected to be nondifferentially expressed across the arrays.Because there are only 14 spike-ins out of about 20,000 probe-sets, they are, from a quality assessment standpoint, essentially24 identical hybridizations. A glance at the weight (or residual)landscapes gives a picture of homogeneous hybridizations withalmost no local defects on any chip except chip 20 (Fig. A1).The NUSE indicates that chip 20 is an outlier. Its median is wellabove 1.10, whereas all others are smaller than 1.05, and its IQRis threefold or more larger than for any other chip (Fig. A2). Theseries of boxplots of the RLE distributions confirms these find-ings. The median is well below 0, and the IQR is twofold ormore times larger than for any other chip. Chip 20 has botha technologically caused bias and a higher noise level. TheAffymetrix quality report (Fig. A3), however, does not clearlyclassify chip 20 as an outlier. Its GAPDH 3′/5′ of about 2.8 is
Figure A1. Weight landscapes of two chips from the AffymetrixHU95 spike-in experiment. The chip on the right side is typical for thisdata set, only tiny local defects and an overall good probe performance.The chip on the left side (chip 20) has more down-weighted probes allover the slide and a large down-weighted area in its upper left part.
the largest within this chip set, but this value is considered ac-ceptable. According to all other Affymetrix quality measures—Percent Present, Noise, Average Background, Scale Factor—chip 20 is within a group of lower-quality chips, but does notstand out.
(B) Outlier in the St. Jude’s Data Not Detected by theAffymetrix Quality Report
The collection of MLL HU133B chips consists of 20 chips,one of which turns out to be an outlier. The NUSE boxplots(Fig. B1, bottom line) show a median of about 1.2 for chip C5,whereas all others are below 1.02. The IQR is much larger forchip C5 than for any other chip. The RLE boxplots (Fig. B1,top line) also distinguish chip C5 as an obvious outlier. Themedian is about −.26 for the outlier chip, whereas it is veryclose to 0 for all other chips. The IQR is about twice as largeas the largest of the IQRs of the other chips. Figure B1 displaysthe weight landscapes of chip C5 along with those of two ofthe typical chips. A region on the left side of chip C5, coveringalmost one-third of the total area, is strongly down-weighted,and the chip has elevated weights overall. The Affymetrix qual-ity report (Fig. B3) paints a very different picture—chip C5 isan outlier on the Med(NUSE) scale, but does not stand out onany of the common Affymetrix quality assessment measures:Percent Present, Noise, Scale Factor, or GAPDH 3′/5′.
(C) Overall Comparison of Our Measures and theAffymetrix Quality Report for a Large Numberof St. Jude’s Chips
Figure C1 pairs the Med(NUSE) with the four most com-mon GCOS scores on a set of 129 HU133A chips from theSt. Jude data set. There is noticable linear association be-tween Med(NUSE) and Percent Present, as well as betweenMed(NUSE) and Scale Factor. GAPDH 3′/5′ does not show alinear association with any the other scores.
(D) Disagreement Between Our Quality Measures andthe Affymetrix Quality Report for the Hyperdip>50Subgroup in the St. Jude’s Data
The Affymetrix quality report detects problems with manychips in this data set. For chip A, Raw Q (Noise) is out ofthe recommended range for the majority of the chips: 12, 14,C1, C13, C15, C16, C18, C21, C22, C23, C8, and R4. AverageBackground detects chip 12 as an outlier. Scale Factor does notshow any clear outliers. Percent Present is within the typicalrange for all chips. GAPDH 3′/5′ is below 3 for all chips. Forchip B, Raw Q (Noise) is out of the recommended range for thechips 12, 8, 18, and R4. Average Background detects chips 12and 8 as outliers. Scale Factor does not show any clear outliers.Percent Present never exceeds 23% in this chip set, and it is be-low the typical minimum of 20% for chips 8, C15, C16, C18,C21, and C4. GAPDH 3′/5′ is satisfactory for all chips.
Our measures suggest that with one exception, the chips areof good quality (Fig. D1). The heterogeneity of the PM distri-butions does not persist after the preprocessing. For chip A,chip 12 has the largest IQR(RLE) and is a clear outlieramong the NUSE distributions. Two other chips have elevated
TECHNOMETRICS, AUGUST 2008, VOL. 50, NO. 3

252 JULIA BRETTSCHNEIDER ET AL.
Figure A2. Series of boxplots of NUSE (a) and RLE (b) of 24 chips from the Affymetrix HU95 spike-in experiment. Chip 20 is a clear outlieraccording to all of our quality measures: Med(RLE), IQR(RLE), Med(NUSE), and IQR(NUSE).
Figure A3. Affymetrix GCOS quality scores and IQR(RLE) for the 24 chips from the Affymetrix HU95 spike-in experiment with the threetechnical replicates in different gray levels (left/center/right in each vertical plot). The outlier chip 20 from Figure A2 is the chip 4 in this figure.It is caught by GAPDH 3′/5′. By all other GCOS quality scores, it is placed within the group of lower-quality chips, but it does not stand out.
TECHNOMETRICS, AUGUST 2008, VOL. 50, NO. 3

QUALITY ASSESSMENT FOR SHORT OLIGONUCLEOTIDE MICROARRAY DATA 253
Figure B1. Series of boxplots of RLE (a) and NUSE (b) for all 20 MLL 133B chips from St. Jude’s. Chip C5 is an outlier according to allour quality measures: Med(RLE), IQR(RLE), Med(NUSE), and IQR(NUSE).
IQR(RLE) but do not stand out according to NUSE. For chipB, the RLE distributions are very similar, with chip 12 againhaving the largest IQR(RLE). The NUSE distributions are con-sistently showing good quality with the exception of chip 12.
(E) Varying Quality Between Diagnostic Subgroupsin the St. Jude’s Data
Each boxplot in Figure E1 sketches the RSFs of the chips ofall diagnostic subgroups. They show substantial quality differ-ences. The E2A_PBX1 subgroup has a much higher Med(RSF)than the other subgroups. The T_ALL subgroup has a slightlyelevated Med(RSF) and a higher IQR(RSF) than the other sub-groups.
(F) Hybridization Date Effects on Quality ofFruit Fly Chips
The fruit fly mutant with dysfunctional synapses was oneof the first biological systems studied by this laboratory us-ing Affymetrix technology. It shows a wide range of quality.In the boxplot series of RLE and NUSE (Fig. F1), the depen-dency on the hybridization date is striking. The chips of thetwo mutants hybridized on the day colored in yellow show sub-stantially lower quality than any of the other chips. Figure F2shows a weight landscape revealing smooth mountains and val-leys. Whereas the pattern is particularly strong in the chip cho-sen for this picture, it is quite typical for the chips in this dataset. We are not sure about the specific technical reason for this,
Figure B2. Weight images for some of St. Jude’s MLL HU133B chips. Chips C1 and C2 show low weights overall and small areas withhigher weights. Chip C5 has elevated weights overall and a region covering almost one-third of the total area with extremly high weights.
TECHNOMETRICS, AUGUST 2008, VOL. 50, NO. 3

254 JULIA BRETTSCHNEIDER ET AL.
Figure B3. Med(NUSE) versus GCOS quality scores for 20 MLL HU133B chips from St. Jude’s data. The outlier chip C5 is in the normalrange according to all GCOS quality scores.
but assume that it is related to insufficient mixing during thehybridization.
(G) Temporal Trends or Biological Variation inFruit Fly Time Series
The series consists of 12 developmental stages of fruit fly em-bryos hybridized in three technical replicates each. Whereas thelog2(PM) distributions are very similar in all chips, we can spottwo kinds of systematic patterns in the RLE and NUSE box-plots (Fig. G1). One pattern is connected to the developmentalstage. Within each single series of the three repeat time series,the hybridizations in the middle stages look “better” than thosein the early and late stages. This may be, at least to some extent,due to biological rather than technological variation. In embryodevelopment, especially in the beginning and at the end, hugenumbers of genes are expected to be affected, which is a po-tential violation of assumption (5). Insufficient staging in thefirst very short developmental stages may further increase thevariability. Also, in the early and late stages of development,there is substantial doubt about the symmetry assumption (6).Another systematic trend in this data set is connected to the re-peat series. The second dozen chips are of poorer quality than
the others. In fact, we learned that they were hybridized on adifferent day from the rest.
The pair plot in Figure G2 illustrates the relationships amongour chip quality measures. There is no linear association be-tween the raw intensities—summarized as Med(PM)—and anyof the quality measures. A weak linear association can benoted between Med(RLE) and IQR(RLE). It is noteworthythat it becomes much stronger when focusing on just thechips hybridized on the day colored in black. IQR(RLE) andMed(NUSE) again have a weak linear association that becomesstronger when looking at only one of the subgroups, exceptthis time it is the chips colored in light blue. For the pairingMed(RLE) and Med(NUSE), however, there is no linear rela-tionship. Finally (not shown), as in the dysfunctional synapsesmutant fruit fly data set, a double-wave gradient (as shown inFig. F2 for the other fruit fly data set) can be seen in the qualitylandscapes of many of the chips. Although these experimentswere conducted by a different team of researchers, they used thesame equipment as used in generating the other fruit fly data set.
(H) Laboratory Differences in Pritzker’s Gender Study
We looked at the HU95 chip data from 13 individuals in twobrain regions, the cortex of the cerebellar hemisphere (i.e., cere-
TECHNOMETRICS, AUGUST 2008, VOL. 50, NO. 3

QUALITY ASSESSMENT FOR SHORT OLIGONUCLEOTIDE MICROARRAY DATA 255
Figure C1. Med(NUSE) versus GCOS quality scores for 129 St. Jude’s HU133A chips. Chips with top three Med(NUSE) values are high-lighted. Med(NUSE) shows a linear association with Percent Present (% Present) and Scale Factor (SF). Noise shows some association withScale Factor, though not quite a linear one. However, the association between Noise and Med(NUSE) is very weak. GAPDH 3′/5′ does not showa linear association with any of the GCOS quality scores or with Med(NUSE). The NUSE values in this plot were computed using 1/
√Wi as an
approximation for the unscaled standard error.
Figure D1. Boxplots of qualilty measures for St. Jude’s HyperdipHU133A chips. (a) PM; (b) RLE; (c) NUSE. The PM (log-scaled)distributions are heterogeneous. Chips 12, 8, and 14 have elevatedIQR(RLE). Chip 12 is a clear outlier in NUSE. The bulk of the chipsare of good quality according to both NUSE and RLE.
Figure D2. Boxplots of qualilty measures for St. Jude’s HyperdipHU133B chips. (a) PM; (b) RLE; (c) NUSE. The PM (log-scaled) dis-tributions are heterogeneous. Chip 12 has elevated IQR(RLE). Chip 12is a clear outlier in NUSE. The bulk of the chips are of good qualityaccording to both NUSE and RLE.
TECHNOMETRICS, AUGUST 2008, VOL. 50, NO. 3

256 JULIA BRETTSCHNEIDER ET AL.
Figure E1. Boxplots of the estimated residual scales for diagnos-tic subgroups in the St. Jude’s data set, demonstrating notable qualitydifferences.
bellum) and the dorsolateral prefrontal cortex. With some ex-ceptions, each sample was hybridized in both Lab M and Lab I.The NUSE and RLE boxplots (Fig. H1) for the cerebellum dataset display an eye-catching pattern: They show systematicallymuch better quality in Lab M than in Lab I. This might becaused by overexposure or saturation effects in Lab I. The me-dians of the raw intensities (PM) in Lab I are, on a log2-scale,between about 9 and 10.5, whereas they are very consistentlyabout 2 to 4 points lower in Lab M. The dorsolateral prefrontalcortex hybridizations show for the most part a laboratory effect
Figure F2. “Waves.” Weight image for a typical chip in the fruit flymutant data set.
similar to the one we saw in the cerebellum chips (plots notshown here).
(I) Laboratory Differences in Pritzker’s MoodDisorder Study
After the experiences with laboratory differences in the gen-der study, the consortium extended their efforts to minimizethese problems. In particular, the machines were calibrated byAffymetrix specialists. Figure I1 summarizes the quality as-sessments of three of the Pritzker mood disorder data sets. Weare looking at HU95 chips from two sample cohorts (a totalof about 40 subjects) in each of three brain regions: the anteriorcingulate cortex, cerebellum, and dorsolateral prefrontal cortex.
Figure F1. Series of boxplots of log-scaled PM intensities (a), RLE (b), and NUSE (c) for a comparison of nine fruit fly mutants with threeto four technical replicates each. The patterns below the plot indicate mutants, and the gray levels of the boxes indicate hybridization dates.Med(RLE), IQR(RLE), Med(NUSE), and IQR(NUSE) all indicate substantially lower quality on the day colored white.
TECHNOMETRICS, AUGUST 2008, VOL. 50, NO. 3

QUALITY ASSESSMENT FOR SHORT OLIGONUCLEOTIDE MICROARRAY DATA 257
Figure G1. Series of boxplots of log-scaled PM intensities (a), RLE (b), and NUSE (c) in the fruit fly development data. Boxes 1–12 represent12 developmental stages (visualized by different gray levels), boxes 13–24 and boxes 25–36 represent replicates of the whole series. Replicateseries B (boxes 13–24) was hybridized on a different day than the other two series. Both RLE and NUSE indicate lower quality for series B. Thefirst couple of chips and the last couple of chips of each series are different from the rest in terms of Med(RLE) deviating from 0 (in varyingdirections), with IQR(RLE) being larger and Med(NUSE) being elevated. This likely is driven mainly by the increased high biological variabilityin these stages.
In terms of Med(PM), for each of the three brain regions, thetwo replicates came closer to each other; the difference betweenthe two laboratories in the mood disorder study is one-third orless of the difference between the two laboratories in the genderstudy (see first two boxes in each of the three parts of Fig. I1,and compare with Fig. H1). This is due to Lab I dropping inintensity (toward Lab M) and the new Lab D also operatingat that level. The consequence of the intensity adjustments forchip quality do not form a coherent story. Whereas for the cere-bellum, the quality in Lab M is still better than in the replicatein one of the other laboratories, the ranking is reversed for theother two brain regions. Effects of a slight underexposure inLab M may now have become more visible. Generally, in allbrain regions, the quality differences between the two laborato-ries are still there, but they are much smaller than those in thegender study data.
(J) Assigning Special Causes of Poor Quality forthe St. Jude’s Data
We evaluated eight quality landscapes from the early St.Jude’s data, a collection of 335 HU133Av2 chips. The ex-
amples were chosen because they were particularly strongcases of certain kinds of shortcomings that occur repeatedlyin this chip collection. They do not represent the generalquality level in the early St. Jude’s chips, and even less sothe quality of later St. Jude’s chips. Quality landscapes forall St. Jude’s chips can be downloaded from Bolstad’s ChipGallery at www.plmimagegallery.bmbolstad.com.
Figure J1, “Bubbles,” is the residual landscape of chipHyperdip-50-02. There are small dots in the left upper part ofthe slide and two larger ones in the middle of the slide. We at-tribute the dots to dust attached to the slide or to air bubblesstuck in this area during the hybridization. Furthermore, thereis an accumulation of positive residuals in the bottom right cor-ner. Areas of elevated residuals near the corners and edges ofthe slide are very common, and often are much larger than thosein this chip. Mostly they are positive. The most likely explana-tion are air bubbles that, because of insufficient mixing duringthe hybridization, stuck close to the edge at which they hadmigrated when this edge was in a higher position to start withor brought up there by the rotation. Note that there typically is
TECHNOMETRICS, AUGUST 2008, VOL. 50, NO. 3

258 JULIA BRETTSCHNEIDER ET AL.
Figure G2. Paired quality measures for fruit fly development with chips colored depending on the day of the hybridization. Med(PM) hasno linear association with any of the other measures. IQR(RLE) and Med(NUSE) show a linear association on the day colored light blue and aweak linear association on the day colored black.
some air in the solution injected into the chip (through a littlehole near one of the edges), but this air is moved around by therotation during the hybridization to minimize the effects on theprobe measurements.
Figure J2, “Circle and stick,” is the residual landscape ofHyperdip47-50-C17. It shows two kinds of spatial patternslikely caused by independent technical shortcomings. First,there is a circle with equally spaced darker spots (approxi-mately). The symmetry of the shape suggests that it was causedby a foreign object scratching trajectories of the rotation dur-ing hybridization into the slide. Second, there are little dots thatalmost seem to be aligned along a straight line connecting thecircle to the upper right corner. These dots might be air bubblesstuck to some invisible, thin, straight object or scratch.
Figure J3, “Sunset,” is the residual landscape of Hyperdip-50-C6. This chip illustrates two independent technical deficien-cies. First, there is a disk in the center of the slide. This might becaused by insufficient mixing, but the sharpness with which thedisk is separated from the rest of the image calls for additionalexplanations. Second, the image obviously splits into upper and
lower rectangular parts with different residuals, separated by astraight border. As a most likely explanation, we attribute thisto scanner problems.
Figure J4, “Pond,” is the residual landscape of TEL–AML1-2M03. The nearly centered disc covers almost the entire slide.It might be caused by the same mechanisms responsible for thesmaller disc in the previous figure. However, in this data collec-tion we have only seen two sizes of discs—the small disk as inthe previous figure and the large one as in this figure. This raisesthe question of why the mechanism that causes them does notproduce medium-size discs.
Figure J5, “Letter S,” is the residual landscape of Hypodip-2M03. The striking pattern—the letter “S” with the “cloud” ontop—is a particularly curious example of a common technicalshortcoming. We attribute the spatially heterogeneous distribu-tion of the residuals to insufficient mixing of the solution duringthe hybridization.
Figure J6, “Compartments,” is the residual landscape ofHyperdip-50-2M02. This is a unique chip. One explanationwould be that the vertical curves separating the three compart-ments of this image are long, thin foreign objects (e.g., hair)
TECHNOMETRICS, AUGUST 2008, VOL. 50, NO. 3

QUALITY ASSESSMENT FOR SHORT OLIGONUCLEOTIDE MICROARRAY DATA 259
Figure H1. Series of boxplots of log-scaled PM intensities (a), RLE (b), and NUSE (c) for Pritzker gender study brain samples hybridizedin two labs (some replicates missing). Gray level indicates lab site (dark for Lab M, light for Lab I). The log-scaled PM intensity distributionsare all located around 6 for Lab M, and around 10 for Lab I. These systematic lab site differences are reflected by IQR(RLE), Med(NUSE), andIQR(NUSE), which consistently show substantially lower quality for Lab I hybridizations than for Lab M hybridizations.
that got onto the chip and inhibited the liquid from spreadingequally over the entire chip.
Figure J7, “Triangle,” is the residual landscape of TEL–AML1-06. The triangle might be caused by a long foreign ob-ject stuck to the center of the slide on one end and free, and thusmanipulated by the rotation, on the other end.
Figure J8, “Fingerprint,” is the residual landscape of Hyperdip-50-C10. What looks like a fingerprint on the picture actuallymight be one. With the slide measuring 1 cm × 1 cm, the pat-tern is about the size of a human fingerprint.
7. DISCUSSION
Quality Landscapes
The residual landscape contains the maximum information.In the weight pictures, the magnitude of the derivation is pre-served, but the sign is lost. Therefore, unrelated local defectscan appear indistinguishable in weight landscapes. The land-scapes provide a first impression of the overall quality of thearray; a square filled with low-level noise typically comes froma good quality chip, whereas one filled with high-level noisecomes from a chip with uniformly bad probes. If the landscapereveals any spatial patterns, then the quality may or may not be
compromised, depending on the size of the problematic area.Even a couple of strong local defects may not lower the chipquality, as indicated by our measures. The reason for this lies inboth the chip design and the RMA model (1). The probes be-longing to one probeset are scattered around the chip, ensuringthat a bubble or small scratch would affect only a small numberof the probes in a probeset; even a larger underexposed or over-exposed area of the chip may affect only a minority of probes ineach probeset. Because the model is fitted robustly, its expres-sion summaries are shielded against this kind of disturbance.
We found the quality landscape to be most useful in assigningspecial causes of poor chip quality. A quality landscape com-posed of smooth mountains and valleys is most likely causedby insufficient mixing during the hybridization. Smaller andsharper cut-out areas of elevated residuals are typically relatedto foreign objects (e.g., dust, hair) or air bubbles. Symmetriescan indicate that scratching was caused by rotation of particlesduring hybridization. Patterns involving horizontal lines may becaused by scanner miscalibration. It must be noted that the fore-going assignments of causes are educated guesses rather thanfacts. They are the result of extensive discussions with experi-mentalists, but there remains a speculative component to them.Even more hypothetical are some ideas that we have regarding
TECHNOMETRICS, AUGUST 2008, VOL. 50, NO. 3
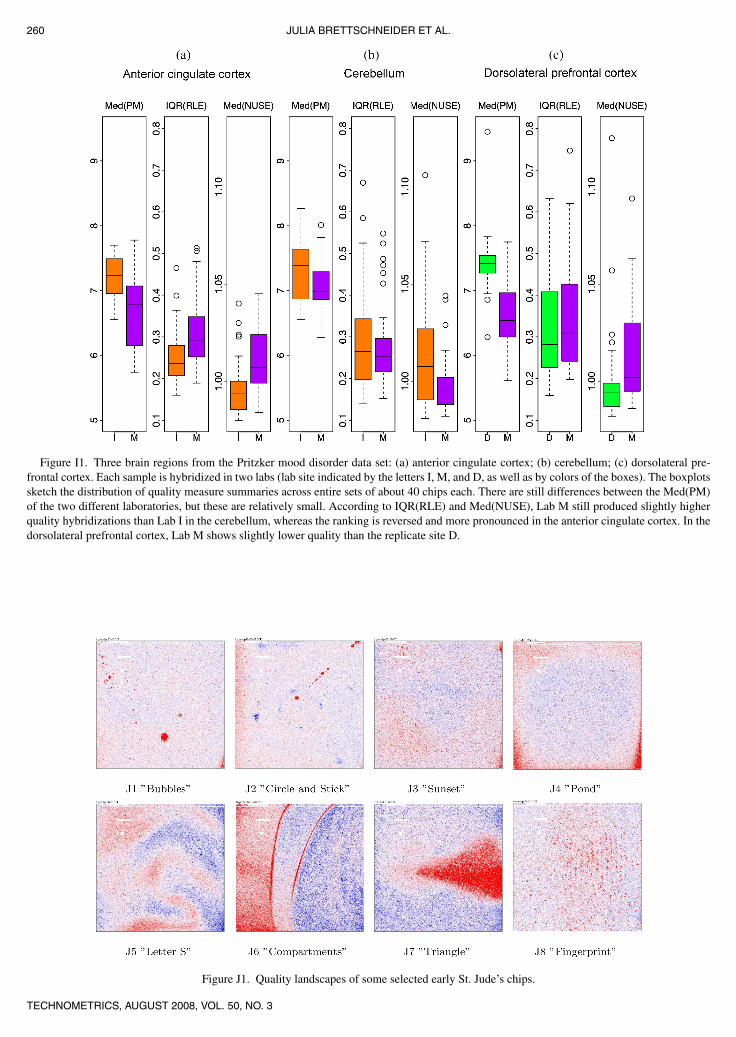
260 JULIA BRETTSCHNEIDER ET AL.
Figure I1. Three brain regions from the Pritzker mood disorder data set: (a) anterior cingulate cortex; (b) cerebellum; (c) dorsolateral pre-frontal cortex. Each sample is hybridized in two labs (lab site indicated by the letters I, M, and D, as well as by colors of the boxes). The boxplotssketch the distribution of quality measure summaries across entire sets of about 40 chips each. There are still differences between the Med(PM)of the two different laboratories, but these are relatively small. According to IQR(RLE) and Med(NUSE), Lab M still produced slightly higherquality hybridizations than Lab I in the cerebellum, whereas the ranking is reversed and more pronounced in the anterior cingulate cortex. In thedorsolateral prefrontal cortex, Lab M shows slightly lower quality than the replicate site D.
Figure J1. Quality landscapes of some selected early St. Jude’s chips.
TECHNOMETRICS, AUGUST 2008, VOL. 50, NO. 3
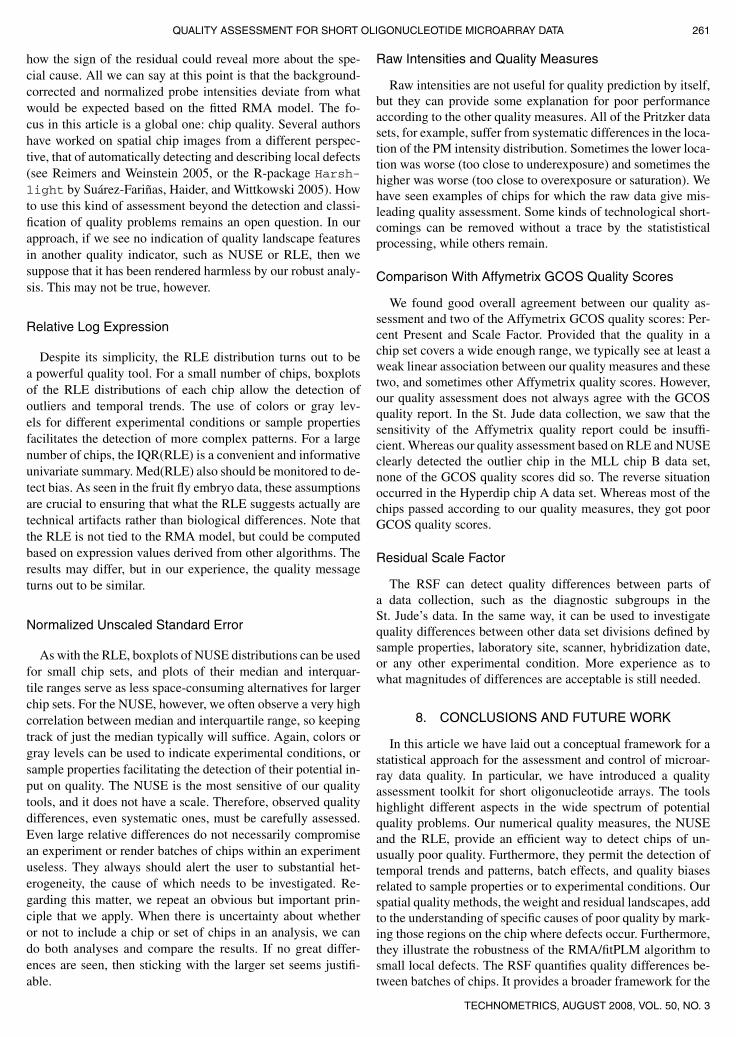
QUALITY ASSESSMENT FOR SHORT OLIGONUCLEOTIDE MICROARRAY DATA 261
how the sign of the residual could reveal more about the spe-cial cause. All we can say at this point is that the background-corrected and normalized probe intensities deviate from whatwould be expected based on the fitted RMA model. The fo-cus in this article is a global one: chip quality. Several authorshave worked on spatial chip images from a different perspec-tive, that of automatically detecting and describing local defects(see Reimers and Weinstein 2005, or the R-package Harsh-light by Suárez-Fariñas, Haider, and Wittkowski 2005). Howto use this kind of assessment beyond the detection and classi-fication of quality problems remains an open question. In ourapproach, if we see no indication of quality landscape featuresin another quality indicator, such as NUSE or RLE, then wesuppose that it has been rendered harmless by our robust analy-sis. This may not be true, however.
Relative Log Expression
Despite its simplicity, the RLE distribution turns out to bea powerful quality tool. For a small number of chips, boxplotsof the RLE distributions of each chip allow the detection ofoutliers and temporal trends. The use of colors or gray lev-els for different experimental conditions or sample propertiesfacilitates the detection of more complex patterns. For a largenumber of chips, the IQR(RLE) is a convenient and informativeunivariate summary. Med(RLE) also should be monitored to de-tect bias. As seen in the fruit fly embryo data, these assumptionsare crucial to ensuring that what the RLE suggests actually aretechnical artifacts rather than biological differences. Note thatthe RLE is not tied to the RMA model, but could be computedbased on expression values derived from other algorithms. Theresults may differ, but in our experience, the quality messageturns out to be similar.
Normalized Unscaled Standard Error
As with the RLE, boxplots of NUSE distributions can be usedfor small chip sets, and plots of their median and interquar-tile ranges serve as less space-consuming alternatives for largerchip sets. For the NUSE, however, we often observe a very highcorrelation between median and interquartile range, so keepingtrack of just the median typically will suffice. Again, colors orgray levels can be used to indicate experimental conditions, orsample properties facilitating the detection of their potential in-put on quality. The NUSE is the most sensitive of our qualitytools, and it does not have a scale. Therefore, observed qualitydifferences, even systematic ones, must be carefully assessed.Even large relative differences do not necessarily compromisean experiment or render batches of chips within an experimentuseless. They always should alert the user to substantial het-erogeneity, the cause of which needs to be investigated. Re-garding this matter, we repeat an obvious but important prin-ciple that we apply. When there is uncertainty about whetheror not to include a chip or set of chips in an analysis, we cando both analyses and compare the results. If no great differ-ences are seen, then sticking with the larger set seems justifi-able.
Raw Intensities and Quality Measures
Raw intensities are not useful for quality prediction by itself,but they can provide some explanation for poor performanceaccording to the other quality measures. All of the Pritzker datasets, for example, suffer from systematic differences in the loca-tion of the PM intensity distribution. Sometimes the lower loca-tion was worse (too close to underexposure) and sometimes thehigher was worse (too close to overexposure or saturation). Wehave seen examples of chips for which the raw data give mis-leading quality assessment. Some kinds of technological short-comings can be removed without a trace by the statististicalprocessing, while others remain.
Comparison With Affymetrix GCOS Quality Scores
We found good overall agreement between our quality as-sessment and two of the Affymetrix GCOS quality scores: Per-cent Present and Scale Factor. Provided that the quality in achip set covers a wide enough range, we typically see at least aweak linear association between our quality measures and thesetwo, and sometimes other Affymetrix quality scores. However,our quality assessment does not always agree with the GCOSquality report. In the St. Jude data collection, we saw that thesensitivity of the Affymetrix quality report could be insuffi-cient. Whereas our quality assessment based on RLE and NUSEclearly detected the outlier chip in the MLL chip B data set,none of the GCOS quality scores did so. The reverse situationoccurred in the Hyperdip chip A data set. Whereas most of thechips passed according to our quality measures, they got poorGCOS quality scores.
Residual Scale Factor
The RSF can detect quality differences between parts ofa data collection, such as the diagnostic subgroups in theSt. Jude’s data. In the same way, it can be used to investigatequality differences between other data set divisions defined bysample properties, laboratory site, scanner, hybridization date,or any other experimental condition. More experience as towhat magnitudes of differences are acceptable is still needed.
8. CONCLUSIONS AND FUTURE WORK
In this article we have laid out a conceptual framework for astatistical approach for the assessment and control of microar-ray data quality. In particular, we have introduced a qualityassessment toolkit for short oligonucleotide arrays. The toolshighlight different aspects in the wide spectrum of potentialquality problems. Our numerical quality measures, the NUSEand the RLE, provide an efficient way to detect chips of un-usually poor quality. Furthermore, they permit the detection oftemporal trends and patterns, batch effects, and quality biasesrelated to sample properties or to experimental conditions. Ourspatial quality methods, the weight and residual landscapes, addto the understanding of specific causes of poor quality by mark-ing those regions on the chip where defects occur. Furthermore,they illustrate the robustness of the RMA/fitPLM algorithm tosmall local defects. The RSF quantifies quality differences be-tween batches of chips. It provides a broader framework for the
TECHNOMETRICS, AUGUST 2008, VOL. 50, NO. 3

262 JULIA BRETTSCHNEIDER ET AL.
quality scores of the individual chips in an experiment. All ofthe quality measures proposed in this article can be computedbased on the raw data using publicly available software.
Deriving the quality assessment directly from the statisticalmodel used to compute the expression values is more powerfulthan basing it on the performance of a particular set of controlprobes, because the control probes may not behave in a waythat is representative for the whole set of probes on the array.The model-based approach also is preferable to quality mea-sures less directly related to the bulk of the expression values.Some of the Affymetrix GCOS quality scores, for example, arederived from the raw probe values and interpret any artifactsas quality problems, even if they are removed by routine pre-processing steps. A lesson from the practical examples in thispaper is the importance of a well-designed experiment. Oneof the most typical sources of bias is an unfortunate system-atic connection between hybridization date and groups of thestudy—a link that could have been avoided by better planning.
More research needs to be done on the attribution of spe-cific causes to poor-quality measurements. Whereas our qual-ity measures, especially, our quality landscapes, are a richsource for finding specific causes of poor quality, a specu-lative component remains. To increase the credibility of thediagnoses, systematic quality experiments need to be con-ducted. A big step forward is Bolstad’s Chip Gallery atwww.plmimagegallery.bmbolstad.com, which collects qualitylandscapes from Affymetrix chip collections, provides detailsabout the experiments and sometimes offers explanations forthe technical causes of poor quality. Started as a collection ofchip curiosities this website is now growing into a visual ency-clopedia for quality assessment. Contributions to the collection,particularly those with known causes of defects, are invited(anonymous if preferred). Further methodological research isneeded to explore the use of the spatial quality assessment forstatistically “repairing” local defects or making partial use oflocally damaged chips.
We are well aware that the range of acceptable values foreach quality score is the burning question for experimentalists.Our quality analysis results with microarray data sets from avariety of scientific studies in Section 6 show that the questionabout the right threshold for good chip quality does not havea simple answer yet, at least not at the present level of gener-ality. Thresholds computed for gene expression measurementsin fruit fly mutant screenings cannot necessarily be transferredto brain disease research or to leukemia diagnosis. Thresholdsneed to be calibrated to the tissue type, the design, and the pre-cision needs of the field of application. We offer two strategiesto deal with this on different levels:
1. Individual researchers. We encouraged researchers to lookfor outliers and artificial patterns in the series of qualitymeasures of the batch of jointly analyzed chips. Further-more, any other form of unusual observations (e.g., a sys-tematic disagreement between NUSE and RLE, or incon-sistencies in the association between raw intensities andquality measures) potentially hints at a quality problem inthe experiment.
2. Community of microarray users. We recommend the de-velopment of quality guidelines. They should be rooted
in extended collections of data sets from scientific exper-iments. Complete raw data sets are ideal, where no pre-vious quality screening has been performed. Careful doc-umentation of the experimental conditions and propertieshelp to link unusual patterns in the quality measures tospecific causes. The sharing of unfiltered raw chip datafrom scientific experiments on the Web and the inclu-sion of chip quality scores in gene expression databankentries can lead the way toward community-wide qualitystandards. Moreover, it contributes to a better understand-ing how quality measures relate to special causes of poorquality. In addition, we encourage the conduction of de-signed microarray quality experiments. Such experimentsexplore the effects of RNA amount, experimental condi-tions, sample properties, and sample handling on the qual-ity measures, as well as on the downstream analysis. Theygive an idea of the range of chip quality to be expected un-der certain experimental conditions, and, again, they helpto characterize specific causes of poor quality.
Benchmarking of microarray data quality will happen oneway or another; if it is not established by community-wideagreements, then the individual experimentalist will resort tojudging on the basis of anecdotal evidence. We recommend theactive development of benchmarks by the community of mi-croarray researchers, experimentalists and data analysts. Thestatistical concepts and methods proposed here may serve asa foundation for the quality benchmarking process.
ACKNOWLEDGMENTS
The authors thank St. Jude Children’s Research Hospital, thePritzker Consortium, Tiago Magalhães, Pavel Tomanc̆ák, andAffymetrix for sharing their data for quality assessment pur-poses. They gratefully acknowledge the support of the NationalInstitutes of Health through the NIMH Silvio O. Conte Cen-ter for Mood Disorders Research (grant 2P50MH060398). Theyalso thank Rafael Irizarry for noticing a mistake in the originalexpression used for the SE in formula (2). They are grateful forthe excellent support received from the Technometrics editors.
[Received March 2006. Revised March 2007.]
REFERENCES
Affymetrix, Inc. (2001), Guidelines for Assessing Data Quality, Santa Clara,CA.
(2004), GeneChip Expression Analysis: Data Analysis Fundamentals,Santa Clara, CA.
Alizadeh, A. A., Eisen, M. B., Davis, R. E., Ma, C., Lossos, I. S., Rosenwald,A., Boldrick, J. C., Sabet, H., Tran, T., Yu, X., Powell, J. I., Yang, L.,Marti, G. E., Moore, T., Hudson, J., Lu, L., Lewis, D. B., Tibshirani, R.,Sherlock, G., Chan, W. C., Greiner, T. C., Weisenburger, D. D., Armitage,J. O., Warnke, R., Levy, R., Wilson, W., Grever, M. R., Byrd, J. C., Botstein,D., Brown, P. O., and Staudt, L. M. (2000), “Distinct Types of Diffuse LargeB–Cell Lymphoma Identified by Gene Expression Profiling,” Nature, 403,503–511.
Allison, D., Cui, X., Page, G., and Sabripour, M. (2006), “Microarray DataAnalysis: From Disarray to Consolidation and Consensus,” Nature ReviewGenetics, 7, 55–65.
TECHNOMETRICS, AUGUST 2008, VOL. 50, NO. 3

QUALITY ASSESSMENT FOR SHORT OLIGONUCLEOTIDE MICROARRAY DATA 263
Archer, K., Dumur, C., Joel, S., and Ramakrishnan, V. (2006), “Assessing Qual-ity of Hybridized RNA in Affymetrix GeneChip Experiments Using MixedEffects Models,” Biostatistics, 7, 198–212.
Barczak, A., Rodriguez, M., Hanspers, K., Koth, L., Tai, Y., Bolstad, B., Speed,T., and Erle, D. (2003), “Spotted Long Oligonucleotide Arrays for HumanGene Expression Analysis,” Genome Research, 1, 1775–1785.
Beissbarth, T., Fellenberg, K., Brors, B., Arribas-Prat, R., Boer, J., Hauser,N. C., Scheideler, M., Hoheisel, J. D., Schutz, G., Poustka, A., and Vingron,M. (2000), “Processing and Quality Control of DNA Array HybridizationData,” Bioinformatics, 16, 1014–1022.
Bild, A., Yao, G., Chang, J., Wang, Q., Potti, A., Chasse, D., Joshi, M., Harpole,D., Lancaster, J., Berchuck, A., Olson, J. J., Marks, J., Dressman, H., West,M., and Nevins, J. (2006), “Oncogenic Pathway Signatures in Human Can-cers as a Guide to Targeted Therapies,” Nature, 439, 353–357.
Bolstad, B. (2003), “Low-Level Analysis of High-Density OligonucleotideArray Data: Background, Normalization and Summarization,” unpublisheddoctoral thesis, University of California at Berkeley, Statistics Dept., avail-able at http://bmbolstad.com.
Bolstad, B., Collin, F., Brettschneider, J., Simpson, K., Cope, L., Irizarry, R.,and Speed, T. (2005), “Quality Assessment of Affymetrix GeneChip Data,”in Bioinformatics and Computational Biology Solutions Using R and Bio-conductor, eds. R. Gentleman, V. Carey, W. Huber, R. Irizarry, and S. Dudoit,New York: Springer, pp. 33–48.
Bolstad, B., Collin, F., Simpson, K., Irizarry, R., and Speed, T. (2004), “Exper-imental Design and Low-Level Analysis of Microarray Data,” InternationalReview of Neurobiology, 60, 25–58.
Bolstad, B., Irizarry, R., Astrand, M., and Speed, T. (2003), “A Comparison ofNormalization Methods for High-Density Oligonucleotide Array Data Basedon Variance and Bias,” Bioinformatics, 19, 185–193.
Buness, A., Huber, W., Steiner, K., Sultmann, H., and Poustka, A. (2005),“arrayMagic: Two-Colour cDNA Microarray Quality Control and Pre-processing,” Bioinformatics, 21, 554–556.
Bunney, W., Bunney, B., Vawter, M., Tomita, H., Li, J., Evans, S., Choudary, P.,Myers, R., Jones, E., Watson, S., and Akil, H. (2003), “Microarray Technol-ogy: A Review of New Strategies to Discover Candidate Vulnerability Genesin Psychiatric Disorders,” American Journal of Psychiatry, 160, 657–666.
Cho, R., Campbell, M., Winzeler, E., Steinmetz, L., Conway, A., Wodicka, L.,Wolfsberg, T., Gabrielian, A., Landsman, D., Lockhart, D., and Davis, R.(1998), “A Genome-Wide Transcriptional Analysis of the Mitotic Cell Cy-cle,” Molecular Cell, 2, 65–73.
Cui, X., Hwang, J., Qiu, J., Blades, N., and Churchill, G. (2005), “ImprovedStatistical Tests for Differential Gene Expression by Shrinking VarianceComponents Estimates,” Biostatistics, 6, 31–46.
Dobbin, K., Beer, D., Meyerson, M., Yeatman, T., Gerald, W., Jacobson, W.,Conley, B., Buetow, K., Heiskanen, M., Simon, R., Minna, J., Girard, L.,Misek, D., Taylor, J., Hanash, S., Naoki, K., Hayes, D., Ladd-Acosta, C.,Enkemann, S., Viale, A., and Giordano, T. (2005), “Interlaboratory Compa-rability Study of Cancer Gene Expression Analysis Using OligonucleotideMicroarrays,” Clinical Cancer Research, 11, 565–572.
Draghici, S., Khatri, P., Eklund, A., and Szallasi, Z. (2006), “Reliability and Re-producibility Issues in DNA Microarray Measurements,” Trends in Genetics,22, 101–109.
Dudoit, S., Shaffer, J., and Boldrick, J. (2003), “Multiple Hypothesis Testing inMicroarray Experiments,” Statistical Science, 18, 71–103.
Dudoit, S., Yang, Y., Speed, T., and Callow, M. J. (2002), “Statistical Methodsfor Identifying Differentially Expressed Genes in Replicated cDNA Microar-ray Experiments,” Statistica Sinica, 12, 111–139.
Dumur, C., Nasim, S., Best, A., Archer, K., Ladd, A., Mas, V., Wilkinson,D., Garrett, C., and Ferreira-Gonzalez, A. (2004), “Evaluation of Quality-Control Criteria for Microarray Gene Expression Analysis,” Clinical Chem-istry, 50, 1994–2002.
Efron, B., Tibshirani, R., Storey, J., and Tusher, V. (2001), “Empirical BayesAnalysis of a Microarray Experiment,” Journal of the American StatisticalAssociation, 96, 1151–1160.
Finkelstein, D. (2005), “Trends in the Quality of Data From 5168 Oligonu-cleotide Microarrays From a Single Facility,” Journal of Biomolecular Tech-niques, 16, 143–153.
Finkelstein, D., Ewing, R., Gollub, J., Sterky, F., Cherry, J., and Somerville,S. (2002), “Microarray Data Quality Analysis: Lessons From the AFGCProject,” Plant Molecular Biology, 48, 119–131.
Gassman, J., Owen, W., Kuntz, T., Martin, J., and Amoroso, W. (1995), “DataQuality Assurance, Monitoring, and Reporting,” Controlled Clinical Trials,16 (2 Suppl), 104S–136S.
Gautier, L., Cope, L., Bolstad, B., and Irizarry, R. (2004a), “affy-Analysis ofAffymetrix GeneChip Data at the Probe Level,” Bioinformatics, 20, 307–315.
Gautier, L., Moller, M., Friis-Hansen, L., and Knudsen, S. (2004b), “AlternativeMapping of Probes to Genes for Affymetrix Chips,” BMC Bioinformatics, 5,e111.
Gentleman, R., Carey, V., Huber, W., Irizarry, R., and Dudoit, S. E. (2005),Bioinformatics and Computational Biology Solutions Using R and Biocon-ductor, New York: Springer.
Groves, R. (1987), “Research on Survey Data Quality,” Public OpinionQuaterly, 51 (Part 2, Suppl), S156–S172.
Hautaniemi, S., Edgren, H., Vesanen, P., Wolf, M., Järvinen, A., Yli-Harja, O.,Astola, J., Kallioniemi, O., and Monni, O. (2003), “A Novel Strategy forMicroarray Quality Control Using Bayesian Networks,” Bioinformatics, 19,2031–2038.
Hoheisel, J. (2006), “Microarray Technology: Beyond Transcript Profiling andGenotype Analysis,” Nature Review Genetics, 7, 200–210.
Hu, P., Greenwood, C., and Beyene, J. (2005), “Integrative Analysis of MultipleGene Expression Profiles With Quality-Adjusted Effect Size Models,” BMCBioinformatics, 6, e128.
Hwang, K., Kong, S., Greenberg, S., and Park, P. (2004), “Combining Gene Ex-pression Data From Different Generations of Oligonucleotide Arrays,” BMCBioinformatics, 5, e159.
Irizarry, R., Bolstad, B., Collin, F., Cope, L., Hobbs, B., and Speed, T. (2003),“Summaries of Affymetrix GeneChip Probe Level Data,” Nucleic Acids Re-search, 31, e15.
Irizarry, R., Warren, D., Spencer, F., Kim, I., Biswal, S., Frank, B., Gabrielson,E., Garcia, J., Geoghegan, J., Germino, G., Griffin, C., Hilmer, S., Hoffman,E., Jedlicka, A., Kawasaki, E., Martinez-Murillo, F., Morsberger, L., Lee, H.,Petersen, D., Quackenbush, J., Scott, A., Wilson, M., Yang, Y., Ye, S., andYu, W. (2005), “Multiple-Laboratory Comparison of Microarray Platforms,”Nature Methods, 2, 345–350.
Jarvinen, A.-K., Hautaniemi, S., Edgren, H., Auvinen, P., Saarela, J.,Kallioniemi, O.-P., and Monni, O. (2004), “Are Data From Different GeneExpression Microarray Platforms Comparable?” Genomics, 83, 1164–1168.
Jones, L., Goldstein, D., Hughes, G., Strand, A., Collin, F., Dunnett, S.,Kooperberg, C., Aragaki, A., Olson, J., Augood, S., Faull, R., Luthi-Carter,R., Moskvina, V., and Hodges, A. (2006), “Assessment of the RelationshipBetween Pre-Chip and Post-Chip Variables for Affymetrix GeneChip Ex-pression Data,” BMC Bioinformatics, 7, e211.
Kerr, M. (2003), “Design Considerations for Efficient and Effective MicroarrayStudies,” Biometrica, 59, 822–828.
Kluger, Y., Yu, H., Qian, J., and Gerstein, M. (2003), “Relationship BetweenGene Co-Expression and Probe Localization on Microarray Slides,” BMCGenomics, 4, e49.
Kong, S., Hwang, K., Kim, R., Zhang, B., Greenberg, S., Kohane, I., and Park,P. (2005), “CrossChip: A System Supporting Comparative Analysis of Dif-ferent Generations of Affymetrix Arrays,” Bioinformatics, 21, 2116–2117.
Kuo, W., Jenssen, T., Butte, A., Ohno-Machado, L., and Kohane, I. (2002),“Analysis of Matched mRNA Measurements From Two Different Microar-ray Technologies,” Bioinformatics, 18, 405–412.
Li, C., and Wong, H. (2001), “Model-Based Analysis of Oligonucleotide Ar-rays: Expression Index Computation and Outlier Detection,” Proceedings ofthe National Academy of Sciences of the USA, 98, 31–36.
Lipshutz, R., Fodor, S., Gingeras, T., and Lockhart, D. (1999), “High-DensitySynthetic Oligonucleotide Arrays,” Nature Genetics, 21, 20–24.
Lockhart, D., Dong, H., Byrne, M., Follettie, M., Gallo, M., Chee, M.,Mittmann, M., Wang, C., Kobayashi, M., Horton, H., and Brown, E. (1996),“Expression Monitoring by Hybridization to High-Density OligonucleotideArrays,” Nature Biotechnology, 14, 1675–1680.
Loebl, A. (1990), “Accuracy and Relevance and the Quality of Data,” in DataQuality Control, Theory and Pragmatics, eds. G. Liepins and V. Uppuluri,New York: Marcel Dekker, pp. 105–144.
Lönnstedt, I., and Speed, T. (2002), “Replicated Microarray Data,” StatisticaSinica, 12, 31–46.
Marinez, Y., McMahan, C., Barnwell, G., and Wigodsky, H. (1984), “EnsuringData Quality in Medical Research Through an Integrated Data ManagementSystem,” Statistics in Medicine, 3, 101–111.
Mason, R., and Young, J. (2002), Multivariate Statistical Process Control WithIndustrial Applications, Philadelphia: ASA–SIAM.
McLachlan, G., Do, K., and Ambroise, C. (2004), Analyzing Microarray GeneExpression Data, Hoboken, NJ: Wiley.
Mecham, B., Klus, G., Strovel, J., Augustus, M., Byrne, D., Bozso, P., Wetmore,D., Mariani, T., Kohane, I., and Szallasi, Z. (2004), “Sequence-MatchedProbes Produce Increased Cross-Platform Consistency and More Repro-ducible Biological Results in Microarray-Based Gene Expression Measure-ments,” Nucleic Acids Research, 32, 74.
Mehta, T., Tanik, M., and Allison, D. (2004), “Towards Sound EpistemologicalFoundations of Statistical Methods for High-Dimensional Biology,” NatureGenetics, 36, 943–947.
Mitchell, S., Brown, K., Henry, M., Mintz, M., Catchpoole, D., LaFleur, B., andStephan, D. (2004), “Inter-Platform Comparability of Microarrays in AcuteLymphoblastic Leukemia,” BMC Genomics, 5, e71.
TECHNOMETRICS, AUGUST 2008, VOL. 50, NO. 3

264 JULIA BRETTSCHNEIDER ET AL.
Model, F., König, T., Piepenbrock, C., and Adorjan, P. (2002), “StatisticalProcess Control for Large-Scale Microarray Experiments,” Bioinformatics,18 (Suppl 1), 155–163.
Morris, J., Yin, G., Baggerly, K., Wu, C., and Zhang, L. (2004), “Pooling Infor-mation Across Different Studies and Oligonucleotide Microarray Chip Typesto Identify Prognostic Genes for Lung Cancer,” in Methods of MicroarrayData Analysis III, eds. J. Shoemaker and S. Lin, New York: Springer, pp. 51–66.
Naef, F., Socci, N., and Magnasco, M. (2003), “A Study of Accuracy and Pre-cision in Oligonucleotide Arrays: Extracting More Signal at Large Concen-trations,” Bioinformatics, 19, 178–184.
Nimgaonkar, A., Sanoudou, D., Butte, A., Haslett, J., Kunkel, L., Beggs, A., andKohane, I. (2003), “Reproducibility of Gene Expression Across Generationsof Affymetrix Microarrays,” BMC Bioinformatics, 4, e27.
Novikov, E., and Barillot, E. (2005), “An Algorithm for Automatic Evalua-tion of the Spot Quality in Two-Color DNA Microarray Experiments,” BMCBioinformatics, 6, e293.
Perou, C., Sorlie, T., Eisen, M., van de Rijn, M., Jeffrey, S., Rees, C., Pollack, J.,Ross, D., Johnsen, H., Akslen, L., Fluge, O., Pergamenschikov, A., Williams,C., Zhu, S., Lonning, P., Borresen-Dale, A., Brown, P., and Botstein, D.(2000), “Molecular Portraits of Human Breast Tumours,” Nature, 406, 747–752.
Qian, J., Kluger, Y., Yu, H., and Gerstein, M. (2003), “Identification and Cor-rection of Spurious Spatial Correlations in Microarray Data,” Biotechniques,35, 42–44.
Ramaswamy, S., and Golub, T. (2002), “DNA Microarrays in Clinical Oncol-ogy,” Journal of Clinical Oncology, 20, 1932–1941.
Redman, T. (1992), Data Quality: Management and Technology, New York:Bantam Books.
Reimers, M., and Weinstein, J. (2005), “Quality Assessment of Microarrays:Visualization of Spatial Artifacts and Quantitation of Regional Biases,” BMCBioinformatics, 6, e166.
Ritchie, M., Diyagama, D., Neilson, J., van Laar, R., Dobrovic, A., Holloway,A., and Smyth, G. K. (2006), “Empirical Array Quality Weights in the Analy-sis of Microarray Data,” BMC Bioinformatics, 7, e261.
Rogojina, A., Orr, W., Song, B., and Geisert, E. J. (2003), “Comparing the Useof Affymetrix to Spotted Oligonucleotide Microarrays Using Two RetinalPigment Epithelium Cell Lines,” Molecular Vision, 9, 482–496.
Ross, M., Zhou, X., Song, G., Shurtleff, S., Girtman, K., Williams, W., Liu,H., Mahfouz, R., Raimondi, S., Lenny, N., Patel, A., and Downing, J. (2003),“Classification of Pediatric Acute Lymphoblastic Leukemia by Gene Expres-sion Profiling,” Blood, 102, 2951–2959.
Schoor, O., Weinschenk, T., Hennenlotter, J., Corvin, S., Stenzl, A.,Rammensee, H., and Stevanovic, S. (2003), “Moderate Degradation DoesNot Preclude Microarray Analysis of Small Amounts of RNA,” Biotech-niques, 35, 1192–1196.
Shewhart, W. (1939), Statistical Method From the Viewpoint of Quality Control,Lancaster, PA: Lancaster Press.
Shippy, R., Sendera, T., Lockner, R., Palaniappan, C., Kaysser-Kranich, T.,Watts, G., and Alsobrook, J. (2004), “Performance Evaluation of Commer-cial Short-Oligonucleotide Microarrays and the Impact of Noise in MakingCross-Platform Correlations,” BMC Genomics, 5, e61.
Smith, K., and Hallett, M. (2004), “Towards Quality Control for DNA Microar-rays,” Journal of Computational Biology, 11, 945–970.
Smyth, G. (2002), “Print-Order Normalization of cDNA Microarrays,” tech-nical report, Genetics and Bioinformatics, Walter and Eliza Hall Instituteof Medical Research, available at www.statsci.org/smyth/pubs/porder/porder.html.
Smyth, G., Yang, H., and Speed, T. (2003), “Statistical Issues in cDNA Mi-croarray Data Analysis,” in Functional Genomics, Methods and Protocols,eds. M. J. Brownstein and A. B. Khodursky, Totowa, NJ: Humana Press,pp. 111–136.
Speed, T. (2003), Statistical Analysis of Gene Expression of Gene ExpressionMicroarray Data, Boca Raton, FL: Chapman & Hall/CRC.
Stevens, J., and Doerge, R. (2005), “Combining Affymetrix Microarray Re-sults,” BMC Bioinformatics, 6, e57.
Storey, J. (2003), “The Positive False Discovery Rate: A Bayesian Interpreta-tion and the q-Value,” The Annals of Statistics, 31, 2013–2035.
Suárez-Fariñas, M., Haider, A., and Wittkowski, K. (2005), “‘Harshlighting’Small Blemishes on Microarrays,” BMC Bioinformatics, 6, e65.
Subramanian, A., Tamayo, P., Mootha, V., Mukherjee, S., Ebert, B., Gillette,M., Paulovich, A., Pomeroy, S., Golub, T., Lander, E., and Mesirov, J. (2005),“Gene Set Enrichment Analysis: A Knowledge-Based Approach for Inter-preting Genomewide Expression Profiles,” PNAS, 102, 155545–155550.
Tai, Y., and Speed, T. (2006), “A Multivariate Empirical Bayes Statistic forReplicated Microarray Time Course Data,” The Annals of Statistics, 34,2387–2412.
Thach, D., Lin, B., Walter, E., Kruzelock, R., Rowley, R., Tibbetts, C., andStenger, D. (2003), “Assessment of Two Methods for Handling Blood inCollection Tubes With RNA Stabilizing Agent for Surveillance of Gene Ex-pression Profiles With High-Density Microarrays,” Journal of Immunologi-cal Methods, 283, 269–279.
The Chipping Forecast (1999), The Chipping Forecast I, Vol. 21-1s, NatureGenetics Supplement.
(2002), The Chipping Forecast II, Vol. 32-4s, Nature Genetics Supple-ment.
(2005), The Chipping Forecast III, Vol. 37-6s, Nature Genetics Sup-plement.
Thompson, K., Rosenzweig, B., Pine, P., Retief, J., Turpaz, Y., Afshari, C.,Hamadeh, H., Damore, M., Boedigheimer, M., Blomme, E., Ciurlionis, R.,Waring, J., Fuscoe, J., Paules, R., Tucker, C., Fare, T., Coffey, E., He,Y., Collins, P., Jarnagin, K., Fujimoto, S., Ganter, B., Kiser, G., Kaysser-Kranich, T., Sina, J., and Sistare, F. (2005), “Use of a Mixed Tissue RNADesign for Performance Assessments on Multiple Microarray Formats,” Nu-cleic Acid Research, 33, e187.
Tom, B., Gilks, W., Brooke-Powell, E., and Ajioka, J. (2005), “Quality Deter-mination and the Repair of Poor Quality Spots in Array Experiments,” BMCBioinformatics, 6, e234.
Tomanc̆ák, P., Beaton, A., Weiszmann, R., Kwan, E., Shu, S., Lewis, S.,Richards, S., Ashburner, M., Hartenstein, V., Celniker, S., and Rubin, G.(2002), “Systematic Determination of Patterns of Gene Expression DuringDrosophila Embryogenesis,” Genome Biology, 3, 1–14.
Vawter, M., Evans, S., Choudary, P., Tomita, H., Meador-Woodruff, J., Molnar,M., Li, J., Lopez, J., Myers, R., Cox, D., Watson, S., Akil, H., Jones, E., andBunney, W. (2004), “Gender-Specific Gene Expression in Post-Mortem Hu-man Brain: Localization to Sex Chromosomes,” Neuropsychopharmacology,29, 373–384.
Wang, H., He, X., Band, M., Wilson, C., and Liu, L. (2005), “A Study ofInter-Lab and Inter-Platform Agreement of DNA Microarray Data,” BMCGenomics, 6, e71.
Wang, R. (2001), Data Quality, Boston: Kluwer Academic Publishers.Wang, R., Storey, V., and Firth, C. (1995), “A Framework for Analysis of Data
Quality Research,” IEEE Transactions of Knowledge and Data Engineering,7, 623–640.
Wang, X., Ghosh, S., and Guo, S. (2001), “Quantitative Quality Control in Mi-croarray Image Processing and Data Acquisition,” Nucleic Acids Research,29, e75.
Wilson, C., and Miller, C. (2005), “Simpleaffy: A BioConductor Package forAffymetrix Quality Control and Data Analysis,” Bioinformatics, 21, 3683–3685.
Wit, E., and McClure, J. (2004), Statistics for Microarrays: Design, Analysis,Inference, Hoboken, NJ: Wiley.
Woo, Y., Affourtit, J., Daigle, S., Viale, A., Johnson, K., Naggert, J., andChurchill, G. (2004), “A Comparison of cDNA, Oligonucleotide, andAffymetrix GeneChip Gene Expression Microarray Platforms,” Journal ofBiomolecular Techniques, 15, 276–284.
Yang, Y., Buckley, M., and Speed, T. (2001), “Analysis of cDNA MicroarrayImages,” Briefings in Bioinformatics, 2, 341–349.
Yang, Y., Dudoit, S., Luu, P., Lin, D., Peng, V., Ngai, J., and Speed, T. (2002),“Normalization for cDNA Microarray Data: A Robust Composite MethodAddressing Single and Multiple Slide Systematic Variation,” Nucleic AcidsResearch, 30, e15.
Yauk, C., Berndt, M., Williams, A., and Douglas, G. (2004), “ComprehensiveComparison of Six Microarray Technologies,” Nucleic Acids Research, 32,e124.
Yeoh, E., Ross, M., Shurtleff, S., Williams, W., Patel, D., Mahfouz, R., Behm,F., Raimondi, S., Relling, M., Patel, A., Cheng, C., Campana, D., Wilkins,D., Zhou, X., Li, J., Liu, H., Pui, C., Evans, W., Naeve, C., Wong, L., andDowning, J. (2002), “Classification, Subtype Discovery, and Prediction ofOutcome in Pediatric Acute Lymphoblastic Leukemia by Gene ExpressionProfiling,” Cancer Cell, 1, 133–143.
Yuen, T., Wurmbach, E., Pfeffer, R., Ebersole, B., and Sealfon, S. (2002), “Ac-curacy and Calibration of Commercial Oligonucleotide and Custom cDNAMicroarrays,” Nucleic Acids Research, 30, e48.
Zhang, W., Shmulevich, I., and Astola, J. (2004), Microarray Quality Control,Hoboken, NJ: Wiley.
Zhu, B., Ping, G., Shinohara, Y., Zhang, Y., and Baba, Y. (2005), “Comparisonof Gene Expression Measurements From cDNA and 60-mer OligonucleotideMicroarrays,” Genomics, 85, 657–665.
TECHNOMETRICS, AUGUST 2008, VOL. 50, NO. 3