Quadrupole Mass Spectrometry Concepts - Hiden Analytical · Quadrupole Mass Spectrometers for...
30
www.HidenAnalytical.com Quadrupole Mass Spectrometry Concepts Mass Spectrometers for Residual Gas Analysis
Transcript of Quadrupole Mass Spectrometry Concepts - Hiden Analytical · Quadrupole Mass Spectrometers for...
www.HidenAnalytical.com
Quadrupole Mass Spectrometry Concepts
Mass Spectrometers for Residual Gas Analysis
www.HidenAnalytical.com
Quadrupole Mass Spectrometers for Advanced Science
Residual Gas Analysis
HAL4 EQS High Energy #8431
Fa
ra
da
y : to
rr
mass : amu
0
1e-06
2e-06
3e-06
4e-06
5e-06
6e-06
7e-06
8e-06
9e-06
1e-05
1.1e-05
0 5 10 15 20 25 30 35 40 45 50
Cycle number 0000000
7x 10⁻⁶ torr
1% Argon
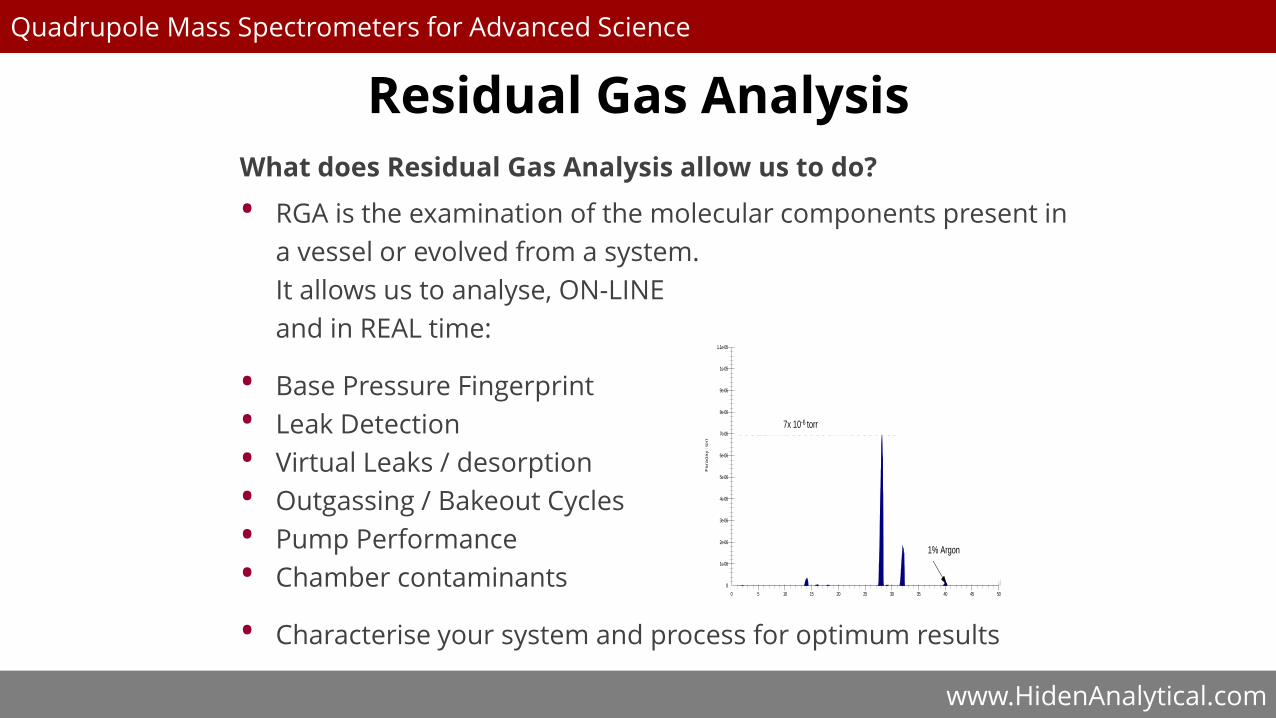
What does Residual Gas Analysis allow us to do?
• RGA is the examination of the molecular components present in
a vessel or evolved from a system.
It allows us to analyse, ON-LINE
and in REAL time:
• Base Pressure Fingerprint
• Leak Detection
• Virtual Leaks / desorption
• Outgassing / Bakeout Cycles
• Pump Performance
• Chamber contaminants
• Characterise your system and process for optimum results
www.HidenAnalytical.com
Quadrupole Mass Spectrometers for Advanced Science
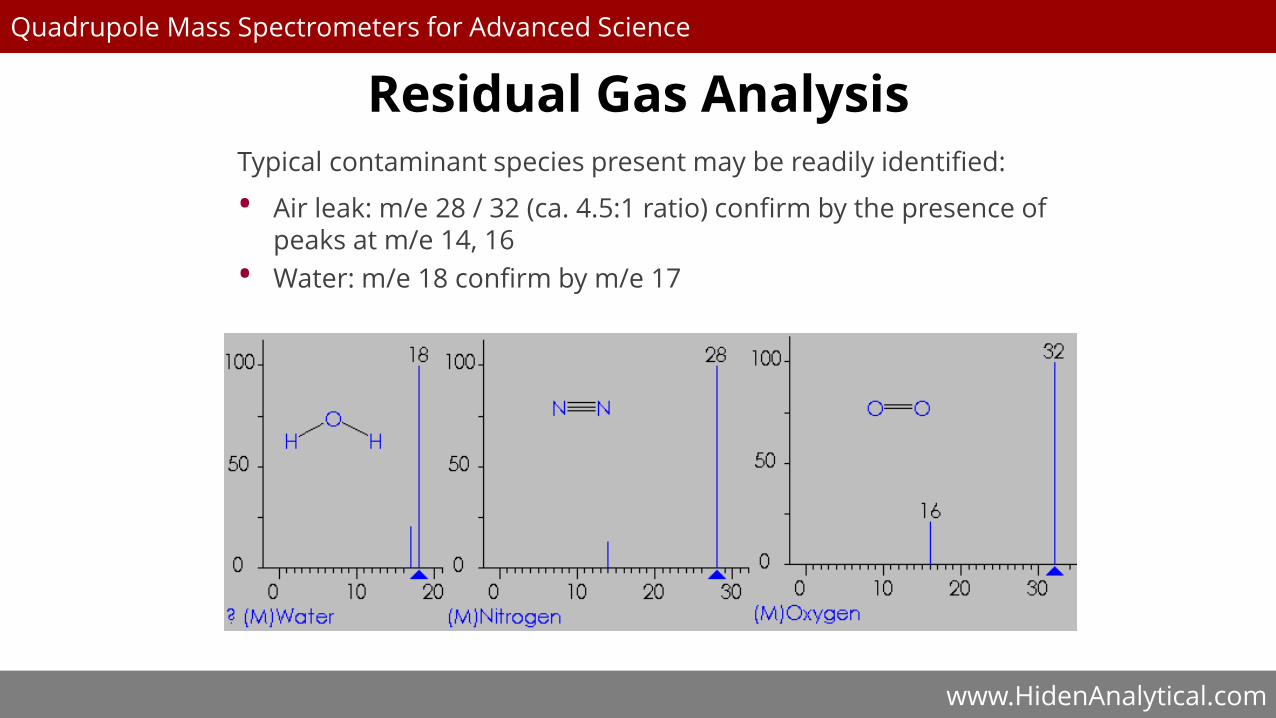
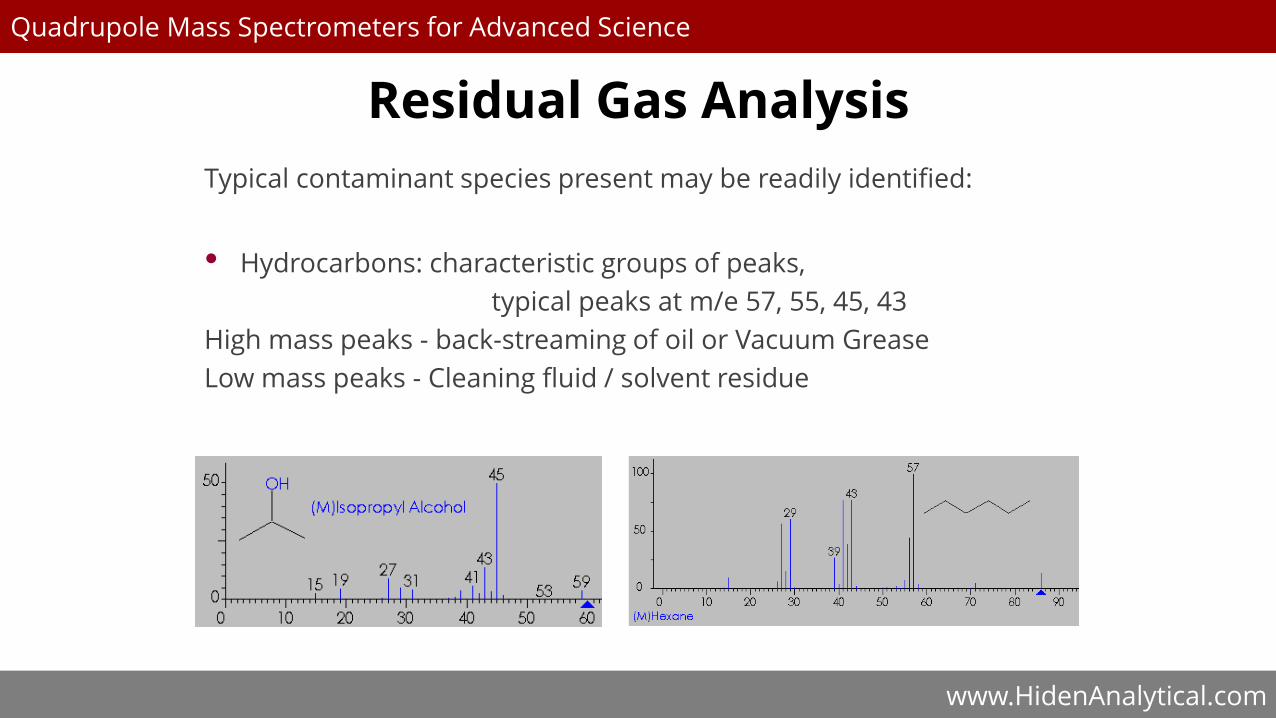
Typical contaminant species present may be readily identified:
• Air leak: m/e 28 / 32 (ca. 4.5:1 ratio) confirm by the presence of peaks at m/e 14, 16
• Water: m/e 18 confirm by m/e 17
Residual Gas Analysis
www.HidenAnalytical.com
Quadrupole Mass Spectrometers for Advanced Science
Typical contaminant species present may be readily identified:
• Hydrocarbons: characteristic groups of peaks,
typical peaks at m/e 57, 55, 45, 43
High mass peaks - back-streaming of oil or Vacuum Grease
Low mass peaks - Cleaning fluid / solvent residue
Residual Gas Analysis
www.HidenAnalytical.com
Quadrupole Mass Spectrometers for Advanced Science
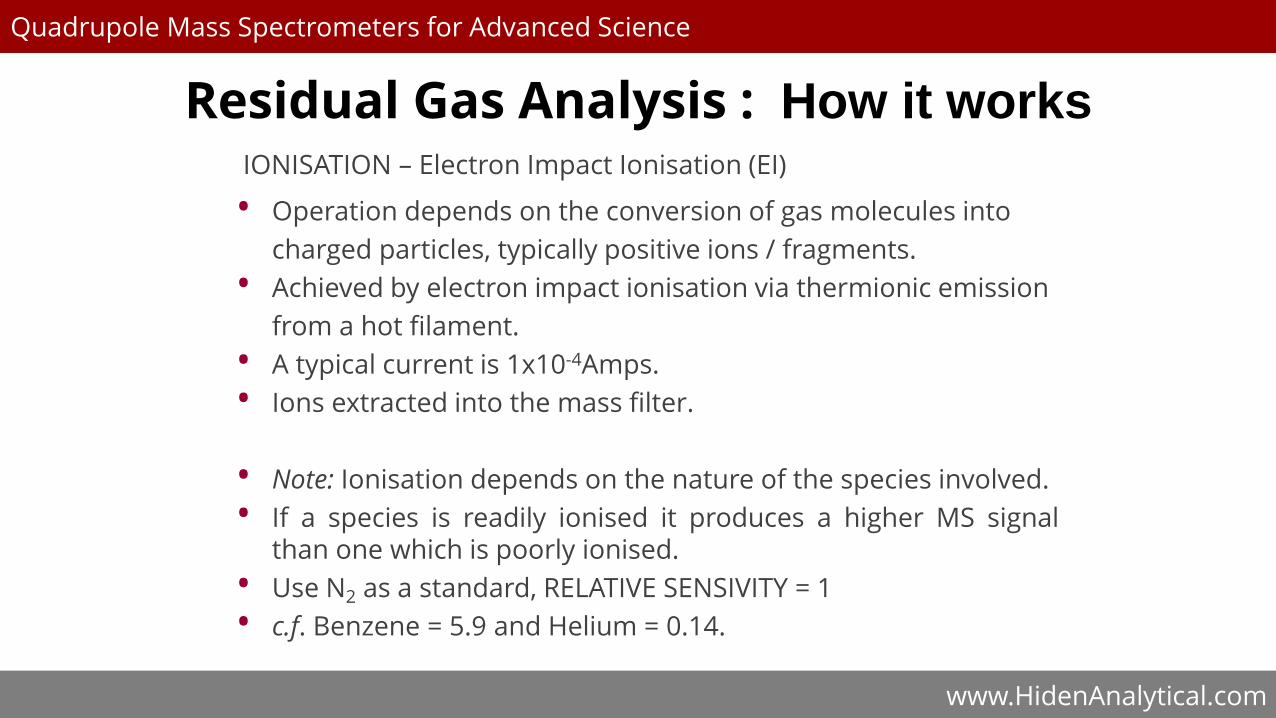
IONISATION – Electron Impact Ionisation (EI)
• Operation depends on the conversion of gas molecules into
charged particles, typically positive ions / fragments.
• Achieved by electron impact ionisation via thermionic emission
from a hot filament.
• A typical current is 1x10⁻⁴Amps.
• Ions extracted into the mass filter.
• Note: Ionisation depends on the nature of the species involved.
• If a species is readily ionised it produces a higher MS signalthan one which is poorly ionised.
• Use N2 as a standard, RELATIVE SENSIVITY = 1
• c.f. Benzene = 5.9 and Helium = 0.14.
Residual Gas Analysis : How it works

www.HidenAnalytical.com
Quadrupole Mass Spectrometers for Advanced Science
IONISATION – Electron Impact Ionisation (EI)
Extractor –90V
Filament –70V
Gas molecules
Electron beam
Quadrupole
entrance
aperture 0V
Positive ions
extracted into
mass filter
Source cage +3V
Residual Gas Analysis: How it works
www.HidenAnalytical.com
Quadrupole Mass Spectrometers for Advanced Science
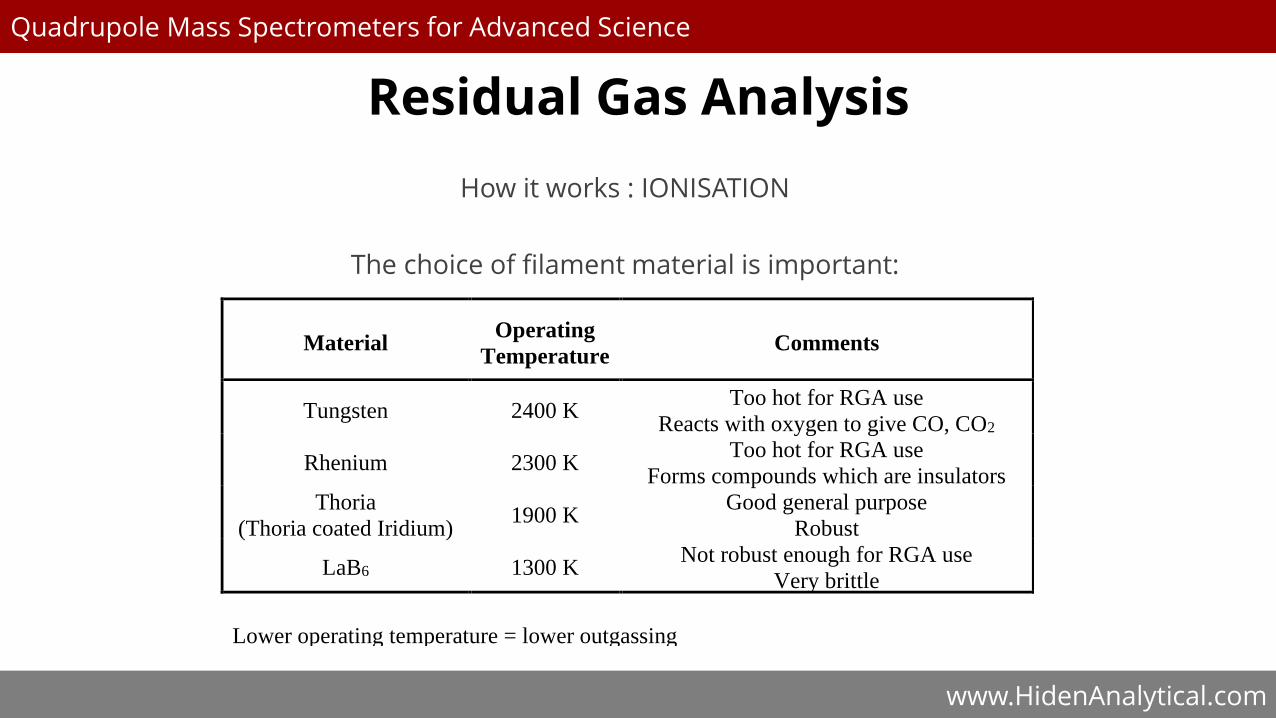
How it works : IONISATION
The choice of filament material is important:
Material Operating
Temperature Comments
Tungsten 2400 K Too hot for RGA use
Reacts with oxygen to give CO, CO2
Rhenium 2300 K Too hot for RGA use
Forms compounds which are insulators
Thoria
(Thoria coated Iridium) 1900 K
Good general purpose
Robust
LaB6 1300 K Not robust enough for RGA use
Very brittle
Lower operating temperature = lower outgassing
Residual Gas Analysis
www.HidenAnalytical.com
Quadrupole Mass Spectrometers for Advanced Science
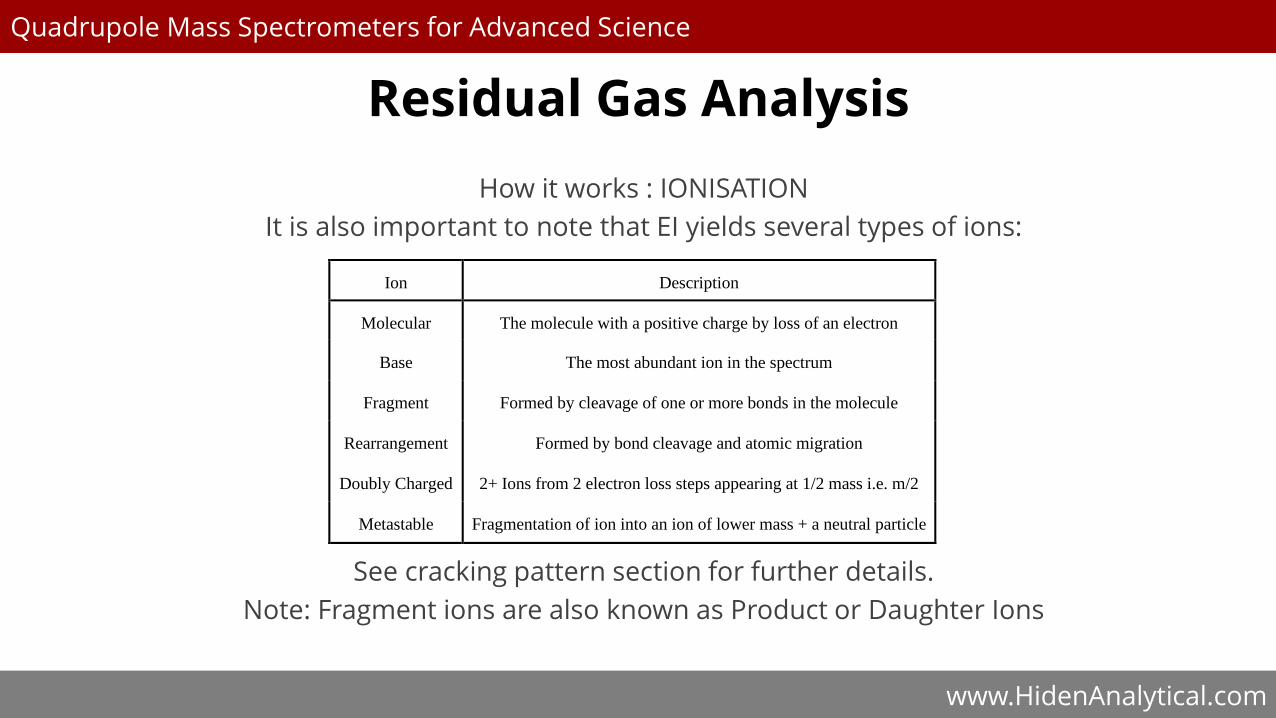
How it works : IONISATION
It is also important to note that EI yields several types of ions:
See cracking pattern section for further details.
Note: Fragment ions are also known as Product or Daughter Ions
Ion Description
Molecular The molecule with a positive charge by loss of an electron
Base The most abundant ion in the spectrum
Fragment Formed by cleavage of one or more bonds in the molecule
Rearrangement Formed by bond cleavage and atomic migration
Doubly Charged 2+ Ions from 2 electron loss steps appearing at 1/2 mass i.e. m/2
Metastable Fragmentation of ion into an ion of lower mass + a neutral particle
Residual Gas Analysis
www.HidenAnalytical.com
Quadrupole Mass Spectrometers for Advanced Science
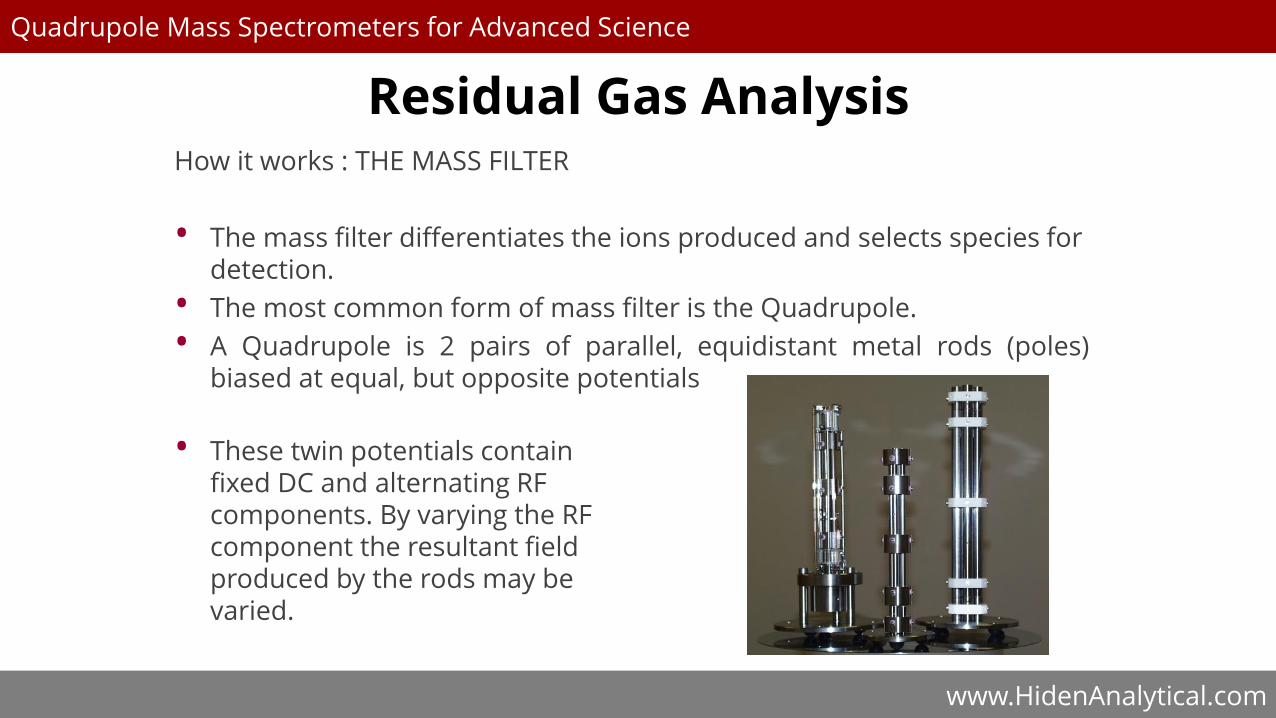
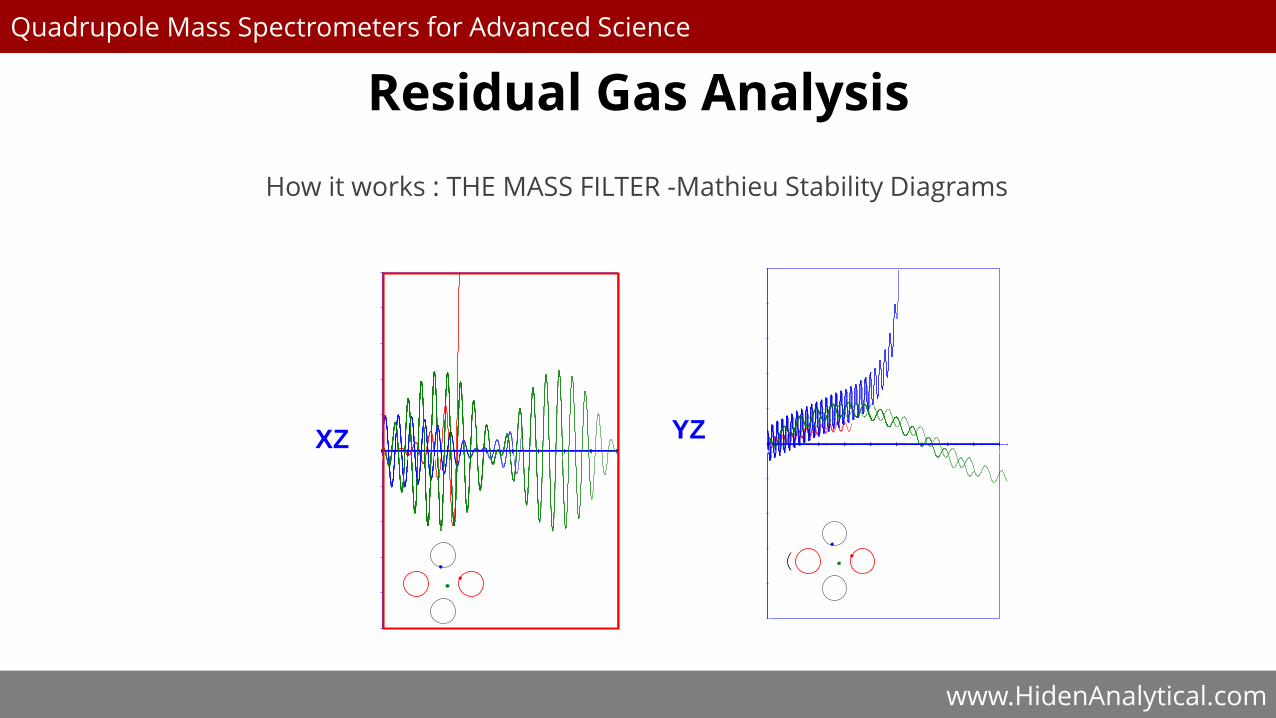
How it works : THE MASS FILTER
• The mass filter differentiates the ions produced and selects species for detection.
• The most common form of mass filter is the Quadrupole.
• A Quadrupole is 2 pairs of parallel, equidistant metal rods (poles)biased at equal, but opposite potentials
• These twin potentials contain fixed DC and alternating RF components. By varying the RF component the resultant field produced by the rods may be varied.
Residual Gas Analysis

www.HidenAnalytical.com
Quadrupole Mass Spectrometers for Advanced Science
How it works: THE MASS FILTER
• Any ions entering the quadrupole field experience potentialdifferences deflecting them from their original trajectory.
• The extent of deflection of any ion entering the field is related to itsmass : charge (m/e or m/z) ratio.
• At each interval on the RF scan only one m/e ratio resonates withthe field allowing the ion to pass along the z-axis.
• All other species are deflected and neutralised by impact upon
the rods of the quadrupole
Residual Gas Analysis
www.HidenAnalytical.com
Quadrupole Mass Spectrometers for Advanced Science
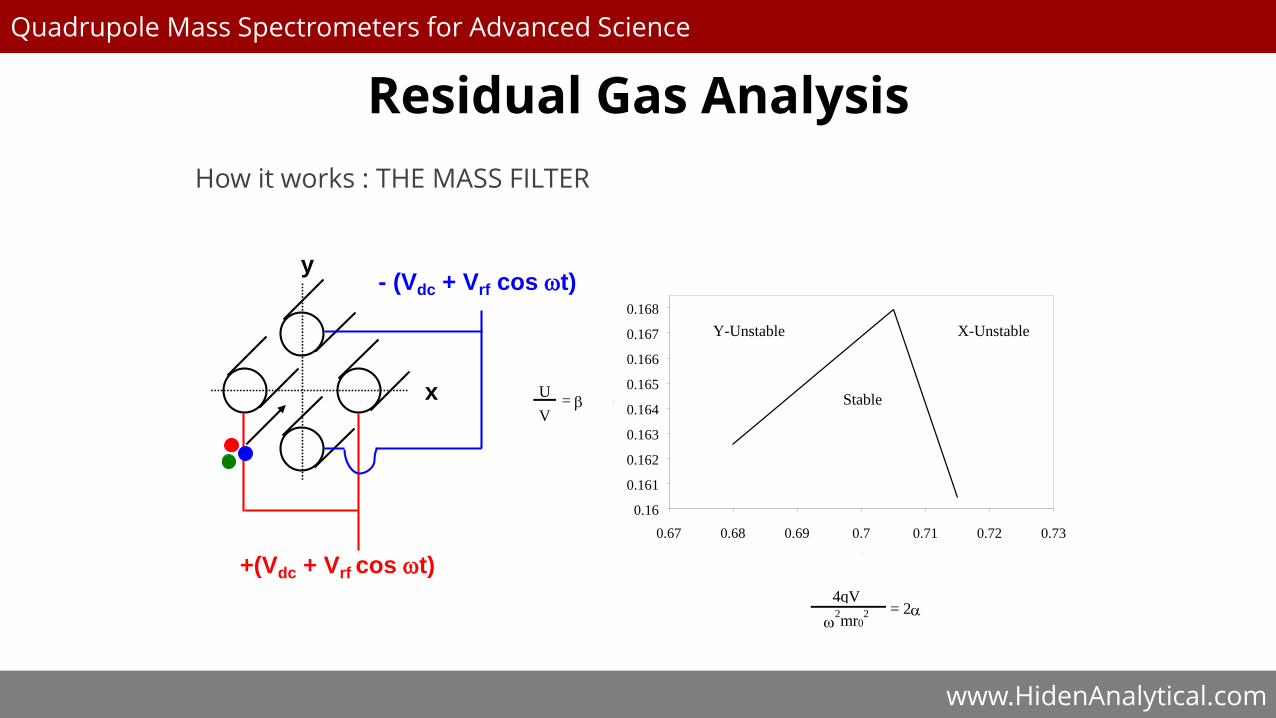
How it works : THE MASS FILTER
+(Vdc + Vrf cos t)
- (Vdc + Vrf cos t)
x
y
0.16
0.161
0.162
0.163
0.164
0.165
0.166
0.167
0.168
0.67 0.68 0.69 0.7 0.71 0.72 0.73
.
. Stable
Y-Unstable X-Unstable
U
V =
4qV
2mr0
2
= 2
Residual Gas Analysis
www.HidenAnalytical.com
Quadrupole Mass Spectrometers for Advanced Science
How it works : THE MASS FILTER -Mathieu Stability Diagrams
-10
-8
-6
-4
-2
0
2
4
6
8
10
0 0.5 1 1.5 2 2.5 3 3.5 4 4.5
-10
-8
-6
-4
-2
0
2
4
6
8
10
0 0.5 1 1.5 2 2.5 3 3.5 4 4.5
-10
-8
-6
-4
-2
0
2
4
6
8
10
0 0.5 1 1.5 2 2.5 3 3.5 4 4.5
-10
-8
-6
-4
-2
0
2
4
6
8
10
0 0.5 1 1.5 2 2.5 3 3.5 4 4.5
-10
-8
-6
-4
-2
0
2
4
6
8
10
0 0.5 1 1.5 2 2.5 3 3.5 4 4.5
-10
-8
-6
-4
-2
0
2
4
6
8
10
0 0.5 1 1.5 2 2.5 3 3.5 4 4.5
-10
-8
-6
-4
-2
0
2
4
6
8
10
0 0.5 1 1.5 2 2.5 3 3.5 4 4.5
-10
-8
-6
-4
-2
0
2
4
6
8
10
0 0.5 1 1.5 2 2.5 3 3.5 4 4.5
YZXZ
-10
-8
-6
-4
-2
0
2
4
6
8
10
0 0.5 1 1.5 2 2.5 3 3.5 4 4.5
-10
-8
-6
-4
-2
0
2
4
6
8
10
0 0.5 1 1.5 2 2.5 3 3.5 4 4.5
-10
-8
-6
-4
-2
0
2
4
6
8
10
0 0.5 1 1.5 2 2.5 3 3.5 4 4.5
-10
-8
-6
-4
-2
0
2
4
6
8
10
0 0.5 1 1.5 2 2.5 3 3.5 4 4.5
-10
-8
-6
-4
-2
0
2
4
6
8
10
0 0.5 1 1.5 2 2.5 3 3.5 4 4.5
-10
-8
-6
-4
-2
0
2
4
6
8
10
0 0.5 1 1.5 2 2.5 3 3.5 4 4.5
-10
-8
-6
-4
-2
0
2
4
6
8
10
0 0.5 1 1.5 2 2.5 3 3.5 4 4.5
-10
-8
-6
-4
-2
0
2
4
6
8
10
0 0.5 1 1.5 2 2.5 3 3.5 4 4.5
-10
-8
-6
-4
-2
0
2
4
6
8
10
0 0.5 1 1.5 2 2.5 3 3.5 4 4.5
-10
-8
-6
-4
-2
0
2
4
6
8
10
0 0.5 1 1.5 2 2.5 3 3.5 4 4.5
Residual Gas Analysis
www.HidenAnalytical.com
Quadrupole Mass Spectrometers for Advanced Science
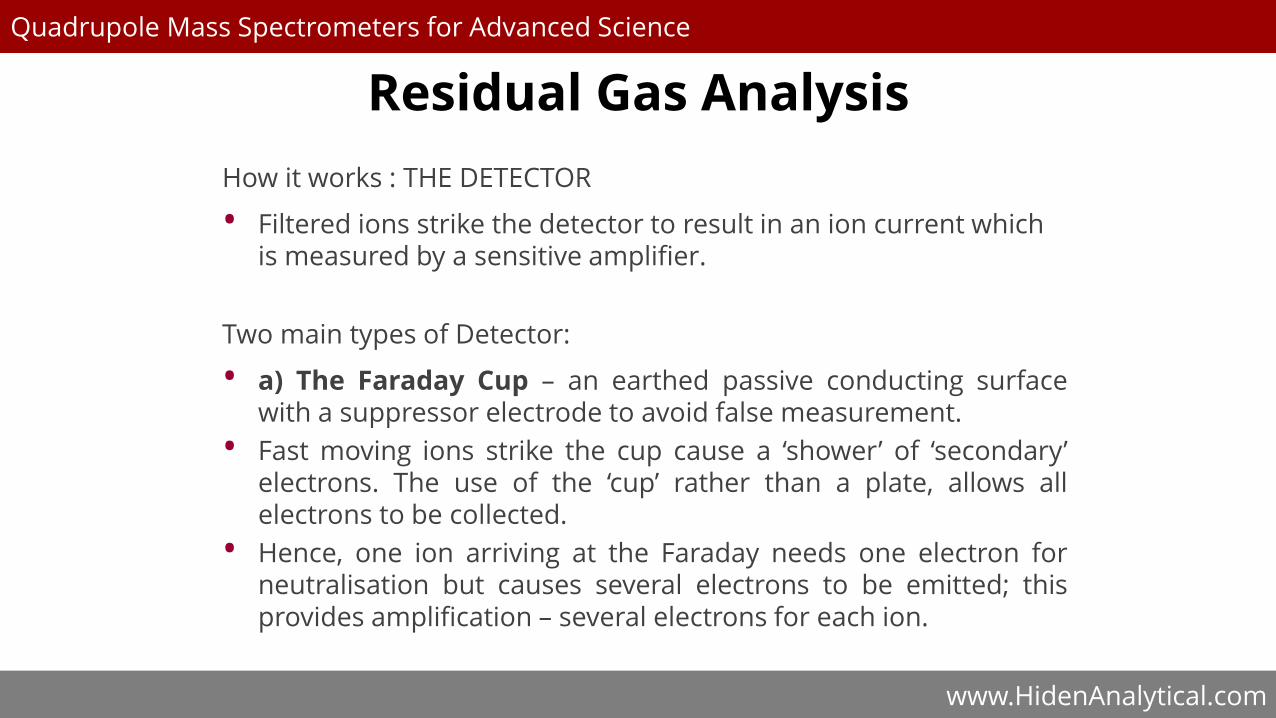
How it works : THE DETECTOR
• Filtered ions strike the detector to result in an ion current which is measured by a sensitive amplifier.
Two main types of Detector:
• a) The Faraday Cup – an earthed passive conducting surfacewith a suppressor electrode to avoid false measurement.
• Fast moving ions strike the cup cause a ‘shower’ of ‘secondary’electrons. The use of the ‘cup’ rather than a plate, allows allelectrons to be collected.
• Hence, one ion arriving at the Faraday needs one electron forneutralisation but causes several electrons to be emitted; thisprovides amplification – several electrons for each ion.
Residual Gas Analysis

www.HidenAnalytical.com
Quadrupole Mass Spectrometers for Advanced Science
How it works : THE DETECTOR
• The Faraday Cup: Detection limits
• Ion current for N2 is 10-4 amps / Torr
• At 10-8 Torr of N2,
10-8 * 10-4 = 10-12 amps
• At 10-11 Torr of N2 = 10-15 amps
Detection limit for conventional analogue amplifier
Analyser exit
+ve ions Electrometer
Faraday Cup
Electron suppressor
Residual Gas Analysis
www.HidenAnalytical.com
Quadrupole Mass Spectrometers for Advanced Science
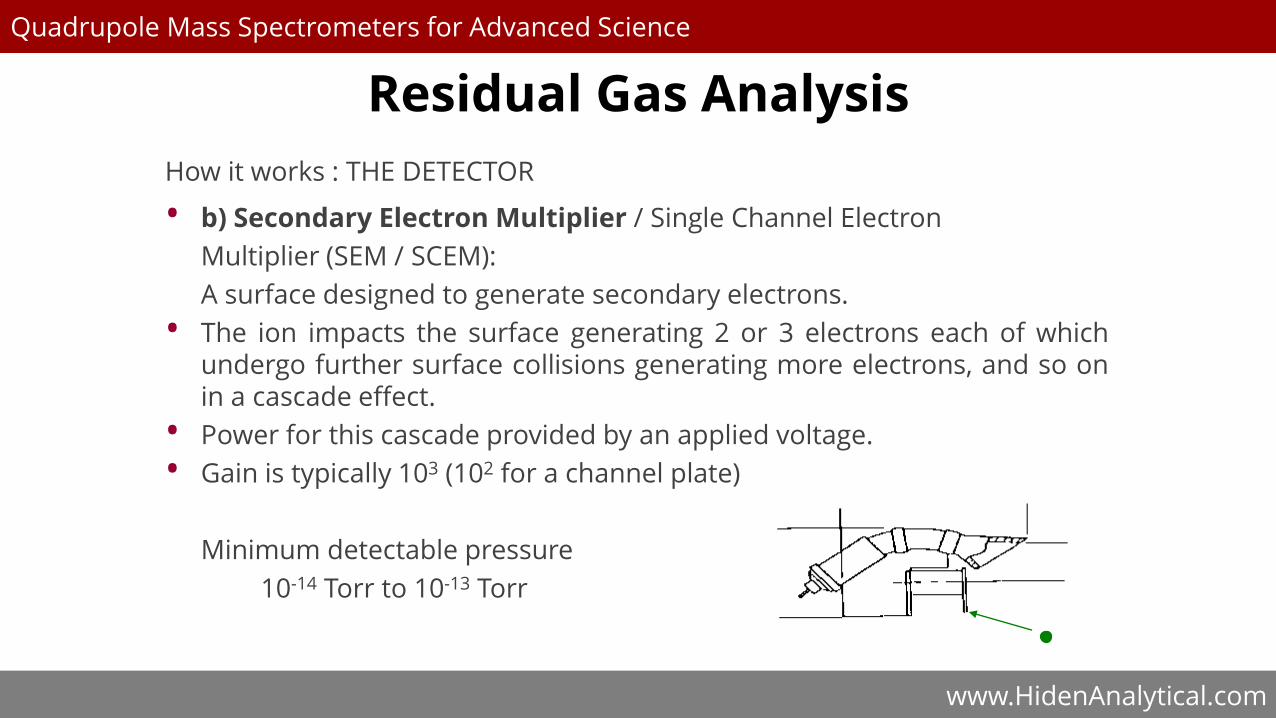
How it works : THE DETECTOR
• b) Secondary Electron Multiplier / Single Channel Electron
Multiplier (SEM / SCEM):
A surface designed to generate secondary electrons.
• The ion impacts the surface generating 2 or 3 electrons each of whichundergo further surface collisions generating more electrons, and so onin a cascade effect.
• Power for this cascade provided by an applied voltage.
• Gain is typically 103 (102 for a channel plate)
Minimum detectable pressure
10-14 Torr to 10-13 Torr
Residual Gas Analysis
www.HidenAnalytical.com
Quadrupole Mass Spectrometers for Advanced Science
Detector Pros and Cons:
Faraday Cup :
• Lower cost
• Indestructible
• Accurate
BUT :
• Detection limit 10-11 Torr
• Measurement relatively slow near detection limit
Residual Gas Analysis
www.HidenAnalytical.com
Quadrupole Mass Spectrometers for Advanced Science
SEM / SCEM :
• Detection limit 10-14 - 10-13 Torr with analogue detection
• Faster measurement
BUT :
• Expensive/Expendable/Sensitivity species dependent
• Sensitivity time / application dependent
• Typical maximum pressure of 10-5 -10-6 Torr
Residual Gas Analysis
www.HidenAnalytical.com
Quadrupole Mass Spectrometers for Advanced Science
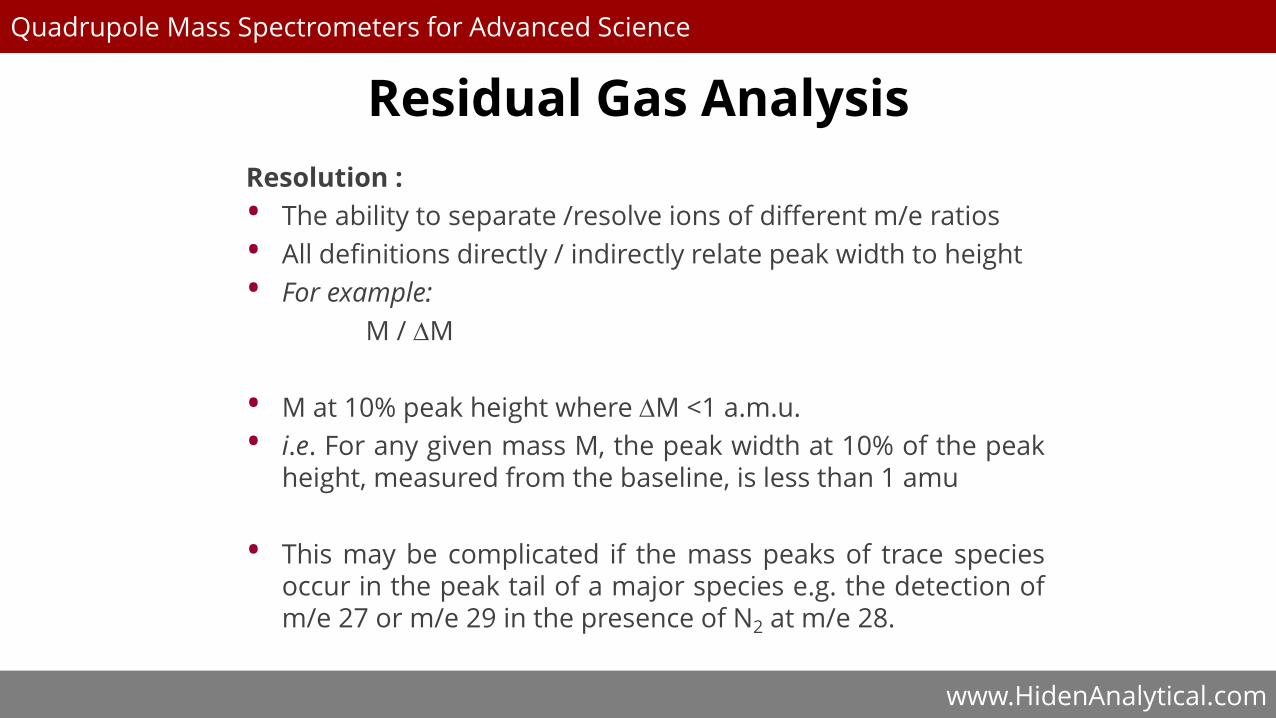
Resolution :
• The ability to separate /resolve ions of different m/e ratios
• All definitions directly / indirectly relate peak width to height
• For example:
M / M
• M at 10% peak height where M <1 a.m.u.
• i.e. For any given mass M, the peak width at 10% of the peakheight, measured from the baseline, is less than 1 amu
• This may be complicated if the mass peaks of trace speciesoccur in the peak tail of a major species e.g. the detection ofm/e 27 or m/e 29 in the presence of N2 at m/e 28.
Residual Gas Analysis
www.HidenAnalytical.com
Quadrupole Mass Spectrometers for Advanced Science
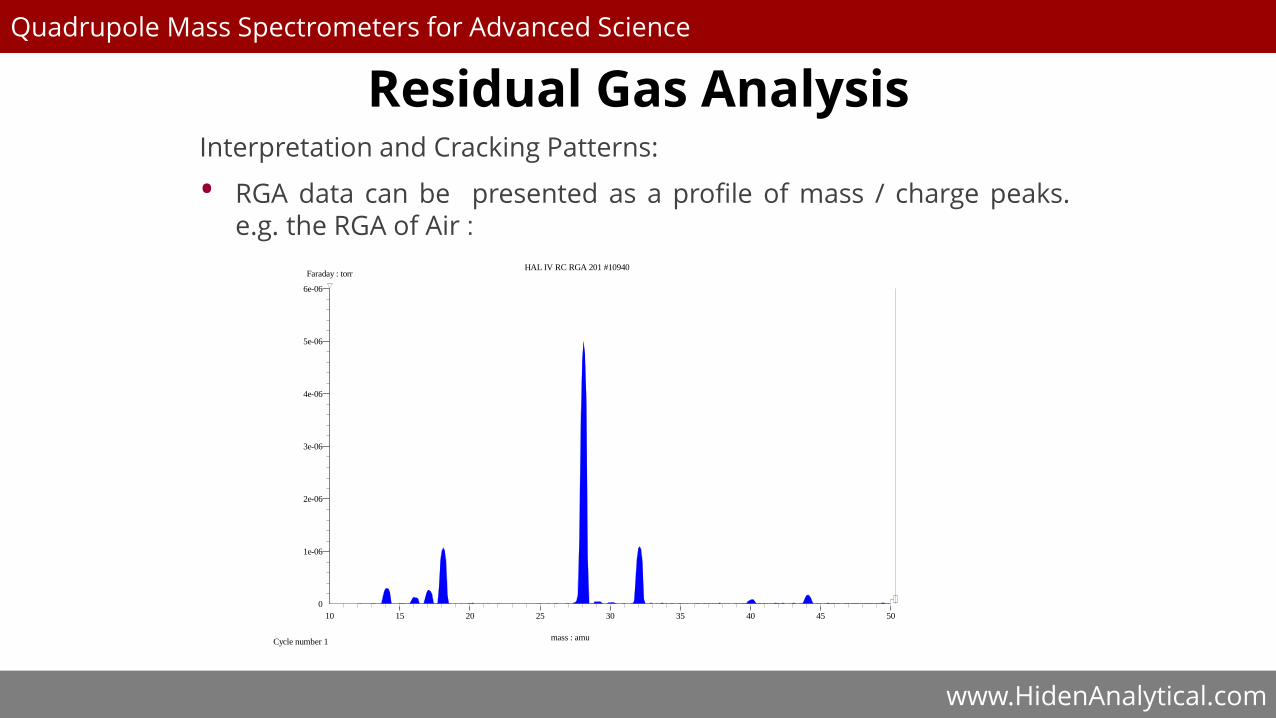
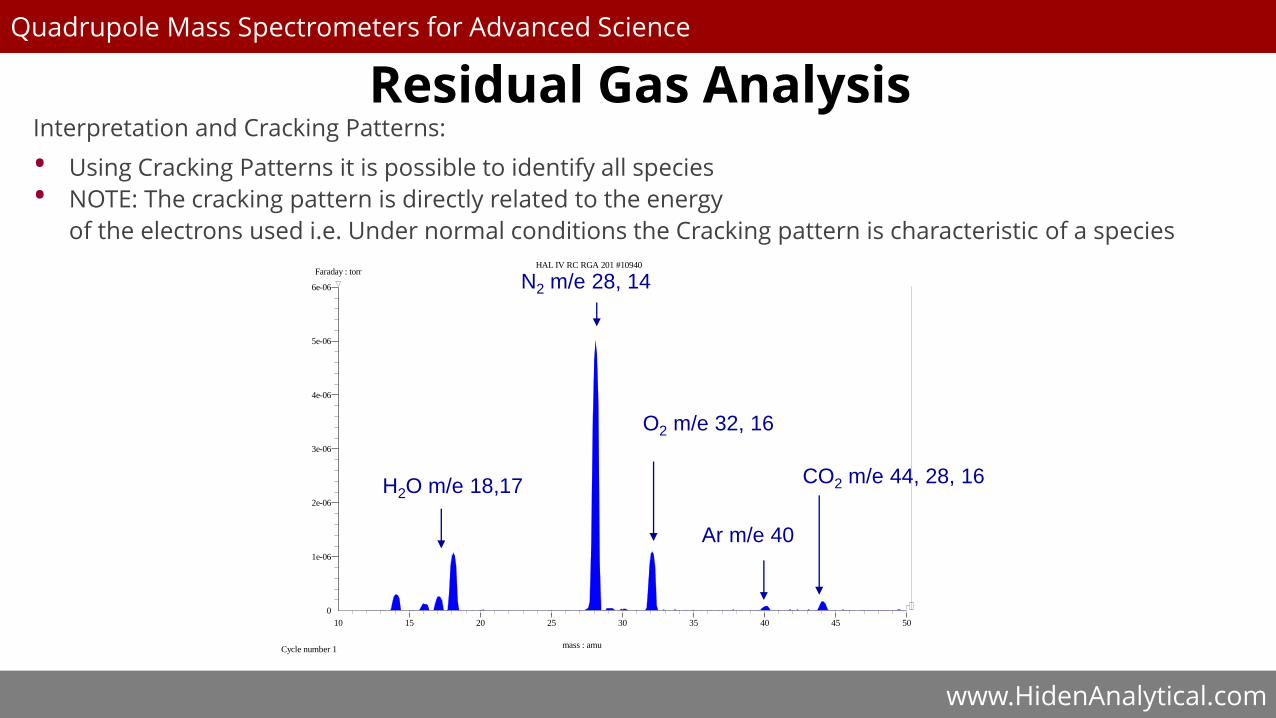
Interpretation and Cracking Patterns:
• RGA data can be presented as a profile of mass / charge peaks.e.g. the RGA of Air :
HAL IV RC RGA 201 #10940
mass : amu
0
1e-06
2e-06
3e-06
4e-06
5e-06
6e-06
10 15 20 25 30 35 40 45 50
Faraday : torr
Cycle number 1
Residual Gas Analysis
www.HidenAnalytical.com
Quadrupole Mass Spectrometers for Advanced Science
Cracking Patterns:
• Cracking arises during ionisation when the high energy
electrons used not only ionise species but fragment them. For CO:12C16O + e- (12C16O)+ Ionisation to give a peak at m/e= 2812C16O + e- 12C + 16O + Cracking to give a peak at m/e =1612C16 O+ e- 12C+ +16O Cracking to give a peak at m/e= 12
This fragmentation can be used to differentiate isobaric species:
12C16O from 14N2 for example.
14N2 has peaks at m/e 28 (14N2+) and m/e 14 (14N+) from:
14 N2+ e- (14N2) + Ionisation to give a peak at m/e= 2814N2 + e- 14 N + 14N + Cracking to give a peak at m/e =14
(14N2) + + e- (14N2 )++ Ionisation to give a peak at m/e= 14
Note: CO/N2 are ISOBARIC the same mass but different composition
Residual Gas Analysis
www.HidenAnalytical.com
Quadrupole Mass Spectrometers for Advanced Science
Interpretation and Cracking Patterns:
• Using Cracking Patterns it is possible to identify all species
• NOTE: The cracking pattern is directly related to the energy
of the electrons used i.e. Under normal conditions the Cracking pattern is characteristic of a speciesHAL IV RC RGA 201 #10940
mass : amu
0
1e-06
2e-06
3e-06
4e-06
5e-06
6e-06
10 15 20 25 30 35 40 45 50
Faraday : torr
Cycle number 1
N2 m/e 28, 14
H2O m/e 18,17
O2 m/e 32, 16
Ar m/e 40
CO2 m/e 44, 28, 16
Residual Gas Analysis
www.HidenAnalytical.com
Quadrupole Mass Spectrometers for Advanced Science
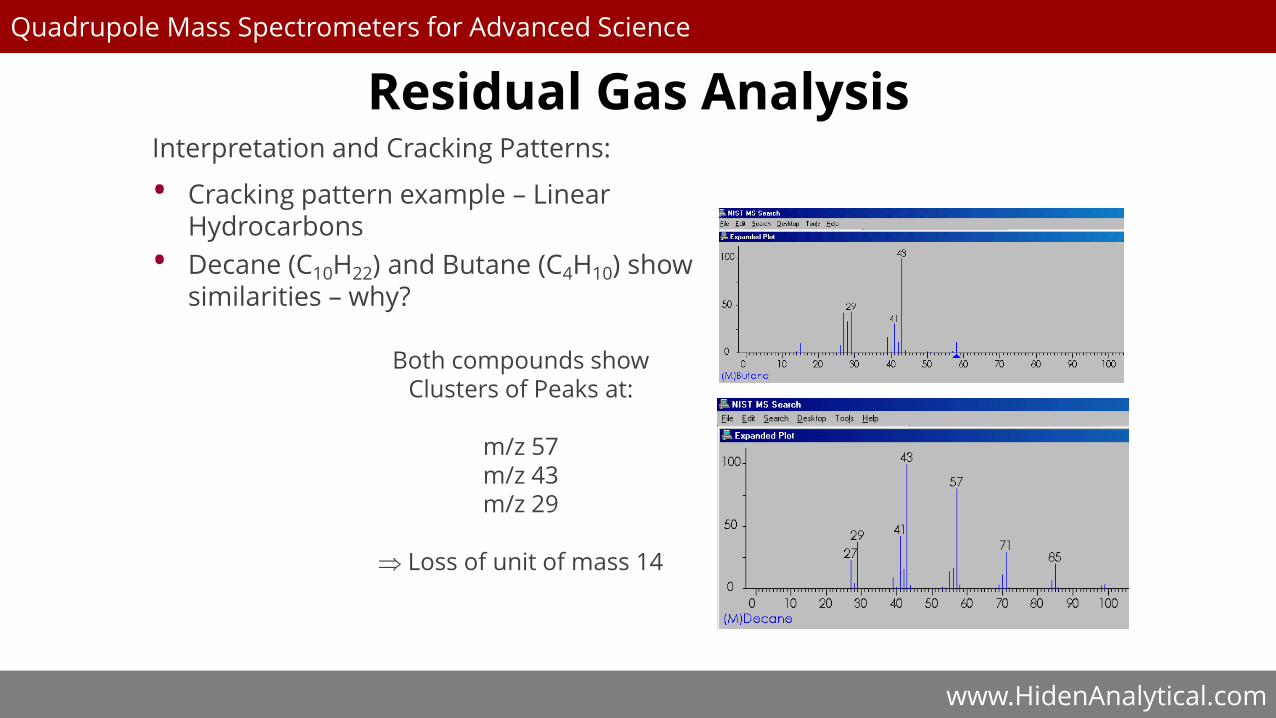
Interpretation and Cracking Patterns:
• Cracking pattern example – Linear Hydrocarbons
• Decane (C10H22) and Butane (C4H10) show similarities – why?
Both compounds showClusters of Peaks at:
m/z 57m/z 43m/z 29
Loss of unit of mass 14
Residual Gas Analysis
www.HidenAnalytical.com
Quadrupole Mass Spectrometers for Advanced Science
Interpretation and Cracking Patterns:
Cracking pattern example
The mass 14 unit loss of alkyl-type species CH2 i.e.
C10H22+ e- C10H21+ +e- CH3
+, C2H5+, C3H7
+, C4H9+, C5H11
+ etc.
And
C4H10+ e- C4H9+ +e- CH3
+, C2H5+, C3H7
+
FRAGMENTATION – Bond cleavage AND Ionisation.
Residual Gas Analysis
www.HidenAnalytical.com
Quadrupole Mass Spectrometers for Advanced Science
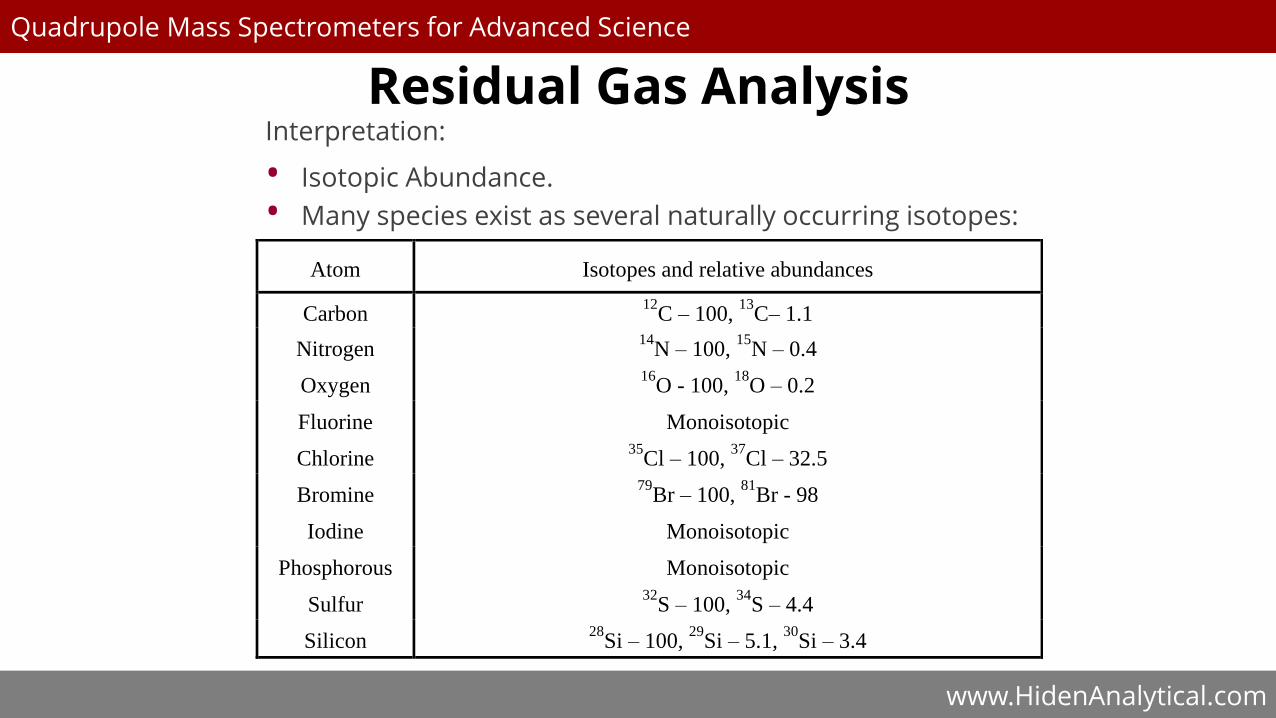
Interpretation:
• Isotopic Abundance.
• Many species exist as several naturally occurring isotopes:
Atom Isotopes and relative abundances
Carbon 12
C – 100, 13
C– 1.1
Nitrogen 14
N – 100, 15
N – 0.4
Oxygen 16
O - 100, 18
O – 0.2
Fluorine Monoisotopic
Chlorine 35
Cl – 100, 37
Cl – 32.5
Bromine 79
Br – 100, 81
Br - 98
Iodine Monoisotopic
Phosphorous Monoisotopic
Sulfur 32
S – 100, 34
S – 4.4
Silicon 28
Si – 100, 29
Si – 5.1, 30
Si – 3.4
Residual Gas Analysis
www.HidenAnalytical.com
Quadrupole Mass Spectrometers for Advanced Science
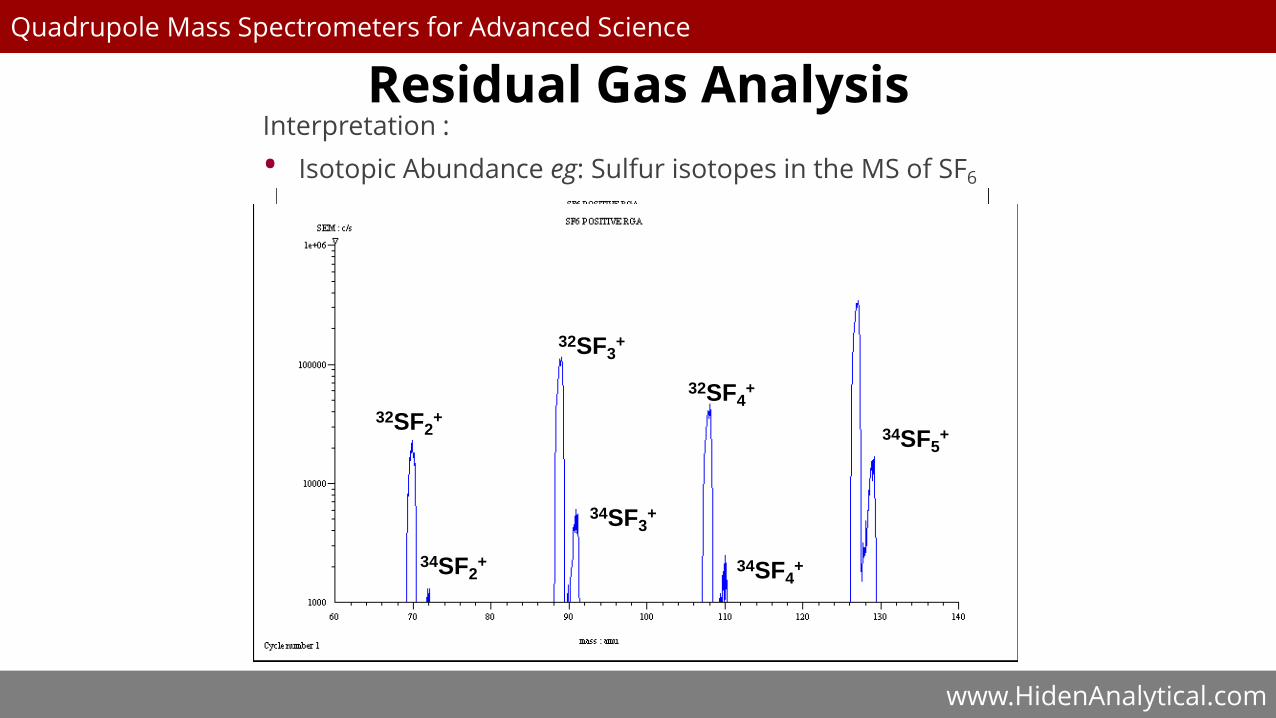
Interpretation :
• Isotopic Abundance eg: Sulfur isotopes in the MS of SF6
32SF5+
34SF5+
32SF4+
34SF4+
32SF3+
34SF3+
32SF2+
34SF2+
Residual Gas Analysis
34SF5+
32SF4+
34SF4+
32SF3+
34SF3+
32SF2+
34SF2+
www.HidenAnalytical.com
Quadrupole Mass Spectrometers for Advanced Science
Interpretation:
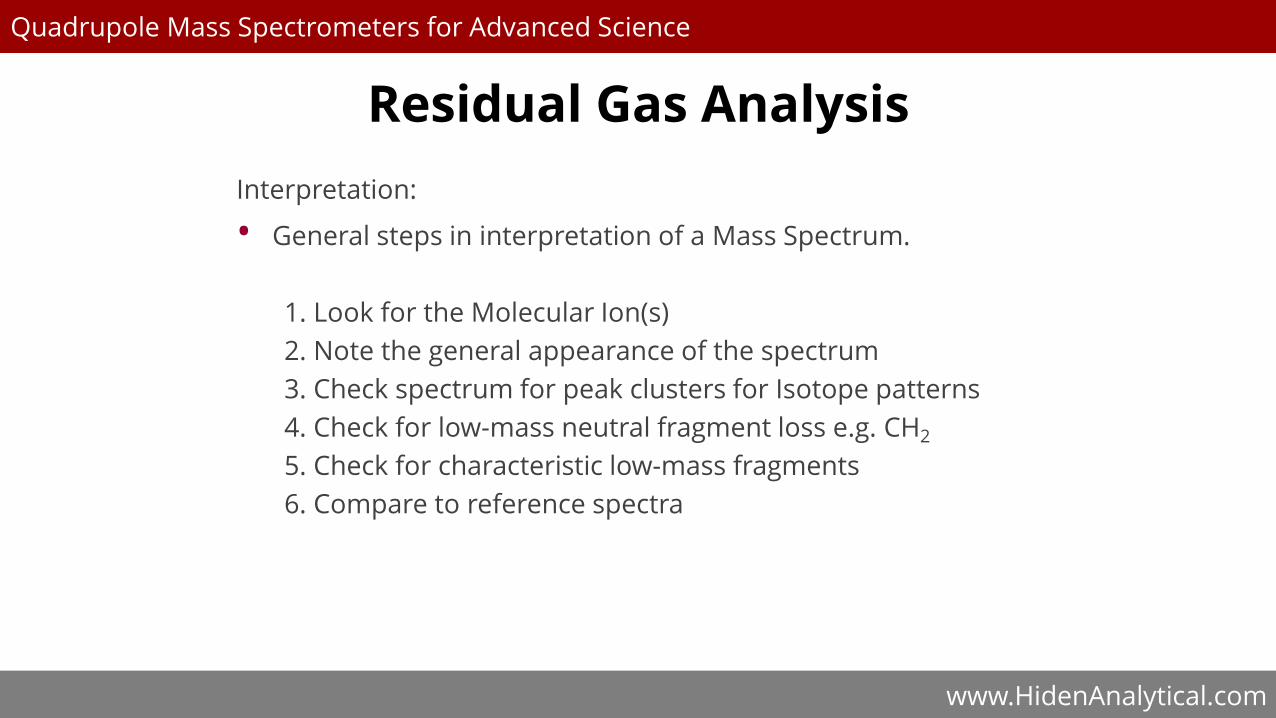
• General steps in interpretation of a Mass Spectrum.
1. Look for the Molecular Ion(s)
2. Note the general appearance of the spectrum
3. Check spectrum for peak clusters for Isotope patterns
4. Check for low-mass neutral fragment loss e.g. CH2
5. Check for characteristic low-mass fragments
6. Compare to reference spectra
Residual Gas Analysis

www.HidenAnalytical.com
Quadrupole Mass Spectrometers for Advanced Science
Quadrupole Mass SpectrometersHiden manufactures a wide range of MS systems, all tailored to specific customer applications.
Options include:
• Mass Ranges of 50, 100, 200, 300, 510, 1000 and 2500 amu
• Ioniser options including cross-beam, gold plated and platinum
• Detectors: Faraday, and electron multipliers, channelplate, channeltron, analogue current measurement and digital pulse ion counting options.
• 6mm, 9 mm or 12mm pole diameter
• Single and triple filter options
• Ethernet, USB, and serial comms.
www.HidenAnalytical.com
Quadrupole Mass Spectrometers for Advanced Science
Hiden Gas Analysers
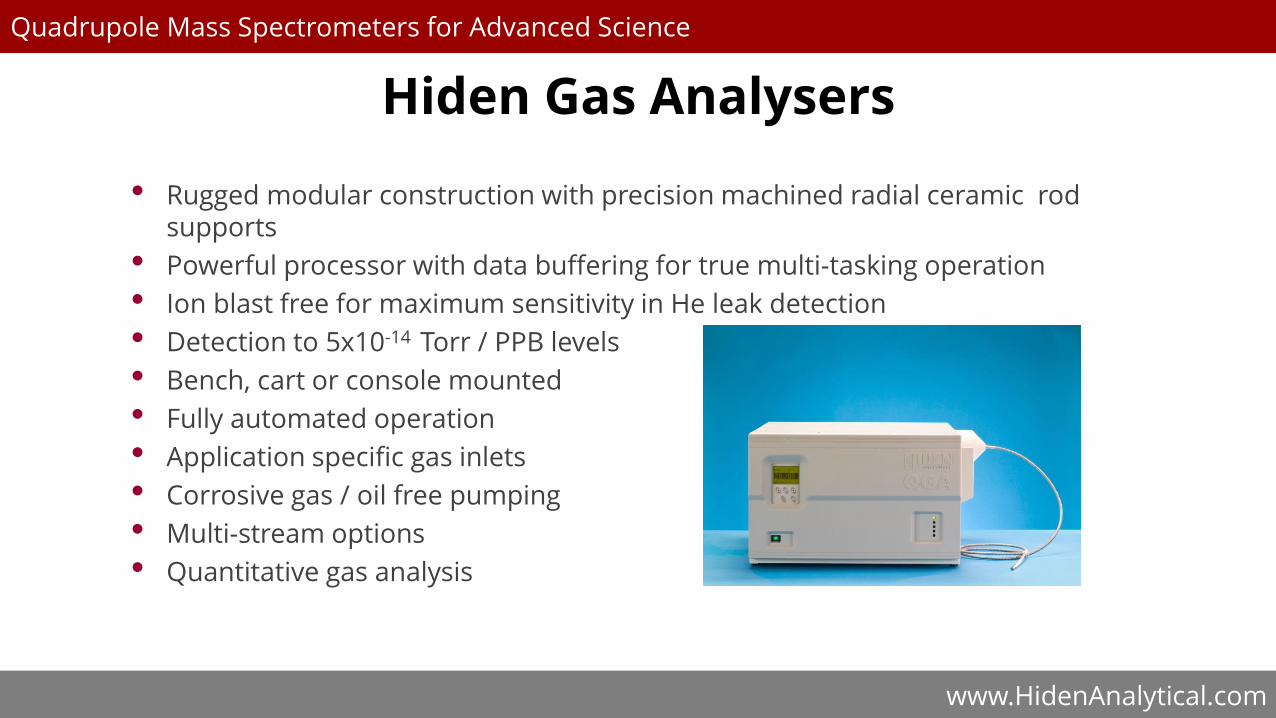
• Rugged modular construction with precision machined radial ceramic rod supports
• Powerful processor with data buffering for true multi-tasking operation
• Ion blast free for maximum sensitivity in He leak detection
• Detection to 5x10-14 Torr / PPB levels
• Bench, cart or console mounted
• Fully automated operation
• Application specific gas inlets
• Corrosive gas / oil free pumping
• Multi-stream options
• Quantitative gas analysis

www.HidenAnalytical.com
Quadrupole Mass Spectrometers for Advanced Science
Appendix 1
• Table 1a gives some of the common RGA contaminants
Name Formula Peak 1
m/e %
Peak 2
m/e %
Peak 3
m/e %
rel
sens
Acetone C3H6O 43 100 58 33 15 20 3.6
Air 28 100 32 27 14 6 1.0
Ammonia NH3 17 100 16 80 15 8 1.3
Argon Ar 40 100 20 16 36 0.3 1.2
Benzene C6H6 78 100 77 19 52 16 5.9
Boron Trichloride BCl3 81 100 58 33 15 20 1.0
Carbon Dioxide CO2 44 100 16 9 14 6 1.4
Carbon Monoxide CO 28 100 12 5 16 2 1.05
Carbon Tetrafluoride CCl4 69 100 50 12 19 7 1.0
Diborane B2H6 26 100 27 97 24 90 1.0
Ethane C2H6 28 100 27 33 30 26 2.6
Fomblin Oil 69 100 20 28 16 16 1.0
Freon 12 CCl2F2 85 100 87 32 50 16 2.7
Helium He 4 100 0.14
Hydrogen H2 2 100 1 2 0.44
www.HidenAnalytical.com
Quadrupole Mass Spectrometers for Advanced Science
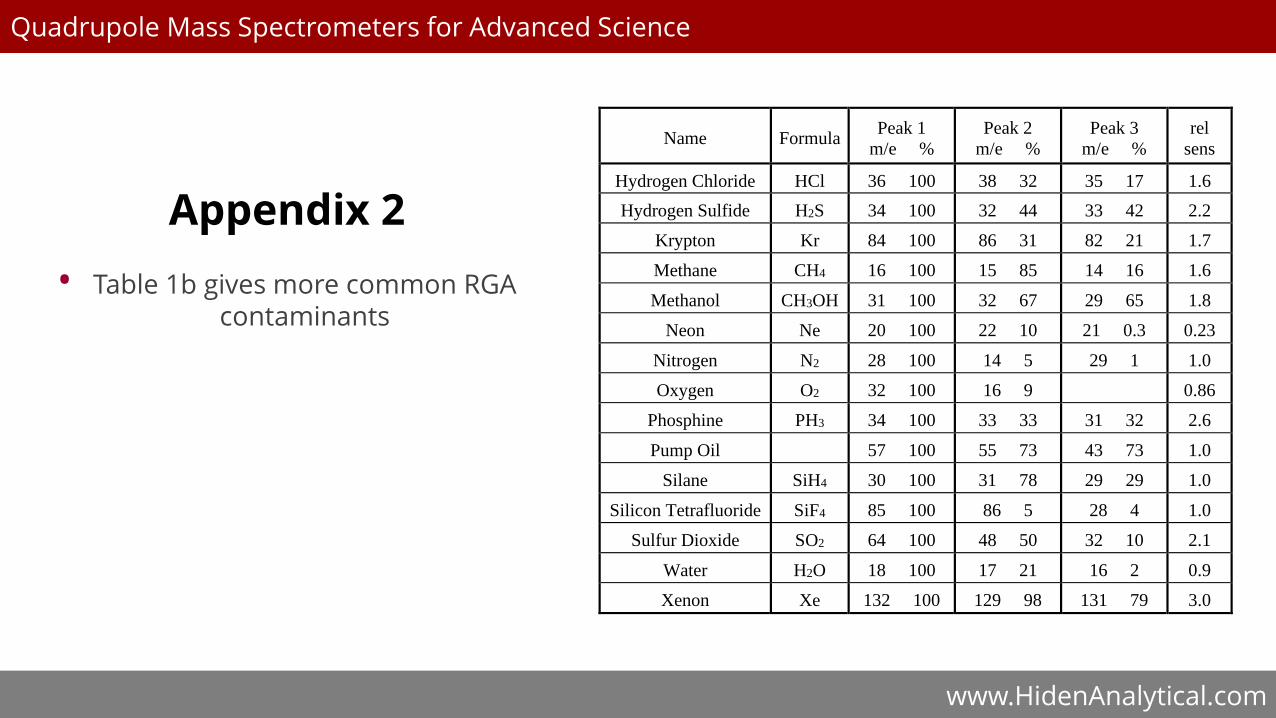
Appendix 2
• Table 1b gives more common RGA contaminants
Name Formula Peak 1
m/e %
Peak 2
m/e %
Peak 3
m/e %
rel
sens
Hydrogen Chloride HCl 36 100 38 32 35 17 1.6
Hydrogen Sulfide H2S 34 100 32 44 33 42 2.2
Krypton Kr 84 100 86 31 82 21 1.7
Methane CH4 16 100 15 85 14 16 1.6
Methanol CH3OH 31 100 32 67 29 65 1.8
Neon Ne 20 100 22 10 21 0.3 0.23
Nitrogen N2 28 100 14 5 29 1 1.0
Oxygen O2 32 100 16 9 0.86
Phosphine PH3 34 100 33 33 31 32 2.6
Pump Oil 57 100 55 73 43 73 1.0
Silane SiH4 30 100 31 78 29 29 1.0
Silicon Tetrafluoride SiF4 85 100 86 5 28 4 1.0
Sulfur Dioxide SO2 64 100 48 50 32 10 2.1
Water H2O 18 100 17 21 16 2 0.9
Xenon Xe 132 100 129 98 131 79 3.0