QT GROUP PLC ANNUAL REPORT 2017 - qt-investors … · Annual Report 2017 5. Qt Group is a company...
88
1 Annual Report 2017
Transcript of QT GROUP PLC ANNUAL REPORT 2017 - qt-investors … · Annual Report 2017 5. Qt Group is a company...

1
Annual Report 2017

Qt provides software developers with a cross-platform framework and related tools by which we aim to increase the productivity of our customers.

3
investors.qt.io
Annual Report 2017
Table of ContentsQt Group in 2017 04
Qt Group in brief 05President and CEO’s review 06
Strategy 2017–2021 08Market and segment review 10Products and services 12Personnel and culture 14Board of Directors’ Report 20Consolidated Key Figures 25Financial statements 2017 27
Consolidated income statement 28Consolidated statement of financial position 29Consolidated statement of cash flows 30Consolidated statement of changes in shareholders’ equity 31Notes to the Consolidated Financial Statements 32Parent company income statement 59Parent company balance sheet 60Parent company cash flow statement 61Basic information on the parent company and accounting policies applied in the financial statements 62Notes to the parent company financial statements 63Signatures to the Financial Statements and the Board of Directors’ Report 68Auditor’s Report 69
Corporate Governance Statement 73Board of Directors 75Management Team 79Statement on Management Remuneration 84
Information for Shareholders 87
Qt Group 2017 / Board of Directors’ Report / Consolidated Key Figures / Financial Statements / CG / Information for Shareholders

4
* 2016
Annual Report 2017
Qt Group in 2017
Operating margin% OF NET SALES
-8.8%* -5.4%
Return on investment
-15.3%* -12.0%
Operating result EUR thousand* -1,736
-3,206 Equity ratio 42.9%* 40.0% * -0.08
-0.14 Earnings per share EUR
* 209
Personnel on average
255
Listed on Nasdaq OMX Helsinki since 2 May 2016.
Net sales MEUR
36.3 * 32.4
26.9
32.436.3
Net sales, by typeMEUR
License sales and consultingSupport and maintenance
5.5 5.4 5.4
6.7
3.1 3.4 3.3 3.4
2015 2016 2017
40
30
20
10
01Q17 2Q17 3Q17 4Q17
8
6
4
2
0
Qt Group 2017 / Board of Directors’ Report / Consolidated Key Figures / Financial Statements / CG / Information for Shareholders

5Annual Report 2017
Qt Group is a company focusing on the development of software tools, responsible for the development, productisation and licensing of software development tools based on Qt technology under commercial and open source licenses.
Globally well-known brands are building their success based on Qt’s technology. Our customers include leading industrial companies from several sectors, using Qt as the software platform of their vehicle hardware, industrial automation applications and business critical systems. Qt is used, for example, in airplane entertainment systems, as a platform for digital televisions, in car entertainment sys-tems and cabins, marine industry’s automation systems and user interfaces of medical devices.
Qt supports several operating systems from desktop computers to embedded systems and mobile devices. Qt helps software developers to save time used for applica-tion and hardware development, because testing is quick and application for several platforms does not require recoding.
Used by more than a million software developers worldwide, Qt enables the development of powerful, interactive and cross-platform applications and devices. Qt Group is responsible for maintaining the operating condi-tions and systems for the open source Qt Project devel-oper community. We engage in software development with an open administration model together with the open source community and Qt partner enterprises.
Qt has operating locations in Finland, Norway, Ger-many, the United States, Russia, Japan, China and South Korea. The company has approximately 100 software developers working in research and product development units in Berlin, Oslo and Oulu. The company’s head office is located in Espoo, Finland.
Qt Group in brief
The future is written with Qt
Qt Group 2017 / Board of Directors’ Report / Consolidated Key Figures / Financial Statements / CG / Information for Shareholders

6Annual Report 2017
Implementation of growth strategy proceeding as planned
Devices connected to the internet and touch screens are becoming more common in consumer and professional use. As a software company, Qt enables the digitalisation of the world by offering the technology and tools to differ-ent industries for building user interfaces and solutions for different platforms – desktop computers, mobile devices and embedded systems, which are used in cars, consumer electronics, industrial automation and domestic appli-ances, for example.
In the on-going digital revolution, Qt plays a significant role as an enabling technology platform, and based on this, the Board of Directors of Qt set new long-term financial objectives for us at the beginning of 2017. In accordance with the updated strategy, our aim is to reach annual net sales of EUR 100 million and an operating profit margin of more than 15% in 2021.
We have proceeded with the implementation of the strategy as planned. During the spring, we carried out a rights issue, successfully raising gross assets of approxi-mately EUR 15.3 million to accelerate investments in grow-ing the global sales network and for product development
President and CEO’s review
Qt Group 2017 / Board of Directors’ Report / Consolidated Key Figures / Financial Statements / CG / Information for Shareholders

7Annual Report 2017
Juha VareliusPresident and CEOQt Group Plc
The importance of user experience as a competitive advantage will be emphasised in the future, and we have continued our trailblazing work that has continued for over 20 years as a facilitator of user interface innovations. Last year, we launched a new 3D-based design tool, Qt 3D Studio. With it, graphic designers can cooperate seamlessly and efficiently with programmers in designing digital car instrument panels, for example. This is what Qt is ulti-mately about: we facilitate our customers’ future user-friendly software and user interface innovations.
Qt is based on cooperation and innovation. Our customers, partners and industry experts are all impor-
in select industries in particular. We recruited more growth drivers, and we have additionally invested in product devel-opment for the automotive industry’s customer segment, for example.
In 2017, we laid the foundation for future growth. Our net sales increased by 11.9 per cent to EUR 36.3 million. The growth of net sales fell slightly short of the forecast level and it was weighed down by the strengthening of the euro compared to the dollar during the latter half of the year and the postponing of several medium-sized contracts in late phases of negotiations until 2018. There might be significant differences between quarters and compari-son periods in the growth of net sales also in the future, depending on the timing of individual significant contracts. At comparable exchange rates, the net sales grew by 20.7 per cent in Q4/2017 and 13.4 per cent in 2017 as a whole. Qt’s operating result for 2017 was at a loss as predicted, -3,206,000 euros (-1,736). We see very promising growth prospects in the next few years.
We facilitate our customers’ future user-friendly innovations
tant stakeholders to us, and we meet them at our annual Qt World Summit. Over 1,000 participants attended the sold-out Qt World Summit which featured almost 90 talks by experts. We will continue this dialog through different channels during the year.
I want to take this opportunity to thank our customers, partners and shareholders for their trust in the company. I would like to thank our employees for their dedicated and inspired work. Thanks go to also those more than a million software developers around the world who are making our product unique as part of the Qt ecosystem.
Qt Group 2017 / Board of Directors’ Report / Consolidated Key Figures / Financial Statements / CG / Information for Shareholders
8Annual Report 2017
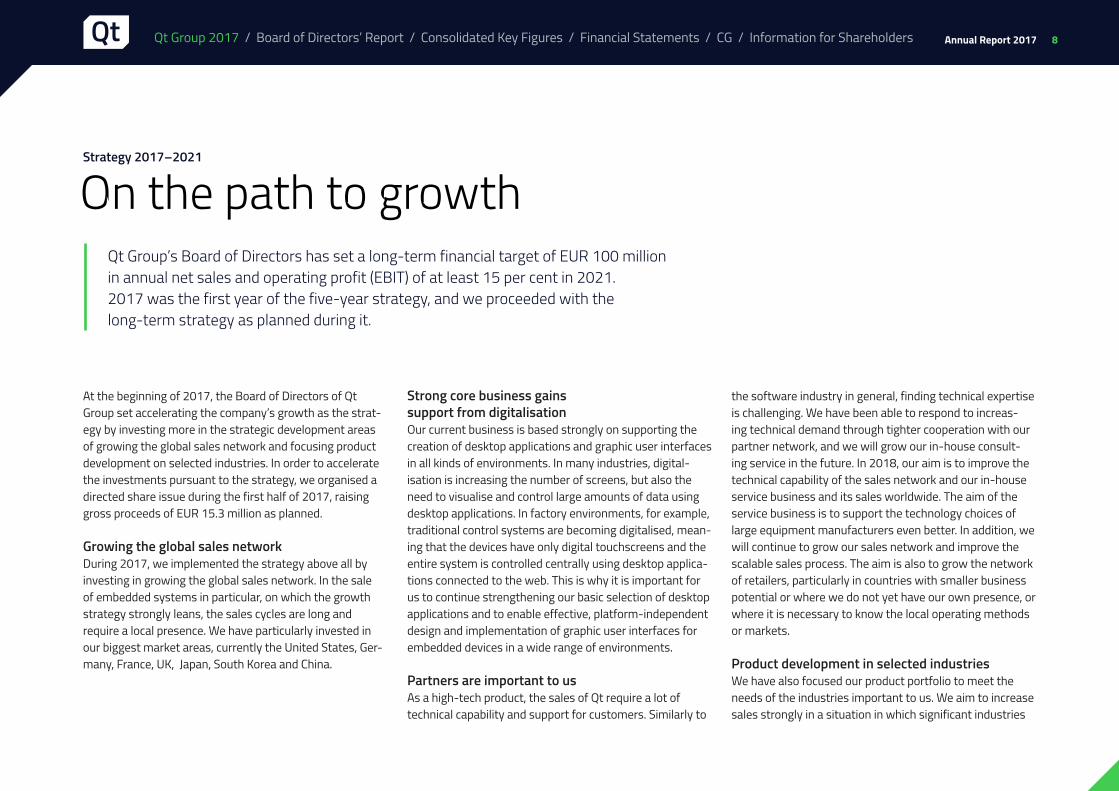
On the path to growthQt Group’s Board of Directors has set a long-term financial target of EUR 100 million in annual net sales and operating profit (EBIT) of at least 15 per cent in 2021. 2017 was the first year of the five-year strategy, and we proceeded with the long-term strategy as planned during it.
At the beginning of 2017, the Board of Directors of Qt Group set accelerating the company’s growth as the strat-egy by investing more in the strategic development areas of growing the global sales network and focusing product development on selected industries. In order to accelerate the investments pursuant to the strategy, we organised a directed share issue during the first half of 2017, raising gross proceeds of EUR 15.3 million as planned.
Growing the global sales networkDuring 2017, we implemented the strategy above all by investing in growing the global sales network. In the sale of embedded systems in particular, on which the growth strategy strongly leans, the sales cycles are long and require a local presence. We have particularly invested in our biggest market areas, currently the United States, Ger-many, France, UK, Japan, South Korea and China.
Strong core business gains support from digitalisationOur current business is based strongly on supporting the creation of desktop applications and graphic user interfaces in all kinds of environments. In many industries, digital-isation is increasing the number of screens, but also the need to visualise and control large amounts of data using desktop applications. In factory environments, for example, traditional control systems are becoming digitalised, mean-ing that the devices have only digital touchscreens and the entire system is controlled centrally using desktop applica-tions connected to the web. This is why it is important for us to continue strengthening our basic selection of desktop applications and to enable effective, platform-independent design and implementation of graphic user interfaces for embedded devices in a wide range of environments.
Partners are important to usAs a high-tech product, the sales of Qt require a lot of technical capability and support for customers. Similarly to
Strategy 2017–2021
the software industry in general, finding technical expertise is challenging. We have been able to respond to increas-ing technical demand through tighter cooperation with our partner network, and we will grow our in-house consult-ing service in the future. In 2018, our aim is to improve the technical capability of the sales network and our in-house service business and its sales worldwide. The aim of the service business is to support the technology choices of large equipment manufacturers even better. In addition, we will continue to grow our sales network and improve the scalable sales process. The aim is also to grow the network of retailers, particularly in countries with smaller business potential or where we do not yet have our own presence, or where it is necessary to know the local operating methods or markets.
Product development in selected industriesWe have also focused our product portfolio to meet the needs of the industries important to us. We aim to increase sales strongly in a situation in which significant industries
Qt Group 2017 / Board of Directors’ Report / Consolidated Key Figures / Financial Statements / CG / Information for Shareholders

9Annual Report 2017
are undergoing a technological transformation and large equipment manufacturers make their choices of future technology platforms.
In the automotive industry, Qt has become the tech-nology for realising the displays of an increasing number of manufacturers. In 2017, we have also gained a foothold in digital instrument panels with new product innovations. The Qt technology now also facilitates a shared technol-ogy platform for the digital user experience of the car as a whole.
The technology is chosen todayCar manufacturers are currently designing their major software platform solutions for new car models in which all of the displays of the car have been built on the same platform and technology. In cars, this change will be evident in that the number of digital displays will gradually increase and media or navigation reproduced with the entertain-ment system, for example, is visible and can be seamlessly controlled on all of the displays of the car or by voice. Qt
has gained a strong foothold in these future technology platforms during 2017 as remarkable car manufactures launched interesting Qt-based concept cars.
We also published new versions for the automotive industry’s product portfolio and introduced a completely new 3D-based user interface design tool with which designers can make 3D-based instrument panels, for example, and work seamlessly with software developers. Our 3D-based solutions facilitate future innovations sim-ilarly in other industries and in developing more conven-tional workstation solutions, which is an important part of our current customer base.
We are negotiating with several major car manufac-turers and developing concepts with Qt technology. We are making our cooperation with car manufacturers closer in sales and technology and aim to support their future tech-nology choices. However, industrial development cycles are long, so significant hardware-based net sales from these possible choices are expected to be recognised as revenue only starting from 2019.
Strategy 2017–2021
In the field of industrial and building automation, smart TV and medical devices, Qt is a well-adopted technology and we secured new deals in all market segments. We pub-lished our own targeted product portfolio for the needs of industrial automation, and our aim is to continue deepening our large customer accounts. We also focused our prod-uct portfolio in the medical device market segment so that the customer’s device certification will be easier and the equipment manufacturer’s development investments will be lower.
Qt Group 2017 / Board of Directors’ Report / Consolidated Key Figures / Financial Statements / CG / Information for Shareholders

10Annual Report 2017
The ongoing technological revolution opens up new opportunities for us
The most significant areas of the software development tool market are conventional desktop application develop-ment, mobile applications and embedded systems. The Qt technology can be utilized in all of these areas; of these, the biggest commercial growth potential is expected to be involved in the development of embedded systems. In workstation application development, we have good awareness and solid technology, and to support growth, Qt’s technology will be enhanced especially regarding quality and compatibility, but also by introducing new 3D-based innovations to support future user interface development. The technologies competing with Qt are most commonly based on HTML5 techniques or parties specializing in a specific field.
The whole world as the marketOver a couple of decades, we have built a global com-munity of over a million developers using the Qt tech-nology, with a significant share of its members utilising open source code licenses. Our business focuses on the
commercial Qt development environment that is in active use globally in the desktop, mobile and embedded soft-ware solutions of thousands of customer companies. Our customers represent dozens of industries – consumer electronics, automotive industry, aviation industry, energy, defense administration, medical devices and media. Our key market areas are the United States, Germany, Japan, South Korea, UK, France and China.
Platform-independence is our assetThe common denominator of our customer base is the need for creating software products that improve the cus-tomer’s own competitiveness. Conventionally, Qt technol-ogies have been utilised in implementing desktop applica-tions. As embedded software is becoming more common, the possibilities of using Qt technology will take a signifi-cant role in devices that use graphic user interfaces. More-over, Qt technology can be utilized in mobile operating systems, such as Android, iOS and Windows.
Market and segment review
The most significant areas of the software develop-ment tool market are conventional desktop application development, mobile applications and embedded systems. With the Internet of Things, the number of embedded systems in particular is expected to increase in the future, and IoT will provide numerous business opportunities to companies of different sizes. We have divided out target market into two main segments: workstation and mobile application development (Qt for Application Development) and embedded system application development (Qt for Device Creation). In addition, we have expanded our port-folio industry-specifically for the needs of the automotive industry, for example (Qt Automotive Suite).
We operate in a growing market Software developers are currently estimated to number approximately 20 million, increasing to approximately 25 million by 2020 (source: Evans Data Corporation: Global Developer Population and Demographic Study 2014).
The global software development tool market is estimated to be approximately USD 10 billion, and the number of software developers is estimated to increase to approximately 25 million by 20202.
1) Gartner, Market Trends: Application Development Software Worldwide, 2012–2016 2) Evans Data Corporation: Global Developer Population and Demographic Study 2014
Qt Group 2017 / Board of Directors’ Report / Consolidated Key Figures / Financial Statements / CG / Information for Shareholders

11Annual Report 2017
In our industry, competition is quite fragmented. In the implementation of desktop solutions, the market is relatively stable and Qt has a strong position. However, the opportunities for growth in the desktop and mobile market is limited by the limited number of software developers able to licence Qt. The competition in the mobile devel-opment market is strong, as there are several free tools available for developing mobile applications only. Qt’s ben-efit in these markets is its cross-platform nature, making it possible to implement the customer’s application using the same technology for both workstation and mobile use. The competitive field of embedded systems is open. The biggest pressure in terms of competition is from web technology-using HTML5-based solutions and solutions developed for the needs of individual industries. We stand out with a readymade product that provides our customers with an effective and easily integrated platform.
IoT drives the marketThe Internet of Things is revolutionising several industries and the way the devices and systems of the future are designed, with a growing number of intelligent devices
connected to each other via networks. The value provided by embedded devices to the user is determined primarily through user experience. Therefore, with the spreading of the Internet of Things, the need for creating good user interfaces will increase in particular. On the other hand, when the same user experience needs to be easily and efficiently brought to every device of the user, this change also drives a growing need for cross-platform develop-ment environments like Qt.
The automotive industry is a good example of current technological revolution. Digitalization is strongly guiding the entire industry towards self-steering cars, creates new sharing-based business models and, above all, empha-sizes a personalized user experience based on several displays inside the car as well as connections with the user’s own mobile devices. The software platform and user interfaces play a significant role in facilitating these. We aim to respond to car manufacturers’ needs by cooperat-ing closely with the world’s biggest producers. Also other industries associated with means of transport, industrial and building automation and medical devices are undergo-ing the same technological revolution.
Market and segment review
Qt Group 2017 / Board of Directors’ Report / Consolidated Key Figures / Financial Statements / CG / Information for Shareholders
12Annual Report 2017
Qt provides software developers with a cross-platform software framework and related tools, including an inte-grated development environment (IDE) and tools for the visual design of software user interfaces. These tools improve the productivity of our customers’ software devel-opers and user interface designers. We help to shorten our customers’ product development projects, allowing them to bring their products faster to the market. We launched new versions of the technology in 2017 (Qt 5.8, Qt 5.9 and Qt 5.10) and the new Qt 3D Studio, supporting the design of 3D-based user interfaces in particular.
Qt technology is double-licensed, meaning that it is offered both under an open source code (GPL, LGPLv3) license and a commercial license. Qt technology has a comprehensive ecosystem comprising our corporate part-ner network and an extensive global network of software developers. In addition to our in-house employees, a large
group of open source code developers – other companies, associations and individual developers –take part in devel-oping the core technology.
Using open source code is a growing trend in the software industry. As a double-licensed technology based on open source code, we offer equipment manufacturers a genuinely independent and reliable solution for creating users’ software platforms. Car or smart TV manufactur-ers, for example, can create entertainment systems with Qt, allowing importing external content and applications so that the user data collected by the device is kept by the equipment manufacturer. This is an important competitive advantage for us alongside large application ecosystems.
We also provide our customers with consulting ser-vices with which our customers’ projects are implemented as efficiently as possible. We support our customers in their technology choices and the adoption of Qt accord-
With Qt, software companies and equipment manufacturers can create software or user interfaces for desktop and mobile platforms as well as embedded systems and their touchscreens. By using Qt’s technology, our customers can focus on improving the customer experience. Visual displays and a smooth user experience are increasingly important success factors with which our customers provide added value to their products and build successful business.
ing to their needs. Our consulting service is provided by a professionally skilled team of top developers with wide experience, offering extensive Qt expertise for the benefit of our customers.
We accelerate our customers’ product developmentProducts and services
Qt Group 2017 / Board of Directors’ Report / Consolidated Key Figures / Financial Statements / CG / Information for Shareholders

13Annual Report 2017
We have engineers and designers working very closely together.We want something that the customer later enjoys using, and building this up together with these teams as one, that's amazing. Qt helps us, actually, on all of these fields, because you can achieve very high performance, high frame rate, which is important for a good user experience, and very nice graphics at the same time.
Alex HilligerSenior Manager,Advanced graphics and renderingDaimler
Qt Group 2017 / Board of Directors’ Report / Consolidated Key Figures / Financial Statements / CG / Information for Shareholders

14Annual Report 2017
Personnel and culture
Developing the culture togetherStrengthening and developing the corporate culture has risen to a prominent role as the company has grown and diversified further, and we launched several development projects around it. We established a global team covering different functions to innovate and share operating meth-ods and objectives that would make it possible to develop our culture in the desired direction globally. We focused on specifying and developing the HR processes. We also began to create career frameworks to support the devel-opment of our employees’ skills and their career develop-ment.
Number of employees is increasingWe appreciate the individual differences of employees and understand that a diversity in background, skills, com-petence and perspectives is beneficial for our business,
Qt Group 2017 / Board of Directors’ Report / Consolidated Key Figures / Financial Statements / CG / Information for Shareholders
15Annual Report 2017
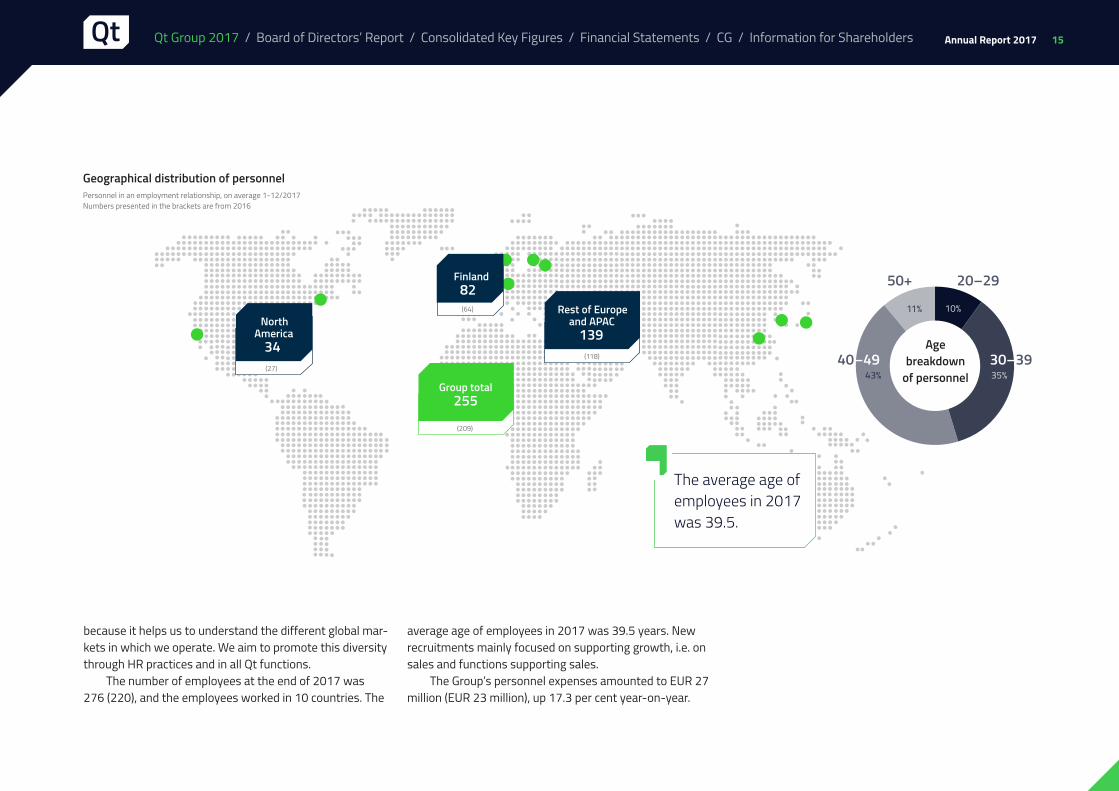
The average age of employees in 2017 was 39.5.
Geographical distribution of personnel
(64)
(118)
(209)
Finland82
(27)
North America
34
Rest of Europe and APAC
139
Group total255
because it helps us to understand the different global mar-kets in which we operate. We aim to promote this diversity through HR practices and in all Qt functions.
The number of employees at the end of 2017 was 276 (220), and the employees worked in 10 countries. The
Personnel in an employment relationship, on average 1-12/2017Numbers presented in the brackets are from 2016
average age of employees in 2017 was 39.5 years. New recruitments mainly focused on supporting growth, i.e. on sales and functions supporting sales.
The Group’s personnel expenses amounted to EUR 27 million (EUR 23 million), up 17.3 per cent year-on-year.
10%11%
43% 35%
50+ 20–29
30–3940–49Age
breakdown of personnel
Qt Group 2017 / Board of Directors’ Report / Consolidated Key Figures / Financial Statements / CG / Information for Shareholders
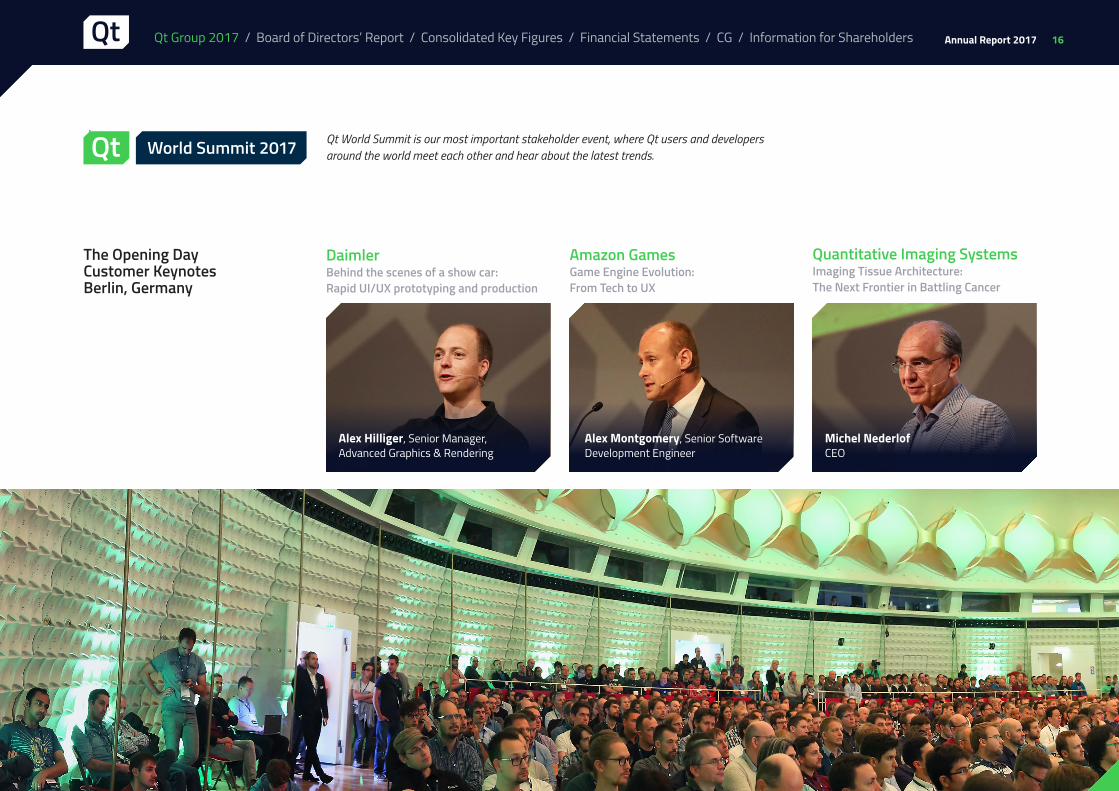
DaimlerBehind the scenes of a show car: Rapid UI/UX prototyping and production
Amazon GamesGame Engine Evolution: From Tech to UX
Alex Hilliger, Senior Manager, Advanced Graphics & Rendering
Alex Montgomery, Senior Software Development Engineer
Quantitative Imaging SystemsImaging Tissue Architecture: The Next Frontier in Battling Cancer
Michel NederlofCEO
16Annual Report 2017
The Opening DayCustomer Keynotes Berlin, Germany
Qt World Summit is our most important stakeholder event, where Qt users and developers around the world meet each other and hear about the latest trends.
Qt Group 2017 / Board of Directors’ Report / Consolidated Key Figures / Financial Statements / CG / Information for Shareholders

Panasonic ITSFuture of Vehicle HMI Systems
HasselbladUsing Qt to Build Next Generation Intuitive High End Cameras
QualcommAn IDE for Embedded Devices
Justin Howard, Engineer, Senior Staff
Richard Röjfors, Senior Embedded Open Source Developer
Takayuki TanabeCEO, Development Center Chief
17Annual Report 2017
The Opening DayCustomer Keynotes Berlin, Germany
Qt Group 2017 / Board of Directors’ Report / Consolidated Key Figures / Financial Statements / CG / Information for Shareholders
18Annual Report 2017
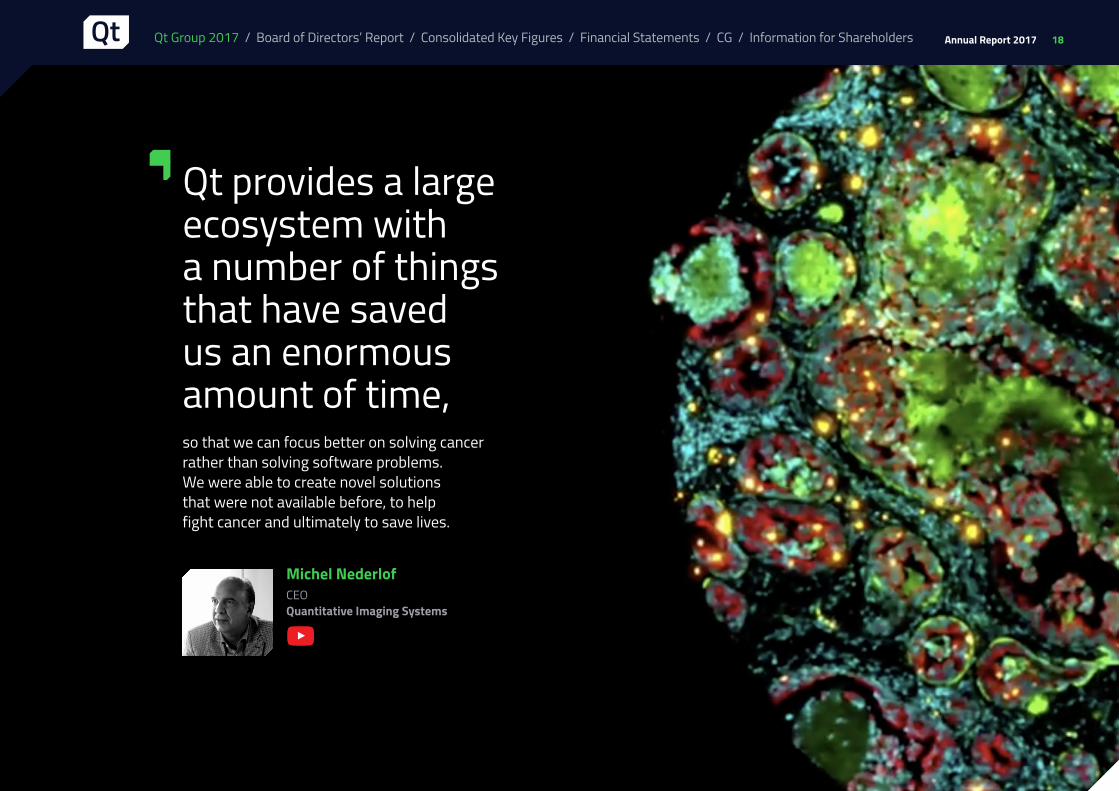
Qt provides a large ecosystem witha number of things that have saved us an enormous amount of time,so that we can focus better on solving cancer rather than solving software problems.We were able to create novel solutionsthat were not available before, to helpfight cancer and ultimately to save lives.
Michel Nederlof CEO Quantitative Imaging Systems
Qt Group 2017 / Board of Directors’ Report / Consolidated Key Figures / Financial Statements / CG / Information for Shareholders
19Annual Report 2017
Together with KDAB and Qi, we have built an imaging software to help researchers understand the progression of cancer.To fuel this research, we launched the nanoQuill non-profit project, a free coloring book and mobile app. Every image you color and upload to the gallery helps Qi measure a cell’s detail and train new deep learning algorithms. This will help us understand and identify cancer cells better and eventually find more efficient ways to fight the disease. We are incredibly proud to be a part of this project. We wish it will give joy to you and hope for everyone whose lives are affected by cancer.
www.nanoquill.org / www.kdab.com / www.qi-tissue.com
Katja Kumpulainen Senior Vice President, Marketing The Qt Company
Qt Group 2017 / Board of Directors’ Report / Consolidated Key Figures / Financial Statements / CG / Information for Shareholders
20Annual Report 2017
Board of Directors’ ReportFiscal year 2017
• Net sales increased by 11.9 per cent to EUR 36,259 thousand (32,395) *. At comparable exchange rates, net sales increased by 13.4 per cent.
• The operating result was EUR -3,206 thousand (-1,736).• The operating margin (EBIT %) was -8.8 per cent (-5.4%).• Earnings per share were EUR -0.14 (-0.08).
* the figures in brackets refer to the comparison period, i.e. the corresponding period in the previous year.This financial statement bulletin was prepared in compli-ance with IAS 34 Interim Financial Reporting.
Business
Qt is responsible for Qt development, productization and licensing under commercial and open source licenses. Qt technology is used globally by over one million software developers. Qt is used for developing cross-platform appli-cations and graphic user interfaces for desktops, embed-ded systems and mobile devices. Qt technology is used in over 70 different industries and in millions of devices and applications, including consumer electronics, vehi-cles, airplanes and industrial automation applications. Qt has operating locations in Finland, Norway, Germany, the United States, Russia, China, Japan and South Korea.
Financial year 2017
Net salesQt’s net sales for 2017 amounted to EUR 36,259 thousand (32,395), up by 11.9 per cent. License sales and consulting grew by 9.3 per cent and support and maintenance by 16.8 per cent. At comparable exchange rates, net sales for the entire year increased by 13.4 per cent.
Qt’s net sales for the fourth quarter amounted to EUR 10,108 thousand (EUR 8,845 thousand), up 14.3 per cent. License sales and consulting grew by 14.6 per cent and support and maintenance by 13.6 per cent. At compara-ble exchange rates, net sales during the fourth quarter increased by 20.7 per cent. Profit performanceQt’s operating result for October–December 2017 was EUR -701 thousand (EUR -305 thousand). The operating result for the financial year amounted to EUR -3,206 thou-sand (EUR -1,736 thousand).
The other operating income for the fiscal year includes income gained from events organized by the company, as well as tax-free research and development invest-ment grants received by the company in Norway, totaling approximately EUR 389 thousand. The grants concern the applicable personnel expenses related to the research and development activities of Qt’s Norwegian company, and they were paid to the company in the second half of 2017.
The company’s operating expenses, including mate-rials and services, personnel expenses, depreciation and other operating expenses, amounted to EUR 11,387 thou-sand (EUR 9,625 thousand) in the fourth quarter, up 18.3 per cent compared to the same period in the previous year. Personnel expenses accounted for 63.4 per cent (60.1%) of operating expenses, or EUR 7,214 thousand (EUR 5,787 thousand).
The company’s net financial expenses in the fourth quarter amounted to EUR 134 thousand (EUR 90 thou-sand), due to translation differences in currency-denomi-nated internal receivables and debts related to the financ-ing of international subsidiaries.
Qt’s earnings before tax for the fourth quarter totaled EUR -835 thousand (EUR -395 thousand) and the result was EUR -731 thousand (EUR -153 thousand). Taxes for the review period amounted to EUR 104 thousand positive (EUR 242 thousand), which was due to deferred tax assets recognized for losses.
Earnings per share totaled EUR -0.03 during the fourth quarter (EUR -0.01).
Financing and investmentsCash flow from operating activities was EUR -2,939 thou-sand (EUR -1,385 thousand) in the first half of the year due to growth investments and subsequent loss-making operating result.
Qt Group 2017 / Board of Directors’ Report / Consolidated Key Figures / Financial Statements / CG / Information for Shareholders

21Annual Report 2017
The subscription period for the rights offering resolved on by the Board of Directors of Qt Group Plc on 14 March 2017 ended on 5 April 2017, and the company announced the result of the offering in a stock exchange release on 12 April 2017. The company raised gross proceeds of approx-imately EUR 15.3 million from the rights offering. A loan of EUR 6.0 million, granted by Ilmarinen Mutual Pension Insurance Company, was repaid in full in May 2017.
Qt’s cash and cash equivalents totaled EUR 11,693 thousand (EUR 6,420 thousand) at the end of the fiscal year.
Qt Group’s consolidated balance sheet total at the end of the fiscal year stood at EUR 37,485 thousand (EUR 29,443 thousand). Net cash flow from investments during the fiscal year was EUR -384 thousand (EUR -374 thou-sand).
The equity ratio stood at 42.9 per cent (40.0%) and gearing was -54.2 per cent (0.7%). Interest-bearing liabil-ities amounted to EUR 686 thousand (EUR 6,207 thou-sand), of which short-term loans accounted for EUR 287 thousand (EUR 6,152 thousand).
The return on investment for the fiscal year was -15.3 per cent (-12.0%) and return on equity was -15.9 per cent (-21.1%).
Research and developmentProduct development expenses are included in the result for the fiscal year in their entirety and the company has no
capitalized product development expenses in its balance sheet.
Product development expenses during the fiscal year totaled EUR 8,527 thousand (EUR 8,347 thousand), accounting for 23.5 per cent (25.8%) of operating expenses. Product development expenses increased by 2.2 per cent year-on-year.
At the end of the review period, the company had 111 people (87) employed in product development.
Personnel 1–12/2017 1–12/2016 Change %
(in an employment relationship, on average)
Finland 82 64 28%
Rest of Europe & APAC 139 118 18%
North-America 34 27 27%
Group total 255 209 22%
The geographical distribution of personnel:
PersonnelThe number of Group personnel was 275 (218) on average during the fourth quarter and 276 (220) at the end of the fiscal year. At the end of the fiscal year, international per-sonnel represented 68 per cent (68%) of the total.
Personnel expenses totaled EUR 26,975 thousand (EUR 22,990 thousand) during the fiscal year, up 17.3 per cent.
Qt Group 2017 / Board of Directors’ Report / Consolidated Key Figures / Financial Statements / CG / Information for Shareholders

22Annual Report 2017
Share and shareholders
On 31 December 2017, the number of Qt Group Plc shares was 23,792,312 (20,818,273).
According to Euroclear Finland Ltd, the company had 4,006 shareholders on 31 December 2017 (4,031). The company did not receive any flagging notifications during the fiscal year 2017.
Share price and trading
Qt Group Plc’s share (trading code: QTCOM) is traded on the Nasdaq Helsinki stock exchange. A total of 2,031,554 shares changed hands during the reporting period. This accounts for 8.5 per cent of the total number of shares. The volume-weighted average price of the share was EUR 6.38, with the lowest price being EUR 5.13 (21 December 2017) and the highest price EUR 7.58 (13 April 2017). The closing price at the end of December was EUR 5.21 per share, and Qt Group’s market capitalization was EUR 124.0 million.
Governance
Qt Group Plc's Annual General Meeting (AGM) held on 14 March 2017 adopted the company’s annual accounts, including the consolidated annual accounts for the accounting period 1 January–31 December 2016, and discharged the members of the Board of Directors and the Chief Executive Officer from liability. The AGM resolved, in accordance with the Board’s proposal, that no dividend will be paid based on the balance sheet adopted for the accounting period that ended on 31 December 2016.
The AGM resolved on the remuneration of the com-pany’s Board of Directors and auditors, decided that the number of members on the Board of Directors would be five (5) and elected the company’s Board of Direc-tors. Robert Ingman, Matti Rossi, Leena Saarinen, Tommi Uhari and Kai Öistämö were re-elected as members of Qt Group Plc’s Board of Directors. At its organizing meeting held after the AGM, the Board of Directors elected Robert Ingman as its Chairman and Tommi Uhari as the Vice Chairman.
Shareholder
Percentage of shares and votes
Ingman Development Oy Ab 21.6%
Ilmarinen Mutual Pension Insurance Company 14.3%
Hallikainen Jyrki Sakari 7.4%
Karvinen Kari Juhani 4.8%
Varma Mutual Pension Insurance Company 4.7%
Savolainen Matti Ilmari 3.9%
Aktia Capital Investment Fund 2.6%
Säästöpankki Small Cap Investment Fund 1.6%
Aktia Nordic Small Cap Investment Fund 1.6%
Varelius Juha Pekka 1.1%
Number of shares Shareholders
Percentage of shares and votes
1–100 22.2% 0.2%
101–1,000 56.2% 3.6%
1,001–10,000 18.8% 8.2%
10,001–100,000 2.0% 10.1%
100,001–1,000,000 0.6% 25.2%
1,000,001–9,999,999 0.1% 52.8%
Number of shares Shareholders Shares
Non-financial corporations 4.1% 27.7%
Financial and insurance corporations 0.6% 12.5%
General government 0.1% 18.9%
Not-for-profit institutions serving households 0.2% 0.3%
Households 94.5% 38.6%
Foreign holding 0.5% 0.6%
The ten largest shareholders on 31 December 2017
Distribution of holdings by number of shares held on 31 December 2017
Shareholding by sector on 31 December 2017
The number of outstanding shares at the end of the review period was 23,792,312.
Qt Group 2017 / Board of Directors’ Report / Consolidated Key Figures / Financial Statements / CG / Information for Shareholders
23Annual Report 2017
Juha Varelius has been Qt Group Plc’s President and CEO since 1 May 2016.
KPMG Oy Ab, Authorized Public Accountants, has served as the auditor of the Qt Group since 1 May 2016, with Authorized Public Accountant Kim Järvi as the princi-pal auditor.
AuthorizationsThe Annual General Meeting of 14 March 2017 granted the following authorizations to the Board of Directors of Qt Group Plc:
Authorizing the Board of Directors to decide on repurchasing the company’s own shares and/or accepting them as collateralThe AGM authorized the Board of Directors to decide on the repurchase and/or acceptance as collateral of a maxi-mum of 2,000,000 of the company’s own shares by using funds in the unrestricted equity.
According to the authorization, the Board will decide on how these shares are to be purchased. The shares may be repurchased in a proportion other than that of the shares held by the current shareholders. The authoriza-tion also includes the acquisition of shares through public trading organized by Nasdaq Helsinki Ltd in accordance with its and Euroclear Finland Ltd.’s rules and instructions, or through offers made to shareholders.
Shares may be acquired in order to improve the com-pany’s capital structure, to finance or carry out acquisi-tions or other arrangements, to implement share-based incentive schemes, to be transferred for other purposes, or to be cancelled.
The shares shall be repurchased for a price based on the fair value quoted in public trading. The authorization is valid for 18 months from the issue date of the authoriza-
tion, i.e. until 14 September 2018, and it replaces any ear-lier authorizations on the repurchase and/or acceptance as collateral of the company's own shares.
Authorizing the Board of Directors to decide on a rights issueThe AGM authorized the Board to decide on the issuance of a maximum total of 4,500,000 new shares or treas-ury shares in one or several rights issues pursuant to the pre-emptive subscription rights of the shareholders.
The authorization is valid until 31 December 2017. The authorization does not replace any earlier authorizations on share issues and the granting of special rights.
The authorization includes the Board of Directors’ right to decide on all terms relating to the share issue(s).
Authorizing the Board of Directors to decide on a share issue and the granting of special rights entitling to sharesThe AGM authorized the Board to decide on a share issue and the granting of special rights pursuant to Chapter 10, Section 1, of the Companies Act, subject to or free of charge, in one or several tranches on the following terms.
The maximum total number of shares to be issued by virtue of the authorization is 2,000,000. The authorization concerns both the issuance of new shares as well as the transfer of treasury shares. By virtue of the authorization, the Board of Directors is entitled to decide on share issues and the granting of special rights waiving the pre-emptive subscription rights of the shareholders (directed issue).
The authorization may be used in order to finance or carry out acquisitions or other arrangements, to carry out the company’s share-based incentive schemes and to improve the capital structure of the company, or for other purposes decided by the Board of Directors.
The authorization includes the Board of Directors' right to decide on all terms relating to the share issue and granting of special rights including the subscription price, its payment and its entry into the company's balance sheet.
The authorization is valid for 18 months from the issue date of the authorization, i.e. until 14 September 2018, and it does not replace any earlier authorizations on share issues and the granting of special rights. The author-ization does not replace any earlier authorizations on share issues and the granting of special rights.
Resolutions based on the authorizationBased on the authorization granted by the AGM, the Board of Directors of Qt Group Plc resolved on 14 March 2017 on a rights offering of a maximum of EUR 15.3 million. In the rights offering, the company offered a maximum of 2,974,039 new shares to its shareholders for subscription in proportion to their current shareholding in the company. The subscription price for the offered shares was EUR 5.15 per share.
The company announced the result of the rights offer-ing in a stock exchange release published on 12 April 2017. A total of 3,431,175 shares were subscribed for in the share issue. The Board of Directors accepted all primary subscriptions and secondary subscriptions in accordance with the terms and conditions of the offering, with a total of 2,974,039 new shares issued in the rights offering and registered with the Trade Register maintained by the Finn-ish Patent and Registration Office on 13 April 2017. As a result of the share issue, the total number of shares in the company increased to 23,792,312.
In its stock exchange release from 27 September 2017, the company announced that the programme involving the issue of a maximum of 2,000,000 stock option rights
Qt Group 2017 / Board of Directors’ Report / Consolidated Key Figures / Financial Statements / CG / Information for Shareholders
24Annual Report 2017
to key personnel of the company, approved at its meeting on 22 June 2016, will be continued so that the still existing 480,000 options will be issued the key personnel accord-ing the conditions of the option programme. At the same time, the Board of Directors of the company decided to issue a total of 52,348 option rights from the above-men-tioned amount gratuitously to those key personnel who had previously been granted option rights based on the option programme. These additional options were issued as an offering correction due to the fact that the share issue approved by the board on 14 March 2017 increased the number of company shares by 2,974,039 and the board did not want this change to affect the value of the options already granted to those who received them.
Corporate Governance StatementIn accordance with the Corporate Governance Code, Qt Group Plc has published a separate Corporate Governance Statement on its website as stipulated in the Finnish Securities Markets Act (746/2012), chapter 7, section 7. Statement has been issued as a separate report from the Report of the Board of Directors.
Risks and uncertainties
The company’s short-term risks and uncertainties are related to potential significant changes in the company’s business operations as well as the retention and recruit-ment of the personnel required for business development.
Exchange rate fluctuations, particularly between the US dollar and euro, may have a large impact on the devel-opment of the company’s net sales. Another factor con-tributing to considerable fluctuation in quarterly net sales and profitability in particular is contract turnaround times
which, in the major customer segment, are very long at up to 18 months.
The company’s business risks and preparations for them are also described on the company website at www.qt.io.
Group structure
The business of Qt Group Plc is operated under the subsid-iary The Qt Company Oy in Finland which has subsidiaries in Norway, Germany, USA, Russia, China and South-Korea as well as branch office in Japan.
Future outlook
Operating environment and market outlookThe company estimates the growth prospects for its busi-ness in the next few years as very promising.
The foundation of the company’s business is the stable market for platform-independent desktop appli-cations, which the company will continue to support by offering customers new versions of Qt and innovations related to 3D technology, for example. Growth potential on the desktop application side is, however, constrained by the limited number of software developers.
The company aims to achieve net sales growth by developing and expanding its sales and product offering, particularly in selected industries that create embedded systems, such as the auto industry, household and indus-trial automation and device manufacturing for the medical industry. Because many device manufacturers use desktop applications as part of their overall systems for purposes such as device visualization, this part of the company’s product offering will also continue to be an important part of the comprehensive solutions the company offers its
customers. The company’s earnings model in the embed-ded systems market is based on the number of devices developed using Qt, which means that the future growth potential in this market is significantly greater than in the desktop applications market. In order to support this, the focus of the company’s product development is tar-geted towards the development value-adding features of embedded systems required for the above-mentioned industries, as well as on innovating development tools.
Sales growth associated with embedded systems will also reflect on the earnings logic. Volume-based license revenue from these sales accumulates over the long term. Consequently, the company anticipates no major impact from embedded systems sales growth on consolidated net sales in 2018.
Outlook 2018The company estimates the growth of its net sales to pick up speed in 2018 with over 15 per cent growth at com-parable exchange rates from the previous year. Due to investments in line with its growth strategy, the compa-ny’s operating result will show a substantial loss also in 2018, as was expected based on prior forecasts.
Events after the end of the fiscal year
The company does not have any significant events after the end of the fiscal year that would have affected the financial statements.
Board of Directors’ Dividend Proposal
The Board of Directors of Qt Group Plc proposes to the Annual General Meeting that no dividend be paid for the fiscal year that ended on 31 December 2017.
Qt Group 2017 / Board of Directors’ Report / Consolidated Key Figures / Financial Statements / CG / Information for Shareholders

25Annual Report 2017
Calculation formulas for key figures
x 100
x 100
Profit/loss before taxes – taxes
Shareholders’ equity + minority interest (average)
Return on equity
(Profit/loss before taxes + interest and other financing costs)
Balance sheet total – non-interest bearing liabilities (average)
Return on investment:
Interest-bearing liabilities – cash, bank receivables and financial securities
Shareholders’ equity
Gearing
Shareholders’ equity + minority interest
Balance sheet total – advance payments received
Equity ratio
x 100
x 100
EUR thousand 1–12/2017carve out
1–12/2016
Net sales 36,259 32,395
Operating profit -3,206 -1,736
- % of net sales -8.80% -5.40%
Net profit -3,222 -1,747
- % of net sales -8.90% -5.40%
Return on equity % -15.90% -21.10%
Return on investment % -15.30% -12.00%
Interest-bearing liabilities 686 6,207
Cash and cash equivalents 11,693 6,420
Net gearing % -54.2% 0.70%
Equity ratio % 42.90% 40.00%
Earnings per share, EUR -0.14 -0.08
Qt Group 2017 / Board of Directors’ Report / Consolidated Key Figures / Financial Statements / CG / Information for Shareholders
Consolidated key figures

26Annual Report 2017
We are very happy with our choice. We’ve been able to develop a stable and productive product removing any risk of an unknown in the clinical environment. Dr. Stuart McGregor Project Manager, Evidence Evolution product line
Randox
Randox Laboratories develops innovative diagnostic systems. Qt has provided a comprehensive cross-platform development framework for building an interactive human machine interface (HMI).
Qt Group 2017 / Board of Directors’ Report / Consolidated Key Figures / Financial Statements / CG / Information for Shareholders

27Annual Report 2017
Financial statements 2017Consolidated income statement 28
Consolidated statement of financial position 29
Consolidated statement of cash flows 30
Consolidated statement of changes in shareholders’ equity 31
Notes to the Consolidated Financial Statements 32
Parent company income statement 59
Parent company balance sheet 60
Parent company cash flow statement 61
Basic information on the parent company and
accounting policies applied in the financial statements 62
Notes to the parent company financial statements 63
Signatures to the Financial Statements and
the Board of Directors’ Report 68
Auditor’s Report 69
Qt Group 2017 / Board of Directors’ Report / Consolidated Key Figures / Financial Statements / CG / Information for Shareholders

28Annual Report 2017
Consolidated income statement Consolidated statement of comprehensive income
EUR thousand Notes1.1.–31.12.
2017
carve-out1.1.–31.12.
2016
Other comprehensive income
Items which may be reclassified subsequently to profit or loss:
Translation difference -88 28
Total comprehensive income -3,310 -1,720
Distribution of comprehensive income:
Parent company shareholders -3,310 -1,720
EUR thousand Notes1.1.–31.12.
2017
carve-out1.1.–31.12.
2016
Net sales 2 36,259 32,395
Other operating income 3 1,128 528
Materials and services 4 -1,130 -2,313
Personnel expenses 5, 18, 22 -26,975 -22,990
Depreciation, amortisation and impairment 7 -914 -866
Other operating expenses 8 -11,574 -8,489
Operating result -3,206 -1,736
Financial income 9 764 529
Financial expenses 9 -1,252 -1,071
Earnings before tax -3,694 -2,277
Income taxes 10 472 530
Net profit -3,222 -1,747
Distribution of comprehensive income:
Parent company shareholders -3,222 -1,747
Net profit attributable to parent company shareholders, earnings per share
Undiluted earnings per share (EUR/share) 11 -0.14 -0.08
Qt Group 2017 / Board of Directors’ Report / Consolidated Key Figures / Financial Statements / CG / Information for Shareholders

29Annual Report 2017
Consolidated statement of financial position Assets Equity and liabilities
EUR thousand Notes 31.12.2017 31.12.2016
Non-current assets
Goodwill 12 6,562 6,562
Other intangible assets 12 4,995 5,360
Tangible assets 13 1,082 567
Long-term receivables 157 37
Deferred tax assets 14 2,049 915
Total non-current assets 14,845 13,441
Current assets
Trade receivables 15 7,829 7,741
Other receivables 15 3,117 1,841
Cash and cash equivalents 16 11,693 6,420
Total current assets 22,639 16,002
Total assets 37,485 29,443
EUR thousand Notes 31.12.2017 31.12.2016
Shareholders’ equity
Share capital 17 500 500
Unrestricted shareholders’ equity reserve 17 23,651 8,720
Translation difference 17 545 633
Retained earnings 17, 18 -1,165 160
Net profit -3,222 -1,747
Total shareholders’ equity 20,308 8,265
Long-term liabilities
Deferred tax liabilities 14 317 293
Long-term interest-bearing liabilities 20 399 55
Other long-term liabilities 19 753 461
Total long-term liabilities 1,469 809
Short-term liabilities
Short-term interest-bearing liabilities 19, 20 287 6,152
Accounts payable 19 1,375 774
Other short-term liabilities 19 14,046 13,443
Total short-term liabilities 15,707 20,369
Total liabilities 17,176 21,178
Shareholders’ equity and liabilities 37,485 29,443
Qt Group 2017 / Board of Directors’ Report / Consolidated Key Figures / Financial Statements / CG / Information for Shareholders
30Annual Report 2017
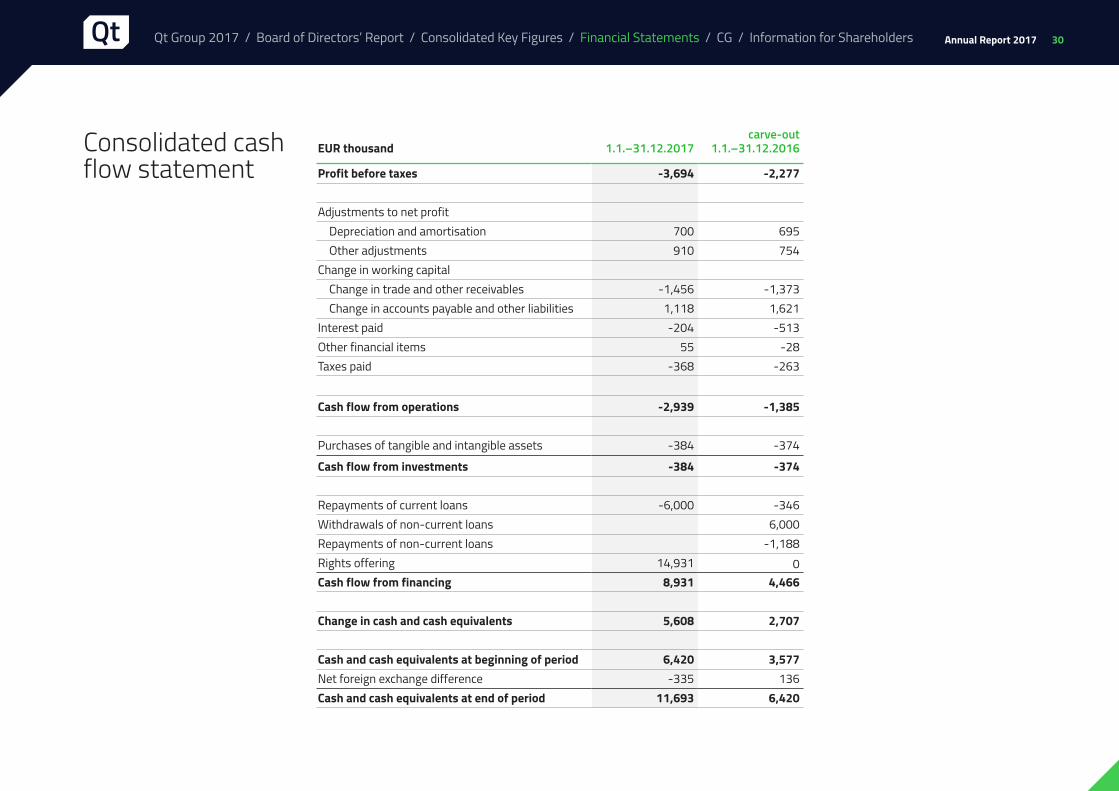
Consolidated cash flow statement
EUR thousand 1.1.–31.12.2017carve-out
1.1.–31.12.2016
Profit before taxes -3,694 -2,277
Adjustments to net profitDepreciation and amortisation 700 695Other adjustments 910 754
Change in working capitalChange in trade and other receivables -1,456 -1,373Change in accounts payable and other liabilities 1,118 1,621
Interest paid -204 -513Other financial items 55 -28Taxes paid -368 -263
Cash flow from operations -2,939 -1,385
Purchases of tangible and intangible assets -384 -374
Cash flow from investments -384 -374
Repayments of current loans -6,000 -346Withdrawals of non-current loans 6,000Repayments of non-current loans -1,188Rights offering 14,931 0Cash flow from financing 8,931 4,466
Change in cash and cash equivalents 5,608 2,707
Cash and cash equivalents at beginning of period 6,420 3,577Net foreign exchange difference -335 136Cash and cash equivalents at end of period 11,693 6,420
Qt Group 2017 / Board of Directors’ Report / Consolidated Key Figures / Financial Statements / CG / Information for Shareholders

31Annual Report 2017
Consolidated statement of changes in shareholders’ equity
EUR thousand
Invested equity and retained earnings
equity Share capital
Unrestricted shareholders’
equity reserve Translation
differenceRetainedearnings
Totalshareholders’
equity
Shareholders’ equity 1.1.2016 8,314 0 0 605 0 8,919
Comprehensive income for the period 1–4/2016
Net profit 526 526
Comprehensive income 0 97 97
Demerger-related transactions 855 855
Demerger 30 April 2016 -9,694 500 8,720 474 0
Shareholders’ equity 1 May 2016 0 500 8,720 702 474 10,396
Comprehensive income for the period 5–12/2016
Net profit -2,273 -2,273
Stock option programme 211 211
Comprehensive income -69 -69
Shareholders’ equity 31 December 2016 0 500 8,720 633 -1,588 8,265
Shareholders’ equity 1 January 2017 0 500 8,720 633 -1,588 8,265
Comprehensive income for the period
Net profit -3,222 -3,222
Stock option programme 422 422
Comprehensive income -88 -88
Rights offering 14,931 14,931
Shareholders’ equity 31 December 2017 0 500 23,651 545 -4,388 20,308
Shareholders’ equity information prior to the demerger (1 May 2016) are based on carve-out figures.
Qt Group 2017 / Board of Directors’ Report / Consolidated Key Figures / Financial Statements / CG / Information for Shareholders

32Annual Report 2017
Notes to the Consolidated Financial Statements
ACCOUNTING POLICIES APPLIED IN THE CONSOLIDATED FINANCIAL STATEMENTS
Basic information on the GroupQt Group is a company focusing on the development of software tools, responsible for the development, producti-sation and licensing of software development tools based on Qt technology under commercial and open source licenses. Globally well-known brands are building their success based on Qt’s technology. Our customers include leading industrial companies from several sectors, using Qtas the software platform of their vehicle hardware, indus-trial automation applications and business critical systems. Qt is used, for example, in airplane entertainment systems, as a platform for digital televisions, in car entertainment systems and cabins, marine industry’s automation sys-tems and user interfaces of medical devices.
Qt has operating locations in Finland, Norway, Ger-many, United States, Russia, Japan, China and South Korea. The company has approximately 100 software develop-ers working in research and product development units in Berlin, Oslo and Oulu. The company’s head office is located in Espoo, Finland. The Group had 276 employees at the end of 2017.
The company is listed on the Nasdaq Helsinki Stock Exchange. The parent company’s domicile is Espoo and its registered address is Bertel Jungin aukio D3A, FI-02600 Espoo, Finland. A copy of the financial statements is avail-able at https://investors.qt.io.
Accounting policies applied in the consolidated financial statementsThis section describes the general accounting policies applied in the consolidated financial statements and the use of management judgement and estimates. More detailed accounting policies are presented below in con-nection with each item.
Basis of preparation
Qt Group Plc was established by the partial demerger of Digia Plc on 1 May 2016, which saw Digia’s Qt business transferred to a new parent company. Hence, some of the comparison data are based on carve-out financial informa-tion.
The consolidated financial statements have been prepared in compliance with the International Financial Reporting Standards (IFRS), observing the IAS and IFRS standards as well as the SIC and IFRIC interpretations valid on 31 December 2017.
The consolidated financial statements are drawn up for the calendar year, which is the fiscal period for the Group’s parent company and other Group companies.
The financial statements are presented in thousands of euros.
Consolidation principles
The consolidated financial statements include the parent company, Qt Group Plc, and all of their subsidiaries. Acquired subsidiaries are consolidated using the acqui-sition cost method, according to which the assets and liabilities of the acquired company are measured at fair value on the date of acquisition, and the remaining dif-ference between the acquisition price and the acquired shareholders’ equity constitutes goodwill. Subsidiaries acquired during the fiscal period are included in the consol-idated financial statements as of the date of acquisition, while divested subsidiaries are included until the date of divestment. Intra-Group transactions, receivables, liabili-ties, unrealised margins and internal profit distribution are eliminated in the consolidated financial statements.
All subsidiaries included in the consolidated financial statements are fully owned and the Group does not have minority interests. The Group does not have associated companies or joint ventures.
Qt Group has applied the amendments to standards and interpretations applicable to the Group which entered into force during the financial year. The amendments have not had a material impact on the result for the financial year, financial position or presentation of the financial statements.
Foreign currency translationItems referring to the earnings and financial position of the Group’s units are recognised in the currency that is the main currency of the unit’s primary operating environ-
Qt Group 2017 / Board of Directors’ Report / Consolidated Key Figures / Financial Statements / CG / Information for Shareholders
33Annual Report 2017
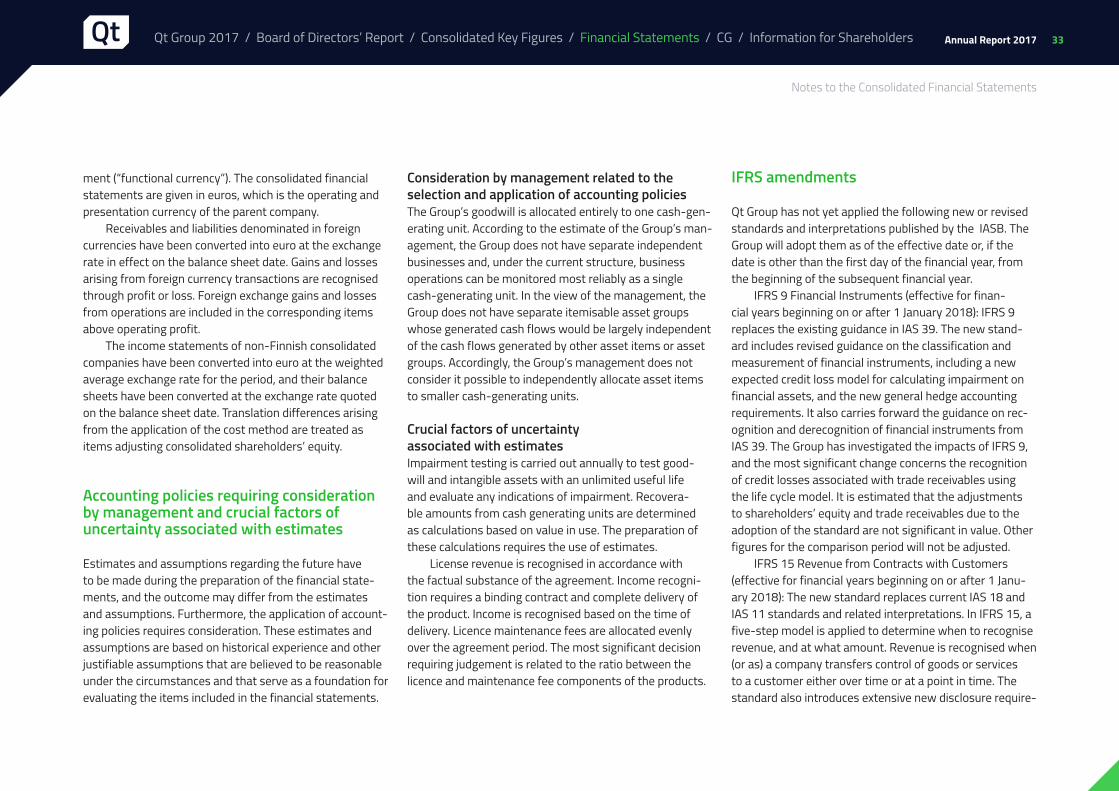
ment (“functional currency”). The consolidated financial statements are given in euros, which is the operating and presentation currency of the parent company.
Receivables and liabilities denominated in foreign currencies have been converted into euro at the exchange rate in effect on the balance sheet date. Gains and losses arising from foreign currency transactions are recognised through profit or loss. Foreign exchange gains and losses from operations are included in the corresponding items above operating profit.
The income statements of non-Finnish consolidated companies have been converted into euro at the weighted average exchange rate for the period, and their balance sheets have been converted at the exchange rate quoted on the balance sheet date. Translation differences arising from the application of the cost method are treated as items adjusting consolidated shareholders’ equity.
Accounting policies requiring consideration by management and crucial factors of uncertainty associated with estimates
Estimates and assumptions regarding the future have to be made during the preparation of the financial state-ments, and the outcome may differ from the estimates and assumptions. Furthermore, the application of account-ing policies requires consideration. These estimates and assumptions are based on historical experience and other justifiable assumptions that are believed to be reasonable under the circumstances and that serve as a foundation for evaluating the items included in the financial statements.
Consideration by management related to the selection and application of accounting policiesThe Group’s goodwill is allocated entirely to one cash-gen-erating unit. According to the estimate of the Group’s man-agement, the Group does not have separate independent businesses and, under the current structure, business operations can be monitored most reliably as a single cash-generating unit. In the view of the management, the Group does not have separate itemisable asset groups whose generated cash flows would be largely independent of the cash flows generated by other asset items or asset groups. Accordingly, the Group’s management does not consider it possible to independently allocate asset items to smaller cash-generating units.
Crucial factors of uncertainty associated with estimatesImpairment testing is carried out annually to test good-will and intangible assets with an unlimited useful life and evaluate any indications of impairment. Recovera-ble amounts from cash generating units are determined as calculations based on value in use. The preparation of these calculations requires the use of estimates.
License revenue is recognised in accordance with the factual substance of the agreement. Income recogni-tion requires a binding contract and complete delivery of the product. Income is recognised based on the time of delivery. Licence maintenance fees are allocated evenly over the agreement period. The most significant decision requiring judgement is related to the ratio between the licence and maintenance fee components of the products.
IFRS amendments
Qt Group has not yet applied the following new or revised standards and interpretations published by the IASB. The Group will adopt them as of the effective date or, if the date is other than the first day of the financial year, from the beginning of the subsequent financial year.
IFRS 9 Financial Instruments (effective for finan-cial years beginning on or after 1 January 2018): IFRS 9 replaces the existing guidance in IAS 39. The new stand-ard includes revised guidance on the classification and measurement of financial instruments, including a new expected credit loss model for calculating impairment on financial assets, and the new general hedge accounting requirements. It also carries forward the guidance on rec-ognition and derecognition of financial instruments from IAS 39. The Group has investigated the impacts of IFRS 9, and the most significant change concerns the recognition of credit losses associated with trade receivables using the life cycle model. It is estimated that the adjustments to shareholders’ equity and trade receivables due to the adoption of the standard are not significant in value. Other figures for the comparison period will not be adjusted.
IFRS 15 Revenue from Contracts with Customers (effective for financial years beginning on or after 1 Janu-ary 2018): The new standard replaces current IAS 18 and IAS 11 standards and related interpretations. In IFRS 15, a five-step model is applied to determine when to recognise revenue, and at what amount. Revenue is recognised when (or as) a company transfers control of goods or services to a customer either over time or at a point in time. The standard also introduces extensive new disclosure require-
Notes to the Consolidated Financial Statements
Qt Group 2017 / Board of Directors’ Report / Consolidated Key Figures / Financial Statements / CG / Information for Shareholders

34Annual Report 2017
ments. The impacts of IFRS 15 on Qt Group’s consolidated financial statements have been assessed as follows:
The essential concepts in IFRS 15 have been analysed with respect to revenue streams. The Group’s revenue streams consist of licences, maintenance and consulting. According to the report and documentation compiled as a result, the new standard makes some specifications to the calculation rules, but no changes to the results for the past year have been observed. The application of IFRS 15 will, therefore, not have a material effect on Qt Group's finan-cial statements.
IFRS 16 Leases (effective for financial years beginning on or after 1 January 2019). The new standard replaces the current IAS 17 standard and related interpretations. IFRS 16 requires the lessees to recognise the lease agreements on the balance sheet as right-of-use assets and lease lia-bilities. The accounting model is similar to current finance lease accounting according to IAS 17. There are two excep-tions available, these relate to either short-term contracts in which the lease term is 12 months or less, or assets of value USD 5,000 or less. The accounting of lessors will largely remain in accordance with the current IAS 17.
Qt Group has commenced a preliminary assessment of the impacts of IFRS 16 on financial statements. The most considerable identified impact is that Qt Group will recognise new assets and liabilities on its balance sheet, mainly business premises and vehicles included currently in other leases. In addition, the nature of expenses asso-ciated with said leases will change as IFRS 16 replaces rental expense with depreciation and interest expense arising from lease liability, reported as part of financial expenses. Qt Group will prepare a more detailed estimate
of the impacts of the standard and the transition method during the 2018 financial year.
Other standards or interpretations entering into force in 2018 are not considered to have a material impact on the Group’s result for the financial year, financial position or presentation of financial statements.
Notes to the Consolidated Financial Statements
Qt Group 2017 / Board of Directors’ Report / Consolidated Key Figures / Financial Statements / CG / Information for Shareholders

35Annual Report 2017
1. ACQUIRED AND SOLD BUSINESSES
Businesses acquired in 2017 No acquisitions were made during the financial year 2017.
Businesses acquired in 2016No acquisitions were made during the financial year 2016.
2. NET SALES BREAKDOWN
Revenue recognition principlesLicense revenue is recognised in accordance with the factual substance of the agreement. Income recognition requires a binding contract and complete delivery of the product. In addition to the license component, licensing may also include maintenance. Depending on the type of license, income is recognised based on the time of deliv-ery. Licence maintenance fees are allocated evenly over the agreement period. Revenue for sold work is recognized based on work performed.
Operating segmentsThe Group reports one business segment that provides its customers with software development tools. The Group’s highest operational decision-maker is the President and CEO together with the Group Management Team. Due to Qt Group’s business model, nature of operations and gov-ernance structure, the reported segment covers the entire Group, and its figures are congruent with the consolidated figures.
Net Sales
* Non-current assets are comprised of goodwill, intangible and tangible assets and long-term receivables.
The Group does not have customers that represent more than 10 % of its net sales.
EUR thousand2017
Net Sales 2016
Net Sales
Licence sales and consulting 23,030 21,073
Maintenance revenue 13,230 11,322
Total net sales 36,259 32,395
EUR thousand2017
Net Sales
2017Non-current
assets *2016
Net Sales
2016Non-current
assets *
Finland 216 12,233 257 12,267
Rest of Europe and APAC 21,038 426 18,811 171
North America 15,006 138 13,327 89
Total net sales 36,259 12,797 32,395 12,527
Notes to the Consolidated Financial Statements
Qt Group 2017 / Board of Directors’ Report / Consolidated Key Figures / Financial Statements / CG / Information for Shareholders

36Annual Report 2017
3. OTHER OPERATING INCOME
Other operating income consists of income that is not attributable to the Group’s actual business. Other operating income is primarily comprised of public grants and income from organised events.
Public grants are recognised once it is reasonably certain that they will be received and the Group meets the conditions for receiving the grant.
Public grants are recognised through profit or loss for the period during which the right to receive the grant arises. The Group’s public grants are presented in other operating income.
EUR thousand 2017 2016
Grants 389 0
Other income 739 528
Total 1,128 528
4. MATERIALS AND SERVICES
EUR thousand 2017 2016
Purchases during the period 0 34
External services 1,130 2,279
Total 1,130 2,313
External services are mainly comprised of outsourcing services and subcontracting.
Grants primarily comprise subsidies allocated for R&D in Norway. Other income is generated by admissions to events organized by the company, and by compensations paid by partners.
Notes to the Consolidated Financial Statements
Qt Group 2017 / Board of Directors’ Report / Consolidated Key Figures / Financial Statements / CG / Information for Shareholders
37Annual Report 2017
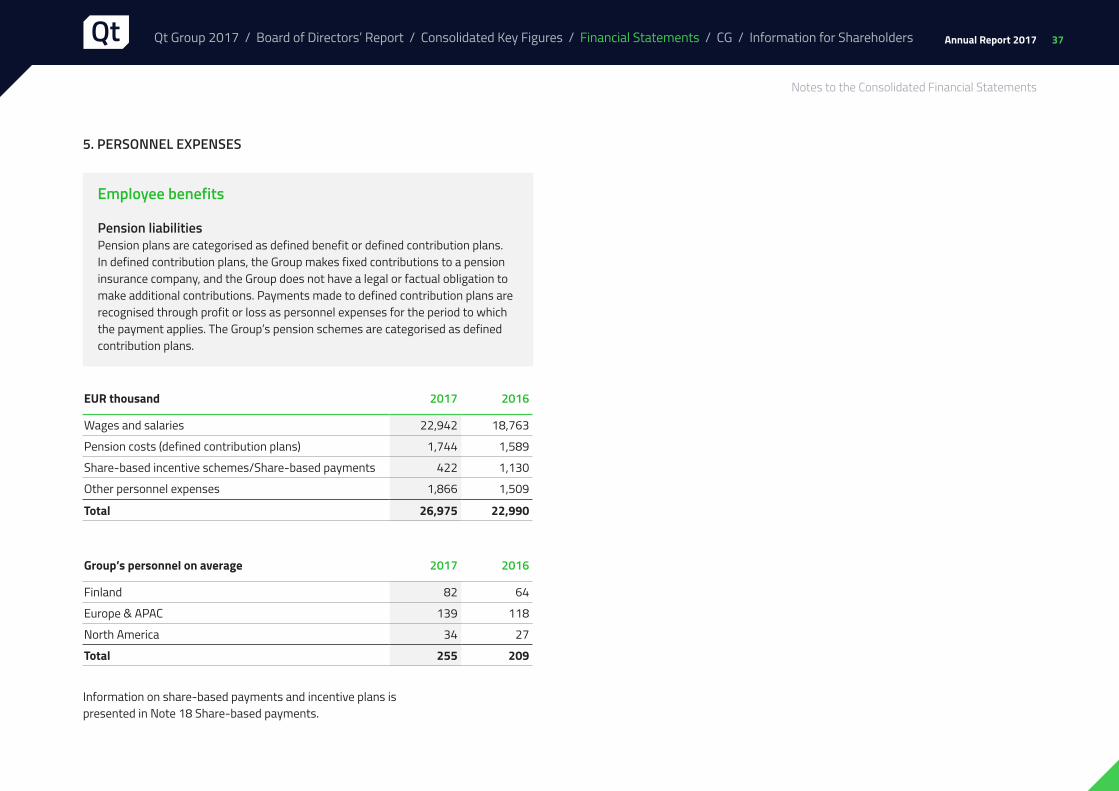
5. PERSONNEL EXPENSES
Employee benefits
Pension liabilitiesPension plans are categorised as defined benefit or defined contribution plans. In defined contribution plans, the Group makes fixed contributions to a pension insurance company, and the Group does not have a legal or factual obligation to make additional contributions. Payments made to defined contribution plans are recognised through profit or loss as personnel expenses for the period to which the payment applies. The Group’s pension schemes are categorised as defined contribution plans.
EUR thousand 2017 2016
Wages and salaries 22,942 18,763
Pension costs (defined contribution plans) 1,744 1,589
Share-based incentive schemes/Share-based payments 422 1,130
Other personnel expenses 1,866 1,509
Total 26,975 22,990
Group’s personnel on average 2017 2016
Finland 82 64
Europe & APAC 139 118
North America 34 27
Total 255 209
Information on share-based payments and incentive plans is presented in Note 18 Share-based payments.
Notes to the Consolidated Financial Statements
Qt Group 2017 / Board of Directors’ Report / Consolidated Key Figures / Financial Statements / CG / Information for Shareholders
38Annual Report 2017
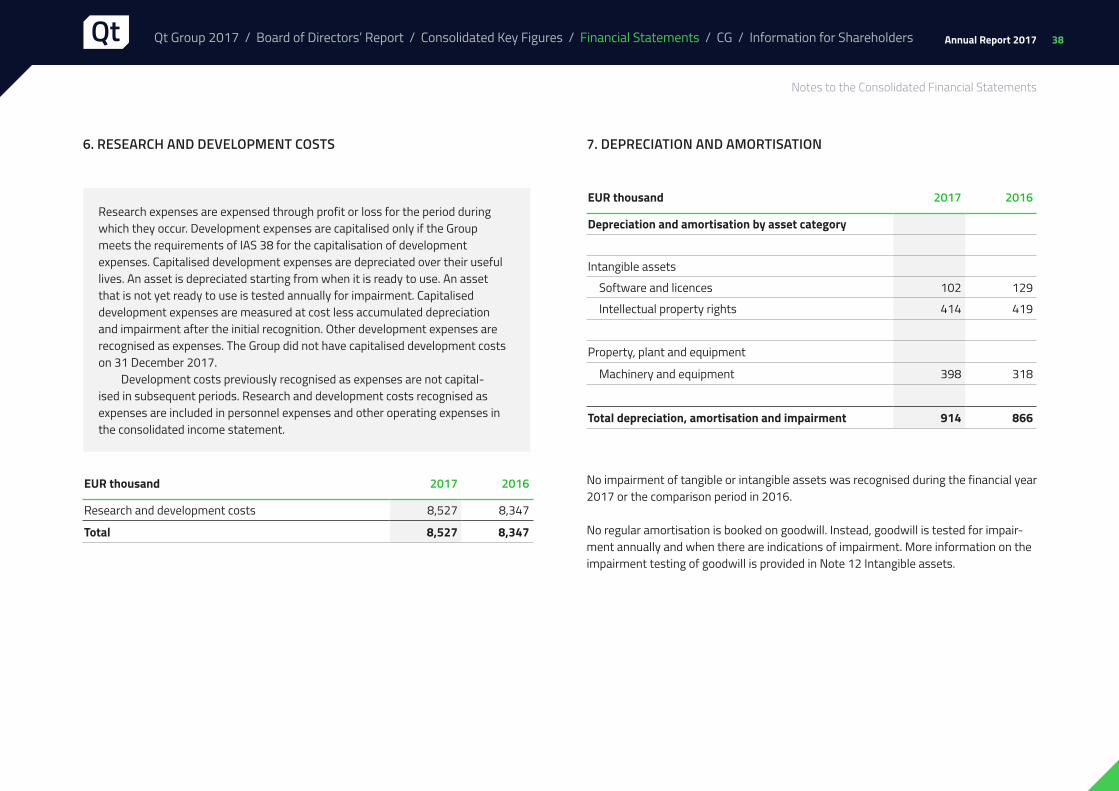
6. RESEARCH AND DEVELOPMENT COSTS
Research expenses are expensed through profit or loss for the period during which they occur. Development expenses are capitalised only if the Group meets the requirements of IAS 38 for the capitalisation of development expenses. Capitalised development expenses are depreciated over their useful lives. An asset is depreciated starting from when it is ready to use. An asset that is not yet ready to use is tested annually for impairment. Capitalised development expenses are measured at cost less accumulated depreciation and impairment after the initial recognition. Other development expenses are recognised as expenses. The Group did not have capitalised development costs on 31 December 2017.
Development costs previously recognised as expenses are not capital-ised in subsequent periods. Research and development costs recognised as expenses are included in personnel expenses and other operating expenses in the consolidated income statement.
EUR thousand 2017 2016
Research and development costs 8,527 8,347
Total 8,527 8,347
7. DEPRECIATION AND AMORTISATION
EUR thousand 2017 2016
Depreciation and amortisation by asset category
Intangible assets
Software and licences 102 129
Intellectual property rights 414 419
Property, plant and equipment
Machinery and equipment 398 318
Total depreciation, amortisation and impairment 914 866
No impairment of tangible or intangible assets was recognised during the financial year 2017 or the comparison period in 2016. No regular amortisation is booked on goodwill. Instead, goodwill is tested for impair-ment annually and when there are indications of impairment. More information on the impairment testing of goodwill is provided in Note 12 Intangible assets.
Notes to the Consolidated Financial Statements
Qt Group 2017 / Board of Directors’ Report / Consolidated Key Figures / Financial Statements / CG / Information for Shareholders

39Annual Report 2017
8. OTHER OPERATING EXPENSES 9. FINANCIAL INCOME AND EXPENSES
Financial incomeEUR thousand 2017 2016
Exchange rate gains 760 526
Other financial income 4 4
Total 764 529
Financial expensesEUR thousand 2017 2016
Interest expenses for loans from financial institutions 204 510
Exchange rate losses 1,020 510
Other financial expenses 28 51
Total 1,252 1,071
During the financial year 2017, loans from financial institutions were covered with income generated by a rights issue.
EUR thousand 2017 2016
Personnel expenses 962 679
Travel and representation expenses 1,809 1,345
Marketing and communications 1,884 725
External services 2,178 1,752
Costs of premises 2,110 1,551
IT expenses 2,100 1,988
Other expenses 531 450
Total 11,574 8,489
Auditors’ fees
Audit 44 35
Tax counselling 38
Other services 88 2
Total 132 75
The Group’s auditor for 2016 and 2017 was KPMG Oy Ab.
During financial year 2017, services that were rendered by KPMG Oy Ab to the Qt Group companies and that were not related to auditing amounted to EUR 88 thousand. These services were comprised of auditor’s opinions (EUR 21 thousand) and other services (EUR 67 thousand).
Notes to the Consolidated Financial Statements
Qt Group 2017 / Board of Directors’ Report / Consolidated Key Figures / Financial Statements / CG / Information for Shareholders

40Annual Report 2017
10. INCOME TAXES
EUR thousand 2017 2016
Taxes for the period 353 222
Taxes for previous periods 54 -170
Other items 230 211
Deferred tax -1,109 -793
Total -472 -530
Reconciliation of tax expenses with the tax rate of the Group’s home country (20%)
Earnings before tax -3,694 -2,277
Taxes calculated at the parent company’s tax rate -739 -455
Effect of deviating tax rates of foreign subsidiaries 132 102
Income not subject to tax -261 -168
Non-deductible expenses and other differences 98 66
Other items 211 96
Taxes for previous periods 87 -170
Total -472 -530
Effective tax rate 13% 23%
The Group’s tax expense is comprised of the tax based on the taxable profit of each Group company for the period and change in deferred tax assets and liabilities. The tax based on the taxable income for the period is calculated using the tax rate pre-scribed or practically confirmed by the closing date of the reporting period. Deferred tax assets or liabilities are recognised for temporary differences between the taxa-tion and accounting values of assets and liabilities using the tax rate prescribed or practically confirmed by the closing date of the reporting period. Temporary differ-ences arise from, among other things, confirmed tax losses, depreciation differ-ence, provisions and adjustments to the fair values of assets and liabilities made in connection with business acquisitions. Deferred tax liabilities are recognised for the undistributed earnings of subsidiaries if the distribution of profits is probable and will result in tax consequences. Deferred tax liabilities are included in the balance sheet in full, and deferred tax assets in the amount of the estimated probable tax benefit. The tax expense in the income statement is comprised of tax based on the taxable income for the period and deferred taxes. Taxes are recognised through profit or loss, except when they are associated with business combinations or items recognised directly in shareholders’ equity or other comprehensive income. Tax assets or liabil-ities based on the taxable income for the period are presented under current items in the balance sheet, while deferred tax liabilities and assets are presented under non-current items.
Notes to the Consolidated Financial Statements
Qt Group 2017 / Board of Directors’ Report / Consolidated Key Figures / Financial Statements / CG / Information for Shareholders

41Annual Report 2017
11. EARNINGS PER SHARE
2017 2016
Net profit attributable to parent company shareholders (EUR thousand) -3,222 -1,747
Weighted average number of shares during the financial period, 1,000 shares 23,049 20,818
Undiluted earnings per share (EUR/share) -0.14 -0.08
Undiluted earnings per shareUndiluted earnings per share are calculated by dividing the profit for the period attributable to parent company shareholders by the weighted average number of outstanding shares.
Diluted earnings per shareIn calculating the diluted earnings per share, the dilution effect of all potential dilu-tive equity shares is taken into account in the weighted average number of shares. Stock options included in the incentive scheme are conditionally issued, and they are taken into account in calculating the diluted earnings per share. The options have a dilution effect when their subscription price is lower than the average market price of the share during the financial period or a shorter period of execution. The dilu-tion effect is the difference between the number of shares issued and the number of shares that would have been issued at the average market price of the shares during the period.
The company does not separately disclose the diluted earnings per share, as the dilution effect would decrease the loss per share for continuing operations.
Notes to the Consolidated Financial Statements
Qt Group 2017 / Board of Directors’ Report / Consolidated Key Figures / Financial Statements / CG / Information for Shareholders
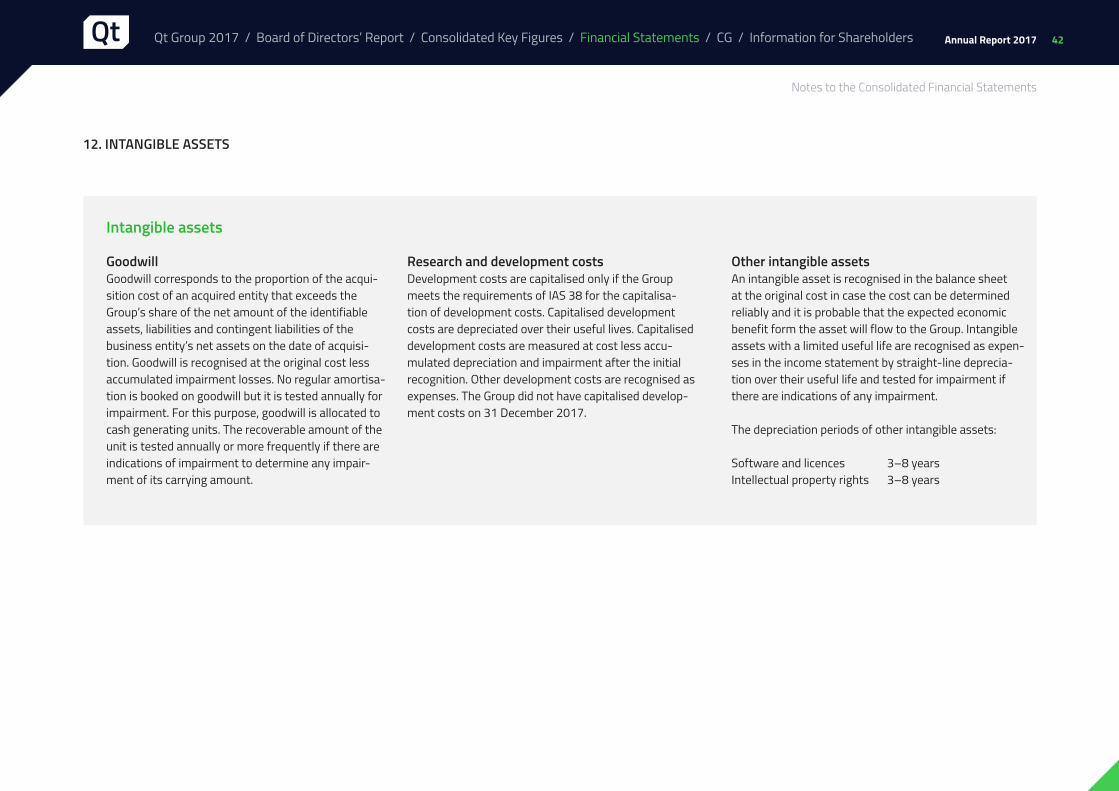
42Annual Report 2017
12. INTANGIBLE ASSETS
Intangible assets
GoodwillGoodwill corresponds to the proportion of the acqui-sition cost of an acquired entity that exceeds the Group’s share of the net amount of the identifiable assets, liabilities and contingent liabilities of the business entity’s net assets on the date of acquisi-tion. Goodwill is recognised at the original cost less accumulated impairment losses. No regular amortisa-tion is booked on goodwill but it is tested annually for impairment. For this purpose, goodwill is allocated to cash generating units. The recoverable amount of the unit is tested annually or more frequently if there are indications of impairment to determine any impair-ment of its carrying amount.
Research and development costs Development costs are capitalised only if the Group meets the requirements of IAS 38 for the capitalisa-tion of development costs. Capitalised development costs are depreciated over their useful lives. Capitalised development costs are measured at cost less accu-mulated depreciation and impairment after the initial recognition. Other development costs are recognised as expenses. The Group did not have capitalised develop-ment costs on 31 December 2017.
Other intangible assetsAn intangible asset is recognised in the balance sheet at the original cost in case the cost can be determined reliably and it is probable that the expected economic benefit form the asset will flow to the Group. Intangible assets with a limited useful life are recognised as expen-ses in the income statement by straight-line deprecia-tion over their useful life and tested for impairment if there are indications of any impairment.
The depreciation periods of other intangible assets:
Software and licences 3–8 yearsIntellectual property rights 3–8 years
Notes to the Consolidated Financial Statements
Qt Group 2017 / Board of Directors’ Report / Consolidated Key Figures / Financial Statements / CG / Information for Shareholders

43Annual Report 2017
EUR thousand Goodwill
Otherintangible
assets Total
Acquisition cost, 1 January 6,562 8,302 14,864
Translation differences and other adjustments 0 -2 -2
Additions 0 162 162
Acquisition cost, 31 December 6,562 8,462 15,024
Accumulated depreciation and impairment, 1 January 0 -2,941 -2,941
Translation differences and other adjustments 0 -10 -10
Depreciation for the period 0 -516 -516
Accumulated depreciation and impairment, 31 December 0 -3,466 -3,466
Book value, 1 January 6,562 5,361 11,923
Book value, 31 December 6,562 4,995 11,557
Intangible assets 2017
Notes to the Consolidated Financial Statements
Qt Group 2017 / Board of Directors’ Report / Consolidated Key Figures / Financial Statements / CG / Information for Shareholders

44Annual Report 2017
EUR thousand Goodwill
Otherintangible
assets Total
Acquisition cost, 1 January 6,562 8,220 14,782
Translation differences and other adjustments 0 34 34
Additions 0 48 48
Acquisition cost, 31 December 6,562 8,302 14,864
Accumulated depreciation and impairment, 1 January 0 -2,376 -2,376
Translation differences and other adjustments 0 -17 -17
Depreciation for the period 0 -548 -548
Accumulated depreciation and impairment, 31 December 0 -2,941 -2,941
Book value, 1 January 6,562 5,844 12,406
Book value, 31 December 6,562 5,361 11,923
Intangible assets2016
Notes to the Consolidated Financial Statements
Qt Group 2017 / Board of Directors’ Report / Consolidated Key Figures / Financial Statements / CG / Information for Shareholders
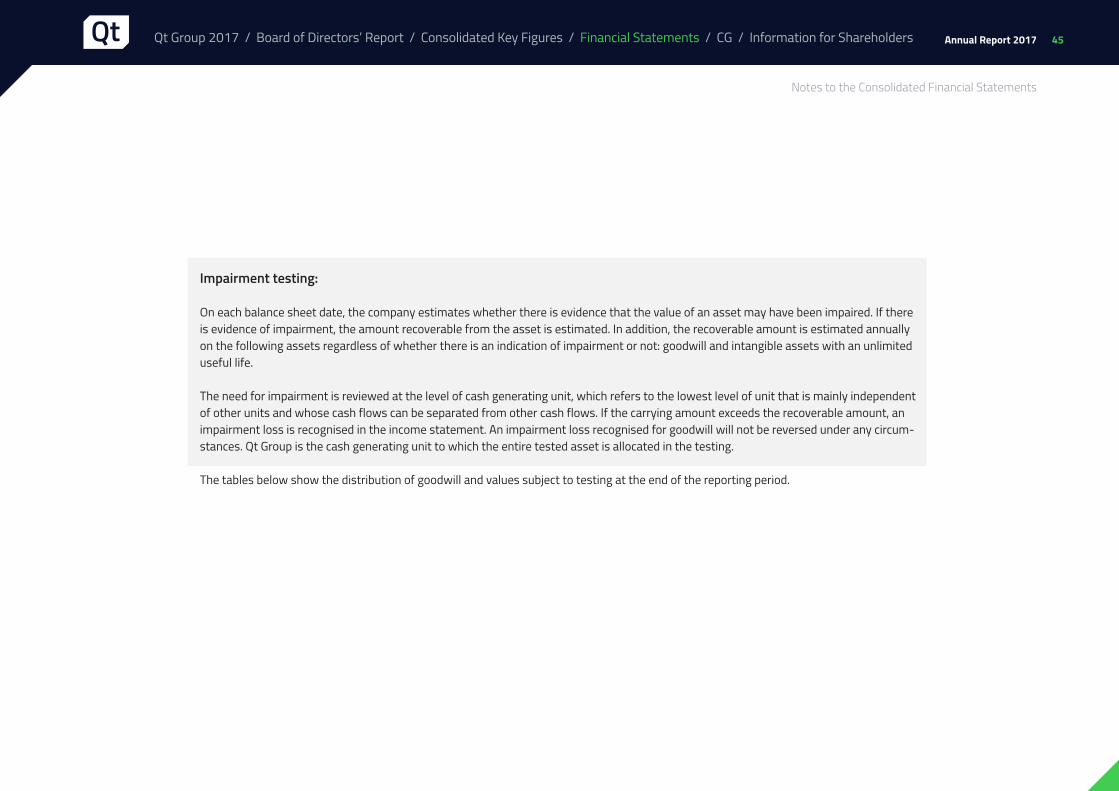
45Annual Report 2017
Impairment testing:
On each balance sheet date, the company estimates whether there is evidence that the value of an asset may have been impaired. If there is evidence of impairment, the amount recoverable from the asset is estimated. In addition, the recoverable amount is estimated annually on the following assets regardless of whether there is an indication of impairment or not: goodwill and intangible assets with an unlimited useful life.
The need for impairment is reviewed at the level of cash generating unit, which refers to the lowest level of unit that is mainly independent of other units and whose cash flows can be separated from other cash flows. If the carrying amount exceeds the recoverable amount, an impairment loss is recognised in the income statement. An impairment loss recognised for goodwill will not be reversed under any circum-stances. Qt Group is the cash generating unit to which the entire tested asset is allocated in the testing.
The tables below show the distribution of goodwill and values subject to testing at the end of the reporting period.
Notes to the Consolidated Financial Statements
Qt Group 2017 / Board of Directors’ Report / Consolidated Key Figures / Financial Statements / CG / Information for Shareholders
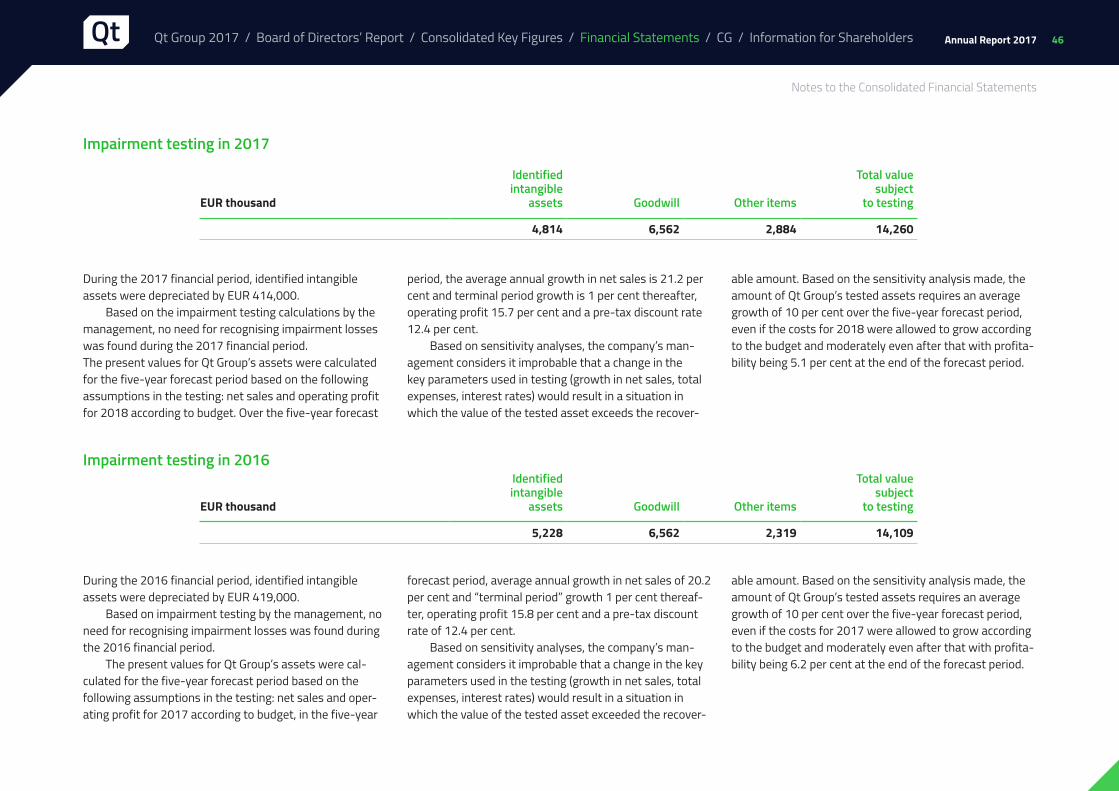
46Annual Report 2017
EUR thousand
Identified intangible
assets Goodwill Other items
Total value subject
to testing
4,814 6,562 2,884 14,260
EUR thousand
Identified intangible
assets Goodwill Other items
Total value subject
to testing
5,228 6,562 2,319 14,109
Impairment testing in 2017
Impairment testing in 2016
During the 2017 financial period, identified intangible assets were depreciated by EUR 414,000.
Based on the impairment testing calculations by the management, no need for recognising impairment losses was found during the 2017 financial period. The present values for Qt Group’s assets were calculated for the five-year forecast period based on the following assumptions in the testing: net sales and operating profit for 2018 according to budget. Over the five-year forecast
period, the average annual growth in net sales is 21.2 per cent and terminal period growth is 1 per cent thereafter, operating profit 15.7 per cent and a pre-tax discount rate 12.4 per cent.
Based on sensitivity analyses, the company’s man-agement considers it improbable that a change in the key parameters used in testing (growth in net sales, total expenses, interest rates) would result in a situation in which the value of the tested asset exceeds the recover-
able amount. Based on the sensitivity analysis made, the amount of Qt Group’s tested assets requires an average growth of 10 per cent over the five-year forecast period, even if the costs for 2018 were allowed to grow according to the budget and moderately even after that with profita-bility being 5.1 per cent at the end of the forecast period.
During the 2016 financial period, identified intangible assets were depreciated by EUR 419,000.
Based on impairment testing by the management, no need for recognising impairment losses was found during the 2016 financial period.
The present values for Qt Group’s assets were cal-culated for the five-year forecast period based on the following assumptions in the testing: net sales and oper-ating profit for 2017 according to budget, in the five-year
forecast period, average annual growth in net sales of 20.2 per cent and “terminal period” growth 1 per cent thereaf-ter, operating profit 15.8 per cent and a pre-tax discount rate of 12.4 per cent.
Based on sensitivity analyses, the company’s man-agement considers it improbable that a change in the key parameters used in the testing (growth in net sales, total expenses, interest rates) would result in a situation in which the value of the tested asset exceeded the recover-
able amount. Based on the sensitivity analysis made, the amount of Qt Group’s tested assets requires an average growth of 10 per cent over the five-year forecast period, even if the costs for 2017 were allowed to grow according to the budget and moderately even after that with profita-bility being 6.2 per cent at the end of the forecast period.
Notes to the Consolidated Financial Statements
Qt Group 2017 / Board of Directors’ Report / Consolidated Key Figures / Financial Statements / CG / Information for Shareholders

47Annual Report 2017
13. TANGIBLE ASSETS
Tangible assets:
Property, plant and equipment (PPE) are carried at cost less accumulated planned depreciation and impairment. Assets are depreciated over their esti-mated useful lives. The estimated useful lives are as follows:
Machinery and equipment 3–8 years
The useful life and depreciation method of assets is reviewed at least at each balance sheet date and, if necessary, adjusted to reflect any changes in the expected economic value.
Property, plant and equipment is derecognised when it is disposed of or no future economic benefit is expected from its use or disposal. Capital gains and losses on elimination and the transfer of tangible assets are recognised through profit or loss and included either in other operating income or expen-ses for the period in which they emerge. .
EUR thousand
Machinery and equipment
2017
Machinery and equipment
2016
Acquisition cost, 1 January 1,573 1,089
Translation differences and other adjustments -5 39
Increases 909 447
Disposals -2
Acquisition cost, 31 December 2,477 1,573
Accumulated depreciation and impairment, 1 January -1,005 -673
Translation differences and other adjustments 9 -14
Depreciation for the period -398 -318
Accumulated depreciation and impairment, 31 December -1,394 -1,005
Book value, 1 January 568 416
Book value, 31 December 1,083 568
EUR thousand
Machinery and equipment
2017
Machinery and equipment
2016
Acquisition cost and increases 1 394 724
Accumulated depreciation -735 -520
Book value, 31 December 659 204
Property, plant and equipment include assets leased under finance lease as follows:
Notes to the Consolidated Financial Statements
Qt Group 2017 / Board of Directors’ Report / Consolidated Key Figures / Financial Statements / CG / Information for Shareholders

48Annual Report 2017
EUR thousand 1.1.2017Recognised in the income statement 31.12.2017
Deferred tax assets:
Confirmed losses 843 1,140 1,983
Other items 72 -6 66
Total 915 1,134 2,049
Deferred tax liabilities:
From allocation of the fair values of acquisitions 253 58 311
Other items 40 -34 6
Total 293 24 317
EUR thousand 1.1.2016Recognised in the income statement 31.12.2016
Deferred tax assets:
Confirmed losses 0 843 843
Other items 24 48 72
Total 24 891 915
Deferred tax liabilities:
Allocation of the fair values of acquisitions 195 58 253
Other items 0 40 40
Total 195 98 293
Changes in deferred tax during 2017:
Changes in deferred tax during 2016:
14. DEFERRED TAX ASSETS AND LIABILITIES
The accounting principles relating to income taxes are presented in Note 10 Income taxes.
Deferred tax asset has been booked on confirmed losses to the extent where it is probable that there will be taxable income in the future against which confirmed losses can be applied. The deferred tax assets booked on confirmed losses on December 31, 2017 were EUR 1,983 thousand (843), and they were related to confirmed losses that will expire in 2027–2028.
Notes to the Consolidated Financial Statements
Qt Group 2017 / Board of Directors’ Report / Consolidated Key Figures / Financial Statements / CG / Information for Shareholders

49Annual Report 2017
15. TRADE AND OTHER RECEIVABLES
EUR thousand 2017 2016
Trade receivables 7,829 7,741
Lease security deposits 189 108
Accrued income 1,605 1,043
VAT receivable 726 145
Other receivables 596 545
Total 10,947 9,582
EUR thousand 2017 2016
Undue trade receivables 5,174 4,247
Trade receivables 1–30 days overdue 1,130 1,265
Trade receivables 31–60 days overdue 839 416
Trade receivables over 60 days overdue 687 1,813
Total 7,829 7,741
The Group has recognised a credit loss provision of EUR 305,000 in trade receivables in the 2017 financial statements (2016: EUR 186,000). The carrying amount of the trade receivables is a moderate estimate of their fair value.
Notes to the Consolidated Financial Statements
Qt Group 2017 / Board of Directors’ Report / Consolidated Key Figures / Financial Statements / CG / Information for Shareholders
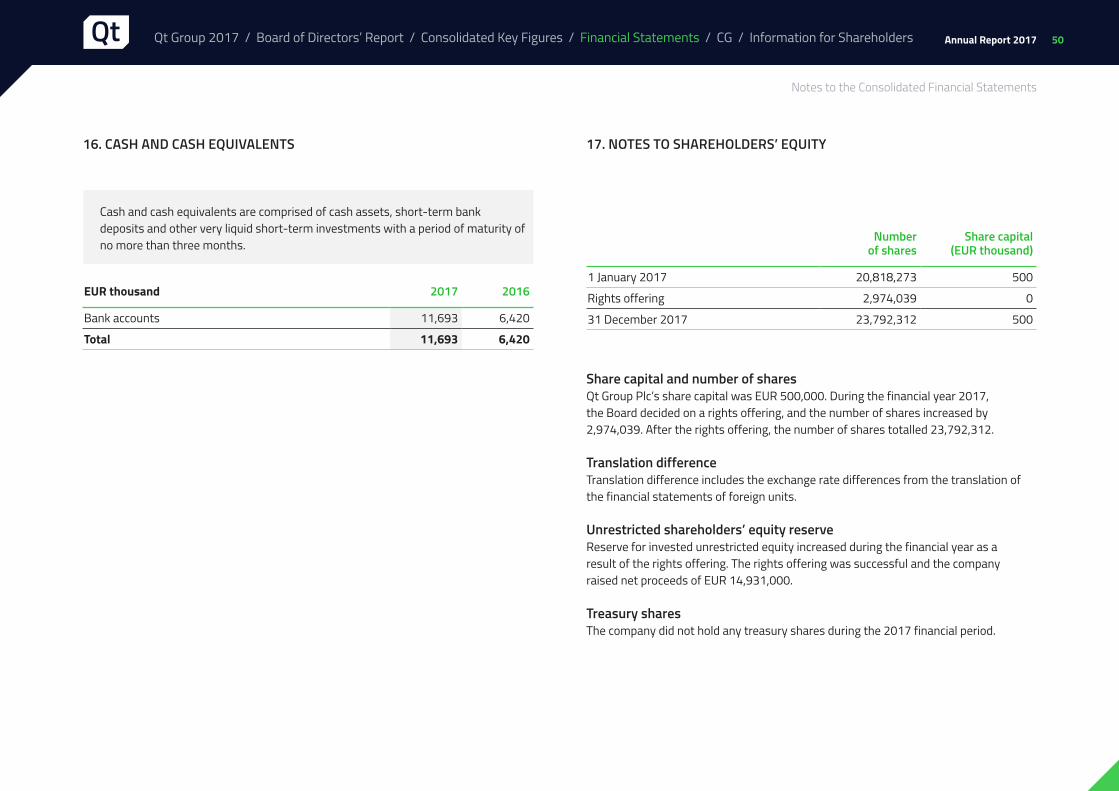
50Annual Report 2017
16. CASH AND CASH EQUIVALENTS 17. NOTES TO SHAREHOLDERS’ EQUITY
EUR thousand 2017 2016
Bank accounts 11,693 6,420
Total 11,693 6,420
Number of shares
Share capital (EUR thousand)
1 January 2017 20,818,273 500
Rights offering 2,974,039 0
31 December 2017 23,792,312 500
Cash and cash equivalents are comprised of cash assets, short-term bank deposits and other very liquid short-term investments with a period of maturity of no more than three months.
Share capital and number of sharesQt Group Plc’s share capital was EUR 500,000. During the financial year 2017, the Board decided on a rights offering, and the number of shares increased by 2,974,039. After the rights offering, the number of shares totalled 23,792,312.
Translation differenceTranslation difference includes the exchange rate differences from the translation of the financial statements of foreign units.
Unrestricted shareholders’ equity reserveReserve for invested unrestricted equity increased during the financial year as a result of the rights offering. The rights offering was successful and the company raised net proceeds of EUR 14,931,000.
Treasury sharesThe company did not hold any treasury shares during the 2017 financial period.
Notes to the Consolidated Financial Statements
Qt Group 2017 / Board of Directors’ Report / Consolidated Key Figures / Financial Statements / CG / Information for Shareholders

51Annual Report 2017
18. SHARE-BASED PAYMENTS
Option programme 2016–2019The Board of Directors of Qt Group Plc decided on 22 June 2016 to issue stock options to the key persons of the company or its Group companies. There are particularly weighty economic reasons for the Company to issue stock option rights, as the stock option rights are intended to be part of the Company’s long-term incentive and com-mitment scheme for key personnel. The maximum total number of stock options issued is 2,000,000, and they entitle their holders to subscribe for a maximum total of 2,000,000 new shares in the company. Each stock option entitles its holder to subscribe for one (1) new share in the company or an existing share held by the company. The
share subscription price shall be credited to the company’s reserve for invested unrestricted equity.
The share subscription period for the stock options shall be 19 December 2019–31 December 2022. A pre-condition for the share subscription is that the value of the company’s share based on the trade volume weighted average quotation on the NASDAQ OMX Helsinki Ltd is at least five euros and eighty-five cents (EUR 5.85) between 18 November 2019 and 13 December 2019.
The share subscription price for the stock options shall be the trade volume weighted average quotation of the company’s share between 1 June 2016 and 30 June
Option programme 2016–2019
Grant date 22 June 2016
Nature of the scheme Stock options
Target group Key personnel
Share-based remuneration, maximum number of shares 2,000,000
Subscription period 19 January 2019–31 December 2022
Vesting conditions Development of Qt Group Plc’s share price
Execution As shares
Persons (31 December 2017) 17
The Group has a share-based incentive scheme where payments are made in equity instruments. The stock option programme is a market-based incentive scheme pursuant to IFRS 2. The benefits granted through the scheme are measured at fair value on the date of their being granted and recog-nised as expenses evenly during the vesting period. The impact of these arrangements on the financial results is shown under personnel expenses with retained earnings as the counter-item.
The expense determined at the time of granting stock options is based on the Group’s estimate of the number of stock options assumed to be earned at the end of the vesting period. The Group updates the estimate of the final number of stock options on the closing date of each reporting period.
2016 and the share subscription price shall, nevertheless, always amount to at least the highest share price quoted on the closing day 22 June 2016 when the stock options have been issued and assigned to the key persons added with one euro cent (EUR 0.01). The share subscription price for the stock options may decline in certain special situations.
Notes to the Consolidated Financial Statements
Qt Group 2017 / Board of Directors’ Report / Consolidated Key Figures / Financial Statements / CG / Information for Shareholders

52Annual Report 2017
Share-based incentive scheme 2015–2018
Grant date 12 March 2015
Nature of the incentive scheme Shares and cash
Target group President and CEO
Share-based remuneration, maximum number of shares 985,000
Earning period begins, date 12 March 2015
Earning period ends, date 12 March 2018
Vesting conditions Development of Digia Plc’s share price
Execution Shares and cash
Share-based incentive scheme 2015–2018 (ended in 2016)The Board of Directors of Digia Plc decided on 12 March 2015 on establishing new share-based incentive schemes for the company’s President and CEO and other members of senior management. Based on the decision, there are separate schemes for Digia’s domestic business opera-tions and the Qt business.
The Qt scheme included one earning period ranging until March 2018. The reward pursuant to the scheme was tied to the development of Digia Plc’s share price by the end of said earning period. If the price of the share reaches the targets set in the scheme in full, the company’s President and other key personnel of the Qt business covered by the scheme will have the right to a reward amounting to a maximum of 985,000 Digia Plc shares at the end of the earning period. The rewards pursuant to the scheme will be paid as a combination of shares and cash so that the
cash amount will cover the taxes and other statutory fees resulting from the reward, and the rest of the reward will be paid to the recipient as shares. The Qt scheme addition-ally included a special condition under which the scheme will expire in case of a demerger of Digia and Qt. Thus, a reward was granted to the persons covered by the scheme based on the share price at the time of the demerger during 2016.
Effect of share-based incentive schemes on the net profit
EUR thousand 2017 2016
Option programme 2016–2019 422 211
Share-based incentive scheme 2015–2018 0 919
Total 422 1,130
Notes to the Consolidated Financial Statements
Qt Group 2017 / Board of Directors’ Report / Consolidated Key Figures / Financial Statements / CG / Information for Shareholders

53Annual Report 2017
19. SHORT-TERM LIABILITIES
EUR thousand 2017 2016
Bank loans 0 6,000
Finance lease liabilities 287 152
Accounts payable 1,375 774
Advances received 9,058 8,324
Accrued charges and deferred credits 3,886 4,410
Other liabilities 1,102 709
Total 15,707 20,369
The carrying amount of accounts payable is a moderate estimate of their fair value. The terms of payment of the Group’s accounts payable comply with the ordinary terms of payment of companies.
Accrued charges and deferred credits are primary comprised of allocations of wages and salaries and personnel expenses.
Besides the aforementioned, EUR 753 thousand of the advances received have been presented in Other long-term liabilities due to their maturity.
Notes to the Consolidated Financial Statements
Qt Group 2017 / Board of Directors’ Report / Consolidated Key Figures / Financial Statements / CG / Information for Shareholders

54Annual Report 2017
20. FINANCIAL LIABILITIES AND FINANCIAL RISK MANAGEMENT
Financial liabilities are initially measured at fair value. Financial liabilities are subsequently measured at cost allocated using the effec-tive rate method. Financial liabilities are included in long- and short-term liabilities. Financial liabilities are categorised as long-term liabilities when they mature in more than 12 months. Liabilities maturing in less than 12 months are categorised as short-term.
2017 2016 Fair valueEUR thousand Asset values Fair values Asset values Fair values hierarchy
Long-term
Finance lease liabilities 399 399 55 55 2
Total 399 399 55 55
Short-term
Bank loans - - 6,000 6,200 2
Finance lease liabilities 287 287 152 152 2
Total 287 287 6,152 6,352
Financial liabilities
All of the financial liabilities are denominated in euros.
Fair value hierarchyFinancial instruments measured at fair value are classified according to the following fair value hierarchy: instruments measured using quoted prices in active markets (level 1), instruments measured using inputs other than quoted prices included in level 1 observable either directly or indirectly (level 2), and instruments measured using inputs that are not based on observable market data (level 3).
Notes to the Consolidated Financial Statements
Qt Group 2017 / Board of Directors’ Report / Consolidated Key Figures / Financial Statements / CG / Information for Shareholders

55Annual Report 2017
EUR thousand 2018 2019 2020 Total
Finance lease liabilities 287 250 148 686
Total 287 250 148 686
EUR thousand 2017 2018 2019 Total
Bank loans 6,000 6,000
Finance lease liabilities 152 44 11 207
Total 6,152 44 11 6,207
Maturity of liabilities
2017
2016
Notes to the Consolidated Financial Statements
Qt Group 2017 / Board of Directors’ Report / Consolidated Key Figures / Financial Statements / CG / Information for Shareholders

56Annual Report 2017
Financial risk management The Group is exposed to certain financial risks during the normal course of its business. The Group’s management regularly monitors the financial risks associated with busi-ness operations. The objective of the Group’s risk man-agement is to minimise the adverse effects of the finan-cial risks on the Group's earnings and balance sheet. The financial risks are mainly comprised of the credit risk and liquidity risk related to counterparties and fluctuation of market interest rates and exchange rates. The Group does not apply hedge accounting pursuant to IAS 39, and the Group has not held any derivative instruments during the financial period or the previous financial period.
Credit risk:Credit risk management and credit control are coordinated by the Group’s financial function, which acts in coopera-tion with the business units. The Group’s policy defines creditworthiness requirements for customers in order to minimise the amount of credit losses. A credit loss is rec-ognised for trade receivables when there is objective evi-dence that the receivables will not be received in full under the original terms and conditions. A sufficient provision was made for uncertain accounts receivable at the end of the fiscal period. The maturity breakdown of trade receiva-bles is presented in Note 15 Trade and other receivables.
Foreign exchange rate risk:The existing foreign exchange rate risk is comprised of currency-denominated commercial transactions, monetary items on the balance sheet and net investments in foreign subsidiaries. Of the Group’s cash flows, the biggest cur-rency exposures arise from EUR and USD. The Group has both income and expenses in both main currencies, which significantly limits the foreign exchange risk. The company monitors the development of currency exposure as its operations expand and as non-USD-denominated cur-rency items increase, which might lead to the adoption of an active hedging policy in the company. At the end of the financial year, the company had no existing hedging instru-ments and the Group does not apply hedge accounting.
Liquidity risk: Liquidity risk is associated with the sufficiency of financ-ing required by the Group’s working capital, repayment of loans, investment expenses and growth, and maintaining its continuity. The purpose of liquidity risk management is to continuously maintain a sufficient level of liquidity. To manage the risk, the Group continuously assesses the amount of financing required by business operations so that the Group has sufficient liquid assets for financing its operations and repaying maturing loans.
Interest rate risk:The Group does not have significant interest-bearing liabilities.
Notes to the Consolidated Financial Statements
Qt Group 2017 / Board of Directors’ Report / Consolidated Key Figures / Financial Statements / CG / Information for Shareholders

57Annual Report 2017
21. THE GROUP’S CONTINGENT LIABILITIES
Contingent liabilities
EUR thousand 2017 2016
Pledges given on own behalf
Corporate mortgage 0 7,800
Guarantees 492 442
Total 492 8,242
Pledges given on behalf of subsidiaries and other Group companies
Guarantees 48 48
Total 48 48
Other leases
Lease liabilities maturing within one year 1,505 1,315
Lease liabilities maturing within one to five years 1,470 1,469
Total 2,975 2,784
Pledges, mortgages and contingent liabilities total 3,515 11,074
Notes to the Consolidated Financial Statements
Qt Group 2017 / Board of Directors’ Report / Consolidated Key Figures / Financial Statements / CG / Information for Shareholders

58Annual Report 2017
22. TRANSACTIONS WITH RELATED PARTIES
The Group’s related parties include the parent company and its subsidiaries. In addi-tion, related parties are considered to include the members of the parent company’s Board of Directors and the Group Management Team, including the President and CEO and persons and companies in which the management or Board of Directors exercise control or significant influence.
The Group’s parent company and subsidiary relationships are as follows
Group companies 31 December 2017
NameGroup’sholding Domicile Country
Qt Group Oyj Parent company Espoo Finland
The Qt Company Oy 100% Espoo Finland
The Qt Company 100% San Jose United States
The Qt Company AS 100% Oslo Norway
The Qt Company GmbH 100% Berlin Germany
OOO The Qt Company 100% St. Petersburg Russia
The Qt Company LLC 100% Seoul South Korea
The Qt Company Ltd 100% Shanghai China
Digia Software Ltd 100% Chengdu China
Digia Hong Kong Ltd* 100% Hong Kong China
The Qt Company Japan** 100% Tokyo Japan
* the company did not engage in business operations ** A branch of The Qt Company Oy in Japan
The Group was established by a partial demerger registered on 1 May 2016. Hence, comparison data is limited to an 8-month period.
Salaries and fees of the Board of Directors and President and CEO
Management’s employee benefits
EUR thousand1.1.–31.12.
20171.5.–31.12.
2016
Varelius Juha President and CEO 579 1,393
Ingman Robert Chairman of the Board of Directors 73 57
Uhari TommiVice Chairman of the Board of Directors 52 38
Rossi Matti Member of the Board of Directors 36 29
Saarinen Leena Member of the Board of Directors 38 27
Öistämö Kai Member of the Board of Directors 36 27
Total 813 1,570
EUR thousand 2017 2016
Salaries and other short-term employee benefits 1,356 1,635
Share-based incentive schemes 422 1,130
Total 1,779 2,765
23. EVENTS AFTER THE CLOSING DATE OF THE REPORTING PERIOD
There have been no major events to report after the period.
Notes to the Consolidated Financial Statements
Qt Group 2017 / Board of Directors’ Report / Consolidated Key Figures / Financial Statements / CG / Information for Shareholders

59Annual Report 2017
Parent company’s income statement FAS
EUR Notes 2017 2016
Net sales 1,169,692.97 0.00
Personnel expenses 1 -654,238.85 -1,442,815.66
Depreciation and amortisation 2 -82,768.11 -117,155.43
Other operating expenses 3 -1,001,148.97 -725,721.69
Operating profit -568,462.96 -2,285,692.78
Financial expenses 4 -204,335.20 -502,653.21
Earnings before tax -772,798.16 -2,788,345.99
Income taxes 0.00 0.00
Net profit -772,798.16 -2,788,345.99
Qt Group 2017 / Board of Directors’ Report / Consolidated Key Figures / Financial Statements / CG / Information for Shareholders

60Annual Report 2017
EUR Notes 31.12.2017 31.12.2016
Non-current assets
Intangible assets
Intangible rights 5 0.00 82,768.24
Total 0.00 82,768.24
Investments
Holdings in group companies 6 10,256,928.24 10,256,928.24
Long-term receivables from group companies 6 2,000,000.00 2,000,000.00
Total 12,256,928.24 12,256,928.24
Non-current assets total 12,256,928.24 12,339,696.48
Current assets
Accounts receivable from group companies 1,450,419.28 0.00
Current receivables from group companies 5,150,000.00 0.00
Other receivables 40,953.97 19,281.03
Cash in hand and at banks 2,720,472.91 337,386.82
Total 9,361,846.16 356,667.85
Total assets 21,618,774.40 12,696,364.33
Parent company’s balance sheet (FAS)
EUR Notes 31.12.2017 31.12.2016
Shareholders’ equity
Share capital 7 500,000.00 500,000.00
Unrestricted shareholders’ equity reserve 7 24,036,509.55 8,720,208.70
Retained earnings -2,788,345.99 0.00
Net profit 7 -772,798.16 -2,788,345.99
Total 20,975,365.40 6,431,862.71
Short-term liabilities
Loans from financial institutions 8 0.00 6,000,000.00
Accounts payable 44,983.15 42,491.19
Other liabilities 173,081.78 26,266.93
Accrued charges and deferred credits 9 425,344.07 195,743.50
Total 643,409.00 6,264,501.62
Total shareholders’ equity and liabilities 21,618,774.40 12,696,364.33
Qt Group 2017 / Board of Directors’ Report / Consolidated Key Figures / Financial Statements / CG / Information for Shareholders

61Annual Report 2017
EUR 2017 2016
Net profit before tax -772,798.16 -2,788,345.99
Adjustments to net profit 287,103.44 619,502.65
Change in working capital -1,093,184.84 112,577.38
Interest paid -204,335.20 -502,347.22Cash flow from financial items and taxes -204,335.20 -502,347.22
Cash flow from operations -1,783,214.76 -2,558,613.18
Loans granted -5,150,000.00 -2,000,000.00Cash flow from investments -5,150,000.00 -2,000,000.00
Repayments of current loans -6,000,000.00 -1,104,000.00Withdrawals of non-current loans 6,000,000.00Repayments of current loans 0.00Rights offering 15,316,300.85 0.00Cash flow from financing 9,316,300.85 4,896,000.00
Change in cash and cash equivalents 2,383,086.09 337,386.82
Cash and cash equivalents at beginning of period 337,386.82 0.00Cash and cash equivalents at end of period 2,720,472.91 337,386.82
Parent company’s cash flow statement FAS
Qt Group 2017 / Board of Directors’ Report / Consolidated Key Figures / Financial Statements / CG / Information for Shareholders
62Annual Report 2017
Basic information on the parent company and accounting policies applied in the financial statements Basic information on the company
Qt Group Plc is the parent company of Qt Group, and its domicile is Espoo and its registered address is Bertel Jungin aukio D3A, FI-02600 Espoo, Finland. Qt Group Plc’s subsidiary responsible for its operations in Finland is The Qt Company Oy. Qt Group Plc was formed as a result of the partial demerger of Digia Plc, which took effect on 1 May 2016, so the comparison data is only for the period of eight months.
Accounting policies applied in the financial statements The parent company’s financial statements have been prepared in accordance with the Finnish Accounting Standards (FAS). The financial statements are based on original acquisition costs. Acquisition cost-based accounting is discounted to correspond to the fair value, if necessary. Pension arrangements The pension cover of the company’s personnel is provided through statutory pension insurance. Pension contributions and expenses allocated to the financial period are based on confirmation received from the insurance company. Pension expenses are recognised as expenses for the year during which they are incurred.
TaxesTaxes recognised in the income statement include taxes based on the net profit for the financial period, and adjustments to taxes for previous periods.
Tangible and intangible assets Tangible and intangible assets are recognised in the balance sheet at direct acquisition cost less planned dep-reciation. Planned depreciation is based on the following useful lives:
Intangible assets 3–5 years
Acquisitions of fixed assets with a useful life of less than three years are recognised as annual expenses.
Cash and cash equivalents andloans from financial institutionsCash and cash equivalents include cash assets and bank accounts. Overdraft facilities of accounts are presented in current liabilities on the balance sheet. Loans from financial institutions are included in long- and short-term liabilities on the balance sheet. Interest expenses are recognised as expenses for the period during which they are incurred.
Shareholders’ equity and dividendsThe Board of Directors’ proposal for dividend payout is not recognised in the distributable shareholders’ equity in the financial statements before the approval of the Annual General Meeting.
Qt Group 2017 / Board of Directors’ Report / Consolidated Key Figures / Financial Statements / CG / Information for Shareholders

63Annual Report 2017
Notes to the parent company financial statements FAS
1. Information on personnel and related parties 3. Other operating expenses
4. Financial income and expenses
2. Depreciation and amortisation
EUR 2017 2016
Wages and salaries 586,000.58 1,381,597.11
Pension expenses 62,766.21 50,705.81
Other personnel expenses 5,472.06 10,512.74
Total 654,238.85 1,442,815.66
EUR 2017 2016
IT expenses 227,253.61 310,758.99
Expert services 555,221.92 262,594.59
Other expenses 218,673.44 152,368.11
Total 1,001,148.97 725,721.69
Auditors’ fees
Audit 14,000.00 13,181.65
Other services 17,515.00
Total 31,515.00 13,181.65
EUR 2017 2016
Interest expenses for loans from financial institutions 204,335.20 502,653.21
Total 204,335.20 502,653.21
EUR 2017 2016
Planned depreciation
Intangible assets 82,768.11 117,155.43
Total 82,768.11 117,155.43
The company’s personnel expenses are comprised of the salaries and fees paid to the President and CEO and the Board of Directors. More detailed information about the related parties is presented in Note 22 Transactions with related parties to the consolidated financial statements.
The company’s auditor for 2016 and 2017 was KPMG Oy Ab.
Resulting from the repayment of loans granted by financial institutions, interest expenses decreased year-on-year.
Qt Group 2017 / Board of Directors’ Report / Consolidated Key Figures / Financial Statements / CG / Information for Shareholders

64Annual Report 2017
5. Intangible assets
EUR
Intangiblerights2017
Acquisition cost, 1 January 527,199.54
Increases 0.00
Acquisition cost, 31 December 527,199.54
Accumulated depreciation and impairment, 1 January -444,431.43
Accumulated depreciation and amortisation transferred in connection with the demerger 0.00
Depreciation and amortisation -82,768.11
Accumulated depreciation and impairment, 31 December -527,199.54
Book value, 1 January 82,768.11
Book value, 31 December 0.00
EUR
Intangiblerights2016
Acquisition cost, 1 May 0.00
Assets transferred in connection with the demerger 527,199.54
Acquisition cost, 31 December 527,199.54
Accumulated depreciation and impairment, 1 May 0.00
Accumulated depreciation and amortisation transferred in connection with the demerger -327,276.01
Depreciation and amortisation -117,155.42
Accumulated depreciation and impairment, 31 December -444,431.43
Book value, 1 May 0.00
Book value, 31 December 82,768.11
Intangible assets are primarily comprised of IT software received in connection with the demerger.
Qt Group 2017 / Board of Directors’ Report / Consolidated Key Figures / Financial Statements / CG / Information for Shareholders

65Annual Report 2017
6. Investments
Holdings in group companies
EUR 2017
Acquisition cost, 1 January 10,256,928.20
Acquisition cost, 31 December 10,256,928.24
Book value, 1 January 10,256,928.20
Book value, 31 December 10,256,928.20
EUR 2016
Acquisition cost, 1 May -
Assets transferred in connection with the demerger 10,256,928.24
Acquisition cost, 31 December 10,256,928.24
Book value, 1 May -
Book value, 31 December 10,256,928.24
Itemisation of shares
Group companies Domicile Country HoldingShare of
votes
Digia Hong Kong Ltd Hong Kong China 100% 100%
The Qt Company Oy Espoo Finland 100% 100%
Long-term receivables from group companies
EUR 2017 2016
Long-term loan receivables 2,000,000.00 2,000,000.00
Total 2,000,000.00 2,000,000.00
Qt Group 2017 / Board of Directors’ Report / Consolidated Key Figures / Financial Statements / CG / Information for Shareholders

66Annual Report 2017
7. Changes in shareholders’ equity
EUR 2017 2016
Share capital, 1 January 500,000.00 -
Share capital formed in connection with the demerger (1 May 2016) 500,000.00
Share capital, 31 December 500,000.00 500,000.00
Unrestricted shareholders’ equity reserve, 1 January 8,720,208.70 -
Reserve for invested unrestricted equity formed in connection with the demerger (1 May 2016) 0.00 8,720,208.70
Rights offering 15,316,300.85 0.00
Unrestricted shareholders’ equity reserve, 31 December 24,036,509.55 8,720,208.70
Retained earnings -2,788,345.99 0.00
Net profit (loss) -772,798.16 -2,788,345.99
Total shareholders’ equity 20,975,365.40 6,431,862.71
Calculation of distributable funds
Unrestricted shareholders’ equity reserve 24,036,509.55 8,720,208.70
Retained earnings -2,788,345.99 0.00
Net profit (loss) -772,798.16 -2,788,345.99
Total distributable funds 20,475,365.40 5,931,862.71
Qt Group 2017 / Board of Directors’ Report / Consolidated Key Figures / Financial Statements / CG / Information for Shareholders
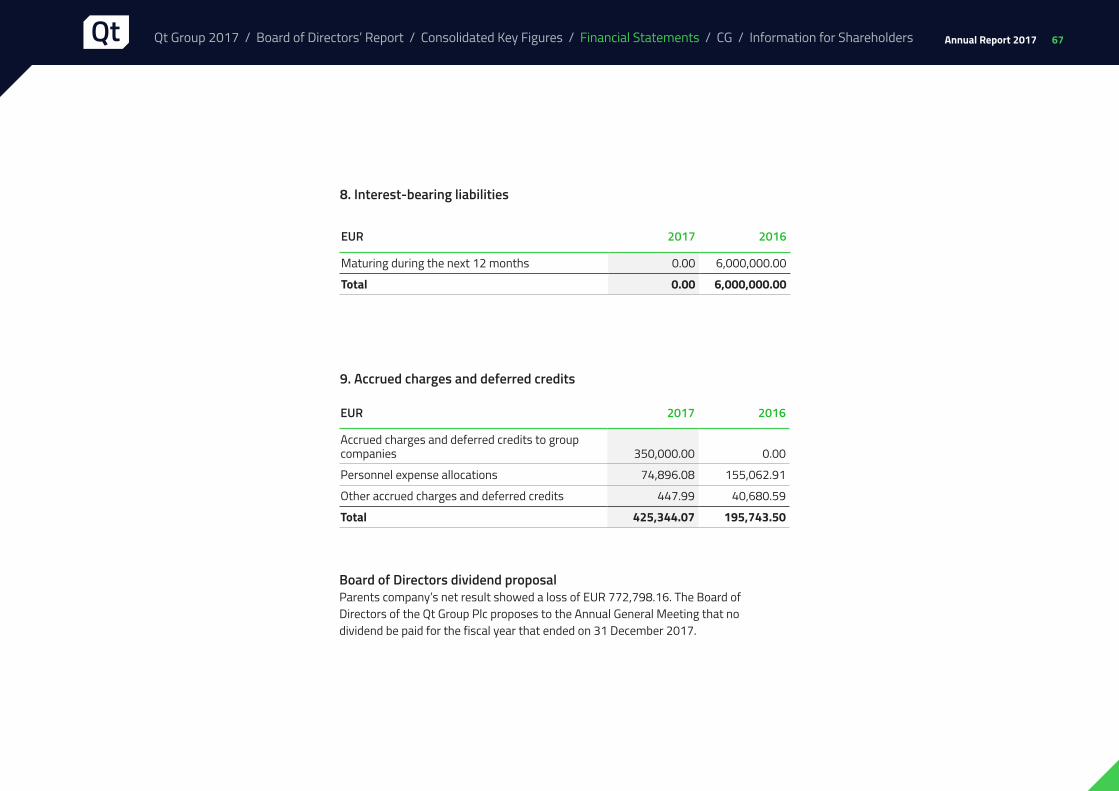
67Annual Report 2017
9. Accrued charges and deferred credits
EUR 2017 2016
Maturing during the next 12 months 0.00 6,000,000.00
Total 0.00 6,000,000.00
EUR 2017 2016
Accrued charges and deferred credits to group companies 350,000.00 0.00
Personnel expense allocations 74,896.08 155,062.91
Other accrued charges and deferred credits 447.99 40,680.59
Total 425,344.07 195,743.50
Board of Directors dividend proposal Parents company’s net result showed a loss of EUR 772,798.16. The Board of Directors of the Qt Group Plc proposes to the Annual General Meeting that no dividend be paid for the fiscal year that ended on 31 December 2017.
8. Interest-bearing liabilities
Qt Group 2017 / Board of Directors’ Report / Consolidated Key Figures / Financial Statements / CG / Information for Shareholders

68Annual Report 2017
Signatures to the Financial Statements and the Board of Directors’ Report
Espoo, 15 February 2018
Robert IngmanChairman of the Board of Directors
Matti RossiMember of the Board of Directors
Tommi UhariVice Chairman of the Board of Directors
Leena SaarinenMember of the Board of Directors
Kai ÖistämöMember of the Board of Directors
Juha VareliusPresident and CEO
Auditors’ noteThe report of the audit has been issued today. Espoo, 15 February 2018
KPMG Oy AbAuthorised Public Accountants Kim Järvi, Authorised Public Accountant
Qt Group 2017 / Board of Directors’ Report / Consolidated Key Figures / Financial Statements / CG / Information for Shareholders

69Annual Report 2017
Auditor’s Report
To the Annual General Meeting of Qt Group Plc
Report on the Audit of the Financial Statements
OpinionWe have audited the financial statements of Qt Group Plc (business identity code 2733394-8) for the year ended December 31, 2017. The financial statements comprise the consolidated balance sheet, income statement, state-ment of comprehensive income, statement of changes in equity, statement of cash flows and notes, including a summary of significant accounting policies, as well as the parent company’s balance sheet, income statement, statement of cash flows and notes.
In our opinion• the consolidated financial statements give a true and fair
view of the group’s financial position, financial perfor-mance and cash flows in accordance with International Financial Reporting Standards (IFRS) as adopted by the EU
• the financial statements give a true and fair view of the parent company’s financial performance and financial position in accordance with the laws and regulations governing the preparation of financial statements in Fin-land and comply with statutory requirements.
Our opinion is consistent with the additional report sub-mitted to the Audit Committee.
Basis for OpinionWe conducted our audit in accordance with good auditing practice in Finland. Our responsibilities under good audit-ing practice are further described in the Auditor’s Responsi-bilities for the Audit of the Financial Statements section of our report.
We are independent of the parent company and of the group companies in accordance with the ethical require-ments that are applicable in Finland and are relevant to our audit, and we have fulfilled our other ethical responsibili-ties in accordance with these requirements.
In our best knowledge and understanding, the non-audit services that we have provided to the parent company and group companies are in compliance with laws and regulations applicable in Finland regarding these services, and we have not provided any prohibited non-au-dit services referred to in Article 5(1) of regulation (EU) 537/2014. The non-audit services that we have provided have been disclosed in Note 8 to the consolidated financial statements.
We believe that the audit evidence we have obtained is sufficient and appropriate to provide a basis for our opinion.
MaterialityThe scope of our audit was influenced by our application of materiality. The materiality is determined based on
our professional judgement and is used to determine the nature, timing and extent of our audit procedures and to evaluate the effect of identified misstatements on the financial statements as a whole. The level of materiality we set is based on our assessment of the magnitude of misstatements that, individually or in aggregate, could reasonably be expected to have influence on the economic decisions of the users of the financial statements. We have also taken into account misstatements and/or possible misstatements that in our opinion are material for qualita-tive reasons for the users of the financial statements.
Key Audit MattersKey audit matters are those matters that, in our profes-sional judgment, were of most significance in our audit of the financial statements of the current period. These matters were addressed in the context of our audit of the financial statements as a whole, and in forming our opin-ion thereon, and we do not provide a separate opinion on these matters. The significant risks of material misstate-ment referred to in the EU Regulation No 537/2014 point (c) of Article 10(2) are included in the description of key audit matters below.
We have also addressed the risk of management override of internal controls. This includes consideration of whether there was evidence of management bias that rep-resented a risk of material misstatement due to fraud.
Qt Group 2017 / Board of Directors’ Report / Consolidated Key Figures / Financial Statements / CG / Information for Shareholders

70Annual Report 2017
The key audit matterHow the matter wasaddressed in the audit
Valuation of Goodwill – refer to Accounting Principles and Note 12 in the Consolidated Financial Statements
Revenue Recognition and Valuation of Accounts Receivable – Refer to Accounting Principles and Notes 2 and 15 in the Consolidated Financial Statements
• Goodwill of EUR 6.6 million relates to the acquisition of the Qt business.
• Irrespective of whether there is any indication of impair-ment, the goodwill acquired in a business combination is required to be tested for impairment annually. An impair-ment arises when the recoverable amount is less than the carrying value of the investment
• The assumptions to support goodwill values (e.g. dis-count rate, profitability and growth rates) are judgmen-tal.
• Revenue recognition is one of the key areas of focus, in respect of risk of management override and timing of revenue for license, maintenance and consulting income.
• Accounts receivable includes management estimate relating to valuation of overdue accounts receivable.
• We have tested controls over revenue recognition, inclu-ding timing of revenue recognition, as well as performed substantive testing.
• We have assessed the recoverability of overdue accounts receivable and the related evidence as well as challenged the management’s assessment of the bad debt provi-sion.
• We have assessed the assumptions used in respect of discount rate, profitability as well as forecast growth rates and involved valuation experts to assess the appropriateness of the discount rates used which include comparison to economic and industry forecasts where appropriate as well as perform audit procedures on tech-nical appropriateness of the calculations.
• We have applied professional judgment when evaluating the forecasts by testing key assumptions, assessing the impact of the sensitivity analysis as well as reconciling those to the forecasts approved by the Board of Direc-tors.
• In addition, we have assessed the adequacy and appro-priateness of the notes in the financial statements on goodwill and impairment testing.
Qt Group 2017 / Board of Directors’ Report / Consolidated Key Figures / Financial Statements / CG / Information for Shareholders

71Annual Report 2017
Responsibilities of the Board of Directors and the Managing Director for the Financial Statements The Board of Directors and the Managing Director are responsible for the preparation of consolidated financial statements that give a true and fair view in accordance with International Financial Reporting Standards (IFRS) as adopted by the EU, and of financial statements that give a true and fair view in accordance with the laws and regu-lations governing the preparation of financial statements in Finland and comply with statutory requirements. The Board of Directors and the Managing Director are also responsible for such internal control as they determine is necessary to enable the preparation of financial state-ments that are free from material misstatement, whether due to fraud or error.
In preparing the financial statements, the Board of Directors and the Managing Director are responsible for assessing the parent company’s and the group’s ability to continue as going concern, disclosing, as applicable, mat-ters relating to going concern and using the going concern basis of accounting. The financial statements are prepared using the going concern basis of accounting unless there is an intention to liquidate the parent company or the group or cease operations, or there is no realistic alternative but to do so.
Auditor’s Responsibilities for the Audit of Financial StatementsOur objectives are to obtain reasonable assurance on whether the financial statements as a whole are free from material misstatement, whether due to fraud or error, and to issue an auditor’s report that includes our opinion. Rea-sonable assurance is a high level of assurance, but is not
a guarantee that an audit conducted in accordance with good auditing practice will always detect a material mis-statement when it exists. Misstatements can arise from fraud or error and are considered material if, individually or in aggregate, they could reasonably be expected to influ-ence the economic decisions of users taken on the basis of the financial statements.
As part of an audit in accordance with good auditing practice, we exercise professional judgment and maintain professional skepticism throughout the audit. We also:
• Identify and assess the risks of material misstatement of the financial statements, whether due to fraud or error, design and perform audit procedures responsive to those risks, and obtain audit evidence that is sufficient and appropriate to provide a basis for our opinion. The risk of not detecting a material misstatement resulting from fraud is higher than for one resulting from error, as fraud may involve collusion, forgery, intentional omissions, misrepresentations, or the override of internal control.
• Obtain an understanding of internal control relevant to the audit in order to design audit procedures that are appropriate in the circumstances, but not for the pur-pose of expressing an opinion on the effectiveness of the parent company’s or the group’s internal control.
• Evaluate the appropriateness of accounting policies used and the reasonableness of accounting estimates and related disclosures made by management.
• Conclude on the appropriateness of the Board of Direc-tors’ and the Managing Director’s use of the going con-cern basis of accounting and based on the audit evidence obtained, whether a material uncertainty exists related
to events or conditions that may cast significant doubt on the parent company’s or the group’s ability to con-tinue as a going concern. If we conclude that a material uncertainty exists, we are required to draw attention in our auditor’s report to the related disclosures in the financial statements or, if such disclosures are inade-quate, to modify our opinion. Our conclusions are based on the audit evidence obtained up to the date of our auditor’s report. However, future events or conditions may cause the parent company or the group to cease to continue as a going concern.
• Evaluate the overall presentation, structure and content of the financial statements, including the disclosures, and whether the financial statements represent the underlying transactions and events so that the financial statements give a true and fair view.
• Obtain sufficient appropriate audit evidence regard-ing the financial information of the entities or business activities within the group to express an opinion on the consolidated financial statements. We are responsible for the direction, supervision and performance of the group audit. We remain solely responsible for our audit opinion.
We communicate with those charged with governance regarding, among other matters, the planned scope and timing of the audit and significant audit findings, including any significant deficiencies in internal control that we iden-tify during our audit.
We also provide those charged with governance with a statement that we have complied with relevant ethical requirements regarding independence, and communicate
Qt Group 2017 / Board of Directors’ Report / Consolidated Key Figures / Financial Statements / CG / Information for Shareholders

72Annual Report 2017
with them all relationships and other matters that may reasonably be thought to bear on our independence, and where applicable, related safeguards.
From the matters communicated with those charged with governance, we determine those matters that were of most significance in the audit of the financial state-ments of the current period and are therefore the key audit matters. We describe these matters in our auditor’s report unless law or regulation precludes public disclosure about the matter or when, in extremely rare circumstances, we determine that a matter should not be communicated in our report because the adverse consequences of doing so would reasonably be expected to outweigh the public interest benefits of such communication.
Other Reporting Requirements
Information on our audit engagementWe were first appointed as the auditors of Qt Group Plc by the Annual General Meeting on May 1, 2016, when the company was founded as the result of de-merger from Digia Plc. Our appointment as auditors of Digia Plc repre-sents a total period of uninterrupted engagement since 2015.
Other InformationThe Board of Directors and the Managing Director are responsible for the other information. The other informa-tion comprises the report of the Board of Directors and the information included in in the Annual Report, but does not include the financial statements and our auditor’s report thereon. We have obtained the report of the Board of Directors prior to the date of this auditor’s report, and the Annual Report is expected to be made available to us after that date. Our opinion on the financial statements does not cover the other information.
In connection with our audit of the financial state-ments, our responsibility is to read the other information identified above and, in doing so, consider whether the other information is materially inconsistent with the finan-cial statements or our knowledge obtained in the audit, or otherwise appears to be materially misstated. With respect to the report of the Board of Directors, our respon-sibility also includes considering whether the report of the Board of Directors has been prepared in accordance with the applicable laws and regulations.
In our opinion, the information in the report of the Board of Directors is consistent with the information in the financial statements and the report of the Board of Direc-tors has been prepared in accordance with the applicable laws and regulations.
If, based on the work we have performed on the other information that we obtained prior to the date of this audi-tor’s report, we conclude that there is a material misstate-ment of this other information, we are required to report that fact. We have nothing to report in this regard.
Helsinki, February 15, 2018
KPMG OY AB
Kim JärviAuthorized Public Accountant, KHT
Qt Group 2017 / Board of Directors’ Report / Consolidated Key Figures / Financial Statements / CG / Information for Shareholders

73Annual Report 2017
Corporate Governance Statement
I. INTRODUCTION
This Corporate Governance Statement has been prepared in accordance with the Governance Code for Listed Finn-ish Companies 2015 (“Governance Code”) and chapter 7, section 7 of Finnish Securities Market Act (746/2012). This Statement has been issued separately from the report of the Board of Directors.
The Governance Code is available on the Finnish Secu-rities Market Association website at www.cgfinland.fi.
II. GOVERNANCE
Qt Group Plc’s (hereinafter referred to as the “company”) corporate governance system is based on the Companies Act, the Securities Markets Act, general corporate gov-ernance recommendations, and the company’s Articles of Association and in-company rules and regulations on corporate governance.
The company’s corporate governance principles are integrity, accountability, fairness and transparency. This means, among other things, that:
• The company complies with the applicable laws, rules and regulations.
• The company organises, plans and manages its oper-ations, and does business abiding by the applicable professional requirements approved by Board members, who demonstrate due care and responsibility in per-forming their duties.
• The company demonstrates special prudence with respect to the management of its capital and assets.
• The company's policy is to keep all market participants actively, openly and equitably informed of its business operations.
• The company's management, administration and per-sonnel are subject to the appropriate internal and exter-nal audits and supervision.
Shareholders’ MeetingThe company's highest decision-making body is the Share-holders' Meeting at which shareholders exercise their voting rights regarding company matters. Each company share entitles the holder to one vote at the Shareholders' Meeting.
Qt Group 2017 / Board of Directors’ Report / Consolidated Key Figures / Financial Statements / CG / Information for Shareholders

74Annual Report 2017
The AGM will be held annually within three (3) months of the end of the financial year. An Extraordinary General Meeting will be held if the Board of Directors deems it necessary or if requested in writing by a company auditor or shareholders holding a minimum of 10 per cent (1/10) of the company's shares, for the purpose of discussing a specific issue.
The Finnish Limited Liability Companies Act and the company’s Articles of Association define the responsibili-ties and duties of the Shareholders’ Meeting. Extraordinary General Meetings decide on the matters for which they have been specifically convened.
Board of Directors
Operations and dutiesElected by the Shareholders' Meeting, the Board of Directors is in charge of company administration and the appropriate organisation of company operations. Under the Articles of Association, the Board of Directors consists of four (4) to eight (8) members. The Compensation and Nomination Committee prepares a proposal for the Share-holders' Meeting regarding the composition of the new Board of Directors to be appointed.
The majority of Board members must be independent of the company and a minimum of two (2) of those mem-bers must also be independent of the company's major shareholders. The President and CEO or other company employees under the President and CEO's direction may not be elected members of the Board.
The term of all Board members expires at the end of the Annual General Meeting following their election. A Board member can be re-elected without limitations on the number of successive terms. The Board of Directors
elects its Chairman and Vice Chairman from amongst its members.
The Board of Directors has determined the principles regarding the diversity of the Board of Directors. Accord-ingly, the requirements of company size, market position and business industry should be duly reflected when com-posing the Board of Directors. When composing the Board of Directors, the objective is that the Board of Directors will always include necessary expertise especially in the following key areas:
• the company's field of business,• management of a similar-sized company,• the specific nature of a publicly listed company,• accounting,• risk management, and• Board activity.
The aim for the composition the Board of Directors is to have both genders represented. The defined diversity principles were well fulfilled in the company's Board of Directors during financial year 2017.
The Board has prepared and approved a written agenda for its work. In addition to Board duties prescribed by the Companies Act and other rules and regulations, the Board of Directors is responsible for issues on its agenda, observing the following guidelines:
• Good board practices require that the Board of Directors, instead of needlessly interfering in the details involved in day-to-day operations, concentrate on elaborating the company’s short- and long-term strategies.
• The Board’s general duty is to steer the company’s busi-ness with a view to maximizing shareholder value in the
long term, while taking account of expectations set by various stakeholder groups; and
• Board members are required to perform on the basis of sufficient, relevant and updated information, in order to serve the company’s interests.
In addition, the Board’s agenda:• defines the Board’s annual action plan and provides a
preliminary meeting schedule and framework agenda for each meeting;
• provides guidelines for the Board’s annual self-assess-ment;
• provides guidelines for distributing notices of meetings and advance information to the Board and procedures for keeping and adopting minutes;
• defines job descriptions for the Chairman, members and secretary of the Board of Directors (the secretary is the Company’s General Counsel or, if absent, the CEO); and
• defines the framework within which the Board may set up special committees or working groups.
The Board evaluates its activities and working methods annually, employing an external consultant for this evalua-tion, if necessary.
Qt Group 2017 / Board of Directors’ Report / Consolidated Key Figures / Financial Statements / CG / Information for Shareholders

75Annual Report 2017
Board of Directors
Robert Ingmanb. 1961, M.Sc. (Eng.), M.Sc. (Econ.)
Chairman of the Board of Directors of Qt Group Plc since 2016. Member of the Compensation and Nomina-tion Committee. Full-time Chairman of the Board of Ingman Group Oy Ab. His previous posts include Manag-ing Director at Arla Ingman Oy Ab (2007–2011) and Ingman Foods Oy Ab (1997–2006). Chairman of the Board of Etteplan Oyj and Halti Ltd. Vice Chairman of the Board of DigiaPlc. Member of the Evli Pankki Plc and M-Brain Ltd.
Matti Rossib. 1966, Doctor of Philosophy
Member of the Board of Directors of Qt Group Plc since 2016. Member of the Audit Committee. Matti Rossi is Professor of Information Sys-tems Science in the Department of Information and Service Economy at Aalto University and Docent in Information System Development at Lappeenranta University of Technol-ogy. Previous posts include that of Professor of Information Systems at the Helsinki School of Econom-ics (1999–2009), Visiting Professor and Visiting Associate Professor at several universities in the United States (2007–2008, 1997–1998), and Researcher at Erasmus Univer-sity Rotterdam in the Netherlands (1998–1999) and the University of Jyväskylä (1985–1998).
Leena Saarinenb. 1960, M.Sc. (Food technology)
Member of the Board of Directors of Qt Group Plc since 2016. Chairman of the Compensation and Nomina-tion Committee. Currently works as a board professional, holding Board chairman or Board member roles in various companies, including Palmia Ltd, Arcus ASA, Handels-banken Finland and Etteplan Oyj. Her previous posts include Managing Director at Suomen Lähikauppa Ltd (2007–2010), President and CEO at Altia Corporation (2005–2007) and various positions at Unilever (1990–2005). Member of the Direc-tors’ Institute of Finland.
Tommi Uharib. 1971, M.Sc. (Eng.)
Vice Chairman of the Board of Direc-tors of Qt Group Plc since 2016. Chairman of the Audit Committee and member of the Compensation and Nomination Committee. Cur-rently serves as Partner and Board member of Karma Ventures and holds board member and strategic advisor roles in various companies. Co-founder and CEO at Uros Ltd (2011–2015). His previous posts include management team member of ST Microelectronics (2006–2010), various managerial positions at ST’s joint ventures ST-NXP Wire-less and ST-Ericsson (2008–2010), head of ST’s Wireless Business Unit (2006–2008) and Director of Nokia Wireless and SW platforms units at Nokia (1999–2006).
Kai Öistämöb. 1964, Doctor of Technology, M.Sc. (Engineering)
Member of the Board of Directors of Qt Group Plc since 2016. Member of the Audit Committee. Currently Executive Partner at Siris Capi-tal Group, Chairman of the Board at Fastems Oy and Helvar Oy, and member of the Board at InterDig-ital and Sanoma Corporation. His previous posts include Chief Devel-opment Officer at Nokia until the autumn of 2014 and a member of the Nokia Group Executive Board in 2006–2014. Obtained his Doctorate in Technology (Signal Processing) from Tampere University of Technol-ogy in 1992.
Qt Group 2017 / Board of Directors’ Report / Consolidated Key Figures / Financial Statements / CG / Information for Shareholders

76Annual Report 2017
Composition of Board of Directors
During the financial year 2017, the Board of Directors of Qt Group Plc comprised the following members:
Name EDUCATION YEAR OF BIRTH MAIN ACTIVITY OWNERSHIP*
Robert Ingman M.Sc. (Eng.), M.Sc. (Econ.) 1961 Chairman of the Board of Directors at Ingman Group Oy Ab 5,173,000
Matti Rossi Ph.D. 1966 Professor, Docent 0
Leena Saarinen M.Sc. (Food Technology) 1960 Board professional 2,844
Tommi Uhari M.Sc. (Eng.) 1971 Partner at Karma Ventures – Venture Capital fund 0
Kai Öistämö D.Sc. (Tech.), M.Sc. (Eng.) 1964 Executive Partner at Siris Capital Group 11,280
Member PARTICIPATION
Robert Ingman (Chairman) 10/10
Matti Rossi 10/10
Leena Saarinen 10/10
Tommi Uhari 10/10
Kai Öistämö 9/10
Total 98%
* Shares and share-based rights held directly or through legal entities under person’s control as per 31 December 2017.
No Board member owns any stock-options or other share-based rights in the company.
Of the aforementioned members of the Board, Matti Rossi, Leena Saarinen, Tommi Uhari and Kai Öistämö are independent of the company and its major shareholders. Robert Ingman is independent of the company
During the financial year 2017, the Board of Directors held 10 meetings. The participation rate into the meetings was the following.
Qt Group 2017 / Board of Directors’ Report / Consolidated Key Figures / Financial Statements / CG / Information for Shareholders
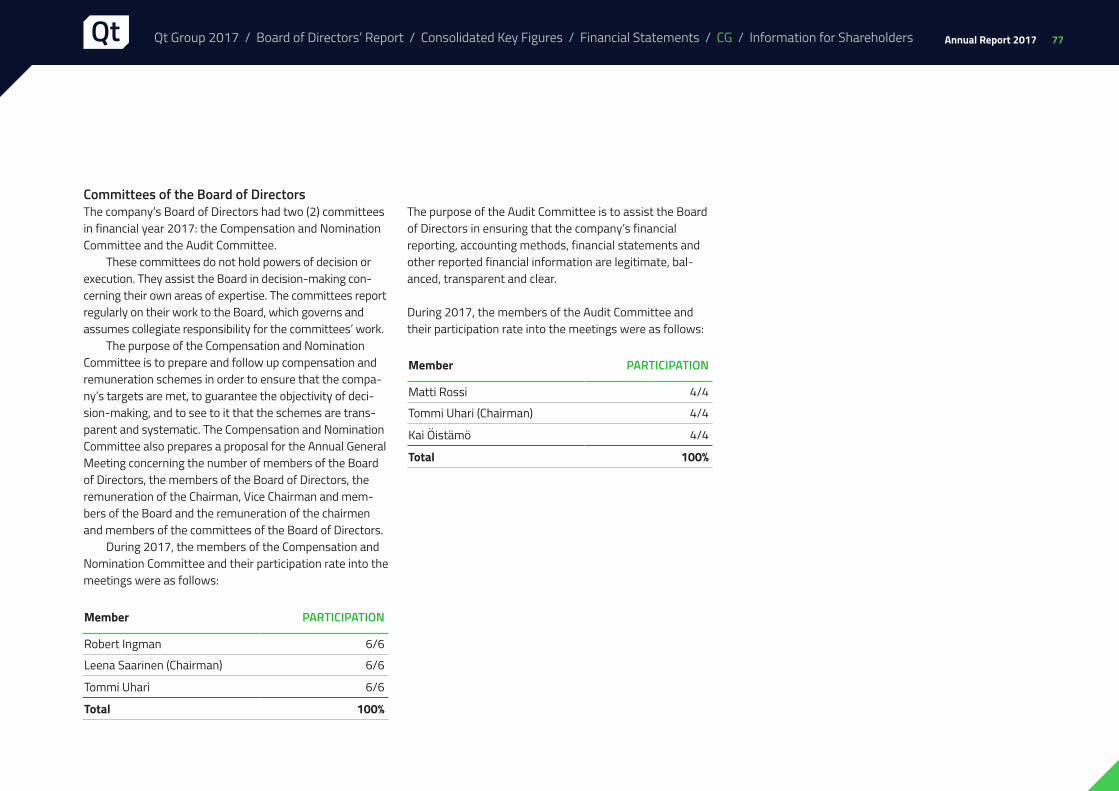
77Annual Report 2017
Committees of the Board of DirectorsThe company’s Board of Directors had two (2) committees in financial year 2017: the Compensation and Nomination Committee and the Audit Committee.
These committees do not hold powers of decision or execution. They assist the Board in decision-making con-cerning their own areas of expertise. The committees report regularly on their work to the Board, which governs and assumes collegiate responsibility for the committees’ work.
The purpose of the Compensation and Nomination Committee is to prepare and follow up compensation and remuneration schemes in order to ensure that the compa-ny’s targets are met, to guarantee the objectivity of deci-sion-making, and to see to it that the schemes are trans-parent and systematic. The Compensation and Nomination Committee also prepares a proposal for the Annual General Meeting concerning the number of members of the Board of Directors, the members of the Board of Directors, the remuneration of the Chairman, Vice Chairman and mem-bers of the Board and the remuneration of the chairmen and members of the committees of the Board of Directors.
During 2017, the members of the Compensation and Nomination Committee and their participation rate into the meetings were as follows:
Member PARTICIPATION
Robert Ingman 6/6
Leena Saarinen (Chairman) 6/6
Tommi Uhari 6/6
Total 100%
Member PARTICIPATION
Matti Rossi 4/4
Tommi Uhari (Chairman) 4/4
Kai Öistämö 4/4
Total 100%
The purpose of the Audit Committee is to assist the Board of Directors in ensuring that the company’s financial reporting, accounting methods, financial statements and other reported financial information are legitimate, bal-anced, transparent and clear.
During 2017, the members of the Audit Committee and their participation rate into the meetings were as follows:
Qt Group 2017 / Board of Directors’ Report / Consolidated Key Figures / Financial Statements / CG / Information for Shareholders
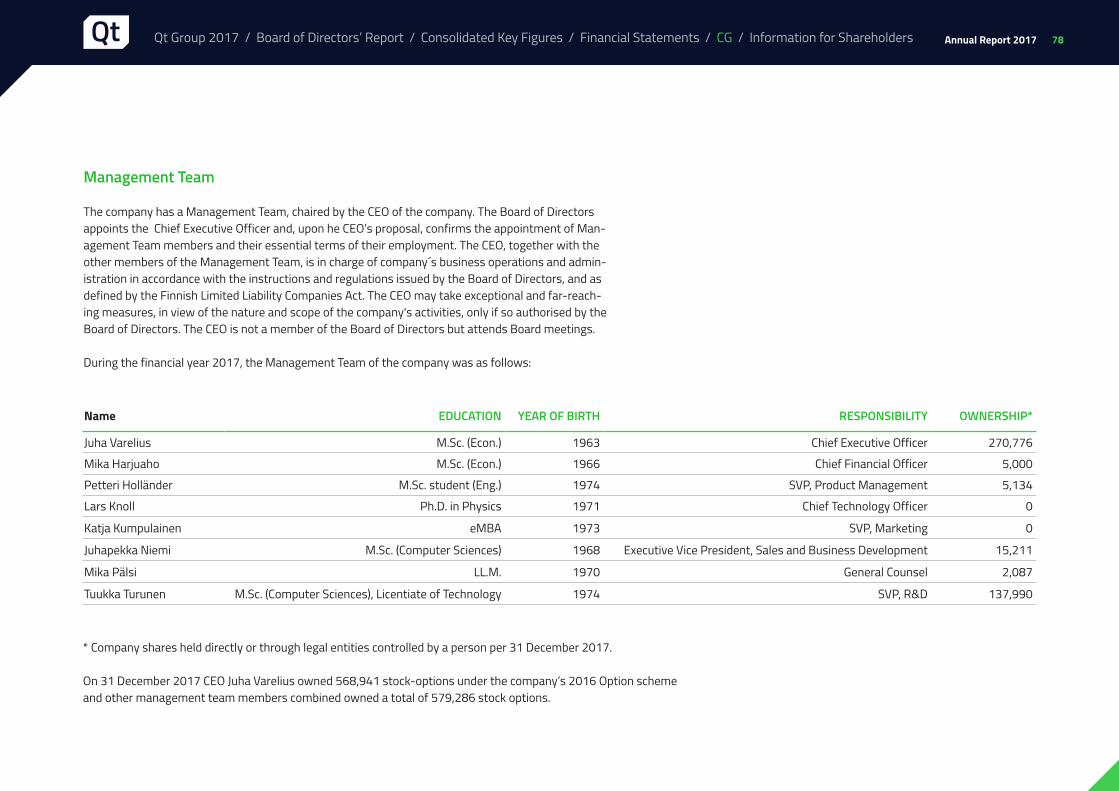
78Annual Report 2017
Management Team
The company has a Management Team, chaired by the CEO of the company. The Board of Directors appoints the Chief Executive Officer and, upon he CEO’s proposal, confirms the appointment of Man-agement Team members and their essential terms of their employment. The CEO, together with the other members of the Management Team, is in charge of company´s business operations and admin-istration in accordance with the instructions and regulations issued by the Board of Directors, and as defined by the Finnish Limited Liability Companies Act. The CEO may take exceptional and far-reach-ing measures, in view of the nature and scope of the company's activities, only if so authorised by the Board of Directors. The CEO is not a member of the Board of Directors but attends Board meetings.
During the financial year 2017, the Management Team of the company was as follows:
Name EDUCATION YEAR OF BIRTH RESPONSIBILITY OWNERSHIP*
Juha Varelius M.Sc. (Econ.) 1963 Chief Executive Officer 270,776
Mika Harjuaho M.Sc. (Econ.) 1966 Chief Financial Officer 5,000
Petteri Holländer M.Sc. student (Eng.) 1974 SVP, Product Management 5,134
Lars Knoll Ph.D. in Physics 1971 Chief Technology Officer 0
Katja Kumpulainen eMBA 1973 SVP, Marketing 0
Juhapekka Niemi M.Sc. (Computer Sciences) 1968 Executive Vice President, Sales and Business Development 15,211
Mika Pälsi LL.M. 1970 General Counsel 2,087
Tuukka Turunen M.Sc. (Computer Sciences), Licentiate of Technology 1974 SVP, R&D 137,990
* Company shares held directly or through legal entities controlled by a person per 31 December 2017.
On 31 December 2017 CEO Juha Varelius owned 568,941 stock-options under the company’s 2016 Option scheme and other management team members combined owned a total of 579,286 stock options.
Qt Group 2017 / Board of Directors’ Report / Consolidated Key Figures / Financial Statements / CG / Information for Shareholders
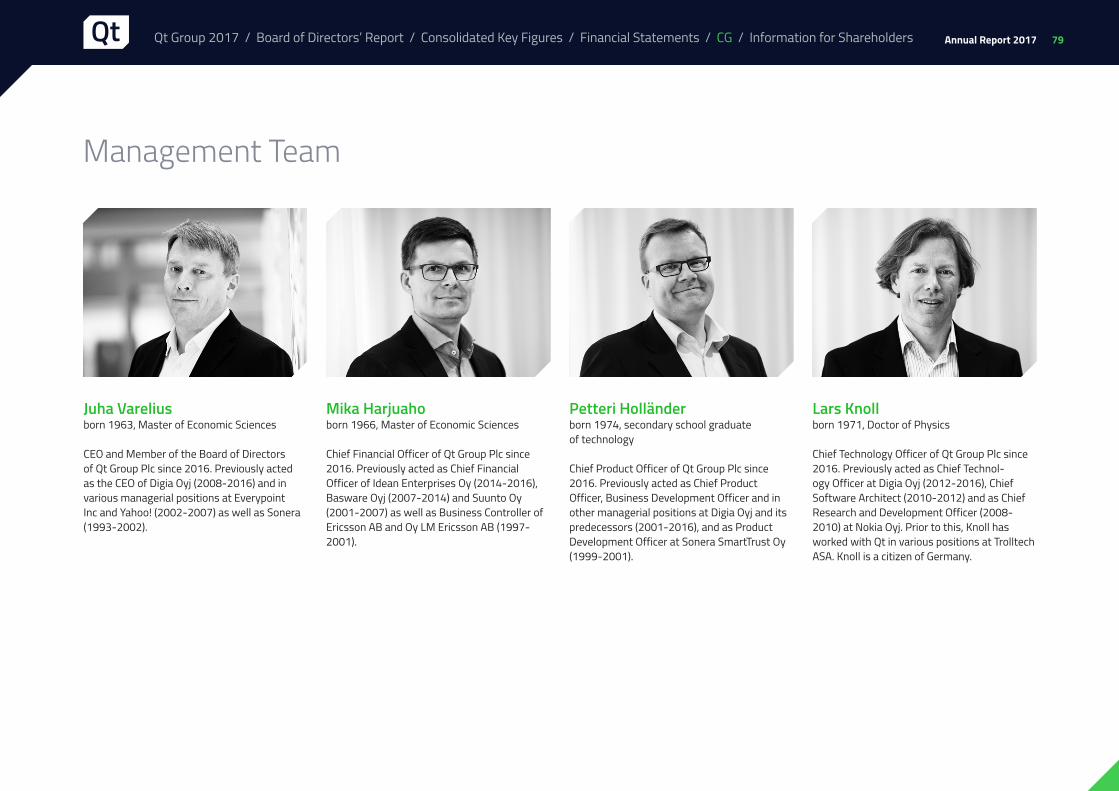
79Annual Report 2017
Management Team
Juha Vareliusborn 1963, Master of Economic Sciences
CEO and Member of the Board of Directors of Qt Group Plc since 2016. Previously acted as the CEO of Digia Oyj (2008-2016) and in various managerial positions at Everypoint Inc and Yahoo! (2002-2007) as well as Sonera (1993-2002).
Mika Harjuahoborn 1966, Master of Economic Sciences
Chief Financial Officer of Qt Group Plc since 2016. Previously acted as Chief Financial Officer of Idean Enterprises Oy (2014-2016), Basware Oyj (2007-2014) and Suunto Oy (2001-2007) as well as Business Controller of Ericsson AB and Oy LM Ericsson AB (1997-2001).
Petteri Holländerborn 1974, secondary school graduate of technology
Chief Product Officer of Qt Group Plc since 2016. Previously acted as Chief Product Officer, Business Development Officer and in other managerial positions at Digia Oyj and its predecessors (2001-2016), and as Product Development Officer at Sonera SmartTrust Oy (1999-2001).
Lars Knollborn 1971, Doctor of Physics
Chief Technology Officer of Qt Group Plc since 2016. Previously acted as Chief Technol-ogy Officer at Digia Oyj (2012-2016), Chief Software Architect (2010-2012) and as Chief Research and Development Officer (2008-2010) at Nokia Oyj. Prior to this, Knoll has worked with Qt in various positions at Trolltech ASA. Knoll is a citizen of Germany.
Qt Group 2017 / Board of Directors’ Report / Consolidated Key Figures / Financial Statements / CG / Information for Shareholders

80Annual Report 2017
Katja Kumpulainenborn 1973, eMBA
Chief Marketing Officer of Qt Group Plc since 2016. Previously acted as Chief Marketing Officer at Digia Oyj (2015-2016) and Nervogrid Oy (2012-2015) as well as in various manage-rial, directorial and expert positions at Lite-On Mobile Oy (prev. Perlos) (2007-2012) and Bas-ware Oyj (1995-2007). Member of the Board of Directors at Sparklike Oy.
Juhapekka Niemiborn 1968, Information Technology Engineer
Chief Business Officer of Qt Group Plc since 2016. Previously acted as Chief Business Officer at Digia Oyj (2013-2016) as well as in various managerial and directorial positions at Nokia Oyj (2000-2013).
Mika Pälsiborn 1970, Master of Laws .
Chief Legal Officer and Member of the Board of Directors of Qt Group Plc since 2016. Previ-ously acted as General Counsel of Digia Oyj (2009-2016), Senior Legal Counsel at Tieto Oyj (2005-2009) and as an attorney at Castrén & Snellman (1999-2005).
Tuukka Turunenborn 1974, Master of Science in Technology, Licentiate in Technology
Chief Research and Product Development Officer of Qt Group Plc since 2016. Previously acted in various managerial and directo-rial positions at Digia Oyj (2001-2016), as a software developer at Nokia Matkapuhelimet Oy (1997-1998) and in teaching and research positions at the University of Oulu (1996-1997 and 1998-2000). Chairman of the Board of Directors in the Qt Project Hosting Foundation and a Member of the Board of Directors in the KDE Free Qt Foundation and Tietolatva Oy.
Qt Group 2017 / Board of Directors’ Report / Consolidated Key Figures / Financial Statements / CG / Information for Shareholders

81Annual Report 2017
Organ
Financial Control Environment
Control Function
Audit
Board of Directors
Internal ControlAudit Committee
Group Management Team
President and CEO
Management of Business Functions
Finance Unit
Annual General Meeting
Written Procedures
Control functions and control environmentThe company has a finance unit tasked with verifying mon-thly reports. The finance unit reports to the management, the Board of Directors and the Board’s Audit Committee regarding the financial performance of the company.
The company uses a reporting system which com-piles separate subsidiaries’ reports into the consolidated financial statements. The accuracy of accounting and the financial statements is monitored by the finance unit. The company also has the necessary separate reporting and information systems for monitoring business operations and asset management.
The Group’s finance unit provides instructions for drawing up financial statements and interim financial sta-tements, and compiles the consolidated financial state-ments. The finance unit has centralised control over the Group's funding and asset management, and is in charge of managing interest rate and currency risk.
Internal risk controlAs a general principle, authorisation is distributed in the company in such a way that no individual may indepen-dently perform measures unbeknown to at least one other individual. For example, the company’s bookkeeping and asset management are managed by separate persons, and two authorised persons are needed to sign on behalf of the company.
Group-level reporting and supervision are based on monthly income reporting led by the CFO and on updates of the latest forecasts.
III. FINANCIAL REPORTING RELATED INTERNAL CONTROL AND RISK MANAGEMENT SYSTEMS
The company’s operations are divided into function- specific areas of responsibility, with the Senior Vice Presi-dents in charge of each function reporting to the President and CEO. The Senior Vice Presidents responsible for the company’s functions report to the Management Team on development matters, strategic and annual planning, investments and internal organisational matters related to their areas of responsibility.
The company’s operational management and super-vision take place according to the corporate governance system described hereinabove. The Group’s administration unit is in charge of HR management and policy. The legal affairs unit provides instructions for and monitors cont-racts made by the company and ensures the legality of the Group’s operations.
Qt Group 2017 / Board of Directors’ Report / Consolidated Key Figures / Financial Statements / CG / Information for Shareholders

82Annual Report 2017
CommunicationsThe Group's General Counsel is in charge of the company’s external communications and their correctness. External communications include financial reports and other stock exchange communications. The General Counsel is respon-sible for the publication of interim reports and financial statements, as well as for actions related to convening and holding Shareholders' Meetings. Most communications take place through the company’s website and using stock exchange releases.
Risk managementThe purpose of the company’s risk management process is to identify and manage risks in such a way that the com-pany is able to meet its strategic and financial targets. Risk management is a continuous process, by which the major risks are identified, listed and assessed, the key persons in charge of risk management are appointed and risks are prioritised according to an assessment scale in order to compare the effects and mutual significance of risks.The main operational risks handled by the company's risk management function are customer risk, personnel risk, data security risk, IPR risk and goodwill risk.
The company manages customer risk by actively developing its customer portfolio structure and avoiding
any potential risk positions. Personnel risks are actively assessed and managed using a goal and development discussion process for key personnel. To improve per-sonnel commitment, the company strives to improve the efficiency of internal communications systematically, using regular personnel events and increasing the visibility of management. In addition, the Group's certified qual-ity systems are regularly evaluated. Data security risk is managed through the continuous development of working models, security practices and processes. Risks associated with shared operating models and best practices, as well as their integrated development, are managed according to plan under the supervision of the Group Management Team. Risks typical to software business, especially to international product business, relating to appropriate protection of company’s own IPRs and violation of IPRs of third parties are managed through extensive internal policies, standard contracts and appropriate follow-up and analysis. With respect to IFRS-compliant accounting poli-cies, the Group actively monitors goodwill and the related impairment tests, as part of prudent and proactive risk management practices within financial management.
In addition to operational risks, the company is sub-ject to financial risks. The company’s internal and exter-
nal financing and the management of financial risks are coordinated by the finance function of the Group's parent company. This function is responsible for the Group's liquidity, sufficiency of financing, and the management of interest rate and currency risk. The Group is exposed to several financial risks during the normal course of its business. The objective of the Group’s risk management is to minimise the adverse effects of changes in the finan-cial markets on the Group's earnings. The primary types of financial risks are interest rate risk, currency risk, credit risk and funding risk. The general principles of risk man-agement are approved by the Board of Directors, and the Group's finance function is responsible for their practical implementation together with the business divisions.
Qt Group 2017 / Board of Directors’ Report / Consolidated Key Figures / Financial Statements / CG / Information for Shareholders
83Annual Report 2017
IV. OTHER INFORMATION
Internal auditThe tasks of internal audit include, among other things, the assessment of the company’s internal control systems and risk management, as well as evaluation of the appropria-teness and efficiency of management and administration processes.
Internal audit does not form a function of its own in the company but is the responsibility of the company’s Financial and Legal functions.
To follow business activities and financial administra-tion, the company has necessary reporting systems in use. As part of the legality control of the company’s activities, the company’s Auditor evaluates the functionality of this internal control system.
AuditorKPMG Oy Ab, Authorised Public Accountants, serves as the auditor of the company, with Authorised Public Accountant Kim Järvi as the principal auditor.
During financial year 2017, the auditor’s fees for auditing services was 43,600 euros and 97,000 euros for services that were not related to auditing.
Insider AdministrationThe company follows the Guidelines for Insiders by Nasdaq Helsinki Oy.
The company’s General Counsel is responsible for the compliance with the Insider Guidelines and the follow-up of the disclosure obligation, regarding training.
Qt Group 2017 / Board of Directors’ Report / Consolidated Key Figures / Financial Statements / CG / Information for Shareholders

84Annual Report 2017
This management remuneration statement sets forth a summary of the financial benefits, remuneration system and thereto related decision-making pertaining to Board members and operative management of Qt Group Plc.
A) Description of the decision-making procedures concerning remuneration
Board of Directors Qt Group Plc’s Compensation and Nomination Committee prepares the remuneration payable to the Board of Direc-tors and grounds for the compensation of expenses. The Shareholders’ Meeting decides on the remuneration paya-ble to the Board of Directors and grounds for the compen-sation of expenses.
President and CEO and Other Executives Qt Group Plc’s Compensation and Nomination Committee prepares the remuneration and other rewards and benefits payable to the President and CEO.
The Compensation and Nomination Committee also prepares, in cooperation with the President and CEO, the remunerations and other rewards and benefits paya-ble to the other executives. If necessary, outside experts and market surveys can also be used in the preparation of remunerations. The Board of Directors decides on the remunerations and other rewards and benefits payable
STATEMENT ON MANAGEMENT REMUNERATION
to the President and CEO. The Board of Directors decides, based on the President and CEO’s proposal, on remunera-tions and other rewards and benefits payable to the other executives.
By virtue of the authorization granted by the Annual General meeting, the Board of Directors of Qt Group Plc decided at its meeting on 22 June 2016 on an option pro-gram, whereunder a maximum of 2,000,000 stock options can be given to the key personnel of the company or its group companies. At its meeting on 27 September 2017 the company’s Board of Directors decided to extent the validity of said option program so that the option rights still unallocated from the original 2,000,000 maximum amount can be allocated to the key personnel of the com-pany or its group companies whilst the authorization given by the Annual General Meeting still remains valid.
B) Key Remuneration Principles
Remuneration of the Board of DirectorsThe 2017 Annual General Meeting of Qt Group Plc decided to pay monthly remuneration of EUR 2,500 to the mem-bers of Qt Group Plc’s Board of Directors, EUR 3,500 to the Vice Chairman and EUR 5,500 to the Chairman for their work on the Board. In addition, the AGM approved EUR 1,000 in fees per committee meeting for the Chairman of respective Board Committee and EUR 500 in fees per
Board or committee meeting for all other Board members of Qt Group Plc. Moreover, the Annual General Meeting decided that standard and reasonable costs resulting from work on the Board of Directors would be reimbursed against invoice.
The company does not grant stock options or share-based remuneration for work on the Board.
Remuneration of the President and CEO CEO Juha Varelius’ remuneration package comprises a monthly salary in accordance with his director agreement and a bonus payable on the basis of reaching the set tar-gets.
At the time of issuing this statement, the CEO was paid EUR 303,225 per year in salary and fringe benefits.
In addition to the monthly salary, the CEO is paid a bonus which is based on bonus schemes confirmed for the company.
Under the company’s bonus scheme, the earning criteria for the bonus is the growth of Qt group’s net sales. Upon fulfilment of the target set for net sales, the CEO is paid a bonus equal to 40 per cent of his annual base salary. Upon exceeding the said target, the bonus will increase as follows: 30% of each euro that exceeds the net sales target is used for the CEO’s and other company personnel's bonus rewards including social costs. The maximum bonus for the CEO under the bonus scheme is 120 per cent of his
Qt Group 2017 / Board of Directors’ Report / Consolidated Key Figures / Financial Statements / CG / Information for Shareholders

85Annual Report 2017
annual base salary. However, no bonus shall be paid if the company’s operating profit is more than one million euros short of the set operating profit budget. The fulfilment of bonus criteria is evaluated and possible rewards are paid semiannually.
Under the company’s long-term incentive scheme (https://qt-investors-uploads.s3.amazonaws.com/ wp-content/uploads/STOCK-OPTIONS-2016_ENG.pdf), the President and CEO has been issued 568,941 stock options, each of which entitles its holder to subscribe for one (1) new share in the company or an existing share held by the company. The share subscription period for the stock options is 19 December 2019–31 December 2022 and the subscription price is EUR 4.84. A precondition for the share subscription is that the value of the company’s share based on the trade volume weighted average quota-tion on the NASDAQ Helsinki Ltd is at least five euros and eighty-five cents (EUR 5.85) between 18 November 2019 and 13 December 2019.
The company may terminate the CEO’s service con-tract with six (6) months’ notice.
Upon such termination, he will receive remuneration for the notice period plus severance pay equaling twelve (12) months’ salary. The CEO’s retirement age is as stipu-lated by law, and he has no supplementary pension agree-ment with the company.
Remuneration of Other Executives The company’s executive management consists of the Group Management Team, which comprises the CEO and seven (7) other members.
The total remuneration package of the said execu-tives comprises a monthly salary and the bonus payable on the basis of reaching the set targets. Annual fixed salaries including fringe benefits for the members of the Manage-ment Team (excluding the CEO) totalled EUR 870,522 per year at the time of issuing this statement.
The earning criteria and conditions of the merit bonus for the members of the Management Team are the same as those of the CEO, but the amount of the bonus at the target level varies between 30 and 44 per cent of the individual’s annual base salary.
As with the CEO, the maximum bonus is three times the target level.
Under the company’s long-term incentive scheme, the members of the Management Team (excluding the CEO) have been issued 579,286 stock options, each of which entitles its holder to subscribe for one (1) new share in the company or an existing share held by the company under terms corresponding to those of the CEO.
The retirement age of the executives is stipulated by law and none of the executives has a supplementary pen-sion agreement with the company.
Qt Group 2017 / Board of Directors’ Report / Consolidated Key Figures / Financial Statements / CG / Information for Shareholders
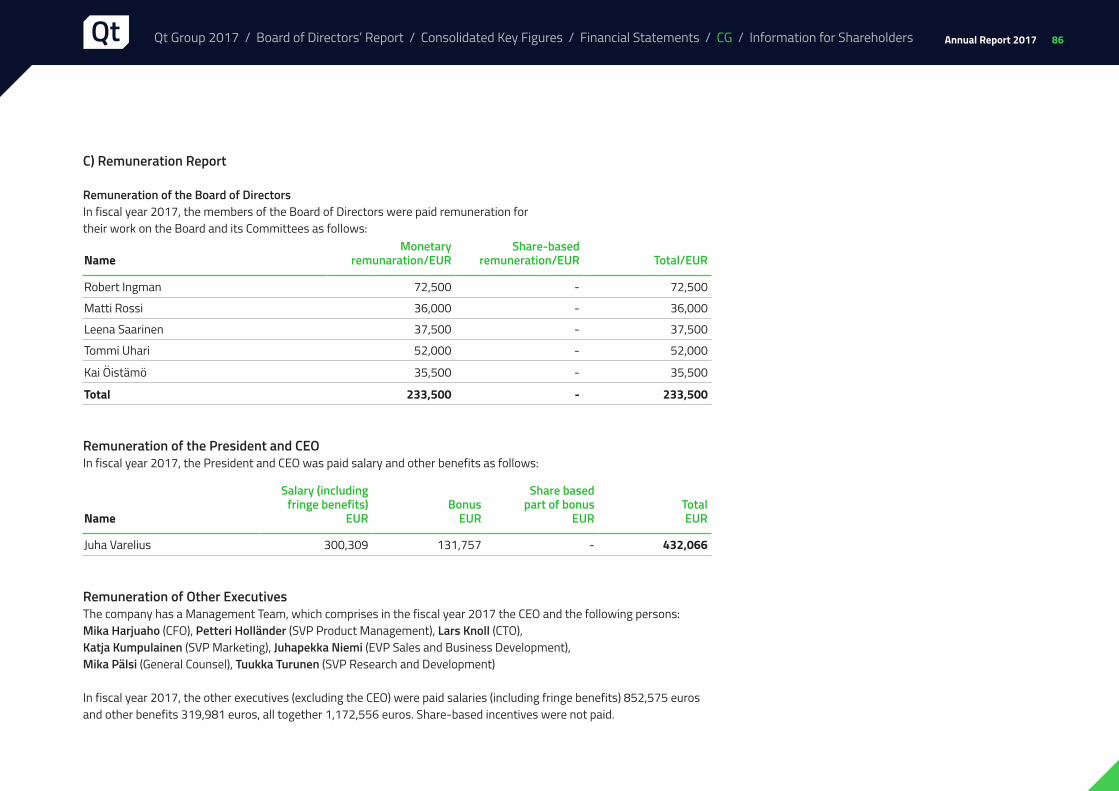
86Annual Report 2017
Remuneration of the President and CEOIn fiscal year 2017, the President and CEO was paid salary and other benefits as follows:
Remuneration of Other ExecutivesThe company has a Management Team, which comprises in the fiscal year 2017 the CEO and the following persons:Mika Harjuaho (CFO), Petteri Holländer (SVP Product Management), Lars Knoll (CTO), Katja Kumpulainen (SVP Marketing), Juhapekka Niemi (EVP Sales and Business Development), Mika Pälsi (General Counsel), Tuukka Turunen (SVP Research and Development)
In fiscal year 2017, the other executives (excluding the CEO) were paid salaries (including fringe benefits) 852,575 euros and other benefits 319,981 euros, all together 1,172,556 euros. Share-based incentives were not paid.
NameMonetary
remunaration/EURShare-based
remuneration/EUR Total/EUR
Robert Ingman 72,500 - 72,500
Matti Rossi 36,000 - 36,000
Leena Saarinen 37,500 - 37,500
Tommi Uhari 52,000 - 52,000
Kai Öistämö 35,500 - 35,500
Total 233,500 - 233,500
Name
Salary (including fringe benefits)
EURBonus
EUR
Share based part of bonus
EURTotalEUR
Juha Varelius 300,309 131,757 - 432,066
C) Remuneration Report
Remuneration of the Board of DirectorsIn fiscal year 2017, the members of the Board of Directors were paid remuneration for their work on the Board and its Committees as follows:
Qt Group 2017 / Board of Directors’ Report / Consolidated Key Figures / Financial Statements / CG / Information for Shareholders

87Annual Report 2017
Qt Group Plc’s investor communications produce reliable and up-to-date information on the company’s business operations in a timely and equal manner for all interested parties. The company’s annual reports, interim reports, stock exchange releases and press releases are available in Finnish and English at https://investors.qt.io.
To subscribe to stock exchange releases, please send your e-mail contact information to [email protected].
Qt’s Annual General Meeting will be held on Tuesday, 13 March 2018 at 10:00 a.m. at Rake-sali in Helsinki, add-ress Erottaja 4C. More information on registering for the AGM and the AGM documents are available at investors.qt.io.
Financial calendar 2018
16 February Financial statements bulletin for 2017 and annual report27 April Interim statement January–March 9 August Half year financial report1 November Interim statement January–September
Information forShareholders
Basic information on the shareListed (2016) on Nasdaq Helsinki LtdTrading code: QTCOMNumber of shares: 23,792,312
IR ContactMika Harjuaho, CFOTel. +358 9 8861 8040E-mail: [email protected]
Head officeQt Group Plc (The Qt Company)Bertel Jungin aukio D3A02600 Espoo, Finland
Qt Group 2017 / Board of Directors’ Report / Consolidated Key Figures / Financial Statements / CG / Information for Shareholders

88
Qt Group Oyj (The Qt Company) / Bertel Jungin aukio D3A, 02600 Espoo / +358 9 8861 8040 / [email protected] / www.qt.io