Qlountu of ~an ~kgo · 2016-09-27 · Barrett Lake 911.3 4232 8 4 of 9 s samples exceeded ......
169
RICHARD E. CROMPTON DIRECTOR August 12, 2016 Ms. Xueyuan Yu Qlountu of DEPARTMENT OF PUBLIC WORKS 5510 OVERLAND AVE, SUITE 410 SAN DIEGO, CALIFORNIA 92123·1237 (858) 694-2212 FAX: (858) 694-3597 Web Sne: www.sdcounty.ca.gov/dpwl San Diego Regional Water Quality Control Board 2375 Northside Drive, #1 00 San Diego, CA 92108 Electronic submission: [email protected] REVIEW AND COMMENT OF THE DRAFT 2014 CALIFORNIA SECTION (§) 303(D)/305(B) INTEGRATED REPORT r' ' •.J (Jj
Transcript of Qlountu of ~an ~kgo · 2016-09-27 · Barrett Lake 911.3 4232 8 4 of 9 s samples exceeded ......

RICHARD E. CROMPTON DIRECTOR
August 12, 2016
Ms. Xueyuan Yu
Qlountu of ~an ~kgo
DEPARTMENT OF PUBLIC WORKS 5510 OVERLAND AVE, SUITE 410
SAN DIEGO, CALIFORNIA 92123·1237 (858) 694-2212 FAX: (858) 694-3597
Web Sne: www.sdcounty.ca.gov/dpwl
San Diego Regional Water Quality Control Board 2375 Northside Drive, #1 00 San Diego, CA 92108
Electronic submission: [email protected]
REVIEW AND COMMENT OF THE DRAFT 2014 CALIFORNIA SECTION (§) 303(D)/305(B) INTEGRATED REPORT
r' ' •.J
(Jj

August 12, 2016 Ms. Xueyuan Yu San Diego Regional Water Quality Control Board 2375 Northside Drive, #100 San Diego, CA 92108 Electronic submission: [email protected] Dear Ms. Yu: REVIEW AND COMMENT OF THE DRAFT 2014 CALIFORNIA SECTION (§) 303(D)/305(B) INTEGRATED REPORT The County of San Diego (County) has reviewed the Draft 2014 California §303(d)/305(b) Integrated Report dated July 12, 2016. We appreciate the opportunity to provide comments to the San Diego Regional Water Quality Control Board (Regional Board) on this important document. We thank the Regional Board staff for their high level of interaction with stakeholders and their responsiveness to stakeholders’ questions. This letter first provides an overview of our key comments and then provides specific comments organized by constituent or water body condition. General Comments 1. Inconsistent Application of Listing Policy for Conventional and Other Pollutants
Listings for conventional and other pollutants do not appear to follow the guidance presented in Table 3.2 of the Water Quality Control Policy for Developing California’s Clean Water Act Section 303(d) List (Listing Policy). The exceedances of conventional and other pollutants needed to place a water body on the §303(d) list should be greater than or equal to five. However, numerous listings, including total nitrogen, total phosphorus, benthic community, and surfactants are included on the Draft 2014 §303(d) list based on exceedance counts of less than five. More detail is provided below regarding comments for specific decision IDs.

Ms. Yu 2014 Draft §303(d)/305(b) Integrated Report Comment Letter August 12, 2016 Page 2
2. Water Quality Improvement Plans Address Beaches and Creek Bacteria TMDL
A number of new listings for indicator bacteria have been added to the Draft 2014 §303d list. Water bodies located in the tributaries of the Beaches and Creek Bacteria TMDL should be classified as Category 4a.
3. Incorrect Application of the Listing Policy by Combining Sediment and Water Toxicity Sample Results In many of the proposed toxicity listings, sediment and water toxicity samples were combined to determine the final exceedance count and listing determination. The toxicants found in water and sediment are likely to be different. Additionally, the species used to test toxicity are different for water and sediment. The Listing Policy states: “A water segment shall be placed on the section 303(d) list if the water segment exhibits statistically significant water or sediment toxicity using the binomial distribution…” The Listing Policy does not state water and/or sediment toxicity.
4. Consider Recent Data Before Making A Listing Decision Although acknowledged by the Regional Board, the age of some of the data used in the listing analysis was greater than 10 years for numerous waterbodies and therefore not likely representative of current water quality conditions. Inclusion of data greater than 10 years old, and arguably greater than five years old, will likely not result in a §303d list that is representative of water quality conditions in San Diego County and therefore not useful in the development of water quality priorities. If the Regional Board is required to list a waterbody using available data, please review listings off-cycle with additional available information not included in the Draft 2014 §303(d) listing evaluation.
5. Inconsistent Use of Biological Indices in Listing DecisionsThe Listing Policy states that appropriate reference sites must be identified for each waterbody assessment of biological data (Section 6.1.5.8 of the Listing Policy). Per the Draft Clean Water Act Sections 305(b) and 303(d) Integrated Report for the San Diego Region (Integrated Report) the Regional Board states that the California Stream Condition Index (CSCI) incorporates reference stations by utilizing an expected value and that for this listing cycle, the CSCI was used to assess stream beneficial use attainment. In the Draft 2014 §303d list, recommendations were made to list both Santa Margarita River (Lower) and Sweetwater River (Upper) based on CSCI scores below the threshold of 0.79, but in both cases the number of samples is below the minimum of five required to list a waterbody for a conventional or other pollutant per Table 3.2 of the Listing Policy.
6. Incorrect use of Nutrient Concentrations as an LOE for Benthic Community ListingsSecondary lines of evidence (LOEs) were presented for the benthic community listings that included nutrients. Note that total nitrogen and total phosphorus, while indicative of conditions that may cause eutrophication or harmful algal blooms, do not directly cause toxicity in the water. The Listing Policy, Section 3.9, states that the biological communities must be compared to reference sites and that the results be associated with “water or sediment concentrations of pollutants including but not limited to chemical concentrations, temperature, dissolved oxygen, and trash.” Nutrients such as total nitrogen and total phosphorus are not included on this list of associated pollutants in the Listing Policy, and should not be included as secondary LOEs.
7. CSCI Impairment Threshold of 0.79 is Overly ConservativeThe CSCI is a relatively new indexing tool that has recently been published for use in California (Mazor, et al 2016) and includes a predictive approach to estimate expected reference conditions at a sampling location. While the tool is an improvement over

Ms. Yu 2014 Draft §303(d)/305(b) Integrated Report Comment Letter August 12, 2016 Page 3
historic benthic community index tools (i.e., Index of Biotic Integrity (IBI) and the observed to expected ratio (O/E)) there are still specific details of the tool that are currently under revision (e.g., use of “distinct” or “non-distinct” Southwestern Association of Freshwater Invertebrate Taxonomists (SAFIT) Level 1 or 2 taxonomic data). The revisions are ongoing and do affect CSCI results. In addition, the Regional Board’s selection of the threshold for impairment of a CSCI < 0.79 is overly conservative and the basis is unclear. Mazor et al 2016, Table 6 indicates that 52% of sites located in “high activity” areas of the South Coast received CSCI scores of <0.63. Combining “moderate” and “high activity,” 32% of sites in the South Coast were <0.63. A CSCI ≥ 0.79 is considered “possibly altered,” and only 40% of samples in Table 6 met this criterion in the South Coast. For the purposes of developing the §303(d) list the Regional Board should use the category “likely altered” (CSCI≥0.63), which would protect the biologic beneficial use and allow stakeholders to accurately prioritize impaired waterways. Further, the use of the CSCI is not consistent with the policy currently under development at the State Water Resources Control Board for biological objectives and is not explicitly included in the Listing Policy.
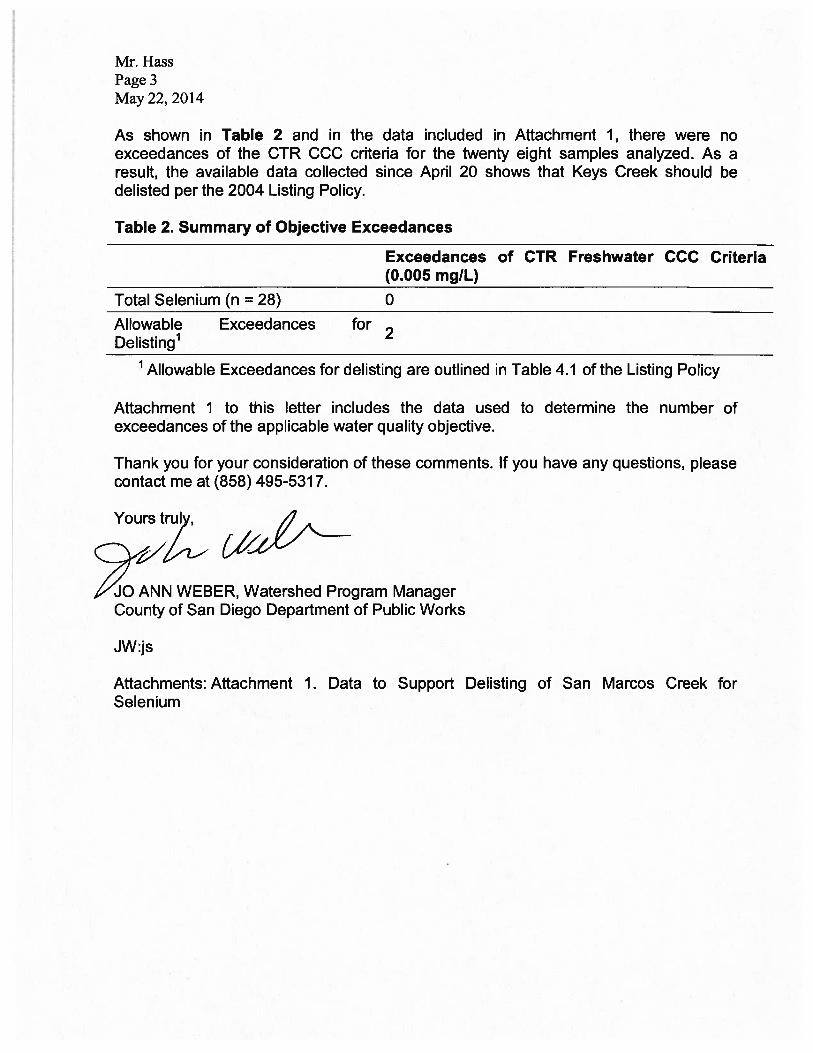
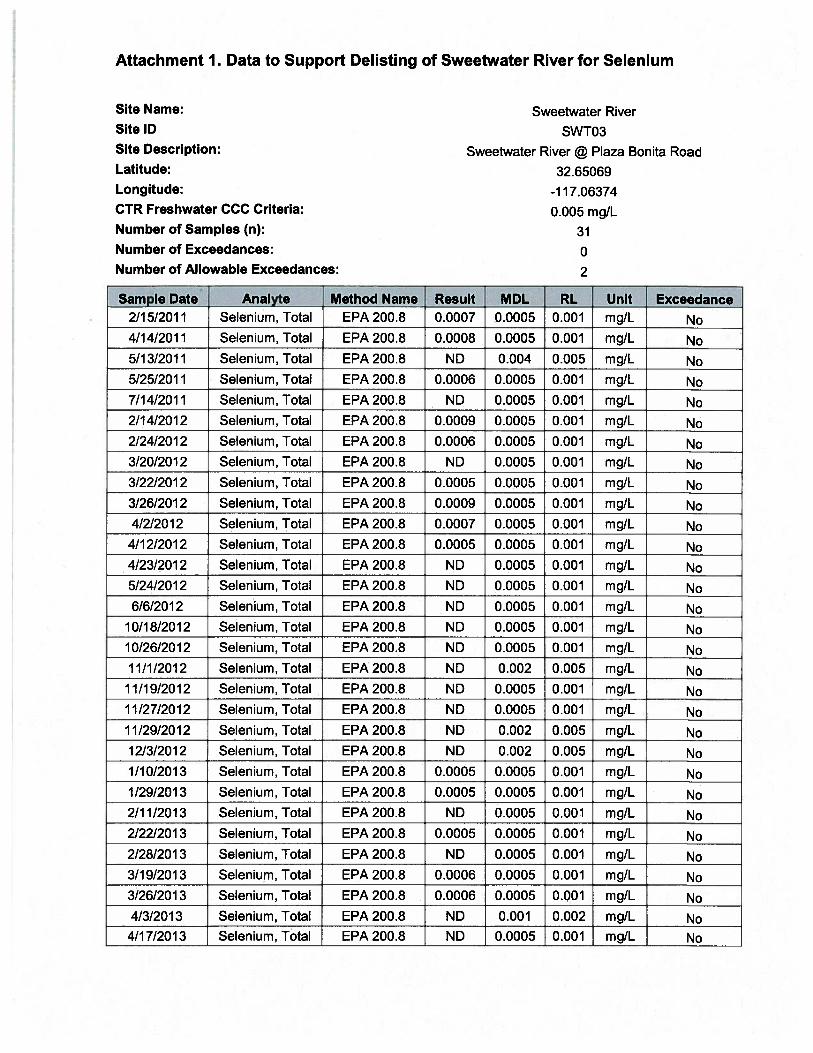
8. Selenium De-Listing Letters not Considered in Draft 2014 303(d) ListIn May 2014, the County of San Diego submitted five comment letters related to the 2010 §303d listings for selenium in five creeks. Additional data were collected by the County of San Diego for use in the de-listing evaluation and compared to the California Toxics Rule (CTR) Freshwater Criterion of 0.005 mg/L. The County requests that these data be considered as part of the 2014 §303(d) list development process.
Specific Comments by Constituent 1. Nitrogen
Numerous pollutant-waterbody combinations were included on the Draft 2014 §303(d) list for total nitrogen based on sample sizes of four or less, with exceedance counts of four or less. Per Table 3.2 of the Listing Policy, the number of exceedances required to list a waterbody for a conventional or other pollutant is at least five. The 14 waterbodies listed below do not meet the listing criteria and should be removed from the 2014 §303(d) list.
Water Body HSA Decision ID LOE Notes
Sandia Creek 902.22 43855 2 of 4 samples exceeded
Santa Margarita River (Upper) 902.22 43136 2 of 4 samples exceeded
Keys Creek 903.12 43330 4 of 4 samples exceeded
Buena Creek 904.32 44287 4 of 4 samples exceeded
Cloverdale Creek 905.32 44129 3 of 3 samples exceeded
Poway Creek 906.2 43500 4 of 4 samples exceeded
Alvarado Creek 907.11 42850 2 of 4 samples exceeded
Forester Creek 907.13 42728 4 of 4 samples exceeded
Los Coches Creek 907.14 43119 4 of 4 samples exceeded
Chocolate Creek 907.33 42678 3 of 3 samples exceeded
Telegraph Canyon Creek 909.11 32905 4 of 4 samples exceeded
Sweetwater River, Upper 909.21 43750 2 of 4 samples exceeded
Poggi Canyon Creek 910.2 43074 3 of 3 samples exceeded
Tecate Creek 911.23 43237 4 of 4 samples exceeded
LOE = Line of Evidence

Ms. Yu 2014 Draft §303(d)/305(b) Integrated Report Comment Letter August 12, 2016 Page 4
Recommendation Remove Sandia Creek, Santa Margarita River (Upper), Keys Creek, Buena Creek, Cloverdale Creek, Poway Creek, Alvarado Creek, Forester Creek, Los Coches Creek, Chocolate Creek, Telegraph Canyon Creek, Sweetwater River (Upper), Poggi Canyon Creek, and Tecate Creek from the Draft 2014 §303(d) List for Total Nitrogen because each waterbody segment has less than the minimum of five samples required by the Listing Policy for conventional and other pollutants. 2. Phosphorus
New pollutant-waterbody combinations were included on the Draft 2014 §303(d) list for total phosphorus based on exceedance counts of four or less. Per Table 3.2 of the Listing Policy, the number of exceedances required to list a waterbody for a conventional or other pollutant is at least five. The 12 waterbodies listed below do not meet the listing criteria and should not be included on the 2014 §303(d) list.
Water Body HSA Decision ID LOE Notes
San Luis Rey River, Upper (East of I-15)
903.12 35149 4 of 4 samples exceeded
Buena Creek 904.32 33504 4 of 4 samples exceeded
Encinitas Creek 904.51 33095 4 of 4 samples exceeded
Reidy Canyon Creek 904.62 32634 2 of 2 samples exceeded
Sutherland Reservoir 905.53 43121 4 of 9 samples exceeded
Forester Creek 907.13 44281 3 of 10 samples exceeded
Los Coches Creek 907.14 44602 2 of 4 samples exceeded
San Vicente Creek 907.22 43874 2 of 5 samples exceeded
Chocolate Creek 907.33 43144 2 of 3 samples exceeded
Otay Reservoir, Lower 910.31 43242 3 of 28 samples exceeded
Tecate Creek 911.23 42788 4 of 4 samples exceeded
Barrett Lake 911.3 42328 4 of 9 s samples exceeded
LOE = Line of Evidence Recommendation Remove San Luis Rey River (Upper), Buena Creek, Encinitas Creek, Reidy Canyon Creek, Sutherland Reservoir, Forester Creek, Los Coches Creek, San Vicente Creek, Chocolate Creek, Otay Reservoir (Lower), Tecate Creek, and Barrett Lake from the Draft 2014 §303(d) List for Total Phosphorus because each waterbody segment has less than the minimum of five samples required by the Listing Policy for conventional and other pollutants. 3. Surfactants
Agua Hedionda Creek, Escondido Creek, and San Diego River (Lower) were listed for surfactants (MBAS) based on one LOE, and each listing referenced the Copermittee monitoring data from 2001 to 2008 as the basis of the listing. Further examination of the available data resulted in the following comments:
Agua Hedionda Creek, Decision ID 47481; the single LOE states that eight of 11 samples collected by the San Diego County Municipal Copermittees (Copermittees) between 2001 and 2008 at AHC-MLS and AHC-TWAS-1 exceeded the criterion for surfactants (MBAS) (0.5 mg/L). According to the latest Copermittee monitoring report (Transitional Monitoring and Assessment Program Report for the Carlsbad Watershed Management Area (2014-2015)), zero of two dry weather and zero of two

Ms. Yu 2014 Draft §303(d)/305(b) Integrated Report Comment Letter August 12, 2016 Page 5
wet weather samples at AHC-TWAS-1 exceeded the criteria between 2001 and October 2010. Additionally, between 2001 and October 2010, zero of three dry weather and zero of 31 wet weather samples collected at AHC-MLS exceeded the criterion. A total of 38 samples were collected between 2001 and October 2010, with zero exceedances of the criterion for surfactants (MBAS). Table 3.2 of the Listing Policy states that a minimum of seven exceedances are needed to list a waterbody for a conventional or other pollutant with 38 samples. These data do not meet the listing criteria for listing Agua Hedionda Creek for surfactants (MBAS).
Escondido Creek, Decision ID 47747; LOE 78020 states that nine of 12 samples collected by the Copermittees between 2001 and 2008 exceeded the criterion for surfactants (MBAS) (0.5 mg/L) at ESC-MLS and ESC-TWAS-1. According to the latest Copermittee monitoring report (Transitional Monitoring and Assessment Program Report for the Carlsbad Watershed Management Area (2014-2015)), zero of two samples exceeded the criterion during dry weather and zero of two samples exceeded the criterion during wet weather at ESC-TWAS-1 between 2001 and October 2010. Additionally, between 2001 and October 2010, zero of three samples exceeded the criterion during dry weather and zero of 22 samples exceeded the criterion during wet weather at ESC-MLS. A total of 29 samples were collected between 2001 and October 2010 in the Escondido subwatershed (904.6) and none of those samples exceeded the criterion for surfactants (MBAS). Table 3.2 of the Listing Policy states that a minimum of five exceedances are needed to list a waterbody for a conventional or other pollutant. These data do not meet the listing criteria for listing Escondido Creek for surfactants (MBAS).
San Diego River (Lower), Decision ID 51367; According to LOE 78088, four wet weather samples were collected at SDR-MLS, and two of those four samples exceeded the criterion of 0.5 mg/L for surfactants (MBAS) between 2001 and 2008. Further examination of the Copermittee monitoring data collected between 2001-2008 and 2008-2010 shows that zero of two samples collected during dry weather (January 2010 and May 2010) and two of 21 samples collected during wet weather (between February 2002 and November 2009) at SDR-MLS exceeded the criterion. A total of two out of 23 samples exceeded the criterion between 2001 and October 2010 (Transitional Monitoring and Assessment Program Report for the San Diego River Watershed Management Area (2014-2015)). Table 3.2 of the Listing Policy states that a minimum of five exceedances are needed to list a waterbody for a conventional or other pollutant. These data do not meet the listing criteria for listing San Diego River (Lower) for surfactants (MBAS).
Recommendations
Recommend removal of Agua Hedionda Creek for surfactants (MBAS) from the Draft 2014 §303(d) list; the total number of exceedances for Agua Hedionda Creek is zero of 38 (AHC-MLS and AHC-TWAS-1).
Recommend removal of Escondido Creek for surfactants (MBAS) from the Draft 2014 §303(d) list; the total number of exceedances for Escondido Creek (ESC-MLS and ESC-TWAS-1) was zero of 29.
Recommend removal of San Diego River (Lower) for surfactants (MBAS) from the Draft 2014 §303(d) list; the total number of exceedances for SDR-MLS was two of 23 samples, which does not meet the criteria for listing.

Ms. Yu 2014 Draft §303(d)/305(b) Integrated Report Comment Letter August 12, 2016 Page 6
4. Chlorpyrifos
Los Peñasquitos Creek and Lower Sweetwater River were placed on the Draft 2014 §303d list for Chlorpyrifos. Both listings were based on the Copermittee data collected between 2001 and 2008. In addition to the Chlorpyrifos results included in the analysis, toxicity at Los Peñasquitos Creek was used as a secondary line of evidence. Re-evaluation of the data available up to October 2010 and to 2015 results in the following findings:
Los Peñasquitos Creek, Decision ID 47517; LOE ID 77794 notes that two exceedances of the Chlorpyrifos criteria were observed from samples collected at LPC-MLS. The two exceedances occurred during wet weather in 2002, and since 2002 there have been no exceedances of the Chlorpyrifos standard (Transitional Monitoring and Assessment Program Report for the Los Peñasquitos Creek Watershed Management Area (2014-2015)) during either wet or dry weather. Re-analysis of wet weather monitoring data collected between 2001 and October 2010 results in two exceedances out of 16 samples, and inclusion of samples collected to 2015 results in two exceedances out of 22 samples. Two dry weather samples were collected in 2007-2008 and one sample in September 2010, and Chlorpyrifos was not detected in any sample. Note that six samples were not included in the analysis because the method reporting limit was greater than the criterion of 0.014 µg/L. Although the Listing Policy does not place a limit on the age of data used in assessments, data over 10 years old are likely not representative of current water quality conditions. Additionally, no exceedances (and no detections) of Chlorpyrifos have been observed since the two exceedances in 2002. See Attachment A for monitoring results. In addition to the LOE based on Chlorpyrifos results, toxicity was also included as a LOE (LOE ID 74173). Seven of 27 results were found to exhibit toxicity; however, no toxicity was observed for the two samples which exceeded the criteria for Chlorpyrifos (November and December 2002). Therefore, based on analysis of Chlorpyrifos and toxicity data, inclusion of Los Peñasquitos Creek on the Draft 2014 §303d list for Chlorpyrifos is not representative of current water quality conditions. Los Peñasquitos Creek should not be included on the 2014 §303d list for Chlorpyrifos.
Sweetwater River (Lower), Decision ID 53457; LOE ID 77930 states that three of 14 samples exceeded the Chlorpyrifos criterion at SR-MLS and SR-TWAS-1 between 2001 and 2008. Re-analysis of available data (Transitional Monitoring and Assessment Program Report for the San Diego Bay Watershed Management Area (2014-2015)) shows that there have been no exceedances of the Chlorpyrifos criterion at SR-MLS or SR-TWAS-1 since 2003. Between 2001 and 2010, three of 16 wet weather samples and zero of two dry weather samples exceeded the criterion at SR-MLS, and zero of two samples for both wet and dry weather exceeded the criterion at SR-TWAS-1 for a total of three out of 22 samples exceeding the Chlorpyrifos criterion. Given the age of the exceedances, it is prudent to consider the available data from 2001 through 2014. During this time period, three of 21 wet weather samples and zero of seven dry weather samples exceeded the criterion at SR-MLS, and zero of six samples exceeded the criterion at SR-TWAS-1 during both wet and dry weather. The total number of exceedances between 2001 and 2014 was three out of 40 samples. This does not meet the criteria for listing presented in Table 3.1 of the Listing Policy. See Attachment A for monitoring results.

Ms. Yu 2014 Draft §303(d)/305(b) Integrated Report Comment Letter August 12, 2016 Page 7
Recommendations
Recommend Los Peñasquitos Creek should not be included on the 2014 §303(d) list for Chlorpyrifos, two of 19 samples exceeded the criterion between 2001 and October 2010; and two of 28 samples exceeded the criterion up to 2015. Additionally, no samples have exceeded or been detected since 2002. Per Section 3.10 item 6 of the Listing Policy, Chlorpyrifos is not expected to exceed the criterion by the next listing cycle and should be removed from the 2014 §303d list.
Recommend Sweetwater River, Lower should not be included on the 2014 §303d list. Three of 22 samples exceed the criterion between 2001 and 2010, however only three of 40 samples exceeded the criterion between 2001 and 2014. Additionally, no exceedances of Chlorpyrifos have been observed in Sweetwater River at the two monitoring stations since 2003. Per Section 3.10 item 6 of the Listing Policy, Chlorpyrifos is not expected to exceed the criterion by the next listing cycle and should be removed from the 2014 §303d list.
5. Diazinon
Diazinon was banned from sale in 2005, and since that time significant decreases in concentrations of this pesticide have been observed in receiving water bodies in San Diego County. Due to the inclusion of data greater than 10 years old in the Draft 2014 §303d list evaluation, the number of exceedances for this pesticide meets listing criteria in some water bodies. However, due to the ban on sales of Diazinon in the past 11 years, evaluation of the data should be limited to data collected since the time of the ban. Additionally, sections 3.10 and 4.10 of the Listing Policy allow for the inclusion of trend evaluation during §303d list development. The following water bodies are currently proposed for listing on the Draft 2014 §303d list for Diazinon; however there have been no exceedances of the criteria for Diazinon since the early 2000’s at any of the stations included in the analysis.
Agua Hedionda Creek, Decision ID 47453; LOE ID 72872 states that nine of 28 samples exceeded the criterion for Diazinon at AHC-MLS and AHC-TWAS-1 between 2001 and 2008. Re-analysis of available data (Transitional Monitoring and Assessment Program Report for the Carlsbad Watershed Management Area (2014-2015)) shows that there have been zero exceedances of the criterion for Diazinon since 2006 at these two monitoring locations (zero of 18 samples during wet and dry weather). Based on the age of the exceedances and significantly decreasing trend results (step six of section 3.10 of the Listing Policy) this pollutant is not likely to exceed the criterion in the future. Therefore, Diazinon should not be included on the 2014 §303d list for Agua Hedionda Creek. See Attachment A for a table of monitoring results.
Escondido Creek, Decision ID 47734; LOE ID 73584 states that five of 35 samples exceeded the criterion for Diazinon at ESC-MLS and ESC-TWAS-1 between 2001 and 2008. Re-analysis of available data (Transitional Monitoring and Assessment Program Report for the Carlsbad Watershed Management Area (2014-2015)) shows that there have been zero exceedances of the criterion for Diazinon since 2003 at these two monitoring locations (zero of 35 samples during wet and dry weather). Based on the age of the exceedances (pre-dating the ban on Diazinon) and significantly decreasing trend results (step six of section 3.10 of the Listing Policy) this pollutant is not likely to exceed the criterion in the future. Therefore, Diazinon should not be included on the 2014 §303d list for Escondido Creek. See Attachment A for a table of monitoring results.

Ms. Yu 2014 Draft §303(d)/305(b) Integrated Report Comment Letter August 12, 2016 Page 8
Los Peñasquitos Creek, Decision ID 47555; LOE ID 74219 states that three of 27 samples exceeded the criterion for Diazinon at LPC-MLS and LPC-TWAS-2 between 2001 and 2008. Re-analysis of available data (Transitional Monitoring and Assessment Program Report for the Los Peñasquitos Creek Watershed Management Area (2014-2015)) shows that there have been zero exceedances of the criterion for Diazinon since 2002 up to 2014 at LPC-MLS (zero of 33 samples during wet and dry weather). LPC-TWAS-2 is located in a separate waterbody and therefore was not included in this reanalysis. Based on the age of the exceedances (pre-dating the ban on Diazinon) and significantly decreasing trend results (step six of section 3.10 of the Listing Policy) this pollutant is not likely to exceed the criterion in the future. Therefore, Diazinon should not be included on the 2014 §303d list for Los Peñasquitos Creek. See Attachment A for a table of monitoring results.
San Diego River (Lower), Decision ID 49392; LOE ID 75599 states that two of 19 samples exceeded the criterion for Diazinon at SDR-MLS between 2001 and 2008. Re-analysis of available data (Transitional Monitoring and Assessment Program Report for the San Diego River Watershed Management Area (2014-2015)) shows that there have been zero exceedances of the criteria for Diazinon since 2002 at this monitoring location (zero of 30 samples during wet and dry weather). Based on the age of the exceedances (pre-dating the ban on Diazinon) and significantly decreasing trend results (step six of section 3.10 of the Listing Policy) this pollutant is not likely to exceed the criterion in the future. Therefore, Diazinon should not be included on the 2014 §303d list for the Lower San Diego River. See Attachment A for a table of monitoring results.
Sweetwater River (Lower), Decision ID 53461; LOE ID 77012 states that five of 27 samples exceeded the criterion for Diazinon at SR-MLS and SR-TWAS-1 between 2001 and 2008. Re-analysis of available data (Transitional Monitoring and Assessment Program Report for the San Diego Bay Watershed Management Area (2014-2015)) shows that there have been zero exceedances of the criterion for Diazinon since 2003 at these two monitoring locations (zero of 38 samples). Based on the age of the exceedances (pre-dating the ban on Diazinon) and significantly decreasing trend results (step six of section 3.10 of the Listing Policy) this pollutant is not likely to exceed the criterion in the future. Therefore, Diazinon should not be included on the 2014 §303d list for the Lower Sweetwater River. See Attachment A for a table of monitoring results.
Recommendations
Recommend Agua Hedionda Creek be removed from the Draft 2014 §303d list due to the ban on the sale of Diazinon, the significantly decreasing trends in Diazinon since 2005, no observed exceedances of Diazinon since 2006 (zero of 18 samples), and the likelihood that Diazinon will not exceed the criterion in the future.
Recommend Escondido Creek be removed from the Draft 2014 §303d list due to the ban on the sale of Diazinon, the significantly decreasing trends in Diazinon since 2005, no observed exceedances of Diazinon since 2003 (zero of 35 samples), and the likelihood that Diazinon will not exceed the criterion in the future.
Recommend Los Peñasquitos Creek, be removed from the Draft 2014 §303d list due to the ban on the sale of Diazinon, the significantly decreasing trends in Diazinon since

Ms. Yu 2014 Draft §303(d)/305(b) Integrated Report Comment Letter August 12, 2016 Page 9
2005, no observed exceedances of Diazinon since 2002 (zero of 33 samples) and the likelihood that Diazinon will not exceed the criterion in the future.
Recommend San Diego River, Lower be removed from the Draft 2014 §303d list due to the ban on the sale of Diazinon, the significantly decreasing trends in Diazinon since 2005, no observed exceedances of Diazinon since 2002 (zero of 30 samples) and the likelihood that Diazinon will not exceed the criterion in the future.
Recommend Sweetwater River, Lower be removed from the Draft 2014 §303d list due to the ban on the sale of Diazinon, the significantly decreasing trends in Diazinon since 2005, no exceedances of Diazinon since 2003 (zero of 38 samples) and the likelihood that Diazinon will not exceed the criterion in the future.
6. Malathion
Five lines of evidence were used as the basis to list Escondido Creek for Malathion (Decision ID 47742) on the Draft 2014 §303d list. One LOE was based on the data collected by the Copermittees from 2001-2008, and one LOE was based on data collected by the County of San Diego between 2003 and 2009. The remaining LOEs compare the same two datasets with a different criterion for Malathion (drinking water standard of 500 µg/L), and one LOE presents toxicity findings from the Copermittee dataset. Based on re-analysis of the Copermittee data ((Transitional Monitoring and Assessment Program Report for the Carlsbad Watershed Management Area (2014-2015)), additional data are available to complete the data analysis from 2001 through October 2010. Below are the findings from this re-analysis.
LOE ID: 73609; the fact sheet states that three of 24 samples exceeded the Malathion criterion during wet and dry weather at ESC-MLS and ESC-TWAS-1 between 2001 and 2008. Inclusion of data up to October of 2010 results in three exceedances out of 26 samples. However, inclusion of data up to 2014 results in a finding of three of 38 samples exceeding the criterion for Malathion (not enough to list, per Table 3.1 of the Listing Policy). In addition, no samples have exceeded the Malathion criterion at the two stations since 2007, and due to the low levels observed since 2007 this pollutant is not likely to exceed the criterion in the future. See Attachment A for a table of monitoring results.
LOE ID: 73610; Zero of seven samples exceeded the criterion for Malathion at two locations in Escondido Creek between 2006 and 2009 (Escondido Creek at El Camino Del Norte and Escondido Creek at East Country Club Drive).
LOE ID: 73566; Toxicity was observed in seven of 27 samples collected as part of the County of San Diego Copermittee monitoring program between 2001 and 2008. Further examination of the data available up to October 2010 shows that although toxicity was observed in some samples, Malathion levels were below the detection limit when toxicity was observed during dry weather at ESC-MLS, and no toxicity was observed during wet weather when Malathion levels were above the criterion (i.e., Malathion levels were below the detection limit when toxicity was observed during wet weather). See Attachment A for a table of monitoring results.
Recommendation Based on the findings above, it is recommended that the listing for Malathion at Escondido Creek be removed from the Draft 2014 §303d list because no exceedances have been observed since 2007. Although three of 26 samples exceeded the criterion between 2001 and 2010, the number of exceedances does not warrant a listing using the dataset available up to

Ms. Yu 2014 Draft §303(d)/305(b) Integrated Report Comment Letter August 12, 2016 Page 10
2014 (three of 38 samples). In addition, the pollutant is not likely to exceed the criterion based on historical monitoring results and trend patterns, and no toxicity was associated with exceedances of Malathion in the sampling results. 7. Toxicity
Santa Margarita River (Lower), Decision ID: 43103. Six LOEs are included as the basis for inclusion of the Lower Santa Margarita River on the 2014 §303d list for toxicity. Of the six LOEs, two reference data collected in the Santa Margarita Lagoon (LOE ID 76545 and 72834) which should not be included in the listing assessment for the Lower Santa Margarita River, as they are located in a downstream waterbody. Of the four remaining LOEs, two are for sediment and two are for water.
LOEs 76546 and 30287 present sediment samples collected as part of the Surface Water Ambient Monitoring Program (SWAMP), and no toxicity is exhibited for either set of samples. Therefore, sediment toxicity should not be included on the 2014 §303d list for the Lower Santa Margarita River.
LOEs 76544 and 7501 do indicate toxicity at a frequency that would cause the Lower Santa Margarita River to be listed for toxicity. Therefore, the Lower Santa Margarita River §303d listing should be revised to indicate impairment for water toxicity only, and the sediment toxicity listing should be removed.
San Diego River (Lower), Decision ID 51375. Four LOEs were used as the basis of the listing for toxicity in the Lower San Diego River. Of the four LOEs, one (LOE ID 75571) is for sediment collected as part of Bight ’08 and should not be included in the evaluation (as the data were collected in the San Diego River Estuary, and not the freshwater lower San Diego River). The other three LOEs are based on toxicity in water. However, LOEs 25293 and 75570 are presenting the same data separately and counting the results twice. LOE 25293 is based on the Copermittee data presented in the San Diego County Municipal Copermittees Urban Runoff Monitoring Report, 2007. LOE 745570 is based on a longer time-range of the same dataset (2001-2008). The first LOE (25293) should be removed. The revised total exceedance count should be six of 23 water samples exhibiting toxicity, not eight of 38.
Recommendations
Recommend that reference to sediment toxicity in the Lower Santa Margarita River be removed from Decision ID 43103 because the samples included in the analysis are downstream of the waterbody (LOE 76545 and 72834) and no sediment toxicity is observed for LOE 76546 and 30287.
Recommend that the reference to sediment toxicity be removed from the San Diego River (Lower) Decision ID51375 because LOE 75571 was based on data collected from the San Diego River estuary (downstream of the waterbody in this Decision ID). No other LOEs were included in the Decision ID referencing sediment toxicity.
Recommend revision of the assessment results for San Diego River (Lower); should be revised to six of 23 water samples exhibiting toxicity, not eight of 38.
8. Benthic Community Effects
Numerous listings for benthic community were added to the Draft 2014 §303d list. The following two listings did not meet the threshold for listing based on Table 3.2 of the Listing Policy, which states that greater than or equal to five samples must be below the CSCI threshold of 0.79 to list the water bodies. All LOEs are assessed for the Santa Margarita River (Lower) Decision ID in this comment letter as a specific example of how toxicity and

Ms. Yu 2014 Draft §303(d)/305(b) Integrated Report Comment Letter August 12, 2016 Page 11
Chlorpyrifos LOEs were used in the listing assessment without consideration of temporal and seasonal requirements necessary to conduct the data analysis. For example, Chlorpyrifos exceedances from 2003 during wet weather are not likely indicative of the potential for beneficial use impairments during dry weather in 2007 collection of BMI data. Additionally, as stated in the general comments, the use of total nitrogen and total phosphorus LOEs does not support benthic community listings in general.
Santa Margarita River (Lower) Decision ID: 49149 is based on nine LOEs: o LOE ID: 79700 states that two of six CSCI scores were below a threshold of
0.79. The Listing Policy states, per Table 3.2, that a minimum of five exceedances are required to list a water body for a conventional or other pollutant. Further, the LOE states that “more recent data from the Stormwater Monitoring Condition was not included in this listing cycle but confirms this listing.” Examination of SMC data collected after 2008 shows that no samples have been collected downstream of Deluz Creek. All samples have been collected upstream of Deluz Creek, which is considered Santa Margarita River, Upper. Of the samples collected for both the SMC program and National Pollutant Discharge Elimination System (NPDES) program upstream of Deluz Creek, all CSCI results are above the threshold of 0.79.
o LOE ID: 76471 notes that seven of eight bioassessment samples collected at SMR-CP as part of the County of San Diego Copermittee program had IBI results of less than 40. The Integrated Report notes that the CSCI will be used to determine whether or not benthic community impairment is occurring, because the index more accurately compares observed benthic community results to “reference” conditions. The use of the IBI score should not be used as a LOE to assess benthic community impairment, as a better measure has been adopted (CSCI).
o LOE ID: 77848 includes an assessment of Chlorpyrifos data collected at SMR-MLS. Note that the data used in the assessment, and the samples that exceeded the Chlorpyrifos criterion, were collected during wet weather sampling. Bioassessment occurs during dry weather. During dry weather sampling at SMR-MLS, no exceedances of the Chlorpyrifos criterion were observed. This LOE does not support a benthic community listing for Santa Margarita River, Lower.
o LOE ID: 7497 states that 5 of 6 samples at SMR-MLS exceeded the criterion of 1 mg/L for total nitrogen. Note that total nitrogen, in and of itself, does not cause toxicity. Nitrate and nitrite do have the potential to cause toxicity, but were not observed at levels above Basin Plan objectives at SMR-MLS during either wet or dry weather. Total nitrogen is an indication of the potential for eutrophication, which could cause benthic impairments. However, total nitrogen does not directly impact the benthic community, and therefore does not support a benthic community listing for Santa Margarita River, Lower.
o LOE ID 7498 states that three of five samples exceeded the criterion for total nitrogen at SMR-MLS. As noted in comments for LOE ID 7497, total nitrogen does not itself cause toxicity. This LOE does not support listing for benthic community at Santa Margarita River, Lower.
o LOE ID: 7501 includes an assessment of toxicity results collected in 2003 at station Santa Margarita 10 as part of the SWAMP program. One of three results showed toxicity, but no toxicity identification evaluation (TIE) was conducted to determine the pollutant causing the toxicity. There is no direct
Ms. Yu 2014 Draft §303(d)/305(b) Integrated Report Comment Letter August 12, 2016 Page 12
link between toxicity observed at this station and any benthic community results, as the data were not collected at the same time.
o LOE ID: 76544 presents the toxicity results from SMR-MLS collected as part of the County of San Diego Copermittee program. Five of 11 samples exhibited toxicity, however the five samples with toxicity were collected during wet weather, and bioassessment is conducted during dry weather. There is no evidence that wet weather toxicity directly affects the bioassessment community during the dry season. Therefore, this LOE does not support a listing for benthic community at Santa Margarita River, Lower.
o LOE ID: 7500 notes that five of five samples collected during 2003 as part of the County of San Diego Copermittees monitoring program at SMR-MLS exceeded the total phosphorus water quality criterion of 0.1 mg/L. Total phosphorus is not a toxicant, and does not directly cause toxicity to the benthic community. Note that total phosphorus can contribute to harmful algal blooms and other water quality issues that may indirectly affect benthic community health, but total phosphorus does not directly degrade the benthic community. Therefore, this LOE does not support a listing for benthic community at Santa Margarita River, Lower.
o LOE ID: 7499 presents the same data as LOE ID 7500 (County of San Diego Copermittee dataset), with an additional year of monitoring. Recommend that LOE ID 7500 be dropped. See comments presented in LOE 7500, total phosphorous does not directly impact the benthic community, and therefore this LOE does not support a listing for benthic community at Santa Margarita River, Lower.
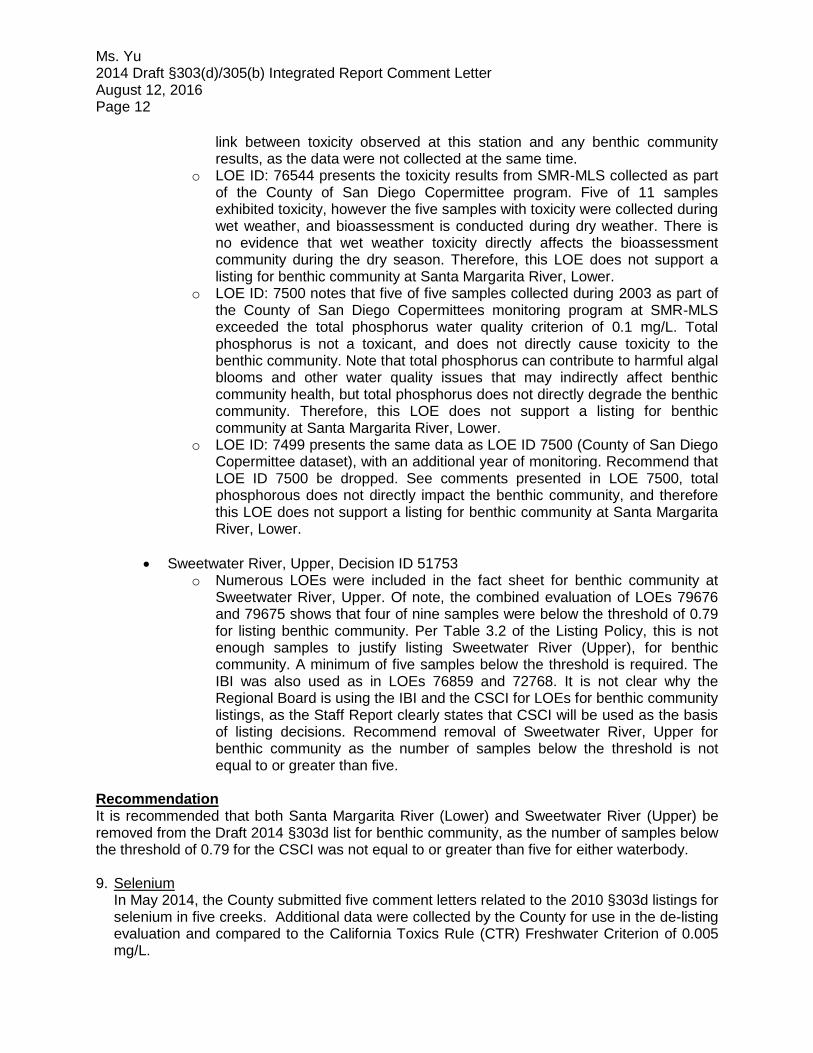
Sweetwater River, Upper, Decision ID 51753 o Numerous LOEs were included in the fact sheet for benthic community at
Sweetwater River, Upper. Of note, the combined evaluation of LOEs 79676 and 79675 shows that four of nine samples were below the threshold of 0.79 for listing benthic community. Per Table 3.2 of the Listing Policy, this is not enough samples to justify listing Sweetwater River (Upper), for benthic community. A minimum of five samples below the threshold is required. The IBI was also used as in LOEs 76859 and 72768. It is not clear why the Regional Board is using the IBI and the CSCI for LOEs for benthic community listings, as the Staff Report clearly states that CSCI will be used as the basis of listing decisions. Recommend removal of Sweetwater River, Upper for benthic community as the number of samples below the threshold is not equal to or greater than five.
Recommendation It is recommended that both Santa Margarita River (Lower) and Sweetwater River (Upper) be removed from the Draft 2014 §303d list for benthic community, as the number of samples below the threshold of 0.79 for the CSCI was not equal to or greater than five for either waterbody. 9. Selenium
In May 2014, the County submitted five comment letters related to the 2010 §303d listings for selenium in five creeks. Additional data were collected by the County for use in the de-listing evaluation and compared to the California Toxics Rule (CTR) Freshwater Criterion of 0.005 mg/L.

Ms. Yu 2014 Draft §303(d)/305(b) Integrated Report Comment Letter August 12, 2016 Page 13
The results are as follows:
Keys Creek: 0 of 28 samples exceeded the criterion
San Marcos Creek: 0 of 31 samples exceeded the criterion
Escondido Creek: 0 of 32 samples exceeded the criterion
Los Coches Creek: 0 of 31 samples exceeded the criterion
Lower Sweetwater River: 0 of 31 samples exceeded the criterion The original letters are included as Attachment B to this comment letter. The data used as the basis of the de-listing evaluations are included in each letter. Recommendation It is recommended that Keys Creek, San Marcos Creek, Escondido Creek, Los Coches Creek, and Lower Sweetwater River be removed from the Draft 2014 §303d list for selenium, as data collected in each creek support de-listing based on California’s Listing Policy. We thank you in advance for your consideration of our comments. If you have any questions or require additional information, please feel free to contact Jo Ann Weber at (858) 495-5317 or e-mail at [email protected]. Sincerely,
TODD E. SNYDER, LUEG Program Manager Watershed Protection Program Attachments: Database to support delisting recommendations
County of San Diego Selenium Delisting letters

Dry Weather Historical Monitoring Table for AHC-TWAS-1
2008-2009 2009-2010 2010-2011 2011-2012 2012-2013 2013-2014 2014-2015
09/18/07-09/19/07
05/13/08-05/14/08 - - - - - - -
Physical Chemistry2007, 2013 pH pH units 6.5-9.0 1. Basin Plan 7.93 8.01 0% NA1
2007, 2013 Specific Conductivity µmhos/cm NA 2,610 1,8442007, 2013 Water Temperature Celsius NA 19.60 17.002007, 2013 Turbidity NTU 20 1. Basin Plan <2 1.2J 0% NA1
Bacteriological2007, 2013 Enterococcus MPN/100 mL 151 (a) 1. Basin Plan 40 260 50% NA1
2007, 2013 Fecal Coliform MPN/100 mL 400 1.Basin Plan REC-1/REC-2 300 2,300 50% NA1
2007, 2013 Total Coliform MPN/100 mL NA 3,000 2,300Nutrients2007, 2013 Ammonia as N mg/L (b) 6. USEPA Water Quality Criteria (Freshwater) 0.02J <0.03 0% NA1
2007, 2013 Nitrate as N mg/L 10 1. Basin Plan 0.11 5.6 0% NA1
2007, 2013 Nitrite as N mg/L 1 1. Basin Plan <0.05 <0.05 0% NA1
2007, 2013 Total Kjeldahl Nitrogen mg/L NA 0.56 0.982007, 2013 Total Nitrogen (calculated) mg/L 1 1. Basin Plan 0.67 6.62 50% NA1
2007 Dissolved Phosphorus mg/L 0.1 1. Basin Plan 0.11 0.11 100% NA1
2007, 2013 Total Phosphorus mg/L 0.1 1. Basin Plan 0.1 0.11 50% NA1
General Chemistry2007 Biochemical Oxygen Demand mg/L 10 8. McNeeley (1979) <2 <2 0% NA1
2007 Chemical Oxygen Demand mg/L 120 4. MSGP 2015 13 14 0% NA1
2007, 2013 Dissolved Organic Carbon mg/L NA 4.9 5.82007, 2013 Total Organic Carbon mg/L NA 6 5.72007 Oil and Grease mg/L 10 1. Basin Plan, 3. Anacostia River TMDL 1.7J <5 0% NA1
2007, 2013 Surfactants (MBAS) mg/L 0.5 1. Basin Plan 0.049 0.055 0% NA1
2007, 2013 Total Dissolved Solids mg/L 500 (c) 1. Basin Plan 1,460 1,438 100% NA1
2007, 2013 Total Suspended Solids mg/L 58 14. NSQD, 1. Basin Plan 3.2J 1.7J 0% NA1
2007, 2013 Total Hardness mg CaCO3/L NA 453.6 492.4Total Metals2007 Antimony mg/L 0.006 (d) 1. Basin Plan 0.0003J 0.0003J 0% NA1
2007, 2013 Arsenic mg/L 0.01 (d) 1. Basin Plan 0.0027 0.0032 0% NA1
2007, 2013 Cadmium mg/L 0.005 (d) 1. Basin Plan <0.0004 <0.0004 0% NA1
2007, 2013 Chromium mg/L 0.05 (d) 1. Basin Plan 0.0001J 0.0001J 0% NA1
2007, 2013 Copper mg/L 1.0 (d) 1. Basin Plan 0.0015 0.0019 0% NA1
2007, 2013 Lead mg/L NA 0.00006J 0.00006J2007, 2013 Nickel mg/L 0.1 (d) 1. Basin Plan 0.0025 0.0022 0% NA1
2007, 2013 Selenium mg/L 0.005 16. 40 CFR 131.38 0.0002J 0.0007 0% NA1
2007, 2013 Zinc mg/L 5.0 (d) 1. Basin Plan 0.0034 0.0038 0% NA1
Dissolved Metals2007 Antimony mg/L 0.006 1. Basin Plan 0.0003J 0.0003J 0% NA1
2007, 2013 Arsenic mg/L 0.34 acute /0.15 chronic 16. 40 CFR 131.38 0.0029 0.0031 0% NA1
2007, 2013 Cadmium mg/L (e) 16. 40 CFR 131.38 <0.0004 <0.0004 0% NA1
2007, 2013 Chromium mg/L (e) 16. 40 CFR 131.38 0.0001J <0.0005 0% NA1
2007, 2013 Copper mg/L (e) 16. 40 CFR 131.38 0.0012 0.0017 0% NA1
2007, 2013 Lead mg/L (e) 16. 40 CFR 131.38 <0.0001 <0.0001 0% NA1
2007, 2013 Nickel mg/L (e) 16. 40 CFR 131.38 0.0024 0.0021 0% NA1
2007, 2013 Selenium mg/L NA 0.0002J 0.00072007, 2013 Zinc mg/L (e) 16. 40 CFR 131.38 0.0023 0.0031 0% NA1
Organophosphorus Pesticides
2007, 2013 Chlorpyrifos µg/L 0.02 acute / 0.014 chronic 12. CA Dept. of Fish & Game, 2000 <0.002 <0.002 0% NA1
2007, 2013 Diazinon µg/L 0.08 acute / 0.05 chronic
12. CA Dept. of Fish & Game, 2000, 11. Chollas Creek TMDL for Diazinon, 10. USEPA, Aquatic Life Ambient
Water Quality Criteria Diazinon<0.004 0.0031J 0% NA1
2007, 2013 Malathion µg/L 0.43 acute /0.1 chronic 13. CA Dept. of Fish & Game, 1998, 5. Goldbook <0.006 <0.006 0% NA1
Toxicity2007, 2013 Ceriodaphnia 96-hr LC50 (%) >100 >100 >100 0% NA1
2007, 2013 Ceriodaphnia 7-day survival NOEC (%) 100 100 100 0% NA1
2007, 2013 Ceriodaphnia 7-day reproduction NOEC (%) 100 100 100 0% NA1
2007 Hyalella 96-hr LC50 (%) >100 >100 >100 0% NA1
2007, 2013 Selenastrum 96-hr NOEC (%) 100 50 100 50% NA1
See last page for footnotes and source references.
Frequency Above
BenchmarksAnalyte Mean Ratio to
Benchmarks
No
Sam
ples
Col
lect
ed
No
Sam
ples
Col
lect
ed
No
Sam
ples
Col
lect
ed
No
Sam
ples
Col
lect
ed
No
Sam
ples
Col
lect
ed
No
Sam
ples
Col
lect
ed
Historical Monitoring Data Transitional Monitoring
No
Sam
ples
Col
lect
ed
2007-2008Permit Requirement Units Water Quality
Benchmarks Benchmark References

Dry Weather Historical Monitoring Table for AHC-TWAS-1
Blank spaces have been verified and no data is available.
NA indicate no criteria or published value was available or applicable to the matrix or program.
(b) Water Quality Benchmark is based on CMC (salmonids absent) and CCC (early life stages present) using water temperature and pH described in the U.S. EPA, 1999 Update of Ambient Water Quality Criteria for Ammonia, EPA-822-R-99-014, December 1999.(c) Water Quality Benchmark are based on the San Diego Regional Water Quality Control Plan by watershed for the San Diego Region (Basin Plan), 1994 (with amendments effective on or before April 4, 2011) and may vary by hydrologic area.(d) Water Quality Benchmark for total metals is based on the MUN beneficial use as described in the Basin Plan, 1994 (with amendments effective on or before April 4, 2011).
J-Analyte was detected at a concentration below the reporting limit and above the method detection limit. Reported value is estimated.NA1 Three or more years of data required to calculate the Mean Ratio to Benchmark.
SourcesPlease refer to the San Diego County Copermittee Regional Monitoring Program Benchmark Sources in Attachment B to Appendix A for benchmark source citations.
(e) Water Quality Benchmark for dissolved metal fractions are based on total hardness and are calculated as described by the USEPA Federal Register Doc. 40 CFR Part 131, May 18, 2000. The Criteria Maximum Concentration (CMC) and Continuous Criteria Concentration (CCC) were used.
(a) Water Quality Benchmark for Enterococcus is based on the maximum criteria for infrequently used freshwater area by the San Diego Regional Water Quality Control Plan for the San Diego Region (Basin Plan), 1994 (with amendments effective on or before April 4, 2011).
Values with red bold font and shading do not meet Water Quality Benchmarks.

Dry Weather Historical Monitoring Table for AHC-MLS
2008-2009 2009-2010 2011-2012 2013-2014
09/18/07-09/19/07
05/13/08-05/14/08 - - 09/14/10-
09/15/1005/09/11-05/10/11 - 09/05/12-
09/06/1205/14/13 - 05/15/13 - 09/10/14 05/13/15
Physical Chemistry2007, 2013 pH pH units 6.5-9.0 1. Basin Plan 7.73 8.49 8.08 8.13 7.63 7.82 8.06 8.06 0% 0.232007, 2013 Specific Conductivity µmhos/cm NA 3,480 3,390 3,530 3,140 3,990 3,040 4397 34872007, 2013 Water Temperature Celsius NA 20.70 23.00 26.00 19.80 24.4 25.3 28.59 22.652007, 2013 Turbidity NTU 20 1. Basin Plan 3.1 1.2J 1.3 0.61 0.91 1.8 2.2 2.2 0% 0.08Bacteriological2007, 2013 Enterococcus MPN/100 mL 151 (a) 1. Basin Plan 300 300 800 500 1,700 230 ≤78AE 2200 88% 5.062007, 2013 Fecal Coliform MPN/100 mL 400 1.Basin Plan REC-1/REC-2 500 1,300 1,300 230 300 800 2200 500 75% 2.232007, 2013 Total Coliform MPN/100 mL NA 3,000 2,800 11,000 3,000 3,000 1,700 4900 2400Nutrients2007, 2013 Ammonia as N mg/L (b) 6. USEPA Water Quality Criteria (Freshwater) 0.03J <0.03 <0.1 <0.1 0.048J 0.064J <0.10 <0.10 0% 0.052007, 2013 Nitrate as N mg/L 10 1. Basin Plan 0.21 0.8 0.44 0.97 0.091J 0.31 0.15 0.36 0% 0.042007, 2013 Nitrite as N mg/L 1 1. Basin Plan <0.05 <0.05 0.019J 0.017J <0.1 0.014J 0.051J 0.019J 0% 0.032007, 2013 Total Kjeldahl Nitrogen mg/L NA 0.7 0.7 0.34 0.41 0.42 0.12 0.41 0.242007, 2013 Total Nitrogen (calculated) mg/L 1 1. Basin Plan 0.91 1.5 0.799 1.397 0.511 0.444 0.611 0.619 25% 0.852007 Dissolved Phosphorus mg/L 0.1 1. Basin Plan 0.02J 0.05 0.0061J 0.023 0.024 0.03 0.0071J 0.02 0% 0.232007, 2013 Total Phosphorus mg/L 0.1 1. Basin Plan 0.02J 0.033J 0.0069J 0.028 0.028 0.038 0.046 0.023 0% 0.28General Chemistry2007 Biochemical Oxygen Demand mg/L 10 8. McNeeley (1979) <2 <2 0.58J 1.3J 1.5J 0.84J <2.0 <2.0 0% 0.102007 Chemical Oxygen Demand mg/L 120 4. MSGP 2015 12 19 9.4 29 17 3.7J 18 17 0% 0.132007, 2013 Dissolved Organic Carbon mg/L NA 4.2 5.2 2.4 3.6 3.2 2.1 3.3 3.22007, 2013 Total Organic Carbon mg/L NA 5.1 9 2.6 3.5 2.5 2.3 3.6 3.12007 Oil and Grease mg/L 10 1. Basin Plan, 3. Anacostia River TMDL <5 <5 <5 <5 1.9J <5 <5.0 <5.0 0% 0.242007, 2013 Surfactants (MBAS) mg/L 0.5 1. Basin Plan 0.044 0.041 0.033J 0.031J 0.048J 0.11 0.054 0% 0.102007, 2013 Total Dissolved Solids mg/L 500 (c) 1. Basin Plan 1,900 2,076 2,200 2,200 2,500 2,200 2800 2200 100% 4.522007, 2013 Total Suspended Solids mg/L 58 14. NSQD, 1. Basin Plan 7.5 2J 1 2 2 3 3 2 0% 0.052007, 2013 Total Hardness mg CaCO3/L NA 531.4 548.7 1,100 1,000 1,100 989 1320 1090Total Metals2007 Antimony mg/L 0.006 (d) 1. Basin Plan 0.0002J 0.0002J 0.0001J 0.00019J 0.00008J 0.00018J 0.000095J 0.00020J 0% 0.032007, 2013 Arsenic mg/L 0.01 (d) 1. Basin Plan 0.0041 0.0046 0.0028 0.0034 0.0032 0.0029 0.0025 0.0022 0% 0.322007, 2013 Cadmium mg/L 0.005 (d) 1. Basin Plan <0.0004 <0.0004 0.000028J 0.000042J 0.00007J 0.00011 <0.00010 <0.00010 0% 0.022007, 2013 Chromium mg/L 0.05 (d) 1. Basin Plan 0.0002J 0.0005 0.00013J 0.00011J <0.0002 0.00019J 0.000098J 0.00013J 0% 0.002007, 2013 Copper mg/L 1.0 (d) 1. Basin Plan 0.002 0.001 0.00072 0.0017 0.00029J 0.0018 0.00061 0.0021 0% 0.002007, 2013 Lead mg/L NA <0.0001 <0.0001 0.000035J 0.00009J 0.00008J 0.000054J 0.000037J <0.000202007, 2013 Nickel mg/L 0.1 (d) 1. Basin Plan 0.0025 0.0031 0.0033 0.0049 0.002 0.0069 0.0022 0.0067 0% 0.042007, 2013 Selenium mg/L 0.005 16. 40 CFR 131.38 0.0008 0.0015 0.00075 0.00076 0.00055 0.0016 0.00033J 0.0024 0% 0.222007, 2013 Zinc mg/L 5.0 (d) 1. Basin Plan 0.01 0.001 0.0014J 0.002J 0.0036J 0.0022J 0.0015J 0.0018J 0% 0.00Dissolved Metals2007 Antimony mg/L 0.006 1. Basin Plan 0.0002J 0.0002J 0.000098J 0.00018J 0.00008J 0.00017J 0.00011J 0.00021J 0% 0.03
2007, 2013 Arsenic mg/L 0.34 acute /0.15 chronic 16. 40 CFR 131.38 0.0039 0.0044 0.0028 0.0034 0.003 0.0025 0.0023 0.002 0% 0.02
2007, 2013 Cadmium mg/L (e) 16. 40 CFR 131.38 <0.0004 <0.0004 0.000029J 0.000043J 0.00007J 0.000084J <0.00010 <0.00010 0% 0.012007, 2013 Chromium mg/L (e) 16. 40 CFR 131.38 0.0001J 0.0001J 0.000042J 0.000051J <0.0002 0.000073J 0.000034J 0.000074J 0% 0.002007, 2013 Copper mg/L (e) 16. 40 CFR 131.38 0.0011 0.0012 0.00097 0.0018 0.00039J 0.0016 0.00059 0.0025 0% 0.042007, 2013 Lead mg/L (e) 16. 40 CFR 131.38 <0.0001 <0.0001 0.000034J 0.000023J 0.00006J <0.0002 0.000045J <0.00020 0% 0.012007, 2013 Nickel mg/L (e) 16. 40 CFR 131.38 0.0023 0.003 0.0037 0.0048 0.002 0.0065 0.0022 0.0069 0% 0.022007, 2013 Selenium mg/L NA 0.0008 0.0015 0.00068 0.00074 0.00053 0.0014 0.00031J 0.00252007, 2013 Zinc mg/L (e) 16. 40 CFR 131.38 0.0034 0.0008 0.0017J 0.0025J 0.0035J 0.0025J 0.0014J 0.0022J 0% 0.01Organophosphorus Pesticides
2007, 2013 Chlorpyrifos µg/L 0.02 acute / 0.014 chronic 12. CA Dept. of Fish & Game, 2000 <0.002 <0.002 <0.01 <0.01 <0.01 <0.01 <0.010 <0.010 0% 0.29
2007, 2013 Diazinon µg/L 0.08 acute / 0.05 chronic
12. CA Dept. of Fish & Game, 2000, 11. Chollas Creek TMDL for Diazinon, 10. USEPA, Aquatic Life Ambient
Water Quality Criteria Diazinon<0.004 <0.004 <0.01 <0.01 <0.01 <0.01 <0.010 <0.010 0% 0.09
2007, 2013 Malathion µg/L 0.43 acute /0.1 chronic 13. CA Dept. of Fish & Game, 1998, 5. Goldbook <0.006 <0.006 <0.01 <0.01 <0.01 <0.01 <0.010 <0.010 0% 0.05
Toxicity2007, 2013 Ceriodaphnia 96-hr LC50 (%) >100 >100 >100 >100 >100 >100 >100 >100 >100 0% 1.002007, 2013 Ceriodaphnia 7-day survival NOEC (%) 100 100 100 100 100 100 100 100 100 0% 1.002007, 2013 Ceriodaphnia 7-day reproduction NOEC (%) 100 50 100 50 <6.25CF 50 100 50 <25 71% 2.002007 Hyalella 96-hr LC50 (%) >100 >100 >100 >100 >100 >100 >100 >100 >100 0% 1.002007, 2013 Selenastrum 96-hr NOEC (%) 100 6.25 100 100 50 50 100 50 50 63% 3.38See last page for footnotes and source references.
Permit Requirement 2014-2015
Frequency Above
BenchmarksAnalyte Units Water Quality
Benchmarks Benchmark References 2007-2008 2010-2011
Historical Monitoring Data Transitional Monitoring
Mean Ratio to Benchmarks
No
Sam
ples
Col
lect
ed
No
Sam
ples
Col
lect
ed
No
Sam
ples
Col
lect
ed
No
Sam
ples
Col
lect
ed
2012-2013

Dry Weather Historical Monitoring Table for AHC-MLS
Blank spaces have been verified and no data is available.
NA indicate no criteria or published value was available or applicable to the matrix or program.
(c) Water Quality Benchmark are based on the San Diego Regional Water Quality Control Plan by watershed for the San Diego Region (Basin Plan), 1994 (with amendments effective on or before April 4, 2011) and may vary by hydrologic area.(d) Water Quality Benchmark for total metals is based on the MUN beneficial use as described in the Basin Plan, 1994 (with amendments effective on or before April 4, 2011).
AE - Analysis error.CF-Control failed; results not used in assessment.J-Analyte was detected at a concentration below the reporting limit and above the method detection limit. Reported value is estimated.NR -Sampling of this analyte not required for transitional monitoring (RWQCB Order No. R9-2007-0001) and/or for long term monitoring (RWQCB Order No. R9-2013-0001).
SourcesPlease refer to the San Diego County Copermittee Regional Monitoring Program Benchmark Sources in Attachment B to Appendix A for benchmark source citations.
(b) Prior to the 2014-2015 monitoring year, Water Quality Benchmark was calculated based on CMC (salmonids absent) and CCC (early life stages present) using water temperature and pH described in the U.S. EPA, 1999 Update of Ambient Water Quality Criteria for Ammonia, EPA-822-R-99-014, December 1999. For 2014-2015 monitoring year, Water Quality Benchmark CMC and CCC were calculated based on pH and water temperature (when applicable) as described in the U.S. EPA, 2013 Aquatic Life Ambient Water Quality Criteria for Ammonia - Freshwater, EPA-822-R-13-001, April 2013.
(e) Water Quality Benchmark for dissolved metal fractions are based on total hardness and are calculated as described by the USEPA Federal Register Doc. 40 CFR Part 131, May 18, 2000. The Criteria Maximum Concentration (CMC) and Continuous Criteria Concentration (CCC) were used.
(a) Water Quality Benchmark for Enterococcus is based on the maximum criteria for infrequently used freshwater area by the San Diego Regional Water Quality Control Plan for the San Diego Region (Basin Plan), 1994 (with amendments effectiveon or before April 4, 2011).
Values with red bold font and shading do not meet Water Quality Benchmarks.

Dry Weather Historical Monitoring Table for BVC-TWAS-1
2008-2009 2009-2010 2011-2012 2013-2014
09/18/07-09/19/07
05/13/08-05/14/08 - - 09/14/10-
09/15/1005/09/11-05/10/11 - 09/05/12-
09/06/1205/01/13-05/02/13 - 09/10/15 05/13/15
Physical Chemistry2007, 2013 pH pH units 6.5-9.0 1. Basin Plan 7.97 8.65 8.35 8.23 7.62 8.04 7.95 8.18 0% 0.332007, 2013 Specific Conductivity µmhos/cm NA 2,620 19 2,430 1,913 2,540 1,984 2,651 2,1222007, 2013 Water Temperature Celsius NA 20.80 20.20 19.10 20.80 22.3 18.8 23.07 17.512007, 2013 Turbidity NTU 20 1. Basin Plan 3 4 0.85 3.2 1.2 2 2 2.4 0% 0.12Bacteriological2007, 2013 Enterococcus MPN/100 mL 151 (a) 1. Basin Plan 1,100 80 130 80 900 300 ≤330AE 3,400 63% 5.232007, 2013 Fecal Coliform MPN/100 mL 400 1.Basin Plan REC-1/REC-2 80 80 130 130 170 170 790 1,100 25% 0.832007, 2013 Total Coliform MPN/100 mL NA 8,000 13,000 5,000 2,300 3,000 30,000 13,000 2,200Nutrients2007, 2013 Ammonia as N mg/L (b) 6. USEPA Water Quality Criteria (Freshwater) 0.03J 0.1 <0.1 <0.1 <0.1 <0.1 <0.10 <0.10 0% 0.052007, 2013 Nitrate as N mg/L 10 1. Basin Plan 0.53 1.3 0.58 1.7 0.32 0.24 0.11 0.11 0% 0.062007, 2013 Nitrite as N mg/L 1 1. Basin Plan <0.05 <0.05 <0.1 <0.1 <0.1 <0.15 0.030J <0.10 0% 0.042007, 2013 Total Kjeldahl Nitrogen mg/L NA 0.98 1.1 0.28 0.41 0.54 0.75 0.26 0.512007, 2013 Total Nitrogen (calculated) mg/L 1 1. Basin Plan 1.51 2.40 0.86 2.11 0.86 0.99 0.4 0.62 38% 1.222007 Dissolved Phosphorus mg/L 0.1 1. Basin Plan 0.1 0.07 0.029 0.065 0.032 0.058 0.054 0.081 0% 0.612007, 2013 Total Phosphorus mg/L 0.1 1. Basin Plan 0.09 0.07 0.028 0.074 0.041 0.065 0.073 0.091 0% 0.67General Chemistry2007 Biochemical Oxygen Demand mg/L 10 8. McNeeley (1979) <2 <2 1.6J 0.74J 1.4J 1.2J <2.0 <2.0 0% 0.112007 Chemical Oxygen Demand mg/L 120 4. MSGP 2015 11 17 7.1 12 16 14 17 24 0% 0.122007, 2013 Dissolved Organic Carbon mg/L NA 4.1 5.3 2.8 4 3.2 3.5 4 7.42007, 2013 Total Organic Carbon mg/L NA 5.1 5.2 3 3.7 2.7 2.1 4.1 7.52007 Oil and Grease mg/L 10 1. Basin Plan, 3. Anacostia River TMDL 1.1J <5 <5 <5 <5 1.9J <5.0 1.9J 0% 0.222007, 2013 Surfactants (MBAS) mg/L 0.5 1. Basin Plan 0.044 0.034 0.031J 0.06 0.043J 0.11 0.077 0% 0.112007, 2013 Total Dissolved Solids mg/L 500 (c) 1. Basin Plan 1,357 1,394 1,400 1,400 1,500 1,500 1,700 1,300 100% 2.892007, 2013 Total Suspended Solids mg/L 58 14. NSQD, 1. Basin Plan 14.8 4.7J 6 8 12 7 10 4 0% 0.142007, 2013 Total Hardness mg CaCO3/L NA 365 360.6 650 670 639 646 729 190Total Metals2007 Antimony mg/L 0.006 (d) 1. Basin Plan 0.0004J 0.0003J 0.00023J 0.00025J 0.0002J 0.00028J 0.00025J 0.00046J 0% 0.052007, 2013 Arsenic mg/L 0.01 (d) 1. Basin Plan 0.0078 0.0075 0.0066 0.006 0.0071 0.0064 0.0062 0.0047 0% 0.652007, 2013 Cadmium mg/L 0.005 (d) 1. Basin Plan <0.0004 <0.0004 0.000032J 0.000037J 0.00009J 0.00005J <0.00010 <0.00010 0% 0.022007, 2013 Chromium mg/L 0.05 (d) 1. Basin Plan 0.0002J 0.0001J 0.00036 0.00036 0.00009J 0.00029 0.00033 0.00029 0% 0.012007, 2013 Copper mg/L 1.0 (d) 1. Basin Plan 0.0016 0.0022 0.0014 0.0023 0.00088 0.0018 0.0013 0.0025 0% 0.002007, 2013 Lead mg/L NA 0.0002 0.0002 0.00018J 0.00019J 0.00009J 0.00023 0.00025 0.000044J2007, 2013 Nickel mg/L 0.1 (d) 1. Basin Plan 0.0014 0.0014 0.0024 0.0031 0.0013 0.0014 0.0014 0.0039 0% 0.022007, 2013 Selenium mg/L 0.005 16. 40 CFR 131.38 0.0010 0.0018 0.00074 0.001 0.00072 0.00078 0.0006 0.0016 0% 0.212007, 2013 Zinc mg/L 5.0 (d) 1. Basin Plan 0.0043 0.0043 0.0024J 0.0033J 0.0015J 0.0033J 0.0031J 0.0043J 0% 0.00Dissolved Metals2007 Antimony mg/L 0.006 1. Basin Plan 0.0004J 0.0003J 0.00023J 0.00024J 0.0002J 0.00026J 0.00024J 0.00049J 0% 0.05
2007, 2013 Arsenic mg/L 0.34 acute /0.15 chronic 16. 40 CFR 131.38 0.0075 0.0074 0.0067 0.0058 0.0072 0.0061 0.0061 0.0046 0% 0.04
2007, 2013 Cadmium mg/L (e) 16. 40 CFR 131.38 <0.0004 <0.0004 0.000026J 0.000031J 0.00009J 0.00005J <0.00010 <0.00010 0% 0.022007, 2013 Chromium mg/L (e) 16. 40 CFR 131.38 0.0001J 0.0001J 0.00011J 0.00016J 0.00009J 0.00012J 0.000059J 0.00013J 0% 0.002007, 2013 Copper mg/L (e) 16. 40 CFR 131.38 0.0012 0.0014 0.0012 0.0018 0.00096 0.0016 0.00077 0.0021 0% 0.062007, 2013 Lead mg/L (e) 16. 40 CFR 131.38 <0.0001 <0.0001 0.000049J 0.000047J 0.00008J 0.00004J 0.000043J <0.00020 0% 0.012007, 2013 Nickel mg/L (e) 16. 40 CFR 131.38 0.0013 0.0014 0.002 0.0028 0.0013 0.0012 0.0012 0.0038 0% 0.012007, 2013 Selenium mg/L NA 0.0009 0.0019 0.00073 0.001 0.00073 0.00075 0.00058 0.00172007, 2013 Zinc mg/L (e) 16. 40 CFR 131.38 0.0020 0.0020 0.0024J 0.0029J 0.0031J 0.0022J 0.0014J 0.0038J 0% 0.01Organophosphorus Pesticides
2007, 2013 Chlorpyrifos µg/L 0.02 acute / 0.014 chronic 12. CA Dept. of Fish & Game, 2000 <0.002 <0.002 <0.01 <0.01 <0.01 <0.01 <0.010 <0.010 0% 0.29
2007, 2013 Diazinon µg/L 0.08 acute / 0.05 chronic
12. CA Dept. of Fish & Game, 2000, 11. Chollas Creek TMDL for Diazinon, 10. USEPA, Aquatic Life Ambient
Water Quality Criteria Diazinon<0.004 <0.004 <0.01 <0.01 <0.01 <0.01 <0.010 <0.010 0% 0.09
2007, 2013 Malathion µg/L 0.43 acute /0.1 chronic 13. CA Dept. of Fish & Game, 1998, 5. Goldbook <0.006 <0.006 <0.01 <0.01 <0.01 <0.01 <0.010 <0.010 0% 0.05
Toxicity2007, 2013 Ceriodaphnia 96-hr LC50 (%) >100 >100 >100 >100 >100 >100 >100 >100 >100 0% 1.002007, 2013 Ceriodaphnia 7-day survival NOEC (%) 100 100 100 100 100 100 100 100 100 0% 1.002007, 2013 Ceriodaphnia 7-day reproduction NOEC (%) 100 100 100 100 <6.25CF 100 100 100 100 0% 1.002007 Hyalella 96-hr LC50 (%) >100 >100 >100 >100 >100 >100 >100 >100 >100 0% 1.002007, 2013 Selenastrum 96-hr NOEC (%) 100 100 100 100 100 100 50 100 100 13% 1.13See last page for footnotes and source references.
Analyte
Transitional Monitoring
No
Sam
ples
Col
lect
ed
2007-2008
Historical Monitoring Data
Permit Requirement Units Water Quality
Benchmarks 2012-2013Benchmark References 2010-2011 Mean Ratio to Benchmarks
No
Sam
ples
Col
lect
ed
No
Sam
ples
Col
lect
ed
No
Sam
ples
Col
lect
ed
2014-2015Frequency
Above Benchmarks

Dry Weather Historical Monitoring Table for BVC-TWAS-1
Blank spaces have been verified and no data is available.
NA indicate no criteria or published value was available or applicable to the matrix or program.
(c) Water Quality Benchmark are based on the San Diego Regional Water Quality Control Plan by watershed for the San Diego Region (Basin Plan), 1994 (with amendments effective on or before April 4, 2011) and may vary by hydrologic area.(d) Water Quality Benchmark for total metals is based on the MUN beneficial use as described in the Basin Plan, 1994 (with amendments effective on or before April 4, 2011).
AE - Analysis error.CF - Control failed; results not used in assessment.J-Analyte was detected at a concentration below the reporting limit and above the method detection limit. Reported value is estimated.
SourcesPlease refer to the San Diego County Copermittee Regional Monitoring Program Benchmark Sources in Attachment B to Appendix A for benchmark source citations.
(b) Prior to the 2014-2015 monitoring year, Water Quality Benchmark was calculated based on CMC (salmonids absent) and CCC (early life stages present) using water temperature and pH described in the U.S. EPA, 1999 Update of Ambient Water Quality Criteria for Ammonia, EPA-822-R-99-014, December 1999. For 2014-2015 monitoring year, Water Quality Benchmark CMC and CCC were calculated based on pH and water temperature (when applicable) as described in the U.S. EPA, 2013 Aquatic Life Ambient Water Quality Criteria for Ammonia - Freshwater, EPA-822-R-13-001, April 2013.
(a) Water Quality Benchmark for Enterococcus is based on the maximum criteria for infrequently used freshwater area by the San Diego Regional Water Quality Control Plan for the San Diego Region (Basin Plan), 1994 (with amendments effective on or before April 4, 2011).
(e) Water Quality Benchmark for dissolved metal fractions are based on total hardness and are calculated as described by the USEPA Federal Register Doc. 40 CFR Part 131, May 18, 2000. The Criteria Maximum Concentration (CMC) and Continuous Criteria Concentration (CCC) were used.
Values with red bold font and shading do not meet Water Quality Benchmarks

Dry Weather Historical Monitoring Table for ESC-TWAS-1
2008-2009 2009-2010 2010-2011 2011-2012 2012-2013 2013-2014
09/18/07-09/19/07
05/13/08-05/14/08 - - - - - - -
Physical Chemistry2007, 2013 pH pH units 6.5-9.0 1. Basin Plan 8.40 8.30 0% NA1
2007, 2013 Specific Conductivity µmhos/cm NA 1,552 1,6192007, 2013 Water Temperature Celsius NA 21.60 18.202007, 2013 Turbidity NTU 20 1. Basin Plan 1.1J 2 0% NA1
Bacteriological2007, 2013 Enterococcus MPN/100 mL 151 (a) 1. Basin Plan 80 140 0% NA1
2007, 2013 Fecal Coliform MPN/100 mL 400 1.Basin Plan REC-1/REC-2 500 40 50% NA1
2007, 2013 Total Coliform MPN/100 mL NA 2,200 1,100Nutrients2007, 2013 Ammonia as N mg/L (b) 6. USEPA Water Quality Criteria (Freshwater) 0.04J 0.03 0% NA1
2007, 2013 Nitrate as N mg/L 10 1. Basin Plan 5.63 6.37 0% NA1
2007, 2013 Nitrite as N mg/L 1 1. Basin Plan 0.06 0.04J 0% NA1
2007, 2013 Total Kjeldahl Nitrogen mg/L NA 0.84 1.12007, 2013 Total Nitrogen (calculated) mg/L 1 1. Basin Plan 6.53 7.51 100% NA1
2007 Dissolved Phosphorus mg/L 0.1 1. Basin Plan 0.05 0.07 0% NA1
2007, 2013 Total Phosphorus mg/L 0.1 1. Basin Plan 0.05 0.057 0% NA1
General Chemistry2007 Biochemical Oxygen Demand mg/L 10 8. McNeeley (1979) <2 <2 0% NA1
2007 Chemical Oxygen Demand mg/L 120 4. MSGP 2015 150 13 50% NA1
2007, 2013 Dissolved Organic Carbon mg/L NA 3.5 52007, 2013 Total Organic Carbon mg/L NA 13 4.62007 Oil and Grease mg/L 10 1. Basin Plan, 3. Anacostia River TMDL <5 <5 0% NA1
2007, 2013 Surfactants (MBAS) mg/L 0.5 1. Basin Plan 0.036 0.049 0% NA1
2007, 2013 Total Dissolved Solids mg/L 500 (c) 1. Basin Plan 1,204 1,242 100% NA1
2007, 2013 Total Suspended Solids mg/L 58 14. NSQD, 1. Basin Plan 1.5J 1J 0% NA1
2007, 2013 Total Hardness mg CaCO3/L NA 315.2 342.3Total Metals2007 Antimony mg/L 0.006 (d) 1. Basin Plan 0.0003J 0.0003J 0% NA1
2007, 2013 Arsenic mg/L 0.01 (d) 1. Basin Plan 0.0014 0.0014 0% NA1
2007, 2013 Cadmium mg/L 0.005 (d) 1. Basin Plan <0.0004 <0.0004 0% NA1
2007, 2013 Chromium mg/L 0.05 (d) 1. Basin Plan 0.0003J 0.0003J 0% NA1
2007, 2013 Copper mg/L 1.0 (d) 1. Basin Plan 0.0018 0.0017 0% NA1
2007, 2013 Lead mg/L NA 0.00007J 0.00012007, 2013 Nickel mg/L 0.1 (d) 1. Basin Plan 0.0011 0.0009 0% NA1
2007, 2013 Selenium mg/L 0.005 16. 40 CFR 131.38 0.0021 0.0030 0% NA1
2007, 2013 Zinc mg/L 5.0 (d) 1. Basin Plan 0.0048 0.0069 0% NA1
Dissolved Metals2007 Antimony mg/L 0.006 1. Basin Plan 0.0003J 0.0003J 0% NA1
2007, 2013 Arsenic mg/L 0.34 acute /0.15 chronic 16. 40 CFR 131.38 0.0015 0.0015 0% NA1
2007, 2013 Cadmium mg/L (e) 16. 40 CFR 131.38 <0.0004 <0.0004 0% NA1
2007, 2013 Chromium mg/L (e) 16. 40 CFR 131.38 0.0003J 0.0003J 0% NA1
2007, 2013 Copper mg/L (e) 16. 40 CFR 131.38 0.0016 0.0014 0% NA1
2007, 2013 Lead mg/L (e) 16. 40 CFR 131.38 <0.0001 <0.0001 0% NA1
2007, 2013 Nickel mg/L (e) 16. 40 CFR 131.38 0.0010 0.0008 0% NA1
2007, 2013 Selenium mg/L NA 0.0022 0.00312007, 2013 Zinc mg/L (e) 16. 40 CFR 131.38 0.0035 0.0039 0% NA1
Organophosphorus Pesticides
2007, 2013 Chlorpyrifos µg/L 0.02 acute / 0.014 chronic 12. CA Dept. of Fish & Game, 2000 <0.002 <0.002 0% NA1
2007, 2013 Diazinon µg/L 0.08 acute / 0.05 chronic
12. CA Dept. of Fish & Game, 2000, 11. Chollas Creek TMDL for Diazinon, 10. USEPA, Aquatic Life Ambient
Water Quality Criteria Diazinon<0.004 <0.004 0% NA1
2007, 2013 Malathion µg/L 0.43 acute /0.1 chronic 13. CA Dept. of Fish & Game, 1998, 5. Goldbook <0.006 <0.006 0% NA1
Toxicity2007, 2013 Ceriodaphnia 96-hr LC50 (%) >100 >100 >100 0% NA1
2007, 2013 Ceriodaphnia 7-day survival NOEC (%) 100 100 100 0% NA1
2007, 2013 Ceriodaphnia 7-day reproduction NOEC (%) 100 100 100 0% NA1
2007 Hyalella 96-hr LC50 (%) >100 >100 >100 0% NA1
2007, 2013 Selenastrum 96-hr NOEC (%) 100 100 100 0% NA1
See last page for footnotes and source references.
No
Sam
ples
Col
lect
ed
No
Sam
ples
Col
lect
ed
No
Sam
ples
Col
lect
ed
No
Sam
ples
Col
lect
ed
Permit Requirement Units Water Quality
Benchmarks Benchmark References
Historical Monitoring Data Transitional Monitoring
Analyte 2014-2015
No
Sam
ples
Col
lect
ed
Mean Ratio to Benchmarks
Frequency Above
Benchmarks
No
Sam
ples
Col
lect
ed
2007-2008
No
Sam
ples
Col
lect
ed

Dry Weather Historical Monitoring Table for ESC-TWAS-1
Blank spaces have been verified and no data is available.
NA indicate no criteria or published value was available or applicable to the matrix or program.
(c) Water Quality Benchmark are based on the San Diego Regional Water Quality Control Plan by watershed for the San Diego Region (Basin Plan), 1994 (with amendments effective on or before April 4, 2011) and may vary by hydrologic area.(d) Water Quality Benchmark for total metals is based on the MUN beneficial use as described in the Basin Plan, 1994 (with amendments effective on or before April 4, 2011).
J-Analyte was detected at a concentration below the reporting limit and above the method detection limit. Reported value is estimated.NA1 Three or more years of data required to calculate the Mean Ratio to Benchmark.
SourcesPlease refer to the San Diego County Copermittee Regional Monitoring Program Benchmark Sources in Attachment B to Appendix A for benchmark source citations.
(e) Water Quality Benchmark for dissolved metal fractions are based on total hardness and are calculated as described by the USEPA Federal Register Doc. 40 CFR Part 131, May 18, 2000. The Criteria Maximum Concentration (CMC) and Continuous Criteria Concentration (CCC) were used.
(b) Prior to the 2014-2015 monitoring year, Water Quality Benchmark was calculated based on CMC (salmonids absent) and CCC (early life stages present) using water temperature and pH described in the U.S. EPA, 1999 Update of Ambient Water Quality Criteria for Ammonia, EPA-822-R-99-014, December 1999. For 2014-2015 monitoring year, Water Quality Benchmark CMC and CCC were calculated based on pH and water temperature (when applicable) as described in the U.S. EPA, 2013 Aquatic Life Ambient Water Quality Criteria for Ammonia - Freshwater, EPA-822-R-13-001, April 2013.
(a) Water Quality Benchmark for Enterococcus is based on the maximum criteria for infrequently used freshwater area by the San Diego Regional Water Quality Control Plan for the San Diego Region (Basin Plan), 1994 (with amendments effective on or before April 4, 2011).
Values with red bold font and shading do not meet Water Quality Benchmarks

Dry Weather Historical Monitoring Table for ESC-MLS
Long Term and
Transitional Monitoring
Long Term and
Transitional Monitoring
Long Term Monitoring
Long Term and
Transitional Monitoring
2008-2009 2009-2010 2011-2012 2013-2014
09/18/07-09/19/07
05/13/08-05/14/08 - - 09/21/10-
09/22/1005/11/11-05/12/11 - 09/12/12-
09/13/1205/14/13-05/15/13 - 09/23/14-
09/24/1401/07/15-01/08/15
05/05/15-05/06/15
Physical Chemistry2013 Dissolved Oxygen mg/L <6.0 (a) 1. Basin Plan 6.92 9.96 7.88 0% NA1
2007, 2013 pH pH units 6.5-9.0 1. Basin Plan 8.14 7.89 8.02 7.69 7.9 7.99 7.76 7.91 8.01 0% 0.152007, 2013 Specific Conductivity µmhos/cm NA 1,988 1,813 2,610 2,510 2,420 1,656 2,829 2,311 2,4362007, 2013 Water Temperature Celsius NA 20.7 16.70 19.20 17.20 23.7 20.9 22.97 9.88 15.382007, 2013 Turbidity NTU 20 1. Basin Plan 4.3 7.8 1.2 3.2 5.9 2.4 3.2 0.7 3.9 0% 0.18Bacteriological2007, 2013 Enterococcus MPN/100 mL 151 (b) 1. Basin Plan 230 230 130 230 300 1,700 790 70 90 67% 2.772007, 2013 Fecal Coliform MPN/100 mL 400 1.Basin Plan REC-1/REC-2 260 90 230 20 230 220 78 40 110 0% 0.362007, 2013 Total Coliform MPN/100 mL NA 7,000 2,200 1,400 700 11,000 1,700 700 5,000 700Nutrients2007, 2013 Ammonia as N mg/L (c) 6. USEPA Water Quality Criteria (Freshwater) 0.03J 0.21 <0.1 0.1 0.56 0.077J <0.10 <0.10 <0.10 0% 0.082007, 2013 Nitrate as N mg/L 10 1. Basin Plan 1.85 0.05 1.4 0.14 1.4 1.2 0.15 2.6 0.61 0% 0.102007, 2013 Nitrite as N mg/L 1 1. Basin Plan <0.05 <0.05 <0.1 0.026J <0.1 0.012J 0.015J 0.020J <0.10 0% 0.032007, 2013 Total Kjeldahl Nitrogen mg/L NA 0.7 1.5 0.44 0.4 1.3 0.21 0.4 0.32 0.362007, 2013 Total Nitrogen (calculated) mg/L 1 1. Basin Plan 2.55 1.55 1.84 0.566 2.7 1.422 0.565 2.94 0.97 67% 1.682007 Dissolved Phosphorus mg/L 0.1 1. Basin Plan 0.09 0.03J 0.11 0.042 0.16 0.11 0.13 NR 0.11 63% 0.982013 Orthophosphate mg/L NA 0.13 AE 0.122007, 2013 Total Phosphorus mg/L 0.1 1. Basin Plan 0.08 0.11 0.13 0.088 0.15 0.13 0.18 0.12 0.16 78% 1.27General Chemistry2007 Biochemical Oxygen Demand mg/L 10 8. McNeeley (1979) <2 <2 2.5 1.1J 0.73J 0.8J <2.0 NR <2.0 0% 0.112007 Chemical Oxygen Demand mg/L 120 4. MSGP 2015 9 30 20 18 11 7.4 9.8 NR 16 0% 0.132007, 2013 Dissolved Organic Carbon mg/L NA 4.3 5 3.6 3.2 4.8 3.8 3.8 4.5 5.12007, 2013 Total Organic Carbon mg/L NA 5.4 5.2 3.5 3.2 4.7 3.5 4.1 4.6 5.12007 Oil and Grease mg/L 10 1. Basin Plan, 3. Anacostia River TMDL <5 <5 <5 <5 <5 <5 <5.0 NR <5.0 0% 0.252013 Sulfate mg/L 250 (a) 1. Basin Plan 560 390 460 100% NA1
2007, 2013 Surfactants (MBAS) mg/L 0.5 1. Basin Plan 0.051 0.05 0.021J 0.066 0.033J 0.056J 0.12 0.08 0.040J 0% 0.112007, 2013 Total Dissolved Solids mg/L 500 (a) 1. Basin Plan 1,591 2,620 1,700 2,200 1,500 1,400 1,800 1,500 1,600 100% 3.542007, 2013 Total Suspended Solids mg/L 58 14. NSQD, 1. Basin Plan 5.7 2.4J 4 3 11 11 13 3 12 0% 0.122007, 2013 Total Hardness mg CaCO3/L NA 445.0 603.7 680 890 590 609 837 722 722Total Metals2007 Antimony mg/L 0.006 (d) 1. Basin Plan 0.0003J <0.0005 0.00019J 0.00005J 0.00019J 0.00036J 0.00014J NR 0.00025J 0% 0.042007, 2013 Arsenic mg/L 0.01 (d) 1. Basin Plan 0.0015 0.0026 0.00081 0.0019 0.00089 0.0012 0.0008 0.00084 0.00098 0% 0.132007, 2013 Cadmium mg/L 0.005 (d) 1. Basin Plan <0.0004 <0.0004 0.000092J 0.00002J 0.00007J 0.00012 0.000025J 0.00023 0.00011 0% 0.022007, 2013 Chromium mg/L 0.05 (d) 1. Basin Plan 0.0003J <0.0005 0.00036 0.00008J 0.00011J 0.00035 0.00041 0.00014J 0.00038 0% 0.012013 Chromium, Trivalent mg/L NA <0.00050 <0.00020 0.000222013 Chromium, Hexavalent mg/L 0.010 (d) 1. Basin Plan 0.000043J 0.00012 0.00015 0% NA1
2007, 2013 Copper mg/L 1.0 (d) 1. Basin Plan 0.0029 <0.0008 0.0026 0.00031J 0.0015 0.0031 0.0033 0.0021 0.0029 0% 0.002013 Iron mg/L 0.3 (a) 1. Basin Plan 0.6 0.13 0.57 67% NA1
2007, 2013 Lead mg/L NA 0.0002 0.00005J 0.00028 0.00008J 0.00011J 0.00035 0.00036 0.00011J 0.000472013 Manganese mg/L 0.05 (a) 1. Basin Plan 0.27 0.21 0.3 100% NA1
2013 Mercury mg/L 0.002 (d) 1. Basin Plan <0.000050 0.0000040J <0.000050 0% NA1
2007, 2013 Nickel mg/L 0.1 (d) 1. Basin Plan 0.0017 0.0014 0.0029 0.0011 0.0012 0.0038 0.0013 0.0014 0.0015 0% 0.022007, 2013 Selenium mg/L 0.005 16. 40 CFR 131.38 0.0017 0.0002J 0.0012 0.00018J 0.0016 0.0019 0.0011 0.0014 0.0011 0% 0.232013 Silver mg/L 0.1 (d) 1. Basin Plan <0.00020 <0.00020 <0.00020 0% NA1
2013 Thallium mg/L 0.002 (d) 1. Basin Plan <0.00020 <0.00020 <0.00020 0% NA1
2007, 2013 Zinc mg/L 5.0 (d) 1. Basin Plan 0.0328 0.0032 0.0028J 0.0018J 0.0026J 0.0042J 0.0029J 0.0061 0.0048J 0% 0.00Dissolved Metals2007 Antimony mg/L 0.006 1. Basin Plan 0.0003J <0.0005 0.00018J 0.00005J 0.00018J 0.00036J 0.00011J NR 0.00029J 0% 0.04
2007, 2013 Arsenic mg/L 0.34 acute /0.15 chronic 16. 40 CFR 131.38 0.0015 0.0025 0.00076 0.0015 0.00085 0.0013 0.00069 0.00079 0.00091 0% 0.01
2007, 2013 Cadmium mg/L (e) 16. 40 CFR 131.38 <0.0004 <0.0004 0.000042J 0.00002J 0.00007J 0.000086J <0.00010 0.00017 0.000051J 0% 0.022007, 2013 Chromium mg/L (e) 16. 40 CFR 131.38 0.0001J <0.0005 0.000083J 0.00002J 0.00009J 0.000098J 0.000043J 0.00011J <0.00020 0% 0.002013 Chromium, Trivalent mg/L (e) 16. 40 CFR 131.38 AE <0.0002 <0.0002 0% NA1
2013 Chromium, Hexavalent mg/L 0.011 16. 40 CFR 131.38 AE 0.00013H 0.00014 0% NA1
2007, 2013 Copper mg/L (e) 16. 40 CFR 131.38 0.0022 <0.0008 0.0021 0.00007J 0.0014 0.0026 0.00098 0.0018 0.0022 0% 0.052013 Iron mg/L NA <0.010 <0.010 0.0032J2007, 2013 Lead mg/L (e) 16. 40 CFR 131.38 <0.0001 <0.0001 <0.0002 0.00003J 0.00002J <0.0002 <0.00020 <0.00020 <0.00020 0% 0.012013 Manganese mg/L NA 0.11 0.18 0.152013 Mercury mg/L NA <0.000050 <0.000050 <0.0000502007, 2013 Nickel mg/L (e) 16. 40 CFR 131.38 0.0014 0.0014 0.0026 0.001 0.0012 0.0037 0.0011 0.0013 0.0013 0% 0.012007, 2013 Selenium mg/L NA 0.0017 0.0002J 0.0011 0.00022J 0.0016 0.0017 0.0011 0.0013 0.0012013 Silver mg/L (e) 16. 40 CFR 131.38 <0.00020 <0.00020 <0.00020 0% 0.042013 Thallium mg/L NA <0.00020 <0.00020 <0.000202007, 2013 Zinc mg/L (e) 16. 40 CFR 131.38 0.0256 0.0025 0.0021J 0.0032J 0.0032J 0.0025J 0.0012J 0.0039J 0.0019J 0% 0.01
No
Sam
ples
Col
lect
ed
No
Sam
ples
Col
lect
ed
Permit Requirement
2007-2008
No
Sam
ples
Col
lect
ed
Mean Ratio to Benchmarks
2012-20132010-2011
Frequency Above
Benchmarks2014-2015
Historical Monitoring Data
No
Sam
ples
Col
lect
ed
Analyte Units Water Quality Benchmarks Benchmark References

Dry Weather Historical Monitoring Table for ESC-MLS
Long Term and
Transitional Monitoring
Long Term and
Transitional Monitoring
Long Term Monitoring
Long Term and
Transitional Monitoring
2008-2009 2009-2010 2011-2012 2013-2014
09/18/07-09/19/07
05/13/08-05/14/08 - - 09/21/10-
09/22/1005/11/11-05/12/11 - 09/12/12-
09/13/1205/14/13-05/15/13 - 09/23/14-
09/24/1401/07/15-01/08/15
05/05/15-05/06/15
Permit Requirement
2007-2008
Mean Ratio to Benchmarks
2012-20132010-2011
Frequency Above
Benchmarks2014-2015
Historical Monitoring Data
Analyte Units Water Quality Benchmarks Benchmark References
Chlorinated Pesticides2013 2,4'-DDE µg/L NA <0.0050 <0.0050 <0.00502013 2,4'-DDT µg/L NA <0.0050 <0.0050 <0.00502013 4,4´-DDE µg/L NA <0.0050 <0.0050 <0.00502013 4,4´-DDT µg/L 0.001 16. 40 CFR 131.38 <0.0050 <0.0050 <0.0050 0% NA1
Organophosphorus Pesticides2013 Azinphos methyl (Guthion) µg/L NA <0.010 <0.010 <0.0102013 Bolstar µg/L NA <0.010 <0.010 <0.010
2007, 2013 Chlorpyrifos µg/L 0.02 acute / 0.014 chronic 12. CA Dept. of Fish & Game, 2000 <0.002 <0.002 <0.01 <0.01 <0.01 <0.01 <0.010 <0.010 <0.010 0% 0.29
2013 Coumaphos µg/L NA <0.010 <0.010 <0.0102013 Demeton-o µg/L NA <0.010 <0.010 <0.0102013 Demeton-s µg/L NA <0.010 <0.010 <0.010
2007, 2013 Diazinon µg/L 0.08 acute / 0.05 chronic
12. CA Dept. of Fish & Game, 2000, 11. Chollas Creek TMDL for Diazinon, 10. USEPA, Aquatic Life Ambient
Water Quality Criteria Diazinon<0.004 <0.004 <0.01 <0.01 <0.01 <0.01 <0.010 <0.010 <0.010 0% 0.09
2013 Dichlorvos µg/L NA <0.010 <0.010 <0.0102013 Dimethoate µg/L NA <0.010 <0.010 <0.0102013 Disulfoton µg/L NA <0.010 <0.010 <0.0102013 Ethoprop µg/L NA <0.010 <0.010 <0.0102013 Ethyl parathion µg/L NA <0.010 <0.010 <0.0102013 Fensulfothion µg/L NA <0.010 <0.010 <0.0102013 Fenthion µg/L NA <0.010 <0.010 <0.010
2007, 2013 Malathion µg/L 0.43 acute /0.1 chronic 13. CA Dept. of Fish & Game, 1998, 5. Goldbook <0.006 <0.006 <0.01 <0.01 <0.01 <0.01 <0.010 <0.010 <0.010 0% 0.05
2013 Merphos µg/L NA <0.010 <0.010 <0.0102013 Methyl parathion µg/L NA <0.010 <0.010 <0.0102013 Mevinphos µg/L NA <0.010 <0.010 <0.0102013 Naled µg/L NA <0.010 <0.010 <0.0102013 Phorate µg/L NA <0.010 <0.010 <0.0102013 Ronnel µg/L NA <0.010 <0.010 <0.0102013 Stirophos µg/L NA <0.010 <0.010 <0.0102013 Tokuthion (Prothiofos) µg/L NA <0.010 <0.010 <0.0102013 Trichloronate µg/L NA <0.010 <0.010 <0.010Pyrethroids2013 Allethrin µg/L NA <0.002 <0.002 <0.0022013 Bifenthrin µg/L 0.0093 15. Anderson et al., 2006 <0.002 <0.002 <0.002 0% NA1
2013 Cyfluthrin µg/L 0.344 17. Wheelock et al., 2004 <0.002 <0.002 <0.002 0% NA1
2013 Cyhalothrin, Total Lambda µg/L 0.2 17. Wheelock et al., 2004 <0.002 <0.002 <0.002 0% NA1
2013 Cypermethrin µg/L 0.344 17. Wheelock et al., 2004 <0.002 <0.002 <0.002 0% NA1
2013 Danitol (Fenpropathrin) µg/L NA <0.002 <0.002 <0.0022013 Deltamethrin/Tralomethrin µg/L NA <0.002 <0.002 <0.0022013 Esfenvalerate µg/L 0.25 17. Wheelock et al., 2004 <0.002 <0.002 <0.002 0% NA1
2013 Fenvalerate µg/L NA <0.002 <0.002 <0.0022013 Fluvalinate µg/L NA <0.002 <0.002 <0.0022013 Permethrin µg/L 0.021 15. Anderson et al., 2006 <0.01 <0.01 <0.01 0% NA1
2013 Prallethrin µg/L NA <0.002 <0.002 <0.0022013 Resmethrin µg/L NA <0.01 <0.01 <0.01Toxicity2007, 2013 Ceriodaphnia 96-hr LC50 (%) >100 >100 >100 >100 >100 >100 >100 >100 NR >100 0% 1.002007, 2013 Ceriodaphnia 7-day survival NOEC (%) 100 100 100 100 100 100 100 100 NR 100 0% 1.002007, 2013 Ceriodaphnia 7-day reproduction NOEC (%) 100 50 100 100 100 100 100 100 NR 100 13% 1.132007 Hyalella 96-hr LC50 (%) >100 >100 >100 >100 >100 >100 >100 >100 NR >100 0% 1.002007, 2013 Selenastrum 96-hr NOEC (%) 100 100 50 100 50 100 100 100 NR 100 25% 1.252013 Strongylocentrotus 96-hr TST Pass/Fail Pass Pass PassSee last page for footnotes and source references.
No
Sam
ples
Col
lect
ed
No
Sam
ples
Col
lect
ed
No
Sam
ples
Col
lect
ed
No
Sam
ples
Col
lect
ed

Dry Weather Historical Monitoring Table for ESC-MLS
Blank spaces have been verified and no data is available.
NA indicate no criteria or published value was available or applicable to the matrix or program.(a) Water Quality Benchmark are based on the San Diego Regional Water Quality Control Plan by watershed for the San Diego Region (Basin Plan), 1994 (with amendments effective on or before April 4, 2011) and may vary by hydrologic area.
AE - Analysis error.H - Sample analyzed and/or extracted past the recommended holding time. J-Analyte was detected at a concentration below the reporting limit and above the method detection limit. Reported value is estimated.NR -Sampling of this analyte not required for transitional monitoring (RWQCB Order No. R9-2007-0001) and/or for long term monitoring (RWQCB Order No. R9-2013-0001).
SourcesPlease refer to the San Diego County Copermittee Regional Monitoring Program Benchmark Sources in Attachment B to Appendix A for benchmark source citations.
(b) Water Quality Benchmark for Enterococcus is based on the maximum criteria for infrequently used freshwater area by the San Diego Regional Water Quality Control Plan for the San Diego Region (Basin Plan), 1994 (with amendments effective on or before April 4, 2011).
(e) Water Quality Benchmark for dissolved metal fractions are based on total hardness and are calculated as described by the USEPA Federal Register Doc. 40 CFR Part 131, May 18, 2000. The Criteria Maximum Concentration (CMC) and Continuous Criteria Concentration (CCC) were used.
(d) Water Quality Benchmark for total metals is based on the MUN beneficial use as described in the Basin Plan, 1994 (with amendments effective on or before April 4, 2011).
(c) Prior to the 2014-2015 monitoring year, Water Quality Benchmark was calculated based on CMC (salmonids absent) and CCC (early life stages present) using water temperature and pH described in the U.S. EPA, 1999 Update of Ambient Water Quality Criteria for Ammonia, EPA-822-R-99-014, December 1999. For 2014-2015 monitoring year, Water Quality Benchmark CMC and CCC were calculated based on pH and water temperature (when applicable) as described in the U.S. EPA, 2013 Aquatic Life Ambient Water Quality Criteria for Ammonia - Freshwater, EPA-822-R-13-001, April 2013.
Values with red bold font and shading do not meet Water Quality Benchmarks

Dry Weather Historical Monitoring Table for LPC-TWAS-1
2008-2009 2009-2010 2011-2012 2012-2013 2013-2014 2014-2015
09/26/07-09/27/07
06/02/08-06/03/08 - - 09/23/10 05/11/11-
05/12/11 - - - -
Physical Chemistry2007, 2013 pH pH units 6.5-9.0 1. Basin Plan 8.00 8.28 7.75 8.28 0% NA1
2007, 2013 Specific Conductivity µmhos/cm NA 2,420 3,920 4,340 3,7902007, 2013 Water Temperature Celsius NA 19.80 27.40 14.90 28.502007, 2013 Turbidity NTU 20 1. Basin Plan 2.23 2.3 0.62 0.22 0% NA1
Bacteriological2007, 2013 Enterococcus MPN/100 mL 151 (a) 1. Basin Plan 500 500 40 <20 50% NA1
2007, 2013 Fecal Coliform MPN/100 mL 4,000 1.Basin Plan REC-1/REC-2 220 230 20 172 0% NA1
2007, 2013 Total Coliform MPN/100 mL NA 6,000 1,300 5,000 1,300Nutrients2007, 2013 Ammonia as N mg/L (b) 6. USEPA Water Quality Criteria (Freshwater) 0.02J <0.03 <0.1 <0.1 0% NA1
2007, 2013 Nitrate as N mg/L 10 1. Basin Plan <0.05 0.03J <0.1 0.066J 0% NA1
2007, 2013 Nitrite as N mg/L 1 1. Basin Plan <0.05 0.04J <0.1 0.031J 0% NA1
2007, 2013 Total Kjeldahl Nitrogen mg/L NA 0.98 0.56 0.22 0.32007, 2013 Total Nitrogen (calculated) mg/L 1 1. Basin Plan 0.98 0.63 0.22 0.397 0% NA1
2007 Dissolved Phosphorus mg/L 0.1 1. Basin Plan <0.05 0.09 0.0018J 0.0067J 0% NA1
2007, 2013 Total Phosphorus mg/L 0.1 1. Basin Plan <0.05 0.034J <0.01 0.0065J 0% NA1
General Chemistry2007 Biochemical Oxygen Demand mg/L 10 8. McNeeley (1979) <2 <2 0.48J 1.7J 0% NA1
2007 Chemical Oxygen Demand mg/L 120 4. MSGP 2015 23 14 26 31 0% NA1
2007, 2013 Dissolved Organic Carbon mg/L NA 6.8 5.3 2.6 2.92007, 2013 Total Organic Carbon mg/L NA 7.1 5.4 2.6 3.12007 Oil and Grease mg/L 10 1. Basin Plan, 3. Anacostia River TMDL 1J <5 <5 <5 0% NA1
2007, 2013 Surfactants (MBAS) mg/L 0.5 1. Basin Plan 0.084 0.097 0.036J 0.056 0% NA1
2007, 2013 Total Dissolved Solids mg/L 500 (c) 1. Basin Plan 2,446 2,638 3,200 2,700 100% NA1
2007, 2013 Total Suspended Solids mg/L 58 14. NSQD, 1. Basin Plan 1J 1.7J <1 2 0% NA1
2007, 2013 Total Hardness mg CaCO3/L NA 699.5 746.8 1,400 1,400Total Metals2007 Antimony mg/L 0.006 (d) 1. Basin Plan 0.0008 0.0008 0.00047J 0.00037J 0% NA1
2007, 2013 Arsenic mg/L 0.01 (d) 1. Basin Plan 0.0024 0.0027 0.0011 0.0017 0% NA1
2007, 2013 Cadmium mg/L 0.005 (d) 1. Basin Plan <0.0004 <0.0004 <0.0001 <0.0001 0% NA1
2007, 2013 Chromium mg/L 0.05 (d) 1. Basin Plan 0.0002J 0.0001J 0.00021 0.00008J 0% NA1
2007, 2013 Copper mg/L 1.0 (d) 1. Basin Plan 0.0026 0.0014 0.0011 0.0012 0% NA1
2007, 2013 Lead mg/L NA <0.0001 <0.0001 0.00002J 0.00003J2007, 2013 Nickel mg/L 0.1 (d) 1. Basin Plan 0.0019 0.0013 0.0044 0.0011 0% NA1
2007, 2013 Selenium mg/L 0.005 16. 40 CFR 131.38 0.0012 0.0015 0.00083 0.0012 0% NA1
2007, 2013 Zinc mg/L 5.0 (d) 1. Basin Plan 0.0051 0.0026 0.00074J 0.0014J 0% NA1
Dissolved Metals2007 Antimony mg/L 0.006 1. Basin Plan 0.0008 0.0008 0.00047J 0.00038J 0% NA1
2007, 2013 Arsenic mg/L 0.34 acute /0.15 chronic 16. 40 CFR 131.38 0.0025 0.0026 0.0011 0.0017 0% NA1
2007, 2013 Cadmium mg/L (e) 16. 40 CFR 131.38 <0.0004 <0.0004 <0.0001 0.00002J 0% NA1
2007, 2013 Chromium mg/L (e) 16. 40 CFR 131.38 0.0001J <0.0005 0.000044J 0.00007J 0% NA1
2007, 2013 Copper mg/L (e) 16. 40 CFR 131.38 0.0029 0.0012 0.0013 0.0013 0% NA1
2007, 2013 Lead mg/L (e) 16. 40 CFR 131.38 <0.0001 <0.0001 <0.0002 0.00002J 0% NA1
2007, 2013 Nickel mg/L (e) 16. 40 CFR 131.38 0.0020 0.0012 0.004 0.00099 0% NA1
2007, 2013 Selenium mg/L NA 0.0012 0.0014 0.00086 0.00132007, 2013 Zinc mg/L (e) 16. 40 CFR 131.38 0.0061 0.0021 0.0016J 0.0025J 0% NA1
Organophosphorus Pesticides
2007, 2013 Chlorpyrifos µg/L 0.02 acute / 0.014 chronic 12. CA Dept. of Fish & Game, 2000 <0.002 <0.002 <0.01 <0.01 0% NA1
2007, 2013 Diazinon µg/L 0.08 acute / 0.05 chronic
12. CA Dept. of Fish & Game, 2000, 11. Chollas Creek TMDL for Diazinon, 10. USEPA, Aquatic Life Ambient
Water Quality Criteria Diazinon<0.004 <0.004 <0.01 <0.01 0% NA1
2007, 2013 Malathion µg/L 0.43 acute /0.1 chronic 13. CA Dept. of Fish & Game, 1998, 5. Goldbook <0.006 <0.006 <0.01 <0.01 0% NA1
Toxicity2007, 2013 Ceriodaphnia 96-hr LC50 (%) >100 >100 >100 >100 >100 0% NA1
2007, 2013 Ceriodaphnia 7-day survival NOEC (%) 100 100 100 100 100 0% NA1
2007, 2013 Ceriodaphnia 7-day reproduction NOEC (%) 100 50 50 100 <6.25CF 67% NA1
2007 Hyalella 96-hr LC50 (%) >100 >100 >100 >100 >100 0% NA1
2007, 2013 Selenastrum 96-hr NOEC (%) 100 100 <6.25 50 100 50% NA1
See last page for footnotes and source references.
AnalyteFrequency
Above Benchmarks
No
Sam
ples
Col
lect
ed
No
Sam
ples
Col
lect
ed
No
Sam
ples
Col
lect
ed
Historical Monitoring Data
No
Sam
ples
Col
lect
ed
2007-2008
Transitional Monitoring
Mean Ratio to Benchmarks
No
Sam
ples
Col
lect
ed
No
Sam
ples
Col
lect
ed
Permit Requirement Units Water Quality
Benchmarks Benchmark References 2010-2011

Dry Weather Historical Monitoring Table for LPC-TWAS-1
Blank spaces have been verified and no data is available.
NA indicate no criteria or published value was available or applicable to the matrix or program.
(c) Water Quality Benchmark are based on the San Diego Regional Water Quality Control Plan by watershed for the San Diego Region (Basin Plan), 1994 (with amendments effective on or before April 4, 2011) and may vary by hydrologic area.(d) Water Quality Benchmark for total metals is based on the MUN beneficial use as described in the Basin Plan, 1994 (with amendments effective on or before April 4, 2011).
CF- control failed; results not used in assessment.J-Analyte was detected at a concentration below the reporting limit and above the method detection limit. Reported value is estimated.NA1 Three or more years of data required to calculate the Mean Ratio to Benchmark.
SourcesPlease refer to the San Diego County Copermittee Regional Monitoring Program Benchmark Sources in Attachment B to Appendix A for benchmark source citations.
(b) Prior to the 2014-2015 monitoring year, Water Quality Benchmark was calculated based on CMC (salmonids absent) and CCC (early life stages present) using water temperature and pH described in the U.S. EPA, 1999 Update of Ambient Water Quality Criteria for Ammonia, EPA-822-R-99-014, December 1999. For 2014-2015 monitoring year, Water Quality Benchmark CMC and CCC were calculated based on pH and water temperature (when applicable) as described in the U.S. EPA, 2013 Aquatic Life Ambient Water Quality Criteria for Ammonia - Freshwater, EPA-822-R-13-001, April 2013.
(a) Water Quality Benchmark for Enterococcus is based on the maximum criteria for infrequently used freshwater area by the San Diego Regional Water Quality Control Plan for the San Diego Region (Basin Plan), 1994 (with amendments effective on or before April 4, 2011).
(e) Water Quality Benchmark for dissolved metal fractions are based on total hardness and are calculated as described by the USEPA Federal Register Doc. 40 CFR Part 131, May 18, 2000. The Criteria Maximum Concentration (CMC) and Continuous Criteria Concentration (CCC) were used.
Values with red bold font and shading do not meet Water Quality Benchmarks.

Dry Weather Historical Monitoring Table for LPC-TWAS-2
2008-2009 2009-2010 2011-2012 2013-2014
09/26/07-09/27/07
06/02/08-06/03/08 - - 09/21/10-
09/22/1005/11/11-05/12/11 - 09/12/12-
09/13/1205/14/13-05/15/13 - 09/23/14 05/13/15
Physical Chemistry2007, 2013 pH pH units 6.5-9.0 1. Basin Plan 7.60 7.68 7.51 7.79 7.55 7.53 7.32 7.96 0% 0.162007, 2013 Specific Conductivity µmhos/cm NA 3,430 3,070 3,890 3,050 3,510 2,680 3,886 2,3622007, 2013 Water Temperature Celsius NA 19.00 19.40 18.40 16.70 21.7 19.6 22.46 17.482007, 2013 Turbidity NTU 20 1. Basin Plan 4.4 6 1.8 2.2 2.1 3.8 1.6 2 0% 0.15Bacteriological2007, 2013 Enterococcus MPN/100 mL 151 (a) 1. Basin Plan 700 800 700 300 170 500 45 2,200 88% 4.482007, 2013 Fecal Coliform MPN/100 mL 400 1.Basin Plan REC-1/REC-2 300 170 170 220 110 80 78 700 13% 0.572007, 2013 Total Coliform MPN/100 mL NA 2,300 17,000 3,000 5,000 3,000 800 490 3,000Nutrients2007, 2013 Ammonia as N mg/L (b) 6. USEPA Water Quality Criteria (Freshwater) <0.05 0.04 0.073J 0.058J <0.1 0.091J <0.10 <0.10 0% 0.032007, 2013 Nitrate as N mg/L 10 1. Basin Plan 0.255 0.2 0.045J 0.27 0.13 0.13 0.24 0.047J 0% 0.022007, 2013 Nitrite as N mg/L 1 1. Basin Plan 0.01J 0.05 <0.1 0.039J <0.1 <0.1 0.014J <0.10 0% 0.042007, 2013 Total Kjeldahl Nitrogen mg/L NA 1.4 0.98 0.48 0.48 0.64 0.19 0.39 0.542007, 2013 Total Nitrogen (calculated) mg/L 1 1. Basin Plan 1.67 1.23 0.525 0.789 0.77 0.32 0.644 0.587 25% 0.822007 Dissolved Phosphorus mg/L 0.1 1. Basin Plan 0.062 0.09 0.056 0.061 0.082 0.11 0.093 0.1 13% 0.822007, 2013 Total Phosphorus mg/L 0.1 1. Basin Plan 0.101 0.130 0.068 0.075 0.096 0.14 0.12 0.12 63% 1.06General Chemistry2007 Biochemical Oxygen Demand mg/L 10 8. McNeeley (1979) <2 <2 1.7J 1.6J 1.3J 0.94J <2.0 <2.0 0% 0.122007 Chemical Oxygen Demand mg/L 120 4. MSGP 2015 41 27 35 24 26 14 34 27 0% 0.242007, 2013 Dissolved Organic Carbon mg/L NA 11.8 8.5 4.9 6.5 7.6 6.9 5.9 9.22007, 2013 Total Organic Carbon mg/L NA 12 8.1 4.6 6.5 6.8 7.9 6.1 9.62007 Oil and Grease mg/L 10 1. Basin Plan, 3. Anacostia River TMDL <2.2 1.5J <5 <5 <5 <5 <5.0 2.1J 0% 0.222007, 2013 Surfactants (MBAS) mg/L 0.5 1. Basin Plan 0.11 0.083 0.048J 0.073 0.045J 0.086 0.11 0.083 0% 0.162007, 2013 Total Dissolved Solids mg/L 500 (c) 1. Basin Plan 1,942 1,802 2,600 2,000 2,200 1,700 2,200 1,200 100% 3.912007, 2013 Total Suspended Solids mg/L 58 14. NSQD, 1. Basin Plan 1.3J 9.7 2 3 3 2 2 1 0% 0.052007, 2013 Total Hardness mg CaCO3/L NA 506.4 475.7 930 770 790 684 1,040 521Total Metals2007 Antimony mg/L 0.006 (d) 1. Basin Plan 0.0005 0.0004J 0.00023J 0.00021J 0.00017J 0.00029J 0.00016J 0.00044J 0% 0.052007, 2013 Arsenic mg/L 0.01 (d) 1. Basin Plan 0.0053 0.0037 0.0024 0.0025 0.003 0.0025 0.0025 0.0022 0% 0.302007, 2013 Cadmium mg/L 0.005 (d) 1. Basin Plan <0.0004 <0.0004 <0.0001 0.00002J 0.00002J 0.000028J <0.00010 <0.00010 0% 0.022007, 2013 Chromium mg/L 0.05 (d) 1. Basin Plan 0.0002J 0.0001J 0.0014 0.00011J <0.0002 0.00012J 0.000097J 0.00019J 0% 0.012007, 2013 Copper mg/L 1.0 (d) 1. Basin Plan 0.0021 0.0019 0.0052 0.0011 0.00028J 0.0016 0.00075 0.0021 0% 0.002007, 2013 Lead mg/L NA 0.0001 0.0001 0.000062J 0.00012J 0.00005J 0.000031J 0.000075J <0.000202007, 2013 Nickel mg/L 0.1 (d) 1. Basin Plan 0.0029 0.0014 0.0086 0.00098 0.0012 0.004 0.001 0.0035 0% 0.032007, 2013 Selenium mg/L 0.005 16. 40 CFR 131.38 0.0007 0.0008 0.0037 0.00063 0.00041 0.00095 0.00028J 0.0013 0% 0.222007, 2013 Zinc mg/L 5.0 (d) 1. Basin Plan 0.0047 0.0031 0.0032J 0.0017J <0.005 0.0016J 0.0014J 0.0036J 0% 0.00Dissolved Metals2007 Antimony mg/L 0.006 1. Basin Plan 0.0005 0.0003J 0.00025J 0.00021J 0.00016J 0.0003J 0.00015J 0.00044J 0% 0.05
2007, 2013 Arsenic mg/L 0.34 acute /0.15 chronic 16. 40 CFR 131.38 0.0045 0.0030 0.0021 0.0023 0.0028 0.0024 0.0023 0.0021 0% 0.02
2007, 2013 Cadmium mg/L (e) 16. 40 CFR 131.38 <0.0004 <0.0004 0.000021J 0.00002J 0.00003J 0.000024J <0.00010 <0.00010 0% 0.012007, 2013 Chromium mg/L (e) 16. 40 CFR 131.38 0.0001J <0.0005 0.000053J 0.00006J <0.0002 0.00011J 0.000043J 0.00013J 0% 0.002007, 2013 Copper mg/L (e) 16. 40 CFR 131.38 0.0020 0.0012 0.0009 0.0011 0.00032J 0.0017 0.00049J 0.002 0% 0.042007, 2013 Lead mg/L (e) 16. 40 CFR 131.38 <0.0001 <0.0001 0.000021J 0.00006J <0.0002 <0.0002 <0.00020 <0.00020 0% 0.012007, 2013 Nickel mg/L (e) 16. 40 CFR 131.38 0.0029 0.0014 0.0036 0.001 0.0012 0.0041 0.00099 0.0035 0% 0.012007, 2013 Selenium mg/L NA 0.0006 0.0008 0.00047 0.00067 0.00044 0.0011 0.00022J 0.00142007, 2013 Zinc mg/L (e) 16. 40 CFR 131.38 0.0049 0.0020 0.0015J 0.003J 0.0022J 0.0027J 0.0012J 0.0029J 0% 0.01Organophosphorus Pesticides
2007, 2013 Chlorpyrifos µg/L 0.02 acute / 0.014 chronic 12. CA Dept. of Fish & Game, 2000 <0.002 <0.002 <0.01 <0.01 <0.01 <0.01 <0.010 <0.010 0% 0.29
2007, 2013 Diazinon µg/L 0.08 acute / 0.05 chronic
12. CA Dept. of Fish & Game, 2000, 11. Chollas Creek TMDL for Diazinon, 10. USEPA, Aquatic Life Ambient
Water Quality Criteria Diazinon<0.004 <0.004 <0.01 <0.01 0.01 <0.01 <0.010 <0.010 0% 0.10
2007, 2013 Malathion µg/L 0.43 acute /0.1 chronic 13. CA Dept. of Fish & Game, 1998, 5. Goldbook <0.006 <0.006 <0.01 <0.01 <0.01 <0.01 <0.010 <0.010 0% 0.05
Toxicity2007, 2013 Ceriodaphnia 96-hr LC50 (%) >100 >100 >100 >100 >100 >100 >100 >100 >100 0% 1.002007, 2013 Ceriodaphnia 7-day survival NOEC (%) 100 100 100 100 100 100 100 100 100 0% 1.002007, 2013 Ceriodaphnia 7-day reproduction NOEC (%) 100 50 100 100 100C 100 100 50 100 25% 1.252007 Hyalella 96-hr LC50 (%) >100 >100 >100 >100 >100 >100 >100 >100 >100 0% 1.002007, 2013 Selenastrum 96-hr NOEC (%) 100 100 100 50 50 50 100 50 100 50% 1.50See last page for footnotes and source references.
2007-2008
Transitional Monitoring
Mean Ratio to Benchmarks
No
Sam
ples
Col
lect
ed
No
Sam
ples
Col
lect
ed
No
Sam
ples
Col
lect
ed
No
Sam
ples
Col
lect
ed
2014-20152012-20132010-2011
Historical Monitoring Data
AnalyteFrequency
Above Benchmarks
Permit Requirement Units Water Quality
Benchmarks Benchmark References

Dry Weather Historical Monitoring Table for LPC-TWAS-2
Blank spaces have been verified and no data is available.
NA indicate no criteria or published value was available or applicable to the matrix or program.
(c) Water Quality Benchmark are based on the San Diego Regional Water Quality Control Plan by watershed for the San Diego Region (Basin Plan), 1994 (with amendments effective on or before April 4, 2011) and may vary by hydrologic area.(d) Water Quality Benchmark for total metals is based on the MUN beneficial use as described in the Basin Plan, 1994 (with amendments effective on or before April 4, 2011).
C-Control failed; however, sample showed no toxic response.J-Analyte was detected at a concentration below the reporting limit and above the method detection limit. Reported value is estimated.
SourcesPlease refer to the San Diego County Copermittee Regional Monitoring Program Benchmark Sources in Attachment B to Appendix A for benchmark source citations.
(b) Prior to the 2014-2015 monitoring year, Water Quality Benchmark was calculated based on CMC (salmonids absent) and CCC (early life stages present) using water temperature and pH described in the U.S. EPA, 1999 Update of Ambient Water Quality Criteria for Ammonia, EPA-822-R-99-014, December 1999. For 2014-2015 monitoring year, Water Quality Benchmark CMC and CCC were calculated based on pH and water temperature (when applicable) as described in the U.S. EPA, 2013 Aquatic Life Ambient Water Quality Criteria for Ammonia - Freshwater, EPA-822-R-13-001, April 2013.
(a) Water Quality Benchmark for Enterococcus is based on the maximum criteria for infrequently used freshwater area by the San Diego Regional Water Quality Control Plan for the San Diego Region (Basin Plan), 1994 (with amendments effective on or before April 4, 2011).
(e) Water Quality Benchmark for dissolved metal fractions are based on total hardness and are calculated as described by the USEPA Federal Register Doc. 40 CFR Part 131, May 18, 2000. The Criteria Maximum Concentration (CMC) and Continuous Criteria Concentration (CCC) were used.
Values with red bold font and shading do not meet Water Quality Benchmarks.

Dry Weather Historical Monitoring Table for LPC-TWAS-3
2013-2014
09/12/12-09/13-12
05/14/13-05/15/13 - 09/23/14 05/13/15
Physical Chemistry2007, 2013 pH pH units 6.5-9.0 1. Basin Plan 7.7 7.69 7.61 7.82 0% NA1
2007, 2013 Specific Conductivity µmhos/cm NA 4,950 4,180 5,287 4,7572007, 2013 Water Temperature Celsius NA 24.2 19.5 22.35 18.142007, 2013 Turbidity NTU 20 1. Basin Plan 6.9 2.8 0.9 1 0% NA1
Bacteriological2007, 2013 Enterococcus MPN/100 mL 151 (a) 1. Basin Plan 230 300 230 17,000 100% NA1
2007, 2013 Fecal Coliform MPN/100 mL 4,000 1.Basin Plan REC-1/REC-2 300 300 20 1,300 25% NA1
2007, 2013 Total Coliform MPN/100 mL NA 17,000 1,400 7,000 9,000Nutrients2007, 2013 Ammonia as N mg/L (b) 6. USEPA Water Quality Criteria (Freshwater) <0.1 0.064J <0.10 <0.10 0% NA1
2007, 2013 Nitrate as N mg/L 10 1. Basin Plan 0.081J 0.063J 0.1 <0.10 0% NA1
2007, 2013 Nitrite as N mg/L 1 1. Basin Plan 0.011J <0.1 0.015J <0.10 0% NA1
2007, 2013 Total Kjeldahl Nitrogen mg/L NA 0.6 0.15 0.52 0.332007, 2013 Total Nitrogen (calculated) mg/L 1 1. Basin Plan 0.692 0.213 0.635 0.33 0% NA1
2007 Dissolved Phosphorus mg/L 0.1 1. Basin Plan 0.066 0.083 0.1 0.085 0% NA1
2007, 2013 Total Phosphorus mg/L 0.1 1. Basin Plan 0.12 0.11 0.18 0.11 100% NA1
General Chemistry2007 Biochemical Oxygen Demand mg/L 10 8. McNeeley (1979) 0.79J 14 <2.0 <2.0 25% NA1
2007 Chemical Oxygen Demand mg/L 120 4. MSGP 2015 27 13 34 23 0% NA1
2007 Dissolved Organic Carbon mg/L NA 5.7 2.7 3.4 4.82007, 2013 Total Organic Carbon mg/L NA 5 2.9 3.6 5.22007, 2013 Oil and Grease mg/L 10 1. Basin Plan, 3. Anacostia River TMDL <5 <5 <5.0 3.3J 0% NA1
2007, 2013 Surfactants (MBAS) mg/L 0.5 1. Basin Plan 0.028J 0.056J 0.1 0.07 0% NA1
2007, 2013 Total Dissolved Solids mg/L 500 (c) 1. Basin Plan 3,800 3,200 3,800 3,100 100% NA1
2007, 2013 Total Suspended Solids mg/L 58 14. NSQD, 1. Basin Plan 45 8 40 2 0% NA1
2007, 2013 Total Hardness mg CaCO3/L NA 1,400 1,370 1,750 1,490Total Metals2007 Antimony mg/L 0.006 (d) 1. Basin Plan 0.00009J 0.00015J 0.000080J 0.00016J 0% NA1
2007, 2013 Arsenic mg/L 0.01 (d) 1. Basin Plan 0.0055 0.0052 0.0056 0.0046 0% NA1
2007, 2013 Cadmium mg/L 0.005 (d) 1. Basin Plan <0.0001 <0.0001 <0.00010 <0.00010 0% NA1
2007, 2013 Chromium mg/L 0.05 (d) 1. Basin Plan <0.0002 0.0002 0.0012 0.000068J 0% NA1
2007, 2013 Copper mg/L 1.0 (d) 1. Basin Plan <0.0005 0.0012 0.00075 0.0015 0% NA1
2007, 2013 Lead mg/L NA 0.00007J 0.000094J 0.00014J <0.000202007, 2013 Nickel mg/L 0.1 (d) 1. Basin Plan 0.0016 0.0077 0.0029 0.0078 0% NA1
2007, 2013 Selenium mg/L 0.005 16. 40 CFR 131.38 <0.0004 0.0015 0.00015J 0.0027 0% NA1
2007, 2013 Zinc mg/L 5.0 (d) 1. Basin Plan 0.0015J 0.0014J 0.0049J 0.00097J 0% NA1
Dissolved Metals2007 Antimony mg/L 0.006 1. Basin Plan 0.00009J 0.00016J 0.000073J 0.00018J 0% NA1
2007, 2013 Arsenic mg/L 0.34 acute /0.15 chronic 16. 40 CFR 131.38 0.0054 0.0053 0.0044 0.0042 0% NA1
2007, 2013 Cadmium mg/L (e) 16. 40 CFR 131.38 <0.0001 <0.0001 <0.00010 <0.00010 0% NA1
2007, 2013 Chromium mg/L (e) 16. 40 CFR 131.38 <0.0002 0.000064J 0.000034J 0.000043J 0% NA1
2007, 2013 Copper mg/L (e) 16. 40 CFR 131.38 <0.0005 0.0014 0.00025J 0.002 0% NA1
2007, 2013 Lead mg/L (e) 16. 40 CFR 131.38 0.00009J <0.0002 <0.00020 <0.00020 0% NA1
2007, 2013 Nickel mg/L (e) 16. 40 CFR 131.38 0.0016 0.0084 0.0017 0.0086 0% NA1
2007, 2013 Selenium mg/L NA <0.0004 0.0019 0.00012J 0.00342007, 2013 Zinc mg/L (e) 16. 40 CFR 131.38 0.0029J 0.002J 0.00096J 0.0016J 0% NA1
Organophosphorus Pesticides
2007, 2013 Chlorpyrifos µg/L 0.02 acute / 0.014 chronic 12. CA Dept. of Fish & Game, 2000 <0.01 <0.01 0.01 <0.010 0% NA1
2007, 2013 Diazinon µg/L 0.08 acute / 0.05 chronic
12. CA Dept. of Fish & Game, 2000, 11. Chollas Creek TMDL for Diazinon, 10. USEPA, Aquatic Life Ambient
Water Quality Criteria Diazinon<0.01 <0.01 <0.010 <0.010 0% NA1
2007, 2013 Malathion µg/L 0.43 acute /0.1 chronic 13. CA Dept. of Fish & Game, 1998, 5. Goldbook <0.01 <0.01 <0.010 <0.010 0% NA1
Toxicity2007, 2013 Ceriodaphnia 96-hr LC50 (%) >100 >100 >100 >100 >100 0% NA1
2007, 2013 Ceriodaphnia 7-day survival NOEC (%) 100 100 100 100 100 0% NA1
2007, 2013 Ceriodaphnia 7-day reproduction NOEC (%) 100 25 50 50 25 100% NA1
2007 Hyalella 96-hr LC50 (%) >100 >100 >100 >100 >100 0% NA1
2007, 2013 Selenastrum 96-hr NOEC (%) 100 50 50 25 25 100% NA1
See last page for footnotes and source references.
Mean Ratio to BenchmarksAnalyte
No
Sam
ples
Col
lect
ed
Transitional Monitoring
Permit Requirement Units Water Quality
Benchmarks 2014-20152012-2013Benchmark References
Historical Monitoring DataFrequency
Above Benchmarks

Dry Weather Historical Monitoring Table for LPC-TWAS-3
Blank spaces have been verified and no data is available.
NA indicate no criteria or published value was available or applicable to the matrix or program.
(c) Water Quality Benchmark are based on the San Diego Regional Water Quality Control Plan by watershed for the San Diego Region (Basin Plan), 1994 (with amendments effective on or before April 4, 2011) and may vary by hydrologic area.(d) Water Quality Benchmark for total metals is based on the MUN beneficial use as described in the Basin Plan, 1994 (with amendments effective on or before April 4, 2011).
CF- control failed; results not used in assessment.J-Analyte was detected at a concentration below the reporting limit and above the method detection limit. Reported value is estimated.NA1 Three or more years of data required to calculate the Mean Ratio to Benchmark.
SourcesPlease refer to the San Diego County Copermittee Regional Monitoring Program Benchmark Sources in Attachment B to Appendix A for benchmark source citations.
(a) Water Quality Benchmark for Enterococcus is based on the maximum criteria for infrequently used freshwater area by the San Diego Regional Water Quality Control Plan for the San Diego Region (Basin Plan), 1994 (with amendments effective on or before April 4, 2011).
(b) Prior to the 2014-2015 monitoring year, Water Quality Benchmark was calculated based on CMC (salmonids absent) and CCC (early life stages present) using water temperature and pH described in the U.S. EPA, 1999 Update of Ambient Water Quality Criteria for Ammonia, EPA-822-R-99-014, December 1999. For 2014-2015 monitoring year, Water Quality Benchmark CMC and CCC were calculated based on pH and water temperature (when applicable) as described in the U.S. EPA, 2013 Aquatic Life Ambient Water Quality Criteria for Ammonia - Freshwater, EPA-822-R-13-001, April 2013.
(e) Water Quality Benchmark for dissolved metal fractions are based on total hardness and are calculated as described by the USEPA Federal Register Doc. 40 CFR Part 131, May 18, 2000. The Criteria Maximum Concentration (CMC) and Continuous Criteria Concentration (CCC) were used.
Values with red bold font and shading do not meet Water Quality Benchmarks.

Dry Weather Historical Monitoring Table for LPC-MLS
Long Term and
Transitional Monitoring
Long Term and
Transitional Monitoring
Long Term Monitoring
Long Term and
Transitional Monitoring
2008-2009 2009-2010 2011-2012 2013-2014
09/26/07-09/27/07
06/02/08-06/03/08 - - 09/22/10 05/11/11-
05/12/11 - 09/12/12-09/13/12
05/14/13-05/15/13 - 09/23/14 01/07/15 05/13/15
Physical Chemistry2013 Dissolved Oxygen mg/L <5.0 (a) 1. Basin Plan 4.79 10.29 8.33 33% NA1
2007, 2013 pH pH units 6.5-9.0 1. Basin Plan 8.07 8.10 8.10 7.96 7.92 7.75 7.57 7.19 8.08 0% 0.002007, 2013 Specific Conductivity µmhos/cm NA 3,500 3,200 3,520 3,290 3,200 1,966 3,858 2,541 2,1472007, 2013 Water Temperature Celsius NA 17.70 19.10 17.50 18.00 21.9 17.8 20.88 7.35 17.242007, 2013 Turbidity NTU 20 1. Basin Plan 3.25 5 0.78 3.1 6.4 2.3 1.4 0.3 1.7 0% 0.13Bacteriological2007, 2013 Enterococcus MPN/100 mL 151 (b) 1. Basin Plan 300 170 700 170 110 500 1,700 <20 500 78% 3.072007, 2013 Fecal Coliform MPN/100 mL 4,000 1.Basin Plan REC-1/REC-2 20 80 40 130 500 130 700 20 500 0% 0.132007, 2013 Total Coliform MPN/100 mL NA 2,200 1,879 800 700 7,000 300 13,000 220 1100Nutrients2007, 2013 Ammonia as N mg/L (c) 6. USEPA Water Quality Criteria (Freshwater) 0.01J 0.03 <0.1 <0.1 0.06J <0.1 <0.10 <0.10 <0.10 0% 0.032007, 2013 Nitrate as N mg/L 10 1. Basin Plan <0.05 0.03J <0.1 0.067J <0.1 0.07J 0.079J <0.10 <0.10 0% 0.012007, 2013 Nitrite as N mg/L 1 1. Basin Plan <0.05 0.05 <0.1 0.043J <0.1 <0.1 0.015J <0.10 0.014J 0% 0.042007, 2013 Total Kjeldahl Nitrogen mg/L NA 1.1 0.84 0.44 0.51 0.43 0.27 0.4 0.21 0.332007, 2013 Total Nitrogen (calculated) mg/L 1 1. Basin Plan 1.1 0.92 0.44 0.62 0.43 0.34 0.494 0.21 0.344 11% 0.542007 Dissolved Phosphorus mg/L 0.1 1. Basin Plan 0.04J 0.03J 0.082 0.12 0.08 0.093 0.083 NR 0.067 13% 0.742013 Orthophosphate mg/L NA 0.075 AE 0.0682007, 2013 Total Phosphorus mg/L 0.1 1. Basin Plan 0.07 0.09 0.1 0.16 0.11 0.11 0.1 0.041 0.085 33% 0.96General Chemistry2007 Biochemical Oxygen Demand mg/L 10 8. McNeeley (1979) <2 <2 1.5J 1.5J 0.94J 0.95J <2.0 NR <2.0 0% 0.112007 Chemical Oxygen Demand mg/L 120 4. MSGP 2015 45 13 33 41 20 13 25 NR 23 0% 0.222007, 2013 Dissolved Organic Carbon mg/L NA 13.6 9.9 4.5 5.5 6.4 5.3 5.3 5 8.22007, 2013 Total Organic Carbon mg/L NA 13.2 9.5 4 5.3 6.3 5.9 5.5 5.1 8.22007 Oil and Grease mg/L 10 1. Basin Plan, 3. Anacostia River TMDL <1.1 <5 <5 <5 <5 <5 <5.0 NR <5.0 0% 0.232013 Sulfate mg/L 250 (a) 1. Basin Plan 570 310 260 #DIV/0! NA1
2007, 2013 Surfactants (MBAS) mg/L 0.5 1. Basin Plan 0.15 0.11 0.033J 0.051 0.033J 0.071 0.096 0.084 0.083 0% 0.162007, 2013 Total Dissolved Solids mg/L 500 (a) 1. Basin Plan 2,057 1,798 2,300 2,100 2,300 1,700 2,300 1,500 1,300 100% 3.862007, 2013 Total Suspended Solids mg/L 58 14. NSQD, 1. Basin Plan 5.3 8 3 26 14 5 8 1 4 0% 0.142007, 2013 Total Hardness mg CaCO3/L NA 547.5 511.3 890 910 840 688 1,160 707 571Total Metals2007 Antimony mg/L 0.006 (d) 1. Basin Plan 0.0004J 0.0004J 0.00015J 0.0002J 0.00017J 0.00032J 0.00027J NR 0.00044J 0% 0.052007, 2013 Arsenic mg/L 0.01 (d) 1. Basin Plan 0.0048 0.0037 0.0029 0.0038 0.0036 0.0027 0.0028 0.0017 0.0025 0% 0.322007, 2013 Cadmium mg/L 0.005 (d) 1. Basin Plan <0.0004 <0.0004 <0.0001 0.00002J 0.00003J 0.000027J <0.00010 <0.00010 <0.00010 0% 0.022007, 2013 Chromium mg/L 0.05 (d) 1. Basin Plan 0.0002J 0.0002J 0.00032 0.00049 <0.0002 0.00018J 0.00024 0.000056J 0.0002 0% 0.002013 Chromium, Trivalent mg/L NA <0.00050 <0.00020 0.00016J2013 Chromium, Hexavalent mg/L 0.010 (d) 0.00012J 0.00012 0.000041 0% NA1
2007, 2013 Copper mg/L 1.0 (d) 1. Basin Plan 0.0017 0.0009 0.00096 0.0012 <0.0005 0.0013 0.00083 0.001 0.0019 0% 0.002013 Iron mg/L 0.3 (a) 1. Basin Plan 0.26 0.083 0.16 0% NA1
2007, 2013 Lead mg/L NA 0.0002 0.00016 0.00024 0.00063 0.00011J 0.0001J 0.00035 0.000035J <0.000202013 Manganese mg/L 0.05 (a) 1. Basin Plan 0.36 0.041 0.085 67% NA1
2013 Mercury mg/L 0.002 (d) <0.000050 0.0000050J <0.0000502007, 2013 Nickel mg/L 0.1 (d) 1. Basin Plan 0.002 0.0018 0.0032 0.0013 0.0011 0.0039 0.0011 0.00086 0.0033 0% 0.022007, 2013 Selenium mg/L 0.005 16. 40 CFR 131.38 0.0005 0.0005 0.00036J 0.00044 <0.0004 0.00089 0.00019J 0.00021J 0.0011 0% 0.102013 Silver mg/L 0.1 (d) 0.000050J <0.00020 0.000064J 0% NA1
2013 Thallium mg/L 0.002 (d) <0.00020 <0.00020 <0.00020 0% NA1
2007, 2013 Zinc mg/L 5.0 (d) 1. Basin Plan 0.002 0.002 0.0015J 0.0045J 0.0018J 0.0014J 0.0039J 0.0015J 0.0017J 0% 0.00Dissolved Metals2007 Antimony mg/L 0.006 1. Basin Plan 0.0005 0.0004J 0.00015J 0.00018J 0.00016J 0.00032J 0.00026J NR 0.00046J 0% 0.05
2007, 2013 Arsenic mg/L 0.34 acute /0.15 chronic 16. 40 CFR 131.38 0.0049 0.0036 0.0028 0.0033 0.0035 0.0024 0.0025 0.0015 0.0022 0% 0.02
2007, 2013 Cadmium mg/L (e) 16. 40 CFR 131.38 <0.0004 <0.0004 <0.0001 <0.0001 0.00003J 0.000018J <0.00010 <0.00010 <0.00010 0% 0.012007, 2013 Chromium mg/L (e) 16. 40 CFR 131.38 0.0001J <0.0005 0.000043J 0.00005J <0.0002 0.000086J 0.000030J 0.000043J 0.000054J 0% 0.012013 Chromium, Trivalent mg/L (e) 16. 40 CFR 131.38 AE AE 0.00002J 0% NA1
2013 Chromium, Hexavalent mg/L 0.011 16. 40 CFR 131.38 AE AE 0.000039 0% NA1
2007, 2013 Copper mg/L (e) 16. 40 CFR 131.38 0.0018 0.0009 0.00079 0.00066 <0.0005 0.0012 0.00045J 0.00091 0.0021 0% 0.032013 Iron mg/L NA 0.000069J 0.00007J 0.00004J <0.0002 <0.010 <0.010 0.0015J2007, 2013 Lead mg/L (e) 16. 40 CFR 131.38 <0.0001 <0.0001 0.000069J 0.00007J 0.00004J <0.0002 <0.00020 <0.00020 <0.00020 0% 0.002013 Manganese mg/L NA 0.053 0.036 0.00552013 Mercury mg/L NA <0.000050 0.0000050J <0.0000502007, 2013 Nickel mg/L (e) 16. 40 CFR 131.38 0.0027 0.0016 0.0031 0.00094 0.0011 0.0035 0.00092 0.00083 0.0032 0% 0.012007, 2013 Selenium mg/L NA 0.0006 0.0005 0.00033J 0.00043 <0.0004 0.00083 0.00015J 0.00019J 0.00122013 Silver mg/L (e) 16. 40 CFR 131.38 0.000062J <0.00020 <0.00020 0% NA1
2013 Thallium mg/L NA <0.00020 <0.00020 <0.000202007, 2013 Zinc mg/L (e) 16. 40 CFR 131.38 0.0036 0.0006 0.0015J 0.0023J 0.0019J 0.0019J 0.0015J 0.0012J 0.0014J 0% 0.00
No
Sam
ples
Col
lect
ed
Permit Requirement Units
2012-2013Analyte Benchmark References
2010-2011 2014-2015
Frequency Above
Benchmarks
Mean Ratio to Benchmarks
Water Quality Benchmarks
No
Sam
ples
Col
lect
ed
No
Sam
ples
Col
lect
ed
No
Sam
ples
Col
lect
ed
2007-2008
Historical Monitoring Data

Dry Weather Historical Monitoring Table for LPC-MLS
Long Term and
Transitional Monitoring
Long Term and
Transitional Monitoring
Long Term Monitoring
Long Term and
Transitional Monitoring
2008-2009 2009-2010 2011-2012 2013-2014
09/26/07-09/27/07
06/02/08-06/03/08 - - 09/22/10 05/11/11-
05/12/11 - 09/12/12-09/13/12
05/14/13-05/15/13 - 09/23/14 01/07/15 05/13/15
Permit Requirement Units
2012-2013Analyte Benchmark References
2010-2011 2014-2015
Frequency Above
Benchmarks
Mean Ratio to Benchmarks
Water Quality Benchmarks
2007-2008
Historical Monitoring Data
Organophosphorus Pesticides2013 Azinphos methyl (Guthion) µg/L NA <0.010 <0.010 <0.0102013 Bolstar µg/L NA <0.010 <0.010 <0.010
2007, 2013 Chlorpyrifos µg/L 0.02 acute / 0.014 chronic 12. CA Dept. of Fish & Game, 2000 <0.002 <0.002 <0.01 <0.01 <0.01 <0.01 <0.010 <0.010 <0.010 0% 0.29
2013 Coumaphos µg/L NA 0.00015J 0.00019J 0.00122013 Demeton-o µg/L NA 0.00015J 0.00019J 0.00122013 Demeton-s µg/L NA 0.0015J 0.0012J 0.0014J
2007, 2013 Diazinon µg/L 0.08 acute / 0.05 chronic
12. CA Dept. of Fish & Game, 2000, 11. Chollas Creek TMDL for Diazinon, 10. USEPA, Aquatic Life Ambient
Water Quality Criteria Diazinon<0.004 <0.004 <0.01 <0.01 <0.01 <0.01 <0.010 <0.010 <0.010 0% 0.09
2013 Dichlorvos µg/L NA <0.010 <0.010 <0.0102013 Dimethoate µg/L NA <0.010 <0.010 <0.0102013 Disulfoton µg/L NA <0.010 <0.010 <0.0102013 Ethoprop µg/L NA <0.010 <0.010 <0.0102013 Ethyl parathion µg/L NA <0.010 <0.010 <0.0102013 Fensulfothion µg/L NA <0.010 <0.010 0.0059J2013 Fenthion µg/L NA <0.010 <0.010 <0.010
2007, 2013 Malathion µg/L 0.43 acute /0.1 chronic 13. CA Dept. of Fish & Game, 1998, 5. Goldbook <0.006 <0.006 <0.01 <0.01 <0.01 <0.01 <0.010 <0.010 <0.010 0% 0.05
2013 Merphos µg/L NA <0.010 <0.010 <0.0102013 Methyl parathion µg/L NA <0.010 <0.010 <0.0102013 Mevinphos µg/L NA <0.010 <0.010 <0.0102013 Naled µg/L NA <0.010 <0.010 <0.0102013 Phorate µg/L NA <0.010 <0.010 <0.0102013 Ronnel µg/L NA <0.010 <0.010 <0.0102013 Stirophos µg/L NA <0.010 <0.010 <0.0102013 Tokuthion (Prothiofos) µg/L NA <0.010 <0.010 <0.0102013 Trichloronate µg/L NA <0.010 <0.010 <0.010Pyrethroids2013 Allethrin µg/L NA <0.002 <0.002 <0.0022013 Bifenthrin µg/L 0.0093 15. Anderson et al., 2006 <0.002 <0.002 <0.002 0% NA1
2013 Cyfluthrin µg/L 0.344 17. Wheelock et al., 2004 <0.002 <0.002 <0.002 0% NA1
2013 Cyhalothrin, Total Lambda µg/L 0.2 17. Wheelock et al., 2004 <0.002 <0.002 <0.002 0% NA1
2013 Cypermethrin µg/L 0.344 17. Wheelock et al., 2004 <0.002 <0.002 <0.002 0% NA1
2013 Danitol (Fenpropathrin) µg/L NA <0.002 <0.002 <0.0022013 Deltamethrin/Tralomethrin µg/L NA <0.002 <0.002 <0.0022013 Esfenvalerate µg/L 0.25 17. Wheelock et al., 2004 <0.002 <0.002 <0.002 0% NA1
2013 Fenvalerate µg/L NA <0.002 <0.002 <0.0022013 Fluvalinate µg/L NA <0.002 <0.002 <0.0022013 Permethrin µg/L 0.021 15. Anderson et al., 2006 <0.01 <0.01 <0.01 0% NA1
2013 Prallethrin µg/L NA <0.002 <0.002 <0.0022013 Resmethrin µg/L NA <0.01 <0.01 <0.01Toxicity2007, 2013 Ceriodaphnia 96-hr LC50 (%) >100 >100 >100 >100 >100 >100 >100 >100 NR >100 0% 1.002007, 2013 Ceriodaphnia 7-day survival NOEC (%) 100 100 100 100 100 100 100 100 NR 100 0% 1.002007, 2013 Ceriodaphnia 7-day reproduction NOEC (%) 100 50 50 100 100 100 100 50 NR 100 38% 1.382007 Hyalella 96-hr LC50 (%) >100 >100 >100 >100 >100 >100 >100 >100 NR >100 0% 1.002007, 2013 Selenastrum 96-hr NOEC (%) 100 100 100 50 100 50 100 50 NR 100 38% 1.382013 Strongylocentrotus 96-hr TST Pass/Fail Pass Pass Pass 0%See last page for footnotes and source references.
No
Sam
ples
Col
lect
ed
No
Sam
ples
Col
lect
ed
No
Sam
ples
Col
lect
ed
No
Sam
ples
Col
lect
ed

Dry Weather Historical Monitoring Table for LPC-MLS
Blank spaces have been verified and no data is available.
NA indicate no criteria or published value was available or applicable to the matrix or program.(a) Water Quality Benchmark are based on the San Diego Regional Water Quality Control Plan by watershed for the San Diego Region (Basin Plan), 1994 (with amendments effective on or before April 4, 2011) and may vary by hydrologic area.
(d) Water Quality Benchmark for total metals is based on the MUN beneficial use as described in the Basin Plan, 1994 (with amendments effective on or before April 4, 2011).
AE - Analysis error.J-Analyte was detected at a concentration below the reporting limit and above the method detection limit. Reported value is estimated.NR -Sampling of this analyte not required for transitional monitoring (RWQCB Order No. R9-2007-0001) and/or for long term monitoring (RWQCB Order No. R9-2013-0001).
SourcesPlease refer to the San Diego County Copermittee Regional Monitoring Program Benchmark Sources in Attachment B to Appendix A for benchmark source citations.
(c) Prior to the 2014-2015 monitoring year, Water Quality Benchmark was calculated based on CMC (salmonids absent) and CCC (early life stages present) using water temperature and pH described in the U.S. EPA, 1999 Update of Ambient Water Quality Criteria for Ammonia, EPA-822-R-99-014, December 1999. For 2014-2015 monitoring year, Water Quality Benchmark CMC and CCC were calculated based on pH and water temperature (when applicable) as described in the U.S. EPA, 2013 Aquatic Life Ambient Water Quality Criteria for Ammonia - Freshwater, EPA-822-R-13-001, April 2013.
(b) Water Quality Benchmark for Enterococcus is based on the maximum criteria for infrequently used freshwater area by the San Diego Regional Water Quality Control Plan for the San Diego Region (Basin Plan), 1994 (with amendments effectiveon or before April 4, 2011).
(e) Water Quality Benchmark for dissolved metal fractions are based on total hardness and are calculated as described by the USEPA Federal Register Doc. 40 CFR Part 131, May 18, 2000. The Criteria Maximum Concentration (CMC) and Continuous Criteria Concentration (CCC) were used.
Values with red bold font and shading do not meet Water Quality Benchmarks
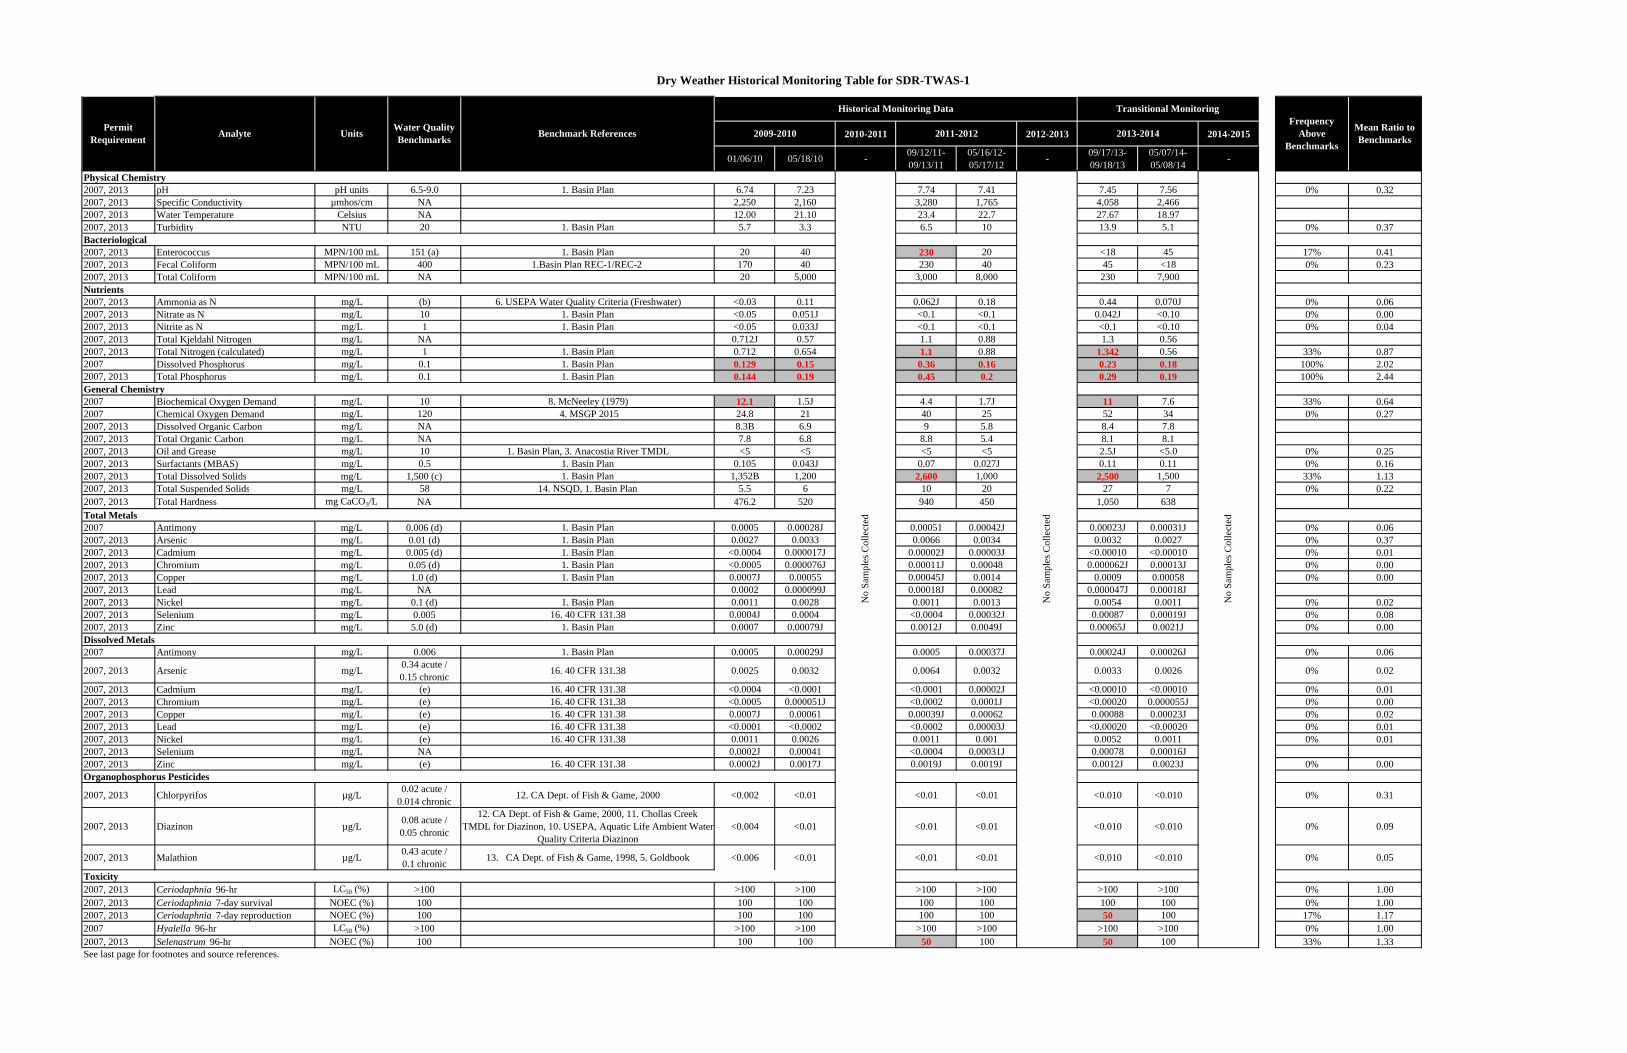
Dry Weather Historical Monitoring Table for SDR-TWAS-1
2010-2011 2012-2013 2014-2015
01/06/10 05/18/10 - 09/12/11-09/13/11
05/16/12-05/17/12 - 09/17/13-
09/18/1305/07/14-05/08/14 -
Physical Chemistry2007, 2013 pH pH units 6.5-9.0 1. Basin Plan 6.74 7.23 7.74 7.41 7.45 7.56 0% 0.322007, 2013 Specific Conductivity µmhos/cm NA 2,250 2,160 3,280 1,765 4,058 2,4662007, 2013 Water Temperature Celsius NA 12.00 21.10 23.4 22.7 27.67 18.972007, 2013 Turbidity NTU 20 1. Basin Plan 5.7 3.3 6.5 10 13.9 5.1 0% 0.37Bacteriological2007, 2013 Enterococcus MPN/100 mL 151 (a) 1. Basin Plan 20 40 230 20 <18 45 17% 0.412007, 2013 Fecal Coliform MPN/100 mL 400 1.Basin Plan REC-1/REC-2 170 40 230 40 45 <18 0% 0.232007, 2013 Total Coliform MPN/100 mL NA 20 5,000 3,000 8,000 230 7,900Nutrients2007, 2013 Ammonia as N mg/L (b) 6. USEPA Water Quality Criteria (Freshwater) <0.03 0.11 0.062J 0.18 0.44 0.070J 0% 0.062007, 2013 Nitrate as N mg/L 10 1. Basin Plan <0.05 0.051J <0.1 <0.1 0.042J <0.10 0% 0.002007, 2013 Nitrite as N mg/L 1 1. Basin Plan <0.05 0.033J <0.1 <0.1 <0.1 <0.10 0% 0.042007, 2013 Total Kjeldahl Nitrogen mg/L NA 0.712J 0.57 1.1 0.88 1.3 0.562007, 2013 Total Nitrogen (calculated) mg/L 1 1. Basin Plan 0.712 0.654 1.1 0.88 1.342 0.56 33% 0.872007 Dissolved Phosphorus mg/L 0.1 1. Basin Plan 0.129 0.15 0.36 0.16 0.23 0.18 100% 2.022007, 2013 Total Phosphorus mg/L 0.1 1. Basin Plan 0.144 0.19 0.45 0.2 0.29 0.19 100% 2.44General Chemistry2007 Biochemical Oxygen Demand mg/L 10 8. McNeeley (1979) 12.1 1.5J 4.4 1.7J 11 7.6 33% 0.642007 Chemical Oxygen Demand mg/L 120 4. MSGP 2015 24.8 21 40 25 52 34 0% 0.272007, 2013 Dissolved Organic Carbon mg/L NA 8.3B 6.9 9 5.8 8.4 7.82007, 2013 Total Organic Carbon mg/L NA 7.8 6.8 8.8 5.4 8.1 8.12007, 2013 Oil and Grease mg/L 10 1. Basin Plan, 3. Anacostia River TMDL <5 <5 <5 <5 2.5J <5.0 0% 0.252007, 2013 Surfactants (MBAS) mg/L 0.5 1. Basin Plan 0.105 0.043J 0.07 0.027J 0.11 0.11 0% 0.162007, 2013 Total Dissolved Solids mg/L 1,500 (c) 1. Basin Plan 1,352B 1,200 2,600 1,000 2,500 1,500 33% 1.132007, 2013 Total Suspended Solids mg/L 58 14. NSQD, 1. Basin Plan 5.5 6 10 20 27 7 0% 0.222007, 2013 Total Hardness mg CaCO3/L NA 476.2 520 940 450 1,050 638Total Metals2007 Antimony mg/L 0.006 (d) 1. Basin Plan 0.0005 0.00028J 0.00051 0.00042J 0.00023J 0.00031J 0% 0.062007, 2013 Arsenic mg/L 0.01 (d) 1. Basin Plan 0.0027 0.0033 0.0066 0.0034 0.0032 0.0027 0% 0.372007, 2013 Cadmium mg/L 0.005 (d) 1. Basin Plan <0.0004 0.000017J 0.00002J 0.00003J <0.00010 <0.00010 0% 0.012007, 2013 Chromium mg/L 0.05 (d) 1. Basin Plan <0.0005 0.000076J 0.00011J 0.00048 0.000062J 0.00013J 0% 0.002007, 2013 Copper mg/L 1.0 (d) 1. Basin Plan 0.0007J 0.00055 0.00045J 0.0014 0.0009 0.00058 0% 0.002007, 2013 Lead mg/L NA 0.0002 0.000099J 0.00018J 0.00082 0.000047J 0.00018J2007, 2013 Nickel mg/L 0.1 (d) 1. Basin Plan 0.0011 0.0028 0.0011 0.0013 0.0054 0.0011 0% 0.022007, 2013 Selenium mg/L 0.005 16. 40 CFR 131.38 0.0004J 0.0004 <0.0004 0.00032J 0.00087 0.00019J 0% 0.082007, 2013 Zinc mg/L 5.0 (d) 1. Basin Plan 0.0007 0.00079J 0.0012J 0.0049J 0.00065J 0.0021J 0% 0.00Dissolved Metals2007 Antimony mg/L 0.006 1. Basin Plan 0.0005 0.00029J 0.0005 0.00037J 0.00024J 0.00026J 0% 0.06
2007, 2013 Arsenic mg/L 0.34 acute /0.15 chronic 16. 40 CFR 131.38 0.0025 0.0032 0.0064 0.0032 0.0033 0.0026 0% 0.02
2007, 2013 Cadmium mg/L (e) 16. 40 CFR 131.38 <0.0004 <0.0001 <0.0001 0.00002J <0.00010 <0.00010 0% 0.012007, 2013 Chromium mg/L (e) 16. 40 CFR 131.38 <0.0005 0.000051J <0.0002 0.0001J <0.00020 0.000055J 0% 0.002007, 2013 Copper mg/L (e) 16. 40 CFR 131.38 0.0007J 0.00061 0.00039J 0.00062 0.00088 0.00023J 0% 0.022007, 2013 Lead mg/L (e) 16. 40 CFR 131.38 <0.0001 <0.0002 <0.0002 0.00003J <0.00020 <0.00020 0% 0.012007, 2013 Nickel mg/L (e) 16. 40 CFR 131.38 0.0011 0.0026 0.0011 0.001 0.0052 0.0011 0% 0.012007, 2013 Selenium mg/L NA 0.0002J 0.00041 <0.0004 0.00031J 0.00078 0.00016J2007, 2013 Zinc mg/L (e) 16. 40 CFR 131.38 0.0002J 0.0017J 0.0019J 0.0019J 0.0012J 0.0023J 0% 0.00Organophosphorus Pesticides
2007, 2013 Chlorpyrifos µg/L 0.02 acute / 0.014 chronic 12. CA Dept. of Fish & Game, 2000 <0.002 <0.01 <0.01 <0.01 <0.010 <0.010 0% 0.31
2007, 2013 Diazinon µg/L 0.08 acute / 0.05 chronic
12. CA Dept. of Fish & Game, 2000, 11. Chollas Creek TMDL for Diazinon, 10. USEPA, Aquatic Life Ambient Water
Quality Criteria Diazinon<0.004 <0.01 <0.01 <0.01 <0.010 <0.010 0% 0.09
2007, 2013 Malathion µg/L 0.43 acute /0.1 chronic 13. CA Dept. of Fish & Game, 1998, 5. Goldbook <0.006 <0.01 <0.01 <0.01 <0.010 <0.010 0% 0.05
Toxicity2007, 2013 Ceriodaphnia 96-hr LC50 (%) >100 >100 >100 >100 >100 >100 >100 0% 1.002007, 2013 Ceriodaphnia 7-day survival NOEC (%) 100 100 100 100 100 100 100 0% 1.002007, 2013 Ceriodaphnia 7-day reproduction NOEC (%) 100 100 100 100 100 50 100 17% 1.172007 Hyalella 96-hr LC50 (%) >100 >100 >100 >100 >100 >100 >100 0% 1.002007, 2013 Selenastrum 96-hr NOEC (%) 100 100 100 50 100 50 100 33% 1.33See last page for footnotes and source references.
Transitional Monitoring
2009-2010 2011-2012
Historical Monitoring Data
Permit Requirement
No
Sam
ples
Col
lect
ed
No
Sam
ples
Col
lect
ed
No
Sam
ples
Col
lect
ed
2013-2014 Mean Ratio to BenchmarksAnalyte Units Water Quality
Benchmarks Benchmark ReferencesFrequency
Above Benchmarks

Dry Weather Historical Monitoring Table for SDR-TWAS-1
Blank spaces have been verified and no data is available.
NA indicate no criteria or published value was available or applicable to the matrix or program.
(c) Water Quality Benchmark are based on the San Diego Regional Water Quality Control Plan by watershed for the San Diego Region (Basin Plan), 1994 (with amendments effective on or before April 4, 2011) and may vary by hydrologic area/subarea.(d) Water Quality Benchmark for total metals is based on the MUN beneficial use as described in the Basin Plan, 1994 (with amendments effective on or before April 4, 2011).
B-Analyte was detected in the associated method blank.J-Analyte was detected at a concentration below the reporting limit and above the method detection limit. Reported value is estimated.
SourcesPlease refer to the San Diego County Copermittee Regional Monitoring Program Benchmark Sources in Attachment B to Appendix A for benchmark source citations.
(b) Prior to the 2014-2015 monitoring year, Water Quality Benchmark was calculated based on CMC (salmonids absent) and CCC (early life stages present) using water temperature and pH described in the U.S. EPA, 1999 Update of Ambient Water Quality Criteria for Ammonia, EPA-822-R-99-014, December 1999. For 2014-2015 monitoring year, Water Quality Benchmark CMC and CCC were calculated based on pH and water temperature (when applicable) as described in the U.S. EPA, 2013 Aquatic Life Ambient Water Quality Criteria for Ammonia - Freshwater, EPA-822-R-13-001, April 2013.
(a) Water Quality Benchmark for Enterococcus is based on the maximum criteria for infrequently used freshwater area by the San Diego Regional Water Quality Control Plan for the San Diego Region (Basin Plan), 1994 (with amendments effective on or before April 4, 2011).
(e) Water Quality Benchmark for dissolved metal fractions are based on total hardness and are calculated as described by the USEPA Federal Register Doc. 40 CFR Part 131, May 18, 2000. The Criteria Maximum Concentration (CMC) and Continuous Criteria Concentration (CCC) were used.
Values with red bold font and shading do not meet Water Quality Benchmarks.

Dry Weather Historical Monitoring Table for SDR-TWAS-2
2010-2011 2012-2013 2014-2015
01/06/10 05/18/10 - 09/12/11-09/13/11
05/16/12-05/17/12 - 09/17/13-
09/18/1305/07/14-05/08/14 -
Physical Chemistry2007, 2013 pH pH units 6.5-9.0 1. Basin Plan 7.32 7.73 7.67 7.55 7.71 7.69 0% 0.112007, 2013 Specific Conductivity µmhos/cm NA 2,320 1,912 2,510 2,180 2,959 2,4112007, 2013 Water Temperature Celsius NA 12.2 20.8 20.6 19.0 23.09 17.082007, 2013 Turbidity NTU 20 1. Basin Plan 3.2 2.9 6.1 3.3 4.4 3.4 0% 0.19Bacteriological2007, 2013 Enterococcus MPN/100 mL 151 (a) 1. Basin Plan 110 500 500 300 310 700 83% 2.672007, 2013 Fecal Coliform MPN/100 mL 400 1.Basin Plan REC-1/REC-2 <20 230 7,000 500 230 330 33% 3.462007, 2013 Total Coliform MPN/100 mL NA 2,200 3,000 17,000 17,000 3,300 4,600Nutrients2007, 2013 Ammonia as N mg/L (b) 6. USEPA Water Quality Criteria (Freshwater) 0.03J 0.09J 0.2 0.057J <0.10 0.049J 0% 0.032007, 2013 Nitrate as N mg/L 10 1. Basin Plan 0.49 1.1 0.72 0.56 0.14 0.1 0% 0.052007, 2013 Nitrite as N mg/L 1 1. Basin Plan <0.05 0.037J 0.021J <0.1 <0.1 0.013J 0% 0.032007, 2013 Total Kjeldahl Nitrogen mg/L NA 0.734J 0.57 1 0.59 0.37 0.382007, 2013 Total Nitrogen (calculated) mg/L 1 1. Basin Plan 1.224 1.707 1.741 1.15 0.51 0.493 67% 1.142007 Dissolved Phosphorus mg/L 0.1 1. Basin Plan 0.095 0.11 0.16 0.11 0.16 0.16 83% 1.332007, 2013 Total Phosphorus mg/L 0.1 1. Basin Plan 0.104 0.13 0.26 0.13 0.16 0.21 100% 1.66General Chemistry2007 Biochemical Oxygen Demand mg/L 10 8. McNeeley (1979) <2 1.5J 1.2J 1.5J 0.88J 6.3 0% 0.212007 Chemical Oxygen Demand mg/L 120 4. MSGP 2015 26.8 22 28 14 26 23 0% 0.192007, 2013 Dissolved Organic Carbon mg/L NA 7.6B 6.4 8 4.1 6.2 5.82007, 2013 Total Organic Carbon mg/L NA 7.5 6.3 8.4 4.2 6.1 6.12007, 2013 Oil and Grease mg/L 10 1. Basin Plan, 3. Anacostia River TMDL <5 <5 <5 <5 <5.0 <5.0 0% 0.252007, 2013 Surfactants (MBAS) mg/L 0.5 1. Basin Plan 0.09 0.046J 0.11 0.023J 0.074 0.077 0% 0.142007, 2013 Total Dissolved Solids mg/L 1,000 (c) 1. Basin Plan 1,338B 1,300 1,800 1,300 1,800 1,500 100% 2.792007, 2013 Total Suspended Solids mg/L 58 14. NSQD, 1. Basin Plan 2.8J <5 8 3 3 2 0% 0.062007, 2013 Total Hardness mg CaCO3/L NA 465.1 540 650 520 710 629Total Metals2007 Antimony mg/L 0.006 (d) 1. Basin Plan 0.0004J 0.0002J 0.00039J 0.00021J 0.00017J 0.00016J 0% 0.042007, 2013 Arsenic mg/L 0.01 (d) 1. Basin Plan 0.0023 0.0017 0.0026 0.0019 0.002 0.0016 0% 0.202007, 2013 Cadmium mg/L 0.005 (d) 1. Basin Plan <0.0004 <0.0001 0.00004J 0.00002J 0.000040J <0.00010 0% 0.012007, 2013 Chromium mg/L 0.05 (d) 1. Basin Plan <0.0005 0.000083J 0.00033 0.0002 0.00013J 0.00010J 0% 0.002007, 2013 Copper mg/L 1.0 (d) 1. Basin Plan 0.0007J 0.00085 0.0012 0.00094 0.0011 0.0006 0% 0.002007, 2013 Lead mg/L NA <0.0001 0.000093J 0.00068 0.00016J 0.00015J 0.00014J2007, 2013 Nickel mg/L 0.1 (d) 1. Basin Plan 0.0014 0.0025 0.0022 0.0013 0.0039 0.0011 0% 0.022007, 2013 Selenium mg/L 0.005 16. 40 CFR 131.38 0.0007 0.00069 0.00058 0.00052 0.00073 0.00030J 0% 0.122007, 2013 Zinc mg/L 5.0 (d) 1. Basin Plan <0.0005 0.0016J 0.0038J 0.0025J 0.0014J 0.0023J 0% 0.00Dissolved Metals2007 Antimony mg/L 0.006 1. Basin Plan 0.0004J 0.00021J 0.00038J 0.0002J 0.00017J 0.00014J 0% 0.04
2007, 2013 Arsenic mg/L 0.34 acute /0.15 chronic 16. 40 CFR 131.38 0.0019 0.0016 0.0022 0.0018 0.0018 0.0015 0% 0.01
2007, 2013 Cadmium mg/L (e) 16. 40 CFR 131.38 <0.0004 <0.0001 0.00003J 0.00002J 0.000037J <0.00010 0% 0.012007, 2013 Chromium mg/L (e) 16. 40 CFR 131.38 <0.0005 0.000066J 0.00012J 0.00011J <0.00020 0.000057J 0% 0.002007, 2013 Copper mg/L (e) 16. 40 CFR 131.38 0.0007J 0.00083 0.0015 0.00079 0.00098 0.00036J 0% 0.032007, 2013 Lead mg/L (e) 16. 40 CFR 131.38 <0.0001 0.000034J 0.00008J 0.00004J <0.00020 0.000038J 0% 0.012007, 2013 Nickel mg/L (e) 16. 40 CFR 131.38 0.0012 0.0027 0.002 0.0012 0.0041 0.001 0% 0.012007, 2013 Selenium mg/L NA 0.0004J 0.00058 0.00056 0.00053 0.0012 0.00025J2007, 2013 Zinc mg/L (e) 16. 40 CFR 131.38 0.0006 0.003J 0.0031J 0.0025J 0.0014J 0.0020J 0% 0.01Organophosphorus Pesticides
2007, 2013 Chlorpyrifos µg/L 0.02 acute / 0.014 chronic 12. CA Dept. of Fish & Game, 2000 <0.002 <0.01 <0.01 <0.01 <0.010 <0.010 0% 0.31
2007, 2013 Diazinon µg/L 0.08 acute / 0.05 chronic
12. CA Dept. of Fish & Game, 2000, 11. Chollas Creek TMDL for Diazinon, 10. USEPA, Aquatic Life Ambient Water
Quality Criteria Diazinon<0.004 <0.01 <0.01 <0.01 <0.010 <0.010 0% 0.09
2007, 2013 Malathion µg/L 0.43 acute /0.1 chronic 13. CA Dept. of Fish & Game, 1998, 5. Goldbook <0.006 <0.01 <0.01 <0.01 <0.010 <0.010 0% 0.05
Toxicity2007, 2013 Ceriodaphnia 96-hr LC50 (%) >100 >100 >100 >100 >100 >100 >100 0% 1.002007, 2013 Ceriodaphnia 7-day survival NOEC (%) 100 100 100 100 100 100 100 0% 1.002007, 2013 Ceriodaphnia 7-day reproduction NOEC (%) 100 100 100 100 100 100 50 17% 1.172007 Hyalella 96-hr LC50 (%) >100 >100 >100 >100 >100 >100 >100 0% 1.002007, 2013 Selenastrum 96-hr NOEC (%) 100 100 100 100 100 50 100 17% 1.17See last page for footnotes and source references.
No
Sam
ples
Col
lect
ed
Transitional Monitoring
2011-2012
Historical Monitoring Data
2013-2014Permit Requirement
No
Sam
ples
Col
lect
ed
No
Sam
ples
Col
lect
ed
Mean Ratio to BenchmarksAnalyte Units Water Quality
Benchmarks Benchmark ReferencesFrequency
Above Benchmarks
2009-2010

Dry Weather Historical Monitoring Table for SDR-TWAS-2
Blank spaces have been verified and no data is available.
NA indicate no criteria or published value was available or applicable to the matrix or program.
(c) Water Quality Benchmark are based on the San Diego Regional Water Quality Control Plan by watershed for the San Diego Region (Basin Plan), 1994 (with amendments effective on or before April 4, 2011) and may vary by hydrologic area/subarea.(d) Water Quality Benchmark for total metals is based on the MUN beneficial use as described in the Basin Plan, 1994 (with amendments effective on or before April 4, 2011).
B-Analyte was detected in the associated method blank.J-Analyte was detected at a concentration below the reporting limit and above the method detection limit. Reported value is estimated.
SourcesPlease refer to the San Diego County Copermittee Regional Monitoring Program Benchmark Sources in Attachment B to Appendix A for benchmark source citations.
(b) Prior to the 2014-2015 monitoring year, Water Quality Benchmark was calculated based on CMC (salmonids absent) and CCC (early life stages present) using water temperature and pH described in the U.S. EPA, 1999 Update of Ambient Water Quality Criteria for Ammonia, EPA-822-R-99-014, December 1999. For 2014-2015 monitoring year, Water Quality Benchmark CMC and CCC were calculated based on pH and water temperature (when applicable) as described in the U.S. EPA, 2013 Aquatic Life Ambient Water Quality Criteria for Ammonia - Freshwater, EPA-822-R-13-001, April 2013.
(a) Water Quality Benchmark for Enterococcus is based on the maximum criteria for infrequently used freshwater area by the San Diego Regional Water Quality Control Plan for the San Diego Region (Basin Plan), 1994 (with amendments effective on or before April 4, 2011).
(e) Water Quality Benchmark for dissolved metal fractions are based on total hardness and are calculated as described by the USEPA Federal Register Doc. 40 CFR Part 131, May 18, 2000. The Criteria Maximum Concentration (CMC) and Continuous Criteria Concentration (CCC) were used.
Values with red bold font and shading do not meet Water Quality Benchmarks.

Dry Weather Historical Monitoring Table for SDR-TWAS-3
2010-2011 2012-2013 2014-2015
01/06/10 05/18/10 - 09/12/11-09/13/11
05/16/12-05/17/12 - 01/13/14-
01/14/1405/07/14-05/08/14 -
Physical Chemistry2007, 2013 pH pH units 6.5-9.0 1. Basin Plan 7.39 7.70 7.83 7.61 7.84 7.81 0% 0.102007, 2013 Specific Conductivity µmhos/cm NA 2,160 1,837 1,812 2,240 2,077 1,8302007, 2013 Water Temperature Celsius NA 10.60 21.20 23.50 21.20 10.27 19.322007, 2013 Turbidity NTU 20 1. Basin Plan 6 3.3 12 12 2.8 3.6 0% 0.33Bacteriological2007, 2013 Enterococcus MPN/100 mL 151 (a) 1. Basin Plan <20 230 70 40 <18 20 17% 0.442007, 2013 Fecal Coliform MPN/100 mL 400 1.Basin Plan REC-1/REC-2 120 <20 20 110 <18 <18 0% 0.132007, 2013 Total Coliform MPN/100 mL NA 300 700 1,100 30,000 140 170Nutrients2007, 2013 Ammonia as N mg/L (b) 6. USEPA Water Quality Criteria (Freshwater) 0.03J 0.21 0.091J 0.098J <0.10 0.054J 0% 0.042007, 2013 Nitrate as N mg/L 10 1. Basin Plan <0.05 0.13 <0.1 <0.1 <0.10 <0.10 0% 0.012007, 2013 Nitrite as N mg/L 1 1. Basin Plan <0.05 0.035J <0.1 <0.1 0.029J <0.10 0% 0.042007, 2013 Total Kjeldahl Nitrogen mg/L NA 2.4 0.79 0.92 0.96 0.48 0.532007, 2013 Total Nitrogen (calculated) mg/L 1 1. Basin Plan 2.4 0.955 0.92 0.96 0.509 0.53 17% 1.052007 Dissolved Phosphorus mg/L 0.1 1. Basin Plan 0.09 0.14 0.11 0.14 0.013 0.12 67% 1.022007, 2013 Total Phosphorus mg/L 0.1 1. Basin Plan 0.081 0.17 0.21 0.18 0.05 0.14 67% 1.39General Chemistry2007 Biochemical Oxygen Demand mg/L 10 8. McNeeley (1979) 6.5 3 2.6 2.9 <2.0 6.6 0% 0.382007 Chemical Oxygen Demand mg/L 120 4. MSGP 2015 34.8 24 26 24 12 28 0% 0.212007, 2013 Dissolved Organic Carbon mg/L NA 5.9 6 6.4 4.9 4.6 6.92007, 2013 Total Organic Carbon mg/L NA 7.2 5.7 5.9 3.6 4.6 7.22007, 2013 Oil and Grease mg/L 10 1. Basin Plan, 3. Anacostia River TMDL <5 <5 <5 <5 <5.0 <5.0 0% 0.252007, 2013 Surfactants (MBAS) mg/L 0.5 1. Basin Plan 0.092 0.025J 0.039J 0.023J 0.056 0.079 0% 0.102007, 2013 Total Dissolved Solids mg/L 1,000 (c) 1. Basin Plan 1,232B 1,300 1,600 1,400 1,300 1,100 100% 2.442007, 2013 Total Suspended Solids mg/L 58 14. NSQD, 1. Basin Plan 10.3 9 11 18 8 4 0% 0.172007, 2013 Total Hardness mg CaCO3/L NA 486.8 600 650 610 610 527Total Metals2007 Antimony mg/L 0.006 (d) 1. Basin Plan 0.0002J 0.00023J 0.00019J 0.0002J 0.00018J 0.00020J 0% 0.032007, 2013 Arsenic mg/L 0.01 (d) 1. Basin Plan 0.0013 0.0015 0.0012 0.0016 0.00062 0.00098 0% 0.122007, 2013 Cadmium mg/L 0.005 (d) 1. Basin Plan <0.0004 0.000042J 0.00002J 0.00003J 0.000035J <0.00010 0% 0.012007, 2013 Chromium mg/L 0.05 (d) 1. Basin Plan <0.0005 0.000071J 0.00008J 0.00033 0.00013J 0.00013J 0% 0.002007, 2013 Copper mg/L 1.0 (d) 1. Basin Plan 0.0005J 0.00062 0.00046J 0.00087 0.00084 0.00049J 0% 0.002007, 2013 Lead mg/L NA 0.00006J 0.0001J 0.00014J 0.00037 0.00012J 0.000061J2007, 2013 Nickel mg/L 0.1 (d) 1. Basin Plan 0.0012 0.0027 0.00088 0.001 0.0033 0.00069J 0% 0.022007, 2013 Selenium mg/L 0.005 16. 40 CFR 131.38 0.0008 0.00069 0.00048 0.00079 0.0016 0.00044 0% 0.162007, 2013 Zinc mg/L 5.0 (d) 1. Basin Plan 0.0021B 0.0015J 0.0025J 0.003J 0.0051 0.0027J 0% 0.00Dissolved Metals2007 Antimony mg/L 0.006 1. Basin Plan 0.0002J 0.00021J 0.00018J 0.00015J 0.00019J 0.00018J 0% 0.03
2007, 2013 Arsenic mg/L 0.34 acute /0.15 chronic 16. 40 CFR 131.38 0.001 0.0014 0.0011 0.0016 0.00058 0.00093 0% 0.01
2007, 2013 Cadmium mg/L (e) 16. 40 CFR 131.38 <0.0004 <0.0001 <0.0001 0.00002J 0.000030J <0.00010 0% 0.012007, 2013 Chromium mg/L (e) 16. 40 CFR 131.38 <0.0005 0.000042J <0.0002 0.0001J 0.000045J 0.000035J 0% 0.002007, 2013 Copper mg/L (e) 16. 40 CFR 131.38 0.0005J 0.00055 <0.0005 0.00046J 0.00075 0.00031J 0% 0.022007, 2013 Lead mg/L (e) 16. 40 CFR 131.38 <0.0001 <0.0002 <0.0002 <0.0002 <0.00020 <0.00020 0% 0.012007, 2013 Nickel mg/L (e) 16. 40 CFR 131.38 0.0011 0.0026 0.00081 0.00082 0.0033 0.00066J 0% 0.012007, 2013 Selenium mg/L NA 0.0011 0.00074 0.00047 0.00075 0.0016 0.00035J2007, 2013 Zinc mg/L (e) 16. 40 CFR 131.38 0.0003J,B 0.0019J 0.002J 0.0015J 0.0037J 0.0013J 0% 0.00Organophosphorus Pesticides
2007, 2013 Chlorpyrifos µg/L 0.02 acute / 0.014 chronic 12. CA Dept. of Fish & Game, 2000 <0.002 <0.01 <0.01 <0.01 <0.010 <0.010 0% 0.31
2007, 2013 Diazinon µg/L 0.08 acute / 0.05 chronic
12. CA Dept. of Fish & Game, 2000, 11. Chollas Creek TMDL for Diazinon, 10. USEPA, Aquatic Life Ambient Water
Quality Criteria Diazinon<0.004 <0.01 <0.01 <0.01 <0.010 <0.010 0% 0.09
2007, 2013 Malathion µg/L 0.43 acute /0.1 chronic 13. CA Dept. of Fish & Game, 1998, 5. Goldbook <0.006 <0.01 <0.01 <0.01 <0.010 <0.010 0% 0.05
Toxicity2007, 2013 Ceriodaphnia 96-hr LC50 (%) >100 >100 >100 >100 >100 >100 >100 0% 1.002007, 2013 Ceriodaphnia 7-day survival NOEC (%) 100 100 100 100 25 100 100 17% 1.502007, 2013 Ceriodaphnia 7-day reproduction NOEC (%) 100 100 100 100 100 100 100 0% 1.002007 Hyalella 96-hr LC50 (%) >100 >100 >100 >100 >100 >100 >100 0% 1.002007, 2013 Selenastrum 96-hr NOEC (%) 100 50 50 50 50 50 100 83% 1.83See last page for footnotes and source references.
No
Sam
ples
Col
lect
ed
Transitional Monitoring
2009-2010 2011-2012
Historical Monitoring Data
Permit Requirement
No
Sam
ples
Col
lect
ed
No
Sam
ples
Col
lect
ed
Mean Ratio to BenchmarksAnalyte Units Water Quality
Benchmarks Benchmark ReferencesFrequency
Above Benchmarks
2013-2014

Dry Weather Historical Monitoring Table for SDR-TWAS-3
Blank spaces have been verified and no data is available.
NA indicate no criteria or published value was available or applicable to the matrix or program.
(c) Water Quality Benchmark are based on the San Diego Regional Water Quality Control Plan by watershed for the San Diego Region (Basin Plan), 1994 (with amendments effective on or before April 4, 2011) and may vary by hydrologic area/subarea.(d) Water Quality Benchmark for total metals is based on the MUN beneficial use as described in the Basin Plan, 1994 (with amendments effective on or before April 4, 2011).
B-Analyte was detected in the associated method blank.J-Analyte was detected at a concentration below the reporting limit and above the method detection limit. Reported value is estimated.
SourcesPlease refer to the San Diego County Copermittee Regional Monitoring Program Benchmark Sources in Attachment B to Appendix A for benchmark source citations.
(b) Prior to the 2014-2015 monitoring year, Water Quality Benchmark was calculated based on CMC (salmonids absent) and CCC (early life stages present) using water temperature and pH described in the U.S. EPA, 1999 Update of Ambient Water Quality Criteria for Ammonia, EPA-822-R-99-014, December 1999. For 2014-2015 monitoring year, Water Quality Benchmark CMC and CCC were calculated based on pH and water temperature (when applicable) as described in the U.S. EPA, 2013 Aquatic Life Ambient Water Quality Criteria for Ammonia - Freshwater, EPA-822-R-13-001, April 2013.
(e) Water Quality Benchmark for dissolved metal fractions are based on total hardness and are calculated as described by the USEPA Federal Register Doc. 40 CFR Part 131, May 18, 2000. The Criteria Maximum Concentration (CMC) and Continuous Criteria Concentration (CCC) were used.
(a) Water Quality Benchmark for Enterococcus is based on the maximum criteria for infrequently used freshwater area by the San Diego Regional Water Quality Control Plan for the San Diego Region (Basin Plan), 1994 (with amendments effective on or before April 4, 2011).
Values with red bold font and shading do not meet Water Quality Benchmarks.

Dry Weather Historical Monitoring Table for SDR-MLS
Long Term and
Transitional Monitoring
Long Term Monitoring
Long Term and
Transitional Monitoring
Long Term and
Transitional Monitoring
2010-2011 2012-2013 2014-2015
01/07/10 05/22/10 - 09/12/11-09/13/11
05/16/12-05/17/12 - 09/17/13-
09/18/1301/13/14-01/14/14
05/07/14-05/08/14 -
Physical Chemistry2013 Dissolved Oxygen mg/L <5.0 (a) 7.18 6.53 4.31 33% NA1
2007, 2013 pH pH units 6.5-9.0 1. Basin Plan 6.58 7.58 7.41 7.34 7.72 7.55 7.39 0% 0.312007, 2013 Specific Conductivity µmhos/cm NA 2,490 2,410 3,450 2,200 3,429 2,882 2,1812007, 2013 Water Temperature Celsius NA 12.90 21.20 23.9 23.1 24.33 13.31 19.122013 Color Color Units 20 1. Basin Plan 15 30 30 67% NA1
2007, 2013 Turbidity NTU 20 1. Basin Plan 4.8 2.7 4 6.4 3.9 8.4 6.6 0% 0.26Bacteriological2007, 2013 Enterococcus MPN/100 mL 151 (b) 1. Basin Plan 110 40 <20 110 330 330 220 43% 1.102007, 2013 Fecal Coliform MPN/100 mL 400 1.Basin Plan REC-1/REC-2 20 90E 230 40 230 130 2,300 14% 1.092007, 2013 Total Coliform MPN/100 mL NA 80 5,000 3,000 3,000 7,000 790 2,300Nutrients2007, 2013 Ammonia as N mg/L (c) 6. USEPA Water Quality Criteria (Freshwater) <0.03 0.1 0.11 0.092J <0.10 0.58 0.084J 0% 0.042007, 2013 Nitrate as N mg/L 10 1. Basin Plan 0.02J 0.055J 0.089J 0.12 0.093J <0.10 <0.10 0% 0.012007, 2013 Nitrite as N mg/L 1 1. Basin Plan <0.05 <0.1 0.013J <0.1 <0.1 0.013J 0.013J 0% 0.032007, 2013 Total Kjeldahl Nitrogen mg/L NA <1 0.59 0.68 0.56 0.34 0.95 0.682007, 2013 Total Nitrogen (calculated) mg/L 1 1. Basin Plan 0.02 0.645 0.782 0.68 0.433 0.963 0.693 0% 0.602007 Dissolved Phosphorus mg/L 0.1 1. Basin Plan 0.101 0.17 0.34 0.16 0.062 NR 0.16 83% 1.662013 Orthophosphate mg/L NA 0.045 0.048 0.162007, 2013 Total Phosphorus mg/L 0.1 1. Basin Plan 0.104 0.0054J 0.39 0.18 0.064 0.06 0.17 57% 1.39General Chemistry2007 Biochemical Oxygen Demand mg/L 10 8. McNeeley (1979) 3.8 0.91J 0.92J 1.9J 1.3J NR 23 17% 0.532007 Chemical Oxygen Demand mg/L 120 4. MSGP 2015 32.8 23 31 19 26 NR 32 0% 0.232013 Chloride mg/L 400 (a) 1. Basin Plan 870 630 470 100% NA1
2007, 2013 Dissolved Organic Carbon mg/L NA 7.9B 6.7 8 4.3 6.6 6.4 9.12007, 2013 Total Organic Carbon mg/L NA 7.7 7.2 7.6 4.7 6.6 6.3 8.82007, 2013 Oil and Grease mg/L 10 1. Basin Plan, 3. Anacostia River TMDL <5 <5 <5 2.5J <5.0 NR 3.9J 0% 0.272013 Sulfate mg/L 500 (a) 1. Basin Plan 330 290 210 0% NA1
2007, 2013 Surfactants (MBAS) mg/L 0.5 1. Basin Plan 0.115 0.14 0.092 0.048J 0.072 0.091 0.17 0% 0.212007, 2013 Total Dissolved Solids mg/L 1,500 (a) 1. Basin Plan 1,454B 1,300 2,400 1,300 2,100 1,700 1,400 43% 1.112007, 2013 Total Suspended Solids mg/L 58 14. NSQD, 1. Basin Plan 5.3 4 4 9 5 2 9 0% 0.092007, 2013 Total Hardness mg CaCO3/L NA 539.3 580 920 530 803 767 608Total Metals2007 Antimony mg/L 0.006 (d) 1. Basin Plan 0.0006 0.00047J 0.00065 0.00055 0.0006 NR 0.00045J 0% 0.092007, 2013 Arsenic mg/L 0.01 (d) 1. Basin Plan 0.0036 0.0043 0.007 0.0044 0.0036 0.0023 0.0027 0% 0.402007, 2013 Cadmium mg/L 0.005 (d) 1. Basin Plan <0.0004 <0.0001 0.00002J 0.00004J 0.000022J 0.000020J <0.00010 0% 0.012007, 2013 Chromium mg/L 0.05 (d) 1. Basin Plan <0.0005 0.00021 0.00008J 0.00041 0.000075J 0.00023 0.00034 0% 0.002013 Chromium, Trivalent mg/L NA <0.0005 <0.0005 <0.00052013 Chromium, Hexavalent mg/L 0.010 (d) 1. Basin Plan 0.000030J 0.00014J 0.00021J 0% NA1
2007, 2013 Copper mg/L 1.0 (d) 1. Basin Plan 0.0008 0.0015 0.0008 0.0013 0.001 0.002 0.0022 0% 0.002013 Iron mg/L 1.0 (a) 1. Basin Plan 0.035 0.082 0.16 0% NA1
2007, 2013 Lead mg/L NA 0.00078 0.00034 0.00024 0.0007 0.000077J 0.00013J 0.000332013 Manganese mg/L 1.0 (a) 1. Basin Plan 0.07 0.088 0.95 0% NA1
2013 Mercury mg/L 0.002 (d) 1. Basin Plan 0.000040J <0.000050 <0.000050 0% NA1
2007, 2013 Nickel mg/L 0.1 (d) 1. Basin Plan 0.0014 0.0032 0.0013 0.0015 0.004 0.005 0.0012 0% 0.032007, 2013 Selenium mg/L 0.005 16. 40 CFR 131.38 0.0009 0.00088 0.0011 0.00086 0.0016 0.0023 0.00052 0% 0.232013 Silver mg/L 0.1 (d) 1. Basin Plan <0.00020 0.00011J 0.000069J 0% NA1
2013 Thallium mg/L 0.002 (d) 1. Basin Plan <0.00020 <0.00020 <0.00020 0% NA1
2007, 2013 Zinc mg/L 5.0 (d) 1. Basin Plan 0.0029 0.0026J 0.0022J 0.0048J 0.0026J 0.0046J 0.0051 0% 0.00Dissolved Metals2007 Antimony mg/L 0.006 1. Basin Plan 0.0006 0.00046J 0.00062 0.00051 0.00059 NR 0.00044J 0% 0.09
2007, 2013 Arsenic mg/L 0.34 acute /0.15 chronic 16. 40 CFR 131.38 0.0032 0.0041 0.0066 0.0041 0.0033 0.0022 0.0028 0% 0.03
2007, 2013 Cadmium mg/L (e) 16. 40 CFR 131.38 <0.0004 <0.0001 0.00002J 0.00002J 0.000022J 0.000029J <0.00010 0% 0.012007, 2013 Chromium mg/L (e) 16. 40 CFR 131.38 <0.0005 0.000069J <0.0002 0.00018J <0.00020 0.00015J 0.000069J 0% 0.002007, 2013 Copper mg/L (e) 16. 40 CFR 131.38 0.0009 0.0021 0.00067 0.0012 0.00099 0.0019 0.00064 0% 0.042013 Iron mg/L NA <0.010 0.02 0.0212007, 2013 Lead mg/L (e) 16. 40 CFR 131.38 <0.0001 0.000074J 0.00002J 0.00005J <0.00020 0.000037J <0.00020 0% 0.012013 Manganese mg/L NA 0.0067 0.069 0.882013 Mercury mg/L NA 0.000042J <0.000050 <0.0000502007, 2013 Nickel mg/L (e) 16. 40 CFR 131.38 0.0014 0.0028 0.0013 0.0014 0.0038 0.0049 0.0011 0% 0.012007, 2013 Selenium mg/L NA 0.0011 0.00083 0.0011 0.0008 0.0015 0.0023 0.000452013 Silver mg/L (e) 16. 40 CFR 131.38 <0.00020 0.00010J 0.00011J 0% NA1
2013 Thallium mg/L NA <0.00020 <0.00020 <0.000202007, 2013 Zinc mg/L (e) 16. 40 CFR 131.38 0.0002J 0.0023J 0.0025J 0.0032J 0.0022J 0.0057 0.0026J 0% 0.01
No
Sam
ples
Col
lect
ed
No
Sam
ples
Col
lect
ed
Historical Monitoring Data
Permit Requirement
Frequency Above
BenchmarksBenchmark References
No
Sam
ples
Col
lect
ed
2013-2014
Mean Ratio to BenchmarksAnalyte Units Water Quality
Benchmarks2009-2010 2011-2012

Dry Weather Historical Monitoring Table for SDR-MLS
Long Term and
Transitional Monitoring
Long Term Monitoring
Long Term and
Transitional Monitoring
Long Term and
Transitional Monitoring
2010-2011 2012-2013 2014-2015
01/07/10 05/22/10 - 09/12/11-09/13/11
05/16/12-05/17/12 - 09/17/13-
09/18/1301/13/14-01/14/14
05/07/14-05/08/14 -
Historical Monitoring Data
Permit Requirement
Frequency Above
BenchmarksBenchmark References
2013-2014
Mean Ratio to BenchmarksAnalyte Units Water Quality
Benchmarks2009-2010 2011-2012
Organophosphorus Pesticides2013 Azinphos methyl (Guthion) µg/L NA <0.010 <0.010 <0.0102013 Bolstar µg/L NA <0.010 <0.010 <0.010
2007, 2013 Chlorpyrifos µg/L 0.02 acute / 0.014 chronic 12. CA Dept. of Fish & Game, 2000 <0.002 <0.01 <0.01 <0.01 <0.010 <0.010 <0.010 0% 0.32
2013 Coumaphos µg/L NA <0.010 <0.010 <0.0102013 Demeton-o µg/L NA <0.010 <0.010 <0.0102013 Demeton-s µg/L NA <0.010 <0.010 <0.010
2007, 2013 Diazinon µg/L 0.08 acute / 0.05 chronic
12. CA Dept. of Fish & Game, 2000, 11. Chollas Creek TMDL for Diazinon, 10. USEPA, Aquatic Life Ambient
Water Quality Criteria Diazinon<0.004 <0.01 <0.01 <0.01 <0.010 <0.010 <0.010 0% 0.09
2013 Dichlorvos µg/L NA <0.010 <0.010 <0.0102013 Dimethoate µg/L NA <0.010 <0.010 <0.0102013 Disulfoton µg/L NA <0.010 <0.010 <0.0102013 Ethoprop µg/L NA <0.010 <0.010 <0.0102013 Ethyl parathion µg/L NA <0.010 <0.010 <0.0102013 Fensulfothion µg/L NA <0.010 <0.010 <0.010BS-L2013 Fenthion µg/L NA <0.010 <0.010 <0.010
2007, 2013 Malathion µg/L 0.43 acute /0.1 chronic 13. CA Dept. of Fish & Game, 1998, 5. Goldbook <0.006 <0.01 <0.01 <0.01 <0.010 <0.010 <0.010 0% 0.47
2013 Merphos µg/L NA <0.010 <0.010 <0.0102013 Methyl parathion µg/L NA <0.010 <0.010 <0.0102013 Mevinphos µg/L NA <0.010 <0.010 <0.0102013 Naled µg/L NA <0.010 <0.010BS-L <0.0102013 Phorate µg/L NA <0.010 <0.010 <0.0102013 Ronnel µg/L NA <0.010 <0.010 <0.0102013 Stirophos µg/L NA <0.010 <0.010 <0.0102013 Tokuthion (Prothiofos) µg/L NA <0.010 <0.010 <0.0102013 Trichloronate µg/L NA <0.010 <0.010 <0.010Pyrethroids2013 Allethrin µg/L NA <0.002 <0.002 <0.0022013 Bifenthrin µg/L 0.0093 15. Anderson et al., 2006 <0.002 <0.002 <0.002 0% NA1
2013 Cyfluthrin µg/L 0.344 17. Wheelock et al., 2004 <0.002 <0.002 <0.002 0% NA1
2013 Cyhalothrin, Total Lambda µg/L 0.20 17. Wheelock et al., 2004 <0.002 <0.002 <0.002 0% NA1
2013 Cypermethrin µg/L 0.683 17. Wheelock et al., 2004 <0.002 <0.002 0.0052 0% NA1
2013 Danitol (Fenpropathrin) µg/L NA <0.002 <0.002 <0.002 2013 Deltamethrin/Tralomethrin µg/L NA <0.002 <0.002 <0.0022013 Esfenvalerate µg/L 0.25 17. Wheelock et al., 2004 <0.002 <0.002 0.0005J 0% NA1
2013 Fenvalerate µg/L NA <0.002 <0.002 0.0006J 2013 Fluvalinate µg/L NA <0.002 <0.002 <0.0022013 Permethrin µg/L 0.021 15. Anderson et al., 2006 <0.01 <0.01 <0.01 0% NA1
2013 Prallethrin µg/L NA <0.002 <0.002 <0.0022013 Resmethrin µg/L NA <0.01 <0.01 <0.01Toxicity2007, 2013 Ceriodaphnia 96-hr LC50 (%) >100 >100 >100 >100 >100 >100 NR >100 0% 1.002007, 2013 Ceriodaphnia 7-day survival NOEC (%) 100 100 100 100 100 100 NR 100 0% 1.002007, 2013 Ceriodaphnia 7-day reproduction NOEC (%) 100 100 100 100 100 50 NR 100 17% 1.172007 Hyalella 96-hr LC50 (%) >100 >100 >100 >100 >100 >100 NR >100 0% 1.002007, 2013 Selenastrum 96-hr NOEC (%) 100 100 100 100 100 100 NR 100 0% 1.002013 Strongylocentrotus 96-hr TST Pass/Fail Pass Pass Pass 0%See last page for footnotes and source references.
No
Sam
ples
Col
lect
ed
No
Sam
ples
Col
lect
ed
No
Sam
ples
Col
lect
ed

Dry Weather Historical Monitoring Table for SDR-MLS
Blank spaces have been verified and no data is available.
NA indicate no criteria or published value was available or applicable to the matrix or program.(a) Water Quality Benchmark are based on the San Diego Regional Water Quality Control Plan by watershed for the San Diego Region (Basin Plan), 1994 (with amendments effective on or before April 4, 2011) and may vary by hydrologic area/subarea.
(d) Water Quality Benchmark for total metals is based on the MUN beneficial as described in the Basin Plan, 1994 (with amendments effective on or before April 4, 2011).
B-Analyte was detected in the associated method blank.BS-L-Blank Spike recovery of this analyte was below the control limits. Results may be biased low.E-Result calculated using Tomas Equation.J-Analyte was detected at a concentration below the reporting limit and above the method detection limit. Reported value is estimated.
R-Sampling of this analyte not required for transitional monitoring (RWQCB Order No. R9-2007-0001) and/or for long term monitoring (RWQCB Order No. R9-2013-0001).
SourcesPlease refer to the San Diego County Copermittee Regional Monitoring Program Benchmark Sources in Attachment B to Appendix A for benchmark source citations.
NA1 Three or more years of data required to calculate the Mean Ratio to Benchmark.
(c) Prior to the 2014-2015 monitoring year, Water Quality Benchmark was calculated based on CMC (salmonids absent) and CCC (early life stages present) using water temperature and pH described in the U.S. EPA, 1999 Update of Ambient Water Quality Criteriafor Ammonia, EPA-822-R-99-014, December 1999. For 2014-2015 monitoring year, Water Quality Benchmark CMC and CCC were calculated based on pH and water temperature (when applicable) as described in the U.S. EPA, 2013 Aquatic Life Ambient Water Quality Criteria for Ammonia - Freshwater, EPA-822-R-13-001, April 2013.
(b) Water Quality Benchmark for Enterococcus is based on the maximum criteria for infrequently used freshwater area by the San Diego Regional Water Quality Control Plan for the San Diego Region (Basin Plan), 1994 (with amendments effective on or before April 4, 2011).
(e) Water Quality Benchmark for dissolved metal fractions are based on total hardness and are calculated as described by the USEPA Federal Register Doc. 40 CFR Part 131, May 18, 2000. The Criteria Maximum Concentration (CMC) and Continuous Criteria Concentration (CCC) were used.
Values with red bold font and shading do not meet Water Quality Benchmarks.

Dry Weather Historical Monitoring Results for SDC-TWAS-1
2008-2009 2009-2010 2011-2012 2013-2014
03/04/08-03/05/08
06/02/08-06/03/08 - - 09/22/10-
09/23/1005/11/11-05/12/11 - 09/12/12-
09/13/1205/14/13-05/15/13 - 01/07/15 05/05/15
Physical Chemistry2007, 2013 pH pH units 6.5-9.0 1. Basin Plan 8.31 7.91 7.85 7.81 6.94 7.68 6.62 8.02 0% 0.322007, 2013 Specific Conductivity µmhos/cm NA 2,650 2,360 2,610 2,420 3,240 1,431 1,138 2,0292007, 2013 Water Temperature Celsius NA 14.00 21.30 19.20 20.50 21.5 19.3 11.24 14.042007, 2013 Turbidity NTU 20 1. Basin Plan 3.2 9.2 2 1.9 1.6 3.2 1.2 2 0% 0.15Bacteriological2007, 2013 Enterococcus MPN/100 mL 151 (a) 1. Basin Plan 230 130 700 80 40 300 130 <20 38% 1.352007, 2013 Fecal Coliform MPN/100 mL 400 1.Basin Plan REC-1/REC-2 20 80 40 70 <20 220 <20 80 0% 0.172007, 2013 Total Coliform MPN/100 mL NA 500 3,000 3,000 2,200 800 3,000 500 2,400Nutrients2007, 2013 Ammonia as N mg/L (b) 6. USEPA Water Quality Criteria (Freshwater) 0.03 0.06 <0.1 0.081J <0.1 <0.1 <0.10 <0.10 0% 0.032007, 2013 Nitrate as N mg/L 10 1. Basin Plan 0.85 0.12 <0.1 0.19 0.18 0.23 0.18 0.059J 0% 0.022007, 2013 Nitrite as N mg/L 1 1. Basin Plan <0.05 0.05 <0.1 0.031J <0.1 <0.1 0.016J <0.10 0% 0.042007, 2013 Total Kjeldahl Nitrogen mg/L NA 1.3 1.3 0.33 0.57 0.49 0.25 0.38 0.262007, 2013 Total Nitrogen (calculated) mg/L 1 1. Basin Plan 2.15 1.47 0.33 0.791 0.67 0.48 0.576 0.319 25% 0.852007 Dissolved Phosphorus mg/L 0.1 1. Basin Plan 0.09 0.12 0.13 0.1 0.06 0.091 0.046 0.016 25% 0.822007, 2013 Total Phosphorus mg/L 0.1 1. Basin Plan 0.118 0.162 0.056 0.12 0.092 0.16 0.067 0.034 50% 1.01General Chemistry2007 Biochemical Oxygen Demand mg/L 10 8. McNeeley (1979) <2 2.4 0.65J 1.9J 6.3 4.6 2.6 <2.0 0% 0.262007 Chemical Oxygen Demand mg/L 120 4. MSGP 2015 16 26 15 32 17 9.6 3.9J 19 0% 0.142007, 2013 Dissolved Organic Carbon mg/L NA 7.1 8.8 4.1 4.9 6.5 4 4.8 7.22007, 2013 Total Organic Carbon mg/L NA 7.5 9.7 4 5.1 6.4 4.7 5.1 72007 Oil and Grease mg/L 10 1. Basin Plan, 3. Anacostia River TMDL <5 <5 <5 <5 <5 <5 <5.0 <5.0 0% 0.252007, 2013 Surfactants (MBAS) mg/L 0.5 1. Basin Plan 0.103 0.11 0.032J 0.062 0.035J 0.076 0.088 0.083 0% 0.152007, 2013 Total Dissolved Solids mg/L 500 (c) 1. Basin Plan 1,752 1,476 1,700 1,800 1,800 1,300 780 1,300 100% 2.982007, 2013 Total Suspended Solids mg/L 58 14. NSQD, 1. Basin Plan 3.3J 19.3 2 11 7 6 2 1 0% 0.112007, 2013 Total Hardness mg CaCO3/L NA 508.1 452.9 840 810 800 594 414 679Total Metals2007 Antimony mg/L 0.006 (d) 1. Basin Plan 0.0003J 0.0004J 0.00011J 0.0002J 0.00011J 0.00019J 0.00034J 0.00011J 0% 0.042007, 2013 Arsenic mg/L 0.01 (d) 1. Basin Plan 0.0024 0.0029 0.0013 0.0021 0.0013 0.0018 0.0012 0.0014 0% 0.182007, 2013 Cadmium mg/L 0.005 (d) 1. Basin Plan <0.0004 <0.0004 0.000017J 0.00002J 0.00005J 0.000039J <0.00010 <0.00010 0% 0.022007, 2013 Chromium mg/L 0.05 (d) 1. Basin Plan 0.0002J 0.0002J 0.0011 0.00036 <0.0002 0.00018J 0.00018J 0.00022 0% 0.012007, 2013 Copper mg/L 1.0 (d) 1. Basin Plan 0.0020 0.0025 0.00044J 0.0012 <0.0005 0.001 0.0021 0.00063 0% 0.002007, 2013 Lead mg/L NA 0.0001 0.0002 0.000022J 0.00053 0.00004J 0.000054J 0.000078J 0.000040J2007, 2013 Nickel mg/L 0.1 (d) 1. Basin Plan 0.0013 0.0016 0.0042 0.0018 0.0013 0.0034 0.0013 0.0018 0% 0.022007, 2013 Selenium mg/L 0.005 16. 40 CFR 131.38 0.0014 0.0008 0.0003J 0.0007 <0.0004 0.00079 0.00059 0.00035J 0% 0.132007, 2013 Zinc mg/L 5.0 (d) 1. Basin Plan 0.0041 0.0054 0.0028J 0.003J 0.0076 0.0028J 0.0061 0.027 0% 0.00Dissolved Metals2007 Antimony mg/L 0.006 1. Basin Plan 0.0003J 0.0004J 0.000089J 0.00018J 0.00011J 0.00019J 0.00036J 0.00012J 0% 0.04
2007, 2013 Arsenic mg/L 0.34 acute /0.15 chronic 16. 40 CFR 131.38 0.0024 0.0025 0.0013 0.002 0.0014 0.0017 0.0009 0.0012 0% 0.00
2007, 2013 Cadmium mg/L (e) 16. 40 CFR 131.38 <0.0004 <0.0004 0.000015J 0.00002J 0.00006J 0.000039J <0.00010 <0.00010 0% 0.012007, 2013 Chromium mg/L (e) 16. 40 CFR 131.38 0.0001J 0.0001J 0.00012J 0.00007J 0.00008J 0.0001J 0.000078J 0.00011J 0% 0.002007, 2013 Copper mg/L (e) 16. 40 CFR 131.38 0.0019 0.0016 0.00061 0.00092 <0.0005 0.0011 0.0017 0.00059 0% 0.042007, 2013 Lead mg/L (e) 16. 40 CFR 131.38 <0.0001 <0.0001 <0.0002 0.00005J 0.00003J <0.0002 <0.00020 <0.00020 0% 0.012007, 2013 Nickel mg/L (e) 16. 40 CFR 131.38 0.0013 0.0014 0.004 0.0015 0.0013 0.0034 0.0011 0.0018 0% 0.012007, 2013 Selenium mg/L NA 0.0015 0.0007 0.00021J 0.00071 <0.0004 0.00081 0.00053 0.00042007, 2013 Zinc mg/L (e) 16. 40 CFR 131.38 0.0023 0.0018 0.002J 0.002J 0.0055 0.0025J 0.0027J 0.022 0% 0.01Organophosphorus Pesticides
2007, 2013 Chlorpyrifos µg/L 0.02 acute / 0.014 chronic 12. CA Dept. of Fish & Game, 2000 <0.002 <0.002 <0.01 <0.01 <0.01 <0.01 <0.010 <0.010 0% 0.29
2007, 2013 Diazinon µg/L 0.08 acute / 0.05 chronic
12. CA Dept. of Fish & Game, 2000, 11. Chollas Creek TMDL for Diazinon, 10. USEPA, Aquatic Life Ambient
Water Quality Criteria Diazinon<0.004 <0.004 <0.01 <0.01 <0.01 <0.01 <0.010 <0.010 0% 0.09
2007, 2013 Malathion µg/L 0.43 acute /0.1 chronic 13. CA Dept. of Fish & Game, 1998, 5. Goldbook <0.006 <0.006 <0.01 <0.01 <0.01 <0.01 <0.010 <0.010 0% 0.05
Toxicity2007, 2013 Ceriodaphnia 96-hr LC50 (%) >100 >100 >100 >100 >100 >100 >100 >100 >100 0% 1.002007, 2013 Ceriodaphnia 7-day survival NOEC (%) 100 100 100 100 100 100 100 100 100 0% 1.002007, 2013 Ceriodaphnia 7-day reproduction NOEC (%) 100 100 <6.25 100 50CF 100 100 100 100 14% 3.142007 Hyalella 96-hr LC50 (%) >100 >100 >100 >100 >100 >100 >100 >100 >100 0% 1.002007, 2013 Selenastrum 96-hr NOEC (%) 100 100 100 50 50 100 100 100 50 38% 1.38See last page for footnotes and source references.
No
Sam
ples
Col
lect
ed
No
Sam
ples
Col
lect
ed
No
Sam
ples
Col
lect
ed
No
Sam
ples
Col
lect
ed
2010-20112007-2008AnalyteFrequency
Above Benchmarks
2012-2013
Historical Monitoring Data
2014-2015 Mean Ratio to Benchmarks
Permit Requirement Units Water Quality
Benchmarks Benchmark References
Transitional Monitoring

Dry Weather Historical Monitoring Results for SDC-TWAS-1
Blank spaces have been verified and no data is available.
NA indicate no criteria or published value was available or applicable to the matrix or program.
(c) Water Quality Benchmark are based on the San Diego Regional Water Quality Control Plan by watershed for the San Diego Region (Basin Plan), 1994 (with amendments effective on or before April 4, 2011) and may vary based on hydrologic area.(d) Water Quality Benchmark for total metals is based on the MUN beneficial use as described in the Basin Plan, 1994 (with amendments effective on or before April 4, 2011).
CF-Control failed; results not used in assessment.J-Analyte was detected at a concentration below the reporting limit and above the method detection limit. Reported value is estimated.
SourcesPlease refer to the San Diego County Copermittee Regional Monitoring Program Benchmark Sources in Attachment B to Appendix A for benchmark source citations.
(a) Water Quality Benchmark for Enterococcus is based on the maximum criteria for infrequently used freshwater area by the San Diego Regional Water Quality Control Plan for the San Diego Region (Basin Plan), 1994 (with amendments effective on or before April 4, 2011).
(e) Water Quality Benchmark for dissolved metal fractions are based on total hardness and are calculated as described by the USEPA Federal Register Doc. 40 CFR Part 131, May 18, 2000. The Criteria Maximum Concentration (CMC) and Continuous Criteria Concentration (CCC) were used.
(b) Prior to the 2014-2015 monitoring year, Water Quality Benchmark was calculated based on CMC (salmonids absent) and CCC (early life stages present) using water temperature and pH described in the U.S. EPA, 1999 Update of Ambient Water Quality Criteria for Ammonia, EPA-822-R-99-014, December 1999. For 2014-2015 monitoring year, Water Quality Benchmark CMC and CCC were calculated based on pH and water temperature (when applicable) as described in the U.S. EPA, 2013 Aquatic Life Ambient Water Quality Criteria for Ammonia - Freshwater, EPA-822-R-13-001, April 2013.
Values with red bold font and shading do not meet Water Quality Benchmarks.

Dry Weather Historical Monitoring Results for SDC-TWAS-2
2008-2009 2009-2010 2011-2012 2012-2013 2013-2014 2014-2015
03/04/08-03/05/08
06/02/08-06/03/08 - - 01/11/11-
01/12/1105/09/11-05/10/11 - - - -
Physical Chemistry2007, 2013 pH pH units 6.5-9.0 1. Basin Plan 8.16 7.73 7.50 7.85 0% NA1
2007, 2013 Specific Conductivity µmhos/cm NA 1,902 3,000 1,617 2,3802007, 2013 Water Temperature Celsius NA 12.50 19.20 11.00 16.002007, 2013 Turbidity NTU 20 1. Basin Plan 102.8 105.2 6.2 14 50% NA1
Bacteriological2007, 2013 Enterococcus MPN/100 mL 151 (a) 1. Basin Plan 170 7,000 130 300 75% NA1
2007, 2013 Fecal Coliform MPN/100 mL 4,000 1.Basin Plan REC-1/REC-2 80 170 80 170 0% NA1
2007, 2013 Total Coliform MPN/100 mL NA 2,200 30,000 3000 80,000Nutrients2007, 2013 Ammonia as N mg/L (b) 6. USEPA Water Quality Criteria (Freshwater) 0.09 0.59 0.2 <0.1 0% NA1
2007, 2013 Nitrate as N mg/L 10 1. Basin Plan 2.25 0.05 2.9 0.8 0% NA1
2007, 2013 Nitrite as N mg/L 1 1. Basin Plan <0.05 0.07 0.095J 0.01J 0% NA1
2007, 2013 Total Kjeldahl Nitrogen mg/L NA 1.7 2.4 1.2 0.892007, 2013 Total Nitrogen (calculated) mg/L 1 1. Basin Plan 3.95 2.52 4.195 1.7 100% NA1
2007 Dissolved Phosphorus mg/L 0.1 1. Basin Plan 0.1 0.07 0.33 0.065 25% NA1
2007, 2013 Total Phosphorus mg/L 0.1 1. Basin Plan 0.452 0.279 0.35 0.17 100% NA1
General Chemistry2007 Biochemical Oxygen Demand mg/L 10 8. McNeeley (1979) 65.1 66.4 1.9J 1.1J 50% NA1
2007 Chemical Oxygen Demand mg/L 120 4. MSGP 2015 22 33 29 33 0% NA1
2007, 2013 Dissolved Organic Carbon mg/L NA 16.5 15.2 11 102007, 2013 Total Organic Carbon mg/L NA 13.7 15.1 11 8.92007 Oil and Grease mg/L 10 1. Basin Plan, 3. Anacostia River TMDL 1.2J 2.6J <5 <5 0% NA1
2007, 2013 Surfactants (MBAS) mg/L 0.5 1. Basin Plan 0.72 0.088 0.06 33% NA1
2007, 2013 Total Dissolved Solids mg/L 500 (c) 1. Basin Plan 1,330 1,940 1,200 1,700 100% NA1
2007, 2013 Total Suspended Solids mg/L 58 14. NSQD, 1. Basin Plan 264 102.7 10 17 50% NA1
2007, 2013 Total Hardness mg CaCO3/L NA 348.9 525.3 560 830Total Metals2007 Antimony mg/L 0.006 (d) 1. Basin Plan 0.0002J 0.0002J 0.00018J 0.00013J 0% NA1
2007, 2013 Arsenic mg/L 0.01 (d) 1. Basin Plan 0.0016 0.0021 0.0012 0.001 0% NA1
2007, 2013 Cadmium mg/L 0.005 (d) 1. Basin Plan <0.0004 <0.0004 0.000028J 0.000021J 0% NA1
2007, 2013 Chromium mg/L 0.05 (d) 1. Basin Plan 0.0015 0.0013 0.0011 0.00062 0% NA1
2007, 2013 Copper mg/L 1.0 (d) 1. Basin Plan 0.0057 0.0034 0.0032 0.0017 0% NA1
2007, 2013 Lead mg/L NA 0.0060 0.0039 0.00055 0.000462007, 2013 Nickel mg/L 0.1 (d) 1. Basin Plan 0.0019 0.0021 0.0034 0.0035 0% NA1
2007, 2013 Selenium mg/L 0.005 16. 40 CFR 131.38 0.0004J 0.0003J 0.00068 0.00032J 0% NA1
2007, 2013 Zinc mg/L 5.0 (d) 1. Basin Plan 0.0145 0.0062 0.0041J 0.0034J 0% NA1
Dissolved Metals2007 Antimony mg/L 0.006 1. Basin Plan 0.0002J 0.0002J 0.00018J 0.00012J 0% NA1
2007, 2013 Arsenic mg/L 0.34 acute /0.15 chronic 16. 40 CFR 131.38 0.0010 0.0018 0.001 0.00064 0% NA1
2007, 2013 Cadmium mg/L (e) 16. 40 CFR 131.38 <0.0004 <0.0004 0.000023J 0.000016J 0% NA1
2007, 2013 Chromium mg/L (e) 16. 40 CFR 131.38 0.0001J 0.0001J 0.00014J 0.000074J 0% NA1
2007, 2013 Copper mg/L (e) 16. 40 CFR 131.38 0.0009 0.0009 0.0026 0.0011 0% NA1
2007, 2013 Lead mg/L (e) 16. 40 CFR 131.38 <0.0001 <0.0001 0.000046J 0.000018J 0% NA1
2007, 2013 Nickel mg/L (e) 16. 40 CFR 131.38 0.0009 0.0012 0.0032 0.003 0% NA1
2007, 2013 Selenium mg/L NA 0.0003J 0.0003J 0.0005 0.00028J2007, 2013 Zinc mg/L (e) 16. 40 CFR 131.38 0.0003J 0.0004J 0.0024J 0.0022J 0% NA1
Organophosphorus Pesticides
2007, 2013 Chlorpyrifos µg/L 0.02 acute / 0.014 chronic 12. CA Dept. of Fish & Game, 2000 <0.002 <0.002 <0.01 <0.01 0% NA1
2007, 2013 Diazinon µg/L 0.08 acute / 0.05 chronic
12. CA Dept. of Fish & Game, 2000, 11. Chollas Creek TMDL for Diazinon, 10. USEPA, Aquatic Life Ambient
Water Quality Criteria Diazinon<0.004 <0.004 <0.01 <0.01 0% NA1
2007, 2013 Malathion µg/L 0.43 acute /0.1 chronic 13. CA Dept. of Fish & Game, 1998, 5. Goldbook <0.006 <0.006 <0.01 <0.01 0% NA1
Toxicity2007, 2013 Ceriodaphnia 96-hr LC50 (%) >100 >100 >100 >100 >100 0% NA1
2007, 2013 Ceriodaphnia 7-day survival NOEC (%) 100 100 100 100 100 0% NA1
2007, 2013 Ceriodaphnia 7-day reproduction NOEC (%) 100 100 100 100 <6.25 25% NA1
2007 Hyalella 96-hr LC50 (%) >100 >100 >100 >100 >100 0% NA1
2007, 2013 Selenastrum 96-hr NOEC (%) 100 100 100 100 <6.25 25% NA1
See last page for footnotes and source references.
Frequency Above
BenchmarksAnalyte
No
Sam
ples
Col
lect
ed
No
Sam
ples
Col
lect
ed
Historical Monitoring Data
2010-2011
Transitional Monitoring
2007-2008Permit Requirement Units Water Quality
Benchmarks Benchmark References Mean Ratio to Benchmarks
No
Sam
ples
Col
lect
ed
No
Sam
ples
Col
lect
ed
No
Sam
ples
Col
lect
ed
No
Sam
ples
Col
lect
ed

Dry Weather Historical Monitoring Results for SDC-TWAS-2
Blank spaces have been verified and no data is available.
NA indicate no criteria or published value was available or applicable to the matrix or program.
(c) Water Quality Benchmark are based on the San Diego Regional Water Quality Control Plan by watershed for the San Diego Region (Basin Plan), 1994 (with amendments effective on or before April 4, 2011) and may vary based on hydrologic area.(d) Water Quality Benchmark for total metals is based on the MUN beneficial use as described in the Basin Plan, 1994 (with amendments effective on or before April 4, 2011).
J-Analyte was detected at a concentration below the reporting limit and above the method detection limit. Reported value is estimated.NA1 Three or more years of data required to calculate the Mean Ratio to Benchmark.
SourcesPlease refer to the San Diego County Copermittee Regional Monitoring Program Benchmark Sources in Attachment B to Appendix A for benchmark source citations.
(a) Water Quality Benchmark for Enterococcus is based on the maximum criteria for infrequently used freshwater area by the San Diego Regional Water Quality Control Plan for the San Diego Region (Basin Plan), 1994 (with amendments effective on or before April 4, 2011).(b) Prior to the 2014-2015 monitoring year, Water Quality Benchmark was calculated based on CMC (salmonids absent) and CCC (early life stages present) using water temperature and pH described in the U.S. EPA, 1999 Update of Ambient Water Quality Criteria for Ammonia, EPA-822-R-99-014, December 1999. For 2014-2015 monitoring year, Water Quality Benchmark CMC and CCC were calculated based on pH and water temperature (when applicable) as described in the U.S. EPA, 2013 Aquatic Life Ambient Water Quality Criteria for Ammonia - Freshwater, EPA-822-R-13-001, April 2013.
(e) Water Quality Benchmark for dissolved metal fractions are based on total hardness and are calculated as described by the USEPA Federal Register Doc. 40 CFR Part 131, May 18, 2000. The Criteria Maximum Concentration (CMC) and Continuous Criteria Concentration (CCC) were used.
Values with red bold font and shading do not meet Water Quality Benchmarks.

Dry Weather Historical Monitoring Table for SDC-MLS
Long Term and
Transitional Monitoring
Long Term and
Transitional Monitoring
Long Term Monitoring
Long Term and
Transitional Monitoring
2008-2009 2009-2010 2011-2012 2013-2014
03/04/08 03/05/08
06/02/08-06/03/08 - - 12/02/10 05/11/11-
05/12/11 - 02/25/13-02/26/13
05/01/13-05/02/13 - 01/07/15 02/11/15 05/13/15
Physical Chemistry2013 Dissolved Oxygen mg/L <6.0 (a) 1. Basin Plan 7.18 5.25 7.27 33% NA1
2007, 2013 pH pH units 6.5-9.0 1. Basin Plan 7.77 7.96 6.98 6.97 7.04 7.43 7.47 7.06 7.66 0% 0.342007, 2013 Specific Conductivity µmhos/cm NA 2,740 3,760 3,740 2,840 3,500 3,420 3,630 3,917 3,6242007, 2013 Water Temperature Celsius NA 15.30 23.40 11.30 19.10 13.7 20.8 11.32 16.55 212013 Color Color Units 20 1. Basin Plan 30 15 20 33% NA1
2007, 2013 Turbidity NTU 20 1. Basin Plan 8.1 3.5 1 3.9 2.1 2.5 1 5.3 5.8 0% 0.18Bacteriological2007, 2013 Enterococcus MPN/100 mL 151 (b) 1. Basin Plan 110 471 500 1,300 230 700 20 130 300 67% 2.772007, 2013 Fecal Coliform MPN/100 mL 400 1.Basin Plan REC-1/REC-2 20 500 140 300 110 40 20 20 270 11% 0.392007, 2013 Total Coliform MPN/100 mL NA 500 1,700 800 11,000 1,300 23,000 800 500 1,700Nutrients2007, 2013 Ammonia as N mg/L (c) 6. USEPA Water Quality Criteria (Freshwater) 0.13 0.05 0.074J 0.17 0.077J 0.087J <0.10 0.079J <0.10 0% 0.032007, 2013 Nitrate as N mg/L 10 1. Basin Plan 1.48 0.11 0.45 0.61 0.36 0.35 0.22 0.17 <0.10 0% 0.042007, 2013 Nitrite as N mg/L 1 1. Basin Plan <0.05 0.05 0.035J 0.043J 0.037J <0.15 0.033J 0.016J 0.013J 0% 0.042007, 2013 Total Kjeldahl Nitrogen mg/L NA 7 0.98 1.1 0.98 0.46 0.6 0.56 0.63 1.52007, 2013 Total Nitrogen (calculated) mg/L 1 1. Basin Plan 8.48 1.14 1.585 1.633 0.857 0.95 0.813 0.816 1.513 56% 1.982007 Dissolved Phosphorus mg/L 0.1 1. Basin Plan 0.09 0.05 0.12 0.097 0.082 0.088 0.087 NR 0.14 25% 0.942013 Orthophosphate mg/L NA 0.074 0.057 0.0712007, 2013 Total Phosphorus mg/L 0.1 1. Basin Plan 0.13 0.08 0.13 0.21 0.11 0.11 0.12 0.13 0.23 89% 1.39General Chemistry2007 Biochemical Oxygen Demand mg/L 10 8. McNeeley (1979) <2 10.2 1.4J 1.1J 1.8J 2.3 2.2 NR 9.3 13% 0.372007 Chemical Oxygen Demand mg/L 120 4. MSGP 2015 19 28 38 <5 27 19 33 NR 62 0% 0.242013 Chloride mg/L 250 (a) 1. Basin Plan 920 980 870 100% NA1
2007, 2013 Dissolved Organic Carbon mg/L NA 8.2 7.9 8.7 6.4 6.3 4.9 7.5 5.5 8.72007, 2013 Total Organic Carbon mg/L NA 9.7 8.1 8.5 6.7 6.4 4.2 7.7 5.2 9.72007 Oil and Grease mg/L 10 1. Basin Plan, 3. Anacostia River TMDL <5 <5 <5.9 <5 <5 <5 <5.0 NR <5.0 0% 0.262013 Sulfate mg/L 250 (a) 1. Basin Plan 460 490 450 100% NA1
2007, 2013 Surfactants (MBAS) mg/L 0.5 1. Basin Plan 0.09 0.068 0.058 0.049J 0.036J 0.052J 0.079 0.12 0.08 0% 0.142007, 2013 Total Dissolved Solids mg/L 500 (a) 1. Basin Plan 2,266 2,160 2,300 1,600 2,000 2,200 2,200 2,400 2,200 100% 4.292007, 2013 Total Suspended Solids mg/L 58 14. NSQD, 1. Basin Plan 7.6 5 5 27 5 6 7 12 29 0% 0.202007, 2013 Total Hardness mg CaCO3/L NA 332.1 560.3 960 760 923 914 1,060 1,070 1,000Total Metals2013 Aluminum mg/L 1.0 (d) 1. Basin Plan 0.046 0.13 0.071 0% NA1
2007 Antimony mg/L 0.006 (d) 1. Basin Plan 0.0003J 0.0002J 0.00018J 0.00016J 0.00014J 0.00018J 0.00015J NR 0.00020J 0% 0.032007, 2013 Arsenic mg/L 0.01 (d) 1. Basin Plan 0.0026 0.0027 0.0017 0.0024 0.002 0.0018 0.0021 0.0019 0.0028 0% 0.222007, 2013 Cadmium mg/L 0.005 (d) 1. Basin Plan <0.0004 <0.0004 <0.0001 0.00004J 0.00002J 0.00003J <0.00010 <0.00010 <0.00010 0% 0.022007, 2013 Chromium mg/L 0.05 (d) 1. Basin Plan 0.0002J <0.0005 0.0014 0.0013 0.00039 0.00023 0.00011J 0.00023 0.00017J 0% 0.012013 Chromium, Trivalent mg/L NA <0.00020 <0.00020 <0.000202013 Chromium, Hexavalent mg/L 0.010 (d) 1. Basin Plan 0.00006 0.000035 0.000028 0% NA1
2007, 2013 Copper mg/L 1.0 (d) 1. Basin Plan 0.0014 0.0005J 0.0012 0.0017 0.00092 0.00097 0.00072 0.00068 0.0017 0% 0.002013 Iron mg/L 0.3 (a) 1. Basin Plan 0.35 0.57 0.3 67% NA1
2007, 2013 Lead mg/L NA 0.0001 0.00013 0.000095J 0.00063 0.00024 0.00019J 0.000060J 0.00016J <0.000202013 Manganese mg/L 0.05 (a) 1. Basin Plan 0.32 0.7 0.22 100% NA1
2013 Mercury mg/L 0.002 (d) 1. Basin Plan 0.0000070J <0.000050 <0.000050 0% NA1
2007, 2013 Nickel mg/L 0.1 (d) 1. Basin Plan 0.0018 0.0021 0.0073 0.0027 0.0024 0.0022 0.0024 0.0025 0.0064 0% 0.032007, 2013 Selenium mg/L 0.005 16. 40 CFR 131.38 0.0008 0.0004J 0.00062 0.00044 0.0005 0.00037J 0.00029J 0.0004 0.002 0% 0.132013 Silver mg/L 0.1 (d) 1. Basin Plan <0.00020 <0.00020 <0.00020 0% NA1
2013 Thallium mg/L 0.002 (d) 1. Basin Plan <0.00020 <0.00020 <0.00020 0% NA1
2007, 2013 Zinc mg/L 5.0 (d) 1. Basin Plan 0.003 0.001 0.0015J 0.0066 0.0046J 0.0016J 0.0031J 0.0030J 0.0023J 0% 0.00Dissolved Metals2013 Aluminum mg/L NA 0.0017J 0.0019J <0.00502007 Antimony mg/L 0.006 1. Basin Plan 0.0003J 0.0002J 0.00019J 0.00015J 0.00015J 0.00015J 0.00016J NR 0.00020J 0% 0.03
2007, 2013 Arsenic mg/L 0.34 acute /0.15 chronic 16. 40 CFR 131.38 0.0022 0.0027 0.0015 0.0018 0.0018 0.0018 0.0018 0.0015 0.0023 0% 0.01
2007, 2013 Cadmium mg/L (e) 16. 40 CFR 131.38 <0.0004 <0.0004 0.000013J <0.0001 <0.0001 0.00002J <0.00010 <0.00010 <0.00010 0% 0.012007, 2013 Chromium mg/L (e) 16. 40 CFR 131.38 0.0001J <0.0005 0.00036 0.00005J 0.00008J 0.00008J 0.000043J <0.00020 0.000052J 0% 0.002013 Chromium, Trivalent mg/L (e) 16. 40 CFR 131.38 AE <0.0002 <0.0002 0% NA1
2013 Chromium, Hexavalent mg/L 0.011 16. 40 CFR 131.38 AE 0.000045 0.000019J 0% NA1
2007, 2013 Copper mg/L (e) 16. 40 CFR 131.38 0.0012 0.0006J 0.001 0.00077 0.00071 0.00082 0.00049J 0.00042J 0.0015 0% 0.032013 Iron mg/L NA 0.044 0.03 <0.0102007, 2013 Lead mg/L (e) 16. 40 CFR 131.38 <0.0001 <0.0001 0.000021J 0.00007J 0.00012J 0.00006J <0.00020 <0.00020 <0.00020 0% 0.012013 Manganese mg/L NA 0.18 0.51 0.00192013 Mercury mg/L NA 0.0000060J <0.000050 <0.0000502007, 2013 Nickel mg/L (e) 16. 40 CFR 131.38 0.0018 0.0021 0.0066 0.0021 0.0022 0.0021 0.0023 0.0023 0.0065 0% 0.022007, 2013 Selenium mg/L NA 0.0007 0.0004J 0.00058 0.00043 0.00044 0.00033J 0.00035J 0.00035J 0.00212013 Silver mg/L (e) 16. 40 CFR 131.38 <0.00020 <0.00020 <0.00020 0% 0.002013 Thallium mg/L NA <0.00020 <0.00020 <0.000202007, 2013 Zinc mg/L (e) 16. 40 CFR 131.38 0.0008 0.0005 0.002J 0.005 0.0026J 0.0016J 0.0024J 0.0013J 0.0012J 0% 0.01
No
Sam
ples
Col
lect
ed
No
Sam
ples
Col
lect
ed
No
Sam
ples
Col
lect
ed
No
Sam
ples
Col
lect
ed
2007-2008 2012-20132010-2011AnalytePermit
Requirement Units Mean Ratio to Benchmarks
Frequency Above
Benchmarks
Historical Monitoring Data
2014-2015
Water Quality Benchmarks Benchmark References

Dry Weather Historical Monitoring Table for SDC-MLS
Long Term and
Transitional Monitoring
Long Term and
Transitional Monitoring
Long Term Monitoring
Long Term and
Transitional Monitoring
2008-2009 2009-2010 2011-2012 2013-2014
03/04/08 03/05/08
06/02/08-06/03/08 - - 12/02/10 05/11/11-
05/12/11 - 02/25/13-02/26/13
05/01/13-05/02/13 - 01/07/15 02/11/15 05/13/15
2007-2008 2012-20132010-2011AnalytePermit
Requirement Units Mean Ratio to Benchmarks
Frequency Above
Benchmarks
Historical Monitoring Data
2014-2015
Water Quality Benchmarks Benchmark References
Acid Extractable Compounds2013 Pentachlorophenol µg/L (f) 16. 40 CFR 131.38 AE <1.0 <1.0 0% NA1
Organophosphorus Pesticides2013 Azinphos methyl (Guthion) µg/L NA <0.010 <0.010 <0.0102013 Bolstar µg/L NA <0.010 <0.010 <0.010
2007, 2013 Chlorpyrifos µg/L 0.02 acute / 0.014 chronic 12. CA Dept. of Fish & Game, 2000 <0.002 <0.002 <0.01 <0.01 <0.01 <0.01 <0.010 <0.010 <0.010 0% 0.29
2013 Coumaphos µg/L NA <0.010 <0.010 <0.0102013 Demeton-o µg/L NA <0.010 <0.010 <0.0102013 Demeton-s µg/L NA <0.010 <0.010 <0.010
2007, 2013 Diazinon µg/L 0.08 acute / 0.05 chronic
12. CA Dept. of Fish & Game, 2000, 11. Chollas Creek TMDL for Diazinon, 10. USEPA, Aquatic Life Ambient
Water Quality Criteria Diazinon<0.004 <0.004 <0.01 <0.01 <0.01 <0.01 <0.010 <0.010 <0.010 0% 0.09
2013 Dichlorvos µg/L NA <0.010 <0.010 <0.0102013 Dimethoate µg/L NA <0.010 <0.010 <0.0102013 Disulfoton µg/L NA <0.010 <0.010 <0.0102013 Ethoprop µg/L NA <0.010 <0.010 <0.0102013 Ethyl parathion µg/L NA <0.010 <0.010 <0.0102013 Fensulfothion µg/L NA <0.010 0.0035J 0.0060J2013 Fenthion µg/L NA <0.010 <0.010 <0.010
2007, 2013 Malathion µg/L 0.43 acute /0.1 chronic 13. CA Dept. of Fish & Game, 1998, 5. Goldbook <0.006 <0.006 <0.01 <0.01 <0.01 <0.01 <0.010 <0.010 <0.010 0% 0.05
2013 Merphos µg/L NA <0.010 <0.010 <0.0102013 Methyl parathion µg/L NA <0.010 <0.010 <0.0102013 Mevinphos µg/L NA <0.010 <0.010 <0.0102013 Naled µg/L NA <0.010 <0.010BS-L <0.0102013 Phorate µg/L NA <0.010 <0.010 <0.0102013 Ronnel µg/L NA <0.010 <0.010 <0.0102013 Stirophos µg/L NA <0.010 <0.010 <0.0102013 Tokuthion (Prothiofos) µg/L NA <0.010 <0.010 <0.0102013 Trichloronate µg/L NA <0.010 <0.010 <0.010Pyrethroids2013 Allethrin µg/L NA <0.002 <0.002 <0.0022013 Bifenthrin µg/L 0.0093 15. Anderson et al., 2006 <0.002 <0.002 <0.002 0% NA1
2013 Cyfluthrin µg/L 0.344 17. Wheelock et al., 2004 <0.002 <0.002 <0.002 0% NA1
2013 Cyhalothrin, Total Lambda µg/L 0.20 17. Wheelock et al., 2004 <0.002 <0.002 <0.002 0% NA1
2013 Cypermethrin µg/L 0.344 17. Wheelock et al., 2004 <0.002 <0.002 <0.002 0% NA1
2013 Danitol (Fenpropathrin) µg/L NA <0.002 <0.002 <0.0022013 Deltamethrin/Tralomethrin µg/L NA <0.002 <0.002 <0.0022013 Esfenvalerate µg/L 0.25 17. Wheelock et al., 2004 <0.002 <0.002 <0.002 0% NA1
2013 Fenvalerate µg/L NA <0.002 <0.002 <0.0022013 Fluvalinate µg/L NA <0.002 <0.002 <0.0022013 Permethrin µg/L 0.021 15. Anderson et al., 2006 <0.01 <0.01 <0.01 0% NA1
2013 Prallethrin µg/L NA <0.002 <0.002 <0.0022013 Resmethrin µg/L NA <0.01 <0.01 <0.01Toxicity2007, 2013 Ceriodaphnia 96-hr LC50 (%) >100 >100 >100 >100 >100 >100 >100 >100 NR >100 0% 1.002007, 2013 Ceriodaphnia 7-day survival NOEC (%) 100 100 100 100 100 100 100 100 NR 100 0% 1.002007, 2013 Ceriodaphnia 7-day reproduction NOEC (%) 100 100 100 50 <6.25 100 50 50 NR 100 50% 3.252007 Hyalella 96-hr LC50 (%) >100 >100 >100 >100 >100 >100 >100 >100 NR >100 0% 1.002007, 2013 Selenastrum 96-hr NOEC (%) 100 100 50 100 100 100 100* 50 NR 100 38% 1.252013 Strongylocentrotus 96-hr TST Pass/Fail Pass Pass Pass 0%See last page for footnotes and source references.
No
Sam
ples
Col
lect
ed
No
Sam
ples
Col
lect
ed
No
Sam
ples
Col
lect
ed
No
Sam
ples
Col
lect
ed

Dry Weather Historical Monitoring Table for SDC-MLS
Blank spaces have been verified and no data is available.
NA indicate no criteria or published value was available or applicable to the matrix or program.(a) Water Quality Benchmark are based on the San Diego Regional Water Quality Control Plan by watershed for the San Diego Region (Basin Plan), 1994 (with amendments effective on or before April 4, 2011) and may vary by hydrologic area.
(d) Water Quality Benchmark for total metals is based on the MUN beneficial use as described in the Basin Plan, 1994 (with amendments effective on or before April 4, 2011).
(f) Water Quality Benchmark for pentachlorophenol are based on pH and are calculated as described by the USEPA Federal Register Doc. 40 CFR Part 131, May 18, 2000. The Criteria Maximum Concentration (CMC) was used.AE-Analysis error.BS-L-Blank Spike recovery of this analyte was below the control limits. Results may be biased low.J-Analyte was detected at a concentration below the reporting limit and above the method detection limit. Reported value is estimated.
NR-Sampling of this analyte not required for transitional monitoring (RWQCB Order No. R9-2007-0001) and/or for long term monitoring (RWQCB Order No. R9-2013-0001).* Originally tested with first batch. Showed slight toxicity (TU=2) but was out of holding time. Re-run with second batch.
SourcesPlease refer to the San Diego County Copermittee Regional Monitoring Program Benchmark Sources in Attachment B to Appendix A for benchmark source citations.
NA1 Three or more years of data required to calculate the Mean Ratio to Benchmark.
(e) Water Quality Benchmark for dissolved metal fractions are based on total hardness and are calculated as described by the USEPA Federal Register Doc. 40 CFR Part 131, May 18, 2000. The Criteria Maximum Concentration (CMC) and Continuous Criteria Concentration (CCC) were used.
(b) Water Quality Benchmark for Enterococcus is based on the maximum criteria for infrequently used freshwater area by the San Diego Regional Water Quality Control Plan for the San Diego Region (Basin Plan), 1994 (with amendments effective on or before April 4, 2011).(c) Prior to the 2014-2015 monitoring year, Water Quality Benchmark was calculated based on CMC (salmonids absent) and CCC (early life stages present) using water temperature and pH described in the U.S. EPA, 1999 Update of Ambient Water Quality Criteria for Ammonia, EPA-822-R-99-014, December 1999. For 2014-2015 monitoring year, Water Quality Benchmark CMC and CCC were calculated based on pH and water temperature (when applicable) as described in the U.S. EPA, 2013 Aquatic Life Ambient Water Quality Criteria for Ammonia - Freshwater, EPA-822-R-13-001, April 2013.
Values with red bold font and shading do not meet Water Quality Benchmarks.

Dry Weather Historical Monitoring Table for SLR-TWAS-1
2008-2009 2009-2010 2011-2012 2013-2014
09/18/07-09/19/07
05/13/08-05/14/08 - - 01/11/11-
01/12/11 05/10/11 - 02/25/13-02/26/13
05/01/13-05/02/13 - 01/07/15 5/5/2015-
5/6/2015Physical Chemistry2007, 2013 pH pH units 6.5-9.0 1. Basin Plan 7.42 7.68 7.34 7.75 7.45 7.62 6.66 7.59 0% 0.252007, 2013 Specific Conductivity µmhos/cm NA 2,320 1,878 1,773 1,811 2,670 2,580 2,283 2,9552007, 2013 Water Temperature Celsius NA 18.9 15.90 12.70 17.20 12.20 15.80 14.58 15.692007, 2013 Turbidity NTU 20 1. Basin Plan 5.3 8.4 8.8 3.2 13 2.6 2.7 2.5 0% 0.29Bacteriological2007, 2013 Enterococcus MPN/100 mL 151 (a) 1. Basin Plan 500 800 1,300 500 60 500 40 20 63% 3.082007, 2013 Fecal Coliform MPN/100 mL 400 1.Basin Plan REC-1/REC-2 170 140 300 230 40 230 <20 40 0% 0.372007, 2013 Total Coliform MPN/100 mL NA 800 5,000 5,000 1,700 3,000 3,000 300 230Nutrients2007, 2013 Ammonia as N mg/L (b) 6. USEPA Water Quality Criteria (Freshwater) 0.004 0.03 0.1 <0.1 0.15 <0.1 <0.10 <0.10 0% 0.022007, 2013 Nitrate as N mg/L 10 1. Basin Plan 0.01 0.48 4.6 1.6 0.99 0.24 0.092J <0.10 0% 0.102007, 2013 Nitrite as N mg/L 1 1. Basin Plan <0.05 <0.05 0.038J <0.1 0.029J <0.15 0.017J <0.10 0% 0.042007, 2013 Total Kjeldahl Nitrogen mg/L NA 0.56 1.1 0.71 0.5 0.41 0.54 0.3 0.22007, 2013 Total Nitrogen (calculated) mg/L 1 1. Basin Plan 0.57 1.58 5.35 2.10 1.429 0.78 0.409 0.2 50% 1.552007 Dissolved Phosphorus mg/L 0.1 1. Basin Plan 0.04J 0.08 0.099 0.1 0.11 0.093 0.017 0.022 13% 0.702007, 2013 Total Phosphorus mg/L 0.1 1. Basin Plan 0.1 0.147 0.15 0.15 0.20 0.17 0.064 0.08 63% 1.33General Chemistry2007 Biochemical Oxygen Demand mg/L 10 8. McNeeley (1979) <2 3.6 1.3J 0.68J 1.2J 0.91J <2.0 <2.0 0% 0.132007 Chemical Oxygen Demand mg/L 120 4. MSGP 2015 160 16 12 17 17 21 15 17 13% 0.292007, 2013 Dissolved Organic Carbon mg/L NA 5 6.4 6.2 5.1 4.8 4.4 5.3 4.92007, 2013 Total Organic Carbon mg/L NA 39.4 5.8 6.4 5.1 5.1 4.1 5.4 4.92007 Oil and Grease mg/L 10 1. Basin Plan, 3. Anacostia River TMDL 1J <5 <5 <5 <5 2.1J <5.0 1.7J 0% 0.222007, 2013 Surfactants (MBAS) mg/L 0.5 1. Basin Plan 0.04 0.029 0.037J <0.05 0.033J 0.056 0.049J 0% 0.082007, 2013 Total Dissolved Solids mg/L 500 (c) 1. Basin Plan 1,740 1,552 1,400 1,500 1,700 1,800 1,800 2,000 100% 3.372007, 2013 Total Suspended Solids mg/L 58 14. NSQD, 1. Basin Plan 2J 10 11 10 19 25 3 4 0% 0.182007, 2013 Total Hardness mg CaCO3/L NA 499.8 447.7 710 750 887 880 978 1,100Total Metals2007 Antimony mg/L 0.006 (d) 1. Basin Plan <0.0005 0.0001J 0.00011J 0.000064J 0.00006J 0.00008J 0.000081J <0.00050 0% 0.022007, 2013 Arsenic mg/L 0.01 (d) 1. Basin Plan 0.0012 0.0014 0.0013 0.0011 0.001 0.0011 0.00096 0.00065 0% 0.112007, 2013 Cadmium mg/L 0.005 (d) 1. Basin Plan <0.0004 <0.0004 0.000036J 0.000023J 0.00003J 0.00004J 0.000057J <0.00010 0% 0.022007, 2013 Chromium mg/L 0.05 (d) 1. Basin Plan 0.0001J <0.0005 0.00095 0.00033 0.00072 0.00062 0.000077J 0.000050J 0% 0.012007, 2013 Copper mg/L 1.0 (d) 1. Basin Plan <0.0008 0.0007J 0.0035 0.0022 0.0017 0.0018 0.00056 0.00026J 0% 0.002007, 2013 Lead mg/L NA <0.0001 0.0001 0.00034 0.00014J 0.0004 0.00045 0.000068J <0.000202007, 2013 Nickel mg/L 0.1 (d) 1. Basin Plan 0.0007 0.0008 0.0042 0.003 0.0017 0.0014 0.0022 0.0015 0% 0.022007, 2013 Selenium mg/L 0.005 16. 40 CFR 131.38 <0.0005 0.0006 0.00071 0.00056 0.00038J 0.00027J 0.00017J <0.00040 0% 0.082007, 2013 Zinc mg/L 5.0 (d) 1. Basin Plan 0.0011 0.0017 0.0039J 0.0019J 0.0039J 0.0042J 0.0026J 0.0011J 0% 0.00Dissolved Metals2007 Antimony mg/L 0.006 1. Basin Plan <0.0005 0.0001J 0.000091J 0.000071J 0.00006J 0.00005J 0.000080J <0.00050 0% 0.02
2007, 2013 Arsenic mg/L 0.34 acute /0.15 chronic 16. 40 CFR 131.38 0.0011 0.0013 0.0009 0.00081 0.00078 0.00083 0.00069 0.00053 0% 0.00
2007, 2013 Cadmium mg/L (e) 16. 40 CFR 131.38 <0.0004 <0.0004 0.000027J 0.000022J 0.00004J 0.00003J <0.00010 <0.00010 0% 0.012007, 2013 Chromium mg/L (e) 16. 40 CFR 131.38 <0.0005 <0.0005 0.000079J 0.0001J <0.0002 0.00007J 0.000039J <0.00020 0% 0.002007, 2013 Copper mg/L (e) 16. 40 CFR 131.38 <0.0008 <0.0008 0.0024 0.0012 0.00081 0.00067 0.00030J 0.00025J 0% 0.032007, 2013 Lead mg/L (e) 16. 40 CFR 131.38 <0.0001 <0.0001 0.000022J <0.0002 0.00007J 0.00004J <0.00020 <0.00020 0% 0.012007, 2013 Nickel mg/L (e) 16. 40 CFR 131.38 0.0006 0.0007 0.0037 0.0025 0.0013 0.0011 0.0022 0.0015 0% 0.012007, 2013 Selenium mg/L NA <0.0005 0.0006 0.00066 0.00062 0.00035J 0.00019J 0.00015J <0.000402007, 2013 Zinc mg/L (e) 16. 40 CFR 131.38 <0.0005 0.0004J 0.002J 0.0021J 0.0024J 0.0019J 0.0012J 0.0012J 0% 0.00Organophosphorus Pesticides
2007, 2013 Chlorpyrifos µg/L 0.02 acute / 0.014 chronic 12. CA Dept. of Fish & Game, 2000 <0.002 <0.002 <0.01 <0.01 <0.01 <0.01 <0.010 <0.010 0% 0.29
2007, 2013 Diazinon µg/L 0.08 acute / 0.05 chronic
12. CA Dept. of Fish & Game, 2000, 11. Chollas Creek TMDL for Diazinon, 10. USEPA, Aquatic Life Ambient
Water Quality Criteria Diazinon<0.004 <0.004 <0.01 <0.01 <0.01 <0.01 0.0056J <0.010 0% 0.09
2007, 2013 Malathion µg/L 0.43 acute /0.1 chronic 13. CA Dept. of Fish & Game, 1998, 5. Goldbook <0.006 <0.006 <0.01 <0.01 <0.01 <0.01 <0.010 <0.010 0% 0.05
Toxicity2007, 2013 Ceriodaphnia 96-hr LC50 (%) >100 >100 >100 >100 >100 >100 >100 >100 >100 0% 1.002007, 2013 Ceriodaphnia 7-day survival NOEC (%) 100 100 100 100 100 100 100 100 100 0% 1.002007, 2013 Ceriodaphnia 7-day reproduction NOEC (%) 100 100 100 100 6.25Q 100 50 50 50 43% 1.432007 Hyalella 96-hr LC50 (%) >100 >100 >100 >100 >100 >100 >100 >100 >100 0% 1.002007, 2013 Selenastrum 96-hr NOEC (%) 100 100 100 100 100 100 50 100 25 25% 1.50See last page for footnotes and source references.
Frequency Above
Benchmarks
Permit Requirement 2007-2008 2010-2011
Transitional Monitoring
No
Sam
ples
Col
lect
ed
No
Sam
ples
Col
lect
ed
No
Sam
ples
Col
lect
ed
2014-2015
No
Sam
ples
Col
lect
ed
Water Quality Benchmarks Benchmark References Mean Ratio to
Benchmarks2012-2013Analyte Units
Historical Monitoring Data

Dry Weather Historical Monitoring Table for SLR-TWAS-1
Blank spaces have been verified and no data is available due.
NA indicate no criteria or published value was available or applicable to the matrix or program.
(c) Water Quality Benchmark are based on the San Diego Regional Water Quality Control Plan by watershed for the San Diego Region (Basin Plan), 1994 (with amendments effective on or before April 4, 2011) and may vary based on hydrologic area.(d) Water Quality Benchmark for total metals is based on the MUN beneficial use as described in the Basin Plan, 1994 (with amendments effective on or before April 4, 2011).
SourcesPlease refer to the San Diego County Copermittee Regional Monitoring Program Benchmark Sources in Attachment B to Appendix A for benchmark source citations.
Q-Results did not meet quality control criteria; results not used in assessment.J-Analyte was detected at a concentration below the reporting limit and above the method detection limit. Reported value is estimated.
(e) Water Quality Benchmark for dissolved metal fractions are based on total hardness and are calculated as described by the USEPA Federal Register Doc. 40 CFR Part 131, May 18, 2000. The Criteria Maximum Concentration (CMC) and Continuous Criteria Concentration (CCC) were used.
(a) Water Quality Benchmark for Enterococcus is based on the maximum criteria for infrequently used freshwater area by the San Diego Regional Water Quality Control Plan for the San Diego Region (Basin Plan), 1994 (with amendments effective on or before April 4, 2011).(b) Prior to the 2014-2015 monitoring year, Water Quality Benchmark was calculated based on CMC (salmonids absent) and CCC (early life stages present) using water temperature and pH described in the U.S. EPA, 1999 Update of Ambient Water Quality Criteria for Ammonia, EPA-822-R-99-014, December 1999. For 2014-2015 monitoring year, Water Quality Benchmark CMC and CCC were calculated based on pH and water temperature (when applicable) as described in the U.S. EPA, 2013 Aquatic Life Ambient Water Quality Criteria for Ammonia - Freshwater, EPA-822-R-13-001, April 2013.
Values with red bold font and shading do not meet Water Quality Benchmarks.

Dry Weather Historical Monitoring Table for SLR-TWAS-2
2011-2012 2013-2014 2014-2015
01/11/11-01/12/11
05/09/11-05/10/11 - 02/25/13-
02/26/1305/01/13-05/02/13 - -
Physical Chemistry2007, 2013 pH pH units 6.5-9.0 1. Basin Plan 7.62 8.02 7.91 7.68 0% NA1
2007, 2013 Specific Conductivity µmhos/cm NA 1,758 1,931 2,740 2,7802007, 2013 Water Temperature Celsius NA 13.60 18.80 13.7 17.32007, 2013 Turbidity NTU 20 1. Basin Plan 12 2 9.6 43 25% NA1
Bacteriological2007, 2013 Enterococcus MPN/100 mL 151 (a) 1. Basin Plan 300 110 20 700 50% NA1
2007, 2013 Fecal Coliform MPN/100 mL 400 1.Basin Plan REC-1/REC-2 170 110 40 300 0% NA1
2007, 2013 Total Coliform MPN/100 mL NA 5,000 1,700 800 5000Nutrients2007, 2013 Ammonia as N mg/L (b) 6. USEPA Water Quality Criteria (Freshwater) 0.1 <0.1 <0.1 0.069J 0% NA1
2007, 2013 Nitrate as N mg/L 10 1. Basin Plan 5.8 4.1 4.1 7.6 0% NA1
2007, 2013 Nitrite as N mg/L 1 1. Basin Plan 0.059J 0.04J 0.071J <0.15 0% NA1
2007, 2013 Total Kjeldahl Nitrogen mg/L NA 0.53 0.35 0.32 0.872007, 2013 Total Nitrogen (calculated) mg/L 1 1. Basin Plan 6.39 4.49 4.491 8.47 100% NA1
2007 Dissolved Phosphorus mg/L 0.1 1. Basin Plan 0.17 0.14 0.14 0.13 100% NA1
2007, 2013 Total Phosphorus mg/L 0.1 1. Basin Plan 0.21 0.15 0.18 0.24 100% NA1
General Chemistry2007 Biochemical Oxygen Demand mg/L 10 8. McNeeley (1979) 1.6J 3.6 1.2J 1.5J 0% NA1
2007 Chemical Oxygen Demand mg/L 120 4. MSGP 2015 31 24 12 23 0% NA1
2007, 2013 Dissolved Organic Carbon mg/L NA 6.7 5.2 4.9 4.72007, 2013 Total Organic Carbon mg/L NA 6.9 5.1 5.4 4.42007 Oil and Grease mg/L 10 1. Basin Plan, 3. Anacostia River TMDL <5 <5 <5 2J 0% NA1
2007, 2013 Surfactants (MBAS) mg/L 0.5 1. Basin Plan 0.031J <0.05 0.024J 0% NA1
2007, 2013 Total Dissolved Solids mg/L 500 (c) 1. Basin Plan 1,400 1,500 1,800 1,900 100% NA1
2007, 2013 Total Suspended Solids mg/L 58 14. NSQD, 1. Basin Plan 18 4 24 71 25% NA1
2007, 2013 Total Hardness mg CaCO3/L NA 690 780 906 894Total Metals2007 Antimony mg/L 0.006 (d) 1. Basin Plan 0.00013J 0.000079J 0.0001J 0.00018J 0% NA1
2007, 2013 Arsenic mg/L 0.01 (d) 1. Basin Plan 0.0014 0.0011 0.0012 0.0019 0% NA1
2007, 2013 Cadmium mg/L 0.005 (d) 1. Basin Plan 0.00003J 0.000026J 0.00006J 0.00007J 0% NA1
2007, 2013 Chromium mg/L 0.05 (d) 1. Basin Plan 0.0021 0.00022 0.00091 0.0047 0% NA1
2007, 2013 Copper mg/L 1.0 (d) 1. Basin Plan 0.0041 0.0017 0.0018 0.0066 0% NA1
2007, 2013 Lead mg/L NA 0.00047 0.00028 0.00034 0.00182007, 2013 Nickel mg/L 0.1 (d) 1. Basin Plan 0.0046 0.003 0.002 0.0034 0% NA1
2007, 2013 Selenium mg/L 0.005 16. 40 CFR 131.38 0.00088 0.0008 0.00061 0.00071 0% NA1
2007, 2013 Zinc mg/L 5.0 (d) 1. Basin Plan 0.0062 0.0011J 0.0061 0.022 0% NA1
Dissolved Metals2007 Antimony mg/L 0.006 1. Basin Plan 0.00011J 0.000076J 0.00007J 0.00009J 0% NA1
2007, 2013 Arsenic mg/L 0.34 acute /0.15 chronic 16. 40 CFR 131.38 0.00096 0.0011 0.001 0.0013 0% NA1
2007, 2013 Cadmium mg/L (e) 16. 40 CFR 131.38 0.000027J 0.000027J 0.00003J 0.00003J 0% NA1
2007, 2013 Chromium mg/L (e) 16. 40 CFR 131.38 0.00013J 0.000056J <0.0002 0.00009J 0% NA1
2007, 2013 Copper mg/L (e) 16. 40 CFR 131.38 0.0024 0.0016 0.00095 0.0014 0% NA1
2007, 2013 Lead mg/L (e) 16. 40 CFR 131.38 0.000041J <0.0002 0.00009J <0.0002 0% NA1
2007, 2013 Nickel mg/L (e) 16. 40 CFR 131.38 0.0038 0.0028 0.0015 0.0013 0% NA1
2007, 2013 Selenium mg/L NA 0.0008 0.00069 0.0006 0.000592007, 2013 Zinc mg/L (e) 16. 40 CFR 131.38 0.0022J 0.0024J 0.0033J 0.0023J 0% NA1
Organophosphorus Pesticides
2007, 2013 Chlorpyrifos µg/L 0.02 acute / 0.014 chronic 12. CA Dept. of Fish & Game, 2000 <0.01 <0.01 <0.01 <0.01 0% NA1
2007, 2013 Diazinon µg/L 0.08 acute / 0.05 chronic
12. CA Dept. of Fish & Game, 2000, 11. Chollas Creek TMDL for Diazinon, 10. USEPA, Aquatic Life Ambient
Water Quality Criteria Diazinon<0.01 <0.01 <0.01 <0.01 0% NA1
2007, 2013 Malathion µg/L 0.43 acute /0.1 chronic 13. CA Dept. of Fish & Game, 1998, 5. Goldbook <0.01 <0.01 <0.01 <0.01 0% NA1
Toxicity2007, 2013 Ceriodaphnia 96-hr LC50 (%) >100 >100 >100 >100 >100 0% NA1
2007, 2013 Ceriodaphnia 7-day survival NOEC (%) 100 100 100 100 100 0% NA1
2007, 2013 Ceriodaphnia 7-day reproduction NOEC (%) 100 100 <6.25 100 100 25% NA1
2007 Hyalella 96-hr LC50 (%) >100 >100 >100 >100 57.4* 25% NA1
2007, 2013 Selenastrum 96-hr NOEC (%) 100 100 100 50 100 25% NA1
See last page for footnotes and source references.
Permit Requirement
Long Term Monitoring
Mean Ratio to Benchmarks
Transitional Monitoring
Units Water Quality Benchmarks
No
Sam
ples
Col
lect
ed
No
Sam
ples
Col
lect
ed
2010-2011
No
Sam
ples
Col
lect
ed
Frequency Above
BenchmarksBenchmark References 2012-2013Analyte

Dry Weather Historical Monitoring Table for SLR-TWAS-2
Blank spaces have been verified and no data is available.
NA indicate no criteria or published value was available or applicable to the matrix or program.
(c) Water Quality Benchmarks are based on the San Diego Regional Water Quality Control Plan by watershed for the San Diego Region (Basin Plan), 1994 (with amendments effective on or before April 4, 2011) and may vary by hyrdologic area/subarea.(d) Water Quality Benchmark for total metals is based on the MUN beneficial use as described in the Basin Plan, 1994 (with amendments effective on or before April 4, 2011).
SourcesPlease refer to the San Diego County Copermittee Regional Monitoring Program Benchmark Sources in Attachment B to Appendix A for benchmark source citations.
(a) Water Quality Benchmark for Enterococcus is based on the maximum criteria for infrequently used freshwater area by the San Diego Regional Water Quality Control Plan for the San Diego Region (Basin Plan), 1994 (with amendments effective on or before April 4, 2011).(b) Prior to the 2014-2015 monitoring year, Water Quality Benchmark was calculated based on CMC (salmonids absent) and CCC (early life stages present) using water temperature and pH described in the U.S. EPA, 1999 Update of Ambient Water Quality Criteria for Ammonia, EPA-822-R-99-014, December 1999. For 2014-2015 monitoring year, Water Quality Benchmark CMC and CCC were calculated based on pH and water temperature (when applicable) as described in the U.S. EPA, 2013 Aquatic Life Ambient Water Quality Criteria for Ammonia - Freshwater, EPA-822-R-13-001, April 2013.
(e) Water Quality Benchmark for dissolved metal fractions are based on total hardness and are calculated as described by the USEPA Federal Register Doc. 40 CFR Part 131, May 18, 2000. The Criteria Maximum Concentration (CMC) and Continuous Criteria Concentration (CCC) were used.
NA1 Three or more years of data required to calculate the Mean Ratio to Benchmark.* Fungus observed on bodies of dead Hyalella. TIE not run.
J-Analyte was detected at a concentration below the reporting limit and above the method detection limit. Reported value is estimated.
Values with red bold font and shading do not meet Water Quality Benchmarks.
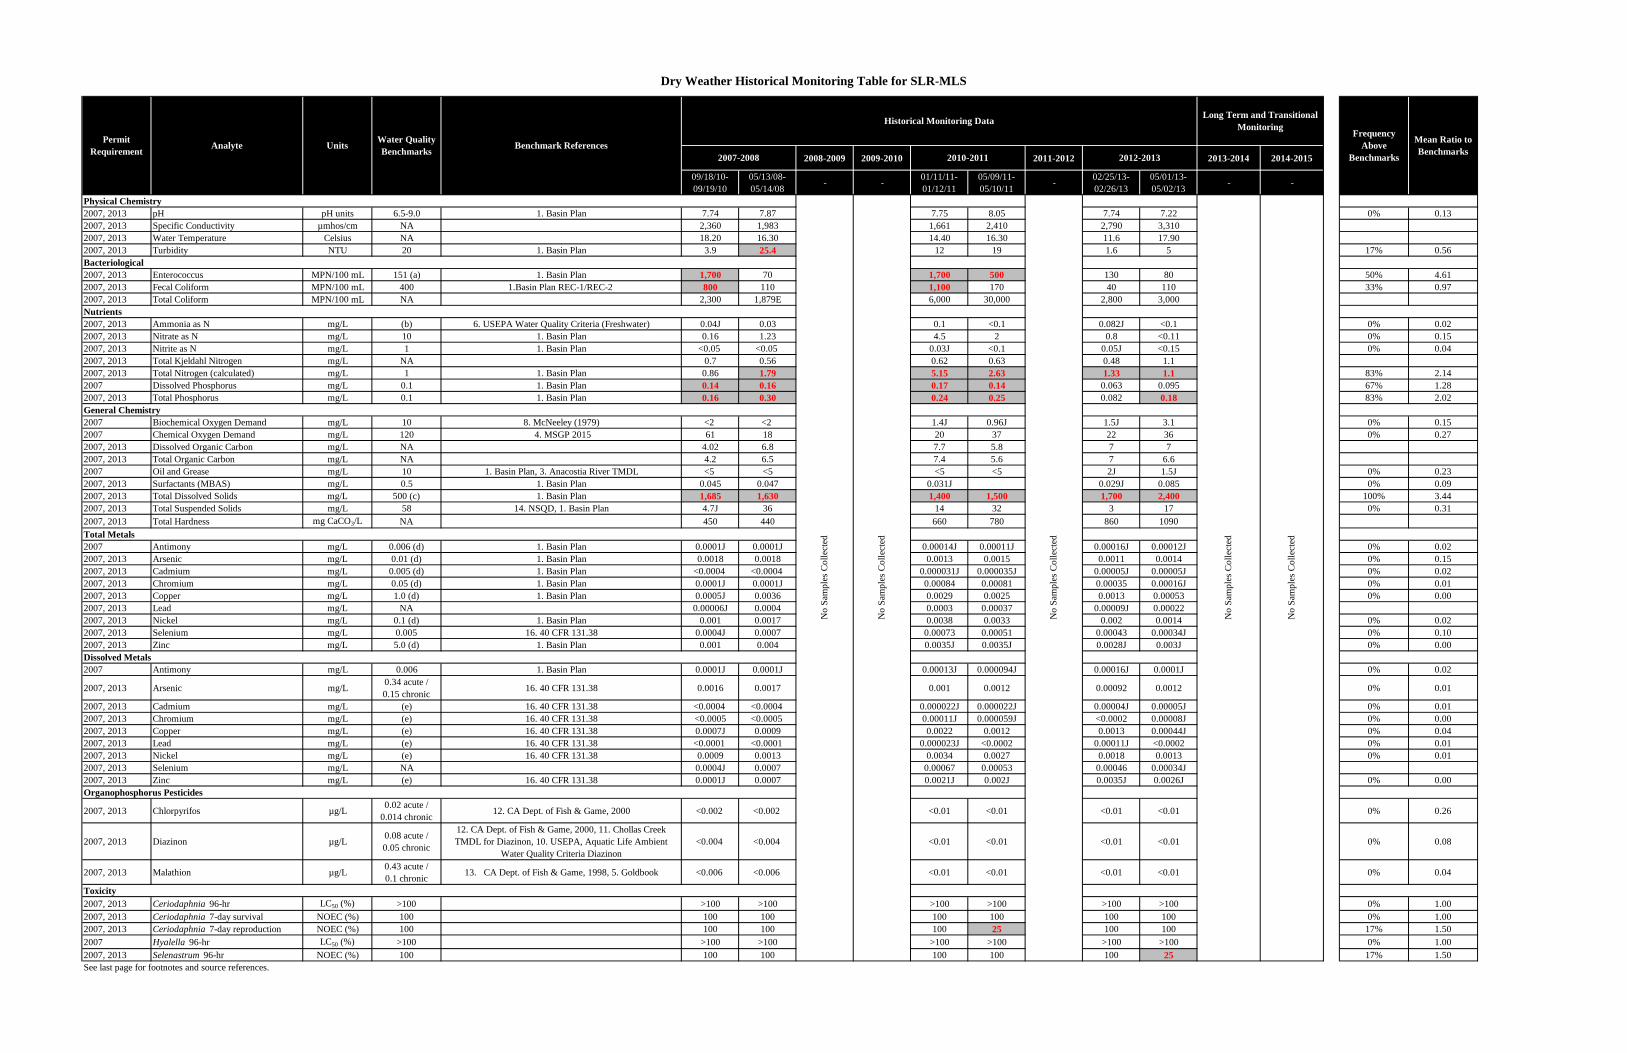
Dry Weather Historical Monitoring Table for SLR-MLS
2008-2009 2009-2010 2011-2012 2013-2014 2014-2015
09/18/10-09/19/10
05/13/08-05/14/08 - - 01/11/11-
01/12/1105/09/11-05/10/11 - 02/25/13-
02/26/1305/01/13-05/02/13 - -
Physical Chemistry2007, 2013 pH pH units 6.5-9.0 1. Basin Plan 7.74 7.87 7.75 8.05 7.74 7.22 0% 0.132007, 2013 Specific Conductivity µmhos/cm NA 2,360 1,983 1,661 2,410 2,790 3,3102007, 2013 Water Temperature Celsius NA 18.20 16.30 14.40 16.30 11.6 17.902007, 2013 Turbidity NTU 20 1. Basin Plan 3.9 25.4 12 19 1.6 5 17% 0.56Bacteriological2007, 2013 Enterococcus MPN/100 mL 151 (a) 1. Basin Plan 1,700 70 1,700 500 130 80 50% 4.612007, 2013 Fecal Coliform MPN/100 mL 400 1.Basin Plan REC-1/REC-2 800 110 1,100 170 40 110 33% 0.972007, 2013 Total Coliform MPN/100 mL NA 2,300 1,879E 6,000 30,000 2,800 3,000Nutrients2007, 2013 Ammonia as N mg/L (b) 6. USEPA Water Quality Criteria (Freshwater) 0.04J 0.03 0.1 <0.1 0.082J <0.1 0% 0.022007, 2013 Nitrate as N mg/L 10 1. Basin Plan 0.16 1.23 4.5 2 0.8 <0.11 0% 0.152007, 2013 Nitrite as N mg/L 1 1. Basin Plan <0.05 <0.05 0.03J <0.1 0.05J <0.15 0% 0.042007, 2013 Total Kjeldahl Nitrogen mg/L NA 0.7 0.56 0.62 0.63 0.48 1.12007, 2013 Total Nitrogen (calculated) mg/L 1 1. Basin Plan 0.86 1.79 5.15 2.63 1.33 1.1 83% 2.142007 Dissolved Phosphorus mg/L 0.1 1. Basin Plan 0.14 0.16 0.17 0.14 0.063 0.095 67% 1.282007, 2013 Total Phosphorus mg/L 0.1 1. Basin Plan 0.16 0.30 0.24 0.25 0.082 0.18 83% 2.02General Chemistry2007 Biochemical Oxygen Demand mg/L 10 8. McNeeley (1979) <2 <2 1.4J 0.96J 1.5J 3.1 0% 0.152007 Chemical Oxygen Demand mg/L 120 4. MSGP 2015 61 18 20 37 22 36 0% 0.272007, 2013 Dissolved Organic Carbon mg/L NA 4.02 6.8 7.7 5.8 7 72007, 2013 Total Organic Carbon mg/L NA 4.2 6.5 7.4 5.6 7 6.62007 Oil and Grease mg/L 10 1. Basin Plan, 3. Anacostia River TMDL <5 <5 <5 <5 2J 1.5J 0% 0.232007, 2013 Surfactants (MBAS) mg/L 0.5 1. Basin Plan 0.045 0.047 0.031J 0.029J 0.085 0% 0.092007, 2013 Total Dissolved Solids mg/L 500 (c) 1. Basin Plan 1,685 1,630 1,400 1,500 1,700 2,400 100% 3.442007, 2013 Total Suspended Solids mg/L 58 14. NSQD, 1. Basin Plan 4.7J 36 14 32 3 17 0% 0.312007, 2013 Total Hardness mg CaCO3/L NA 450 440 660 780 860 1090Total Metals2007 Antimony mg/L 0.006 (d) 1. Basin Plan 0.0001J 0.0001J 0.00014J 0.00011J 0.00016J 0.00012J 0% 0.022007, 2013 Arsenic mg/L 0.01 (d) 1. Basin Plan 0.0018 0.0018 0.0013 0.0015 0.0011 0.0014 0% 0.152007, 2013 Cadmium mg/L 0.005 (d) 1. Basin Plan <0.0004 <0.0004 0.000031J 0.000035J 0.00005J 0.00005J 0% 0.022007, 2013 Chromium mg/L 0.05 (d) 1. Basin Plan 0.0001J 0.0001J 0.00084 0.00081 0.00035 0.00016J 0% 0.012007, 2013 Copper mg/L 1.0 (d) 1. Basin Plan 0.0005J 0.0036 0.0029 0.0025 0.0013 0.00053 0% 0.002007, 2013 Lead mg/L NA 0.00006J 0.0004 0.0003 0.00037 0.00009J 0.000222007, 2013 Nickel mg/L 0.1 (d) 1. Basin Plan 0.001 0.0017 0.0038 0.0033 0.002 0.0014 0% 0.022007, 2013 Selenium mg/L 0.005 16. 40 CFR 131.38 0.0004J 0.0007 0.00073 0.00051 0.00043 0.00034J 0% 0.102007, 2013 Zinc mg/L 5.0 (d) 1. Basin Plan 0.001 0.004 0.0035J 0.0035J 0.0028J 0.003J 0% 0.00Dissolved Metals2007 Antimony mg/L 0.006 1. Basin Plan 0.0001J 0.0001J 0.00013J 0.000094J 0.00016J 0.0001J 0% 0.02
2007, 2013 Arsenic mg/L 0.34 acute /0.15 chronic 16. 40 CFR 131.38 0.0016 0.0017 0.001 0.0012 0.00092 0.0012 0% 0.01
2007, 2013 Cadmium mg/L (e) 16. 40 CFR 131.38 <0.0004 <0.0004 0.000022J 0.000022J 0.00004J 0.00005J 0% 0.012007, 2013 Chromium mg/L (e) 16. 40 CFR 131.38 <0.0005 <0.0005 0.00011J 0.000059J <0.0002 0.00008J 0% 0.002007, 2013 Copper mg/L (e) 16. 40 CFR 131.38 0.0007J 0.0009 0.0022 0.0012 0.0013 0.00044J 0% 0.042007, 2013 Lead mg/L (e) 16. 40 CFR 131.38 <0.0001 <0.0001 0.000023J <0.0002 0.00011J <0.0002 0% 0.012007, 2013 Nickel mg/L (e) 16. 40 CFR 131.38 0.0009 0.0013 0.0034 0.0027 0.0018 0.0013 0% 0.012007, 2013 Selenium mg/L NA 0.0004J 0.0007 0.00067 0.00053 0.00046 0.00034J2007, 2013 Zinc mg/L (e) 16. 40 CFR 131.38 0.0001J 0.0007 0.0021J 0.002J 0.0035J 0.0026J 0% 0.00Organophosphorus Pesticides
2007, 2013 Chlorpyrifos µg/L 0.02 acute / 0.014 chronic 12. CA Dept. of Fish & Game, 2000 <0.002 <0.002 <0.01 <0.01 <0.01 <0.01 0% 0.26
2007, 2013 Diazinon µg/L 0.08 acute / 0.05 chronic
12. CA Dept. of Fish & Game, 2000, 11. Chollas Creek TMDL for Diazinon, 10. USEPA, Aquatic Life Ambient
Water Quality Criteria Diazinon<0.004 <0.004 <0.01 <0.01 <0.01 <0.01 0% 0.08
2007, 2013 Malathion µg/L 0.43 acute /0.1 chronic 13. CA Dept. of Fish & Game, 1998, 5. Goldbook <0.006 <0.006 <0.01 <0.01 <0.01 <0.01 0% 0.04
Toxicity2007, 2013 Ceriodaphnia 96-hr LC50 (%) >100 >100 >100 >100 >100 >100 >100 0% 1.002007, 2013 Ceriodaphnia 7-day survival NOEC (%) 100 100 100 100 100 100 100 0% 1.002007, 2013 Ceriodaphnia 7-day reproduction NOEC (%) 100 100 100 100 25 100 100 17% 1.502007 Hyalella 96-hr LC50 (%) >100 >100 >100 >100 >100 >100 >100 0% 1.002007, 2013 Selenastrum 96-hr NOEC (%) 100 100 100 100 100 100 25 17% 1.50See last page for footnotes and source references.
Mean Ratio to Benchmarks
Frequency Above
Benchmarks2012-2013
No
Sam
ples
Col
lect
ed
No
Sam
ples
Col
lect
ed
No
Sam
ples
Col
lect
ed
No
Sam
ples
Col
lect
ed
No
Sam
ples
Col
lect
ed
Analyte
Long Term and Transitional Monitoring
Units
Historical Monitoring Data
Permit Requirement
Water Quality Benchmarks Benchmark References
2007-2008 2010-2011

Dry Weather Historical Monitoring Table for SLR-MLS
Blank spaces have been verified and no data is available.
NA indicate no criteria or published value was available or applicable to the matrix or program.
(c) Water Quality Benchmark are based on the San Diego Regional Water Quality Control Plan by watershed for the San Diego Region (Basin Plan), 1994 (with amendments effective on or before April 4, 2011) and may vary by hydrologic area.(d) Water Quality Benchmark for total metals is based on the MUN beneficial use as described in the Basin Plan, 1994 (with amendments effective on or before April 4, 2011).
E-Results calculated using Thomas Equation.J-Analyte was detected at a concentration below the reporting limit and above the method detection limit. Reported value is estimated.
SourcesPlease refer to the San Diego County Copermittee Regional Monitoring Program Benchmark Sources in Attachment B to Appendix A for benchmark source citations.
(a) Water Quality Benchmark for Enterococcus is based on the maximum criteria for infrequently used freshwater area by the San Diego Regional Water Quality Control Plan for the San Diego Region (Basin Plan), 1994 (with amendments effectiveon or before April 4, 2011).(b) Prior to the 2014-2015 monitoring year, Water Quality Benchmark was calculated based on CMC (salmonids absent) and CCC (early life stages present) using water temperature and pH described in the U.S. EPA, 1999 Update of Ambient Water Quality Criteria for Ammonia, EPA-822-R-99-014, December 1999. For 2014-2015 monitoring year, Water Quality Benchmark CMC and CCC were calculated based on pH and water temperature (when applicable) as described in the U.S. EPA, 2013 Aquatic Life Ambient Water Quality Criteria for Ammonia - Freshwater, EPA-822-R-13-001, April 2013.
(e) Water Quality Benchmark for dissolved metal fractions are based on total hardness and are calculated as described by the USEPA Federal Register Doc. 40 CFR Part 131, May 18, 2000. The Criteria Maximum Concentration (CMC) and Continuous Criteria Concentration (CCC) were used.
Values with red bold font and shading do not meet Water Quality Benchmarks.

Dry Weather Historical Monitoring Table for SM-TWAS-1b
2011-2012 2013-2014
09/14/10-09/15/10
05/11/11-05/12/11 - 09/05/12-
09/06/1205/14/13-05/15/13 - 1/7/2015-
1/8/20155/5/2015-5/6/2015
Physical Chemistry2007, 2013 pH pH units 6.5-9.0 1. Basin Plan 8.24 7.89 7.86 7.91 6.96 8.15 0% 0.282007, 2013 Specific Conductivity µmhos/cm NA 1,823 2,250 1,746 1,370 1,869 1,8482007, 2013 Water Temperature Celsius NA 17.70 15.90 20.2 16.9 13.83 16.442007, 2013 Turbidity NTU 20 1. Basin Plan 4.4 35 8.4 14 2.7 3.4 17% 0.57Bacteriological2007, 2013 Enterococcus MPN/100 mL 151 (a) 1. Basin Plan 1,300 300 4,000 5,000 110 80 67% 11.912007, 2013 Fecal Coliform MPN/100 mL 400 1.Basin Plan REC-1/REC-2 170 500 3,000 500 40 140 50% 1.812007, 2013 Total Coliform MPN/100 mL NA 80,000 14,000 5,000 8,000 900 2,400Nutrients2007, 2013 Ammonia as N mg/L (b) 6. USEPA Water Quality Criteria (Freshwater) <0.1 <0.1 0.072J 0.17 <0.10 <0.10 0% 0.042007, 2013 Nitrate as N mg/L 10 1. Basin Plan 1.7 3.6 0.97 1 1 0.32 0% 0.142007, 2013 Nitrite as N mg/L 1 1. Basin Plan 0.08J 0.04J <0.1 <0.1 0.013J 0.010J 0% 0.042007, 2013 Total Kjeldahl Nitrogen mg/L NA 0.78 0.9 0.68 0.26 0.33 0.412007, 2013 Total Nitrogen (calculated) mg/L 1 1. Basin Plan 2.56 4.54 1.65 1.26 1.343 0.74 83% 2.022007 Dissolved Phosphorus mg/L 0.1 1. Basin Plan 0.066 0.11 0.056 0.15 0.037 0.092 33% 0.852007, 2013 Total Phosphorus mg/L 0.1 1. Basin Plan 0.08 0.18 0.076 0.18 0.051 0.18 50% 1.25General Chemistry2007 Biochemical Oxygen Demand mg/L 10 8. McNeeley (1979) 3.4 1.3J 1.6J 0.88J <2.0 <2.0 0% 0.152007 Chemical Oxygen Demand mg/L 120 4. MSGP 2000 25 50 19 5.5 9.9 15 0% 0.172007, 2013 Dissolved Organic Carbon mg/L NA 3.8 4.4 4.9 3.2 5.3 7.42007, 2013 Total Organic Carbon mg/L NA 4.1 4.4 5.5 3.8 5.4 7.42007 Oil and Grease mg/L 10 1. Basin Plan, 3. Anacostia River TMDL <5 <5 <5 <5 <5.0 <5.0 0% 0.252007, 2013 Surfactants (MBAS) mg/L 0.5 1. Basin Plan 0.028J 0.046J 0.037J 0.053J 0.091 0.076 0% 0.112007, 2013 Total Dissolved Solids mg/L 500 (c) 1. Basin Plan 1,300 1,400 1,200 1,200 1,300 1,100 100% 2.502007, 2013 Total Suspended Solids mg/L 58 14. NSQD, 1. Basin Plan 55 60 31 16 2 8 17% 0.492007, 2013 Total Hardness mg CaCO3/L NA 580 650 528 531 665 574Total Metals2007 Antimony mg/L 0.006 (d) 1. Basin Plan 0.00028J 0.00027J 0.00028J 0.00038J 0.00029J 0.00029J 0% 0.052007, 2013 Arsenic mg/L 0.01 (d) 1. Basin Plan 0.0015 0.0018 0.002 0.0015 0.00091 0.002 0% 0.162007, 2013 Cadmium mg/L 0.005 (d) 1. Basin Plan 0.000053J 0.00006J 0.00006J 0.000031J 0.000042J <0.00010 0% 0.012007, 2013 Chromium mg/L 0.05 (d) 1. Basin Plan 0.0021 0.0019 0.0002 0.00018J 0.00014J 0.00033 0% 0.022007, 2013 Copper mg/L 1.0 (d) 1. Basin Plan 0.0054 0.0062 0.0012 0.0021 0.0016 0.0017 0% 0.002007, 2013 Lead mg/L NA 0.0014 0.0016 0.00017J 0.000088J 0.00010J 0.000312007, 2013 Nickel mg/L 0.1 (d) 1. Basin Plan 0.0035 0.0027 0.0018 0.0035 0.002 0.002 0% 0.032007, 2013 Selenium mg/L 0.005 16. 40 CFR 131.38 0.0012 0.0012 0.0009 0.0011 0.00058 0.00054 0% 0.182007, 2013 Zinc mg/L 5.0 (d) 1. Basin Plan 0.02 0.019 0.0026J 0.0035J 0.0071 0.0063Dissolved Metals2007 Antimony mg/L 0.006 1. Basin Plan 0.00025J 0.00021J 0.00028J 0.00038J 0.00029J 0.00028J 0% 0.05
2007, 2013 Arsenic mg/L 0.34 acute /0.15 chronic 16. 40 CFR 131.38 0.0013 0.0016 0.0019 0.0015 0.00077 0.0015 0% 0.01
2007, 2013 Cadmium mg/L (e) 16. 40 CFR 131.38 0.000016J 0.00002J 0.00006J 0.000031J <0.00010 <0.00010 0% 0.012007, 2013 Chromium mg/L (e) 16. 40 CFR 131.38 0.00012J 0.00016J 0.00008J 0.00014J 0.000055J 0.000043J 0% 0.002007, 2013 Copper mg/L (e) 16. 40 CFR 131.38 0.0017 0.0021 0.00097 0.0019 0.0014 0.00096 0% 0.052007, 2013 Lead mg/L (e) 16. 40 CFR 131.38 0.000045J 0.00005J 0.00009J 0.000024J <0.00020 <0.00020 0% 0.012007, 2013 Nickel mg/L (e) 16. 40 CFR 131.38 0.0023 0.0015 0.0015 0.0038 0.0021 0.0018 0% 0.012007, 2013 Selenium mg/L NA 0.00098 0.0011 0.00088 0.0011 0.00066 0.000432007, 2013 Zinc mg/L (e) 16. 40 CFR 131.38 0.0035J 0.0036J 0.0024J 0.0037J 0.0045J 0.0028J 0% 0.01Organophosphorus Pesticides
2007, 2013 Chlorpyrifos µg/L 0.02 acute / 0.014 chronic 12. CA Dept. of Fish & Game, 2000 <0.01 <0.01 <0.01 <0.01 <0.010 <0.010 0% 0.36
2007, 2013 Diazinon µg/L 0.08 acute / 0.05 chronic
12. CA Dept. of Fish & Game, 2000, 11. Chollas Creek TMDL for Diazinon, 10. USEPA, Aquatic Life Ambient
Water Quality Criteria Diazinon<0.01 <0.01 0.0065J <0.01 <0.010 <0.010 0% 0.11
2007, 2013 Malathion µg/L 0.43 acute /0.1 chronic 13. CA Dept. of Fish & Game, 1998, 5. Goldbook <0.01 <0.01 <0.01 <0.01 <0.010 <0.010 0% 0.05
Toxicity2007, 2013 Ceriodaphnia 96-hr LC50 (%) >100 >100 >100 >100 >100 >100 >100 0% 1.002007, 2013 Ceriodaphnia 7-day survival NOEC (%) 100 100 100 100 100 100 100 0% 1.002007, 2013 Ceriodaphnia 7-day reproduction NOEC (%) 100 100 100C 100 100 100 100 0% 1.002007 Hyalella 96-hr LC50 (%) >100 >100 >100 >100 >100 >100 >100 0% 1.002007, 2013 Selenastrum 96-hr NOEC (%) 100 100 50 100 100 50 100 33% 1.33See last page for footnotes and source references.
No
Sam
ples
Col
lect
ed
No
Sam
ples
Col
lect
ed
2014-2015AnalyteFrequency
Above Benchmarks
Transitional Monitoring
Units
Historical Monitoring Data
Mean Ratio to Benchmarks
Water Quality Benchmarks 2012-2013Permit
Requirement 2010-2011Benchmark References

Dry Weather Historical Monitoring Table for SM-TWAS-1b
Blank spaces have been verified and no data is available.
NA indicate no criteria or published value was available or applicable to the matrix or program.
(c) Water Quality Benchmark are based on the San Diego Regional Water Quality Control Plan by watershed for the San Diego Region (Basin Plan), 1994 (with amendments effective on or before April 4, 2011) and may vary based on hydrologic area.(d) Water Quality Benchmark for total metals is based on the MUN beneficial use as described in the Basin Plan, 1994 (with amendments effective on or before April 4, 2011).
SourcesPlease refer to the San Diego County Copermittee Regional Monitoring Program Benchmark Sources in Attachment B to Appendix A for benchmark source citations.
(e) Water Quality Benchmark for dissolved metal fractions are based on total hardness and are calculated as described by the USEPA Federal Register Doc. 40 CFR Part 131, May 18, 2000. The Criteria Maximum Concentration (CMC) and Continuous Criteria Concentration (CCC) were used.
(a) Water Quality Benchmark for Enterococcus is based on the maximum criteria for infrequently used freshwater area by the San Diego Regional Water Quality Control Plan for the San Diego Region (Basin Plan), 1994 (with amendments effective on or before April 4, 2011).(b) Prior to the 2014-2015 monitoring year, Water Quality Benchmark was calculated based on CMC (salmonids absent) and CCC (early life stages present) using water temperature and pH described in the U.S. EPA, 1999 Update of Ambient Water Quality Criteria for Ammonia, EPA-822-R-99-014, December 1999. For 2014-2015 monitoring year, Water Quality Benchmark CMC and CCC were calculated based on pH and water temperature (when applicable) as described in the U.S. EPA, 2013 Aquatic Life Ambient Water Quality Criteria for Ammonia - Freshwater, EPA-822-R-13-001, April 2013.
C-Control failed; however, sample showed no toxic response.J-Analyte was detected at a concentration below the reporting limit and above the method detection limit. Reported value is estimated.
Values with red bold font and shading do not meet Water Quality Benchmarks.

Dry Weather Historical Monitoring Table for SMR-MLS
03/06/08 05/08/08
Physical Chemistry2007, 2013 pH pH units 6.5-9.0 1. Basin Plan 8.02 8.21 0% NA1
2007, 2013 Specific Conductivity µmhos/cm NA 1,280 1,1802007, 2013 Water Temperature Celsius NA 12.72 18.612007, 2013 Turbidity NTU 20 1. Basin Plan 8.76 1.18 0% NA1
Bacteriological2007, 2013 Enterococcus MPN/100 mL 151 (a) 1. Basin Plan 8 22 0% NA1
2007, 2013 Fecal Coliform MPN/100 mL 400 1.Basin Plan REC-1/REC-2 17 50 0% NA1
2007, 2013 Total Coliform MPN/100 mL NA 110 1,600Nutrients2007, 2013 Ammonia as N mg/L (b) 6. USEPA Water Quality Criteria (Freshwater) <0.02 <0.02 0% NA1
2007, 2013 Nitrate as N mg/L 10 1. Basin Plan 1.82 0.26 0% NA1
2007, 2013 Nitrite as N mg/L 1 1. Basin Plan <0.007 <0.007 0% NA1
2007, 2013 Total Kjeldahl Nitrogen mg/L NA <0.3 1.22007, 2013 Total Nitrogen (calculated) mg/L 1 1. Basin Plan 1.82 1.46 100% NA1
2007 Dissolved Phosphorus mg/L 0.1 1. Basin Plan <0.05 <0.05 0% NA1
2007, 2013 Total Phosphorus mg/L 0.1 1. Basin PlanGeneral Chemistry2007 Biochemical Oxygen Demand mg/L 10 8. McNeeley (1979) <2.00 <2.00 0% NA1
2007 Chemical Oxygen Demand mg/L 120 4. MSGP 2015 <25 <25 0% NA1
2007, 2013 Dissolved Organic Carbon mg/L NA 4.83 3.712007, 2013 Total Organic Carbon mg/L NA 6.32 6.612007 Oil and Grease mg/L 10 1. Basin Plan, 3. Anacostia River TMDL <5 <5 0% NA1
2007, 2013 Surfactants (MBAS) mg/L 0.5 1. Basin Plan <0.1 <0.1 0% NA1
2007, 2013 Total Dissolved Solids mg/L 750 (c) 1. Basin Plan 830 819 100% NA1
2007, 2013 Total Suspended Solids mg/L 58 14. NSQD, 1. Basin Plan <1 <1 0% NA1
2007, 2013 Total Hardness mg CaCO3/L NA 494 521Total Metals2007 Antimony mg/L 0.006 (d) 1. Basin Plan <0.001 <0.001 0% NA1
2007, 2013 Arsenic mg/L 0.01 (d) 1. Basin Plan <0.001 <0.001 0% NA1
2007, 2013 Cadmium mg/L 0.005 (d) 1. Basin Plan <0.001 <0.001 0% NA1
2007, 2013 Chromium mg/L 0.05 (d) 1. Basin Plan <0.004 <0.004 0% NA1
2007, 2013 Copper mg/L 1.0 (d) 1. Basin Plan <0.002 <0.002 0% NA1
2007, 2013 Lead mg/L NA <0.004 <0.0042007, 2013 Nickel mg/L 0.1 (d) 1. Basin Plan <0.002 <0.002 0% NA1
2007, 2013 Selenium mg/L 0.005 16. 40 CFR 131.38 <0.005 <0.005 0% NA1
2007, 2013 Zinc mg/L 5.0 (d) 1. Basin Plan <0.010 <0.010 0% NA1
Dissolved Metals2007 Antimony mg/L 0.006 1. Basin Plan <0.002 <0.002 0% NA1
2007, 2013 Arsenic mg/L 0.34 acute /0.15 chronic 16. 40 CFR 131.38 <0.001 <0.001 0% NA1
2007, 2013 Cadmium mg/L (e) 16. 40 CFR 131.38 <0.001 <0.001 0% NA1
2007, 2013 Chromium mg/L (e) 16. 40 CFR 131.38 <0.004 <0.004 0% NA1
2007, 2013 Copper mg/L (e) 16. 40 CFR 131.38 <0.001 <0.001 0% NA1
2007, 2013 Lead mg/L (e) 16. 40 CFR 131.38 <0.001 <0.001 0% NA1
2007, 2013 Nickel mg/L (e) 16. 40 CFR 131.38 <0.002 <0.002 0% NA1
2007, 2013 Selenium mg/L NA <0.005 <0.0052007, 2013 Zinc mg/L (e) 16. 40 CFR 131.38 <0.010 <0.010 0% NA1
Organophosphorus Pesticides
2007, 2013 Chlorpyrifos µg/L 0.02 acute / 0.014 chronic 12. CA Dept. of Fish & Game, 2000 <0.04* <0.04*
2007, 2013 Diazinon µg/L 0.08 acute / 0.05 chronic
12. CA Dept. of Fish & Game, 2000, 11. Chollas Creek TMDL for Diazinon, 10. USEPA, Aquatic Life Ambient
Water Quality Criteria Diazinon<0.04 <0.04 0% NA1
2007, 2013 Malathion µg/L 0.43 acute /0.1 chronic 13. CA Dept. of Fish & Game, 1998, 5. Goldbook <0.05 <0.05 0% NA1
Toxicity2007, 2013 Ceriodaphnia 96-hr LC50 (%) >1002007, 2013 Ceriodaphnia 7-day survival NOEC (%) 100 100 100 0% NA1
2007, 2013 Ceriodaphnia 7-day reproduction NOEC (%) 100 100 100 0% NA1
2007 Hyalella 96-hr LC50 (%) >1002007, 2013 Selenastrum 96-hr NOEC (%) 100 100 100 0% NA1
See last page for footnotes and source references.
2007-2008Analyte Units Mean Ratio to Benchmarks
Water Quality Benchmarks Benchmark References
Historical Monitoring Data
Permit Requirement
Frequency Above
Benchmarks

Dry Weather Historical Monitoring Table for SMR-MLS
Blank spaces have been verified and no data is available.
NA indicate no criteria or published value was available or applicable to the matrix or program.
(d) Water Quality Benchmark for total metals is based on the MUN beneficial use as described in the Basin Plan, 1994 (with amendments effective on or before April 4, 2011).
J-Analyte was detected at a concentration below the reporting limit and above the method detection limit. Reported value is estimated.NA1 Three or more years of data required to calculate the Mean Ratio to Benchmark.
SourcesPlease refer to the San Diego County Copermittee Regional Monitoring Program Benchmark Sources in Attachment B to Appendix A for benchmark source citations.
(a) Water Quality Benchmark for Enterococcus is based on the maximum criteria for infrequently used freshwater area by the San Diego Regional Water Quality Control Plan for the San Diego Region (Basin Plan), 1994 (with amendments effective on or before April 4, 2011).(b) Prior to the 2014-2015 monitoring year, Water Quality Benchmark was calculated based on CMC (salmonids absent) and CCC (early life stages present) using water temperature and pH described in the U.S. EPA, 1999 Update of Ambient Water Quality Criteria for Ammonia, EPA-822-R-99-014, December 1999. For 2014-2015 monitoring year, Water Quality Benchmark CMC and CCC were calculated based on pH and water temperature (when applicable) as described in the U.S. EPA, 2013 Aquatic Life Ambient Water Quality Criteria for Ammonia - Freshwater, EPA-822-R-13-001, April 2013.
(e) Water Quality Benchmark for dissolved metal fractions are based on total hardness and are calculated as described by the USEPA Federal Register Doc. 40 CFR Part 131, May 18, 2000. The Criteria MaximumConcentration (CMC) and Continuous Criteria Concentration (CCC) were used.
(c) Water Quality Benchmark are based on the San Diego Regional Water Quality Control Plan by watershed for the San Diego Region (Basin Plan), 1994 (with amendments effective on or before April 4, 2011) and may vary by hydrologic area.
Values with red bold font and shading do not meet Water Quality Benchmarks.

Dry Weather Historical Monitoring Table for SMR-MLS-2
Long Term and
Transitional Monitoring
Long Term and
Transitional Monitoring
Long Term Monitoring
Long Term and
Transitional Monitoring
2008-2009 2009-2010 2011-2012 2013-2014
- - 09/14//10-09/15/10 05/10/11 - 09/05/12-
09/06/1205/01/13-05/02/13 - 09/10/14 01/07/15 05/05/15
Physical Chemistry2013 Dissolved Oxygen mg/L <6.0 (a) 1. Basin Plan 6.92 10.43 7.64 0% NA1
2007, 2013 pH pH units 6.5-9.0 1. Basin Plan 7.03 8.19 7.39 7.4 7.56 7.3 7.55 0% 0.312007, 2013 Specific Conductivity µmhos/cm NA 1,288 1,256 1,153 1,057 1,293 1,412 1,4162007, 2013 Water Temperature Celsius NA 20.40 15.90 21.5 19.6 23.17 12.13 19.052007, 2013 Turbidity NTU 20 1. Basin Plan 1.4 1.4 0.52 1.4 1.2 0.9 0.6 0% 0.05Bacteriological2007, 2013 Enterococcus MPN/100 mL 151 (b) 1. Basin Plan 40 40 130 170 ≤110AE 40 70 14% 0.572007, 2013 Fecal Coliform MPN/100 mL 400 1.Basin Plan REC-1/REC-2 20 70 20 80 20 40 110 0% 0.132007, 2013 Total Coliform MPN/100 mL NA 5,000 1,300 800 2,300 490 2,400 500Nutrients2007, 2013 Ammonia as N mg/L (c) 6. USEPA Water Quality Criteria (Freshwater) <0.1 <0.1 <0.1 <0.1 <0.10 <0.10 <0.10 0% 0.022007, 2013 Nitrate as N mg/L 10 1. Basin Plan 0.37 2.7 0.32 0.48 0.063J 3.2 0.51 0% 0.112007, 2013 Nitrite as N mg/L 1 1. Basin Plan 0.016J <0.1 <0.1 <0.15 0.028J 0.017J <0.10 0% 0.042007, 2013 Total Kjeldahl Nitrogen mg/L NA 0.23 0.17 0.23 0.23 0.16 0.18 0.142007, 2013 Total Nitrogen (calculated) mg/L 1 1. Basin Plan 0.616 2.87 0.55 0.71 0.251 3.397 0.65 29% 1.292007 Dissolved Phosphorus mg/L 0.1 1. Basin Plan 0.037 0.018 0.012 0.011 0.015 NR 0.01 0% 0.172013 Orthophosphate mg/L NA 0.014 AE 0.0122007, 2013 Total Phosphorus mg/L 0.1 1. Basin Plan 0.038 0.021 0.015 0.022 0.026 0.036 0.019 0% 0.25General Chemistry2007 Biochemical Oxygen Demand mg/L 10 8. McNeeley (1979) 4.7 0.59J 1.5J 1.2J <2.0 NR <2.0 0% 0.172007 Chemical Oxygen Demand mg/L 120 4. MSGP 2015 3.9J 7.2 11 6.2 12 NR 11 0% 0.072007, 2013 Dissolved Organic Carbon mg/L NA 2.2 3.2 3.8 3.2 3.2 4 3.72007, 2013 Total Organic Carbon mg/L NA 2.3 3.2 2.9 2.9 3.3 4.2 3.12007 Oil and Grease mg/L 10 1. Basin Plan, 3. Anacostia River TMDL <5 <5 4.5J 1.5J <5.0 NR <5.0 0% 0.272013 Sulfate mg/L 250 (a) 1. Basin Plan 290 330 330 100% NA1
2007, 2013 Surfactants (MBAS) mg/L 0.5 1. Basin Plan <0.05 0.034J 0.035J 0.038J 0.06 0.032J 0% 0.072007, 2013 Total Dissolved Solids mg/L 750 (a) 1. Basin Plan 870 840 850 810 860 1,000 950 100% 1.182007, 2013 Total Suspended Solids mg/L 58 14. NSQD, 1. Basin Plan 1 31 3 4 6 3 2 0% 0.122007, 2013 Total Hardness mg CaCO3/L NA 430 440 402 385 426 542 481Total Metals2007 Antimony mg/L 0.006 (d) 1. Basin Plan 0.0002J 0.00013J 0.00008J 0.00017J 0.000088J NR 0.000045J 0% 0.022007, 2013 Arsenic mg/L 0.01 (d) 1. Basin Plan 0.001 0.0014 0.0017 0.0012 0.0014 0.0014 0.0012 0% 0.132007, 2013 Cadmium mg/L 0.005 (d) 1. Basin Plan 0.000017J <0.0001 0.00002J <0.0001 <0.00010 <0.00010 <0.00010 0% 0.012007, 2013 Chromium mg/L 0.05 (d) 1. Basin Plan 0.0001J 0.00015J <0.0002 0.00021 0.00031 0.00012J 0.00013J 0% 0.002013 Chromium, Trivalent mg/L NA <0.00050 <0.00020 <0.000202013 Chromium, Hexavalent mg/L 0.010 (d) 1. Basin Plan 0.000053J 0.000095 0.000084 0% NA1
2007, 2013 Copper mg/L 1.0 (d) 1. Basin Plan 0.00067 0.0013 0.00045J 0.0013 0.00067 0.0013 0.00088 0% 0.002013 Iron mg/L 0.3 (a) 1. Basin Plan 0.39 0.13 0.15 33% NA1
2007, 2013 Lead mg/L NA 0.0001J 0.000062J 0.00002J 0.00019J 0.000085J 0.000067J 0.000058J2013 Manganese mg/L 0.05 (a) 1. Basin Plan 0.063 0.034 0.049 33% NA1
2013 Mercury mg/L 0.002 (d) 1. Basin Plan 0.000026J 0.0000040J <0.000050 0% NA1
2007, 2013 Nickel mg/L 0.1 (d) 1. Basin Plan 0.0014 0.0016 0.00075J 0.00079J 0.00075J 0.001 0.00068J 0% 0.012007, 2013 Selenium mg/L 0.005 16. 40 CFR 131.38 0.00056 0.0012 0.00065 0.00079 0.00043 0.0012 0.00053 0% 0.152013 Silver mg/L 0.1 (d) 1. Basin Plan <0.00020 <0.00020 <0.00020 0% NA1
2013 Thallium mg/L 0.002 (d) 1. Basin Plan <0.00020 <0.00020 <0.00020 0% NA1
2007, 2013 Zinc mg/L 5.0 (d) 1. Basin Plan 0.0011J 0.0013J <0.005 0.0015J 0.0018J 0.0030J <0.0050 0% 0.00Dissolved Metals2007 Antimony mg/L 0.006 1. Basin Plan 0.00014J 0.00012J 0.0001J 0.00012J 0.000086J NR 0.000095J 0% 0.02
2007, 2013 Arsenic mg/L 0.34 acute /0.15 chronic 16. 40 CFR 131.38 0.001 0.0013 0.0016 0.0012 0.0011 0.0013 0.0012 0% 0.00
2007, 2013 Cadmium mg/L (e) 16. 40 CFR 131.38 <0.0001 <0.0001 0.00002J <0.0001 <0.00010 <0.00010 <0.00010 0% 0.012007, 2013 Chromium mg/L (e) 16. 40 CFR 131.38 0.000056J 0.000074J <0.0002 0.00016J 0.000086J 0.000047J <0.00020 0% 0.002013 Chromium, Trivalent mg/L (e) 16. 40 CFR 131.38 AE AE <0.0002 0% NA1
2013 Chromium, Hexavalent mg/L 0.011 16. 40 CFR 131.38 AE AE 0.000076 0% NA1
2007, 2013 Copper mg/L (e) 16. 40 CFR 131.38 0.00061 0.0012 0.0005 0.00095 0.00048J 0.0012 0.00092 0% 0.032013 Iron mg/L NA 0.027 0.0077J 0.0392007, 2013 Lead mg/L (e) 16. 40 CFR 131.38 <0.0002 0.000039J <0.0002 <0.0002 <0.00020 <0.00020 0.000045J 0% 0.012013 Manganese mg/L NA 0.012 0.018 0.042013 Mercury mg/L NA 0.000015J <0.000050 <0.0000502007, 2013 Nickel mg/L (e) 16. 40 CFR 131.38 0.0014 0.0016 0.00071J 0.0008 0.00065J 0.00092 0.00067J 0% 0.012007, 2013 Selenium mg/L NA 0.00065 0.0012 0.00067 0.00071 0.00035J 0.0012 0.000582013 Silver mg/L (e) 16. 40 CFR 131.38 <0.00020 <0.00020 <0.00020 0% NA1
2013 Thallium mg/L NA <0.00020 <0.00020 <0.000202007, 2013 Zinc mg/L (e) 16. 40 CFR 131.38 0.0017J 0.0024J 0.0016J 0.0046J 0.0011J 0.0013J 0.0012J 0% 0.01
Historical Monitoring Data
Mean Ratio to BenchmarksAnalytePermit
Requirement
Frequency Above
Benchmarks2014-20152010-2011 2012-2013Units Water Quality
Benchmarks Benchmark References
No
sam
ples
col
lect
ed
No
sam
ples
col
lect
ed
No
sam
ples
col
lect
ed
No
sam
ples
col
lect
ed

Dry Weather Historical Monitoring Table for SMR-MLS-2
Long Term and
Transitional Monitoring
Long Term and
Transitional Monitoring
Long Term Monitoring
Long Term and
Transitional Monitoring
2008-2009 2009-2010 2011-2012 2013-2014
- - 09/14//10-09/15/10 05/10/11 - 09/05/12-
09/06/1205/01/13-05/02/13 - 09/10/14 01/07/15 05/05/15
Historical Monitoring Data
Mean Ratio to BenchmarksAnalytePermit
Requirement
Frequency Above
Benchmarks2014-20152010-2011 2012-2013Units Water Quality
Benchmarks Benchmark References
Organophosphorus Pesticides2013 Azinphos methyl (Guthion) µg/L NA <0.010 <0.010 <0.0102013 Bolstar µg/L NA <0.010 <0.010 <0.010
2007, 2013 Chlorpyrifos µg/L 0.02 acute / 0.014 chronic 12. CA Dept. of Fish & Game, 2000 <0.01 <0.01 <0.01 <0.01 <0.010 <0.010 <0.010 0% 0.36
2013 Coumaphos µg/L NA <0.010 <0.010 <0.0102013 Demeton-o µg/L NA <0.010 <0.010 <0.0102013 Demeton-s µg/L NA <0.010 <0.010 <0.010
2007, 2013 Diazinon µg/L 0.08 acute / 0.05 chronic
12. CA Dept. of Fish & Game, 2000, 11. Chollas Creek TMDL for Diazinon, 10. USEPA, Aquatic Life Ambient
Water Quality Criteria Diazinon<0.01 <0.01 <0.01 <0.01 <0.010 <0.010 <0.010 0% 0.10
2013 Dichlorvos µg/L NA <0.010 <0.010 <0.0102013 Dimethoate µg/L NA <0.010 <0.010 <0.0102013 Disulfoton µg/L NA <0.010 <0.010 <0.0102013 Ethoprop µg/L NA <0.010 <0.010 <0.0102013 Ethyl parathion µg/L NA <0.010 <0.010 <0.0102013 Fensulfothion µg/L NA <0.010 <0.010 <0.0102013 Fenthion µg/L NA <0.010 <0.010 <0.010
2007, 2013 Malathion µg/L 0.43 acute /0.1 chronic 13. CA Dept. of Fish & Game, 1998, 5. Goldbook <0.01 <0.01 <0.01 <0.01 <0.010 <0.010 <0.010 0% 0.05
2013 Merphos µg/L NA <0.010 <0.010 <0.0102013 Methyl parathion µg/L NA <0.010 <0.010 <0.0102013 Mevinphos µg/L NA <0.010 <0.010 <0.0102013 Naled µg/L NA <0.010 <0.010 <0.0102013 Phorate µg/L NA <0.010 <0.010 <0.0102013 Ronnel µg/L NA <0.010 <0.010 <0.0102013 Stirophos µg/L NA <0.010 <0.010 <0.0102013 Tokuthion (Prothiofos) µg/L NA <0.010 <0.010 <0.0102013 Trichloronate µg/L NA <0.010 <0.010 <0.010Pyrethroids2013 Allethrin µg/L NA <0.002 <0.002 <0.0022013 Bifenthrin µg/L 0.0093 15. Anderson et al., 2006 <0.002 <0.002 <0.002 0% NA1
2013 Cyfluthrin µg/L 0.344 17. Wheelock et al., 2004 <0.002 <0.002 <0.002 0% NA1
2013 Cyhalothrin, Total Lambda µg/L 0.2 17. Wheelock et al., 2004 <0.002 <0.002 <0.002 0% NA1
2013 Cypermethrin µg/L 0.344 17. Wheelock et al., 2004 <0.002 <0.002 <0.002 0% NA1
2013 Danitol (Fenpropathrin) µg/L NA <0.002 <0.002 <0.0022013 Deltamethrin/Tralomethrin µg/L NA <0.002 <0.002 <0.0022013 Esfenvalerate µg/L 0.25 17. Wheelock et al., 2004 <0.002 <0.002 <0.002 0% NA1
2013 Fenvalerate µg/L NA <0.002 <0.002 <0.0022013 Fluvalinate µg/L NA <0.002 <0.002 <0.0022013 Permethrin µg/L 0.021 15. Anderson et al., 2006 <0.01 <0.01 <0.01 0% NA1
2013 Prallethrin µg/L NA <0.002 <0.002 <0.0022013 Resmethrin µg/L NA <0.01 <0.01 <0.01Toxicity2007, 2013 Ceriodaphnia 96-hr LC50 (%) >100 >100 >100 >100 >100 >100 NR >100 0% 1.002007, 2013 Ceriodaphnia 7-day survival NOEC (%) 100 100 100 100 100 100 NR 100 0% 1.002013 Ceriodaphnia 7-day survival TST Pass/Fail Pass Pass Pass 0%2007, 2013 Ceriodaphnia 7-day reproduction NOEC (%) 100 100 <6.25CF 100 100 100 NR 100 0% 1.002013 Ceriodaphnia 7-day reproduction TST Pass/Fail Pass Pass Pass 0%2007 Hyalella 96-hr LC50 (%) >100 >100 >100 >100 >100 >100 NR >100 0% 1.002007, 2013 Selenastrum 96-hr NOEC (%) 100 100 100 100 100 100 NR 100 0% 1.002013 Selenastrum 96-hr TST Pass/Fail Pass Pass Pass 0%2013 Pimephales 7-day survival TST Pass/Fail Pass Pass Pass 0%2013 Pimephales 7-day biomass TST Pass/Fail Pass Pass Pass 0%See last page for footnotes and source references.
No
sam
ples
col
lect
ed
No
sam
ples
col
lect
ed
No
sam
ples
col
lect
ed
No
sam
ples
col
lect
ed

Dry Weather Historical Monitoring Table for SMR-MLS-2
Blank spaces have been verified and no data is available.
NA indicate no criteria or published value was available or applicable to the matrix or program.(a) Water Quality Benchmark are based on the San Diego Regional Water Quality Control Plan by watershed for the San Diego Region (Basin Plan), 1994 (with amendments effective on or before April 4, 2011) and may vary by hydrologic area.
(d) Water Quality Benchmark for total metals is based on the MUN beneficial use as described in the Basin Plan, 1994 (with amendments effective on or before April 4, 2011).
AE-Analysis error.CF-Control failed; results not used in assessment.J-Analyte was detected at a concentration below the reporting limit and above the method detection limit. Reported value is estimated.
NR-Sampling of this analyte not required for transitional monitoring (RWQCB Order No. R9-2007-0001) and/or for long term monitoring (RWQCB Order No. R9-2013-0001).
SourcesPlease refer to the San Diego County Copermittee Regional Monitoring Program Benchmark Sources in Attachment B to Appendix A for benchmark source citations.
(b) Water Quality Benchmark for Enterococcus is based on the maximum criteria for infrequently used freshwater area by the San Diego Regional Water Quality Control Plan for the San Diego Region (Basin Plan), 1994 (with amendments effective on or before April 4, 2011)(c) Prior to the 2014-2015 monitoring year, Water Quality Benchmark was calculated based on CMC (salmonids absent) and CCC (early life stages present) using water temperature and pH described in the U.S. EPA, 1999 Update of Ambient Water Quality Criteria for Ammonia, EPA-822-R-99-014, December 1999. For 2014-2015 monitoring year, Water Quality Benchmark CMC and CCC were calculated based on pH and water temperature (when applicable) as described in the U.S. EPA, 2013 Aquatic Life Ambient Water Quality Criteria for Ammonia - Freshwater, EPA-822-R-13-001, April 2013.
(e) Water Quality Benchmark for dissolved metal fractions are based on total hardness and are calculated as described by the USEPA Federal Register Doc. 40 CFR Part 131, May 18, 2000. The Criteria Maximum Concentration (CMC) and Continuous Criteria Concentration (CCC) were used.
NA1 Three or more years of data required to calculate the Mean Ratio to Benchmark.
Values with red bold font and shading do not meet Water Quality Benchmarks.

Dry Weather Historical Monitoring Table for SR-TWAS-1
2010-2011 2012-2013 2014-2015
01/06/10 05/18/10 - 09/12/11-09/13/11
05/08/12-05/09/12 - 01/13/14-
01/14/1405/01/14-05/02/14 -
Physical Chemistry2007, 2013 pH pH units 6.5-9.0 1. Basin Plan 7.15 7.51 7.09 7.39 7.3 7.25 0% 0.372007, 2013 Specific Conductivity µmhos/cm NA 3,110 2,970 2,470 2,680 2,652 2,7432007, 2013 Water Temperature Celsius NA 11.80 17.4 18.4 16.3 12.28 16.392007, 2013 Turbidity NTU 20 1. Basin Plan 10.9 9.4 11 10 16.7 47.8 17% 0.88Bacteriological2007, 2013 Enterococcus MPN/100 mL 151 (a) 1. Basin Plan 130 170 140 300 78 790 50% 1.772007, 2013 Fecal Coliform MPN/100 mL 400 1.Basin Plan REC-1/REC-2 <20 20 300 40 <18 170 0% 0.222007, 2013 Total Coliform MPN/100 mL NA 800 8,000 5,000 2,200 1,300 790Nutrients2007, 2013 Ammonia as N mg/L (b) 6. USEPA Water Quality Criteria (Freshwater) 0.04 0.1 0.094J 0.058J 0.030J <0.10 0% 0.012007, 2013 Nitrate as N mg/L 10 1. Basin Plan 0.17 0.13 0.27 0.23 0.062J <0.10 0% 0.022007, 2013 Nitrite as N mg/L 1 1. Basin Plan 0.04J <0.1 <0.1 <0.1 0.014J 0.011J 0% 0.042007, 2013 Total Kjeldahl Nitrogen mg/L NA <1 0.4 0.4 0.45 0.25 0.282007, 2013 Total Nitrogen (calculated) mg/L 1 1. Basin Plan 0.21 0.53 0.67 0.68 0.326 0.291 0% 0.452007 Dissolved Phosphorus mg/L 0.1 1. Basin Plan 0.076 0.02 0.054 0.053 0.01 0.024 0% 0.402007, 2013 Total Phosphorus mg/L 0.1 1. Basin Plan 0.086 0.086 0.13 0.11 0.062 0.068 33% 0.90General Chemistry2007 Biochemical Oxygen Demand mg/L 10 8. McNeeley (1979) <2 1.1J 1.3J 0.42J <2.0 <2.0 0% 0.102007 Chemical Oxygen Demand mg/L 120 4. MSGP 2015 24.8 10 22 12 13 6.8 0% 0.122007, 2013 Dissolved Organic Carbon mg/L NA 5.1 5.7 4.7 5.6 4.5 4.42007, 2013 Total Organic Carbon mg/L NA 5.7 5.3 4.7 5.3 4.4 4.52007, 2013 Oil and Grease mg/L 10 1. Basin Plan, 3. Anacostia River TMDL <5 <5 <5 <5 <5.0 3.7J 0% 0.272007, 2013 Surfactants (MBAS) mg/L 0.5 1. Basin Plan 0.058 0.032J 0.065 0.039J 0.066 0.058 0% 0.112007, 2013 Total Dissolved Solids mg/L 1,500 (c) 1. Basin Plan 1,952B 1,900 1,800 1,800 1,700 1,800 100% 1.222007, 2013 Total Suspended Solids mg/L 58 14. NSQD, 1. Basin Plan 8.2 6 10 9 5 12 0% 0.142007, 2013 Total Hardness mg CaCO3/L NA 801.3 860 780 780 835 893Total Metals2007 Antimony mg/L 0.006 (d) 1. Basin Plan <0.0005 0.000085J 0.0001J 0.00009J 0.000060J 0.000044J 0% 0.022007, 2013 Arsenic mg/L 0.01 (d) 1. Basin Plan 0.001 0.00096 0.0013 0.0017 0.001 0.00076 0% 0.112007, 2013 Cadmium mg/L 0.005 (d) 1. Basin Plan <0.0004 0.000016J 0.00002J 0.00002J 0.000032J <0.00010 0% 0.012007, 2013 Chromium mg/L 0.05 (d) 1. Basin Plan <0.0005 0.000072J 0.00022 0.00022 0.00012J <0.00020 0% 0.002007, 2013 Copper mg/L 1.0 (d) 1. Basin Plan <0.0008 0.00036J 0.00073 0.00034J 0.00065 0.00018J 0% 0.002007, 2013 Lead mg/L NA <0.0001 0.000033J 0.00026 0.00014J 0.000065J <0.000202007, 2013 Nickel mg/L 0.1 (d) 1. Basin Plan 0.0012 0.0031 0.00093 0.001 0.0043 0.00066J 0% 0.022007, 2013 Selenium mg/L 0.005 16. 40 CFR 131.38 0.0003J 0.00044 <0.0004 0.00036J 0.0015 0.00011J 0% 0.102007, 2013 Zinc mg/L 5.0 (d) 1. Basin Plan <0.0005 0.00096J 0.0026J 0.0023J 0.0022J 0.00078J 0% 0.00Dissolved Metals2007 Antimony mg/L 0.006 1. Basin Plan 0.0001J 0.000093J 0.00015J 0.00008J 0.000060J 0.000050J 0% 0.01
2007, 2013 Arsenic mg/L 0.34 acute /0.15 chronic 16. 40 CFR 131.38 0.0011 0.00076 0.00095 0.0013 0.00072 0.00075 0% 0.01
2007, 2013 Cadmium mg/L (e) 16. 40 CFR 131.38 <0.0004 0.000017J 0.00002J 0.00003J 0.000040J <0.00010 0% 0.012007, 2013 Chromium mg/L (e) 16. 40 CFR 131.38 <0.0005 0.000069J 0.00019J <0.0002 0.000057J 0.000058J 0% 0.002007, 2013 Copper mg/L (e) 16. 40 CFR 131.38 <0.0008 0.00045J 0.00046J <0.0005 0.00061 0.00012J 0% 0.012007, 2013 Lead mg/L (e) 16. 40 CFR 131.38 <0.0001 <0.0002 <0.0002 <0.0002 <0.00020 <0.00020 0% 0.012007, 2013 Nickel mg/L (e) 16. 40 CFR 131.38 0.001 0.0034 0.00086 0.001 0.0043 0.00065J 0% 0.012007, 2013 Selenium mg/L NA 0.0004J 0.00034J <0.0004 0.00037J 0.0015 0.00012J2007, 2013 Zinc mg/L (e) 16. 40 CFR 131.38 <0.0005 0.0024J 0.0022J 0.0016J 0.0026J 0.0011J 0% 0.00Organophosphorus Pesticides
2007, 2013 Chlorpyrifos µg/L 0.02 acute / 0.014 chronic 12. CA Dept. of Fish & Game, 2000 <0.002 <0.01 <0.01 <0.01 <0.010 <0.010 0% 0.22
2007, 2013 Diazinon µg/L 0.08 acute / 0.05 chronic
12. CA Dept. of Fish & Game, 2000, 11. Chollas Creek TMDL for Diazinon, 10. USEPA, Aquatic Life Ambient
Water Quality Criteria Diazinon<0.004 <0.01 <0.01 <0.01 <0.010 <0.010 0% 0.06
2007^, 2013 Malathion µg/L 0.43 acute /0.1 chronic 13. CA Dept. of Fish & Game, 1998, 5. Goldbook <0.006 <0.01 <0.01 <0.01 <0.010 <0.010 0% 0.01
Toxicity2007, 2013 Ceriodaphnia 96-hr LC50 (%) >100 >100 >100 >100 >100 >100 >100 0% 1.002007, 2013 Ceriodaphnia 7-day survival NOEC (%) 100 100 100 100 100 100 100 0% 1.002007, 2013 Ceriodaphnia 7-day reproduction NOEC (%) 100 100 100 100 100 50 50 33% 1.332007, 2013 Hyalella 96-hr LC50 (%) >100 >100 >100 >100C >100 >100 >100 0% 1.002007 Selenastrum 96-hr NOEC (%) 100 25 25 50 50 50 50 100% 2.67See last page for footnotes and source references.
No
Sam
ples
Col
lect
ed
Transitional Monitoring
Units Water Quality Benchmarks Benchmark References
Historical Monitoring Data
No
Sam
ples
Col
lect
ed
2009-2010 2011-2012Permit Requirement Analyte 2013-2014
Frequency Above
Benchmarks
Mean Ratio to Benchmarks

Dry Weather Historical Monitoring Table for SR-TWAS-1
Blank spaces have been verified and no data is available.
NA indicate no criteria or published value was available or applicable to the matrix or program.
(c) Water Quality Benchmark are based on the San Diego Regional Water Quality Control Plan by watershed for the San Diego Region (Basin Plan), 1994 (with amendments effective on or before April 4, 2011) and may vary by hydrologic area.(d) Water Quality Benchmark for total metals is based on the MUN beneficial use as described in the Basin Plan, 1994 (with amendments effective on or before April 4, 2011).
B-Analyte was detected in the associated method blank.
J-Analyte was detected at a concentration below the reporting limit and above the method detection limit. Reported value is estimated.
SourcesPlease refer to the San Diego County Copermittee Regional Monitoring Program Benchmark Sources in Attachment B to Appendix A for benchmark source citations.
(b) Prior to the 2014-2015 monitoring year, Water Quality Benchmark was calculated based on CMC (salmonids absent) and CCC (early life stages present) using water temperature and pH described in the U.S. EPA, 1999 Update of Ambient Water Quality Criteria for Ammonia, EPA-822-R-99-014, December 1999. For 2014-2015 monitoring year, Water Quality Benchmark CMC and CCC were calculated based on pH and water temperature (when applicable) as described in the U.S. EPA, 2013 Aquatic Life Ambient Water Quality Criteria for Ammonia - Freshwater, EPA-822-R-13-001, April 2013.
(a) Water Quality Benchmark for Enterococcus is based on the maximum criteria for infrequently used freshwater area by the San Diego Regional Water Quality Control Plan for the San Diego Region (Basin Plan), 1994 (with amendments effective on or before April 4, 2011).
C - Control failed; however, sample showed no toxic response.
(e) Water Quality Benchmark for dissolved metal fractions are based on total hardness and are calculated as described by the USEPA Federal Register Doc. 40 CFR Part 131, may 18, 2000. The Criteria Maximum Concentration (CMC) and Continuous Criteria concentration (CCC) were used.
Values with red bold font and shading do not meet Water Quality Benchmarks.

Dry Weather Historical Monitoring Table for SR-MLS
Long Term and
Transitional Monitoring
Long Term Monitoring
Only
Long Term and
Transitional Monitoring
Long Term and
Transitional Monitoring
2010-2011 2012-2013 2014-2015
01/06/10 05/18/10 - 09/12/11-09/13/11
05/08/12-05/09/12 - 09/17/13-
09/18/131/13/14-1/14/14
05/01/14-05/02/14 -
Physical Chemistry2013 Dissolved Oxygen mg/L <5.0 (a) 1. Basin Plan 3 6.44 5.68 33% NA1
2007, 2013 pH pH units 6.5-9.0 1. Basin Plan 7.38 7.39 7.26 7.29 7.36 7.38 7.46 0% 0.312007, 2013 Specific Conductivity µmhos/cm NA 4,810 4,630 5,010 4,640 5,229 5,167 5,1092007, 2013 Water Temperature Celsius NA 12.70 18.10 19.3 16.8 21.24 16.28 19.912013 Color Color units 20 1. Basin Plan 20 20 25 33% NA1
2007, 2013 Turbidity NTU 20 1. Basin Plan 1.4J 2.5 0.98 4 3.2 0.1 63.4 14% 0.54Bacteriological2007, 2013 Enterococcus MPN/100 mL 151 (b) 1. Basin Plan 80 170 130 300 78 140 310 43% 1.142007, 2013 Fecal Coliform MPN/100 mL 4,000 1.Basin Plan REC-1/REC-2 120 90 20 <20 130 45 20 0% 0.022007, 2013 Total Coliform MPN/100 mL NA 800 13,000 1,300 500 1,400 490 1,100Nutrients2007, 2013 Ammonia as N mg/L (c) 6. USEPA Water Quality Criteria (Freshwater) 0.03J 0.14 0.18 0.06J 0.11 <0.10 0.044J 0% 0.022007, 2013 Nitrate as N mg/L 10 1. Basin Plan 0.17 0.33 0.063J 0.24 0.085J 0.098J 0.065J 0% 0.022007, 2013 Nitrite as N mg/L 1 1. Basin Plan <0.05 0.045J <0.1 <0.1 <0.1 0.012J 0.022J 0% 0.042007, 2013 Total Kjeldahl Nitrogen mg/L NA 0.554J 0.51 0.62 0.46 0.4 0.3 0.422007, 2013 Total Nitrogen (calculated) mg/L 1 1. Basin Plan 0.724 0.885 0.683 0.7 0.485 0.41 0.507 0% 0.632007 Dissolved Phosphorus mg/L 0.1 1. Basin Plan 0.132 0.077 0.18 0.097 0.15 NR 0.1 50% 1.232013 Orthophosphate mg/L NA 0.15 0.097 0.112007, 2013 Total Phosphorus mg/L 0.1 1. Basin Plan 0.098 0.14 0.21 0.12 0.16 0.096 0.11 71% 1.33General Chemistry2007 Biochemical Oxygen Demand mg/L 10 8. McNeeley (1979) <2 1.5J 2.7 0.54J 1.5J NR <2.0 0% 0.142007 Chemical Oxygen Demand mg/L 120 4. MSGP 2015 40.9 22 29 22 24 NR 28 0% 0.232007, 2013 Dissolved Organic Carbon mg/L NA 7.8 6.7 5.3 6 6.1 3.9 4.92007, 2013 Total Organic Carbon mg/L NA 7.7 6.1 4.3 6.2 5.9 3.8 4.92007 Oil and Grease mg/L 10 1. Basin Plan, 3. Anacostia River TMDL <5 <5 <5 2J <5.0 NR 1.4J 0% 0.222013 Sulfate mg/l 500 (a) 1. Basin Plan 410 420 470 0% NA1
2007, 2013 Surfactants (MBAS) mg/L 0.5 1. Basin Plan 0.074 0.06 0.063 0.057 0.071 0.059 0.072 0% 0.132007, 2013 Total Dissolved Solids mg/L 1,500 (a) 1. Basin Plan 2,642B 2,700 3,400 2,700 3,200 2,900 3,000 100% 1.962007, 2013 Total Suspended Solids mg/L 58 14. NSQD, 1. Basin Plan 1.8J 5 2 4 4 6 4 0% 0.072007, 2013 Total Hardness mg CaCO3/L NA 978.7 1,100 1,200 1,100 1,290 1,270 1,260Total Metals2013 Aluminum mg/L 0.2 (d) 1. Basin Plan 0.0049J 0.0085 0.021 0% 0.062007 Antimony mg/L 0.006 (d) 1. Basin Plan 0.0002J 0.00016J 0.00011J 0.00017J 0.000083J 0.000070J 0.00013J 0% 0.022007, 2013 Arsenic mg/L 0.01 (d) 1. Basin Plan 0.0031 0.0016 0.0014 0.0024 0.0014 0.00092 0.0013 0% 0.172007, 2013 Cadmium mg/L 0.005 (d) 1. Basin Plan <0.0004 <0.0001 0.00002J 0.00002J 0.000025J 0.000022J <0.00010 0% 0.012007, 2013 Chromium mg/L 0.05 (d) 1. Basin Plan <0.0005 0.000077J <0.0002 0.00011J 0.00015J 0.000065J 0.000046J 0% 0.002013 Chromium, Trivalent mg/L NA <0.0005 <0.0005 <0.00052013 Chromium, Hexavalent mg/L 0.010 (d) 1. Basin Plan 0.000036J 0.000025J 0.00016J 0% NA1
2007, 2013 Copper mg/L 1.0 (d) 1. Basin Plan 0.0005J 0.00063 <0.0005 <0.0005 0.0011 0.001 0.00040J 0% 0.002013 Iron mg/L 0.3 (a) 1. Basin Plan 0.024 0.024 0.06 0% NA1
2007, 2013 Lead mg/L NA 0.00007J,B 0.000062J 0.00004J 0.00011J 0.000028J 0.000030J 0.000061J2013 Manganese mg/L 0.05 (a) 1. Basin Plan 0.39 0.14 0.31 100% NA1
2013 Mercury mg/L 0.002 (d) 1. Basin Plan 0.000039J <0.000050 <0.000050 0% NA1
2007, 2013 Nickel mg/L 0.1 (d) 1. Basin Plan 0.0015 0.0051 0.0011 0.0015 0.0069 0.0073 0.00093 0% 0.032007, 2013 Selenium mg/L 0.005 16. 40 CFR 131.38 0.0003J 0.00045 <0.0004 0.00043 0.001 0.0026 0.00022J 0% 0.152013 Silver mg/L 0.1 (d) 1. Basin Plan 0.000013J 0.000056J <0.00020 0% NA1
2013 Thallium mg/L 0.002 (d) 1. Basin Plan <0.00020 <0.00020 <0.00020 0% NA1
2007, 2013 Zinc mg/L 5.0 (d) 1. Basin Plan 0.0023B 0.0017J 0.0011J 0.003J 0.0024J 0.0016J 0.0014J 0% 0.00Dissolved Metals2013 Aluminum <0.0050 <0.0050 <0.00502007 Antimony mg/L 0.006 1. Basin Plan 0.0002J 0.00019J 0.0001J 0.00016J 0.000085J 0.000078J 0.00014J 0% 0.02
2007, 2013 Arsenic mg/L 0.34 acute /0.15 chronic 16. 40 CFR 131.38 0.0033 0.0015 0.0014 0.002 0.0014 0.0009 0.0012 0% 0.01
2007, 2013 Cadmium mg/L (e) 16. 40 CFR 131.38 <0.0004 <0.0001 0.00002J 0.00002J 0.000022J 0.000017J <0.00010 0% 0.012007, 2013 Chromium mg/L (e) 16. 40 CFR 131.38 <0.0005 0.000083J <0.0002 <0.0002 <0.00020 0.000052J 0.000039J 0% 0.002007, 2013 Copper mg/L (e) 16. 40 CFR 131.38 0.0005J 0.0007 <0.0005 <0.0005 0.0011 0.0011 0.00030J 0% 0.022013 Iron mg/L NA <0.010 0.0017J <0.0102007, 2013 Lead mg/L (e) 16. 40 CFR 131.38 <0.0001 <0.0002 0.00002J <0.0002 <0.00020 <0.00020 <0.00020 0% 0.012013 Manganese mg/L NA 0.38 0.1 0.272013 Mercury mg/L NA 0.000048J 0.0000040J <0.0000502007, 2013 Nickel mg/L (e) 16. 40 CFR 131.38 0.0014 0.0054 0.001 0.0014 0.007 0.0071 0.00084 0% 0.022007, 2013 Selenium mg/L NA 0.0005 0.00047 <0.0004 0.0004 0.00089 0.0025 0.00022J2013 Silver mg/L (e) 16. 40 CFR 131.38 0.000029J 0.000058J <0.00020 0% NA1
2013 Thallium mg/L NA <0.00020 <0.00020 <0.000202007, 2013 Zinc mg/L (e) 16. 40 CFR 131.38 0.0021B 0.0029J 0.0019J 0.0027J 0.0011J 0.0024J 0.0016J 0% 0.01
Permit Requirement Benchmark References
Historical Monitoring Data
Analyte Units Water Quality Benchmarks 2011-2012
No
Sam
ples
Col
lect
ed
Mean Ratio to Benchmarks2009-2010 2013-2014
No
Sam
ples
Col
lect
ed
No
Sam
ples
Col
lect
ed
Frequency Above
Benchmarks

Dry Weather Historical Monitoring Table for SR-MLS
Long Term and
Transitional Monitoring
Long Term Monitoring
Only
Long Term and
Transitional Monitoring
Long Term and
Transitional Monitoring
2010-2011 2012-2013 2014-2015
01/06/10 05/18/10 - 09/12/11-09/13/11
05/08/12-05/09/12 - 09/17/13-
09/18/131/13/14-1/14/14
05/01/14-05/02/14 -
Permit Requirement Benchmark References
Historical Monitoring Data
Analyte Units Water Quality Benchmarks 2011-2012
Mean Ratio to Benchmarks2009-2010 2013-2014
Frequency Above
Benchmarks
Organophosphorus Pesticides2013 Azinphos methyl (Guthion) µg/L NA <0.010 <0.010 <0.0102013 Bolstar µg/L NA <0.010 <0.010 <0.010
2007, 2013 Chlorpyrifos µg/L 0.02 acute / 0.014 chronic 12. CA Dept. of Fish & Game, 2000 <0.002 <0.01 <0.01 <0.01 <0.010 <0.010 <0.010 0% 0.32
2013 Coumaphos µg/L NA <0.010 <0.010 <0.0102013 Demeton-o µg/L NA <0.010 <0.010 <0.0102013 Demeton-s µg/L NA <0.010 <0.010 <0.010
2007, 2013 Diazinon µg/L 0.08 acute / 0.05 chronic
12. CA Dept. of Fish & Game, 2000, 11. Chollas Creek TMDL for Diazinon, 10. USEPA, Aquatic Life Ambient
Water Quality Criteria Diazinon<0.004 <0.01 <0.01 <0.01 <0.010 <0.010 <0.010 0% 0.09
2013 Dichlorvos µg/L NA <0.010 <0.010 <0.0102013 Dimethoate µg/L NA <0.010 <0.010 <0.0102013 Disulfoton µg/L NA <0.010 <0.010 <0.0102013 Ethoprop µg/L NA <0.010 <0.010 <0.0102013 Ethyl parathion µg/L NA <0.010 <0.010 <0.0102013 Fensulfothion µg/L NA <0.010 <0.010 <0.0102013 Fenthion µg/L NA <0.010 <0.010 <0.010
2007, 2013 Malathion µg/L 0.43 acute /0.1 chronic 13. CA Dept. of Fish & Game, 1998, 5. Goldbook <0.006 <0.01 <0.01 <0.01 <0.010 <0.010 <0.010 0% 0.47
2013 Merphos µg/L NA <0.010 <0.010 <0.0102013 Methyl parathion µg/L NA <0.010 <0.010 <0.0102013 Mevinphos µg/L NA <0.010 <0.010 <0.0102013 Naled µg/L NA <0.010 <0.010BS-L <0.0102013 Phorate µg/L NA <0.010 <0.010 <0.010BS-L2013 Ronnel µg/L NA <0.010 <0.010 <0.0102013 Stirophos µg/L NA <0.010 <0.010 <0.0102013 Tokuthion (Prothiofos) µg/L NA <0.010 <0.010 <0.0102013 Trichloronate µg/L NA <0.010 <0.010 <0.010PCB Congeners2013 PCB-8 µg/L 0.014 (f) 16. 40 CFR 131.38 <0.010 <0.010 <0.010 0% NA1
2013 PCB-18 µg/L 0.014 (f) 16. 40 CFR 131.38 <0.010 <0.010 <0.010 0% NA1
2013 PCB-28 µg/L 0.014 (f) 16. 40 CFR 131.38 <0.010 <0.010 <0.010 0% NA1
2013 PCB-44 µg/L 0.014 (f) 16. 40 CFR 131.38 <0.010 <0.010 <0.010 0% NA1
2013 PCB-52 µg/L 0.014 (f) 16. 40 CFR 131.38 <0.010 <0.010 <0.010 0% NA1
2013 PCB-66 µg/L 0.014 (f) 16. 40 CFR 131.38 <0.010 <0.010 <0.010 0% NA1
2013 PCB-77 µg/L 0.014 (f) 16. 40 CFR 131.38 <0.010 <0.010 <0.010 0% NA1
2013 PCB-81 µg/L 0.014 (f) 16. 40 CFR 131.38 <0.010 <0.010 <0.010 0% NA1
2013 PCB-101 µg/L 0.014 (f) 16. 40 CFR 131.38 <0.010 <0.010 <0.010 0% NA1
2013 PCB-105 µg/L 0.014 (f) 16. 40 CFR 131.38 <0.010 <0.010 <0.010 0% NA1
2013 PCB-114 µg/L 0.014 (f) 16. 40 CFR 131.38 <0.010 <0.010 <0.010 0% NA1
2013 PCB-118 µg/L 0.014 (f) 16. 40 CFR 131.38 <0.010 <0.010 <0.010 0% NA1
2013 PCB-123 µg/L 0.014 (f) 16. 40 CFR 131.38 <0.010 <0.010 <0.010 0% NA1
2013 PCB-126 µg/L 0.014 (f) 16. 40 CFR 131.38 <0.010 <0.010 <0.010 0% NA1
2013 PCB-128 µg/L 0.014 (f) 16. 40 CFR 131.38 <0.010 <0.010 <0.010 0% NA1
2013 PCB-138 µg/L 0.014 (f) 16. 40 CFR 131.38 <0.010 <0.010 <0.010 0% NA1
Polynuclear Aromatic Hydrocarbons2013 1-Methylnaphthalene µg/L NA <0.10 <0.10 <0.102013 1-Methylphenanthrene µg/L NA <0.10 <0.10 <0.102013 2,6-Dimethylnaphthalene µg/L NA <0.10 <0.10 <0.102013 2-Methylnaphthalene µg/L NA <0.10 <0.10 <0.102013 Acenaphthene µg/L NA <0.10 <0.10 <0.102013 Acenaphthylene µg/L NA <0.10 <0.10 <0.102013 Anthracene µg/L NA <0.10 <0.10 <0.102013 Benzo (a) anthracene µg/L NA <0.10 <0.10 <0.102013 Benzo (a) pyrene µg/L NA <0.10 <0.10 <0.102013 Benzo (b) fluoranthene µg/L NA <0.10 <0.10 <0.102013 Benzo (e) pyrene µg/L NA <0.10 <0.10 <0.102013 Benzo (g,h,i) perylene µg/L NA <0.10 <0.10 <0.102013 Benzo (k) fluoranthene µg/L NA <0.10 <0.10 <0.102013 Biphenyl µg/L NA <0.10 <0.10 <0.102013 Chrysene µg/L NA <0.10 <0.10 <0.102013 Dibenzo (a,h) anthracene µg/L NA <0.10 <0.10 <0.102013 Fluoranthene µg/L NA <0.10 <0.10 <0.102013 Fluorene µg/L NA <0.10 <0.10 <0.102013 Indeno (1,2,3-cd) pyrene µg/L NA <0.10 <0.10 <0.102013 Naphthalene µg/L NA <0.10 <0.10 <0.102013 Perylene µg/L NA <0.10 <0.10 <0.102013 Phenanthrene µg/L NA <0.10 <0.10 <0.102013 Pyrene µg/L NA <0.10 <0.10 <0.10
No
Sam
ples
Col
lect
ed
No
Sam
ples
Col
lect
ed
No
Sam
ples
Col
lect
ed

Dry Weather Historical Monitoring Table for SR-MLS
Long Term and
Transitional Monitoring
Long Term Monitoring
Only
Long Term and
Transitional Monitoring
Long Term and
Transitional Monitoring
2010-2011 2012-2013 2014-2015
01/06/10 05/18/10 - 09/12/11-09/13/11
05/08/12-05/09/12 - 09/17/13-
09/18/131/13/14-1/14/14
05/01/14-05/02/14 -
Permit Requirement Benchmark References
Historical Monitoring Data
Analyte Units Water Quality Benchmarks 2011-2012
Mean Ratio to Benchmarks2009-2010 2013-2014
Frequency Above
Benchmarks
Pyrethroids 2013 Allethrin µg/L NA <0.002 <0.002 <0.0022013 Bifenthrin µg/L 0.0093 15. Anderson et al., 2006 <0.002 <0.002 <0.002 0% NA1
2013 Cyfluthrin µg/L 0.344 17. Wheelock et al., 2004 <0.002 <0.002 <0.002 0% NA1
2013 Cypermethrin µg/L 0.683 17. Wheelock et al., 2004 <0.002 <0.002 <0.002 0% NA1
2013 Danitol (Fenpropathrin) µg/L NA <0.002 <0.002 <0.0022013 Deltamethrin/Tralomethrin µg/L NA <0.002 <0.002 <0.0022013 Esfenvalerate µg/L 0.25 17. Wheelock et al., 2004 <0.002 <0.002 <0.002 0% NA1
2013 Fenvalerate µg/L NA <0.002 <0.002 <0.0022013 Fluvalinate µg/L NA <0.002 <0.002 <0.0022013 L-Cyhalothrin µg/L 0.2 17. Wheelock et al., 2004 <0.002 <0.002 <0.002 0% NA1
2013 Permethrin µg/L 0.021 15. Anderson et al., 2006 <0.01 <0.01 <0.01 0% NA1
2013 Prallethrin µg/L NA <0.002 <0.002 <0.0022013 Resmethrin µg/L NA <0.01 <0.01 <0.01Toxicity2007, 2013 Ceriodaphnia 96-hr LC50 (%) >100 >100 >100 >100 >100 >100 NR >100 0% 1.002007, 2013 Ceriodaphnia 7-day survival NOEC (%) 100 100 100 100 100 100 NR 50 17% 1.172007, 2013 Ceriodaphnia 7-day reproduction NOEC (%) 100 50 50 50 50 25 NR 25 100% 2.672007 Hyalella 96-hr LC50 (%) >100 >100 >100 >100C >100 >100 NR >100 0% 1.002007, 2013 Selenastrum 96-hr NOEC (%) 100 50 50 50 50 25 NR 25 100% 2.672013 Strongylocentrotus 96-hr TST Pass/Fail Pass Pass Pass 0%Blank spaces have been verified and no data is available.
NA indicate no criteria or published value was available or applicable to the matrix or program.(a) Water Quality Benchmark are based on the San Diego Regional Water Quality Control Plan by watershed for the San Diego Region (Basin Plan), 1994 (with amendments effective on or before April 4, 2011) and may vary by hydrologic area.
(d) Water Quality Benchmark for total metals is based on the MUN beneficial as described in the Basin Plan, 1994 (with amendments effective on or before April 4, 2011).
(f) Water Quality Benchmark for PCBs is the CCC (USEPA Federal Register Doc. 40 CFR Part 131, May 18, 2000). B-Analyte was detected in the associated method blank.BS-L-Blank Spike recovery of this analyte was below the control limits. Results may be biased low.C - Control failed; however, sample showed no toxic response.J-Analyte was detected at a concentration below the reporting limit and above the method detection limit. Reported value is estimated.NA1 Three or more years of data required to calculate the Mean Ratio to Benchmark.NR-Sampling of this analyte not required for transitional monitoring (RWQCB Order No. R9-2007-0001) and/or for long term monitoring (RWQCB Order No. R9-2013-0001).
SourcesPlease refer to the San Diego County Copermittee Regional Monitoring Program Benchmark Sources in Attachment B to Appendix A for benchmark source citations.
No
Sam
ples
Col
lect
ed
No
Sam
ples
Col
lect
ed
No
Sam
ples
Col
lect
ed
(e) Water Quality Benchmark for dissolved metal fractions are based on total hardness and are calculated as described by the USEPA Federal Register Doc. 40 CFR Part 131, May 18, 2000. The Criteria Maximum Concentration (CMC) and Continuous Criteria Concentration (CCC) were used.
(b) Water Quality Benchmark for Enterococcus is based on the maximum criteria for infrequently used freshwater area by the San Diego Regional Water Quality Control Plan for the San Diego Region (Basin Plan), 1994 (with amendments effective on or before April 4, 2011).(c) Prior to the 2014-2015 monitoring year, Water Quality Benchmark was calculated based on CMC (salmonids absent) and CCC (early life stages present) using water temperature and pH described in the U.S. EPA, 1999 Update of Ambient Water Quality Criteria for Ammonia, EPA-822-R-99-014, December 1999. For 2014-2015 monitoring year, Water Quality Benchmark CMC and CCC were calculated based on pH and water temperature (when applicable) as described in the U.S. EPA, 2013 Aquatic Life Ambient Water Quality Criteria for Ammonia - Freshwater, EPA-822-R-13-001, April 2013.
Values with red bold font and shading do not meet Water Quality Benchmarks.

Wet Weather Historical Monitoring Table for AHC-TWAS-1
2008-2009 2009-2010 2010-2011 2011-2012 2012-2013 2013-2014 2014-2015
11/30/07 02/03/08 - - - - - - -
Physical Chemistry2007, 2013 pH pH units 6.5-9.0 1. Basin Plan 8.34 8.02 0% NA1
2007, 2013 Specific Conductivity umhos/cm NA 254 4232007, 2013 Water Temperature Celsius NA 16.60 13.202007, 2013 Turbidity NTU 20 1. Basin Plan 304 108 100% NA1
Bacteriological2007, 2013 Enterococcus MPN/100 mL NA 80,000 22,0002007, 2013 Fecal Coliform MPN/100 mL 400 1. Basin Plan REC-1/REC-2 110,000 2,200 100% NA1
2007, 2013 Total Coliform MPN/100 mL NA 170,000 70,000Nutrients2007, 2013 Ammonia as N mg/L (a) 6. U.S. EPA Water Quality Criteria (Freshwater) 0.74 0.09 0% NA1
2007, 2013 Nitrate as N mg/L 10 1. Basin Plan 2.5 1.9 0% NA1
2007, 2013 Nitrite as N mg/L 1 1. Basin Plan 0.1 <0.03 0% NA1
2007, 2013 Total Kjeldahl Nitrogen mg/L NA 3.9 1.12007 Dissolved Phosphorus mg/L 2 4. MSGP 2015 0.74 0.26 0% NA1
2007, 2013 Total Phosphorus mg/L 2 4. MSGP 2015 1.3 0.4 0% NA1
General Chemistry2007 Biochemical Oxygen Demand mg/L 30 4. MSGP 2015, 8. McNeeley (1979) 11 2.7 0% NA1
2007 Chemical Oxygen Demand mg/L 120 4. MSGP 2015 62 23 0% NA1
2007, 2013 Dissolved Organic Carbon mg/L NA 14.7 5.42007, 2013 Total Organic Carbon mg/L NA 15.9 5.62007 Oil and Grease mg/L 10 1. Basin Plan, 3. Anacostia River TMDL, 4. MSGP 2015 3.3J 2.2J 0% NA1
2007, 2013 Surfactants (MBAS) mg/L 0.5 1. Basin Plan 0.03 0.1 0% NA1
2007, 2013 Total Dissolved Solids mg/L 500 (b) 1. Basin Plan 504 406 50% NA1
2007, 2013 Total Suspended Solids mg/L 100 4. MSGP 2015, 1. Basin Plan 440 122 100% NA1
2007, 2013 Hardness mg CaCO3/L NA 88.5 86.6Total Metals2007 Antimony mg/L NA 0.0006 0.00062007, 2013 Arsenic mg/L NA 0.0035 0.00232007, 2013 Cadmium mg/L NA 0.0003J <0.00042007, 2013 Chromium mg/L NA 0.0065 0.00162007, 2013 Copper mg/L NA 0.0379 0.01152007, 2013 Lead mg/L NA 0.0099 0.00322007, 2013 Nickel mg/L NA 0.0084 0.00252007, 2013 Selenium mg/L 0.005 16. 40 CFR 131.38 0.0006 0.0003J 0% NA1
2007, 2013 Zinc mg/L NA 0.1632 0.0509Dissolved Metals2007 Antimony mg/L 0.006 1. Basin Plan 0.0009 0.0007 0% NA1
2007, 2013 Arsenic mg/L 0.34 16. 40 CFR 131.38 0.0025 0.0020 0% NA1
2007, 2013 Cadmium mg/L (c) 16. 40 CFR 131.38 <0.0004 <0.0004 0% NA1
2007, 2013 Chromium mg/L (c) 16. 40 CFR 131.38 0.0005 0.0005 0% NA1
2007, 2013 Copper mg/L (c) 16. 40 CFR 131.38 0.0051 0.0042 0% NA1
2007, 2013 Lead mg/L (c) 16. 40 CFR 131.38 0.00009J <0.0001 0% NA1
2007, 2013 Nickel mg/L (c) 16. 40 CFR 131.38 0.0021 0.0012 0% NA1
2007, 2013 Selenium mg/L NA 0.0005 0.0004J2007, 2013 Zinc mg/L (c) 16. 40 CFR 131.38 0.0125 0.0089 0% NA1
Organophosphorus Pesticides
2007, 2013 Chlorpyrifos µg/L 0.02 acute / 0.014 chronic 12. CA Dept. of Fish & Game, 2000 0.25 0.07 100% NA1
2007, 2013 Diazinon µg/L 0.08 acute / 0.05 chronic
12. CA Dept. of Fish & Game, 2000, 11. Chollas Creek TMDL for Diazinon, 10. USEPA, Aquatic Life Ambient
Water Quality Criteria Diazinon0.037 0.015 0% NA1
2007, 2013 Malathion µg/L 0.43 13. CA Dept. of Fish & Game, 1998, 5. Goldbook 0.058 0.048 0% NA1
Pyrethroids2007, 2013 Allethrin µg/L NA <0.002 <0.0022007, 2013 Bifenthrin µg/L 0.0093 15. Anderson et al., 2006 0.0329 0.0693 100% NA1
2007, 2013 Cyfluthrin µg/L 0.344 17. Wheelock et al., 2004 0.007 <0.002 0% NA1
2007, 2013 Cyhalothrin, Total Lambda µg/L 0.20 17. Wheelock et al., 2004 <0.002 <0.002 0% NA1
2007, 2013 Cypermethrin µg/L 0.683 17. Wheelock et al., 2004 0.01 <0.002 0% NA1
2007, 2013 Danitol (Fenpropathrin) µg/L NA <0.002 0.001J2007, 2013 Deltamethrin/Tralomethrin£ µg/L NA <0.002 <0.0022007, 2013 Esfenvalerate µg/L 0.25 17. Wheelock et al., 2004 <0.002 <0.002 0% NA1
2007, 2013 Fenvalerate µg/L NA <0.002 <0.0022007, 2013 Fluvalinate µg/L NA <0.002 0.0007J2007, 2013 Permethrin µg/L 0.021 15. Anderson et al., 2006 <0.025* <0.025* 0% NA1
2007, 2013 Prallethrin µg/L NA <0.002 <0.0022007, 2013 Resmethrin µg/L NAToxicity2007, 2013 Ceriodaphnia 96-hr LC50 (%) >100 >100 >100 0% NA1
2007, 2013 Ceriodaphnia 7-day survival NOEC (%) 100 100 100 0% NA1
2007, 2013 Ceriodaphnia 7-day reproduction NOEC (%) 100 100 100 0% NA1
2007 Hyalella 96-hr LC50 (%) >100 90.93 >100 50% NA1
2007, 2013 Selenastrum 96-hr NOEC (%) 100 100 100 0% NA1
See last page for footnotes and source references.
No
Sam
ples
Col
lect
ed
No
Sam
ples
Col
lect
ed
No
Sam
ples
Col
lect
ed
Permit Requirement
Frequency Above
Benchmarks
No
Sam
ples
Col
lect
ed
No
Sam
ples
Col
lect
ed
Mean Ratio to Benchmarks
Historical Monitoring Data
No
Sam
ples
Col
lect
ed
Analyte Units Water Quality Benchmarks 2007-2008Benchmark References
Transitional Monitoring
No
Sam
ples
Col
lect
ed

Wet Weather Historical Monitoring Table for AHC-TWAS-1
Blank spaces have been verified and no data is available.
NA indicate no criteria or published value was available or applicable to the matrix or program.
(b) Water Quality Benchmark is based on the San Diego Regional Water Quality Control Plan by watershed for the San Diego Region (Basin Plan), 1994 (with amendments effective on or before April 4, 2011) and may vary by hydrologic area.(c) Water Quality Benchmark for dissolved metal fractions are based on total hardness and are calculated as described by the USEPA Federal Register Doc. 40 CFR Part 131, May 18, 2000. The Criteria Maximum Concentration (CMC) was used.*Indicates detection limit above water quality benchmark£ Historical results for Deltamethrin/Tralomethrin contain results reported by lab as Deltamethrin.J-Analyte was detected at a concentration below the reporting limit and above the method detection limit. Reported value is estimated.NA1 Three or more years of data required to calculate the Mean Ratio to Benchmark.
SourcesPlease refer to the San Diego County Copermittee Regional Monitoring Program Benchmark Sources in Attachment B to Appendix A for benchmark source citations.
(a) Prior to the 2014-2015 monitoring year, Water Quality Benchmark was calculated based on CMC (salmonids absent) using pH described in the U.S. EPA, 1999 Update of Ambient Water Quality Criteria for Ammonia, EPA-822-R-99-014, December 1999. For 2014-2015 monitoring year, Water Quality Benchmark CMC was calculated based on pH and water temperature (when applicable) as described in the U.S. EPA, 2013 Aquatic Life Ambient Water Quality Criteria for Ammonia - Freshwater, EPA-822-R-13-001, April 2013.
Values with red bold font and shading do not meet Water Quality Benchmarks.

Wet Weather Historical Monitoring Table for AHC-MLS
11/08/98 01/31/99 03/15/99 01/25/00 02/20/00 03/05/00 10/27/00 01/08/01 02/23/01 02/17/02 03/08/02 03/17/02 11/08/02 02/11/03 02/25/03 11/12/03 01/19/04 02/18/04
Physical Chemistry2007, 2013 pH pH units 6.5-9.0 1. Basin Plan 7.6 7.8 7.5 7.76 7.5 7.67 7.70 8.00 7.612007, 2013 Specific Conductivity µmhos/cm NA 652 1,560 2,270 2,160 1,172 1,194 2,220 3,180 645 1,320 2,000 1,520 955 588 548 1,203 2,610 6472007, 2013 Water Temperature Celsius NA 17.40 13.90 13.70 16.00 14.20 14.102007, 2013 Turbidity NTU 20 1. Basin Plan 8 14 22 52 58 6.4 66 302 9.5 16 55.1 264 184 290 295 135 27.7Bacteriological2007, 2013 Enterococcus MPN/100 mL NA 3,000 9,000 13,000 13,000 11,000 30,000 50,000 13,000 110,000 11,000 5,000 3,0002007, 2013 Fecal Coliform MPN/100 mL 400 1.Basin Plan REC-1/REC-2 >1600 240 >1600 >1600 >1600 <2 500 11,000 13,000 13,000 500 24,000 23,000 7,000 5,000 5,000 2,300 2,3002007, 2013 Total Coliform MPN/100 mL NA >241,900 8,130 197,000 >1,600 >1,600 300 13,000 50,000 23,000 23,000 1,700 24,000 80,000 50,000 50,000 17,000 5,000 3,000Nutrients2007, 2013 Ammonia as N mg/L (a) 6. USEPA Water Quality Criteria (Freshwater) 0.3 0.15 0.21 0.4 <0.1 0.11 0.84 0.6 0.3 <0.1 0.1 0.1 0.25 0.25 0.62 0.43 <0.1 0.32007, 2013 Nitrate as N mg/L 10 1. Basin Plan 2.1 0.86 1.1 1.6 1.42 1.58 0.4 1.3 1.1 1.1 0.7 1.2 1.27 1.15 0.55 3.1 1.7 3.22007, 2013 Nitrite as N mg/L 1 1. Basin Plan <0.05 <0.05 <0.05 0.057 <0.05 <0.05 <0.05 <0.05 <0.05 <0.05 <0.05 <0.05 <0.05 0.05 <0.05 0.06 <0.05 <0.052007, 2013 Total Kjeldahl Nitrogen mg/L NA 0.44 2.8 0.85 4.02 2.11 2.45 3 4.06 1.5 2.3 2.6 1.8 0.9 2.4 11 7.6 3.52007 Dissolved Phosphorus mg/L 2 4. MSGP 2015 0.57 0.12 0.1 0.12 0.22 <0.1 0.06 0.22 0.42 <0.05 0.08 0.16 0.13 0.20 0.14 0.53 0.88 0.162007, 2013 Total Phosphorus mg/L 2 4. MSGP 2015 0.72 0.13 0.12 0.16 1.04 0.74 0.11 0.24 0.62 0.5 0.25 0.53 0.87 0.83 1.14 0.63 2.28 0.56General Chemistry2007 Biochemical Oxygen Demand mg/L 30 4. MSGP 2015, 8. McNeeley (1979) 20 <3 5.25 6 2.98 6.6 2 8.9 5 8 2.1 7.6 4.32 20.4 5.6 45.3 3.52 162007 Chemical Oxygen Demand mg/L 120 4. MSGP 2015 34 <5 21 70 66 41 62 69 56 50 44 61 88 46 60 260 124 1062007, 2013 Dissolved Organic Carbon mg/L NA 11.0 9.75 11.9 19.6 8.28 32.92007, 2013 Total Organic Carbon mg/L NA 20.3 13.8 5.21 18.1 14.5 47.22007 Oil and Grease mg/L 10 1. Basin Plan, 3. Anacostia River TMDL, 4. MSGP 2015 0.67 <0.5 <0.5 3.24 3.54 2.28 <1 <1 1 2 <1 2 <1.00 1.54 <1.00 <1 <1 <12007, 2013 Surfactants (MBAS) mg/L 0.5 1. Basin Plan 0.25 0.07 <0.05 0.33 0.21 0.08 <0.5* <0.5* <0.5* <0.5* <0.5* <0.5* <0.1 <0.1 <0.1 <0.5 <0.5 <0.52007, 2013 Total Dissolved Solids mg/L 500 (b) 1. Basin Plan 892 1,611 1,356 335 362 1,300 1,290 487 1,050 1,250 389 851 641 310 951 <20 8512007, 2013 Total Suspended Solids mg/L 100 4. MSGP 2015, 1. Basin Plan 35 5 65 134 286 <20 131 442 39 152 335 508 380 674 842 <20 4032007, 2013 Total Hardness mg CaCO3/L NA 137 365 568 52.2 155 35.3 680 532 201 592 669 290 418 370 205 680 576 403Total Metals2007 Antimony mg/L NA <0.0015 <0.0015 <0.0015 <0.0015 <0.0015 <0.002 <0.002 <0.002 <0.002 <0.002 <0.002 <0.002 0.003 0.003 <0.005 <0.006 <0.0062007, 2013 Arsenic mg/L NA <0.001 <0.001 <0.001 0.018 0.007 0.005 0.005 0.007 0.004 0.004 0.003 0.008 0.005 0.010 0.015 0.008 0.0082007, 2013 Cadmium mg/L NA <0.0003 <0.0003 <0.0003 0.001 0.00025 <0.001 <0.001 <0.001 <0.001 <0.001 <0.001 <0.001 <0.001 <0.001 0.002 <0.001 <0.0012007, 2013 Chromium mg/L NA <0.005 0.12 <0.005 <0.005 <0.005 <0.005 <0.005 0.015 0.042 <0.005 <0.005 0.006 0.009 0.017 0.021 <0.005 0.0092007, 2013 Copper mg/L NA <0.005 <0.005 <0.005 0.054 0.020 <0.005 0.010 0.031 0.006 0.010 0.008 0.021 0.02 0.042 0.055 0.02 0.0312007, 2013 Lead mg/L NA <0.001 0.0017 <0.001 <0.001 <0.005 <0.002 0.002 0.010 <0.002 <0.002 0.003 0.008 0.006 0.008 0.012 0.002 0.0072007, 2013 Nickel mg/L NA <0.005 0.010 <0.005 0.050 <0.005 0.007 0.007 0.010 0.007 0.006 0.003 0.009 0.007 0.014 0.026 0.006 0.0082007, 2013 Selenium mg/L 0.005 16. 40 CFR 131.38 <0.001 <0.001 <0.001 0.002 <0.001 0.002 0.003 <0.002 0.006 <0.002 <0.002 <0.004 <0.004 <0.004 <0.005 <0.005 <0.0052007, 2013 Zinc mg/L NA 0.194 0.035 0.010 0.110 0.050 <0.020 0.030 0.070 <0.020 0.027 <0.020 0.047 0.053 0.089 0.148 0.036 0.083Dissolved Metals2007 Antimony mg/L 0.006 1. Basin Plan <0.0015 <0.0015 <0.0015 <0.002 <0.002 <0.002 <0.002 <0.002 <0.002 <0.002 0.002 0.002 <0.005 <0.006 <0.0062007, 2013 Arsenic mg/L 0.34 16. 40 CFR 131.38 <0.001 0.011 <0.001 0.005 0.003 0.003 <0.001 0.002 0.002 0.004 0.003 0.003 0.002 0.002 0.0032007, 2013 Cadmium mg/L (c) 16. 40 CFR 131.38 <0.00025 <0.00025 <0.00025 <0.001 <0.001 <0.001 <0.001 <0.001 <0.001 <0.001 <0.001 <0.001 <0.001 <0.001 <0.0012007, 2013 Chromium mg/L (c) 16. 40 CFR 131.38 <0.005 <0.005 <0.005 <0.005 <0.005 <0.005 <0.005 <0.005 <0.005 <0.005 <0.005 <0.005 <0.005 <0.005 <0.0052007, 2013 Copper mg/L (c) 16. 40 CFR 131.38 <0.005 <0.005 <0.005 <0.005 <0.005 <0.005 <0.005 0.006 <0.005 0.005 0.041 0.010 <0.005 0.008 0.0052007, 2013 Lead mg/L (c) 16. 40 CFR 131.38 <0.001 <0.001 <0.001 <0.002 <0.002 <0.002 <0.002 <0.002 <0.002 <0.002 <0.002 <0.002 <0.002 <0.002 <0.0022007, 2013 Nickel mg/L (c) 16. 40 CFR 131.38 <0.005 <0.005 <0.005 0.007 0.005 0.002 0.004 0.005 <0.002 0.005 0.003 0.002 0.004 0.002 0.0022007, 2013 Selenium mg/L NA <0.001 <0.001 <0.001 <0.002 0.002 <0.002 <0.002 <0.002 <0.002 <0.004 <0.004 <0.004 <0.005 <0.02 <0.0052007, 2013 Zinc mg/L (c) 16. 40 CFR 131.38 0.01 <0.001 0.005 <0.020 <0.020 <0.020 <0.020 <0.020 <0.020 0.009 0.291 0.030 <0.02 <0.02 <0.02Organophosphorus Pesticides
2007, 2013 Chlorpyrifos µg/L 0.02 acute / 0.014 chronic 12. CA Dept. of Fish & Game, 2000 <0.5* <0.5* <0.5* <0.5* <0.05* <0.5* <0.05* <0.03* <0.03* <0.03* 0.047 <0.03* <0.03* <0.01 <0.01 0.121
2007, 2013 Diazinon µg/L 0.08 acute / 0.05 chronic
12. CA Dept. of Fish & Game, 2000, 11. Chollas Creek TMDL for Diazinon, 10. USEPA, Aquatic Life Ambient
Water Quality Criteria Diazinon<0.5* 0.38 <0.5* <0.5* <0.5* 0.41 <0.5* 0.1 0.18 0.13 0.28 0.464 0.194 0.320 0.165 0.051 0.068
2007, 2013 Malathion µg/L 0.43 13. CA Dept. of Fish & Game, 1998, 5. Goldbook 0.10 0.36 0.11 <0.01 0.331 0.076Pyrethroids2007, 2013 Allethrin µg/L NA2007, 2013 Bifenthrin µg/L 0.0093 15. Anderson et al., 20062007, 2013 Cyfluthrin µg/L 0.344 17. Wheelock et al., 20042007, 2013 Cyhalothrin, Total Lambda µg/L 0.20 17. Wheelock et al., 20042007, 2013 Cypermethrin µg/L 0.683 17. Wheelock et al., 20042007, 2013 Danitol (Fenpropathrin) µg/L NA2007, 2013 Deltamethrin/Tralomethrin µg/L NA2007, 2013 Esfenvalerate µg/L 0.25 17. Wheelock et al., 20042007, 2013 Fenvalerate µg/L NA2007, 2013 Fluvalinate µg/L NA2007, 2013 Permethrin µg/L 0.021 15. Anderson et al., 20062007, 2013 Prallethrin µg/L NA2007, 2013 Resmethrin µg/L NAToxicity2007, 2013 Ceriodaphnia 96-hr LC50 (%) >100 >100 >100 >100 81.25 >100 >100 >100 >100 >1002007, 2013 Ceriodaphnia 7-day survival NOEC (%) 100 100 100 100 50 50 50 100 100 1002007, 2013 Ceriodaphnia 7-day reproduction NOEC (%) 100 100 100 100 50 100 50 100 100 1002007 Hyalella 96-hr LC50 (%) >100 >100 >100 >100 >100 >100 >100 >100 >100 >1002007, 2013 Selenastrum 96-hr NOEC (%) 100 100 100 100 100 100 100 100 100 100See last page for footnotes and source references.
Permit Requirements Analyte
2002-20031999-2000 2000-2001 2001-2002
Historical Monitoring Data
Water Quality Benchmarks Benchmark ReferencesUnits
1998-1999 2003-2004

Wet Weather Historical Monitoring Table for AHC-MLS
Physical Chemistry2007, 2013 pH pH units 6.5-9.0 1. Basin Plan2007, 2013 Specific Conductivity µmhos/cm NA2007, 2013 Water Temperature Celsius NA2007, 2013 Turbidity NTU 20 1. Basin PlanBacteriological2007, 2013 Enterococcus MPN/100 mL NA2007, 2013 Fecal Coliform MPN/100 mL 400 1.Basin Plan REC-1/REC-2 2007, 2013 Total Coliform MPN/100 mL NANutrients2007, 2013 Ammonia as N mg/L (a) 6. USEPA Water Quality Criteria (Freshwater)2007, 2013 Nitrate as N mg/L 10 1. Basin Plan2007, 2013 Nitrite as N mg/L 1 1. Basin Plan2007, 2013 Total Kjeldahl Nitrogen mg/L NA2007 Dissolved Phosphorus mg/L 2 4. MSGP 20152007, 2013 Total Phosphorus mg/L 2 4. MSGP 2015General Chemistry2007 Biochemical Oxygen Demand mg/L 30 4. MSGP 2015, 8. McNeeley (1979)2007 Chemical Oxygen Demand mg/L 120 4. MSGP 20152007, 2013 Dissolved Organic Carbon mg/L NA2007, 2013 Total Organic Carbon mg/L NA2007 Oil and Grease mg/L 10 1. Basin Plan, 3. Anacostia River TMDL, 4. MSGP 20152007, 2013 Surfactants (MBAS) mg/L 0.5 1. Basin Plan2007, 2013 Total Dissolved Solids mg/L 500 (b) 1. Basin Plan2007, 2013 Total Suspended Solids mg/L 100 4. MSGP 2015, 1. Basin Plan2007, 2013 Total Hardness mg CaCO3/L NATotal Metals2007 Antimony mg/L NA2007, 2013 Arsenic mg/L NA2007, 2013 Cadmium mg/L NA2007, 2013 Chromium mg/L NA2007, 2013 Copper mg/L NA2007, 2013 Lead mg/L NA2007, 2013 Nickel mg/L NA2007, 2013 Selenium mg/L 0.005 16. 40 CFR 131.382007, 2013 Zinc mg/L NADissolved Metals2007 Antimony mg/L 0.006 1. Basin Plan2007, 2013 Arsenic mg/L 0.34 16. 40 CFR 131.382007, 2013 Cadmium mg/L (c) 16. 40 CFR 131.382007, 2013 Chromium mg/L (c) 16. 40 CFR 131.382007, 2013 Copper mg/L (c) 16. 40 CFR 131.382007, 2013 Lead mg/L (c) 16. 40 CFR 131.382007, 2013 Nickel mg/L (c) 16. 40 CFR 131.382007, 2013 Selenium mg/L NA2007, 2013 Zinc mg/L (c) 16. 40 CFR 131.38Organophosphorus Pesticides
2007, 2013 Chlorpyrifos µg/L 0.02 acute / 0.014 chronic 12. CA Dept. of Fish & Game, 2000
2007, 2013 Diazinon µg/L 0.08 acute / 0.05 chronic
12. CA Dept. of Fish & Game, 2000, 11. Chollas Creek TMDL for Diazinon, 10. USEPA, Aquatic Life Ambient
Water Quality Criteria Diazinon2007, 2013 Malathion µg/L 0.43 13. CA Dept. of Fish & Game, 1998, 5. GoldbookPyrethroids2007, 2013 Allethrin µg/L NA2007, 2013 Bifenthrin µg/L 0.0093 15. Anderson et al., 20062007, 2013 Cyfluthrin µg/L 0.344 17. Wheelock et al., 20042007, 2013 Cyhalothrin, Total Lambda µg/L 0.20 17. Wheelock et al., 20042007, 2013 Cypermethrin µg/L 0.683 17. Wheelock et al., 20042007, 2013 Danitol (Fenpropathrin) µg/L NA2007, 2013 Deltamethrin/Tralomethrin µg/L NA2007, 2013 Esfenvalerate µg/L 0.25 17. Wheelock et al., 20042007, 2013 Fenvalerate µg/L NA2007, 2013 Fluvalinate µg/L NA2007, 2013 Permethrin µg/L 0.021 15. Anderson et al., 20062007, 2013 Prallethrin µg/L NA2007, 2013 Resmethrin µg/L NAToxicity2007, 2013 Ceriodaphnia 96-hr LC50 (%) >1002007, 2013 Ceriodaphnia 7-day survival NOEC (%) 1002007, 2013 Ceriodaphnia 7-day reproduction NOEC (%) 1002007 Hyalella 96-hr LC50 (%) >1002007, 2013 Selenastrum 96-hr NOEC (%) 100See last page for footnotes and source references.
Permit Requirements Analyte Water Quality
Benchmarks Benchmark ReferencesUnits2008-2009 2009-2010 2011-2012
10/17/04 02/11/05 02/18/05 10/17/05 12/31/05 02/19/06 10/14/06 01/30/07 02/19/07 11/30/07 02/03/08 11/04/08 - 10/06/10 02/16/11 - 10/11/12-10/12/12 02/08/13
7.50 7.76 7.38 8.22 6.70 7.30 7.86 7.39 7.31 8.10 7.84 8.09 7.63 7.65 7.991,760 502 700 1,248 2,760 1,268 587 2,440 951 345 749 3,260 1,181 1,208 3,350 1,43017.60 15.10 13.50 18.00 14.30 9.50 15.70 13.30 13.40 16.30 13.30 17.10 16.66 13.50 22.1 11.6383 27.5 214 67.1 194 825 321 181 68.3 406 121 15.4 11 6 41 18
280,000 7,000 50,000 22,000 17,000 23,000 500,000 3,000 8,000 110,000 3,000 50,000 50,000 11000 170,000 17,00030,000 5,000 50,000 14,000 5,000 11,000 22,000 11,000 3,000 130,000 5,000 30,000 23,000 5,000 70,000 5,000
300,000 17,000 80,000 110,000 70,000 80,000 50,000 50,000 30,000 130,000 30,000 80,000 70,000 30000 300,000 22,000
0.82 0.23 0.18 0.64 0.43 0.24 0.81 0.88 0.91 0.68 0.07 0.22 0.17 0.13 0.65 0.09J1.93 2.41 0.88 2.23 1.66 2.58 1.77 <0.05 0.95 1.3 0.89 1.64 0.55 1.8 1.2 1.2
<0.05 <0.05 0.09 <0.05 <0.05 <0.05 <0.05 <0.05 <0.05 0.07 <0.05 0.05 0.065J 0.073J 0.038J 0.043J14.1 1.3 3.6 5.1 4.2 2.7 2.5 3.5 2.7 2.7 1.1 1.6 0.94 0.71 4.6 1.31.1 0.44 0.51 0.31 0.23 0.32 0.31 0.39 0.1 0.53 0.15 0.094 0.1 0.1 0.09 0.085
2.15 0.47 1.12 0.32 0.47 0.47 0.98 0.43 0.28 1.3 0.34 0.2 0.12 0.16 0.93 0.2
32.2 4.67 3.64 7.76 8.59 <2 15.3 49.4 9.84 17 2.5 10.8 4.6 2.7 23 4.4279 75 39 157 81 85 552 115 33 42 25 83 40 35 130 4228.9 7.3 7.2 10.8 7.78 15.2 32.5 16.6 8.91 12.1 5.4 21.6 10 8.7 17 6.244.7 7.31 14.2 34.3 18.7 17.5 47.5 17.9 9.49 13.4 5.3 22.4 12 9.2 18 6.8<1 <1 <1 <1 <1 <1 <5 <5 <5 2.2J 2.1J <5 <5 <5 <5 <5
<0.5 <0.5 <0.5 <0.5 <0.5 <0.5 <0.5 <0.5 <0.5 <0.01 0.037 0.365 0.11 0.12 0.037J 0.063852 752 416 617 1,010 800 518 806 573 406 580 1,870 1,200 1,200 920 990962 246 859 597 344 2,210 1,160 346 120 840 215 44.5 29 34 560 74422 387 225 442 606 532 419 413 300 80 126.4 672.2 550 570 420 496
<0.005 <0.005 <0.005 <0.005 <0.005 <0.005 0.003 0.002 0.003 0.0005 0.0005 0.0008 0.0011 0.00071 0.0016 0.000670.008 0.007 <0.002 0.009 0.009 0.004 0.016 0.003 0.003 0.0054 0.0038 0.0045 0.0037 0.0032 0.0069 0.00330.002 <0.001 <0.001 <0.001 <0.001 <0.001 0.003 <0.001 <0.001 0.0004 0.0002J <0.0004 0.000091J 0.00014 0.00086 0.00014
<0.005 <0.005 <0.005 <0.005 0.013 <0.005 0.013 <0.005 0.007 0.0055 0.0021 0.0008 0.00074 0.0016 0.0064 0.00240.032 0.012 0.018 0.03 0.028 0.021 0.036 0.015 0.025 0.037 0.016 0.007 0.0045 0.0085 0.03 0.00930.007 0.004 0.006 0.008 0.006 0.004 0.015 0.006 0.004 0.0099 0.0039 0.00052 0.00056 0.00089 0.0054 0.00140.028 0.007 0.007 0.015 0.013 0.014 0.026 0.008 0.008 0.0115 0.0065 0.0086 0.0065 0.0083 0.013 0.0076
<0.005 <0.005 <0.005 <0.005 <0.004 <0.005 <0.004 <0.004 <0.004 0.0005 0.0005 0.0009 0.0006 0.00098 0.00077 0.000870.270 0.042 0.060 0.116 0.077 0.102 0.199 0.093 0.075 0.12 0.058 0.02 0.011 0.021 0.1 0.027
<0.005 <0.005 <0.005 <0.005 <0.005 <0.005 <0.002 <0.002 0.003 0.0006 0.0006 0.0009 0.0011 0.00066 0.0018 0.00053<0.002 <0.002 <0.002 0.001 <0.001 <0.001 0.001 <0.001 <0.001 0.0027 0.0022 0.0038 0.003 0.0021 0.0032 0.0019<0.001 <0.001 <0.001 <0.001 <0.001 <0.001 <0.001 <0.001 <0.001 <0.0004 <0.0004 <0.0004 0.000036J 0.000059J 0.00013 0.000047J<0.005 <0.005 <0.005 <0.005 <0.005 <0.005 <0.005 <0.005 <0.005 0.0003J 0.0003J 0.0002J 0.00022 0.00031 0.00027 0.000230.006 0.005 <0.005 <0.005 0.005 0.006 0.003 0.006 0.004 0.0042 0.0033 0.0035 0.0027 0.0046 0.0031 0.0028
<0.002 <0.002 <0.002 <0.002 <0.002 <0.002 <0.001 <0.001 <0.001 0.00005J <0.0001 <0.0001 0.000041J 0.000019J <0.0002 0.000031J0.007 0.003 0.002 0.007 0.003 0.003 0.003 0.003 0.003 0.0022 0.0002 0.0072 0.0052 0.0065 0.0048 0.0049
<0.005 <0.005 <0.005 <0.005 <0.004 <0.005 <0.004 <0.004 <0.004 0.0005 0.0006 0.0009 0.00066 0.00076 0.00033J 0.00069<0.02 <0.02 <0.02 0.041 <0.02 <0.02 <0.02 <0.02 <0.02 0.0054 0.0038 0.0049 0.0044J 0.0041J 0.0095 0.006
<0.01 <0.01 <0.01 <0.01 <0.02 <0.02 <0.002 <0.002 <0.002 0.0938 0.0354 <0.002 <0.01 <0.01 <0.01 <0.01
0.267 0.044 <0.01 0.024 <0.02 <0.02 0.451 <0.004 <0.004 0.035 0.007 <0.004 0.016 0.01 0.0063J <0.01
0.330 0.083 <0.01 0.247 0.622 0.035 0.436 0.064 0.062 0.398 0.034 0.078 0.094 0.012 0.13 <0.01
<0.002 <0.002 <0.002 <0.002 <0.002 <0.002 <0.002 <0.002 <0.002 <0.0020.4869 0.1925 0.1374 0.0816 0.0386 0.0233 <0.002 0.0156 0.931 0.1510.1013 <0.002 0.0101 0.02 0.004 <0.002 <0.002 <0.002 0.0575 <0.0020.0205 <0.002 <0.002 0.002J 0.0007J <0.002 <0.002 <0.002 0.0081 0.0290.0682 <0.002 0.0047 <0.002 0.001J <0.002 <0.002 <0.002 0.0244 <0.002<0.002 <0.002 <0.002 <0.002 <0.002 <0.002 <0.002 <0.002 <0.002<0.002 <0.002 <0.002 <0.002 <0.002 <0.002 <0.002 <0.002 0.0154 <0.002<0.002 <0.002 <0.002 0.004 <0.002 <0.002 <0.002 <0.002 <0.002 <0.002<0.002 <0.002 <0.002 0.003 0.0007J <0.002 <0.002 <0.002 <0.002 <0.002
<0.002 <0.002 <0.002 <0.002 0.006 <0.002<0.002 <0.002 <0.002 <0.025* <0.025* <0.025* <0.005 <0.025* <0.025†† <0.01<0.002 <0.002 <0.002 <0.002 <0.002 <0.002 <0.002 <0.002 <0.002 <0.002
<0.025 <0.025 <0.0025 <0.01
>100 >100 >100 >100 >100 >100 77.11 >100 >100 >100 >100 >100 >100 >100 >100 >10050 100 100 100 100 100 25 100 100 100 100 100 100 100 100 100
100 100 100 100 100 100 25 100 100 100 100 100 100 100 100 10072.17 >100 >100 >100 73.61 >100 6.53 46.97 >100 77.3 >100 >100 >100 >100 13.2 >100100 100 100 100 100 100 100 100 100 100 100 100 100 100 100 100
2005-20062004-2005 2006-2007
No
Sam
ples
Col
lect
ed
No
Sam
ples
Col
lect
ed
Historical Monitoring Data
2012-20132010-20112007-2008
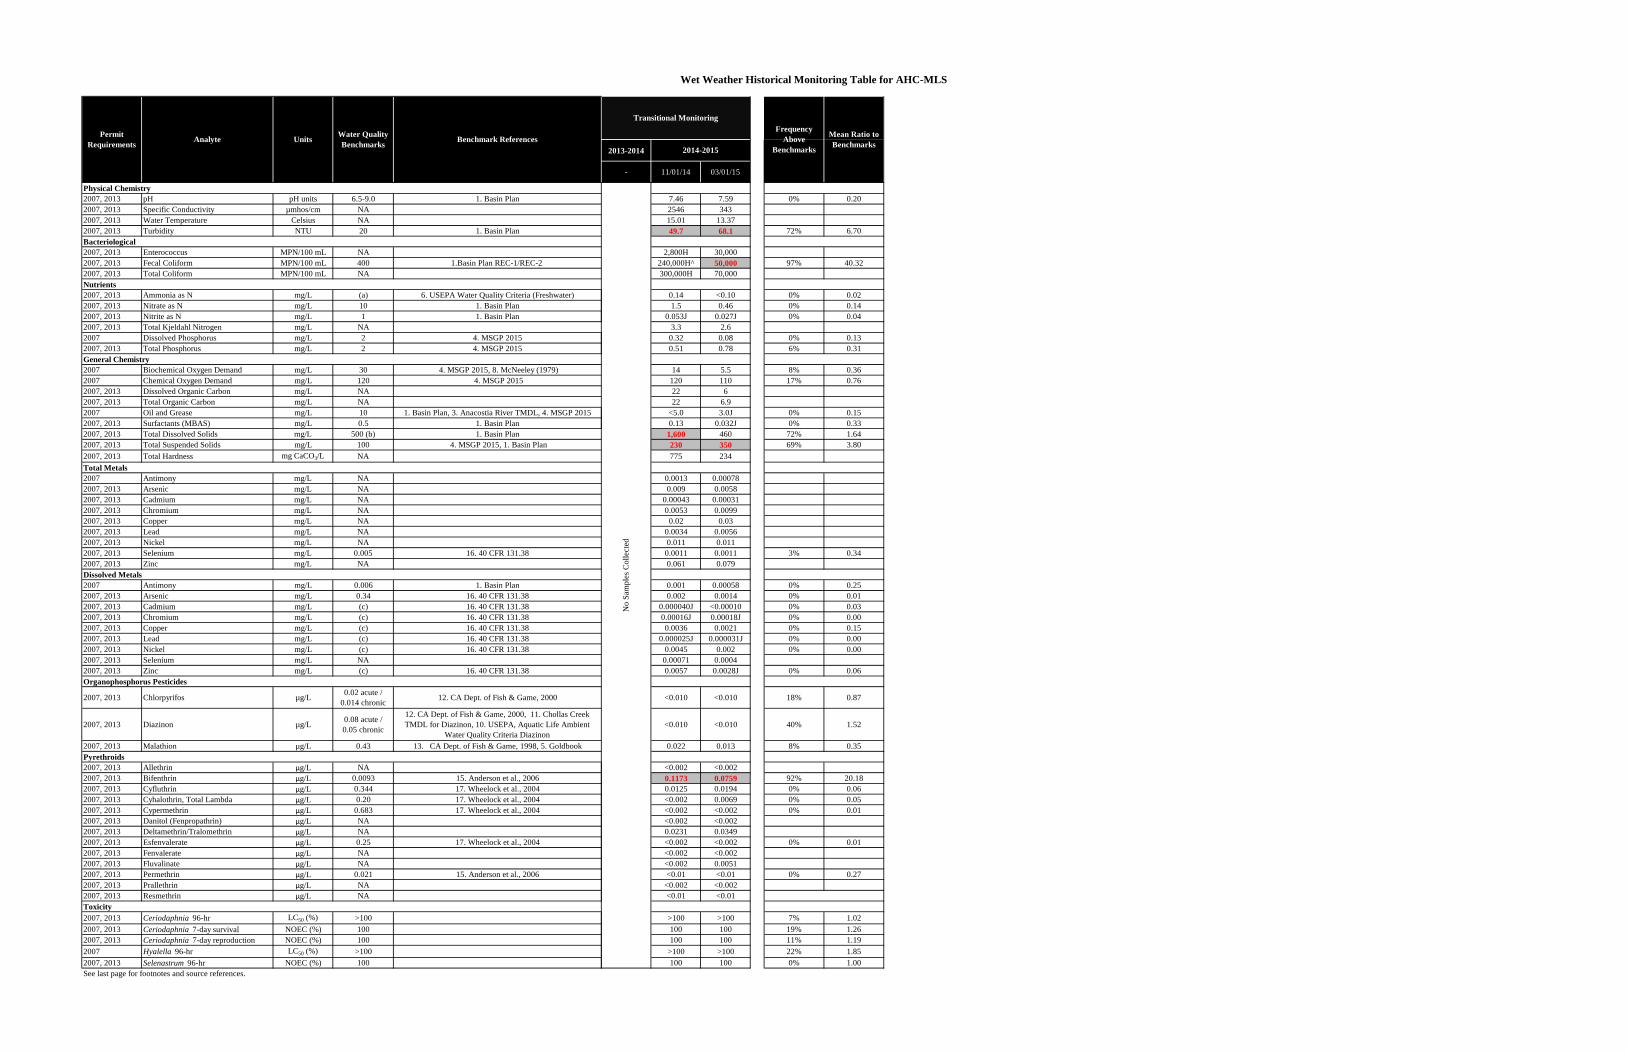
Wet Weather Historical Monitoring Table for AHC-MLS
Physical Chemistry2007, 2013 pH pH units 6.5-9.0 1. Basin Plan2007, 2013 Specific Conductivity µmhos/cm NA2007, 2013 Water Temperature Celsius NA2007, 2013 Turbidity NTU 20 1. Basin PlanBacteriological2007, 2013 Enterococcus MPN/100 mL NA2007, 2013 Fecal Coliform MPN/100 mL 400 1.Basin Plan REC-1/REC-2 2007, 2013 Total Coliform MPN/100 mL NANutrients2007, 2013 Ammonia as N mg/L (a) 6. USEPA Water Quality Criteria (Freshwater)2007, 2013 Nitrate as N mg/L 10 1. Basin Plan2007, 2013 Nitrite as N mg/L 1 1. Basin Plan2007, 2013 Total Kjeldahl Nitrogen mg/L NA2007 Dissolved Phosphorus mg/L 2 4. MSGP 20152007, 2013 Total Phosphorus mg/L 2 4. MSGP 2015General Chemistry2007 Biochemical Oxygen Demand mg/L 30 4. MSGP 2015, 8. McNeeley (1979)2007 Chemical Oxygen Demand mg/L 120 4. MSGP 20152007, 2013 Dissolved Organic Carbon mg/L NA2007, 2013 Total Organic Carbon mg/L NA2007 Oil and Grease mg/L 10 1. Basin Plan, 3. Anacostia River TMDL, 4. MSGP 20152007, 2013 Surfactants (MBAS) mg/L 0.5 1. Basin Plan2007, 2013 Total Dissolved Solids mg/L 500 (b) 1. Basin Plan2007, 2013 Total Suspended Solids mg/L 100 4. MSGP 2015, 1. Basin Plan2007, 2013 Total Hardness mg CaCO3/L NATotal Metals2007 Antimony mg/L NA2007, 2013 Arsenic mg/L NA2007, 2013 Cadmium mg/L NA2007, 2013 Chromium mg/L NA2007, 2013 Copper mg/L NA2007, 2013 Lead mg/L NA2007, 2013 Nickel mg/L NA2007, 2013 Selenium mg/L 0.005 16. 40 CFR 131.382007, 2013 Zinc mg/L NADissolved Metals2007 Antimony mg/L 0.006 1. Basin Plan2007, 2013 Arsenic mg/L 0.34 16. 40 CFR 131.382007, 2013 Cadmium mg/L (c) 16. 40 CFR 131.382007, 2013 Chromium mg/L (c) 16. 40 CFR 131.382007, 2013 Copper mg/L (c) 16. 40 CFR 131.382007, 2013 Lead mg/L (c) 16. 40 CFR 131.382007, 2013 Nickel mg/L (c) 16. 40 CFR 131.382007, 2013 Selenium mg/L NA2007, 2013 Zinc mg/L (c) 16. 40 CFR 131.38Organophosphorus Pesticides
2007, 2013 Chlorpyrifos µg/L 0.02 acute / 0.014 chronic 12. CA Dept. of Fish & Game, 2000
2007, 2013 Diazinon µg/L 0.08 acute / 0.05 chronic
12. CA Dept. of Fish & Game, 2000, 11. Chollas Creek TMDL for Diazinon, 10. USEPA, Aquatic Life Ambient
Water Quality Criteria Diazinon2007, 2013 Malathion µg/L 0.43 13. CA Dept. of Fish & Game, 1998, 5. GoldbookPyrethroids2007, 2013 Allethrin µg/L NA2007, 2013 Bifenthrin µg/L 0.0093 15. Anderson et al., 20062007, 2013 Cyfluthrin µg/L 0.344 17. Wheelock et al., 20042007, 2013 Cyhalothrin, Total Lambda µg/L 0.20 17. Wheelock et al., 20042007, 2013 Cypermethrin µg/L 0.683 17. Wheelock et al., 20042007, 2013 Danitol (Fenpropathrin) µg/L NA2007, 2013 Deltamethrin/Tralomethrin µg/L NA2007, 2013 Esfenvalerate µg/L 0.25 17. Wheelock et al., 20042007, 2013 Fenvalerate µg/L NA2007, 2013 Fluvalinate µg/L NA2007, 2013 Permethrin µg/L 0.021 15. Anderson et al., 20062007, 2013 Prallethrin µg/L NA2007, 2013 Resmethrin µg/L NAToxicity2007, 2013 Ceriodaphnia 96-hr LC50 (%) >1002007, 2013 Ceriodaphnia 7-day survival NOEC (%) 1002007, 2013 Ceriodaphnia 7-day reproduction NOEC (%) 1002007 Hyalella 96-hr LC50 (%) >1002007, 2013 Selenastrum 96-hr NOEC (%) 100See last page for footnotes and source references.
Permit Requirements Analyte Water Quality
Benchmarks Benchmark ReferencesUnits2013-2014
- 11/01/14 03/01/15
7.46 7.59 0% 0.202546 34315.01 13.3749.7 68.1 72% 6.70
2,800H 30,000240,000H^ 50,000 97% 40.32300,000H 70,000
0.14 <0.10 0% 0.021.5 0.46 0% 0.14
0.053J 0.027J 0% 0.043.3 2.6
0.32 0.08 0% 0.130.51 0.78 6% 0.31
14 5.5 8% 0.36120 110 17% 0.7622 622 6.9
<5.0 3.0J 0% 0.150.13 0.032J 0% 0.33
1,600 460 72% 1.64230 350 69% 3.80775 234
0.0013 0.000780.009 0.0058
0.00043 0.000310.0053 0.0099
0.02 0.030.0034 0.00560.011 0.011
0.0011 0.0011 3% 0.340.061 0.079
0.001 0.00058 0% 0.250.002 0.0014 0% 0.01
0.000040J <0.00010 0% 0.030.00016J 0.00018J 0% 0.000.0036 0.0021 0% 0.15
0.000025J 0.000031J 0% 0.000.0045 0.002 0% 0.00
0.00071 0.00040.0057 0.0028J 0% 0.06
<0.010 <0.010 18% 0.87
<0.010 <0.010 40% 1.52
0.022 0.013 8% 0.35
<0.002 <0.0020.1173 0.0759 92% 20.180.0125 0.0194 0% 0.06<0.002 0.0069 0% 0.05<0.002 <0.002 0% 0.01<0.002 <0.0020.0231 0.0349<0.002 <0.002 0% 0.01<0.002 <0.002<0.002 0.0051<0.01 <0.01 0% 0.27
<0.002 <0.002<0.01 <0.01
>100 >100 7% 1.02100 100 19% 1.26100 100 11% 1.19
>100 >100 22% 1.85100 100 0% 1.00
Frequency Above
Benchmarks2014-2015
No
Sam
ples
Col
lect
ed
Mean Ratio to Benchmarks
Transitional Monitoring

Wet Weather Historical Monitoring Table for AHC-MLS
Blank spaces have been verified and no data is available.
NA indicate no criteria or published value was available or applicable to the matrix or program.
(b) Water Quality Benchmark is based on the San Diego Regional Water Quality Control Plan by watershed for the San Diego Region (Basin Plan), 1994 (with amendments effective on or before April 4, 2011) and may vary by hydrologic area.(c) Water Quality Benchmark for dissolved metal fractions are based on total hardness and are calculated as described by the USEPA Federal Register Doc. 40 CFR Part 131, May 18, 2000. The Criteria Maximum Concentration (CMC) was used.
£ Historical results for Deltamethrin/Tralomethrin contain results reported by lab as Deltamethrin.
^Results were not compared to the water quality benchmark for fecal coliform due to the sample being received and/or analyzed past the recommended holding time.H-Sample analyzed and/or extracted past the recommended holding time.
SourcesPlease refer to the San Diego County Copermittee Regional Monitoring Program Benchmark Sources in Attachment B to Appendix A for benchmark source citations.
J-Analyte was detected at a concentration below the reporting limit and above the method detection limit. Reported value is estimated.
†† Permethrin was non-detect at the method detection limit of 0.005 µg/L
* Indicates detection limit above water quality benchmark.
(a) Prior to the 2014-2015 monitoring year, Water Quality Benchmark was calculated based on CMC (salmonids absent) using pH described in the U.S. EPA, 1999 Update of Ambient Water Quality Criteria for Ammonia, EPA-822-R-99-014, December 1999. For 2014-2015 monitoring year, Water Quality Benchmark CMC was calculated based on pH and water temperature (when applicable) as described in the U.S. EPA, 2013 Aquatic Life Ambient Water Quality Criteria for Ammonia - Freshwater, EPA-822-R-13-001, April 2013.
Values with red bold font and shading do not meet Water Quality Benchmarks.

Wet Weather Historical Monitoring Table for BVC-TWAS-1
2008-2009 2009-2010 2011-2012 2013-2014
11/30/07 02/03/08 - - 10/6/10 02/16/11 - 10/11/12 02/08/13-02/09/13 - 11/01/14 03/01/15
Physical Chemistry2007, 2013 pH pH units 6.5-9.0 1. Basin Plan 7.75 8.02 7.59 7.78 7.26 8.28 7.58 7.77 0% 0.172007, 2013 Specific Conductivity µmhos/cm NA 286 361 1,108 1,160 562 1,961 1,576 6442007, 2013 Water Temperature Celsius NA 15.90 13.60 17.30 16.40 17.1 14 15.55 14.52007, 2013 Turbidity NTU 20 1. Basin Plan 231 112 11 6.9 33 6 102.2 99.9 63% 3.76Bacteriological2007, 2013 Enterococcus MPN/100 mL NA 70,000 17,000 110,000 8,000 140,000 11,000 3,300 30,0002007, 2013 Fecal Coliform MPN/100 mL 400 1. Basin Plan REC-1/REC-2 28,000 5,000 17,000 9,000 80,000 1,300 30,000 17,000 100% 58.532007, 2013 Total Coliform MPN/100 mL NA 70,000 80,000 170,000 50,000 600,000 30,000 50,000 50,000Nutrients2007, 2013 Ammonia as N mg/L (a) 6. U.S. EPA Water Quality Criteria (Freshwater) 0.68 0.13 0.15 0.1 0.69 0.13 0.33 0.077J 0% 0.022007, 2013 Nitrate as N mg/L 10 1. Basin Plan 1.6 1.06 1.3 2.3 1.4 1.9 2.2 0.77 0% 0.162007, 2013 Nitrite as N mg/L 1 1. Basin Plan 0.07 0.03J 0.064J 0.07J 0.045J 0.026J 0.071J 0.031J 0% 0.052007, 2013 Total Kjeldahl Nitrogen mg/L NA 5.9 1.1 1.6 0.92 4 0.89 4.9 1.72007 Dissolved Phosphorus mg/L 2 4. MSGP 2015 0.95 0.18 0.23 0.16 0.39 0.08 0.39 0.22 0% 0.162007, 2013 Total Phosphorus mg/L 2 4. MSGP 2015 1.19 0.434 0.24 0.26 0.9 0.12 0.66 0.46 0% 0.27General Chemistry2007 Biochemical Oxygen Demand mg/L 30 4. MSGP 2015, 8. McNeeley (1979) 20 5.3 4.9 6.1 22 4 25 10 0% 0.412007 Chemical Oxygen Demand mg/L 120 4. MSGP 2015 60 26 47 45 150 25 160 70 25% 0.612007, 2013 Dissolved Organic Carbon mg/L NA 15.2 5.4 11 11 15 5.7 28 8.22007, 2013 Total Organic Carbon mg/L NA 16.6 5.9 13 12 16 6 30 8.82007 Oil and Grease mg/L 10 1. Basin Plan, 3. Anacostia River TMDL, 4. MSGP 2015 6.3 3.7J 2J <5 <5 <5 <5.0 1.6J 0% 0.302007, 2013 Surfactants (MBAS) mg/L 0.5 1. Basin Plan 0.045 0.064 0.22 0.15 0.046J 0.08 0.16 0.042J 0% 0.202007, 2013 Total Dissolved Solids mg/L 500 (b) 1. Basin Plan 434 402 860 750 660 1,200 1,100 590 75% 1.502007, 2013 Total Suspended Solids mg/L 100 4. MSGP 2015, 1. Basin Plan 520 290 42 66 310 15 290 230 63% 2.202007, 2013 Hardness mg CaCO3/L NA 68.2 83.1 360 360 295 559 455 277Total Metals2007 Antimony mg/L NA 0.0011 0.0008 0.0019 0.0014 0.0015 0.00067 0.002 0.000962007, 2013 Arsenic mg/L NA 0.0081 0.0044 0.0059 0.0047 0.0063 0.0055 0.0087 0.00462007, 2013 Cadmium mg/L NA 0.0005 0.0002J 0.000079J 0.000094J 0.00032 0.000087J 0.0003 0.000142007, 2013 Chromium mg/L NA 0.0056 0.0019 0.0019 0.0033 0.0072 0.00079 0.009 0.00612007, 2013 Copper mg/L NA 0.0479 0.0178 0.011 0.015 0.036 0.0045 0.039 0.0192007, 2013 Lead mg/L NA 0.0193 0.0072 0.0017 0.0029 0.0098 0.00049 0.0092 0.00562007, 2013 Nickel mg/L NA 0.0092 0.0044 0.0039 0.0056 0.0074 0.005 0.0094 0.00572007, 2013 Selenium mg/L 0.005 16. 40 CFR 131.38 0.0005 0.0003J 0.00052 0.00067 0.00076 0.0012 0.0013 0.001 0% 0.162007, 2013 Zinc mg/L NA 0.2828 0.1068 0.031 0.044 0.19 0.013 0.16 0.071Dissolved Metals2007 Antimony mg/L 0.006 1. Basin Plan 0.0011 0.0009 0.0018 0.0013 0.00093 0.00059 0.0017 0.00069 0% 0.192007, 2013 Arsenic mg/L 0.34 16. 40 CFR 131.38 0.0040 0.0030 0.0053 0.0038 0.0042 0.0052 0.005 0.0028 0% 0.012007, 2013 Cadmium mg/L (c) 16. 40 CFR 131.38 <0.0004 <0.0004 0.000037J 0.000038J 0.00006J 0.000075J 0.000029J <0.00010 0% 0.022007, 2013 Chromium mg/L (c) 16. 40 CFR 131.38 0.0004J 0.0005 0.00047 0.00064 0.00074 0.00023 0.00033 0.00028 0% 0.002007, 2013 Copper mg/L (c) 16. 40 CFR 131.38 0.0044 0.0036 0.0061 0.0074 0.0057 0.0029 0.0078 0.0032 0% 0.192007, 2013 Lead mg/L (c) 16. 40 CFR 131.38 0.0002 <0.0001 0.00009J 0.000033J 0.00026 0.000034J 0.000062J 0.000084J 0% 0.002007, 2013 Nickel mg/L (c) 16. 40 CFR 131.38 0.0020 0.0012 0.003 0.0039 0.0026 0.0041 0.0038 0.0019 0% 0.002007, 2013 Selenium mg/L NA 0.0004J 0.0003J 0.0006 0.0008 0.00051 0.0012 0.00073 0.000592007, 2013 Zinc mg/L (c) 16. 40 CFR 131.38 0.0109 0.0075 0.012 0.011 0.031 0.0071 0.03 0.0076 0% 0.06Organophosphorus Pesticides
2007, 2013 Chlorpyrifos µg/L 0.02 acute / 0.014 chronic 12. CA Dept. of Fish & Game, 2000 <0.002 <0.002 <0.01 <0.01 <0.01 <0.01 <0.010 <0.010 0% 0.20
2007, 2013 Diazinon µg/L 0.08 acute / 0.05 chronic
12. CA Dept. of Fish & Game, 2000, 11. Chollas Creek TMDL for Diazinon, 10. USEPA, Aquatic Life Ambient
Water Quality Criteria Diazinon0.042 <0.004 <0.01 0.0092J <0.01 <0.01 <0.010 <0.010 0% 0.12
2007, 2013 Malathion µg/L 0.43 13. CA Dept. of Fish & Game, 1998, 5. Goldbook 0.106 0.020 <0.01 0.12 0.061 <0.01 0.14 0.025 0% 0.14Pyrethroids2007, 2013 Allethrin µg/L NA <0.002 <0.002 <0.002 <0.002 <0.002 <0.002 <0.002 <0.0022007, 2013 Bifenthrin µg/L 0.0093 15. Anderson et al., 2006 0.1024 0.0583 <0.002 0.0459 0.194 0.012 0.1098 0.0084 75% 7.152007, 2013 Cyfluthrin µg/L 0.344 17. Wheelock et al., 2004 0.02 0.02 <0.002 0.0039 0.0398 <0.002 0.0425 <0.002 0% 0.052007, 2013 Cyhalothrin, Total Lambda µg/L 0.20 17. Wheelock et al., 2004 0.005 <0.002 <0.002 0.0015J 0.0044 <0.002 0.0075 <0.002 0% 0.042007, 2013 Cypermethrin µg/L 0.683 17. Wheelock et al., 2004 <0.002 <0.002 <0.002 <0.002 0.0117 <0.002 0.0132 <0.002 0% 0.012007, 2013 Danitol (Fenpropathrin) µg/L NA 0.002 <0.002 <0.002 0.0009J <0.002 <0.002 <0.0022007, 2013 Deltamethrin/Tralomethrin£ µg/L NA <0.002 <0.002 <0.002 <0.002 <0.002 <0.002 0.0405 <0.0022007, 2013 Esfenvalerate µg/L 0.25 17. Wheelock et al., 2004 <0.002 0.0009J <0.002 <0.002 0.0011J <0.002 0.0036 <0.002 0% 0.012007, 2013 Fenvalerate µg/L NA <0.002 0.0009J <0.002 <0.002 0.0008J <0.002 0.0006J <0.0022007, 2013 Fluvalinate µg/L NA <0.002 <0.002 <0.002 <0.002 <0.002 0.0029 <0.0022007, 2013 Permethrin µg/L 0.021 15. Anderson et al., 2006 0.235 <0.025* <0.005 <0.025* 0.2759 <0.01 0.094 <0.01 38% 3.812007, 2013 Prallethrin µg/L NA <0.002 <0.002 <0.002 0.0016J <0.002 <0.002 <0.002 <0.0022007, 2013 Resmethrin µg/L NA <0.025 <0.025 <0.01 <0.01 <0.01Toxicity2007, 2013 Ceriodaphnia 96-hr LC50 (%) >100 >100 >100 >100 >100 >100 >100 >100 >100 0% 1.002007, 2013 Ceriodaphnia 7-day survival NOEC (%) 100 100 100 100 100 100 100 100 100 0% 1.002007, 2013 Ceriodaphnia 7-day reproduction NOEC (%) 100 100 100 100 100 100 100 100 100 0% 1.002007 Hyalella 96-hr LC50 (%) >100 >100 >100 >100 >100 100 >100 >100 >100 13% 1.002007, 2013 Selenastrum 96-hr NOEC (%) 100 100 100 100 100 100 100 100 100 0% 1.00See last page for footnotes and source references.
2007-2008
No
Sam
ples
Col
lect
ed
No
Sam
ples
Col
lect
ed
No
Sam
ples
Col
lect
ed
No
Sam
ples
Col
lect
ed
Benchmark References 2010-2011
Historical Monitoring DataFrequency
Above Benchmarks
Mean Ratio to Benchmarks
Permit Requirement 2012-2013Analyte Units
Transitional Monitoring
2014-2015Water Quality Benchmarks

Wet Weather Historical Monitoring Table for BVC-TWAS-1
Blank spaces have been verified and no data is available.
NA indicate no criteria or published value was available or applicable to the matrix or program.
(b) Water Quality Benchmark is based on the San Diego Regional Water Quality Control Plan by watershed for the San Diego Region (Basin Plan), 1994 (with amendments effective on or before April 4, 2011) and may vary by hydrologic area.(c) Water Quality Benchmark for dissolved metal fractions are based on total hardness and are calculated as described by the USEPA Federal Register Doc. 40 CFR Part 131, May 18, 2000. The Criteria Maximum Concentration (CMC) was used.* Indicates detection limit above water quality benchmark.£ Historical results for Deltamethrin/Tralomethrin contain results reported by lab as Deltamethrin.J-Analyte was detected at a concentration below the reporting limit and above the method detection limit. Reported value is estimated.
SourcesPlease refer to the San Diego County Copermittee Regional Monitoring Program Benchmark Sources in Attachment B to Appendix A for benchmark source citations.
(a) Prior to the 2014-2015 monitoring year, Water Quality Benchmark was calculated based on CMC (salmonids absent) using pH described in the U.S. EPA, 1999 Update of Ambient Water Quality Criteria for Ammonia, EPA-822-R-99-014, December 1999. For 2014-2015 monitoring year, Water Quality Benchmark CMC was calculated based on pH and water temperature (when applicable) as described in the U.S. EPA, 2013 Aquatic Life Ambient Water Quality Criteria for Ammonia - Freshwater, EPA-822-R-13-001, April 2013.
Values with red bold font and shading do not meet Water Quality Benchmarks.

Wet Weather Historical Monitoring Table for ESC-TWAS-1
2008-2009 2009-2010 2010-2011 2011-2012 2012-2013 2013-2014 2014-2015
11/30/07 02/03/08 - - - - - - -
Physical Chemistry2007, 2013 pH pH units 6.5-9.0 1. Basin Plan 7.41 8.32 0% NA1
2007, 2013 Specific Conductivity µmhos/cm NA 252 1652007, 2013 Water Temperature Celsius NA 16.00 12.402007, 2013 Turbidity NTU 20 1. Basin Plan 114 82.2 100% NA1
Bacteriological2007, 2013 Enterococcus MPN/100 mL NA 80,000 23,0002007, 2013 Fecal Coliform MPN/100 mL 400 1. Basin Plan REC-1/REC-2 17,000 5,000 100% NA1
2007, 2013 Total Coliform MPN/100 mL NA 50,000 170,000Nutrients2007, 2013 Ammonia as N mg/L (a) 6. U.S. EPA Water Quality Criteria (Freshwater) 0.48 0.13 0% NA1
2007, 2013 Nitrate as N mg/L 10 1. Basin Plan 1.7 0.8 0% NA1
2007, 2013 Nitrite as N mg/L 1 1. Basin Plan 0.1 0.03J 0% NA1
2007, 2013 Total Kjeldahl Nitrogen mg/L NA 3.2 0.842007 Dissolved Phosphorus mg/L 2 4. MSGP 2015 0.3 0.12 0% NA1
2007, 2013 Total Phosphorus mg/L 2 4. MSGP 2015 0.60 0.33 0% NA1
General Chemistry2007 Biochemical Oxygen Demand mg/L 30 4. MSGP 2015, 8. McNeeley (1979) 15 2.8 0% NA1
2007 Chemical Oxygen Demand mg/L 120 4. MSGP 2000 62 19 0% NA1
2007, 2013 Dissolved Organic Carbon mg/L NA 13 42007, 2013 Total Organic Carbon mg/L NA 15.2 4.52007 Oil and Grease mg/L 10 1. Basin Plan, 3. Anacostia River TMDL, 4. MSGP 2015 4J 1.9J 0% NA1
2007, 2013 Surfactants (MBAS) mg/L 0.5 1. Basin Plan 0.34 0.12 0% NA1
2007, 2013 Total Dissolved Solids mg/L 500 (b) 1. Basin Plan 546 116 50% NA1
2007, 2013 Total Suspended Solids mg/L 100 4. MSGP 2015, 1. Basin Plan 180 96 50% NA1
2007, 2013 Hardness mg CaCO3/L NA 48.7 42.7Total Metals2007 Antimony mg/L NA 0.0012 0.00082007, 2013 Arsenic mg/L NA 0.0018 0.00132007, 2013 Cadmium mg/L NA 0.0002J <0.00042007, 2013 Chromium mg/L NA 0.0028 0.00172007, 2013 Copper mg/L NA 0.0180 0.01252007, 2013 Lead mg/L NA 0.0091 0.00622007, 2013 Nickel mg/L NA 0.0035 0.00192007, 2013 Selenium mg/L 0.005 16. 40 CFR 131.38 0.0004J 0.0002J2007, 2013 Zinc mg/L NA 0.1277 0.0926Dissolved Metals2007 Antimony mg/L 0.006 1. Basin Plan 0.0012 0.0008 0% NA1
2007, 2013 Arsenic mg/L 0.34 16. 40 CFR 131.38 0.0015 0.0010 0% NA1
2007, 2013 Cadmium mg/L (c) 16. 40 CFR 131.38 <0.0004 <0.0004 0% NA1
2007, 2013 Chromium mg/L (c) 16. 40 CFR 131.38 0.0007 0.0006 0% NA1
2007, 2013 Copper mg/L (c) 16. 40 CFR 131.38 0.0053 0.0034 0% NA1
2007, 2013 Lead mg/L (c) 16. 40 CFR 131.38 0.0003 <0.00007 0% NA1
2007, 2013 Nickel mg/L (c) 16. 40 CFR 131.38 0.0015 0.0007 0% NA1
2007, 2013 Selenium mg/L NA 0.0004J 0.0002J2007, 2013 Zinc mg/L (c) 16. 40 CFR 131.38 0.0262 0.0186 0% NA1
Organophosphorus Pesticides
2007, 2013 Chlorpyrifos µg/L 0.02 acute / 0.014 chronic 12. CA Dept. of Fish & Game, 2000 <0.002 <0.002 0% NA1
2007, 2013 Diazinon µg/L 0.08 acute / 0.05 chronic
12. CA Dept. of Fish & Game, 2000, 11. Chollas Creek TMDL for Diazinon, 10. USEPA, Aquatic Life Ambient
Water Quality Criteria Diazinon0.067 0.042 0% NA1
2007, 2013 Malathion µg/L 0.43 13. CA Dept. of Fish & Game, 1998, 5. Goldbook 0.175 0.048 0% NA1
Pyrethroids2007, 2013 Allethrin µg/L NA <0.002 <0.0022007, 2013 Bifenthrin µg/L 0.0093 15. Anderson et al., 2006 0.0428 0.0532 100% NA1
2007, 2013 Cyfluthrin µg/L 0.344 17. Wheelock et al., 2004 0.02 0.02 0% NA1
2007, 2013 Cyhalothrin, Total Lambda µg/L 0.20 17. Wheelock et al., 2004 0.006 0.003 0% NA1
2007, 2013 Cypermethrin µg/L 0.683 17. Wheelock et al., 2004 0.02 <0.0022007, 2013 Danitol (Fenpropathrin) µg/L NA <0.002 <0.0022007, 2013 Deltamethrin/Tralomethrin£ µg/L NA <0.002 <0.0022007, 2013 Esfenvalerate µg/L 0.25 17. Wheelock et al., 2004 <0.002 0.0007J 0% NA1
2007, 2013 Fenvalerate µg/L NA <0.002 <0.0022007, 2013 Fluvalinate µg/L NA <0.002 <0.0022007, 2013 Permethrin µg/L 0.021 15. Anderson et al., 2006 <0.025* <0.025* 0% NA1
2007, 2013 Prallethrin µg/L NA <0.002 <0.0022007, 2013 Resmethrin µg/L NA <0.025Toxicity2007, 2013 Ceriodaphnia 96-hr LC50 (%) >100 >100 >100 0% NA1
2007, 2013 Ceriodaphnia 7-day survival NOEC (%) 100 100 100 0% NA1
2007, 2013 Ceriodaphnia 7-day reproduction NOEC (%) 100 100 100 0% NA1
2007 Hyalella 96-hr LC50 (%) >100 >100 >100 0% NA1
2007, 2013 Selenastrum 96-hr NOEC (%) 100 100 100 0% NA1
See last page for footnotes and source references.
No
Sam
ples
Col
lect
ed
AnalyteFrequency
Above Benchmarks
Mean Ratio to Benchmarks
Transitional Monitoring
No
Sam
ples
Col
lect
ed
No
Sam
ples
Col
lect
ed
Water Quality Benchmarks
No
Sam
ples
Col
lect
ed
Historical Monitoring Data
Benchmark ReferencesUnits
No
Sam
ples
Col
lect
ed
2007-2008
No
Sam
ples
Col
lect
ed
No
Sam
ples
Col
lect
ed
Permit Requirement

Wet Weather Historical Monitoring Table for ESC-TWAS-1
Blank spaces have been verified and no data is available.
NA indicate no criteria or published value was available or applicable to the matrix or program.
(b) Water Quality Benchmark is based on the San Diego Regional Water Quality Control Plan by watershed for the San Diego Region (Basin Plan), 1994 (with amendments effective on or before April 4, 2011) and may vary by hydrologic area.(c) Water Quality Benchmark for dissolved metal fractions are based on total hardness and are calculated as described by the USEPA Federal Register Doc. 40 CFR Part 131, May 18, 2000. The Criteria Maximum Concentration (CMC) was used.* Indicates detection limit above water quality benchmark.£ Historical results for Deltamethrin/Tralomethrin contain results reported by lab as Deltamethrin.J-Analyte was detected at a concentration below the reporting limit and above the method detection limit. Reported value is estimated.NA1 Three or more years of data required to calculate the Mean Ratio to Benchmark.
SourcesPlease refer to the San Diego County Copermittee Regional Monitoring Program Benchmark Sources in Attachment B to Appendix A for benchmark source citations.
(a) Prior to the 2014-2015 monitoring year, Water Quality Benchmark was calculated based on CMC (salmonids absent) using pH described in the U.S. EPA, 1999 Update of Ambient Water Quality Criteria for Ammonia, EPA-822-R-99-014, December 1999. For 2014-2015 monitoring year, Water Quality Benchmark CMC was calculated based on pH and water temperature (when applicable) as described in the U.S. EPA, 2013 Aquatic Life Ambient Water Quality Criteria for Ammonia - Freshwater, EPA-822-R-13-001, April 2013.
Values with red bold font and shading do not meet Water Quality Benchmarks

Wet Weather Historical Monitoring Table for ESC-MLS
11/29/01 02/17/02 03/08/02 11/08/02 02/11/03 02/25/03 11/12/03 02/03/04 03/02/04 10/17/04 02/11/05 02/18/05 10/17/05 02/19/06 03/11/06
Physical Chemistry2013 Dissolved Oxygen mg/L <6.0 (a) 1. Basin Plan2007, 2013 pH pH units 6.5-9.0 1. Basin Plan 7.7 7.7 7.7 7.55 7.46 7.41 7.78 8.02 7.83 7.91 8.16 8.10 7.80 6.70 7.692007, 2013 Specific Conductivity µmhos/cm NA 1,810 2,540 1,620 1,826 1,192 1,675 1,736 1,452 1,595 2,860 2,530 1,390 2,550 1,618 7782007, 2013 Water Temperature Celsius NA 15.30 14.60 16.80 16.00 12.10 12.50 17.80 13.60 14.20 17.00 9.70 12.102007, 2013 Turbidity NTU 20 1. Basin Plan 31.3 4.33 24.5 38.3 111 192 40.1 116 26 15.4 13.4 117 30.9 39.3 137Bacteriological2007, 2013 Enterococcus MPN/100 mL NA 8,000 1,400 17,000 50,000 80,000 80,000 22,000 170,000 80,000 8,000 1,700 50,000 80,000 5,000 90,0002007, 2013 Fecal Coliform MPN/100 mL 400 1.Basin Plan REC-1/REC-2 3,000 8,000 1,700 13,000 23,000 22,000 17,000 23,000 17,000 1,300 1,100 50,000 80,000 17,000 17,0002007, 2013 Total Coliform MPN/100 mL NA 50,000 30,000 8,000 30,000 50,000 80,000 70,000 30,000 80,000 17,000 13,000 230,000 130,000 300,000 170,000Nutrients2007, 2013 Ammonia as N mg/L (b) 6. USEPA Water Quality Criteria (Freshwater) 0.4 0.19 0.18 0.29 0.32 0.41 <0.1 0.18 1.2 0.33 0.26 0.32 0.95 0.23 <0.12007, 2013 Nitrate as N mg/L 10 1. Basin Plan 2.6 3.2 2.2 2.32 0.95 2.25 1.72 1.66 3.8 2.71 7.2 6.32 4.63 3.77 4.152007, 2013 Nitrite as N mg/L 1 1. Basin Plan <0.05 <0.05 <0.05 <0.05 0.08 <0.05 <0.05 <0.05 <0.05 <0.05 <0.05 <0.05 0.05 0.05 0.062007, 2013 Total Kjeldahl Nitrogen mg/L NA 2.1 1.2 1.6 1.6 2.0 1.7 3.2 4.2 1.7 2 0.7 3 3 6.5 1.32007 Dissolved Phosphorus mg/L 2 4. MSGP 2015 0.29 <0.05 0.14 0.32 0.32 0.13 0.36 0.25 0.22 0.26 <0.05 <0.05 0.42 0.36 0.262013 Orthophosphate mg/L NA2007, 2013 Total Phosphorus mg/L 2 4. MSGP 2015 1.75 0.8 0.29 0.49 0.62 0.72 0.46 0.52 0.3 0.28 0.26 0.62 0.44 0.39 0.5General Chemistry2007 Biochemical Oxygen Demand mg/L 30 4. MSGP 2015, 8. McNeeley (1979) 5.2 4.4 5.3 4.07 9.93 5.00 4.4 43.1 21.7 6.26 3.32 5.2 7.62 4.54 7.292007 Chemical Oxygen Demand mg/L 120 4. MSGP 2015 <25 25 40 73 51 69 45 126 59 68 37 42 75 64 692007, 2013 Dissolved Organic Carbon mg/L NA 4.1 11.1 9.86 10.9 6.31 13.4 29 3.86 6.47 5.66 18.2 5.562007, 2013 Total Organic Carbon mg/L NA 14.5 14.0 8.04 11.1 13.1 12.7 34 6.9 13.8 32.2 18.2 14.12007 Oil and Grease mg/L 10 1. Basin Plan, 3. Anacostia River TMDL, 4. MSGP 2015 <1 <1 1 <1.00 1.16 <1.00 <1 <1 <1 <1 <1 <1 <1 <1 <12013 Sulfate mg/L 250 (a) 1. Basin Plan2007, 2013 Surfactants (MBAS) mg/L 0.5 1. Basin Plan <0.5 <0.5 <0.5 <0.1 <0.1 <0.1 <0.5 <0.5 <0.5 <0.5 <0.5 <0.5 <0.5 <0.5 <0.52007, 2013 Total Dissolved Solids mg/L 500 (a) 1. Basin Plan 1,150 1,460 1,160 1,360 681 717 1,300 665 1,310 1,460 1,410 965 1,220 844 9292007, 2013 Total Suspended Solids mg/L 100 4. MSGP 2015, 1. Basin Plan 53 <20 60 54 150 221 75 <20 55 60 72 264 102 36 1552007, 2013 Total Hardness mg CaCO3/L NA 564 681 532 530 365 388 610 284 547 700 663 514 668 447 502Total Metals2007 Antimony mg/L NA <0.002 <0.002 <0.002 <0.002 0.003 0.004 <0.005 <0.005 <0.005 0.005 <0.005 <0.005 <0.005 <0.005 <0.0052007, 2013 Arsenic mg/L NA <0.001 <0.001 0.002 0.003 0.003 0.004 0.003 0.004 0.003 0.003 0.004 <0.002 0.004 0.002 0.0052007, 2013 Cadmium mg/L NA <0.001 <0.001 <0.001 <0.001 <0.001 <0.001 <0.001 <0.001 <0.001 <0.001 <0.001 <0.001 <0.001 0.002 0.0092007, 2013 Chromium mg/L NA 0.006 <0.005 <0.005 <0.005 0.008 <0.005 <0.005 <0.005 <0.005 <0.005 <0.005 <0.005 <0.005 <0.005 <0.0052007, 2013 Copper mg/L NA <0.006 <0.005 0.009 0.009 0.015 0.019 0.009 0.018 0.006 0.008 0.022 0.02 0.012 0.009 0.012013 Iron mg/L 0.3 (a) 1. Basin Plan2007, 2013 Lead mg/L NA <0.002 <0.002 <0.002 0.005 0.005 0.005 0.002 0.006 <0.002 <0.002 0.002 0.005 0.004 <0.002 0.0052013 Manganese mg/L 0.05 (a) 1. Basin Plan2013 Mercury mg/L NA2007, 2013 Nickel mg/L NA 0.002 0.002 0.004 0.004 0.004 0.006 0.004 0.003 <0.002 0.004 0.002 0.003 0.004 0.003 0.0042007, 2013 Selenium mg/L 0.005 16. 40 CFR 131.38 <0.002 <0.002 <0.002 <0.004 <0.004 <0.004 <0.005 <0.005 <0.005 <0.005 <0.005 <0.005 <0.005 <0.005 <0.0052013 Thallium mg/L NA2007, 2013 Zinc mg/L NA <0.020 <0.020 0.028 0.022 0.046 0.066 0.033 0.065 <0.02 0.020 0.022 0.052 0.030 0.038 0.079Dissolved Metals2007 Antimony mg/L 0.006 1. Basin Plan <0.002 <0.002 <0.002 <0.002 0.002 0.002 <0.005 <0.005 <0.005 <0.005 <0.005 <0.005 <0.005 <0.005 <0.0052007, 2013 Arsenic mg/L 0.34 16. 40 CFR 131.38 <0.001 <0.001 0.002 0.002 0.002 0.002 <0.002 0.002 <0.002 <0.002 <0.002 <0.002 <0.001 <0.001 <0.0012007, 2013 Cadmium mg/L (c) 16. 40 CFR 131.38 <0.001 <0.001 <0.001 <0.001 <0.001 <0.001 <0.001 <0.001 <0.001 <0.001 <0.001 <0.001 <0.001 <0.001 0.0012007, 2013 Chromium mg/L (c) 16. 40 CFR 131.38 0.005 <0.005 <0.005 <0.005 <0.005 <0.005 <0.005 <0.005 <0.005 <0.005 <0.005 <0.005 <0.005 <0.005 <0.0052007, 2013 Copper mg/L (c) 16. 40 CFR 131.38 <0.005 0.012 0.005 <0.005 0.049 0.008 <0.005 0.005 <0.005 <0.005 0.007 <0.005 0.005 0.007 <0.0052013 Iron mg/L NA2007, 2013 Lead mg/L (c) 16. 40 CFR 131.38 <0.002 <0.002 <0.002 <0.002 <0.002 <0.002 <0.002 <0.002 <0.002 <0.002 <0.002 <0.002 <0.002 <0.002 <0.0022013 Manganese mg/L NA2013 Mercury mg/L NA2007, 2013 Nickel mg/L (c) 16. 40 CFR 131.38 0.002 0.005 0.002 0.003 0.002 <0.002 0.002 0.002 0.002 0.003 0.002 <0.002 0.003 0.003 0.0022007, 2013 Selenium mg/L NA <0.002 <0.002 <0.002 <0.004 <0.004 <0.004 <0.005 <0.005 <0.005 <0.005 <0.005 <0.005 <0.005 <0.005 <0.0052013 Thallium mg/L NA2007, 2013 Zinc mg/L (c) 16. 40 CFR 131.38 <0.020 <0.020 <0.020 <0.020 0.230 0.022 <0.02 <0.02 <0.02 <0.02 <0.02 <0.02 0.03 0.023 0.03
Historical Monitoring Data
2004-2005 2005-20062001-2002
Permit Requirement Analyte Units Water Quality
Benchmarks Benchmark References2003-20042002-2003

Wet Weather Historical Monitoring Table for ESC-MLS
11/29/01 02/17/02 03/08/02 11/08/02 02/11/03 02/25/03 11/12/03 02/03/04 03/02/04 10/17/04 02/11/05 02/18/05 10/17/05 02/19/06 03/11/06
Historical Monitoring Data
2004-2005 2005-20062001-2002
Permit Requirement Analyte Units Water Quality
Benchmarks Benchmark References2003-20042002-2003
Chlorinated Pesticides2013 2,4'-DDE µg/L NA2013 2,4'-DDT µg/L NA 16. 40 CFR 131.382013 4,4´-DDE µg/L NA2013 4,4´-DDT µg/L 1.1 16. 40 CFR 131.38Organophosphorus Pesticides2013 Azinphos methyl (Guthion) µg/L NA2013 Bolstar µg/L NA
2007, 2013 Chlorpyrifos µg/L 0.02 acute / 0.014 chronic 12. CA Dept. of Fish & Game, 2000 <0.03* <0.03* <0.03* <0.03* <0.03* 0.030 <0.01 <0.01 <0.01 <0.01 <0.01 <0.01 <0.01 <0.02 <0.02
2013 Coumaphos µg/L NA2013 Demeton-o µg/L NA2013 Demeton-s µg/L NA
2007, 2013 Diazinon µg/L 0.08 acute / 0.05 chronic
12. CA Dept. of Fish & Game, 2000, 11. Chollas Creek TMDL for Diazinon, 10. USEPA, Aquatic Life Ambient
Water Quality Criteria Diazinon0.94 0.27 0.27 0.122 0.163 0.063 0.061 0.067 0.037 <0.01 <0.01 <0.01 <0.01 0.045 <0.02
2013 Dichlorvos µg/L NA2013 Dimethoate µg/L NA2013 Disulfoton µg/L NA2013 Ethoprop µg/L NA2013 Ethyl parathion µg/L NA2013 Fensulfothion µg/L NA2013 Fenthion µg/L NA2007, 2013 Malathion µg/L 0.43 13. CA Dept. of Fish & Game, 1998, 5. Goldbook <0.10 <0.10 <0.10 0.205 0.037 0.047 <0.01 <0.01 <0.01 0.052 <0.02 <0.022013 Merphos µg/L NA2013 Methyl parathion µg/L NA2013 Mevinphos µg/L NA2013 Naled µg/L NA2013 Phorate µg/L NA2013 Ronnel µg/L NA2013 Stirophos µg/L NA2013 Tokuthion (Prothiofos) µg/L NA2013 Trichloronate µg/L NAPyrethroids2007, 2013 Allethrin µg/L NA2007, 2013 Bifenthrin µg/L 0.0093 15. Anderson et al., 20062007, 2013 Cyfluthrin µg/L 0.344 17. Wheelock et al., 20042007, 2013 Cyhalothrin, Total Lambda µg/L 0.20 17. Wheelock et al., 20042007, 2013 Cypermethrin µg/L 0.683 17. Wheelock et al., 20042007, 2013 Danitol (Fenpropathrin) µg/L NA2007, 2013 Deltamethrin/Tralomethrin µg/L NA2007, 2013 Esfenvalerate µg/L 0.25 17. Wheelock et al., 20042007, 2013 Fenvalerate µg/L NA2007, 2013 Fluvalinate µg/L NA2007, 2013 Permethrin µg/L 0.021 15. Anderson et al., 20062007, 2013 Prallethrin µg/L NA2007, 2013 Resmethrin µg/L NAToxicity2007, 2013 Ceriodaphnia 96-hr LC50 (%) >100 35.36 >100 >100 >100 >100 >100 >100 >100 > 100 >100 >100 >100 >100 >100 >1002007, 2013 Ceriodaphnia 7-day survival NOEC (%) 100 25 50 100 100 100 100 100 100 100 100 100 100 100 100 1002013 Ceriodaphnia 7-day survival TST Pass/Fail2007, 2013 Ceriodaphnia 7-day reproduction NOEC (%) 100 25 100 100 100 100 100 100 100 100 100 100 100 100 100 1002013 Ceriodaphnia 7-day reproduction TST Pass/Fail2007 Hyalella 96-hr LC50 (%) >100 >100 >100 >100 >100 >100 >100 >100 >100 >100 >100 >100 >100 >100 >100 >1002007, 2013 Selenastrum 96-hr NOEC (%) 100 100 100 100 100 100 100 100 100 100 100 100 100 100 100 1002013 Selenastrum 96-hr TST Pass/Fail2013 Pimephale s 7-day survival TST Pass/Fail2013 Pimephales 7-day biomass TST Pass/Fail2013 Strongylocentrotus 96-hr TST Pass/FailSee last page for footnotes and source references.

Wet Weather Historical Monitoring Table for ESC-MLS
Physical Chemistry2013 Dissolved Oxygen mg/L <6.0 (a) 1. Basin Plan2007, 2013 pH pH units 6.5-9.0 1. Basin Plan2007, 2013 Specific Conductivity µmhos/cm NA2007, 2013 Water Temperature Celsius NA2007, 2013 Turbidity NTU 20 1. Basin PlanBacteriological2007, 2013 Enterococcus MPN/100 mL NA2007, 2013 Fecal Coliform MPN/100 mL 400 1.Basin Plan REC-1/REC-2 2007, 2013 Total Coliform MPN/100 mL NANutrients2007, 2013 Ammonia as N mg/L (b) 6. USEPA Water Quality Criteria (Freshwater)2007, 2013 Nitrate as N mg/L 10 1. Basin Plan2007, 2013 Nitrite as N mg/L 1 1. Basin Plan2007, 2013 Total Kjeldahl Nitrogen mg/L NA2007 Dissolved Phosphorus mg/L 2 4. MSGP 20152013 Orthophosphate mg/L NA2007, 2013 Total Phosphorus mg/L 2 4. MSGP 2015General Chemistry2007 Biochemical Oxygen Demand mg/L 30 4. MSGP 2015, 8. McNeeley (1979)2007 Chemical Oxygen Demand mg/L 120 4. MSGP 20152007, 2013 Dissolved Organic Carbon mg/L NA2007, 2013 Total Organic Carbon mg/L NA2007 Oil and Grease mg/L 10 1. Basin Plan, 3. Anacostia River TMDL, 4. MSGP 20152013 Sulfate mg/L 250 (a) 1. Basin Plan2007, 2013 Surfactants (MBAS) mg/L 0.5 1. Basin Plan2007, 2013 Total Dissolved Solids mg/L 500 (a) 1. Basin Plan2007, 2013 Total Suspended Solids mg/L 100 4. MSGP 2015, 1. Basin Plan2007, 2013 Total Hardness mg CaCO3/L NATotal Metals2007 Antimony mg/L NA2007, 2013 Arsenic mg/L NA2007, 2013 Cadmium mg/L NA2007, 2013 Chromium mg/L NA2007, 2013 Copper mg/L NA2013 Iron mg/L 0.3 (a) 1. Basin Plan2007, 2013 Lead mg/L NA2013 Manganese mg/L 0.05 (a) 1. Basin Plan2013 Mercury mg/L NA2007, 2013 Nickel mg/L NA2007, 2013 Selenium mg/L 0.005 16. 40 CFR 131.382013 Thallium mg/L NA2007, 2013 Zinc mg/L NADissolved Metals2007 Antimony mg/L 0.006 1. Basin Plan2007, 2013 Arsenic mg/L 0.34 16. 40 CFR 131.382007, 2013 Cadmium mg/L (c) 16. 40 CFR 131.382007, 2013 Chromium mg/L (c) 16. 40 CFR 131.382007, 2013 Copper mg/L (c) 16. 40 CFR 131.382013 Iron mg/L NA2007, 2013 Lead mg/L (c) 16. 40 CFR 131.382013 Manganese mg/L NA2013 Mercury mg/L NA2007, 2013 Nickel mg/L (c) 16. 40 CFR 131.382007, 2013 Selenium mg/L NA2013 Thallium mg/L NA2007, 2013 Zinc mg/L (c) 16. 40 CFR 131.38
Permit Requirement Analyte Units Water Quality
Benchmarks Benchmark References2008-2009 2009-2010 2011-2012
10/14/06 01/31/07 02/19/07 11/30/07 02/03/08-02/04/08 11/04/08 - 10/06/10-
10/07/10 02/16/11 - 10/12/12 02/08/13-02/09/13
7.50 8.01 6.97 7.57 8.38 7.78 8.09 7.95 8.04 8.222,400 1,654 1,086 496 1,759 2,770 2,410 1,620 2,510 1,57215.40 13.70 14.30 16.10 12.10 14.80 18.10 15.00 18.6 11.857.5 52 62.3 126 75.3 14.6 6.7 4.8 5.2 5.5
80,000 5,000 110,000 130,000 3,000 30,000 13,000 3000 5,000 5,00023,000 2,800 4,000 110,000 1,100 30,000 17,000 3,000 3,000 5,000
130,000 14,000 170,000 800,000 22,000 80,000 170,000 30000 70,000 50,000
0.44 1.41 1.24 0.38 0.1 0.08 0.099J 0.18 0.26 0.15.3 <0.05 2.38 1.6 1.6 3.57 2.2 5.1 3.8 3.6
<0.05 0.1 0.05 0.08 0.03J 0.04J 0.062J 0.15 0.13 0.031J1.8 3 2.4 2.9 1.1 1.4 1 1.2 1.3 0.61
0.35 0.35 0.28 0.51 0.33 0.148 0.19 0.16 0.16 0.094
0.4 0.52 0.4 0.63 0.46 0.22 0.21 0.24 0.26 0.13
14.5 33.1 8.8 9.1 5.5 5.5 1.9J 4.5 7.6 1.6J58 116 37 47 24 39 33 29 33 22
76.9 27.3 10.7 13.1 6.9 8.8 10 8.4 8.6 5.177.1 31.9 11 14.6 6.6 8.8 11 9.3 8.8 5.2<5 <5 <5 3.1J 1.5J 1J <5 2.3J <5 <5
<0.5 <0.5 <0.5 0.28 0.107 0.138 0.11 0.2 0.044J 0.0531,590 715 748 448 364 1,686 1,600 1,200 1,700 1,300
97 103 65 160 46 22 23 54 76 26772 331 329 95.7 87.6 671.6 670 560 724 578
0.002 0.002 0.003 0.001 0.0007 0.0004J 0.00057 0.00058 0.0004J 0.00037J0.01 <0.001 0.002 0.0023 0.0015 0.0023 0.0018 0.0013 0.0018 0.0011
0.003 <0.001 0.001 0.0003J <0.0004 0.0003J 0.00057 0.00015 0.00033 0.0002<0.005 <0.005 <0.005 0.0023 0.0011 0.0004J 0.00059 0.00099 0.00068 0.000670.008 0.014 0.026 0.015 0.0068 0.005 0.0047 0.006 0.004 0.004
0.002 0.005 0.005 0.0067 0.0025 0.0006 0.00067 0.00094 0.0013 0.00052
0.004 0.004 0.005 0.0036 0.0014 0.0022 0.0034 0.0041 0.0024 0.0043<0.004 <0.004 <0.004 0.0006 0.0004J 0.0015 0.0011 0.0013 0.002 0.0021
0.026 0.061 0.08 0.083 0.033 0.017 0.01 0.013 0.015 0.0089
<0.002 <0.002 0.002 0.0009 0.0008 0.0004J 0.00057 0.00057 0.0004J 0.00035J<0.001 <0.001 <0.001 0.0017 0.0013 0.0019 0.0016 0.0011 0.0018 0.00092<0.001 <0.001 <0.001 <0.0004 <0.0004 0.0002J 0.00035 0.000053J 0.00012 0.00012<0.005 <0.005 <0.005 0.0005 0.0006 0.0001J 0.00014J 0.00039 0.00008J 0.00020.004 0.007 0.005 0.0048 0.0037 0.0032 0.003 0.0041 0.002 0.0027
<0.001 <0.001 <0.001 0.00027 <0.0001 <0.0001 0.000045J <0.0002 <0.0002 0.000021J
0.002 <0.002 <0.002 0.0014 0.0009 0.0019 0.0027 0.0037 0.0017 0.0036<0.004 <0.004 <0.004 0.0007 0.0004J 0.0014 0.0011 0.0013 0.0017 0.0018
<0.02 <0.02 0.07 0.0134 0.0068 0.0075 0.0053 0.0036J 0.0047J 0.0044J
2010-20112006-2007
Historical Monitoring Data
No
Sam
ples
Col
lect
ed
No
Sam
ples
Col
lect
ed
2012-20132007-2008

Wet Weather Historical Monitoring Table for ESC-MLS
Permit Requirement Analyte Units Water Quality
Benchmarks Benchmark References
Chlorinated Pesticides2013 2,4'-DDE µg/L NA2013 2,4'-DDT µg/L NA 16. 40 CFR 131.382013 4,4´-DDE µg/L NA2013 4,4´-DDT µg/L 1.1 16. 40 CFR 131.38Organophosphorus Pesticides2013 Azinphos methyl (Guthion) µg/L NA2013 Bolstar µg/L NA
2007, 2013 Chlorpyrifos µg/L 0.02 acute / 0.014 chronic 12. CA Dept. of Fish & Game, 2000
2013 Coumaphos µg/L NA2013 Demeton-o µg/L NA2013 Demeton-s µg/L NA
2007, 2013 Diazinon µg/L 0.08 acute / 0.05 chronic
12. CA Dept. of Fish & Game, 2000, 11. Chollas Creek TMDL for Diazinon, 10. USEPA, Aquatic Life Ambient
Water Quality Criteria Diazinon2013 Dichlorvos µg/L NA2013 Dimethoate µg/L NA2013 Disulfoton µg/L NA2013 Ethoprop µg/L NA2013 Ethyl parathion µg/L NA2013 Fensulfothion µg/L NA2013 Fenthion µg/L NA2007, 2013 Malathion µg/L 0.43 13. CA Dept. of Fish & Game, 1998, 5. Goldbook2013 Merphos µg/L NA2013 Methyl parathion µg/L NA2013 Mevinphos µg/L NA2013 Naled µg/L NA2013 Phorate µg/L NA2013 Ronnel µg/L NA2013 Stirophos µg/L NA2013 Tokuthion (Prothiofos) µg/L NA2013 Trichloronate µg/L NAPyrethroids2007, 2013 Allethrin µg/L NA2007, 2013 Bifenthrin µg/L 0.0093 15. Anderson et al., 20062007, 2013 Cyfluthrin µg/L 0.344 17. Wheelock et al., 20042007, 2013 Cyhalothrin, Total Lambda µg/L 0.20 17. Wheelock et al., 20042007, 2013 Cypermethrin µg/L 0.683 17. Wheelock et al., 20042007, 2013 Danitol (Fenpropathrin) µg/L NA2007, 2013 Deltamethrin/Tralomethrin µg/L NA2007, 2013 Esfenvalerate µg/L 0.25 17. Wheelock et al., 20042007, 2013 Fenvalerate µg/L NA2007, 2013 Fluvalinate µg/L NA2007, 2013 Permethrin µg/L 0.021 15. Anderson et al., 20062007, 2013 Prallethrin µg/L NA2007, 2013 Resmethrin µg/L NAToxicity2007, 2013 Ceriodaphnia 96-hr LC50 (%) >1002007, 2013 Ceriodaphnia 7-day survival NOEC (%) 1002013 Ceriodaphnia 7-day survival TST Pass/Fail2007, 2013 Ceriodaphnia 7-day reproduction NOEC (%) 1002013 Ceriodaphnia 7-day reproduction TST Pass/Fail2007 Hyalella 96-hr LC50 (%) >1002007, 2013 Selenastrum 96-hr NOEC (%) 1002013 Selenastrum 96-hr TST Pass/Fail2013 Pimephale s 7-day survival TST Pass/Fail2013 Pimephales 7-day biomass TST Pass/Fail2013 Strongylocentrotus 96-hr TST Pass/FailSee last page for footnotes and source references.
2008-2009 2009-2010 2011-2012
10/14/06 01/31/07 02/19/07 11/30/07 02/03/08-02/04/08 11/04/08 - 10/06/10-
10/07/10 02/16/11 - 10/12/12 02/08/13-02/09/13
2010-20112006-2007
Historical Monitoring Data
2012-20132007-2008
<0.002 <0.002 <0.002 <0.002 <0.002 <0.002 <0.01 <0.01 <0.01 <0.01
<0.004 <0.004 <0.004 0.015 0.007 <0.004 <0.01 <0.01 <0.01 <0.01
0.032 <0.006 <0.006 0.136 0.038 <0.006 <0.01 0.026 <0.01 <0.01
<0.002 <0.002 <0.002 <0.002 <0.002 <0.002 <0.0020.0907 0.0108 <0.002 <0.002 0.0081 0.0018J 0.0107
0.01 <0.002 <0.002 <0.002 <0.002 <0.002 <0.0020.002J 0.0005J <0.002 <0.002 <0.002 <0.002 <0.002<0.002 <0.002 <0.002 <0.002 <0.002 <0.002 <0.0020.003 <0.002 <0.002 <0.002 <0.002 <0.002
<0.002 <0.002 <0.002 <0.002 <0.002 <0.002 <0.0020.0006J <0.002 <0.002 <0.002 <0.002 <0.002 <0.0020.0008J <0.002 <0.002 <0.002 <0.002 <0.002 <0.0020.0011J <0.002 <0.002 <0.002 <0.002 <0.002<0.025* <0.025* <0.025* <0.005 <0.025* <0.025†† <0.01<0.002 <0.002 <0.002 <0.002 <0.002 <0.002 <0.002
<0.025 <0.025 <0.01
>100 >100 >100 >100 >100 >100 >100 >100 >100 >100100 100 100 100 100 100 100 100 100 100
100 100 100 100 100 100 100 100 100 100
>100 >100 >100 >100 >100 >100 >100 >100 >100 >100100 100 100 100 100 100 100 100 100 100
No
Sam
ples
Col
lect
ed
No
Sam
ples
Col
lect
ed

Wet Weather Historical Monitoring Table for ESC-MLS
Physical Chemistry2013 Dissolved Oxygen mg/L <6.0 (a) 1. Basin Plan2007, 2013 pH pH units 6.5-9.0 1. Basin Plan2007, 2013 Specific Conductivity µmhos/cm NA2007, 2013 Water Temperature Celsius NA2007, 2013 Turbidity NTU 20 1. Basin PlanBacteriological2007, 2013 Enterococcus MPN/100 mL NA2007, 2013 Fecal Coliform MPN/100 mL 400 1.Basin Plan REC-1/REC-2 2007, 2013 Total Coliform MPN/100 mL NANutrients2007, 2013 Ammonia as N mg/L (b) 6. USEPA Water Quality Criteria (Freshwater)2007, 2013 Nitrate as N mg/L 10 1. Basin Plan2007, 2013 Nitrite as N mg/L 1 1. Basin Plan2007, 2013 Total Kjeldahl Nitrogen mg/L NA2007 Dissolved Phosphorus mg/L 2 4. MSGP 20152013 Orthophosphate mg/L NA2007, 2013 Total Phosphorus mg/L 2 4. MSGP 2015General Chemistry2007 Biochemical Oxygen Demand mg/L 30 4. MSGP 2015, 8. McNeeley (1979)2007 Chemical Oxygen Demand mg/L 120 4. MSGP 20152007, 2013 Dissolved Organic Carbon mg/L NA2007, 2013 Total Organic Carbon mg/L NA2007 Oil and Grease mg/L 10 1. Basin Plan, 3. Anacostia River TMDL, 4. MSGP 20152013 Sulfate mg/L 250 (a) 1. Basin Plan2007, 2013 Surfactants (MBAS) mg/L 0.5 1. Basin Plan2007, 2013 Total Dissolved Solids mg/L 500 (a) 1. Basin Plan2007, 2013 Total Suspended Solids mg/L 100 4. MSGP 2015, 1. Basin Plan2007, 2013 Total Hardness mg CaCO3/L NATotal Metals2007 Antimony mg/L NA2007, 2013 Arsenic mg/L NA2007, 2013 Cadmium mg/L NA2007, 2013 Chromium mg/L NA2007, 2013 Copper mg/L NA2013 Iron mg/L 0.3 (a) 1. Basin Plan2007, 2013 Lead mg/L NA2013 Manganese mg/L 0.05 (a) 1. Basin Plan2013 Mercury mg/L NA2007, 2013 Nickel mg/L NA2007, 2013 Selenium mg/L 0.005 16. 40 CFR 131.382013 Thallium mg/L NA2007, 2013 Zinc mg/L NADissolved Metals2007 Antimony mg/L 0.006 1. Basin Plan2007, 2013 Arsenic mg/L 0.34 16. 40 CFR 131.382007, 2013 Cadmium mg/L (c) 16. 40 CFR 131.382007, 2013 Chromium mg/L (c) 16. 40 CFR 131.382007, 2013 Copper mg/L (c) 16. 40 CFR 131.382013 Iron mg/L NA2007, 2013 Lead mg/L (c) 16. 40 CFR 131.382013 Manganese mg/L NA2013 Mercury mg/L NA2007, 2013 Nickel mg/L (c) 16. 40 CFR 131.382007, 2013 Selenium mg/L NA2013 Thallium mg/L NA2007, 2013 Zinc mg/L (c) 16. 40 CFR 131.38
Permit Requirement Analyte Units Water Quality
Benchmarks Benchmark References
Long Term and
Transitional Monitoring
Long Term and
Transitional Monitoring
Long Term Monitoring
Only
Long Term and
Transitional Monitoring
2013-2014
- 11/1/14 11/21/14-11/22/14
03/01/15-03/02/15
7.31 8.26 9.07 0% NA1
7.66 7.71 7.76 0% 0.202,548 2,397 69614.76 15.72 13.58
4.3 19.6 12.4 61% 2.47
170 300 50,00030,000 80 35,000 96% 49.8330,000 110 160,000
0.16 0.12 0.057J 0% 0.031.4 3.1 1.5 0% 0.30
0.036J 0.063J 0.032J 0% 0.052.1 1.6 1
0.44 NR 0.24 0% 0.120.36 0.27 0.220.44 0.44 0.39 0% 0.24
3.2 NR 2.7 7% 0.2963 NR 41 4% 0.4313 16 9.114 16 9.7
<5.0 NR <5.0 0% 0.14410 290 150 67% NA1
0.081 0.15 0.094 0% 0.371,400 990 590 93% 2.21110 25 44 29% 0.80662 424 281
0.00059 NR 0.000870.002 0.0016 0.0012
0.00023 0.00065 0.000230.0026 0.0009 0.00130.013 0.009 0.0083
3.5 0.87 1.4 100% NA1
0.0023 0.001 0.00150.59 0.22 0.24 100% NA1
0.000017J <0.000050 0.000011J0.0037 0.0041 0.00280.003 0.0021 0.0012 0% 0.38
0.000034J <0.00020 0.000014J0.035 0.018 0.019
0.00036J NR 0.00073 0% 0.240.0012 0.0015 0.00091 0% 0.00
0.000038J 0.00041 0.000085J 0% 0.030.00016J 0.00031 0.00037 0% 0.000.0038 0.0065 0.0039 4% 0.150.047 0.068 0.056
0.000040J 0.000099J 0.000082J 0% 0.000.017 0.029 0.033
0.000012J <0.000050 0.0000080J0.0018 0.0035 0.0017 0% 0.000.0023 0.0021 0.00082
<0.00020 <0.00020 <0.000200.0063 0.0085 0.0054 0% 0.06
Frequency Above
Benchmarks
Mean Ratio to Benchmarks
No
Sam
ples
Col
lect
ed
2014-2015

Wet Weather Historical Monitoring Table for ESC-MLS
Permit Requirement Analyte Units Water Quality
Benchmarks Benchmark References
Chlorinated Pesticides2013 2,4'-DDE µg/L NA2013 2,4'-DDT µg/L NA 16. 40 CFR 131.382013 4,4´-DDE µg/L NA2013 4,4´-DDT µg/L 1.1 16. 40 CFR 131.38Organophosphorus Pesticides2013 Azinphos methyl (Guthion) µg/L NA2013 Bolstar µg/L NA
2007, 2013 Chlorpyrifos µg/L 0.02 acute / 0.014 chronic 12. CA Dept. of Fish & Game, 2000
2013 Coumaphos µg/L NA2013 Demeton-o µg/L NA2013 Demeton-s µg/L NA
2007, 2013 Diazinon µg/L 0.08 acute / 0.05 chronic
12. CA Dept. of Fish & Game, 2000, 11. Chollas Creek TMDL for Diazinon, 10. USEPA, Aquatic Life Ambient
Water Quality Criteria Diazinon2013 Dichlorvos µg/L NA2013 Dimethoate µg/L NA2013 Disulfoton µg/L NA2013 Ethoprop µg/L NA2013 Ethyl parathion µg/L NA2013 Fensulfothion µg/L NA2013 Fenthion µg/L NA2007, 2013 Malathion µg/L 0.43 13. CA Dept. of Fish & Game, 1998, 5. Goldbook2013 Merphos µg/L NA2013 Methyl parathion µg/L NA2013 Mevinphos µg/L NA2013 Naled µg/L NA2013 Phorate µg/L NA2013 Ronnel µg/L NA2013 Stirophos µg/L NA2013 Tokuthion (Prothiofos) µg/L NA2013 Trichloronate µg/L NAPyrethroids2007, 2013 Allethrin µg/L NA2007, 2013 Bifenthrin µg/L 0.0093 15. Anderson et al., 20062007, 2013 Cyfluthrin µg/L 0.344 17. Wheelock et al., 20042007, 2013 Cyhalothrin, Total Lambda µg/L 0.20 17. Wheelock et al., 20042007, 2013 Cypermethrin µg/L 0.683 17. Wheelock et al., 20042007, 2013 Danitol (Fenpropathrin) µg/L NA2007, 2013 Deltamethrin/Tralomethrin µg/L NA2007, 2013 Esfenvalerate µg/L 0.25 17. Wheelock et al., 20042007, 2013 Fenvalerate µg/L NA2007, 2013 Fluvalinate µg/L NA2007, 2013 Permethrin µg/L 0.021 15. Anderson et al., 20062007, 2013 Prallethrin µg/L NA2007, 2013 Resmethrin µg/L NAToxicity2007, 2013 Ceriodaphnia 96-hr LC50 (%) >1002007, 2013 Ceriodaphnia 7-day survival NOEC (%) 1002013 Ceriodaphnia 7-day survival TST Pass/Fail2007, 2013 Ceriodaphnia 7-day reproduction NOEC (%) 1002013 Ceriodaphnia 7-day reproduction TST Pass/Fail2007 Hyalella 96-hr LC50 (%) >1002007, 2013 Selenastrum 96-hr NOEC (%) 1002013 Selenastrum 96-hr TST Pass/Fail2013 Pimephale s 7-day survival TST Pass/Fail2013 Pimephales 7-day biomass TST Pass/Fail2013 Strongylocentrotus 96-hr TST Pass/FailSee last page for footnotes and source references.
Long Term and
Transitional Monitoring
Long Term and
Transitional Monitoring
Long Term Monitoring
Only
Long Term and
Transitional Monitoring
2013-2014
- 11/1/14 11/21/14-11/22/14
03/01/15-03/02/15
Frequency Above
Benchmarks
Mean Ratio to Benchmarks
2014-2015
<0.0050 <0.0050 <0.0050<0.0050 <0.0050 <0.0050<0.0050 <0.0050 <0.0050<0.0050 <0.0050 <0.0050 0% NA1
<0.010 <0.010 <0.010<0.010 <0.010 <0.010
<0.010 <0.010 <0.010 4% 0.27
<0.010 <0.010 <0.010<0.010 <0.010 <0.010BS-L<0.010 <0.010 <0.010
<0.010BS-L <0.010 <0.010 18% 0.95
<0.010 <0.010 0.048<0.010 <0.010 <0.010<0.010 <0.010 <0.010<0.010 <0.010 <0.010<0.010 <0.010 <0.010<0.010 <0.010 <0.010<0.010 <0.010 <0.0100.073 0.017 <0.010 0% 0.08
<0.010 <0.010 <0.010<0.010 <0.010 <0.010<0.010 <0.010 <0.010<0.010 <0.010 <0.010<0.010 <0.010 <0.010<0.010 <0.010 <0.010<0.010 <0.010 <0.010<0.010 <0.010 <0.010<0.010 <0.010 <0.010
<0.002 <0.002 <0.0020.0783 0.0076 <0.002 40% 2.270.0273 <0.002 <0.002 0% 0.010.0021 <0.002 <0.002 0% 0.040.0048 <0.002 <0.002 0% 0.00<0.002 <0.002 <0.0020.0246 <0.002 <0.0020.0054 <0.002 <0.002 0% 0.010.0012J <0.002 <0.002<0.002 <0.002 <0.0020.123 <0.01 <0.01 10% 0.90
<0.002 <0.002 <0.002<0.01 <0.01 <0.01
>100 NR >100 4% 1.07100 NR 50 11% 1.19NR Pass Fail 50%100 NR 50 7% 1.15NR Pass Fail 50%89 NR >100 4% 1.00
100 NR 100 0% 1.00NR Pass Pass 0%NR Pass Pass 0%NR Pass Pass 0%Pass NR NR 0%
No
Sam
ples
Col
lect
ed

Wet Weather Historical Monitoring Table for ESC-MLSBlank spaces have been verified and no data is available.
NA indicate no criteria or published value was available or applicable to the matrix or program.(a) Water Quality Benchmark are based on the San Diego Regional Water Quality Control Plan by watershed for the San Diego Region (Basin Plan), 1994 (with amendments effective on or before April 4, 2011) and may vary by hydrologic area.
* Indicates detection limit above water quality benchmark.£ Historical results for Deltamethrin/Tralomethrin contain results reported by lab as Deltamethrin.†† Permethrin was non-detect at the method detection limit of 0.005 µg/L. BS-L-Blank Spike recovery of this analyte was below the control limits. Results may be biased low.
NA1 Three or more years of data required to calculate the Mean Ratio to Benchmark.NR-Sampling of this analyte not required for transitional monitoring (RWQCB Order No. R9-2007-0001) and/or for long term monitoring (RWQCB Order No. R9-2013-0001).
SourcesPlease refer to the San Diego County Copermittee Regional Monitoring Program Benchmark Sources in Attachment B to Appendix A for benchmark source citations.
(c) Water Quality Benchmark for dissolved metal fractions are based on total hardness and are calculated as described by the USEPA Federal Register Doc. 40 CFR Part 131, May 18, 2000. The Criteria Maximum Concentration (CMC) was used.
J-Analyte was detected at a concentration below the reporting limit and above the method detection limit. Reported value is estimated.
(b) Prior to the 2014-2015 monitoring year, Water Quality Benchmark was calculated based on CMC (salmonids absent) using pH described in the U.S. EPA, 1999 Update of Ambient Water Quality Criteria for Ammonia, EPA-822-R-99-014, December 1999. For 2014-2015 monitoring year, Water Quality Benchmark CMC was calculated based on pH and water temperature (when applicable) as described in the U.S. EPA, 2013 Aquatic Life Ambient Water Quality Criteria for Ammonia - Freshwater, EPA-822-R-13-001, April 2013.
Values with red bold font and shading do not meet Water Quality Benchmarks. Values that are underlined are above the CMC Water Quality Benchmark.

Wet Weather Historical Monitoring Table for LPC-TWAS-1
2008-2009 2009-2010 2011-2012 2012-2013 2013-2014 2014-2015
11/30/07 02/03/08 - - 10/6/10 02/16/11** - - - -
Physical Chemistry2007, 2013 pH pH units 6.5-9.0 1. Basin Plan 7.04 7.43 7.37 6.40 25% NA1
2007, 2013 Specific Conductivity µmhos/cm NA 196 208 380 7202007, 2013 Water Temperature Celsius NA 17.20 13.20 17.60 16.202007, 2013 Turbidity NTU 20 1. Basin Plan 164 65 32 28 100% NA1
Bacteriological2007, 2013 Enterococcus MPN/100 mL NA 14,000 5,000 130,000 17,0002007, 2013 Fecal Coliform MPN/100 mL 4,000 1. Basin Plan REC-1/REC-2 17,000 1,700 50,000 3,000 50% NA1
2007, 2013 Total Coliform MPN/100 mL NA 110,000 23,000 300,000 30,000Nutrients2007, 2013 Ammonia as N mg/L (a) 6. U.S. EPA Water Quality Criteria (Freshwater) 0.78 0.1 0.35 0.48 0% NA1
2007, 2013 Nitrate as N mg/L 10 1. Basin Plan 1.3 0.2 0.45 0.45 0% NA1
2007, 2013 Nitrite as N mg/L 1 1. Basin Plan 0.1 <0.05 0.3 0.054J 0% NA1
2007, 2013 Total Kjeldahl Nitrogen mg/L NA 3.9 0.84 3.5 1.92007 Dissolved Phosphorus mg/L 2 4. MSGP 2015 0.69 0.2 0.51 0.053 0% NA1
2007, 2013 Total Phosphorus mg/L 2 4. MSGP 2015 0.606 0.33 0.83 0.53 0% NA1
General Chemistry2007 Biochemical Oxygen Demand mg/L 30 4. MSGP 2015, 8. McNeeley (1979) 12 3.4 7 6.8 0% NA1
2007 Chemical Oxygen Demand mg/L 120 4. MSGP 2015 49 22 110 83 0% NA1
2007, 2013 Dissolved Organic Carbon mg/L NA 12.7 6.5 7.9 9.52007, 2013 Total Organic Carbon mg/L NA 14.3 5.7 12 9.62007 Oil and Grease mg/L 10 1. Basin Plan, 3. Anacostia River TMDL, 4. MSGP 2015 4.4J 3.3J <5 2.1J 0% NA1
2007, 2013 Surfactants (MBAS) mg/L 0.5 1. Basin Plan 0.158 0.062 0.17 0.095 0% NA1
2007, 2013 Total Dissolved Solids mg/L 500 (b) 1. Basin Plan 524 496 600 340 50% NA1
2007, 2013 Total Suspended Solids mg/L 100 4. MSGP 2015, 1. Basin Plan 260 40 330 220 75% NA1
2007, 2013 Hardness mg CaCO3/L NA 49.2 45.2 360 180Total Metals2007 Antimony mg/L NA 0.0014 0.0011 0.0024 0.00262007, 2013 Arsenic mg/L NA 0.0074 0.0032 0.013 0.0122007, 2013 Cadmium mg/L NA 0.0004 <0.0004 0.00051 0.000382007, 2013 Chromium mg/L NA 0.0047 0.0015 0.0088 0.00942007, 2013 Copper mg/L NA 0.0417 0.0128 0.062 0.052007, 2013 Lead mg/L NA 0.0152 0.0037 0.019 0.0152007, 2013 Nickel mg/L NA 0.0087 0.0028 0.01 0.00972007, 2013 Selenium mg/L 0.005 16. 40 CFR 131.38 0.0004J 0.0002J 0.00087 0.00056 0% NA1
2007, 2013 Zinc mg/L NA 0.2228 0.0708 0.23 0.22Dissolved Metals2007 Antimony mg/L 0.006 1. Basin Plan 0.0014 0.0012 0.0014 0.0019 0% NA1
2007, 2013 Arsenic mg/L 0.34 16. 40 CFR 131.38 0.0025 0.0020 0.0017 0.0012 0% NA1
2007, 2013 Cadmium mg/L (c) 16. 40 CFR 131.38 <0.0004 <0.0004 0.000027J 0.000014J 0% NA1
2007, 2013 Chromium mg/L (c) 16. 40 CFR 131.38 0.0006 0.0006 0.00026 0.00073 0% NA1
2007, 2013 Copper mg/L (c) 16. 40 CFR 131.38 0.0056 0.0053 0.0049 0.0096 0% NA1
2007, 2013 Lead mg/L (c) 16. 40 CFR 131.38 0.0002 <0.0001 0.00023 0.000079J 0% NA1
2007, 2013 Nickel mg/L (c) 16. 40 CFR 131.38 0.0020 0.0012 0.0025 0.0023 0% NA1
2007, 2013 Selenium mg/L NA 0.0004J 0.0002J 0.00048 0.000412007, 2013 Zinc mg/L (c) 16. 40 CFR 131.38 0.0125 0.0120 0.014 0.01 0% NA1
Organophosphorus Pesticides
2007, 2013 Chlorpyrifos µg/L 0.02 acute / 0.014 chronic 12. CA Dept. of Fish & Game, 2000 <0.002 <0.002 <0.01 <0.01 0% NA1
2007, 2013 Diazinon µg/L 0.08 acute / 0.05 chronic
12. CA Dept. of Fish & Game, 2000, 11. Chollas Creek TMDL for Diazinon, 10. USEPA, Aquatic Life Ambient
Water Quality Criteria Diazinon<0.004 <0.004 <0.01 <0.01 0% NA1
2007, 2013 Malathion µg/L 0.43 13. CA Dept. of Fish & Game, 1998, 5. Goldbook <0.006 <0.006 <0.01 <0.01 0% NA1
Pyrethroids2007, 2013 Allethrin µg/L NA <0.002 <0.002 <0.002 <0.002 NA1
2007, 2013 Bifenthrin µg/L 0.0093 15. Anderson et al., 2006 0.0323 <0.002 <0.002 0.0288 50% NA1
2007, 2013 Cyfluthrin µg/L 0.344 17. Wheelock et al., 2004 0.02 0.01 <0.002 0.0125 0% NA1
2007, 2013 Cyhalothrin, Total Lambda µg/L 0.20 17. Wheelock et al., 2004 0.001J <0.002 <0.002 0.0018J 0% NA1
2007, 2013 Cypermethrin µg/L 0.683 17. Wheelock et al., 2004 <0.002 <0.002 <0.002 <0.002 0% NA1
2007, 2013 Danitol (Fenpropathrin) µg/L NA 0.001J <0.002 <0.0022007, 2013 Deltamethrin/Tralomethrin£ µg/L NA <0.002 <0.002 <0.002 <0.0022007, 2013 Esfenvalerate µg/L 0.25 17. Wheelock et al., 2004 <0.002 <0.002 <0.002 <0.002 0% NA1
2007, 2013 Fenvalerate µg/L NA <0.002 <0.002 <0.002 <0.0022007, 2013 Fluvalinate µg/L NA 0.0006J <0.002 0.0062007, 2013 Permethrin µg/L 0.021 15. Anderson et al., 2006 <0.025* <0.025* <0.005 <0.025* 0% NA1
2007, 2013 Prallethrin µg/L NA <0.002 <0.002 <0.002 <0.0022007, 2013 Resmethrin µg/L NA <0.025Toxicity2007, 2013 Ceriodaphnia 96-hr LC50 (%) >100 >100 >100 >100 >100 0% NA1
2007, 2013 Ceriodaphnia 7-day survival NOEC (%) 100 100 100 100 100 0% NA1
2007, 2013 Ceriodaphnia 7-day reproduction NOEC (%) 100 100 100 100 100 0% NA1
2007 Hyalella 96-hr LC50 (%) >100 >100 >100 >100 >100 0% NA1
2007, 2013 Selenastrum 96-hr NOEC (%) 100 100 100 100 100 0% NA1
See last page for footnotes and source references.
Transitional Monitoring
Permit Requirement Analyte Units Water Quality
Benchmarks Benchmark References 2007-2008
No
Sam
ples
Col
lect
ed
Frequency Above
Benchmarks
Mean Ratio to Benchmarks
No
Sam
ples
Col
lect
ed
No
Sam
ples
Col
lect
ed
No
Sam
ples
Col
lect
ed
No
Sam
ples
Col
lect
ed
No
Sam
ples
Col
lect
ed
2010-2011
Historical Monitoring Data

Wet Weather Historical Monitoring Table for LPC-TWAS-1
Blank spaces have been verified and no data is available.
NA indicate no criteria or published value was available or applicable to the matrix or program.
(b) Water Quality Benchmark is based on the San Diego Regional Water Quality Control Plan by watershed for the San Diego Region (Basin Plan), 1994 (with amendments effective on or before April 4, 2011) and may vary by hydrologic area.(c) Water Quality Benchmark for dissolved metal fractions are based on total hardness and are calculated as described by the USEPA Federal Register Doc. 40 CFR Part 131, May 18, 2000. The Criteria Maximum Concentration (CMC) was used.* Indicates detection limit above water quality benchmark.**Sample was taken upstream of LPC-TWAS-1.£ Historical results for Deltamethrin/Tralomethrin contain results reported by lab as Deltamethrin.J-Analyte was detected at a concentration below the reporting limit and above the method detection limit. Reported value is estimated.NA1 Three or more years of data required to calculate the Mean Ratio to Benchmark.
SourcesPlease refer to the San Diego County Copermittee Regional Monitoring Program Benchmark Sources in Attachment B to Appendix A for benchmark source citations
(a) Prior to the 2014-2015 monitoring year, Water Quality Benchmark was calculated based on CMC (salmonids absent) using pH described in the U.S. EPA, 1999 Update of Ambient Water Quality Criteria for Ammonia, EPA-822-R-99-014, December 1999. For 2014-2015 monitoring year, Water Quality Benchmark CMC was calculated based on pH and water temperature (when applicable) as described in the U.S. EPA, 2013 Aquatic Life Ambient Water Quality Criteria for Ammonia - Freshwater, EPA-822-R-13-001, April 2013.
Values with red bold font and shading do not meet Water Quality Benchmarks.

Wet Weather Historical Monitoring Table for LPC-TWAS-2
2008-2009 2009-2010 2011-2012 2013-2014
11/30/07 02/03/08 - - 10/19/10-10/20/10 02/16/11 - 10/11/12 02/20/13 - 11/01/14 03/01/15-
03/02/15Physical Chemistry2007, 2013 pH pH units 6.5-9.0 1. Basin Plan 7.28 7.62 7.30 7.65 7.54 7.62 7.23 7.62 0% 0.212007, 2013 Specific Conductivity µmhos/cm NA 567 373 548 1,334 1,735 641 1,089 4512007, 2013 Water Temperature Celsius NA 16.80 12.50 17.50 15.10 20 10.8 17.64 13.272007, 2013 Turbidity NTU 20 1. Basin Plan 84 147 77 4.9 18 11 75.7 26.6 63% 2.78Bacteriological2007, 2013 Enterococcus MPN/100 mL NA 80,000 5,000 280,000 17,000 50,000 50,000 2,200 50,0002007, 2013 Fecal Coliform MPN/100 mL 400 1. Basin Plan REC-1/REC-2 70,000 1,700 50,000 17,000 80,000 11,000 110,000 7,000 100% 108.342007, 2013 Total Coliform MPN/100 mL NA 110,000 17,000 300,000 30,000 300,000 60,000 170,000 9,000Nutrients2007, 2013 Ammonia as N mg/L (a) 6. U.S. EPA Water Quality Criteria (Freshwater) 0.62 0.08 0.33 0.16 0.87 0.14 0.28 <0.10 0% 0.022007, 2013 Nitrate as N mg/L 10 1. Basin Plan 1.3 0.44 0.67 1 2.1 0.45 1.4 0.28 0% 0.102007, 2013 Nitrite as N mg/L 1 1. Basin Plan 0.09 0.02J 0.13 0.078J 0.13 0.047J 0.075J 0.020J 0% 0.072007, 2013 Total Kjeldahl Nitrogen mg/L NA 2.2 0.98 2.3 1.2 6.2 1.3 3.1 0.712007 Dissolved Phosphorus mg/L 2 4. MSGP 2015 0.1 0.16 0.29 0.098 0.18 0.13 0.47 0.13 0% 0.102007, 2013 Total Phosphorus mg/L 2 4. MSGP 2015 1.01 0.41 0.42 0.15 0.87 0.27 0.66 0.25 0% 0.25General Chemistry2007 Biochemical Oxygen Demand mg/L 30 4. MSGP 2015, 8. McNeeley (1979) 15 2.2 6.6 4.9 82 6.4 15 6.3 13% 0.582007 Chemical Oxygen Demand mg/L 120 . 60 23 82 40 230 54 130 35 25% 0.682007, 2013 Dissolved Organic Carbon mg/L NA 16.4 5.3 8.6 11 41 6.1 28 8.12007, 2013 Total Organic Carbon mg/L NA 16.9 5.5 8.7 12 42 5.8 32 8.62007 Oil and Grease mg/L 10 1. Basin Plan, 3. Anacostia River TMDL, 4. MSGP 2015 2.8J 2.2J 2.6J <5 <5 <5 <5.0 <5.0 0% 0.252007, 2013 Surfactants (MBAS) mg/L 0.5 1. Basin Plan 0.268 0.096 <0.05 0.2 0.095 0.065 0.15 0.096 0% 0.252007, 2013 Total Dissolved Solids mg/L 500 (b) 1. Basin Plan 322 298 330 1,000 1,200 430 1,300 390 38% 1.322007, 2013 Total Suspended Solids mg/L 100 4. MSGP 2015, 1. Basin Plan 113 200 130 27 380 150 120 45 75% 1.462007, 2013 Hardness mg CaCO3/L NA 93.9 66.5 150 430 505 198 553 174Total Metals2007 Antimony mg/L NA 0.0014 0.0007 0.0012 0.0011 0.0023 0.001 0.0015 0.000952007, 2013 Arsenic mg/L NA 0.0046 0.0033 0.004 0.0022 0.0066 0.0025 0.0048 0.00212007, 2013 Cadmium mg/L NA <0.0004 <0.0004 0.00014 0.000029J 0.00029 0.0001 0.00015 0.000046J2007, 2013 Chromium mg/L NA 0.0016 0.0014 0.0043 0.00069 0.004 0.0025 0.0033 0.00152007, 2013 Copper mg/L NA 0.0183 0.0093 0.019 0.0071 0.034 0.015 0.016 0.00762007, 2013 Lead mg/L NA 0.0047 0.0046 0.0062 0.00053 0.0071 0.0037 0.0036 0.00142007, 2013 Nickel mg/L NA 0.0032 0.0020 0.0045 0.0037 0.009 0.0027 0.0046 0.00222007, 2013 Selenium mg/L 0.005 16. 40 CFR 131.38 0.0006 0.0002J 0.00064 0.00072 0.0012 0.00041 0.00079 0.00064 0% 0.132007, 2013 Zinc mg/L NA 0.0635 0.0465 0.076 0.011 0.15 0.068 0.066 0.026Dissolved Metals2007 Antimony mg/L 0.006 1. Basin Plan 0.0012 0.0007 0.00087 0.0011 0.0019 0.00058 0.0012 0.00072 0% 0.172007, 2013 Arsenic mg/L 0.34 16. 40 CFR 131.38 0.0028 0.0024 0.0022 0.0019 0.0035 0.0012 0.0025 0.0014 0% 0.012007, 2013 Cadmium mg/L (c) 16. 40 CFR 131.38 <0.0004 <0.0004 <0.0001 0.000014J 0.00007J 0.00002J 0.000054J <0.00010 0% 0.022007, 2013 Chromium mg/L (c) 16. 40 CFR 131.38 0.0003J 0.0005 0.00032 0.00045 0.00067 0.00028 0.00036 0.00034 0% 0.002007, 2013 Copper mg/L (c) 16. 40 CFR 131.38 0.0042 0.0035 0.0051 0.0059 0.0074 0.003 0.0048 0.0031 0% 0.202007, 2013 Lead mg/L (c) 16. 40 CFR 131.38 0.0001 <0.0001 0.00013J 0.000026J 0.00024 <0.0002 0.00022 0.000062J 0% 0.002007, 2013 Nickel mg/L (c) 16. 40 CFR 131.38 0.0017 0.0009 0.0016 0.0034 0.0059 0.00085 0.0028 0.0012 0% 0.002007, 2013 Selenium mg/L NA 0.0006 0.0003J 0.00036J 0.00085 0.00084 <0.0004 0.00049 0.000472007, 2013 Zinc mg/L (c) 16. 40 CFR 131.38 0.0090 0.0043 0.009 0.0059 0.034 0.0082 0.019 0.0051 0% 0.05Organophosphorus Pesticides
2007, 2013 Chlorpyrifos µg/L 0.02 acute / 0.014 chronic 12. CA Dept. of Fish & Game, 2000 <0.002 <0.002 <0.01 <0.01 <0.01 <0.01 <0.010 <0.010 0% 0.20
2007, 2013 Diazinon µg/L 0.08 acute / 0.05 chronic
12. CA Dept. of Fish & Game, 2000, 11. Chollas Creek TMDL for Diazinon, 10. USEPA, Aquatic Life Ambient
Water Quality Criteria Diazinon0.057 0.006 <0.01 0.0063J <0.01 <0.01 <0.010BS-L <0.010 0% 0.15
2007, 2013 Malathion µg/L 0.43 13. CA Dept. of Fish & Game, 1998, 5. Goldbook 0.121 0.014 <0.01 0.023 0.069 0.081 0.017 <0.010 0% 0.10Pyrethroids2007, 2013 Allethrin µg/L NA <0.002 <0.002 <0.005 <0.002 <0.002 <0.002 <0.002 <0.0022007, 2013 Bifenthrin µg/L 0.0093 15. Anderson et al., 2006 0.0549 0.0534 0.0023J 0.0437 0.1197 0.2351 0.0507 0.0051 75% 7.592007, 2013 Cyfluthrin µg/L 0.344 17. Wheelock et al., 2004 0.01 0.009 <0.005 <0.002 0.0175 0.071 0.0154 <0.002 0% 0.052007, 2013 Cyhalothrin, Total Lambda µg/L 0.20 17. Wheelock et al., 2004 0.02 0.0007J <0.005 <0.002 0.0024 <0.002 0.0016J <0.002 0% 0.052007, 2013 Cypermethrin µg/L 0.683 17. Wheelock et al., 2004 0.05 <0.002 <0.005 <0.002 0.0072 <0.002 0.0064 <0.002 0% 0.012007, 2013 Danitol (Fenpropathrin) µg/L NA <0.002 <0.002 <0.002 <0.002 <0.002 <0.002 <0.0022007, 2013 Deltamethrin/Tralomethrin£ µg/L NA <0.002 <0.002 <0.005 <0.002 <0.002 <0.002 0.0215 <0.0022007, 2013 Esfenvalerate µg/L 0.25 17. Wheelock et al., 2004 <0.002 <0.002 <0.005 <0.002 <0.002 <0.002 <0.002 <0.002 0% 0.002007, 2013 Fenvalerate µg/L NA <0.002 <0.002 <0.005 <0.002 <0.002 <0.002 <0.002 <0.0022007, 2013 Fluvalinate µg/L NA <0.002 <0.002 <0.002 <0.002 <0.002 <0.002 <0.0022007, 2013 Permethrin µg/L 0.021 15. Anderson et al., 2006 <0.025* <0.025* <0.005 <0.025* 0.1607 <0.01 0.082 <0.01 25% 1.712007, 2013 Prallethrin µg/L NA <0.002 <0.002 <0.005 <0.002 <0.002 <0.002 <0.002 <0.0022007, 2013 Resmethrin µg/L NA <0.025 <0.025 <0.01 <0.01 <0.01Toxicity2007, 2013 Ceriodaphnia 96-hr LC50 (%) >100 >100 >100 >100 >100 >100 >100 >100 >100 0% 1.002007, 2013 Ceriodaphnia 7-day survival NOEC (%) 100 100 100 100 100 100 100 100 100 0% 1.002007, 2013 Ceriodaphnia 7-day reproduction NOEC (%) 100 100 100 100 100 100 100 100 100 0% 1.002007 Hyalella 96-hr LC50 (%) >100 >100 94.2 >100 58 >100 >100 >100 >100 25% 1.102007, 2013 Selenastrum 96-hr NOEC (%) 100 100 100 100 100 100 100 100 100 0% 1.00See last page for footnotes and source references.
Water Quality Benchmarks Benchmark References 2010-2011
Frequency Above
Benchmarks
Mean Ratio to Benchmarks
Permit Requirement Analyte Units
Historical Monitoring Data
2007-2008 2012-2013
Transitional Monitoring
2014-2015
No
Sam
ples
Col
lect
ed
No
Sam
ples
Col
lect
ed
No
Sam
ples
Col
lect
ed
No
Sam
ples
Col
lect
ed

Wet Weather Historical Monitoring Table for LPC-TWAS-2
Blank spaces have been verified and no data is available.
NA indicate no criteria or published value was available or applicable to the matrix or program.
(b) Water Quality Benchmark is based on the San Diego Regional Water Quality Control Plan by watershed for the San Diego Region (Basin Plan), 1994 (with amendments effective on or before April 4, 2011) and may vary by hydrologic area.(c) Water Quality Benchmark for dissolved metal fractions are based on total hardness and are calculated as described by the USEPA Federal Register Doc. 40 CFR Part 131, May 18, 2000. The Criteria Maximum Concentration (CMC) was used.* Indicates detection limit above water quality benchmark.£ Historical results for Deltamethrin/Tralomethrin contain results reported by lab as Deltamethrin.BS-L Blank Spike recovery of this analyte was below the control limits. Results may be biased low.J-Analyte was detected at a concentration below the reporting limit and above the method detection limit. Reported value is estimated.
SourcesPlease refer to the San Diego County Copermittee Regional Monitoring Program Benchmark Sources in Attachment B to Appendix A for benchmark source citations.
(a) Prior to the 2014-2015 monitoring year, Water Quality Benchmark was calculated based on CMC (salmonids absent) using pH described in the U.S. EPA, 1999 Update of Ambient Water Quality Criteria for Ammonia, EPA-822-R-99-014, December 1999. For 2014-2015 monitoring year, Water Quality Benchmark CMC was calculated based on pH and water temperature (when applicable) as described in the U.S. EPA, 2013 Aquatic Life Ambient Water Quality Criteria for Ammonia - Freshwater, EPA-822-R-13-001, April 2013.
Values with red bold font and shading do not meet Water Quality Benchmarks.

Wet Weather Historical Monitoring Table for LPC-TWAS-3
2013-2014
12/13/12 02/08/13-02/09/13 - 11/01/14 03/01/15
Physical Chemistry2007, 2013 pH pH units 6.5-9.0 1. Basin Plan 7.33 7.62 7.23 7.9 0% NA1
2007, 2013 Specific Conductivity µmhos/cm NA 1,247 3,600 2,096 1,7832007, 2013 Water Temperature Celsius NA 13.5 10.5 16.99 14.322007, 2013 Turbidity NTU 20 1. Basin Plan 42 4.9 29.5 31 75% NA1
Bacteriological2007, 2013 Enterococcus MPN/100 mL NA 110,000 2,200 17,000H 50,0002007, 2013 Fecal Coliform MPN/100 mL 4,000 1. Basin Plan REC-1/REC-2 50,000 2,200 240,000H^ 110,000 67% NA1
2007, 2013 Total Coliform MPN/100 mL NA 140,000 17,000 500,000H 170,000Nutrients2007, 2013 Ammonia as N mg/L (a) 6. U.S. EPA Water Quality Criteria (Freshwater) 0.22 0.061J <0.10 <0.10 0% NA1
2007, 2013 Nitrate as N mg/L 10 1. Basin Plan 0.76 0.087J 0.99 0.18 0% NA1
2007, 2013 Nitrite as N mg/L 1 1. Basin Plan 0.038J 0.018J 0.066J 0.024J 0% NA1
2007, 2013 Total Kjeldahl Nitrogen mg/L NA 1.2 0.42 2.8 0.632007 Dissolved Phosphorus mg/L 2 4. MSGP 2015 0.33 0.094 0.72 0.14 0% NA1
2007, 2013 Total Phosphorus mg/L 2 4. MSGP 2015 0.71 0.26 0.94 0.24 0% NA1
General Chemistry2007 Biochemical Oxygen Demand mg/L 30 4. MSGP 2015, 8. McNeeley (1979) 8 3.4 9.6 5.8 0% NA1
2007 Chemical Oxygen Demand mg/L 120 47 25 110 39 0% NA1
2007, 2013 Dissolved Organic Carbon mg/L NA 11 6.2 29 8.82007, 2013 Total Organic Carbon mg/L NA 11 5.7 32 9.22007 Oil and Grease mg/L 10 1. Basin Plan, 3. Anacostia River TMDL, 4. MSGP 2015 <5 1.5J <5.0 <5.0 0% NA1
2007, 2013 Surfactants (MBAS) mg/L 0.5 1. Basin Plan <0.05 0.068 0.12 0.053 0% NA1
2007, 2013 Total Dissolved Solids mg/L 500 (b) 1. Basin Plan 590 2,600 1,900 1,300 100% NA1
2007, 2013 Total Suspended Solids mg/L 100 4. MSGP 2015, 1. Basin Plan 150 7 110 35 50% NA1
2007, 2013 Hardness mg CaCO3/L NA 247 1,210 825 571Total Metals2007 Antimony mg/L NA 0.00043J 0.00028J 0.00062 0.00042J2007, 2013 Arsenic mg/L NA 0.0068 0.004 0.012 0.00412007, 2013 Cadmium mg/L NA 0.000071J <0.0001 0.000098J <0.000102007, 2013 Chromium mg/L NA 0.0021 0.00025 0.0016 0.00132007, 2013 Copper mg/L NA 0.0063 0.0023 0.0071 0.00342007, 2013 Lead mg/L NA 0.0021 0.00012J 0.0013 0.000522007, 2013 Nickel mg/L NA 0.003 0.0079 0.0027 0.0042007, 2013 Selenium mg/L 0.005 16. 40 CFR 131.38 0.00099 0.0012 0.0013 0.0014 0% NA1
2007, 2013 Zinc mg/L NA 0.022 0.0046J 0.018 0.0075Dissolved Metals2007 Antimony mg/L 0.006 1. Basin Plan 0.00035J 0.00026J 0.00042J 0.00034J 0% NA1
2007, 2013 Arsenic mg/L 0.34 16. 40 CFR 131.38 0.0033 0.0031 0.0062 0.0024 0% NA1
2007, 2013 Cadmium mg/L (c) 16. 40 CFR 131.38 <0.0001 <0.0001 <0.00010 <0.00010 0% NA1
2007, 2013 Chromium mg/L (c) 16. 40 CFR 131.38 0.00022 0.00011J 0.00017J 0.0003 0% NA1
2007, 2013 Copper mg/L (c) 16. 40 CFR 131.38 0.0024 0.0018 0.0036 0.0024 0% NA1
2007, 2013 Lead mg/L (c) 16. 40 CFR 131.38 0.000059J 0.000016J 0.000026J <0.00020 0% NA1
2007, 2013 Nickel mg/L (c) 16. 40 CFR 131.38 0.0018 0.0076 0.0018 0.0026 0% NA1
2007, 2013 Selenium mg/L NA 0.00076 0.00091 0.00098 0.00132007, 2013 Zinc mg/L (c) 16. 40 CFR 131.38 0.005 0.0038J 0.0046J 0.0025J 0% NA1
Organophosphorus Pesticides
2007, 2013 Chlorpyrifos µg/L 0.02 acute / 0.014 chronic 12. CA Dept. of Fish & Game, 2000 <0.01 <0.01 <0.010 <0.010 0% NA1
2007, 2013 Diazinon µg/L 0.08 acute / 0.05 chronic
12. CA Dept. of Fish & Game, 2000, 11. Chollas Creek TMDL for Diazinon, 10. USEPA, Aquatic Life Ambient
Water Quality Criteria Diazinon<0.01 <0.01 <0.010 <0.010 0% NA1
2007, 2013 Malathion µg/L 0.43 13. CA Dept. of Fish & Game, 1998, 5. Goldbook <0.01 <0.01 0.087 <0.010 0% NA1
Pyrethroids2007, 2013 Allethrin µg/L NA <0.002 <0.002 <0.002 <0.0022007, 2013 Bifenthrin µg/L 0.0093 15. Anderson et al., 2006 0.1048 0.1463 0.0219 <0.002 75% NA1
2007, 2013 Cyfluthrin µg/L 0.344 17. Wheelock et al., 2004 <0.002 <0.002 0.0642 <0.002 0% NA1
2007, 2013 Cyhalothrin, Total Lambda µg/L 0.20 17. Wheelock et al., 2004 <0.002 0.0156 <0.002 <0.002 0% NA1
2007, 2013 Cypermethrin µg/L 0.683 17. Wheelock et al., 2004 <0.002 <0.002 <0.002 <0.002 0% NA1
2007, 2013 Danitol (Fenpropathrin) µg/L NA <0.002 <0.002 <0.002 <0.0022007, 2013 Deltamethrin/Tralomethrin£ µg/L NA <0.002 <0.002 <0.002 <0.0022007, 2013 Esfenvalerate µg/L 0.25 17. Wheelock et al., 2004 <0.002 <0.002 <0.002 <0.002 0% NA1
2007, 2013 Fenvalerate µg/L NA <0.002 <0.002 <0.002 <0.0022007, 2013 Fluvalinate µg/L NA <0.002 <0.002 <0.002 <0.0022007, 2013 Permethrin µg/L 0.021 15. Anderson et al., 2006 <0.025†† <0.01 <0.01 <0.01 0% NA1
2007, 2013 Prallethrin µg/L NA <0.002 <0.002 <0.002 <0.0022007, 2013 Resmethrin µg/L NA <0.025 <0.01 <0.01 <0.01Toxicity2007, 2013 Ceriodaphnia 96-hr LC50 (%) >100 >100 >100 >100 >100 0% NA1
2007, 2013 Ceriodaphnia 7-day survival NOEC (%) 100 100 100 100 100 0% NA1
2007, 2013 Ceriodaphnia 7-day reproduction NOEC (%) 100 100 50 100 100 25% NA1
2007 Hyalella 96-hr LC50 (%) >100 35.8 68.6 >100 >100 50% NA1
2007, 2013 Selenastrum 96-hr NOEC (%) 100 100 100 100 100 0% NA1
See last page for footnotes and source references.
Water Quality Benchmarks Benchmark References 2012-2013 Mean Ratio to
Benchmarks
Historical Monitoring Data
Frequency Above
Benchmarks
Transitional Monitoring
2014-2015
No
Sam
ples
Col
lect
ed
Permit Requirement Analyte Units

Wet Weather Historical Monitoring Table for LPC-TWAS-3
Blank spaces have been verified and no data is available.
NA indicate no criteria or published value was available or applicable to the matrix or program.
(b) Water Quality Benchmark is based on the San Diego Regional Water Quality Control Plan by watershed for the San Diego Region (Basin Plan), 1994 (with amendments effective on or before April 4, 2011) and may vary by hydrologic area.(c) Water Quality Benchmark for dissolved metal fractions are based on total hardness and are calculated as described by the USEPA Federal Register Doc. 40 CFR Part 131, May 18, 2000. The Criteria Maximum Concentration (CMC) was used.* Indicates detection limit above water quality benchmark.£ Historical results for Deltamethrin/Tralomethrin contain results reported by lab as Deltamethrin.†† Permethrin was non-detect at the method detection limit of 0.005 µg/L. ^Results were not compared to the water quality benchmark for fecal coliform due to the sample being received and/or analyzed past the recommended holding time.J-Analyte was detected at a concentration below the reporting limit and above the method detection limit. Reported value is estimated.NA1 Three or more years of data required to calculate the Mean Ratio to Benchmark.
SourcesPlease refer to the San Diego County Copermittee Regional Monitoring Program Benchmark Sources in Attachment B to Appendix A for benchmark source citations.
(a) Prior to the 2014-2015 monitoring year, Water Quality Benchmark was calculated based on CMC (salmonids absent) using pH described in the U.S. EPA, 1999 Update of Ambient Water Quality Criteria for Ammonia, EPA-822-R-99-014, December 1999. For 2014-2015 monitoring year, Water Quality Benchmark CMC was calculated based on pH and water temperature (when applicable) as described in the U.S. EPA, 2013 Aquatic Life Ambient Water Quality Criteria for Ammonia - Freshwater, EPA-822-R-13-001, April 2013.
Values with red bold font and shading do not meet Water Quality Benchmarks.

Wet Weather Historical Monitoring Table for LPC-MLS
11/29/01 02/17/02 03/17/02 11/08/02 12/16/02 02/11/03 11/12/03 02/03/04 02/18/04 10/17/04 02/11/05 02/18/05 10/17/05 02/20/06 02/28/06
Physical Chemistry2013 Dissolved Oxygen mg/L <5.0 (a) 1. Basin Plan2007, 2013 pH pH units 6.5-9.0 1. Basin Plan 7.70 7.80 7.50 7.46 7.63 7.78 6.91 7.83 8.29 7.76 7.48 6.85 7.32 6.66 6.792007, 2013 Specific Conductivity µmhos/cm NA 2,640 2,700 1,590 1,827 1,939 2,600 2,470 3,060 3,540 3,270 2,690 1,213 2,980 2,440 1132007, 2013 Water Temperature Celsius NA 16.30 15.00 12.80 15.60 12.40 12.20 18.00 12.30 13.90 17.40 11.50 13.702007, 2013 Turbidity NTU 20 1. Basin Plan 3.8 3.33 5.05 17.1 45.4 29.9 7.53 8.98 2.74 7.89 9.05 56.4 16.4 17.1 30.3Bacteriological2007, 2013 Enterococcus MPN/100 mL NA 500 1,700 3,000 230,000 500 22,000 700 1,700 500 1,112 3,000 8,000 1,300,000 2,300 30,0002007, 2013 Fecal Coliform MPN/100 mL 4,000 1.Basin Plan REC-1/REC-2 130 500 300 30,000 500 1,700 1,300 130 130 500 500 2,200 170,000 1,112 5,0002007, 2013 Total Coliform MPN/100 mL NA 1,700 3,000 500 500,000 1,400 50,000 5,000 13,000 230 17,000 13,000 50,000 1,300,000 30,000 30,000Nutrients2007, 2013 Ammonia as N mg/L (b) 6. USEPA Water Quality Criteria (Freshwater) 0.2 <0.1 <0.1 <0.1 <0.1 <0.1 <0.1 <0.1 <0.1 <0.1 0.14 <0.1 <0.1 0.3 0.112007, 2013 Nitrate as N mg/L 10 1. Basin Plan 0.2 0.3 0.3 1.32 0.98 0.60 0.28 0.11 <0.05 0.09 0.6 1.06 1.24 0.94 0.92007, 2013 Nitrite as N mg/L 1 1. Basin Plan <0.05 <0.05 <0.05 0.11 <0.05 <0.05 <0.05 <0.05 <0.05 <0.05 <0.05 <0.05 <0.05 <0.05 <0.052007, 2013 Total Kjeldahl Nitrogen mg/L NA 1.7 1 1.2 1.9 0.8 1.2 1.2 2.5 2.1 1.6 1.9 0.8 1 2.5 1.12007 Dissolved Phosphorus mg/L 2 4. MSGP 2015 0.9 <0.05 0.15 0.52 0.40 0.28 0.21 0.13 0.11 0.14 0.1 0.51 0.29 0.45 0.372013 Orthophosphate mg/L NA2007, 2013 Total Phosphorus mg/L 2 4. MSGP 2015 0.1 0.15 0.23 0.73 0.60 0.39 0.23 0.2 0.17 0.14 0.28 0.69 0.48 0.47 0.38General Chemistry2007 Biochemical Oxygen Demand mg/L 30 4. MSGP 2000, 8. McNeeley (1979) 3.1 5.6 21.3 5.55 <2.0 8.31 3.28 28.6 5.28 23.7 3.75 2.31 6.16 <2 5.242007 Chemical Oxygen Demand mg/L 120 4. MSGP 2000 <25 50 54 73 53 115 47 108 56 143 62 36 63 42 762007, 2013 Dissolved Organic Carbon mg/L NA 16.8 11.0 11.2 14 6.41 77.2 27.2 4.44 4.66 10.6 14.4 12.22007, 2013 Total Organic Carbon mg/L NA 22.7 57.4 13.6 10.5 8.86 95.6 29.9 9.51 10.8 22.1 14.5 14.9
2007 Oil and Grease mg/L 10 1. Basin Plan, 3. Anacostia River TMDL, 4. MSGP 2015 <1 1 <1 3.24 <1.00 1.39 <1 <1 <1 <1 <1 <1 <1 1.05 <1
2013 Sulfate mg/L 250 (a) 1. Basin Plan2007, 2013 Surfactants (MBAS) mg/L 0.5 1. Basin Plan <0.5 <0.5 <0.5 0.2 <0.1 <0.1 <0.5 <0.5 <0.5 <0.5 <0.5 <0.5 <0.5 <0.5 <0.52007, 2013 Total Dissolved Solids mg/L 500 (a) 1. Basin Plan 1,580 1,590 1,010 955 1,280 997 1,380 1,890 2,040 2,120 1,500 804 1,940 1,030 522007, 2013 Total Suspended Solids mg/L 100 4. MSGP 2015 , 1. Basin Plan <20 <20 <20 35 58 38 27 <20 <20 <20 <20 108 20 30 1822007, 2013 Total Hardness mg CaCO3/L NA 808 815 551 428 602 602 692 805 880 1,000 707 379 932 563 373Total Metals2007 Antimony mg/L NA <0.002 <0.002 <0.002 <0.002 0.005 0.009 <0.005 <0.005 <0.006 <0.005 <0.005 <0.005 <0.005 <0.005 <0.0052007, 2013 Arsenic mg/L NA 0.002 0.002 0.003 0.012 0.005 0.003 <0.002 0.006 0.005 0.005 0.004 <0.002 0.006 0.004 0.0072007, 2013 Cadmium mg/L NA <0.001 <0.001 <0.001 <0.001 <0.001 <0.001 <0.001 <0.001 <0.001 <0.001 <0.001 <0.001 <0.001 0.002 <0.0012007, 2013 Chromium mg/L NA <0.005 <0.005 <0.005 0.008 0.006 <0.005 <0.005 <0.005 <0.005 <0.005 <0.005 <0.005 <0.005 <0.005 <0.0052007, 2013 Copper mg/L NA <0.005 <0.005 0.008 0.021 0.004 0.010 <0.005 0.008 0.006 <0.005 <0.005 <0.005 0.005 0.005 0.0062013 Iron mg/L 0.3 (a) 1. Basin Plan2007, 2013 Lead mg/L NA <0.002 <0.002 0.003 0.011 0.004 0.003 <0.002 <0.002 <0.002 <0.002 <0.002 0.002 <0.002 <0.002 0.0032013 Mercury mg/L NA2007, 2013 Nickel mg/L NA <0.002 <0.002 <0.002 0.026 <0.002 0.002 0.003 <0.002 <0.002 0.003 0.002 0.002 0.005 0.004 0.0032007, 2013 Selenium mg/L 0.005 16. 40 CFR 131.38 <0.002 <0.002 <0.002 <0.004 <0.004 <0.004 <0.005 <0.005 <0.005 <0.005 <0.005 <0.005 <0.005 <0.005 <0.0052013 Thallium mg/L NA2007, 2013 Zinc mg/L NA <0.020 <0.020 0.020 0.058 0.006 <0.020 0.028 <0.02 <0.02 <0.02 <0.02 <0.02 0.039 <0.02 <0.02Dissolved Metals2007 Antimony mg/L 0.006 1. Basin Plan <0.002 <0.002 <0.002 <0.002 0.002 <0.002 <0.005 <0.005 <0.006 <0.005 <0.005 <0.005 <0.005 <0.005 <0.0052007, 2013 Arsenic mg/L 0.34 16. 40 CFR 131.38 0.002 <0.001 0.003 0.004 0.003 0.003 0.002 0.004 0.004 <0.002 <0.002 <0.002 0.002 <0.001 <0.0012007, 2013 Cadmium mg/L (c) 16. 40 CFR 131.38 <0.001 <0.001 <0.001 0.0002 <0.001 <0.001 <0.001 <0.001 <0.001 <0.001 <0.001 <0.001 <0.001 0.001 <0.0012007, 2013 Chromium mg/L (c) 16. 40 CFR 131.38 <0.005 <0.005 <0.005 <0.005 <0.005 <0.005 <0.005 <0.005 <0.005 <0.005 <0.005 <0.005 <0.005 <0.005 <0.0052007, 2013 Copper mg/L (c) 16. 40 CFR 131.38 <0.005 <0.005 <0.005 0.007 <0.005 0.027 <0.005 0.005 0.005 <0.005 <0.005 <0.005 <0.005 0.005 <0.0052013 Iron mg/L NA2007, 2013 Lead mg/L (c) 16. 40 CFR 131.38 <0.002 <0.002 <0.002 <0.002 0.002 <0.002 <0.002 <0.002 <0.002 <0.002 <0.002 <0.002 <0.002 <0.002 <0.0022013 Mercury mg/L NA2007, 2013 Nickel mg/L (c) 16. 40 CFR 131.38 <0.002 0.003 <0.002 0.003 <0.002 0.002 0.002 0.002 <0.002 0.003 0.002 0.002 0.003 0.003 0.0022007, 2013 Selenium mg/L NA <0.002 <0.002 <0.002 <0.004 <0.004 <0.004 <0.005 <0.005 <0.005 <0.005 <0.005 <0.005 <0.005 <0.005 <0.0052013 Thallium mg/L NA2007, 2013 Zinc mg/L (c) 16. 40 CFR 131.38 <0.020 <0.020 <0.020 <0.020 0.020 0.106 <0.02 <0.02 <0.02 <0.02 <0.02 <0.02 0.036 <0.02 <0.02
Permit Requirement Units Water Quality
Benchmarks Benchmark References2003-20042001-2002 2002-2003
Analyte
Historical Monitoring Data
2004-2005 2005-2006

Wet Weather Historical Monitoring Table for LPC-MLS
11/29/01 02/17/02 03/17/02 11/08/02 12/16/02 02/11/03 11/12/03 02/03/04 02/18/04 10/17/04 02/11/05 02/18/05 10/17/05 02/20/06 02/28/06
Permit Requirement Units Water Quality
Benchmarks Benchmark References2003-20042001-2002 2002-2003
Analyte
Historical Monitoring Data
2004-2005 2005-2006
Organophosphorus Pesticides2013 Azinphos methyl (Guthion) µg/L NA2013 Bolstar µg/L NA
2007, 2013 Chlorpyrifos µg/L 0.02 acute / 0.014 chronic 12. CA Dept. of Fish & Game, 2000 <0.03* <0.03* <0.03* 0.055 0.067 <0.03* <0.01 <0.01 <0.01 <0.01 <0.01 <0.01 <0.01 <0.02 <0.02
2013 Coumaphos µg/L NA2013 Demeton-o µg/L NA2013 Demeton-s µg/L NA
2007, 2013 Diazinon µg/L 0.08 acute / 0.05 chronic
12. CA Dept. of Fish & Game, 2000, 11. Chollas Creek TMDL for Diazinon, 10. USEPA, Aquatic Life Ambient
Water Quality Criteria Diazinon0.12 0.06 0.13 0.231 0.040 0.077 <0.01 <0.01 <0.01 <0.01 <0.01 <0.01 <0.01 <0.02 <0.02
2013 Dichlorvos µg/L NA2013 Dimethoate µg/L NA2013 Disulfoton µg/L NA2013 Ethoprop µg/L NA2013 Ethyl parathion µg/L NA2013 Fensulfothion µg/L NA2013 Fenthion µg/L NA2007, 2013 Malathion µg/L 0.43 13. CA Dept. of Fish & Game, 1998, 5. Goldbook <0.10 <0.10 <0.10 <0.01 <0.01 <0.01 <0.01 <0.01 <0.01 0.045 0.028 0.0392013 Merphos µg/L NA2013 Methyl parathion µg/L NA2013 Mevinphos µg/L NA2013 Naled µg/L NA2013 Phorate µg/L NA2013 Ronnel µg/L NA2013 Stirophos µg/L NA2013 Tokuthion (Prothiofos) µg/L NA2013 Trichloronate µg/L NAPyrethroids2007, 2013 Allethrin µg/L NA2007, 2013 Bifenthrin µg/L 0.0093 15. Anderson et al., 20062007, 2013 Cyfluthrin µg/L 0.344 17. Wheelock et al., 20042007, 2013 Cyhalothrin, Total Lambda µg/L 0.20 17. Wheelock et al., 20042007, 2013 Cypermethrin µg/L 0.683 17. Wheelock et al., 20042007, 2013 Danitol (Fenpropathrin) µg/L NA2007, 2013 Deltamethrin/Tralomethrin µg/L NA2007, 2013 Esfenvalerate µg/L 0.25 17. Wheelock et al., 20042007, 2013 Fenvalerate µg/L NA2007, 2013 Fluvalinate µg/L NA2007, 2013 Permethrin µg/L 0.021 15. Anderson et al., 20062007, 2013 Prallethrin µg/L NA2007, 2013 Resmethrin µg/L NAToxicity2007 Ceriodaphnia 96-hr LC50 (%) >100 >100 >100 >100 >100 >100 >100 >100 >100 >100 >100 >100 >100 >100 >100 >1002007 Ceriodaphnia 7-day survival NOEC (%) 100 100 100 100 100 100 100 100 100 100 100 100 100 100 100 1002013 Ceriodaphnia 7-day survival TST Pass/Fail2007 Ceriodaphnia 7-day reproduction NOEC (%) 100 100 100 100 100 100 100 100 100 100 100 100 100 100 100 1002013 Ceriodaphnia 7-day reproduction TST Pass/Fail2007 Hyalella 96-hr LC50 (%) >100 >100 >100 >100 >100 >100 >100 >100 >100 >100 >100 >100 >100 >100 >100 >1002007 Selenastrum 96-hr NOEC (%) 100 100 100 100 100 100 100 100 100 100 100 100 100 100^ 100 1002013 Selenastrum 96-hr TST Pass/Fail2013 Pimephales 7-day survival TST Pass/Fail2013 Pimephales 7-day biomass TST Pass/Fail2013 Strongylocentrotus 96-hr TST Pass/FailSee last page for footnotes and source references.

Wet Weather Historical Monitoring Table for LPC-MLS
Physical Chemistry2013 Dissolved Oxygen mg/L <5.0 (a) 1. Basin Plan2007, 2013 pH pH units 6.5-9.0 1. Basin Plan2007, 2013 Specific Conductivity µmhos/cm NA2007, 2013 Water Temperature Celsius NA2007, 2013 Turbidity NTU 20 1. Basin PlanBacteriological2007, 2013 Enterococcus MPN/100 mL NA2007, 2013 Fecal Coliform MPN/100 mL 4,000 1.Basin Plan REC-1/REC-2 2007, 2013 Total Coliform MPN/100 mL NANutrients2007, 2013 Ammonia as N mg/L (b) 6. USEPA Water Quality Criteria (Freshwater)2007, 2013 Nitrate as N mg/L 10 1. Basin Plan2007, 2013 Nitrite as N mg/L 1 1. Basin Plan2007, 2013 Total Kjeldahl Nitrogen mg/L NA2007 Dissolved Phosphorus mg/L 2 4. MSGP 20152013 Orthophosphate mg/L NA2007, 2013 Total Phosphorus mg/L 2 4. MSGP 2015General Chemistry2007 Biochemical Oxygen Demand mg/L 30 4. MSGP 2000, 8. McNeeley (1979)2007 Chemical Oxygen Demand mg/L 120 4. MSGP 20002007, 2013 Dissolved Organic Carbon mg/L NA2007, 2013 Total Organic Carbon mg/L NA
2007 Oil and Grease mg/L 10 1. Basin Plan, 3. Anacostia River TMDL, 4. MSGP 2015
2013 Sulfate mg/L 250 (a) 1. Basin Plan2007, 2013 Surfactants (MBAS) mg/L 0.5 1. Basin Plan2007, 2013 Total Dissolved Solids mg/L 500 (a) 1. Basin Plan2007, 2013 Total Suspended Solids mg/L 100 4. MSGP 2015 , 1. Basin Plan2007, 2013 Total Hardness mg CaCO3/L NATotal Metals2007 Antimony mg/L NA2007, 2013 Arsenic mg/L NA2007, 2013 Cadmium mg/L NA2007, 2013 Chromium mg/L NA2007, 2013 Copper mg/L NA2013 Iron mg/L 0.3 (a) 1. Basin Plan2007, 2013 Lead mg/L NA2013 Mercury mg/L NA2007, 2013 Nickel mg/L NA2007, 2013 Selenium mg/L 0.005 16. 40 CFR 131.382013 Thallium mg/L NA2007, 2013 Zinc mg/L NADissolved Metals2007 Antimony mg/L 0.006 1. Basin Plan2007, 2013 Arsenic mg/L 0.34 16. 40 CFR 131.382007, 2013 Cadmium mg/L (c) 16. 40 CFR 131.382007, 2013 Chromium mg/L (c) 16. 40 CFR 131.382007, 2013 Copper mg/L (c) 16. 40 CFR 131.382013 Iron mg/L NA2007, 2013 Lead mg/L (c) 16. 40 CFR 131.382013 Mercury mg/L NA2007, 2013 Nickel mg/L (c) 16. 40 CFR 131.382007, 2013 Selenium mg/L NA2013 Thallium mg/L NA2007, 2013 Zinc mg/L (c) 16. 40 CFR 131.38
Permit Requirement Units Water Quality
Benchmarks Benchmark ReferencesAnalyte2008-2009 2009-2010 2011-2012
12/10/06 01/30/07 02/19/07 11/30/07 02/03/08-02/04/08 11/11/08 - 10/20/10 02/17/11-
02/18/11 - 10/12/12 02/09/13
7.73 8.08 7.21 7.11 8.33 7.82 7.28 7.96 7.63 7.993,300 3,270 974 1,253 1,336 4,760 687 2,960 4,440 3,00013.50 10.50 14.60 16.40 12.30 15.00 16.80 10.40 16.3 10.16.86 3.6 70.8 73 14.9 4.1 16 2.6 8.2 1.5
230 300 13,000 22,000 3,000 11,000 170,000 1,700 5,000 500800 500 2,300 22,000 300 5,000 50,000 1,112 30,000 500
1,300 800 30,000 22,000 5,000 50,000 230,000 35,000 500,000 13,000
0.37 <0.1 0.94 0.44 <0.03 0.08 0.14 0.15 0.3 0.07J<0.05 <0.05 0.47 1.7 0.38 0.55 0.93 0.21 0.84 <0.1<0.05 <0.05 <0.05 0.07 <0.05 0.06 0.15 0.024J 0.19 <0.1
0.5 0.6 2.1 2.7 0.84 1.7 0.88 0.56 1.9 0.450.09 0.1 0.26 0.63 0.17 0.301 0.35 0.12 0.4 0.11
0.22 0.24 0.35 0.91 0.21 0.35 0.37 0.14 0.53 0.12
<2 3.87 6.01 15 <2 4.7 5.2 2.3 15 1.6J58 45 37 75 28 99 45 27 73 26
11.6 10.4 11 20 7 19 12 7.9 24 6.311.6 11.2 11.9 21.7 6.5 18.7 11 8 24 6.6
<5 <5 <5 2.3J <5 <5 <5 <5 <5 <5
<0.5 <0.5 <0.5 0.25 0.10 0.24 <0.05 0.099 0.18 0.0541,890 1,760 1,080 906 822 2,360 630 1,400 2,400 1,600
22 <20 81 130 26 6.8 34 8 43 31,080 908 572 219.6 178.4 809.5 250 700 1,020 728
<0.002 <0.002 0.002 0.001 0.0007 0.0007 0.00093 0.00038J 0.00067 0.00031J<0.001 <0.001 0.003 0.0048 0.0028 0.0048 0.0033 0.0024 0.0051 0.00240.007 <0.001 <0.001 <0.0004 <0.0004 <0.0004 0.000048J 0.000024J 0.00009J 0.00002J
<0.005 <0.005 <0.005 0.0013 0.0008 0.0003J 0.0012 0.00042 0.00049 0.000220.006 0.006 0.011 0.0077 0.0033 0.0023 0.0055 0.0023 0.004 0.0016
0.001 <0.001 0.003 0.0023 0.00039 0.0002 0.0012 0.00015J 0.00049 0.00006J
0.004 0.004 0.005 0.0025 0.0012 0.0023 0.0023 0.0037 0.0027 0.0011<0.004 <0.004 <0.004 0.0006 0.0005 0.0007 0.00046 0.00082 0.00077 0.0005
<0.02 0.024 0.064 0.025 0.006 0.004 0.012 0.002J 0.013 0.0018J
<0.002 <0.002 0.002 0.0009 0.0007 0.0007 0.00089 0.00037J 0.0006 0.00031J<0.001 <0.001 <0.001 0.0038 0.0029 0.0053 0.0028 0.0022 0.0046 0.0023<0.001 <0.001 <0.001 <0.0004 <0.0004 <0.0004 0.000017J 0.000021J 0.00006J 0.00002J<0.005 <0.005 <0.005 0.0003J 0.0004J 0.0001J 0.00023 0.00021 0.00014J 0.000280.002 0.003 0.003 0.0037 0.0028 0.0023 0.0039 0.0021 0.0032 0.0015
<0.001 <0.001 <0.001 0.00006J <0.0001 <0.0001 0.000071J <0.0002 0.00006J <0.0002
0.003 0.002 0.002 0.0015 0.0012 0.0021 0.0019 0.0034 0.0024 0.0011<0.004 <0.004 <0.004 0.0005 0.0005 0.0008 0.00046 0.00065 0.00064 0.00049
<0.02 <0.02 <0.02 0.0055 0.0023 0.0029 0.0053 0.0019J 0.0094 0.0048J
2010-2011 2012-2013
Historical Monitoring Data
No
Sam
ples
Col
lect
ed
No
Sam
ples
Col
lect
ed
2006-2007 2007-2008
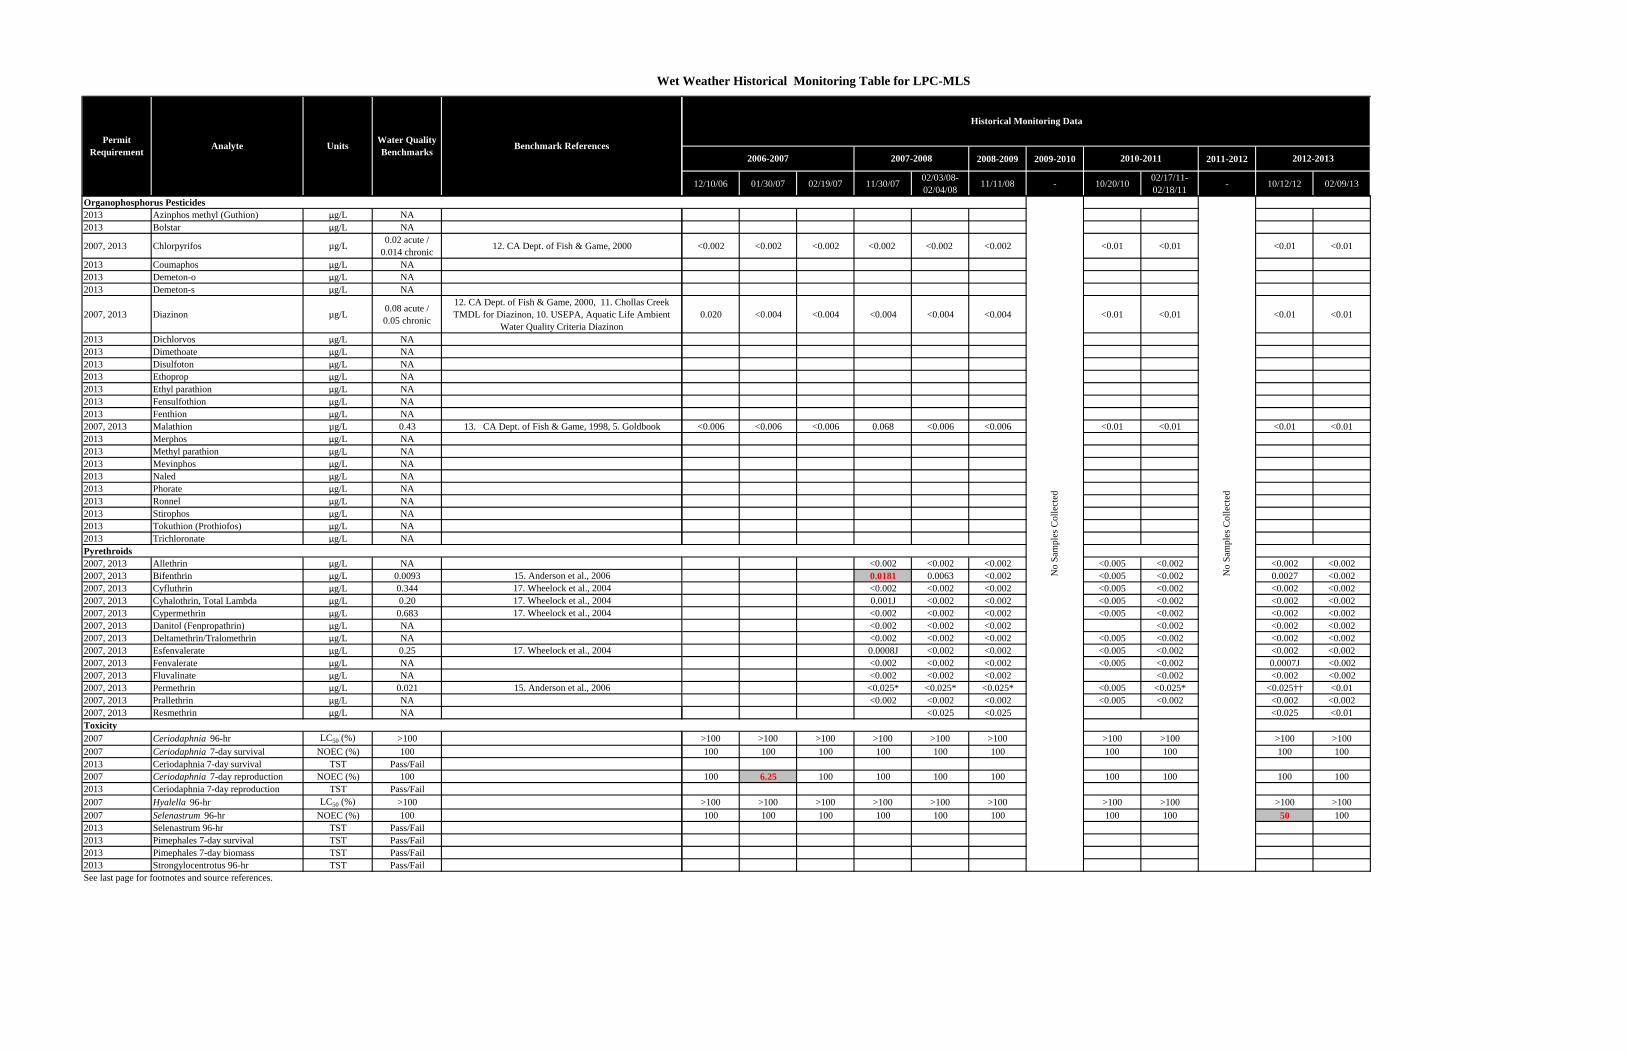
Wet Weather Historical Monitoring Table for LPC-MLS
Permit Requirement Units Water Quality
Benchmarks Benchmark ReferencesAnalyte
Organophosphorus Pesticides2013 Azinphos methyl (Guthion) µg/L NA2013 Bolstar µg/L NA
2007, 2013 Chlorpyrifos µg/L 0.02 acute / 0.014 chronic 12. CA Dept. of Fish & Game, 2000
2013 Coumaphos µg/L NA2013 Demeton-o µg/L NA2013 Demeton-s µg/L NA
2007, 2013 Diazinon µg/L 0.08 acute / 0.05 chronic
12. CA Dept. of Fish & Game, 2000, 11. Chollas Creek TMDL for Diazinon, 10. USEPA, Aquatic Life Ambient
Water Quality Criteria Diazinon2013 Dichlorvos µg/L NA2013 Dimethoate µg/L NA2013 Disulfoton µg/L NA2013 Ethoprop µg/L NA2013 Ethyl parathion µg/L NA2013 Fensulfothion µg/L NA2013 Fenthion µg/L NA2007, 2013 Malathion µg/L 0.43 13. CA Dept. of Fish & Game, 1998, 5. Goldbook2013 Merphos µg/L NA2013 Methyl parathion µg/L NA2013 Mevinphos µg/L NA2013 Naled µg/L NA2013 Phorate µg/L NA2013 Ronnel µg/L NA2013 Stirophos µg/L NA2013 Tokuthion (Prothiofos) µg/L NA2013 Trichloronate µg/L NAPyrethroids2007, 2013 Allethrin µg/L NA2007, 2013 Bifenthrin µg/L 0.0093 15. Anderson et al., 20062007, 2013 Cyfluthrin µg/L 0.344 17. Wheelock et al., 20042007, 2013 Cyhalothrin, Total Lambda µg/L 0.20 17. Wheelock et al., 20042007, 2013 Cypermethrin µg/L 0.683 17. Wheelock et al., 20042007, 2013 Danitol (Fenpropathrin) µg/L NA2007, 2013 Deltamethrin/Tralomethrin µg/L NA2007, 2013 Esfenvalerate µg/L 0.25 17. Wheelock et al., 20042007, 2013 Fenvalerate µg/L NA2007, 2013 Fluvalinate µg/L NA2007, 2013 Permethrin µg/L 0.021 15. Anderson et al., 20062007, 2013 Prallethrin µg/L NA2007, 2013 Resmethrin µg/L NAToxicity2007 Ceriodaphnia 96-hr LC50 (%) >1002007 Ceriodaphnia 7-day survival NOEC (%) 1002013 Ceriodaphnia 7-day survival TST Pass/Fail2007 Ceriodaphnia 7-day reproduction NOEC (%) 1002013 Ceriodaphnia 7-day reproduction TST Pass/Fail2007 Hyalella 96-hr LC50 (%) >1002007 Selenastrum 96-hr NOEC (%) 1002013 Selenastrum 96-hr TST Pass/Fail2013 Pimephales 7-day survival TST Pass/Fail2013 Pimephales 7-day biomass TST Pass/Fail2013 Strongylocentrotus 96-hr TST Pass/FailSee last page for footnotes and source references.
2008-2009 2009-2010 2011-2012
12/10/06 01/30/07 02/19/07 11/30/07 02/03/08-02/04/08 11/11/08 - 10/20/10 02/17/11-
02/18/11 - 10/12/12 02/09/13
2010-2011 2012-2013
Historical Monitoring Data
2006-2007 2007-2008
<0.002 <0.002 <0.002 <0.002 <0.002 <0.002 <0.01 <0.01 <0.01 <0.01
0.020 <0.004 <0.004 <0.004 <0.004 <0.004 <0.01 <0.01 <0.01 <0.01
<0.006 <0.006 <0.006 0.068 <0.006 <0.006 <0.01 <0.01 <0.01 <0.01
<0.002 <0.002 <0.002 <0.005 <0.002 <0.002 <0.0020.0181 0.0063 <0.002 <0.005 <0.002 0.0027 <0.002<0.002 <0.002 <0.002 <0.005 <0.002 <0.002 <0.0020.001J <0.002 <0.002 <0.005 <0.002 <0.002 <0.002<0.002 <0.002 <0.002 <0.005 <0.002 <0.002 <0.002<0.002 <0.002 <0.002 <0.002 <0.002 <0.002<0.002 <0.002 <0.002 <0.005 <0.002 <0.002 <0.0020.0008J <0.002 <0.002 <0.005 <0.002 <0.002 <0.002<0.002 <0.002 <0.002 <0.005 <0.002 0.0007J <0.002<0.002 <0.002 <0.002 <0.002 <0.002 <0.002
<0.025* <0.025* <0.025* <0.005 <0.025* <0.025†† <0.01<0.002 <0.002 <0.002 <0.005 <0.002 <0.002 <0.002
<0.025 <0.025 <0.025 <0.01
>100 >100 >100 >100 >100 >100 >100 >100 >100 >100100 100 100 100 100 100 100 100 100 100
100 6.25 100 100 100 100 100 100 100 100
>100 >100 >100 >100 >100 >100 >100 >100 >100 >100100 100 100 100 100 100 100 100 50 100
No
Sam
ples
Col
lect
ed
No
Sam
ples
Col
lect
ed

Wet Weather Historical Monitoring Table for LPC-MLS
Physical Chemistry2013 Dissolved Oxygen mg/L <5.0 (a) 1. Basin Plan2007, 2013 pH pH units 6.5-9.0 1. Basin Plan2007, 2013 Specific Conductivity µmhos/cm NA2007, 2013 Water Temperature Celsius NA2007, 2013 Turbidity NTU 20 1. Basin PlanBacteriological2007, 2013 Enterococcus MPN/100 mL NA2007, 2013 Fecal Coliform MPN/100 mL 4,000 1.Basin Plan REC-1/REC-2 2007, 2013 Total Coliform MPN/100 mL NANutrients2007, 2013 Ammonia as N mg/L (b) 6. USEPA Water Quality Criteria (Freshwater)2007, 2013 Nitrate as N mg/L 10 1. Basin Plan2007, 2013 Nitrite as N mg/L 1 1. Basin Plan2007, 2013 Total Kjeldahl Nitrogen mg/L NA2007 Dissolved Phosphorus mg/L 2 4. MSGP 20152013 Orthophosphate mg/L NA2007, 2013 Total Phosphorus mg/L 2 4. MSGP 2015General Chemistry2007 Biochemical Oxygen Demand mg/L 30 4. MSGP 2000, 8. McNeeley (1979)2007 Chemical Oxygen Demand mg/L 120 4. MSGP 20002007, 2013 Dissolved Organic Carbon mg/L NA2007, 2013 Total Organic Carbon mg/L NA
2007 Oil and Grease mg/L 10 1. Basin Plan, 3. Anacostia River TMDL, 4. MSGP 2015
2013 Sulfate mg/L 250 (a) 1. Basin Plan2007, 2013 Surfactants (MBAS) mg/L 0.5 1. Basin Plan2007, 2013 Total Dissolved Solids mg/L 500 (a) 1. Basin Plan2007, 2013 Total Suspended Solids mg/L 100 4. MSGP 2015 , 1. Basin Plan2007, 2013 Total Hardness mg CaCO3/L NATotal Metals2007 Antimony mg/L NA2007, 2013 Arsenic mg/L NA2007, 2013 Cadmium mg/L NA2007, 2013 Chromium mg/L NA2007, 2013 Copper mg/L NA2013 Iron mg/L 0.3 (a) 1. Basin Plan2007, 2013 Lead mg/L NA2013 Mercury mg/L NA2007, 2013 Nickel mg/L NA2007, 2013 Selenium mg/L 0.005 16. 40 CFR 131.382013 Thallium mg/L NA2007, 2013 Zinc mg/L NADissolved Metals2007 Antimony mg/L 0.006 1. Basin Plan2007, 2013 Arsenic mg/L 0.34 16. 40 CFR 131.382007, 2013 Cadmium mg/L (c) 16. 40 CFR 131.382007, 2013 Chromium mg/L (c) 16. 40 CFR 131.382007, 2013 Copper mg/L (c) 16. 40 CFR 131.382013 Iron mg/L NA2007, 2013 Lead mg/L (c) 16. 40 CFR 131.382013 Mercury mg/L NA2007, 2013 Nickel mg/L (c) 16. 40 CFR 131.382007, 2013 Selenium mg/L NA2013 Thallium mg/L NA2007, 2013 Zinc mg/L (c) 16. 40 CFR 131.38
Permit Requirement Units Water Quality
Benchmarks Benchmark ReferencesAnalyte
Long Term and
Transitional Monitoring
Long Term and
Transitional Monitoring
Long Term Monitoring
Only
Long Term and
Transitional Monitoring
2013-2014
- 11/01/14 11/21/14-11/22/14
03/01/15-03/02/15
7.48 8.12 8.42 0% NA1
7.63 7.29 7.64 0% 0.282,677 3,433 2,11715.21 16.02 13.3
1.7 11.4 0.2 21% 0.85
500 <2.0 22,0009,000 13 110,000 32% 3.98
24,000 30 170,000
0.059J 0.050J <0.10 0% 0.010.51 0.45 0.28 0% 0.05
0.014J 0.020J 0.013J 0% 0.040.96 0.76 0.440.24 NR 0.17 0% 0.140.21 0.19 0.160.29 0.30 0.20 0% 0.17
4.6 NR 2 0% 0.2349 NR 28 4% 0.4916 15 9.215 14 9
<5.0 NR <5.0 0% 0.16
320 350 140 67% NA1
0.1 0.15 0.094 0% 0.381,400 1,900 810 96% 2.79
34 7 6 11% 0.35651 800 349
0.00042J NR 0.00070.0029 0.0033 0.0024
0.000049J 0.000065J 0.000061J0.001 0.00027 0.000430.005 0.0035 0.0034
1.2 0.27 0.23 33% NA1
0.00098 0.00019J 0.00018J0.0000040J <0.000050 0.000012J
0.0017 0.0048 0.00240.00025J 0.0026 0.00078 0% NA1
<0.00020 <0.00020 <0.000200.021 0.0034J 0.0046J
0.00031J NR 0.00062 0% 0.240.0023 0.003 0.0021 0% 0.01
<0.00010 0.000044J <0.00010 0% 0.020.00013J 0.00015J 0.00026 0% 0.00
0.003 0.0032 0.0026 0% 0.090.031 0.038 0.038
<0.00020 <0.00020 <0.00020 0% 0.00<0.000050 <0.000050 0.000013J
0.0011 0.0048 0.0018 0% 0.000.00022J 0.0024 0.00067<0.00020 <0.00020 <0.00020
0.0062 0.0022J 0.0027J 0% 0.03
No
Sam
ples
Col
lect
ed
Frequency Above
Benchmarks
Mean Ratio to Benchmarks
2014-2015

Wet Weather Historical Monitoring Table for LPC-MLS
Permit Requirement Units Water Quality
Benchmarks Benchmark ReferencesAnalyte
Organophosphorus Pesticides2013 Azinphos methyl (Guthion) µg/L NA2013 Bolstar µg/L NA
2007, 2013 Chlorpyrifos µg/L 0.02 acute / 0.014 chronic 12. CA Dept. of Fish & Game, 2000
2013 Coumaphos µg/L NA2013 Demeton-o µg/L NA2013 Demeton-s µg/L NA
2007, 2013 Diazinon µg/L 0.08 acute / 0.05 chronic
12. CA Dept. of Fish & Game, 2000, 11. Chollas Creek TMDL for Diazinon, 10. USEPA, Aquatic Life Ambient
Water Quality Criteria Diazinon2013 Dichlorvos µg/L NA2013 Dimethoate µg/L NA2013 Disulfoton µg/L NA2013 Ethoprop µg/L NA2013 Ethyl parathion µg/L NA2013 Fensulfothion µg/L NA2013 Fenthion µg/L NA2007, 2013 Malathion µg/L 0.43 13. CA Dept. of Fish & Game, 1998, 5. Goldbook2013 Merphos µg/L NA2013 Methyl parathion µg/L NA2013 Mevinphos µg/L NA2013 Naled µg/L NA2013 Phorate µg/L NA2013 Ronnel µg/L NA2013 Stirophos µg/L NA2013 Tokuthion (Prothiofos) µg/L NA2013 Trichloronate µg/L NAPyrethroids2007, 2013 Allethrin µg/L NA2007, 2013 Bifenthrin µg/L 0.0093 15. Anderson et al., 20062007, 2013 Cyfluthrin µg/L 0.344 17. Wheelock et al., 20042007, 2013 Cyhalothrin, Total Lambda µg/L 0.20 17. Wheelock et al., 20042007, 2013 Cypermethrin µg/L 0.683 17. Wheelock et al., 20042007, 2013 Danitol (Fenpropathrin) µg/L NA2007, 2013 Deltamethrin/Tralomethrin µg/L NA2007, 2013 Esfenvalerate µg/L 0.25 17. Wheelock et al., 20042007, 2013 Fenvalerate µg/L NA2007, 2013 Fluvalinate µg/L NA2007, 2013 Permethrin µg/L 0.021 15. Anderson et al., 20062007, 2013 Prallethrin µg/L NA2007, 2013 Resmethrin µg/L NAToxicity2007 Ceriodaphnia 96-hr LC50 (%) >1002007 Ceriodaphnia 7-day survival NOEC (%) 1002013 Ceriodaphnia 7-day survival TST Pass/Fail2007 Ceriodaphnia 7-day reproduction NOEC (%) 1002013 Ceriodaphnia 7-day reproduction TST Pass/Fail2007 Hyalella 96-hr LC50 (%) >1002007 Selenastrum 96-hr NOEC (%) 1002013 Selenastrum 96-hr TST Pass/Fail2013 Pimephales 7-day survival TST Pass/Fail2013 Pimephales 7-day biomass TST Pass/Fail2013 Strongylocentrotus 96-hr TST Pass/FailSee last page for footnotes and source references.
Long Term and
Transitional Monitoring
Long Term and
Transitional Monitoring
Long Term Monitoring
Only
Long Term and
Transitional Monitoring
2013-2014
- 11/01/14 11/21/14-11/22/14
03/01/15-03/02/15
Frequency Above
Benchmarks
Mean Ratio to Benchmarks
2014-2015
<0.010 <0.010 <0.010<0.010 <0.010 <0.010
<0.010 <0.010 <0.010 8% 0.45
<0.010 <0.010 <0.010<0.010 <0.010 <0.010BS-L<0.010 <0.010 <0.010
<0.010BS-L <0.010 <0.010 11% 0.35
<0.010 <0.010 <0.010<0.010 <0.010 <0.010<0.010 <0.010 <0.010<0.010 <0.010 <0.010<0.010 <0.010 <0.010<0.010 0.0036J 0.0031J<0.010 <0.010 <0.010<0.010 <0.010 <0.010 0% 0.04<0.010 <0.010 <0.010<0.010 <0.010 <0.010<0.010 <0.010 <0.010<0.010 <0.010 <0.010<0.010 <0.010 <0.010<0.010 <0.010 <0.010<0.010 <0.010 <0.010<0.010 <0.010 <0.010<0.010 <0.010 <0.010
<0.002 <0.002 <0.0020.0029 <0.002 <0.002 10% 0.40<0.002 <0.002 <0.002 0% 0.000.0063 <0.002 <0.002 0% 0.05<0.002 <0.002 <0.002 0% 0.00<0.002 <0.002 <0.002<0.002 <0.002 <0.002<0.002 <0.002 <0.002 0% 0.00<0.002 <0.002 <0.002<0.002 <0.002 <0.002<0.01 <0.01 <0.01 0% 0.33
<0.002 <0.002 <0.002<0.01 <0.01 <0.01
>100 NR >100 0% 1.00100 NR 100 0% 1.00NR NR Pass 0%100 NR 100 4% 1.56NR NR Pass 0%
>100 NR >100 0% 1.00100 NR 100 4% 1.04NR NR Pass 0%NR NR Pass 0%NR NR Pass 0%Pass Pass NR 0%
No
Sam
ples
Col
lect
ed

Wet Weather Historical Monitoring Table for LPC-MLSBlank spaces have been verified and no data is available.
NA indicate no criteria or published value was available or applicable to the matrix or program.(a) Water Quality Benchmark are based on the San Diego Regional Water Quality Control Plan by watershed for the San Diego Region (Basin Plan), 1994 (with amendments effective on or before April 4, 2011) and may vary by hydrologic area.
(c) Water Quality Benchmark for dissolved metal fractions are based on total hardness and are calculated as described by the USEPA Federal Register Doc. 40 CFR Part 131, May 18, 2000. The Criteria Maximum Concentration (CMC) was used.
* Indicates detection limit above water quality benchmark.^ Indicates results should be interpreted with care due to method protocol discrepancy.£ Historical results for Deltamethrin/Tralomethrin contain results reported by lab as Deltamethrin.†† Permethrin was non-detect at the method detection limit of 0.005 µg/L. BS-L - Blank Spike recovery of this analyte was below the control limits. Results may be biased low.J-Analyte was detected at a concentration below the reporting limit and above the method detection limit. Reported value is estimated.NA1 Three or more years of data required to calculate the Mean Ratio to Benchmark.NR - Sampling of this analyte not required for transitional monitoring (RWQCB Order No. R9-2007-0001) and/or for long term monitoring (RWQCB Order No. R9-2013-0001).
SourcesPlease refer to the San Diego County Copermittee Regional Monitoring Program Benchmark Sources in Attachment B to Appendix A for benchmark source citations.
(b) Prior to the 2014-2015 monitoring year, Water Quality Benchmark was calculated based on CMC (salmonids absent) using pH described in the U.S. EPA, 1999 Update of Ambient Water Quality Criteria for Ammonia, EPA-822-R-99-014, December 1999. For 2014-2015 monitoring year, Water Quality Benchmark CMC was calculated based on pH and water temperature (when applicable) as described in the U.S. EPA, 2013 Aquatic Life Ambient Water Quality Criteria for Ammonia - Freshwater, EPA-822-R-13-001, April 2013.
Values with red bold font and shading do not meet Water Quality Benchmarks.

Wet Weather Historical Monitoring Table for SDR-TWAS-1
2010-2011 2012-2013 2014-2015
11/28/09 11/30/09 02/06/10 - 10/05/11-10/06/11 02/07/12 - 10/10/13 02/28/14-
03/01/14 -
Physical Chemistry2007, 2013 pH pH units 6.5-9.0 1. Basin Plan 7.51 7.61 7.24 7.34 7.58 6.7 7.38 0% 0.332007, 2013 Specific Conductivity µmhos/cm NA 1,750 4,580 1,431 1,388 1,523 1,832 7372007, 2013 Water Temperature Celsius NA 13.90 13.30 14.80 19.0 14.2 15.4 17.72007, 2013 Turbidity NTU 20 1. Basin Plan 31.2 6.1 25.2 36 7.4 AE AE 75% 1.25Bacteriological2007, 2013 Enterococcus MPN/100 mL NA 170,000 2,300 2,300 500,000 1,700 46,000 110,0002007, 2013 Fecal Coliform MPN/100 mL 400 1. Basin Plan REC-1/REC-2 140,000 5,000 3,000 80,000 700 33,000 7,000 100% 109.882007, 2013 Total Coliform MPN/100 mL NA 280,000 70,000 30,000 300,000 13,000 170,000 49,000Nutrients2007, 2013 Ammonia as N mg/L (a) 6. U.S. EPA Water Quality Criteria (Freshwater) 0.95 <0.03 0.09 0.6 <0.1 1.2 0.14 0% 0.022007, 2013 Nitrate as N mg/L 10 1. Basin Plan 1.64 0.07 0.62 1.2 <0.1 1.7 0.33 0% 0.092007, 2013 Nitrite as N mg/L 1 1. Basin Plan 0.06 0.06 <0.15 0.035J <0.1 0.096J 0.025J 0% 0.072007, 2013 Total Kjeldahl Nitrogen mg/L NA 3.58 1.282 0.922J 2.9 0.85 3.3 0.782007 Dissolved Phosphorus mg/L 2 4. MSGP 2015 0.281 0.312 0.129 0.25 0.084 0.24 0.22 0% 0.102007, 2013 Total Phosphorus mg/L 2 4. MSGP 2015 0.441 0.394 0.214 0.49 0.11 0.28 0.19 0% 0.14General Chemistry2007, 2013 Biochemical Oxygen Demand mg/L 30 4. MSGP 2015, 8. McNeeley (1979) <2 4.5 <2 18 3.9† 17 7.5 0% 0.292007 Chemical Oxygen Demand mg/L 120 4. MSGP 2015 98.9 50.3 53 89 32 120 32 0% 0.592007, 2013 Dissolved Organic Carbon mg/L NA 29.9 12.9 9.4 14 6.6 35 8.12007, 2013 Total Organic Carbon mg/L NA 31.8 12.7 17.1 17 7.1 39 8.32007, 2013 Oil & Grease mg/L 10 1. Basin Plan, 3. Anacostia River TMDL, 4. MSGP 2015 1.4J <5 1.7J <5 <5 2.6J 1.6J 0% 0.212007, 2013 Surfactants (MBAS) mg/L 0.5 1. Basin Plan 0.79H 0.129 0.107 0.36 0.094 1.1 0.17 33% 0.872007, 2013 Total Dissolved Solids mg/L 1,500 (b) 1. Basin Plan 1,712 2,646 804B 1,100 850 1,400 1,000 17% 0.872007, 2013 Total Suspended Solids mg/L 100 4. MSGP 2015, 1. Basin Plan 26.8 <5 30.5 44 9 34 16 0% 0.272007, 2013 Total Hardness mg CaCO3/L NA 643 1,040.7 301.7 500 510 564 411Total Metals2007 Antimony mg/L NA 0.0017 0.0003J 0.0007 0.0022 0.00055 0.0031 0.000972007, 2013 Arsenic mg/L NA 0.0097 0.0088 0.0038 0.0075 0.0021 0.0068 0.00232007, 2013 Cadmium mg/L NA <0.0004 <0.0004 <0.0004 0.00015 0.000036J 0.00016 0.000049J2007, 2013 Chromium mg/L NA 0.0009 0.0001J 0.0006 0.0023 0.00048 0.002 0.000762007, 2013 Copper mg/L NA 0.0093 0.0013 0.1004 0.019 0.002 0.017 0.00492007, 2013 Lead mg/L NA 0.0027 0.0003 0.0023 0.0064 0.00051 0.0045 0.00132007, 2013 Nickel mg/L NA 0.0038 0.0028 0.0017 0.0056 0.0022 0.0061 0.00132007, 2013 Selenium mg/L 0.005 16. 40 CFR 131.38 <0.0005 0.0005 0.0007 0.00053 0.00034J 0.00097 0.00034J 0% 0.112007, 2013 Zinc mg/L NA 0.0328 <0.0005 0.0217 0.074 0.0041J 0.076 0.017Dissolved Metals2007 Antimony mg/L 0.006 1. Basin Plan 0.0013 0.0003J 0.0006 0.0014 0.0005 0.0025 0.0008 0% 0.202007, 2013 Arsenic mg/L 0.34 16. 40 CFR 131.38 0.0082 0.0090 0.0031 0.0053 0.0019 0.0046 0.0019 0% 0.012007, 2013 Cadmium mg/L (c) 16. 40 CFR 131.38 <0.0004 <0.0004 <0.0004 0.000043J 0.000023J 0.000060J 0.000025J 0% 0.012007, 2013 Chromium mg/L (c) 16. 40 CFR 131.38 0.0004J 0.0001J 0.0002J 0.00048 0.00025 0.00082 0.00044 0% 0.002007, 2013 Copper mg/L (c) 16. 40 CFR 131.38 0.0029 0.0009 0.0026 0.0053 0.0014 0.0069 0.0028 0% 0.082007, 2013 Lead mg/L (c) 16. 40 CFR 131.38 0.0004 <0.0001 0.00008J 0.00031 0.00003J 0.00043 0.00014J 0% 0.002007, 2013 Nickel mg/L (c) 16. 40 CFR 131.38 0.0035 0.0028 0.0014 0.0043 0.002 0.0052 0.0013 0% 0.002007, 2013 Selenium mg/L NA 0.0006 0.0005 0.0006 0.00041 0.00031J 0.00083 0.00027J2007, 2013 Zinc mg/L (c) 16. 40 CFR 131.38 0.0099 0.0017 0.0046 0.023 0.0029J 0.045 0.01 0% 0.04Organophosphorus Pesticides
2007, 2013 Chlorpyrifos µg/L 0.2 (acute) / 0.014 (chronic) 12. CA Dept. of Fish & Game, 2000 <0.002 <0.002 <0.002 <0.01 <0.01 <0.010 <0.010 0% 0.18
2007, 2013 Diazinon µg/L 0.08 (acute) / 0.05 (chronic)
12. CA Dept. of Fish & Game, 2000, 11. Chollas Creek TMDL for Diazinon, 10. USEPA, Aquatic Life Ambient
Water Quality Criteria Diazinon<0.004 <0.004 <0.004 <0.01 <0.01 <0.010 <0.010 0% 0.05
2007, 2013 Malathion µg/L 0.43 13. CA Dept. of Fish & Game, 1998, 5. Goldbook <0.006 <0.006 <0.006 0.05 <0.01 <0.010 <0.010 0% 0.03Pyrethroids2007, 2013 Allethrin µg/L NA <0.0005 <0.0005 0.0468B <0.002 <0.002 <0.002 <0.0022007, 2013 Bifenthrin µg/L 0.0093 15. Anderson et al., 2006 0.0133 <0.0005 0.0338B 0.0412 0.0023 0.016 <0.002 67% 1.932007, 2013 Cyfluthrin µg/L 0.344 17. Wheelock et al., 2004 <0.0005 <0.0005 0.0151 0.0119 <0.002 0.0109 <0.002 0% 0.022007, 2013 Cyhalothrin, Total Lambda µg/L 0.20 17. Wheelock et al., 2004 <0.0005 <0.0005 <0.0005 <0.002 <0.002 <0.002 <0.002 0% 0.002007, 2013 Cypermethrin µg/L 0.683 17. Wheelock et al., 2004 <0.0005 <0.0005 0.0399 <0.002 <0.002 <0.002 <0.002 0% 0.012007, 2013 Danitol (Fenpropathrin) µg/L NA <0.0005 <0.0005 0.0357B <0.002 <0.002 <0.002 <0.0022007, 2013 Deltamethrin/Tralomethrin£ µg/L NA <0.0005 <0.0005 <0.0005 <0.002 <0.002 <0.002 <0.0022007, 2013 Esfenvalerate µg/L 0.25 17. Wheelock et al., 2004 <0.0005 <0.0005 <0.0005 <0.002 <0.002 <0.002 <0.002 0% 0.002007, 2013 Fenvalerate µg/L NA <0.0005 <0.0005 <0.0005 <0.002 <0.002 <0.002 <0.0022007, 2013 Fluvalinate µg/L NA <0.0005 <0.0005 <0.0005 <0.002 <0.002 <0.002 <0.0022007, 2013 Permethrin µg/L 0.021 15. Anderson et al., 2006 <0.005 <0.005 <0.005 <0.025†† 0.0529 <0.01 <0.01 17% 0.542007, 2013 Prallethrin µg/L NA <0.0005 <0.0005 0.0529B <0.002 <0.002 <0.002 <0.0022007, 2013 Resmethrin µg/L NA <0.005 <0.005 <0.025 <0.025 <0.01 <0.01Toxicity2007, 2013 Ceriodaphnia 96-hr LC50 (%) >100 >100 >100 >100 >100 >100 >100 >100 0% 1.002007, 2013 Ceriodaphnia 7-day survival NOEC (%) 100 100 100 100 100 100 100 100 0% 1.002007, 2013 Ceriodaphnia 7-day reproduction NOEC (%) 100 100 50 100 100 100 100 100 14% 1.142007 Hyalella 96-hr LC50 (%) >100 >100 >100 >100 >100 >100 >100 >100 0% 1.002007, 2013 Selenastrum 96-hr NOEC (%) 100 100 100 100 100 100 100 100 0% 1.00See last page for footnotes and source references.
No
Sam
ples
Col
lect
ed
Transitional Monitoring
Mean Ratio to Benchmarks
Frequency Above
BenchmarksAnalyte Units Water Quality
Benchmarks Benchmark References 2013-2014
No
Sam
ples
Col
lect
ed
No
Sam
ples
Col
lect
ed
Permit Requirement 2009-2010** 2011-2012
Historical Monitoring Data

Wet Weather Historical Monitoring Table for SDR-TWAS-1
Blank spaces have been verified and no data is available due to changes in the monitoring program.
NA indicate no criteria or published value was available or applicable to the matrix or program.
(b) Water Quality Benchmark is based on the San Diego Regional Water Quality Control Plan by watershed for the San Diego Region (Basin Plan), 1994 (with amendments effective on or before April 4, 2011) and may vary by hydrologic area/subarea.(c) Water Quality Benchmark for dissolved metal fractions are based on total hardness and are calculated as described by the USEPA Federal Register Doc. 40 CFR Part 131, May 18, 2000. The Criteria Maximum Concentration (CMC) was used.* Indicates detection limit above water quality benchmark.**Because of the unique drainage characteristics of the sample location, 2 peaks were monitored for this event. For conservative purposes, an exceedance of either sample was used to calculate exceedance frequencies.† Result was from composite sample. The grab sample was analyzed outside of the holding time.£ Historical results for Deltamethrin/Tralomethrin contain results reported by lab as Deltamethrin.†† Permethrin was non-detect at the method detection limit of 0.005 µg/L. AE-Analysis error.B-Analyte was detected in the associated method blank.H-Sample received and/or analyzed past the recommended holding time.J-Analyte was detected at a concentration below the reporting limit and above the method detection limit. Reported value is estimated.
SourcesPlease refer to the San Diego County Copermittee Regional Monitoring Program Benchmark Sources in Attachment B to Appendix A for benchmark source citations.
(a) Prior to the 2014-2015 monitoring year, Water Quality Benchmark was calculated based on CMC (salmonids absent) using pH described in the U.S. EPA, 1999 Update of Ambient Water Quality Criteria for Ammonia, EPA-822-R-99-014, December 1999. For 2014-2015 monitoring year, Water Quality Benchmark CMC was calculated based on pH and water temperature (when applicable) as described in the U.S. EPA, 2013 Aquatic Life Ambient Water Quality Criteria for Ammonia - Freshwater, EPA-822-R-13-001, April 2013.
Values with red bold font and shading do not meet Water Quality Benchmarks.

Wet Weather Historical Monitoring Table for SDR-TWAS-2
2010-2011 2012-2013 2014-2015
11/28/09 02/06/10 - 10/05/11-10/06/11 02/07/12 - 10/10/13 02/28/14-
03/01/14 -
Physical Chemistry2007, 2013 pH pH units 6.5-9.0 1. Basin Plan 5.91 7.80 6.95 7.81 7.65 7.62 17% 0.332007, 2013 Specific Conductivity µmhos/cm NA 292 122 336 1,097 920 2902007, 2013 Water Temperature Celsius NA 13.20 15.30 18.4 13.3 17 17.782007, 2013 Turbidity NTU 20 1. Basin Plan 145.2 142.8 67 31 AE 59.3 100% 4.45Bacteriological2007, 2013 Enterococcus MPN/100 mL NA 70,000 110,000 220,000 80,000 110,000 110,0002007, 2013 Fecal Coliform MPN/100 mL 400 1. Basin Plan REC-1/REC-2 130,000 5,000 110,000 80,000 70,000 49,000 100% 185.002007, 2013 Total Coliform MPN/100 mL NA 240,000 170,000 170,000 220,000 460,000 490,000Nutrients2007, 2013 Ammonia as N mg/L (a) 6. U.S. EPA Water Quality Criteria (Freshwater) 1.11 0.12 0.8 0.2 1.2 0.15 0% 0.032007, 2013 Nitrate as N mg/L 10 1. Basin Plan 1.55 0.74 1.9 2.1 2.1 0.58 0% 0.152007, 2013 Nitrite as N mg/L 1 1. Basin Plan 0.08 <0.15 0.049J 0.1 0.12 0.046J 0% 0.082007, 2013 Total Kjeldahl Nitrogen mg/L NA 4.58 1.162 4.5 2.2 4.3 1.22007 Dissolved Phosphorus mg/L 2 4. MSGP 2015 0.337 0.12 0.15 0.095 0.25 0.16 0% 0.092007, 2013 Total Phosphorus mg/L 2 4. MSGP 2015 0.709 0.254 0.73 0.23 0.89 0.27 0% 0.26General Chemistry2007, 2013 Biochemical Oxygen Demand mg/L 30 4. MSGP 2015, 8. McNeeley (1979) 39.4 5.3 28 15† 50 6.9 33% 0.742007 Chemical Oxygen Demand mg/L 120 4. MSGP 2015 64.4 51.1 140 71 140 46 33% 0.712007, 2013 Dissolved Organic Carbon mg/L NA 22.6 7.3 14 11 32 6.82007, 2013 Total Organic Carbon mg/L NA 25.4 8 19 14 38 7.92007, 2013 Oil and Grease mg/L 10 1. Basin Plan, 3. Anacostia River TMDL, 4. MSGP 2015 4.6J 2.8J <5 <5 4.7J 2.1J 0% 0.322007, 2013 Surfactants (MBAS) mg/L 0.5 1. Basin Plan 0.48H 0.054 0.38 0.23 0.85 0.11 17% 0.702007, 2013 Total Dissolved Solids mg/L 1,000 (b) 1. Basin Plan 342 304B 450 620 390 270 0% 0.402007, 2013 Total Suspended Solids mg/L 100 4. MSGP 2015, 1. Basin Plan 233 209 250 37 230 66 67% 1.712007, 2013 Total Hardness mg CaCO3/L NA 131 110.9 220 290 163 109Total Metals2007 Antimony mg/L NA 0.0016 0.0010 0.0019 0.0016 0.0033 0.00152007, 2013 Arsenic mg/L NA 0.0043 0.0029 0.012 0.0029 0.0059 0.00322007, 2013 Cadmium mg/L NA 0.0003J 0.0002J 0.0005 0.00011 0.00047 0.000182007, 2013 Chromium mg/L NA 0.0032 0.0020 0.0084 0.0019 0.0062 0.00332007, 2013 Copper mg/L NA 0.0264 0.0158 0.042 0.013 0.038 0.0152007, 2013 Lead mg/L NA 0.0149 0.0133 0.023 0.0037 0.017 0.00742007, 2013 Nickel mg/L NA 0.0053 0.0030 0.01 0.0039 0.01 0.00292007, 2013 Selenium mg/L 0.005 16. 40 CFR 131.38 <0.0005 0.0009 0.00088 0.00052 0.00083 0.00028J 0% 0.122007, 2013 Zinc mg/L NA 0.1822 0.1080 0.21 0.039 0.21 0.068Dissolved Metals2007 Antimony mg/L 0.006 1. Basin Plan 0.0015 0.0009 0.0016 0.0013 0.0024 0.0012 0% 0.252007, 2013 Arsenic mg/L 0.34 16. 40 CFR 131.38 0.0024 0.0017 0.0028 0.0022 0.0024 0.0016 0% 0.012007, 2013 Cadmium mg/L (c) 16. 40 CFR 131.38 <0.0004 <0.0004 0.000061J 0.000049J 0.00012 0.000026J 0% 0.022007, 2013 Chromium mg/L (c) 16. 40 CFR 131.38 0.0009 0.0006 0.00078 0.00072 0.001 0.0007 0% 0.002007, 2013 Copper mg/L (c) 16. 40 CFR 131.38 0.0050 0.0034 0.0067 0.0078 0.0084 0.0045 0% 0.282007, 2013 Lead mg/L (c) 16. 40 CFR 131.38 0.0015 0.0003 0.0006 0.00025 0.0012 0.00028 0% 0.012007, 2013 Nickel mg/L (c) 16. 40 CFR 131.38 0.0030 0.0012 0.0042 0.0028 0.0062 0.0012 0% 0.002007, 2013 Selenium mg/L NA 0.0008 <0.0005 0.00035J 0.00056 0.00059 0.00024J2007, 2013 Zinc mg/L (c) 16. 40 CFR 131.38 0.0322 0.0124 0.022 0.016 0.062 0.012 0% 0.15Organophosphorus Pesticides
2007, 2013 Chlorpyrifos µg/L 0.02 acute / 0.014 chronic 12. CA Dept. of Fish & Game, 2000 <0.002 <0.002 <0.01 <0.01 <0.010 <0.010 0% 0.18
2007, 2013 Diazinon µg/L 0.08 acute / 0.05 chronic
12. CA Dept. of Fish & Game, 2000, 11. Chollas Creek TMDL for Diazinon, 10. USEPA, Aquatic Life Ambient
Water Quality Criteria Diazinon<0.004 <0.004 <0.01 <0.01 <0.010 <0.010 0% 0.05
2007^, 2013 Malathion µg/L 0.43 13. CA Dept. of Fish & Game, 1998, 5. Goldbook <0.006 0.0998 0.069 <0.01 <0.010 0.011 0% 0.07Pyrethroids2007, 2013 Allethrin µg/L NA <0.0005 <0.0005 <0.002 <0.002 <0.002 <0.0022007, 2013 Bifenthrin µg/L 0.0093 15. Anderson et al., 2006 0.084 0.0824B 0.0596 0.0648 0.0406 0.0151 100% 6.212007, 2013 Cyfluthrin µg/L 0.344 17. Wheelock et al., 2004 0.1225 0.0876 0.0159 0.0389 0.0095 <0.002 0% 0.132007, 2013 Cyhalothrin, Total Lambda µg/L 0.20 17. Wheelock et al., 2004 <0.0005 0.01 <0.002 0.0042 <0.002 <0.002 0% 0.042007, 2013 Cypermethrin µg/L 0.683 17. Wheelock et al., 2004 0.0564 0.054 <0.002 0.0125 0.0082 <0.002 0% 0.032007, 2013 Danitol (Fenpropathrin) µg/L NA <0.0005 0.0402B <0.002 <0.002 <0.002 <0.0022007, 2013 Deltamethrin/Tralomethrin£ µg/L NA <0.0005 <0.0005 <0.002 <0.002 <0.002 <0.0022007, 2013 Esfenvalerate µg/L 0.25 17. Wheelock et al., 2004 <0.0005 <0.0005 <0.002 <0.002 <0.002 <0.002 0% 0.002007, 2013 Fenvalerate µg/L NA <0.0005 <0.0005 <0.002 <0.002 <0.002 <0.0022007, 2013 Fluvalinate µg/L NA <0.0005 <0.0005 <0.002 <0.002 <0.002 <0.0022007, 2013 Permethrin µg/L 0.021 15. Anderson et al., 2006 0.0493 0.1064 <0.025†† 0.2326 <0.01 <0.01 50% 3.162007, 2013 Prallethrin µg/L NA <0.0005 <0.0005 <0.002 <0.002 <0.002 <0.0022007, 2013 Resmethrin µg/L NA <0.005 <0.025 <0.025 <0.01 <0.01Toxicity2007, 2013 Ceriodaphnia 96-hr LC50 (%) >100 >100 >100 >100 >100 >100 >100 0% 1.002007, 2013 Ceriodaphnia 7-day survival NOEC (%) 100 100 100 100 100 100 100 0% 1.002007, 2013 Ceriodaphnia 7-day reproduction NOEC (%) 100 100 100 100 100 100 100 0% 1.002007 Hyalella 96-hr LC50 (%) >100 32.2 >100 >100 >100 97 >100 33% 1.362007, 2013 Selenastrum 96-hr NOEC (%) 100 100 100 100 100 100 100 0% 1.00
No
Sam
ples
Col
lect
ed
Transitional Monitoring
Permit Requirement
No
Sam
ples
Col
lect
ed
Units Water Quality Benchmarks Benchmark References
No
Sam
ples
Col
lect
ed
See last page for footnotes and source references.
Mean Ratio to Benchmarks
Frequency Above
BenchmarksAnalyte 2009-2010 2011-2012
Historical Monitoring Data
2013-2014

Wet Weather Historical Monitoring Table for SDR-TWAS-2
NA indicate no criteria or published value was available or applicable to the matrix or program.
(b) Water Quality Benchmark is based on the San Diego Regional Water Quality Control Plan by watershed for the San Diego Region (Basin Plan), 1994 (with amendments effective on or before April 4, 2011) and may vary by hydrologic area/subarea.(c) Water Quality Benchmark for dissolved metal fractions are based on total hardness and are calculated as described by the USEPA Federal Register Doc. 40 CFR Part 131, May 18, 2000. The Criteria Maximum Concentration (CMC) was used.*Indicates detection limit above water quality benchmark† Result was from composite sample. The grab sample was analyzed outside of the holding time.£ Historical results for Deltamethrin/Tralomethrin contain results reported by lab as Deltamethrin.†† Permethrin was non-detect at the method detection limit of 0.005 µg/L. AE-Analysis error.B-Analyte was detected in the associated method blank.H-Sample received and/or analyzed past the recommended holding time.J-Analyte was detected at a concentration below the reporting limit and above the method detection limit. Reported value is estimated.
SourcesPlease refer to the San Diego County Copermittee Regional Monitoring Program Benchmark Sources in Attachment B to Appendix A for benchmark source citations.
(a) Prior to the 2014-2015 monitoring year, Water Quality Benchmark was calculated based on CMC (salmonids absent) using pH described in the U.S. EPA, 1999 Update of Ambient Water Quality Criteria for Ammonia, EPA-822-R-99-014, December 1999. For 2014-2015 monitoring year, Water Quality Benchmark CMC was calculated based on pH and water temperature (when applicable) as described in the U.S. EPA, 2013 Aquatic Life Ambient Water Quality Criteria for Ammonia - Freshwater, EPA-822-R-13-001, April 2013.
Blank spaces have been verified and no data is available.
Values with red bold font and shading do not meet Water Quality Benchmarks.

Wet Weather Historical Monitoring Table for SDR-TWAS-3
2010-2011 2012-2013 2014-2015
11/28/09 02/06/10 -10/05/11-10/06/11
02/07/12-02/08/12 - 10/10/13 02/28/14-
03/01/14 -
Physical Chemistry2007, 2013 pH pH units 6.5-9.0 1. Basin Plan 7.81 7.40 7.25 7.81 7.83 7.73 0% 0.142007, 2013 Specific Conductivity µmhos/cm NA 1,403 1,744 2,330 1,986 2,206 1,5662007, 2013 Water Temperature Celsius NA 11.80 15.30 19.5 12.0 17.28 15.92007, 2013 Turbidity NTU 20 1. Basin Plan 68.7 78.8 7.1 6.2 6.7 AE 40% 1.68Bacteriological2007, 2013 Enterococcus MPN/100 mL NA 70,000 50,000 500 230 270 7,9002007, 2013 Fecal Coliform MPN/100 mL 400 1. Basin Plan REC-1/REC-2 110,000 17,000 130 80 <18 790 50% 53.342007, 2013 Total Coliform MPN/100 mL NA 300,000 50,000 1,700 500 7,000 2,800Nutrients2007, 2013 Ammonia as N mg/L (a) 6. U.S. EPA Water Quality Criteria (Freshwater) 0.64 0.06 0.11 <0.1 0.34 0.1 0% 0.022007, 2013 Nitrate as N mg/L 10 1. Basin Plan 1.02 1.8 0.13 0.37 0.42 0.49 0% 0.072007, 2013 Nitrite as N mg/L 1 1. Basin Plan 0.05 <0.75 <0.1 0.015J 0.043J 0.029J 0% 0.042007, 2013 Total Kjeldahl Nitrogen mg/L NA 2.88 0.794J 0.72 0.66 1.3 0.932007 Dissolved Phosphorus mg/L 2 4. MSGP 2015 0.332 0.129 0.057 0.052 0.23 0.2 0% 0.082007, 2013 Total Phosphorus mg/L 2 4. MSGP 2015 0.497 0.231 0.096 0.075 0.26 0.29 0% 0.12General Chemistry2007, 2013 Biochemical Oxygen Demand mg/L 30 4. MSGP 2015, 8. McNeeley (1979) <2 3.8 2.5 3† 4.4 4 0% 0.102007 Chemical Oxygen Demand mg/L 120 4. MSGP 2015 58.4 31.5 22 18 27 32 0% 0.262007, 2013 Dissolved Organic Carbon mg/L NA 18.8 7.5 3.7 4.2 11 72007, 2013 Total Organic Carbon mg/L NA 20.5 7.3 3.5 4.5 12 7.62007, 2013 Oil and Grease mg/L 10 1. Basin Plan, 3. Anacostia River TMDL, 4. MSGP 2015 <5 <5 <5 1.7J <5.0 1.6J 0% 0.222007, 2013 Surfactants (MBAS) mg/L 0.5 1. Basin Plan 0.059H 0.071 0.04J 0.062 1.1 0.074 17% 0.572007, 2013 Total Dissolved Solids mg/L 1,000 (b) 1. Basin Plan 928 938B 1,200 1,000 1,200 860 33% 1.022007, 2013 Total Suspended Solids mg/L 100 4. MSGP 2015, 1. Basin Plan 69 72.7 7 7 24 59 0% 0.402007, 2013 Total Hardness mg CaCO3/L NA 410.1 459.4 700 680 568 379Total Metals2007 Antimony mg/L NA 0.0006 0.0005 0.00018J 0.00016J 0.00037J 0.00045J2007, 2013 Arsenic mg/L NA 0.0028 0.0018 0.0013 0.00072 0.0012 0.00142007, 2013 Cadmium mg/L NA <0.0004 <0.0004 0.000024J <0.0001 0.000030J 0.000059J2007, 2013 Chromium mg/L NA 0.0012 0.0013 0.00035 0.00019J 0.00053 0.00222007, 2013 Copper mg/L NA 0.0070 0.0055 0.001 0.00064 0.0034 0.00632007, 2013 Lead mg/L NA 0.0036 0.0029 0.00029 0.00021 0.00068 0.00312007, 2013 Nickel mg/L NA 0.0023 0.0019 0.0024 0.0018 0.0013 0.00172007, 2013 Selenium mg/L 0.005 16. 40 CFR 131.38 0.0005 0.0007 0.00068 0.001 0.00046 0.00052 0% 0.132007, 2013 Zinc mg/L NA 0.0269 0.0196 0.0025J 0.0036J 0.014 0.022Dissolved Metals2007 Antimony mg/L 0.006 1. Basin Plan 0.0004J 0.0004J 0.00017J 0.00015J 0.00032J 0.00034J 0% 0.052007, 2013 Arsenic mg/L 0.34 16. 40 CFR 131.38 0.0030 0.0011 0.0012 0.00067 0.001 0.00093 0% 0.002007, 2013 Cadmium mg/L (c) 16. 40 CFR 131.38 <0.0004 <0.0004 <0.0001 <0.0001 <0.00010 0.000018J 0% 0.002007, 2013 Chromium mg/L (c) 16. 40 CFR 131.38 0.0002J 0.0003J <0.0002 <0.0002 0.00016J 0.00033 0% 0.002007, 2013 Copper mg/L (c) 16. 40 CFR 131.38 0.0025 0.0022 0.00058 0.00043J 0.0025 0.002 0% 0.032007, 2013 Lead mg/L (c) 16. 40 CFR 131.38 0.0003 <0.0001 0.000028J 0.000011J <0.00020 0.000067J 0% 0.002007, 2013 Nickel mg/L (c) 16. 40 CFR 131.38 0.0020 0.0013 0.0024 0.002 0.0011 0.00068J 0% 0.002007, 2013 Selenium mg/L NA 0.0013 0.0005 0.00061 0.001 0.0004 0.000472007, 2013 Zinc mg/L (c) 16. 40 CFR 131.38 0.0060 0.0023 0.0024J 0.0016J 0.01 0.0047J 0% 0.01Organophosphorus Pesticides
2007, 2013 Chlorpyrifos µg/L 0.02 acute / 0.014 chronic 12. CA Dept. of Fish & Game, 2000 <0.002 <0.002 <0.01 <0.01 <0.010 <0.010 0% 0.18
2007, 2013 Diazinon µg/L 0.08 acute / 0.05 chronic
12. CA Dept. of Fish & Game, 2000, 11. Chollas Creek TMDL for Diazinon, 10. USEPA, Aquatic Life Ambient
Water Quality Criteria Diazinon<0.004 <0.004 <0.01 <0.01 <0.010 <0.010 0% 0.05
2007^, 2013 Malathion µg/L 0.43 13. CA Dept. of Fish & Game, 1998, 5. Goldbook <0.006 <0.006 <0.01 <0.01 <0.010 0.018 0% 0.02Pyrethroids2007, 2013 Allethrin µg/L NA <0.0005 <0.0005 <0.002 <0.002 <0.002 <0.0022007, 2013 Bifenthrin µg/L 0.0093 15. Anderson et al., 2006 0.0228 0.0395B <0.002 0.0011J 0.0051 <0.002 33% 1.262007, 2013 Cyfluthrin µg/L 0.344 17. Wheelock et al., 2004 0.0155 0.0161 <0.002 <0.002 0.0021 <0.002 0% 0.022007, 2013 Cyhalothrin, Total Lambda µg/L 0.20 17. Wheelock et al., 2004 <0.0005 <0.0005 <0.002 <0.002 <0.002 <0.002 0% 0.042007, 2013 Cypermethrin µg/L 0.683 17. Wheelock et al., 2004 <0.0005 0.0397 <0.002 <0.002 <0.002 <0.002 0% 0.012007, 2013 Danitol (Fenpropathrin) µg/L NA <0.0005 0.0366B <0.002 <0.002 <0.002 <0.0022007, 2013 Deltamethrin/Tralomethrin£ µg/L NA <0.0005 <0.0005 <0.002 <0.002 <0.002 <0.0022007, 2013 Esfenvalerate µg/L 0.25 17. Wheelock et al., 2004 <0.0005 <0.0005 <0.002 <0.002 <0.002 <0.002 0% 0.002007, 2013 Fenvalerate µg/L NA <0.0005 <0.0005 <0.002 <0.002 <0.002 <0.0022007, 2013 Fluvalinate µg/L NA <0.0005 <0.0005 <0.002 <0.002 <0.002 <0.0022007, 2013 Permethrin µg/L 0.021 15. Anderson et al., 2006 0.0208J 0.0155J <0.025†† <0.025†† <0.01 <0.01 0% 0.372007, 2013 Prallethrin µg/L NA <0.0005 <0.0005 <0.002 <0.002 <0.002 <0.0022007, 2013 Resmethrin µg/L NA <0.005 <0.025 <0.025 <0.01 <0.01Toxicity2007, 2013 Ceriodaphnia 96-hr LC50 (%) >100 >100 >100 >100 >100 >100 >100 0% 1.002007, 2013 Ceriodaphnia 7-day survival NOEC (%) 100 100 100 100 100 100 100 0% 1.002007, 2013 Ceriodaphnia 7-day reproduction NOEC (%) 100 100 100 100 100 100 100 0% 1.002007 Hyalella 96-hr LC50 (%) >100 >100 >100 >100 >100 >100 >100 0% 1.002007, 2013 Selenastrum 96-hr NOEC (%) 100 100 100 50 25 100 100 33% 1.67See last page for footnotes and source references.
No
Sam
ples
Col
lect
ed
Transitional Monitoring
Permit Requirement
Mean Ratio to Benchmarks
Frequency Above
Benchmarks2011-2012 2013-2014Analyte Units Water Quality
Benchmarks Benchmark References 2009-2010
Historical Monitoring Data
No
Sam
ples
Col
lect
ed
No
Sam
ples
Col
lect
ed

Wet Weather Historical Monitoring Table for SDR-TWAS-3
Blank spaces have been verified and no data is available.
NA indicate no criteria or published value was available or applicable to the matrix or program.
(b) Water Quality Benchmark is based on the San Diego Regional Water Quality Control Plan by watershed for the San Diego Region (Basin Plan), 1994 (with amendments effective on or before April 4, 2011) and may vary by hydrologic area/subarea.(c) Water Quality Benchmark for dissolved metal fractions are based on total hardness and are calculated as described by the USEPA Federal Register Doc. 40 CFR Part 131, May 18, 2000. The Criteria Maximum Concentration (CMC) was used.*Indicates detection limit above water quality benchmark† Result was from composite sample. The grab sample was analyzed outside of the holding time.£ Historical results for Deltamethrin/Tralomethrin contain results reported by lab as Deltamethrin.†† Permethrin was non-detect at the method detection limit of 0.005 µg/L. AE-Analysis error.B-Analyte was detected in the associated method blank.H-Sample received and/or analyzed past the recommended holding time.J-Analyte was detected at a concentration below the reporting limit and above the method detection limit. Reported value is estimated.
SourcesPlease refer to the San Diego County Copermittee Regional Monitoring Program Benchmark Sources in Attachment B to Appendix A for benchmark source citations.
(a) Prior to the 2014-2015 monitoring year, Water Quality Benchmark was calculated based on CMC (salmonids absent) using pH described in the U.S. EPA, 1999 Update of Ambient Water Quality Criteria for Ammonia, EPA-822-R-99-014, December 1999. For 2014-2015 monitoring year, Water Quality Benchmark CMC was calculated based on pH and water temperature (when applicable) as described in the U.S. EPA, 2013 Aquatic Life Ambient Water Quality Criteria for Ammonia - Freshwater, EPA-822-R-13-001, April 2013.
Values with red bold font and shading do not meet Water Quality Benchmarks.

Wet Weather Historical Monitoring Table for SDR-MLS
11/29/01 02/17/02 03/17/02 11/08/02 12/16/02 02/11/03 11/12/03 02/03/04 03/02/04 10/27/04 02/11/05 02/18/05
Physical Chemistry2013 Dissolved Oxygen mg/L <5.0 (a) 1. Basin Plan2007, 2013 pH pH units 6.5-9.0 1. Basin Plan 7.30 7.60 7.50 7.68 7.64 7.61 7.48 7.70 7.26 7.16 7.63 7.202007, 2013 Specific Conductivity µmhos/cm NA 1,680 2,230 2,270 1,568 811 1,550 2,470 1,546 995 560 1,260 7472007, 2013 Water Temperature Celsius NA 17.40 15.00 15.00 17.40 14.20 13.70 15.40 14.40 16.002013 Color Color Units 20 1. Basin Plan2007, 2013 Turbidity NTU 20 1. Basin Plan 8.6 15.3 13.1 40.7 104 34.5 19.9 31.2 22.4 234 14.5 30.9Bacteriological2007, 2013 Enterococcus MPN/100 mL NA 80 2,200 170 17,000 13,000 7,000 11,000 23,000 358 22,000 2,300 22,0002007, 2013 Fecal Coliform MPN/100 mL 400 1.Basin Plan REC-1/REC-2 130 30,000 170 110,000 17,000 5,000 13,000 2,300 500 5,000 800 1,3002007, 2013 Total Coliform MPN/100 mL NA 2,300 80,000 3,000 220,000 50,000 23,000 50,000 28,000 11,000 300,000 30,000 50,000Nutrients2007, 2013 Ammonia as N mg/L (b) 6. USEPA Water Quality Criteria (Freshwater) 0.9 0.7 0.2 0.34 0.13 0.19 <0.1 <0.1 1.8 0.38 0.28 0.952007, 2013 Nitrate as N mg/L 10 1. Basin Plan 0.9 0.8 0.3 0.67 0.56 0.57 0.5 0.2 0.63 0.37 0.66 1.012007, 2013 Nitrite as N mg/L 1 1. Basin Plan 0.12 0.07 <0.05 <0.05 <0.05 <0.05 <0.05 <0.05 <0.05 <0.05 <0.05 <0.052007, 2013 Total Kjeldahl Nitrogen mg/L NA 2.7 2.9 1.7 1.6 1.2 1.5 1.4 2.8 2 2.3 <0.5 23.32007 Dissolved Phosphorus mg/L 2 4. MSGP 2015 0.3 0.03 0.12 0.19 0.24 0.19 0.41 0.13 0.15 0.44 <0.05 0.322013 Orthophosphate mg/L NA2007, 2013 Total Phosphorus mg/L 2 4. MSGP 2015 1.21 0.4 0.28 0.57 1.01 0.33 0.34 0.23 0.35 0.85 0.28 0.44General Chemistry2007, 2013 Biochemical Oxygen Demand mg/L 30 4. MSGP 2015, 8. McNeeley (1979) 12 58.8 3.4 4.73 <2.0 20.7 8.44 45.2 2.94 4.22 3.68 3.392007 Chemical Oxygen Demand mg/L 120 4. MSGP 2015 28 154 54 71 48 63 83 67 52 98 283 562013 Chloride mg/L 400 (a) 1. Basin Plan2007, 2013 Dissolved Organic Carbon mg/L NA 6.80 8.68 10.70 16.6 4.26 5.57 33.2 2.94 5.622007, 2013 Total Organic Carbon mg/L NA 18.3 39.8 12.4 16.7 11.7 11.5 62 9.61 9.62007, 2013 Oil and Grease mg/L 10 1. Basin Plan, 3. Anacostia River TMDL, 4. MSGP 2015 <1 4 <1 10.70 <1.00 2.39 4.83 <1 <1 <1 <1 <12013 Sulfate mg/L 500 (a) 1. Basin Plan2007, 2013 Surfactants (MBAS) mg/L 0.5 1. Basin Plan <0.5 0.6 <0.5 <0.1 <0.1 0.2 <0.5 <0.5 <0.5 <0.5 <0.5 <0.52007, 2013 Total Dissolved Solids mg/L 1,500 (a) 1. Basin Plan 869 691 796 1,260 676 896 1,540 1,120 491 594 756 4902007, 2013 Total Suspended Solids mg/L 100 4. MSGP 2015, 1. Basin Plan <20 24 20 43 212 66 34 <20 21 477 50 612007, 2013 Total Hardness mg CaCO3/L NA 429 399 490 545 331 483 759 476 206 201 364 251Total Metals2007 Antimony mg/L NA <0.002 0.003 <0.002 <0.002 0.006 0.007 <0.005 <0.005 <0.005 <0.005 <0.005 <0.0052007, 2013 Arsenic mg/L NA 0.003 0.002 0.005 0.005 0.008 0.004 0.005 0.006 0.003 0.006 0.006 <0.0022007, 2013 Cadmium mg/L NA <0.001 <0.001 <0.001 <0.001 <0.001 <0.001 <0.001 <0.001 <0.001 <0.001 <0.001 <0.0012007, 2013 Chromium mg/L NA 0.005 <0.005 0.007 <0.005 0.02 0.005 <0.005 <0.005 <0.005 <0.005 <0.005 <0.0052007, 2013 Copper mg/L NA 0.007 0.028 0.011 0.009 0.021 0.017 0.008 0.013 0.006 0.025 0.006 0.0062013 Iron mg/L 1.0 (a) 1. Basin Plan2007, 2013 Lead mg/L NA 0.003 0.004 0.009 0.007 0.035 0.011 0.004 0.006 0.005 0.060 0.005 0.0042013 Manganese mg/L 1.0 (a) 1. Basin Plan2013 Mercury mg/L NA2007, 2013 Nickel mg/L NA 0.004 0.005 0.004 0.007 0.005 0.005 0.005 0.003 <0.002 0.006 0.003 0.0022007, 2013 Selenium mg/L 0.005 16. 40 CFR 131.38 <0.002 0.002 <0.002 <0.004 <0.004 <0.004 <0.005 <0.005 <0.005 <0.005 <0.005 <0.0052013 Thallium mg/L NA2007, 2013 Zinc mg/L NA 0.029 0.112 0.067 0.031 0.118 0.077 0.046 0.053 0.026 0.213 0.033 0.032Dissolved Metals2007 Antimony mg/L 0.006 1. Basin Plan <0.002 <0.002 <0.002 0.002 0.007 0.002 <0.005 <0.005 <0.005 <0.005 <0.005 <0.0052007, 2013 Arsenic mg/L 0.34 16. 40 CFR 131.38 0.002 <0.001 0.002 0.004 0.003 0.003 0.004 0.003 0.002 <0.002 <0.002 <0.0022007, 2013 Cadmium mg/L (c) 16. 40 CFR 131.38 <0.001 <0.001 <0.001 <0.001 <0.001 <0.001 <0.001 <0.001 <0.001 <0.001 <0.001 <0.0012007, 2013 Chromium mg/L (c) 16. 40 CFR 131.38 <0.005 <0.005 <0.005 <0.005 <0.005 <0.005 <0.005 <0.005 <0.005 <0.005 <0.005 <0.0052007, 2013 Copper mg/L (c) 16. 40 CFR 131.38 0.006 0.015 <0.005 0.005 0.006 0.015 <0.005 0.005 <0.005 <0.005 <0.005 0.0052013 Iron mg/L NA2007, 2013 Lead mg/L (c) 16. 40 CFR 131.38 0.002 <0.002 <0.002 0.006 0.002 <0.002 <0.002 <0.002 <0.002 <0.002 <0.002 <0.0022013 Manganese mg/L NA2013 Mercury mg/L NA2007, 2013 Nickel mg/L (c) 16. 40 CFR 131.38 0.003 0.005 0.002 0.006 <0.002 0.003 0.003 0.003 <0.002 0.003 0.002 0.0022007, 2013 Selenium mg/L NA <0.002 <0.002 <0.002 <0.004 <0.004 <0.004 <0.005 <0.005 <0.005 <0.005 <0.005 <0.0052013 Thallium mg/L NA2007, 2013 Zinc mg/L (c) 16. 40 CFR 131.38 0.022 0.084 <0.020 0.026 0.037 0.070 <0.02 <0.02 <0.02 <0.02 <0.02 <0.02
Water Quality Benchmarks Benchmark ReferencesPermit
Requirement Analyte Units2001-2002 2002-2003
Historical Monitoring Data
2003-2004 2004-2005

Wet Weather Historical Monitoring Table for SDR-MLS
11/29/01 02/17/02 03/17/02 11/08/02 12/16/02 02/11/03 11/12/03 02/03/04 03/02/04 10/27/04 02/11/05 02/18/05
Water Quality Benchmarks Benchmark ReferencesPermit
Requirement Analyte Units2001-2002 2002-2003
Historical Monitoring Data
2003-2004 2004-2005
Organophosphorus Pesticides2013 Azinphos methyl (Guthion) µg/L NA2013 Bolstar µg/L NA
2007, 2013 Chlorpyrifos µg/L 0.02 acute / 0.014 chronic 12. CA Dept. of Fish & Game, 2000 <0.03* <0.03* 0.03 0.0133 0.0264 0.0227 <0.01 <0.01 <0.01 <0.01 <0.01 <0.01
2013 Coumaphos µg/L NA2013 Demeton-o µg/L NA2013 Demeton-s µg/L NA
2007, 2013 Diazinon µg/L 0.08 acute / 0.05 chronic
12. CA Dept. of Fish & Game, 2000, 11. Chollas Creek TMDL for Diazinon, 10. USEPA, Aquatic Life Ambient
Water Quality Criteria Diazinon0.21 0.10 0.08 0.051 0.051 0.038 <0.01 <0.01 <0.01 <0.01 0.038 <0.01
2013 Dichlorvos µg/L NA2013 Dimethoate µg/L NA2013 Disulfoton µg/L NA2013 Ethoprop µg/L NA2013 Ethyl parathion µg/L NA2013 Fensulfothion µg/L NA2013 Fenthion µg/L NA2007, 2013 Malathion µg/L 0.43 13. CA Dept. of Fish & Game, 1998, 5. Goldbook <0.10 <0.10 <0.10 <0.01 <0.01 <0.01 <0.01 <0.01 <0.012013 Merphos µg/L NA2013 Methyl parathion µg/L NA2013 Mevinphos µg/L NA2013 Naled µg/L NA2013 Phorate µg/L NA2013 Ronnel µg/L NA2013 Stirophos µg/L NA2013 Tokuthion (Prothiofos) µg/L NA2013 Trichloronate µg/L NAPyrethroids2007, 2013 Allethrin µg/L NA2007, 2013 Bifenthrin µg/L 0.0093 15. Anderson et al., 20062007, 2013 Cyfluthrin µg/L 0.344 17. Wheelock et al., 20042007, 2013 Cyhalothrin, Total Lambda µg/L 0.20 17. Wheelock et al., 20042007, 2013 Cypermethrin µg/L 0.683 17. Wheelock et al., 20042007, 2013 Danitol (Fenpropathrin) µg/L NA2007, 2013 Deltamethrin/Tralomethrin£ µg/L NA2007, 2013 Esfenvalerate µg/L 0.25 17. Wheelock et al., 20042007, 2013 Fenvalerate µg/L NA2007, 2013 Fluvalinate µg/L NA2007, 2013 Permethrin µg/L 0.021 15. Anderson et al., 20062007, 2013 Prallethrin µg/L NA2007, 2013 Resmethrin µg/L NAToxicity2007, 2013 Ceriodaphnia 96-hr LC50 (%) >100 >100 >100 >100 >100 >100 >100 >100 >100 >100 >100 >100 >1002007, 2013 Ceriodaphnia 7-day survival NOEC (%) 100 100 100 100 100 100 100 100 100 100 100 100 1002007, 2013 Ceriodaphnia 7-day reproduction NOEC (%) 100 100 100 100 100 100 100 100 100 100 100 100 1002007 Hyalella 96-hr LC50 (%) >100 >100 >100 >100 >100 >100 >100 >100 >100 >100 >100 >100 >1002007, 2013 Selenastrum 96-hr NOEC (%) 100 100 25 100 100 100 100 100 100 100 100 100 1002013 Strongylocentrotus 96-hr TST Pass/FailSee last page for fSee last page for footnotes and source references.

Wet Weather Historical Monitoring Table for SDR-MLS
Physical Chemistry2013 Dissolved Oxygen mg/L <5.0 (a) 1. Basin Plan2007, 2013 pH pH units 6.5-9.0 1. Basin Plan2007, 2013 Specific Conductivity µmhos/cm NA2007, 2013 Water Temperature Celsius NA2013 Color Color Units 20 1. Basin Plan2007, 2013 Turbidity NTU 20 1. Basin PlanBacteriological2007, 2013 Enterococcus MPN/100 mL NA2007, 2013 Fecal Coliform MPN/100 mL 400 1.Basin Plan REC-1/REC-2 2007, 2013 Total Coliform MPN/100 mL NANutrients2007, 2013 Ammonia as N mg/L (b) 6. USEPA Water Quality Criteria (Freshwater)2007, 2013 Nitrate as N mg/L 10 1. Basin Plan2007, 2013 Nitrite as N mg/L 1 1. Basin Plan2007, 2013 Total Kjeldahl Nitrogen mg/L NA2007 Dissolved Phosphorus mg/L 2 4. MSGP 20152013 Orthophosphate mg/L NA2007, 2013 Total Phosphorus mg/L 2 4. MSGP 2015General Chemistry2007, 2013 Biochemical Oxygen Demand mg/L 30 4. MSGP 2015, 8. McNeeley (1979)2007 Chemical Oxygen Demand mg/L 120 4. MSGP 20152013 Chloride mg/L 400 (a) 1. Basin Plan2007, 2013 Dissolved Organic Carbon mg/L NA2007, 2013 Total Organic Carbon mg/L NA2007, 2013 Oil and Grease mg/L 10 1. Basin Plan, 3. Anacostia River TMDL, 4. MSGP 20152013 Sulfate mg/L 500 (a) 1. Basin Plan2007, 2013 Surfactants (MBAS) mg/L 0.5 1. Basin Plan2007, 2013 Total Dissolved Solids mg/L 1,500 (a) 1. Basin Plan2007, 2013 Total Suspended Solids mg/L 100 4. MSGP 2015, 1. Basin Plan2007, 2013 Total Hardness mg CaCO3/L NATotal Metals2007 Antimony mg/L NA2007, 2013 Arsenic mg/L NA2007, 2013 Cadmium mg/L NA2007, 2013 Chromium mg/L NA2007, 2013 Copper mg/L NA2013 Iron mg/L 1.0 (a) 1. Basin Plan2007, 2013 Lead mg/L NA2013 Manganese mg/L 1.0 (a) 1. Basin Plan2013 Mercury mg/L NA2007, 2013 Nickel mg/L NA2007, 2013 Selenium mg/L 0.005 16. 40 CFR 131.382013 Thallium mg/L NA2007, 2013 Zinc mg/L NADissolved Metals2007 Antimony mg/L 0.006 1. Basin Plan2007, 2013 Arsenic mg/L 0.34 16. 40 CFR 131.382007, 2013 Cadmium mg/L (c) 16. 40 CFR 131.382007, 2013 Chromium mg/L (c) 16. 40 CFR 131.382007, 2013 Copper mg/L (c) 16. 40 CFR 131.382013 Iron mg/L NA2007, 2013 Lead mg/L (c) 16. 40 CFR 131.382013 Manganese mg/L NA2013 Mercury mg/L NA2007, 2013 Nickel mg/L (c) 16. 40 CFR 131.382007, 2013 Selenium mg/L NA2013 Thallium mg/L NA2007, 2013 Zinc mg/L (c) 16. 40 CFR 131.38
Water Quality Benchmarks Benchmark ReferencesPermit
Requirement Analyte Units2007-2008 2008-2009 2010-2011 2012-2013
10/18/05 02/19/06 03/11/06 10/14/06 01/30/07 02/19/07 - 11/04/08 11/28/09 02/06/10 - 10/05/11-10/06/11
02/07/12-02/08/12 -
7.79 8.07 7.74 8.32 7.67 6.95 7.80 8.07 7.30 7.56 7.242,870 2,490 1,262 1,499 2,830 994 2,860 3,160 1,512 1,735 1,63319.00 14.60 13.40 18.80 11.20 14.10 20.40 13.70 15.00 19.6 15.0
27.3 34.8 32.3 58.1 24.5 59.6 16.8 19.5 28.7 27 13
50,000 3,000 5,000 17,000 2,300 9,000 30,000 30,000 8,000 110,000 2,30070,000 3,000 800 5,000 8,000 5,000 50,000 8,000 800 11,000 8,000
1,100,000 50,000 30,000 30,000 14,000 23,000 110,000 300,000 17,000 230,000 80,000
0.19 0.31 <0.1 0.54 0.51 1.04 0.17 0.28 0.06 0.18 <0.10.63 0.25 0.29 0.9 <0.05 0.1 0.46 0.65 0.54 0.36 0.16
<0.05 <0.05 <0.05 <0.05 <0.05 <0.05 0.04J 0.05 0.03J 0.014J 0.025J1.6 4.3 1.5 2.2 1.7 3.1 2.2 2.3 0.714J 1.6 0.92
0.24 0.37 0.11 0.29 0.07 0.1 0.14 0.097 0.146 0.24 0.076
0.5 0.45 0.52 0.51 0.09 0.33 0.25 0.234 0.225 0.44 0.12
8.24 2.21 5.17 15.6 14.8 5.51 10 75.2 2.4 9.4 4.3†
62 65 74 112 59 52 60 58.4 53 56 39
9.41 12.8 5.59 66 13 9.03 12.4 17.9 9.1 9.7 722.4 14.1 8.57 69.4 16 9.85 14 19.8 8.5 10 8.1<1 <1 <1 <5 <5 <5 <5 4.1J 2.6J <5 <5
<0.5 <0.5 <0.5 <0.5 <0.5 <0.5 0.29 0.68H 0.127 0.089 0.141,490 1,370 655 1,200 1,350 642 1,800 1,880 628B 1,600 920
31 42 48 111 34 124 19.3 23.8 31.1 58 12706 751 366 657 713 305 645.1 797.6 273.9 670 550
<0.005 <0.005 <0.005 0.003 0.003 0.004 0.0019 0.0019 0.0012 0.002 0.0010.008 0.005 0.006 0.015 <0.001 0.004 0.0071 0.0109 0.0044 0.0076 0.0024
<0.001 <0.001 0.012 0.003 <0.001 <0.001 <0.0004 <0.0004 <0.0004 0.00013 0.000048J<0.005 <0.005 <0.005 <0.005 <0.005 0.006 0.0008 0.0008 0.0008 0.0027 0.00078
0.01 0.008 0.008 0.02 0.009 0.029 0.0082 0.0082 0.006 0.015 0.0054
0.004 0.006 0.007 0.016 0.004 0.024 0.0026 0.00246 0.00482 0.0087 0.0016
0.007 0.005 0.003 0.006 0.003 0.007 0.0035 0.0058 0.002 0.0058 0.0029<0.005 <0.005 <0.005 <0.004 0.004 <0.004 0.0018 0.002 0.0015 0.0012 0.0011
0.075 0.045 0.068 0.113 0.045 0.149 0.036 0.0311 0.0247 0.062 0.015
<0.005 <0.005 <0.005 <0.002 <0.002 0.002 0.0017 0.0016 0.0011 0.0012 0.000770.003 <0.001 <0.001 0.003 <0.001 <0.001 0.0058 0.0089 0.0039 0.0048 0.0019
<0.001 <0.001 <0.001 <0.001 <0.001 <0.001 <0.0004 <0.0004 <0.0004 0.000029J 0.000027J<0.005 <0.005 <0.005 <0.005 <0.005 <0.005 0.0003J 0.0003J 0.0004J 0.00037 0.000390.005 <0.005 <0.005 0.003 0.005 0.003 0.0032 0.0034 0.0036 0.0032 0.0035
<0.002 <0.002 <0.002 <0.001 <0.001 <0.001 0.0001J 0.00017 0.00014 0.00017J 0.000065J
0.003 0.004 0.002 0.004 <0.002 0.002 0.003 0.0051 0.0019 0.0041 0.0025<0.005 <0.005 <0.005 <0.004 <0.004 <0.004 0.0018 0.002 0.0014 0.0011 0.00087
0.053 0.026 0.035 <0.02 <0.02 <0.02 0.0161 0.0128 0.0099 0.013 0.0083
2006-2007 2009-2010
No
Sam
pled
Col
lect
ed
No
Sam
pled
Col
lect
ed
2011-2012
Historical Monitoring Data
No
Sam
pled
Col
lect
ed
2005-2006

Wet Weather Historical Monitoring Table for SDR-MLS
Water Quality Benchmarks Benchmark ReferencesPermit
Requirement Analyte Units
Organophosphorus Pesticides2013 Azinphos methyl (Guthion) µg/L NA2013 Bolstar µg/L NA
2007, 2013 Chlorpyrifos µg/L 0.02 acute / 0.014 chronic 12. CA Dept. of Fish & Game, 2000
2013 Coumaphos µg/L NA2013 Demeton-o µg/L NA2013 Demeton-s µg/L NA
2007, 2013 Diazinon µg/L 0.08 acute / 0.05 chronic
12. CA Dept. of Fish & Game, 2000, 11. Chollas Creek TMDL for Diazinon, 10. USEPA, Aquatic Life Ambient
Water Quality Criteria Diazinon2013 Dichlorvos µg/L NA2013 Dimethoate µg/L NA2013 Disulfoton µg/L NA2013 Ethoprop µg/L NA2013 Ethyl parathion µg/L NA2013 Fensulfothion µg/L NA2013 Fenthion µg/L NA2007, 2013 Malathion µg/L 0.43 13. CA Dept. of Fish & Game, 1998, 5. Goldbook2013 Merphos µg/L NA2013 Methyl parathion µg/L NA2013 Mevinphos µg/L NA2013 Naled µg/L NA2013 Phorate µg/L NA2013 Ronnel µg/L NA2013 Stirophos µg/L NA2013 Tokuthion (Prothiofos) µg/L NA2013 Trichloronate µg/L NAPyrethroids2007, 2013 Allethrin µg/L NA2007, 2013 Bifenthrin µg/L 0.0093 15. Anderson et al., 20062007, 2013 Cyfluthrin µg/L 0.344 17. Wheelock et al., 20042007, 2013 Cyhalothrin, Total Lambda µg/L 0.20 17. Wheelock et al., 20042007, 2013 Cypermethrin µg/L 0.683 17. Wheelock et al., 20042007, 2013 Danitol (Fenpropathrin) µg/L NA2007, 2013 Deltamethrin/Tralomethrin£ µg/L NA2007, 2013 Esfenvalerate µg/L 0.25 17. Wheelock et al., 20042007, 2013 Fenvalerate µg/L NA2007, 2013 Fluvalinate µg/L NA2007, 2013 Permethrin µg/L 0.021 15. Anderson et al., 20062007, 2013 Prallethrin µg/L NA2007, 2013 Resmethrin µg/L NAToxicity2007, 2013 Ceriodaphnia 96-hr LC50 (%) >1002007, 2013 Ceriodaphnia 7-day survival NOEC (%) 1002007, 2013 Ceriodaphnia 7-day reproduction NOEC (%) 1002007 Hyalella 96-hr LC50 (%) >1002007, 2013 Selenastrum 96-hr NOEC (%) 1002013 Strongylocentrotus 96-hr TST Pass/FailSee last page for fSee last page for footnotes and source references.
2007-2008 2008-2009 2010-2011 2012-2013
10/18/05 02/19/06 03/11/06 10/14/06 01/30/07 02/19/07 - 11/04/08 11/28/09 02/06/10 - 10/05/11-10/06/11
02/07/12-02/08/12 -
2006-2007 2009-2010 2011-2012
Historical Monitoring Data
2005-2006
<0.01 <0.02 <0.02 <0.002 <0.002 <0.002 <0.002 <0.002 <0.002 <0.01 <0.01
<0.01 <0.02 <0.02 <0.004 <0.004 <0.004 <0.004 <0.004 <0.004 <0.01 <0.01
<0.01 <0.02 <0.02 0.095 <0.006 <0.006 0.048 <0.006 <0.006 <0.01 <0.01
<0.002 <0.0005 <0.0005B <0.002 <0.002<0.002 <0.0005 0.0321B 0.0222 0.00890.0146 <0.0005 <0.0005 0.0093 0.0074<0.002 <0.0005 0.0255 <0.002 <0.002<0.002 <0.0005 <0.0005 <0.002 <0.002<0.002 <0.0005 0.001J <0.002 <0.002<0.002 <0.0005 <0.0005 <0.002 <0.002<0.002 <0.0005 0.0008J <0.002 <0.002<0.002 <0.0005 0.0066B <0.002 <0.002<0.002 <0.0005 <0.0005 <0.002 <0.002
<0.025* <0.005 <0.005 <0.025†† 0.1116<0.002 <0.0005 <0.0005B <0.002 <0.002<0.025 <0.005 <0.025 <0.025
>100 >100 >100 >100 >100 >100 >100 >100 >100 >100 >100100 100 100 100 100 100 100 100 100 100 10050 100 100 100 100 100 100 100 100 100 100
>100 >100 >100 >100 >100 >100 >100 >100 >100 >100 >100100 100 100 100 100 100 100 50 100 100 100
No
Sam
pled
Col
lect
ed
No
Sam
pled
Col
lect
ed
No
Sam
pled
Col
lect
ed

Wet Weather Historical Monitoring Table for SDR-MLS
Physical Chemistry2013 Dissolved Oxygen mg/L <5.0 (a) 1. Basin Plan2007, 2013 pH pH units 6.5-9.0 1. Basin Plan2007, 2013 Specific Conductivity µmhos/cm NA2007, 2013 Water Temperature Celsius NA2013 Color Color Units 20 1. Basin Plan2007, 2013 Turbidity NTU 20 1. Basin PlanBacteriological2007, 2013 Enterococcus MPN/100 mL NA2007, 2013 Fecal Coliform MPN/100 mL 400 1.Basin Plan REC-1/REC-2 2007, 2013 Total Coliform MPN/100 mL NANutrients2007, 2013 Ammonia as N mg/L (b) 6. USEPA Water Quality Criteria (Freshwater)2007, 2013 Nitrate as N mg/L 10 1. Basin Plan2007, 2013 Nitrite as N mg/L 1 1. Basin Plan2007, 2013 Total Kjeldahl Nitrogen mg/L NA2007 Dissolved Phosphorus mg/L 2 4. MSGP 20152013 Orthophosphate mg/L NA2007, 2013 Total Phosphorus mg/L 2 4. MSGP 2015General Chemistry2007, 2013 Biochemical Oxygen Demand mg/L 30 4. MSGP 2015, 8. McNeeley (1979)2007 Chemical Oxygen Demand mg/L 120 4. MSGP 20152013 Chloride mg/L 400 (a) 1. Basin Plan2007, 2013 Dissolved Organic Carbon mg/L NA2007, 2013 Total Organic Carbon mg/L NA2007, 2013 Oil and Grease mg/L 10 1. Basin Plan, 3. Anacostia River TMDL, 4. MSGP 20152013 Sulfate mg/L 500 (a) 1. Basin Plan2007, 2013 Surfactants (MBAS) mg/L 0.5 1. Basin Plan2007, 2013 Total Dissolved Solids mg/L 1,500 (a) 1. Basin Plan2007, 2013 Total Suspended Solids mg/L 100 4. MSGP 2015, 1. Basin Plan2007, 2013 Total Hardness mg CaCO3/L NATotal Metals2007 Antimony mg/L NA2007, 2013 Arsenic mg/L NA2007, 2013 Cadmium mg/L NA2007, 2013 Chromium mg/L NA2007, 2013 Copper mg/L NA2013 Iron mg/L 1.0 (a) 1. Basin Plan2007, 2013 Lead mg/L NA2013 Manganese mg/L 1.0 (a) 1. Basin Plan2013 Mercury mg/L NA2007, 2013 Nickel mg/L NA2007, 2013 Selenium mg/L 0.005 16. 40 CFR 131.382013 Thallium mg/L NA2007, 2013 Zinc mg/L NADissolved Metals2007 Antimony mg/L 0.006 1. Basin Plan2007, 2013 Arsenic mg/L 0.34 16. 40 CFR 131.382007, 2013 Cadmium mg/L (c) 16. 40 CFR 131.382007, 2013 Chromium mg/L (c) 16. 40 CFR 131.382007, 2013 Copper mg/L (c) 16. 40 CFR 131.382013 Iron mg/L NA2007, 2013 Lead mg/L (c) 16. 40 CFR 131.382013 Manganese mg/L NA2013 Mercury mg/L NA2007, 2013 Nickel mg/L (c) 16. 40 CFR 131.382007, 2013 Selenium mg/L NA2013 Thallium mg/L NA2007, 2013 Zinc mg/L (c) 16. 40 CFR 131.38
Water Quality Benchmarks Benchmark ReferencesPermit
Requirement Analyte Units
Long Term and
Transitional Monitoring
Long Term Monitoring
Long Term and
Transitional Monitoring
Long Term and
Transitional Monitoring
2014-2015
10/10/13 11/22/13 02/28/14-03/01/14 -
9.49 2.86 2.7 67% NA1
7.82 7.19 7.12 10% 0.393,167 1,923 2,25519.29 16.1 17.12
† 40 308.5 13 12.1 58% 1.82
4,900 70,000 14,0002,200 22,000 3,300 92% 36.76
33,000 330,000 330,000
0.22 <0.10 0.11 0% 0.020.38 0.34 0.34 0% 0.05<0.1 0.027J 0.025J 0% 0.030.93 1.1 0.740.11 NR 0.11 0% 0.09
0.045 0.069 0.0990.11 0.15 0.21 0% 0.20
2.7 NR 4.5 12% 0.4442 NR 45 8% 0.61
780 520 420 100% NA1
14 11 7.715 12 8.1
<5.0 NR <5.0 4% 0.22300 200 210 0% NA1
0.19 0.16 0.17 8% 0.481,800 1,400 1,200 19% 0.72
8 20 40 15% 0.63745 594 472
0.0014 NR 0.00130.0037 0.0029 0.003
0.000070J 0.000050J 0.000059J0.00081 0.0012 0.00120.0063 0.01 0.0077
0.34 0.72 0.76 0% NA1
0.0011 0.0021 0.00310.18 0.48 0.32 0% NA1
<0.000050 NR 0.000023J0.0031 0.002 0.00190.0015 0.0009 0.00079 0% 0.39
<0.00020 <0.00020 <0.000200.036 0.038 0.029
0.0012 NR 0.0011 4% 0.330.0032 0.0023 0.0022 0% 0.01
0.000050J 0.000020J 0.000021J 0% 0.020.00028 0.00032 0.00024 0% 0.000.0049 0.0051 0.003 0% 0.100.0055J 0.0090J 0.046
<0.00020 <0.00020 0.00023 0% 0.000.002 0.00099 0.1
<0.000050 NR 0.000020J0.0029 0.0016 0.0013 0% 0.000.0014 0.00085 0.0006
<0.00020 0.000040J <0.000200.025 0.0096 0.012 0% 0.06
Mean Ratio to Benchmarks
No
Sam
pled
Col
lect
ed
Frequency Above
Benchmarks2013-2014

Wet Weather Historical Monitoring Table for SDR-MLS
Water Quality Benchmarks Benchmark ReferencesPermit
Requirement Analyte Units
Organophosphorus Pesticides2013 Azinphos methyl (Guthion) µg/L NA2013 Bolstar µg/L NA
2007, 2013 Chlorpyrifos µg/L 0.02 acute / 0.014 chronic 12. CA Dept. of Fish & Game, 2000
2013 Coumaphos µg/L NA2013 Demeton-o µg/L NA2013 Demeton-s µg/L NA
2007, 2013 Diazinon µg/L 0.08 acute / 0.05 chronic
12. CA Dept. of Fish & Game, 2000, 11. Chollas Creek TMDL for Diazinon, 10. USEPA, Aquatic Life Ambient
Water Quality Criteria Diazinon2013 Dichlorvos µg/L NA2013 Dimethoate µg/L NA2013 Disulfoton µg/L NA2013 Ethoprop µg/L NA2013 Ethyl parathion µg/L NA2013 Fensulfothion µg/L NA2013 Fenthion µg/L NA2007, 2013 Malathion µg/L 0.43 13. CA Dept. of Fish & Game, 1998, 5. Goldbook2013 Merphos µg/L NA2013 Methyl parathion µg/L NA2013 Mevinphos µg/L NA2013 Naled µg/L NA2013 Phorate µg/L NA2013 Ronnel µg/L NA2013 Stirophos µg/L NA2013 Tokuthion (Prothiofos) µg/L NA2013 Trichloronate µg/L NAPyrethroids2007, 2013 Allethrin µg/L NA2007, 2013 Bifenthrin µg/L 0.0093 15. Anderson et al., 20062007, 2013 Cyfluthrin µg/L 0.344 17. Wheelock et al., 20042007, 2013 Cyhalothrin, Total Lambda µg/L 0.20 17. Wheelock et al., 20042007, 2013 Cypermethrin µg/L 0.683 17. Wheelock et al., 20042007, 2013 Danitol (Fenpropathrin) µg/L NA2007, 2013 Deltamethrin/Tralomethrin£ µg/L NA2007, 2013 Esfenvalerate µg/L 0.25 17. Wheelock et al., 20042007, 2013 Fenvalerate µg/L NA2007, 2013 Fluvalinate µg/L NA2007, 2013 Permethrin µg/L 0.021 15. Anderson et al., 20062007, 2013 Prallethrin µg/L NA2007, 2013 Resmethrin µg/L NAToxicity2007, 2013 Ceriodaphnia 96-hr LC50 (%) >1002007, 2013 Ceriodaphnia 7-day survival NOEC (%) 1002007, 2013 Ceriodaphnia 7-day reproduction NOEC (%) 1002007 Hyalella 96-hr LC50 (%) >1002007, 2013 Selenastrum 96-hr NOEC (%) 1002013 Strongylocentrotus 96-hr TST Pass/FailSee last page for fSee last page for footnotes and source references.
Long Term and
Transitional Monitoring
Long Term Monitoring
Long Term and
Transitional Monitoring
Long Term and
Transitional Monitoring
2014-2015
10/10/13 11/22/13 02/28/14-03/01/14 -
Mean Ratio to Benchmarks
Frequency Above
Benchmarks2013-2014
<0.010BS-L AE <0.010<0.010 AE <0.010
<0.010 AE <0.010 13% 0.38
<0.010 AE <0.010<0.010 AE <0.010<0.010 AE <0.010
<0.010 AE <0.010 8% 0.33
<0.010 AE <0.010<0.010 AE <0.010<0.010 AE <0.010<0.010 AE <0.010<0.010 AE <0.010<0.010 AE <0.010<0.010 AE <0.010<0.010 AE <0.010 0% 0.04<0.010 AE <0.010<0.010 AE <0.010<0.010 AE <0.010<0.010 AE <0.010<0.010 AE <0.010<0.010 AE <0.010
<0.010BS-L AE <0.010<0.010 AE <0.010<0.010 AE <0.010
<0.002 <0.002 <0.0020.0028 0.0088 0.0045 25% 1.08<0.002 <0.002 <0.002 0% 0.01<0.002 <0.002 <0.002 0% 0.06<0.002 <0.002 <0.002 0% 0.00<0.002 <0.002 <0.002<0.002 <0.002 <0.002<0.002 <0.002 <0.002 0% 0.00<0.002 <0.002 <0.002<0.002 <0.002 <0.002<0.01 <0.01 <0.01 13% 0.86
<0.002 <0.002 <0.002<0.01 <0.01 <0.01
>100 NR >100 0% 1.00100 NR 100 0% 1.00100 NR 100 4% 1.04
>100 NR >100 0% 1.00100 NR 100 8% 1.16Fail Fail Pass 67%
No
Sam
pled
Col
lect
ed

Wet Weather Historical Monitoring Table for SDR-MLSBlank spaces have been verified and no data is available.
NA indicate no criteria or published value was available or applicable to the matrix or program.(a) Water Quality Benchmark are based on the San Diego Regional Water Quality Control Plan by watershed for the San Diego Region (Basin Plan), 1994 (with amendments effective on or before April 4, 2011) and may vary by hydrologic area/subarea.
(c) Water Quality Benchmark for dissolved metal fractions are based on total hardness and are calculated as described by the USEPA Federal Register Doc. 40 CFR Part 131, May 18, 2000. The Criteria Maximum Concentration (CMC) was used.* Indicates detection limit above water quality benchmark.† Result was from composite sample. The grab sample was analyzed outside of the holding time.£ Historical results for Deltamethrin/Tralomethrin contain results reported by lab as Deltamethrin.†† Permethrin was non-detect at the method detection limit of 0.005 µg/L. AE-Analysis error.B-Analyte was detected in the associated method blank.BS-L-Blank Spike recovery of this analyte was below the control limits. Results may be biased low.H-Sample received and or/analyzed past the recommended holding time.J-Analyte was detected at a concentration below the reporting limit and above the method detection limit. Reported value is estimated.NA1 Three or more years of data required to calculate the Mean Ratio to Benchmark.NR-Not required.
SourcesPlease refer to the San Diego County Copermittee Regional Monitoring Program Benchmark Sources in Attachment B to Appendix A for benchmark source citations.
(b) Prior to the 2014-2015 monitoring year, Water Quality Benchmark was calculated based on CMC (salmonids absent) using pH described in the U.S. EPA, 1999 Update of Ambient Water Quality Criteria for Ammonia, EPA-822-R-99-014, December 1999. For 2014-2015 monitoring year, Water Quality Benchmark CMC was calculated based on pH and water temperature (when applicable) as described in the U.S. EPA, 2013 Aquatic Life Ambient Water Quality Criteria for Ammonia - Freshwater, EPA-822-R-13-001, April 2013.
Values with red bold font and shading do not meet Water Quality Benchmarks.
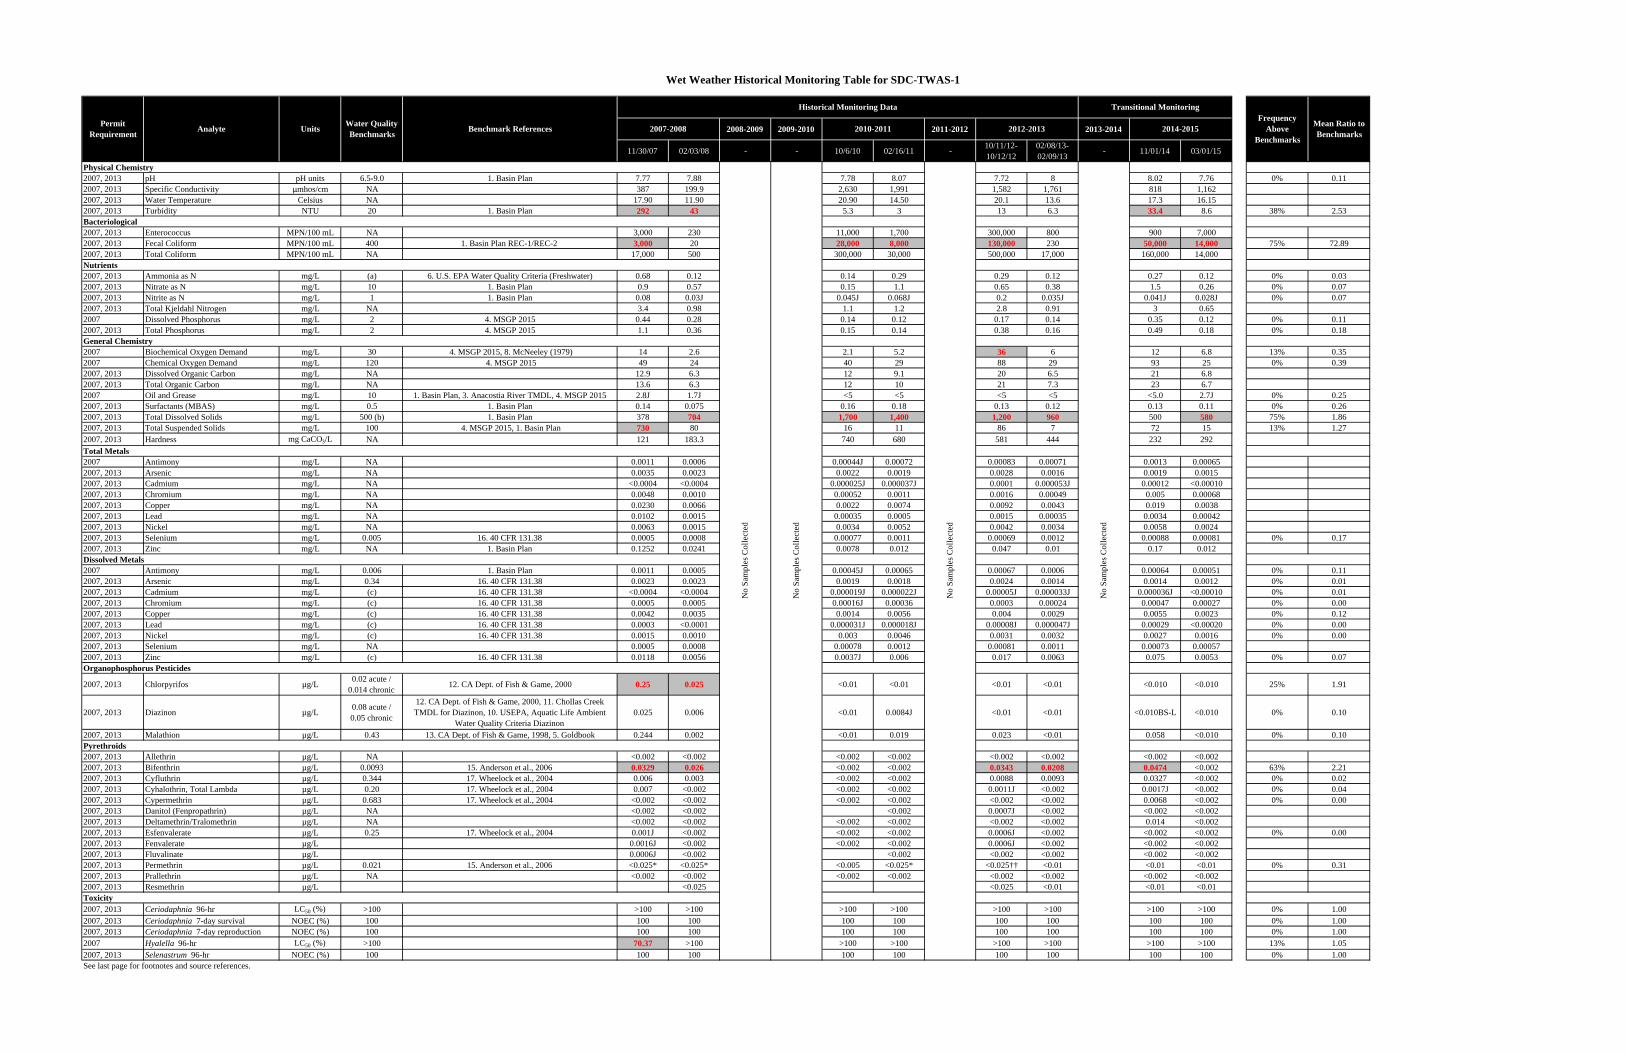
Wet Weather Historical Monitoring Table for SDC-TWAS-1
2008-2009 2009-2010 2011-2012 2013-2014
11/30/07 02/03/08 - - 10/6/10 02/16/11 - 10/11/12-10/12/12
02/08/13-02/09/13 - 11/01/14 03/01/15
Physical Chemistry2007, 2013 pH pH units 6.5-9.0 1. Basin Plan 7.77 7.88 7.78 8.07 7.72 8 8.02 7.76 0% 0.112007, 2013 Specific Conductivity µmhos/cm NA 387 199.9 2,630 1,991 1,582 1,761 818 1,1622007, 2013 Water Temperature Celsius NA 17.90 11.90 20.90 14.50 20.1 13.6 17.3 16.152007, 2013 Turbidity NTU 20 1. Basin Plan 292 43 5.3 3 13 6.3 33.4 8.6 38% 2.53Bacteriological2007, 2013 Enterococcus MPN/100 mL NA 3,000 230 11,000 1,700 300,000 800 900 7,0002007, 2013 Fecal Coliform MPN/100 mL 400 1. Basin Plan REC-1/REC-2 3,000 20 28,000 8,000 130,000 230 50,000 14,000 75% 72.892007, 2013 Total Coliform MPN/100 mL NA 17,000 500 300,000 30,000 500,000 17,000 160,000 14,000Nutrients2007, 2013 Ammonia as N mg/L (a) 6. U.S. EPA Water Quality Criteria (Freshwater) 0.68 0.12 0.14 0.29 0.29 0.12 0.27 0.12 0% 0.032007, 2013 Nitrate as N mg/L 10 1. Basin Plan 0.9 0.57 0.15 1.1 0.65 0.38 1.5 0.26 0% 0.072007, 2013 Nitrite as N mg/L 1 1. Basin Plan 0.08 0.03J 0.045J 0.068J 0.2 0.035J 0.041J 0.028J 0% 0.072007, 2013 Total Kjeldahl Nitrogen mg/L NA 3.4 0.98 1.1 1.2 2.8 0.91 3 0.652007 Dissolved Phosphorus mg/L 2 4. MSGP 2015 0.44 0.28 0.14 0.12 0.17 0.14 0.35 0.12 0% 0.112007, 2013 Total Phosphorus mg/L 2 4. MSGP 2015 1.1 0.36 0.15 0.14 0.38 0.16 0.49 0.18 0% 0.18General Chemistry2007 Biochemical Oxygen Demand mg/L 30 4. MSGP 2015, 8. McNeeley (1979) 14 2.6 2.1 5.2 36 6 12 6.8 13% 0.352007 Chemical Oxygen Demand mg/L 120 4. MSGP 2015 49 24 40 29 88 29 93 25 0% 0.392007, 2013 Dissolved Organic Carbon mg/L NA 12.9 6.3 12 9.1 20 6.5 21 6.82007, 2013 Total Organic Carbon mg/L NA 13.6 6.3 12 10 21 7.3 23 6.72007 Oil and Grease mg/L 10 1. Basin Plan, 3. Anacostia River TMDL, 4. MSGP 2015 2.8J 1.7J <5 <5 <5 <5 <5.0 2.7J 0% 0.252007, 2013 Surfactants (MBAS) mg/L 0.5 1. Basin Plan 0.14 0.075 0.16 0.18 0.13 0.12 0.13 0.11 0% 0.262007, 2013 Total Dissolved Solids mg/L 500 (b) 1. Basin Plan 378 704 1,700 1,400 1,200 960 500 580 75% 1.862007, 2013 Total Suspended Solids mg/L 100 4. MSGP 2015, 1. Basin Plan 730 80 16 11 86 7 72 15 13% 1.272007, 2013 Hardness mg CaCO3/L NA 121 183.3 740 680 581 444 232 292Total Metals2007 Antimony mg/L NA 0.0011 0.0006 0.00044J 0.00072 0.00083 0.00071 0.0013 0.000652007, 2013 Arsenic mg/L NA 0.0035 0.0023 0.0022 0.0019 0.0028 0.0016 0.0019 0.00152007, 2013 Cadmium mg/L NA <0.0004 <0.0004 0.000025J 0.000037J 0.0001 0.000053J 0.00012 <0.000102007, 2013 Chromium mg/L NA 0.0048 0.0010 0.00052 0.0011 0.0016 0.00049 0.005 0.000682007, 2013 Copper mg/L NA 0.0230 0.0066 0.0022 0.0074 0.0092 0.0043 0.019 0.00382007, 2013 Lead mg/L NA 0.0102 0.0015 0.00035 0.0005 0.0015 0.00035 0.0034 0.000422007, 2013 Nickel mg/L NA 0.0063 0.0015 0.0034 0.0052 0.0042 0.0034 0.0058 0.00242007, 2013 Selenium mg/L 0.005 16. 40 CFR 131.38 0.0005 0.0008 0.00077 0.0011 0.00069 0.0012 0.00088 0.00081 0% 0.172007, 2013 Zinc mg/L NA 1. Basin Plan 0.1252 0.0241 0.0078 0.012 0.047 0.01 0.17 0.012Dissolved Metals2007 Antimony mg/L 0.006 1. Basin Plan 0.0011 0.0005 0.00045J 0.00065 0.00067 0.0006 0.00064 0.00051 0% 0.112007, 2013 Arsenic mg/L 0.34 16. 40 CFR 131.38 0.0023 0.0023 0.0019 0.0018 0.0024 0.0014 0.0014 0.0012 0% 0.012007, 2013 Cadmium mg/L (c) 16. 40 CFR 131.38 <0.0004 <0.0004 0.000019J 0.000022J 0.00005J 0.000033J 0.000036J <0.00010 0% 0.012007, 2013 Chromium mg/L (c) 16. 40 CFR 131.38 0.0005 0.0005 0.00016J 0.00036 0.0003 0.00024 0.00047 0.00027 0% 0.002007, 2013 Copper mg/L (c) 16. 40 CFR 131.38 0.0042 0.0035 0.0014 0.0056 0.004 0.0029 0.0055 0.0023 0% 0.122007, 2013 Lead mg/L (c) 16. 40 CFR 131.38 0.0003 <0.0001 0.000031J 0.000018J 0.00008J 0.000047J 0.00029 <0.00020 0% 0.002007, 2013 Nickel mg/L (c) 16. 40 CFR 131.38 0.0015 0.0010 0.003 0.0046 0.0031 0.0032 0.0027 0.0016 0% 0.002007, 2013 Selenium mg/L NA 0.0005 0.0008 0.00078 0.0012 0.00081 0.0011 0.00073 0.000572007, 2013 Zinc mg/L (c) 16. 40 CFR 131.38 0.0118 0.0056 0.0037J 0.006 0.017 0.0063 0.075 0.0053 0% 0.07Organophosphorus Pesticides
2007, 2013 Chlorpyrifos µg/L 0.02 acute / 0.014 chronic 12. CA Dept. of Fish & Game, 2000 0.25 0.025 <0.01 <0.01 <0.01 <0.01 <0.010 <0.010 25% 1.91
2007, 2013 Diazinon µg/L 0.08 acute / 0.05 chronic
12. CA Dept. of Fish & Game, 2000, 11. Chollas Creek TMDL for Diazinon, 10. USEPA, Aquatic Life Ambient
Water Quality Criteria Diazinon0.025 0.006 <0.01 0.0084J <0.01 <0.01 <0.010BS-L <0.010 0% 0.10
2007, 2013 Malathion µg/L 0.43 13. CA Dept. of Fish & Game, 1998, 5. Goldbook 0.244 0.002 <0.01 0.019 0.023 <0.01 0.058 <0.010 0% 0.10Pyrethroids2007, 2013 Allethrin µg/L NA <0.002 <0.002 <0.002 <0.002 <0.002 <0.002 <0.002 <0.0022007, 2013 Bifenthrin µg/L 0.0093 15. Anderson et al., 2006 0.0329 0.026 <0.002 <0.002 0.0343 0.0208 0.0474 <0.002 63% 2.212007, 2013 Cyfluthrin µg/L 0.344 17. Wheelock et al., 2004 0.006 0.003 <0.002 <0.002 0.0088 0.0093 0.0327 <0.002 0% 0.022007, 2013 Cyhalothrin, Total Lambda µg/L 0.20 17. Wheelock et al., 2004 0.007 <0.002 <0.002 <0.002 0.0011J <0.002 0.0017J <0.002 0% 0.042007, 2013 Cypermethrin µg/L 0.683 17. Wheelock et al., 2004 <0.002 <0.002 <0.002 <0.002 <0.002 <0.002 0.0068 <0.002 0% 0.002007, 2013 Danitol (Fenpropathrin) µg/L NA <0.002 <0.002 <0.002 0.0007J <0.002 <0.002 <0.0022007, 2013 Deltamethrin/Tralomethrin µg/L NA <0.002 <0.002 <0.002 <0.002 <0.002 <0.002 0.014 <0.0022007, 2013 Esfenvalerate µg/L 0.25 17. Wheelock et al., 2004 0.001J <0.002 <0.002 <0.002 0.0006J <0.002 <0.002 <0.002 0% 0.002007, 2013 Fenvalerate µg/L 0.0016J <0.002 <0.002 <0.002 0.0006J <0.002 <0.002 <0.0022007, 2013 Fluvalinate µg/L 0.0006J <0.002 <0.002 <0.002 <0.002 <0.002 <0.0022007, 2013 Permethrin µg/L 0.021 15. Anderson et al., 2006 <0.025* <0.025* <0.005 <0.025* <0.025†† <0.01 <0.01 <0.01 0% 0.312007, 2013 Prallethrin µg/L NA <0.002 <0.002 <0.002 <0.002 <0.002 <0.002 <0.002 <0.0022007, 2013 Resmethrin µg/L <0.025 <0.025 <0.01 <0.01 <0.01Toxicity2007, 2013 Ceriodaphnia 96-hr LC50 (%) >100 >100 >100 >100 >100 >100 >100 >100 >100 0% 1.002007, 2013 Ceriodaphnia 7-day survival NOEC (%) 100 100 100 100 100 100 100 100 100 0% 1.002007, 2013 Ceriodaphnia 7-day reproduction NOEC (%) 100 100 100 100 100 100 100 100 100 0% 1.002007 Hyalella 96-hr LC50 (%) >100 70.37 >100 >100 >100 >100 >100 >100 >100 13% 1.052007, 2013 Selenastrum 96-hr NOEC (%) 100 100 100 100 100 100 100 100 100 0% 1.00See last page for footnotes and source references.
Frequency Above
Benchmarks
Mean Ratio to Benchmarks2012-2013
Historical Monitoring Data Transitional Monitoring
No
Sam
ples
Col
lect
ed
No
Sam
ples
Col
lect
ed
No
Sam
ples
Col
lect
ed
No
Sam
ples
Col
lect
ed
2014-2015Permit Requirement Analyte Units Water Quality
Benchmarks Benchmark References 2010-20112007-2008

Wet Weather Historical Monitoring Table for SDC-TWAS-1
Blank spaces have been verified and no data is available.
NA indicate no criteria or published value was available or applicable to the matrix or program.
(b) Water Quality Benchmark is based on the San Diego Regional Water Quality Control Plan by watershed for the San Diego Region (Basin Plan), 1994 (with amendments effective on or before April 4, 2011) and may vary by hydrologic area.(c) Water Quality Benchmark for dissolved metal fractions are based on total hardness and are calculated as described by the USEPA Federal Register Doc. 40 CFR Part 131, May 18, 2000. The Criteria Maximum Concentration (CMC) was used.* Indicates detection limit above water quality benchmark.£ Historical results for Deltamethrin/Tralomethrin contain results reported by lab as Deltamethrin.†† Permethrin was non-detect at the method detection limit of 0.005 µg/L. BS-L Blank Spike recovery of this analyte was below the control limits. Results may be biased low.J-Analyte was detected at a concentration below the reporting limit and above the method detection limit. Reported value is estimated.
SourcesPlease refer to the San Diego County Copermittee Regional Monitoring Program Benchmark Sources in Attachment B to Appendix A for benchmark source citations.
(a) Prior to the 2014-2015 monitoring year, Water Quality Benchmark was calculated based on CMC (salmonids absent) using pH described in the U.S. EPA, 1999 Update of Ambient Water Quality Criteria for Ammonia, EPA-822-R-99-014, December 1999. For 2014-2015 monitoring year, Water Quality Benchmark CMC was calculated based on pH and water temperature (when applicable) as described in the U.S. EPA, 2013 Aquatic Life Ambient Water Quality Criteria for Ammonia - Freshwater, EPA-822-R-13-001, April 2013.
Values with red bold font and shading do not meet Water Quality Benchmarks.

Wet Weather Historical Monitoring Table for SDC-TWAS-2
2008-2009 2009-2010 2011-2012 2012-2013 2013-2014 2014-2015
11/30/07-12/01/07 02/03/08 - - 02/01/11 02/17/11-
02/18/11 - - - -
Physical Chemistry2007, 2013 pH pH units 6.5-9.0 1. Basin Plan 9.64 8.80 7.93 7.69 25% NA1
2007, 2013 Specific Conductivity µmhos/cm NA 1,382 811 1936 24402007, 2013 Water Temperature Celsius NA 14.50 11.10 12.00 11.402007, 2013 Turbidity NTU 20 1. Basin Plan 8,338 164 5.6 4.9 50% NA1
Bacteriological2007, 2013 Enterococcus MPN/100 mL NA 170,000 17,000 1,400 5002007, 2013 Fecal Coliform MPN/100 mL 4,000 1. Basin Plan REC-1/REC-2 220,000 13,000 300 80 50% NA1
2007, 2013 Total Coliform MPN/100 mL NA 9,000,000 17,000 7,000 8,000Nutrients2007, 2013 Ammonia as N mg/L (a) 6. U.S. EPA Water Quality Criteria (Freshwater) 8.3 0.71 0.077J 0.15 25% NA1
2007, 2013 Nitrate as N mg/L 10 1. Basin Plan 3.6 0.93 1.2 0.5 0% NA1
2007, 2013 Nitrite as N mg/L 1 1. Basin Plan 1.1 0.03J 0.013J 0.033J 25% NA1
2007, 2013 Total Kjeldahl Nitrogen mg/L NA 23 17 1.2 0.842007 Dissolved Phosphorus mg/L 2 4. MSGP 2015 0.83 0.67 0.17 0.1 0% NA1
2007, 2013 Total Phosphorus mg/L 2 4. MSGP 2015 13 4 0.17 0.14 50% NA1
General Chemistry2007 Biochemical Oxygen Demand mg/L 30 4. MSGP 2015, 8. McNeeley (1979) 110 64.4 3.1 1.3J 50% NA1
2007 Chemical Oxygen Demand mg/L 120 4. MSGP 2015 70 140 40 32 25% NA1
2007, 2013 Dissolved Organic Carbon mg/L NA 58 11.8 11 102007, 2013 Total Organic Carbon mg/L NA 90.7 18.4 11 102007 Oil and Grease mg/L 10 1. Basin Plan, 3. Anacostia River TMDL, 4. MSGP 2015 1.8J 5.4 <5 <5 0% NA1
2007, 2013 Surfactants (MBAS) mg/L 0.5 1. Basin Plan 8.25 0.28 0.062 0.048J 25% NA1
2007, 2013 Total Dissolved Solids mg/L 500 (b) 1. Basin Plan 1,304 394 1,400 1,500 75% NA1
2007, 2013 Total Suspended Solids mg/L 100 4. MSGP 2015, 1. Basin Plan 7,100 2,030 14 9 50% NA1
2007, 2013 Hardness mg CaCO3/L NA 255.8 106.9 620 740Total Metals2007 Antimony mg/L NA 0.0004J 0.0002J 0.00014J 0.00013J2007, 2013 Arsenic mg/L NA 0.0112 0.0042 0.00088 0.000922007, 2013 Cadmium mg/L NA 0.0046 0.0007 0.000037J 0.000038J2007, 2013 Chromium mg/L NA 0.0377 0.0046 0.0004 0.000842007, 2013 Copper mg/L NA 0.1289 0.0304 0.0019 0.00222007, 2013 Lead mg/L NA 0.3442 0.0744 0.00025 0.000612007, 2013 Nickel mg/L NA 0.0669 0.0104 0.0025 0.00382007, 2013 Selenium mg/L 0.005 16. 40 CFR 131.38 0.0030 0.0004J 0.00032J 0.00046 0% NA1
2007, 2013 Zinc mg/L NA 0.5719 0.1323 0.0025J 0.0034JDissolved Metals2007 Antimony mg/L 0.006 1. Basin Plan 0.0019 0.0003J 0.00013J 0.00012J 0% NA1
2007, 2013 Arsenic mg/L 0.34 16. 40 CFR 131.38 0.0023 0.0013 0.00074 0.00073 0% NA1
2007, 2013 Cadmium mg/L (c) 16. 40 CFR 131.38 <0.0004 <0.0004 0.000032J 0.00003J 0% NA1
2007, 2013 Chromium mg/L (c) 16. 40 CFR 131.38 0.0002J 0.0001J 0.00011J 0.00011J 0% NA1
2007, 2013 Copper mg/L (c) 16. 40 CFR 131.38 0.0050 0.0021 0.0015 0.0019 0% NA1
2007, 2013 Lead mg/L (c) 16. 40 CFR 131.38 0.0001 <0.0001 <0.0002 0.000045J 0% NA1
2007, 2013 Nickel mg/L (c) 16. 40 CFR 131.38 0.0028 0.0005 0.0024 0.0036 0% NA1
2007, 2013 Selenium mg/L NA 0.0014 0.0003J 0.00039J 0.0003J2007, 2013 Zinc mg/L (c) 16. 40 CFR 131.38 0.0028 0.0007 0.0022J 0.0019J 0% NA1
Organophosphorus Pesticides
2007, 2013 Chlorpyrifos µg/L 0.02 acute / 0.014 chronic 12. CA Dept. of Fish & Game, 2000 <0.002 <0.002 <0.01 <0.01 0% NA1
2007, 2013 Diazinon µg/L 0.08 acute / 0.05 chronic
12. CA Dept. of Fish & Game, 2000, 11. Chollas Creek TMDL for Diazinon, 10. USEPA, Aquatic Life Ambient
Water Quality Criteria Diazinon<0.004 <0.004 <0.01 <0.01 0% NA1
2007, 2013 Malathion µg/L 0.43 13. CA Dept. of Fish & Game, 1998, 5. Goldbook <0.006 <0.006 <0.01 <0.01 0% NA1
Pyrethroids2007, 2013 Allethrin µg/L NA <0.002 <0.002 <0.002 <0.002 NA1
2007, 2013 Bifenthrin µg/L 0.0093 15. Anderson et al., 2006 <0.002 <0.002 <0.002 <0.002 0% NA1
2007, 2013 Cyfluthrin µg/L 0.344 17. Wheelock et al., 2004 <0.002 <0.002 <0.002 <0.002 0% NA1
2007, 2013 Cyhalothrin, Total Lambda µg/L 0.20 17. Wheelock et al., 2004 <0.002 0.005 <0.002 <0.002 0% NA1
2007, 2013 Cypermethrin µg/L 0.683 17. Wheelock et al., 2004 <0.002 <0.002 <0.002 <0.002 0% NA1
2007, 2013 Danitol (Fenpropathrin) µg/L NA <0.002 <0.002 <0.002 <0.0022007, 2013 Deltamethrin/Tralomethrin£ µg/L NA <0.002 <0.002 <0.002 <0.0022007, 2013 Esfenvalerate µg/L 0.25 17. Wheelock et al., 2004 <0.002 <0.002 <0.002 <0.002 0% NA1
2007, 2013 Fenvalerate µg/L NA <0.002 <0.002 <0.002 <0.0022007, 2013 Fluvalinate µg/L NA <0.002 <0.002 <0.002 <0.0022007, 2013 Permethrin µg/L 0.021 15. Anderson et al., 2006 <0.025* <0.025* <0.025* <0.025* 0% NA1
2007, 2013 Prallethrin µg/L NA <0.002 <0.002 <0.002 <0.0022007, 2013 Resmethrin µg/L NA <0.025Toxicity2007, 2013 Ceriodaphnia 96-hr LC50 (%) >100 >100 >100 >100 >100 0% NA1
2007, 2013 Ceriodaphnia 7-day survival NOEC (%) 100 100 100 >100 100 0% NA1
2007, 2013 Ceriodaphnia 7-day reproduction NOEC (%) 100 12.5** 100 >100 100 0% NA1
2007 Hyalella 96-hr LC50 (%) >100 >100 >100 >100 >100 0% NA1
2007, 2013 Selenastrum 96-hr NOEC (%) 100 100 100 100 100 0% NA1
See last page for footnotes and source references.N
o Sa
mpl
es C
olle
cted
No
Sam
ples
Col
lect
ed
Transitional MonitoringFrequency
Above Benchmarks
Mean Ratio to Benchmarks2010-2011Benchmark References 2007-2008
No
Sam
ples
Col
lect
ed
No
Sam
ples
Col
lect
ed
No
Sam
ples
Col
lect
ed
No
Sam
ples
Col
lect
ed
Historical Monitoring Data
Permit Requirement Analyte Units Water Quality
Benchmarks

Wet Weather Historical Monitoring Table for SDC-TWAS-2
Blank spaces have been verified and no data is available.
NA indicate no criteria or published value was available or applicable to the matrix or program.
(b) Water Quality Benchmark is based on the San Diego Regional Water Quality Control Plan by watershed for the San Diego Region (Basin Plan), 1994 (with amendments effective on or before April 4, 2011) and may vary by hydrologic area.(c) Water Quality Benchmark for dissolved metal fractions are based on total hardness and are calculated as described by the USEPA Federal Register Doc. 40 CFR Part 131, May 18, 2000. The Criteria Maximum Concentration (CMC) was used.* Indicates detection limit above water quality benchmark.
* Indicates detection limit above water quality benchmark.J-Analyte was detected at a concentration below the reporting limit and above the method detection limit. Reported value is estimated.NA1 Three or more years of data required to calculate the Mean Ratio to Benchmark.
SourcesPlease refer to the San Diego County Copermittee Regional Monitoring Program Benchmark Sources in Attachment B to Appendix A for benchmark source citations.
(a) Prior to the 2014-2015 monitoring year, Water Quality Benchmark was calculated based on CMC (salmonids absent) using pH described in the U.S. EPA, 1999 Update of Ambient Water Quality Criteria for Ammonia, EPA-822-R-99-014, December 1999. For 2014-2015 monitoring year, Water Quality Benchmark CMC was calculated based on pH and water temperature (when applicable) as described in the U.S. EPA, 2013 Aquatic Life Ambient Water Quality Criteria for Ammonia - Freshwater, EPA-822-R-13-001, April 2013.
**For SDC-TWAS-2 on 11/30/07-12/1/07, the C. dubia 7-day reproduction endpoint test was inconclusive due to the high particulate content from fire related impacts to this portion of the watershed. The sample required dilution to a 12.5% solution to run the test and no toxicity was observed in this diluted sample. No inference can be made to the 100% solution.
Values with red bold font and shading do not meet Water Quality Benchmarks.

Wet Weather Historical Monitoring Tables for SDC-MLS
11/29/01 01/29/02 02/17/02 02/11/03 02/25/03 03/15/03 02/03/04 02/18/04 03/02/04 10/17/04 02/11/05 02/18/05 10/18/05 01/02/06 02/20/06
Physical Chemistry2013 Dissolved Oxygen mg/L <6.0 (a) 1. Basin Plan2007, 2013 pH pH units 6.5-9.0 1. Basin Plan 7.6 7.5 7.5 7.83 7.56 7.64 8.00 5.22 7.21 7.82 7.70 6.84 7.17 8.45 6.602007, 2013 Specific Conductivity µmhos/cm NA 3,090 3,340 3,480 277 2,700 257 3,700 3,660 1,990 3,210 3,380 1,744 3,790 4,250 3,7102007, 2013 Water Temperature Celsius NA 15.00 14.30 13.70 13.40 12.80 13.50 19.90 13.10 14.40 17.90 15.30 11.902013 Color Color Units 20 1. Basin Plan2007, 2013 Turbidity NTU 20 1. Basin Plan 17.6 3.69 3.12 4.72 17.5 17.7 30.6 19.3 29.7 6.77 6.01 18.3 3.02 7.89 39.2Bacteriological2007, 2013 Enterococcus MPN/100 mL NA 3,000 300 500 17,000 5,000 1,700 7,000 1,300 30,000 140,000 130 1,300 8,000 5,000 2302007, 2013 Fecal Coliform MPN/100 mL 400 1.Basin Plan REC-1/REC-2 230 80 22 5,000 300 700 230 1300 8,000 14,000 230 500 1,300 1,300 2302007, 2013 Total Coliform MPN/100 mL NA 230 1,300 170 50,000 3,000 13,000 500 3,000 130,000 300,000 800 3,000 2,300 3,000 500Nutrients2007, 2013 Ammonia as N mg/L (b) 6. USEPA Water Quality Criteria (Freshwater) 0.2 0.13 <0.1 0.52 0.20 0.13 <0.1 0.17 1.7 <0.1 0.17 0.16 0.12 <0.1 0.392007, 2013 Nitrate as N mg/L 10 1. Basin Plan 0.1 0.2 0.2 0.06 0.40 0.27 0.05 0.13 1.01 0.16 1.67 1.81 0.18 0.07 0.452007, 2013 Nitrite as N mg/L 1 1. Basin Plan <0.05 <0.05 <0.05 <0.05 <0.05 <0.05 <0.05 <0.05 <0.05 <0.05 <0.05 <0.05 <0.05 <0.05 <0.052007, 2013 Total Kjeldahl Nitrogen mg/L NA 2.4 1.35 1.4 0.8 1.4 0.9 0.8 2.8 1.8 1.4 1.6 2 2.9 1.9 4.12007, 2013 Dissolved Phosphorus mg/L 2 4. MSGP 2015 0.1 0.05 <0.05 0.11 0.08 <0.05 <0.05 0.2 0.19 0.16 0.13 0.12 0.4 0.09 0.22013 Orthophosphate mg/L NA2007 Total Phosphorus mg/L 2 4. MSGP 2015 0.1 0.07 0.08 0.14 0.08 0.12 0.12 0.2 0.3 0.19 0.14 0.45 0.52 0.16 0.3General Chemistry2007 Biochemical Oxygen Demand mg/L 30 4. MSGP 2015, 8. McNeeley (1979) 14 3 2.1 15.9 2.51 3.89 44.7 7.46 4.37 21.8 3.33 <2 4.39 4.16 <22007 Chemical Oxygen Demand mg/L 120 4. MSGP 2015 34 61 60 51 41 82 138 57 81 <25 123 41 38 41 1042013 Chloride mg/L 250 (a) 1. Basin Plan2007, 2013 Dissolved Organic Carbon mg/L NA 7.98 10.4 7.67 5.74 61 9.19 35.9 5.42 5.21 5.53 14 9.662007, 2013 Total Organic Carbon mg/L NA 9.68 8.59 11.0 9.85 83.8 11.2 36.3 9.54 10.9 13.7 3.83 13.62007 Oil and Grease mg/L 10 1. Basin Plan, 3. Anacostia River TMDL, 4. MSGP 2015 <1 <1 <1 <1 <1 1.38 <1 <1 <1 <1 <1 <1 <1 <1 <12013 Sulfate mg/L 250 (a) 1. Basin Plan2007, 2013 Surfactants (MBAS) mg/L 0.5 1. Basin Plan <0.5 <0.5 <0.5 <0.1 0.1 <0.1 <0.5 <0.5 <0.5 <0.5 <0.5 <0.5 <0.5 <0.5 <0.52007, 2013 Total Dissolved Solids mg/L 500 (a) 1. Basin Plan 1,750 1,940 2,080 1,900 1,440 1,490 2,220 2,580 1,350 2,100 1,630 982 2,020 2,090 1,9502007, 2013 Total Suspended Solids mg/L 100 4. MSGP 2015, 1. Basin Plan 31 <20 <20 10 23 34 <20 44 101 28 24 28 <20 26 1742007, 2013 Total Hardness mg CaCO3/L NA 840 970 1,080 1,030 726 767 935 999 564 967 767 487 1,030 1,090 1,080Total Metals2013 Aluminum mg/L NA2007 Antimony mg/L NA <0.002 <0.002 <0.002 0.002 0.003 <0.002 <0.005 <0.006 <0.005 <0.005 <0.005 <0.005 <0.005 <0.005 <0.0052007, 2013 Arsenic mg/L NA 0.001 0.002 0.003 0.002 0.003 0.003 0.007 0.006 0.004 0.006 0.007 <0.002 0.009 0.005 0.0052007, 2013 Cadmium mg/L NA <0.001 <0.001 <0.001 <0.001 <0.001 <0.001 <0.001 <0.001 <0.001 <0.001 <0.001 <0.001 <0.001 <0.001 0.0032007, 2013 Chromium mg/L NA 0.005 0.006 <0.005 <0.005 <0.005 <0.005 <0.005 <0.005 <0.005 <0.005 <0.005 <0.005 <0.005 <0.005 <0.0052007, 2013 Copper mg/L NA <0.005 <0.005 <0.005 0.014 0.004 <0.005 0.012 0.006 0.005 0.005 <0.005 <0.005 <0.005 <0.005 <0.0052013 Iron mg/L 0.3 (a) 1. Basin Plan2007, 2013 Lead mg/L NA <0.002 <0.002 <0.002 0.002 <0.002 <0.002 <0.002 <0.002 <0.002 0.002 <0.002 <0.002 <0.002 <0.002 <0.0022013 Manganese mg/L 0.05 (a) 1. Basin Plan2013 Mercury mg/L NA2007, 2013 Nickel mg/L NA 0.002 0.002 0.003 0.002 <0.002 0.003 0.003 <0.002 <0.002 0.003 0.003 0.002 0.003 0.003 0.0032007, 2013 Selenium mg/L 0.005 16. 40 CFR 131.38 <0.002 <0.002 0.007 <0.004 <0.004 <0.004 <0.005 <0.005 <0.005 <0.005 <0.005 <0.005 <0.005 <0.004 <0.0052013 Thallium mg/L NA2007, 2013 Zinc mg/L NA <0.020 <0.020 <0.020 <0.020 0.008 0.005 <0.02 <0.02 <0.02 <0.02 <0.02 <0.02 0.034 <0.02 0.026Dissolved Metals2013 Aluminum mg/L NA2007 Antimony mg/L 0.006 1. Basin Plan <0.002 <0.002 <0.002 <0.002 0.002 0.003 <0.005 <0.006 <0.005 <0.005 <0.005 <0.005 <0.005 <0.005 <0.0052007, 2013 Arsenic mg/L 0.34 16. 40 CFR 131.38 0.001 0.002 0.001 0.002 0.002 0.002 0.003 0.004 <0.002 <0.002 <0.002 <0.002 0.003 <0.001 <0.0012007, 2013 Cadmium mg/L (c) 16. 40 CFR 131.38 <0.001 <0.001 <0.001 0.002 <0.001 <0.001 <0.001 <0.001 <0.001 <0.001 <0.001 <0.001 <0.001 <0.001 <0.0012007, 2013 Chromium mg/L (c) 16. 40 CFR 131.38 <0.005 <0.005 0.007 <0.005 <0.005 <0.005 <0.005 <0.005 <0.005 <0.005 <0.005 <0.005 <0.005 <0.005 <0.0052007, 2013 Copper mg/L (c) 16. 40 CFR 131.38 <0.005 <0.005 <0.005 0.016 0.005 0.005 0.005 0.005 <0.005 <0.005 <0.005 <0.005 <0.005 <0.005 <0.0052013 Iron mg/L NA2007, 2013 Lead mg/L (c) 16. 40 CFR 131.38 <0.002 <0.002 <0.002 <0.002 <0.002 0.0007 <0.002 <0.002 <0.002 <0.002 <0.002 <0.002 <0.002 <0.002 <0.0022013 Manganese mg/L NA2013 Mercury mg/L NA2007, 2013 Nickel mg/L (c) 16. 40 CFR 131.38 <0.002 0.003 0.005 0.002 <0.002 0.009 0.003 0.002 0.007 0.003 0.003 0.002 <0.002 0.003 0.0032007, 2013 Selenium mg/L NA <0.002 <0.002 <0.002 <0.004 <0.004 <0.004 <0.005 <0.005 <0.005 <0.005 <0.005 <0.005 <0.005 <0.004 <0.0052013 Thallium mg/L NA2007, 2013 Zinc mg/L (c) 16. 40 CFR 131.38 <0.020 <0.020 <0.020 0.086 0.033 <0.020 <0.02 <0.02 <0.02 <0.02 <0.02 <0.02 <0.02 <0.02 <0.02
2003-20042002-2003 2004-2005 2005-2006
Permit Requirement Benchmark ReferencesWater Quality
BenchmarksUnitsAnalyte
Historical Monitoring Data
2001-2002

Wet Weather Historical Monitoring Tables for SDC-MLS
11/29/01 01/29/02 02/17/02 02/11/03 02/25/03 03/15/03 02/03/04 02/18/04 03/02/04 10/17/04 02/11/05 02/18/05 10/18/05 01/02/06 02/20/06
2003-20042002-2003 2004-2005 2005-2006
Permit Requirement Benchmark ReferencesWater Quality
BenchmarksUnitsAnalyte
Historical Monitoring Data
2001-2002
Acid Extractable Compounds2013 Pentachlorophenol µg/L (d) 16. 40 CFR 131.38Organophosphorus Pesticides2013 Azinphos methyl (Guthion) µg/L NA2013 Bolstar µg/L NA
2007, 2013 Chlorpyrifos µg/L 0.02 acute / 0.014 chronic 12. CA Dept. of Fish & Game, 2000 <0.03* <0.03* <0.03* <0.03* <0.03* <0.03* <0.01 <0.01 <0.01 <0.01 <0.01 <0.01 <0.01 <0.02 <0.02
2013 Coumaphos µg/L NA2013 Demeton-o µg/L NA2013 Demeton-s µg/L NA
2007, 2013 Diazinon µg/L 0.08 acute / 0.05 chronic
12. CA Dept. of Fish & Game, 2000, 11. Chollas Creek TMDL for Diazinon, 10. USEPA, Aquatic Life Ambient
Water Quality Criteria Diazinon<0.03 <0.03 <0.03 <0.03 <0.03 <0.03 <0.01 <0.01 0.032 <0.01 <0.01 <0.01 <0.01 <0.02 <0.02
2013 Dichlorvos µg/L NA2013 Dimethoate µg/L NA2013 Disulfoton µg/L NA2013 Ethoprop µg/L NA2013 Ethyl parathion µg/L NA2013 Fensulfothion µg/L NA2013 Fenthion µg/L NA2007, 2013 Malathion µg/L 0.43 13. CA Dept. of Fish & Game, 1998, 5. Goldbook <0.10 <0.10 <0.10 <0.01 <0.01 <0.01 <0.01 <0.01 <0.01 <0.01 <0.02 <0.022013 Merphos µg/L NA2013 Methyl parathion µg/L NA2013 Mevinphos µg/L NA2013 Naled µg/L NA2013 Phorate µg/L NA2013 Ronnel µg/L NA2013 Stirophos µg/L NA2013 Tokuthion (Prothiofos) µg/L NA2013 Trichloronate µg/L NAPyrethroids2007, 2013 Allethrin µg/L NA2007, 2013 Bifenthrin µg/L 0.0093 15. Anderson et al., 20062007, 2013 Cyfluthrin µg/L 0.344 17. Wheelock et al., 20042007, 2013 L-Cyhalothrin µg/L 0.20 17. Wheelock et al., 20042007, 2013 Cypermethrin µg/L 0.683 17. Wheelock et al., 20042007, 2013 Danitol (Fenpropathrin) µg/L NA2007, 2013 Deltamethrin/Tralomethrin£ µg/L NA2007, 2013 Esfenvalerate µg/L 0.25 17. Wheelock et al., 20042007, 2013 Fenvalerate µg/L NA2007, 2013 Fluvalinate µg/L NA2007, 2013 Permethrin µg/L 0.021 15. Anderson et al., 20062007, 2013 Prallethrin µg/L NA2007, 2013 Resmethrin µg/L NAToxicity2007, 2013 Ceriodaphnia 96-hr LC50 (%) >100 >100 >100 >100 >100 >100 >100 >100 >100 > 100 >100 >100 >100 >100 >100 >1002007, 2013 Ceriodaphnia 7-day survival NOEC (%) 100 100 100 100 100 100 100 100 100 100 100 100 100 100 50 1002007, 2013 Ceriodaphnia 7-day reproduction NOEC (%) 100 6.25 100 50 12.5 100 50 100 100 100 25 100 100 100 50 1002007 Hyalella 96-hr LC50 (%) >100 >100 >100 >100 >100 >100 >100 >100 >100 >100 >100 >100 >100 >100 >100 >1002007, 2013 Selenastrum 96-hr NOEC (%) 100 100 50 50 100 100 100 100 50 100 100 100 100 100 50 <6.252013 Strongylocentrotus 96-hr TST Pass/FailSee last page for footnotes and source references.

Wet Weather Historical Monitoring Tables for SDC-MLS
Physical Chemistry2013 Dissolved Oxygen mg/L <6.0 (a) 1. Basin Plan2007, 2013 pH pH units 6.5-9.0 1. Basin Plan2007, 2013 Specific Conductivity µmhos/cm NA2007, 2013 Water Temperature Celsius NA2013 Color Color Units 20 1. Basin Plan2007, 2013 Turbidity NTU 20 1. Basin PlanBacteriological2007, 2013 Enterococcus MPN/100 mL NA2007, 2013 Fecal Coliform MPN/100 mL 400 1.Basin Plan REC-1/REC-2 2007, 2013 Total Coliform MPN/100 mL NANutrients2007, 2013 Ammonia as N mg/L (b) 6. USEPA Water Quality Criteria (Freshwater)2007, 2013 Nitrate as N mg/L 10 1. Basin Plan2007, 2013 Nitrite as N mg/L 1 1. Basin Plan2007, 2013 Total Kjeldahl Nitrogen mg/L NA2007, 2013 Dissolved Phosphorus mg/L 2 4. MSGP 20152013 Orthophosphate mg/L NA2007 Total Phosphorus mg/L 2 4. MSGP 2015General Chemistry2007 Biochemical Oxygen Demand mg/L 30 4. MSGP 2015, 8. McNeeley (1979)2007 Chemical Oxygen Demand mg/L 120 4. MSGP 20152013 Chloride mg/L 250 (a) 1. Basin Plan2007, 2013 Dissolved Organic Carbon mg/L NA2007, 2013 Total Organic Carbon mg/L NA2007 Oil and Grease mg/L 10 1. Basin Plan, 3. Anacostia River TMDL, 4. MSGP 20152013 Sulfate mg/L 250 (a) 1. Basin Plan2007, 2013 Surfactants (MBAS) mg/L 0.5 1. Basin Plan2007, 2013 Total Dissolved Solids mg/L 500 (a) 1. Basin Plan2007, 2013 Total Suspended Solids mg/L 100 4. MSGP 2015, 1. Basin Plan2007, 2013 Total Hardness mg CaCO3/L NATotal Metals2013 Aluminum mg/L NA2007 Antimony mg/L NA2007, 2013 Arsenic mg/L NA2007, 2013 Cadmium mg/L NA2007, 2013 Chromium mg/L NA2007, 2013 Copper mg/L NA2013 Iron mg/L 0.3 (a) 1. Basin Plan2007, 2013 Lead mg/L NA2013 Manganese mg/L 0.05 (a) 1. Basin Plan2013 Mercury mg/L NA2007, 2013 Nickel mg/L NA2007, 2013 Selenium mg/L 0.005 16. 40 CFR 131.382013 Thallium mg/L NA2007, 2013 Zinc mg/L NADissolved Metals2013 Aluminum mg/L NA2007 Antimony mg/L 0.006 1. Basin Plan2007, 2013 Arsenic mg/L 0.34 16. 40 CFR 131.382007, 2013 Cadmium mg/L (c) 16. 40 CFR 131.382007, 2013 Chromium mg/L (c) 16. 40 CFR 131.382007, 2013 Copper mg/L (c) 16. 40 CFR 131.382013 Iron mg/L NA2007, 2013 Lead mg/L (c) 16. 40 CFR 131.382013 Manganese mg/L NA2013 Mercury mg/L NA2007, 2013 Nickel mg/L (c) 16. 40 CFR 131.382007, 2013 Selenium mg/L NA2013 Thallium mg/L NA2007, 2013 Zinc mg/L (c) 16. 40 CFR 131.38
Permit Requirement Benchmark ReferencesWater Quality
BenchmarksUnitsAnalyte2008-2009 2009-2010 2011-2012
12/10/06 01/31/07 02/20/07 11/30/07 02/03/08-02/04/08 11/12/08 - 10/20/10 02/17/11-
02/18/11 - 12/13/12-12/14/12 02/10/13
7.46 8.04 7.53 7.90 7.75 7.56 7.39 7.55 7.63 7.063,650 3,470 3,080 3,720 2,740 4,170 406 3,310 3,680 3,52016.40 11.90 16.20 13.00 18.70 20.00 12.70 14.6 11.2
10.2 18.7 36.1 28 8 4.4 3.1 1.5 4 2.2
1,300 110 13,000 8,000 2,300 500 11,000 700 8,000 1,300130 20 800 2,200 80 800 2,300 170 5,000 230
1,300 500 3,000 17,000 5,000 2,200 13,000 5,000 30,000 1,400
0.45 0.12 0.92 0.26 0.07 0.07 0.67 0.2 0.37 0.13<0.05 <0.05 0.11 0.7 0.33 0.17 0.17 0.61 0.33 0.36<0.05 <0.05 <0.05 0.08 <0.05 0.06 0.12 0.047J 0.043J 0.015J
2.5 2.9 4.5 1.8 1.3 1.7 1.2 1 0.91 1.1<0.05 0.05 <0.05 0.28 0.08 0.072 0.32 0.078 0.24 0.094
0.43 0.16 0.18 0.35 0.15 0.12 0.34 0.19 0.3 0.11
2.18 3.89 7.07 11 2.7 <2 3.9 1.7J 2.5 1.2J99 76 46 70 29 38 40 24 24 23
10.5 9.56 10.3 11.6 8.4 6 5.9 6.3 9.1 6.613.8 10.9 10.8 12.8 7.4 6.4 5.8 5.8 9.9 6.6<5 <5 <5 1.9J 2.3J <5 <5 <5 <5 <5
<0.5 <0.5 <0.5 0.14 0.072 0.05 0.059 0.038J 0.057 0.042J2,180 2,340 1,840 2,034 1,528 2,374 2,600 1,900 2,100 2,000156 141 39 28 7.3 5 14 17 11 3
1,190 1,210 985 510.1 358.9 842.7 1,000 970 921 912
<0.002 <0.002 0.002 0.0003J 0.0004J 0.0001J 0.00016J 0.00016J 0.00017J 0.00017J<0.001 <0.001 0.003 0.0048 0.0029 0.0037 0.0027 0.0017 0.0027 0.00190.007 <0.001 <0.001 <0.0004 <0.0004 <0.0004 0.000014J 0.00003J 0.000028J 0.00002J
<0.005 <0.005 <0.005 0.0006 <0.0002 0.0001J 0.00044 0.00056 0.00018J 0.000320.006 0.007 0.012 0.0059 0.0018 <0.0008 0.00071 0.0014 0.0015 0.001
0.002 0.002 0.002 0.00062 0.00025 0.0001J 0.000048J 0.00016J 0.000082J 0.00013J
0.005 0.005 0.006 0.0026 0.002 0.0026 0.0048 0.0063 0.0056 0.002<0.004 0.005 <0.004 0.0003J 0.0007 0.0003J 0.0004 0.00081 0.00082 0.00047
0.028 <0.02 0.101 0.018 0.0031 0.002 0.0017J 0.0015J 0.0017J 0.0014J
<0.002 <0.002 0.002 0.0002J 0.0004J 0.0001J 0.00015J 0.00016J 0.00016J 0.00017J<0.001 <0.001 <0.001 0.0038 0.0028 0.0037 0.0026 0.0015 0.0028 0.0017<0.001 <0.001 <0.001 <0.0004 <0.0004 <0.0004 0.00002J 0.000022J 0.000021J <0.0001<0.005 <0.005 <0.005 0.0001J 0.0001J <0.0005 0.00017J 0.00015J 0.00008J 0.00012J<0.002 0.003 0.003 0.0023 0.0016 <0.0008 0.0006 0.0012 0.0014 0.00084
<0.001 <0.001 <0.001 0.00008J <0.0001 <0.0001 <0.0002 0.000017J 0.000012J 0.00003J
0.003 0.003 0.002 0.0022 0.0021 0.0024 0.0045 0.0062 0.0054 0.002<0.004 <0.004 <0.004 0.0003J 0.0008 0.0002J 0.00037J 0.0008 0.00078 0.00047
<0.02 <0.02 <0.02 0.0046 0.0008 0.0005 0.0018J 0.0011J 0.002J 0.0022J
No
Sam
ples
Col
lect
ed
No
Sam
ples
Col
lect
ed
2012-20132010-2011
Historical Monitoring Data
2007-20082006-2007

Wet Weather Historical Monitoring Tables for SDC-MLS
Permit Requirement Benchmark ReferencesWater Quality
BenchmarksUnitsAnalyte
Acid Extractable Compounds2013 Pentachlorophenol µg/L (d) 16. 40 CFR 131.38Organophosphorus Pesticides2013 Azinphos methyl (Guthion) µg/L NA2013 Bolstar µg/L NA
2007, 2013 Chlorpyrifos µg/L 0.02 acute / 0.014 chronic 12. CA Dept. of Fish & Game, 2000
2013 Coumaphos µg/L NA2013 Demeton-o µg/L NA2013 Demeton-s µg/L NA
2007, 2013 Diazinon µg/L 0.08 acute / 0.05 chronic
12. CA Dept. of Fish & Game, 2000, 11. Chollas Creek TMDL for Diazinon, 10. USEPA, Aquatic Life Ambient
Water Quality Criteria Diazinon2013 Dichlorvos µg/L NA2013 Dimethoate µg/L NA2013 Disulfoton µg/L NA2013 Ethoprop µg/L NA2013 Ethyl parathion µg/L NA2013 Fensulfothion µg/L NA2013 Fenthion µg/L NA2007, 2013 Malathion µg/L 0.43 13. CA Dept. of Fish & Game, 1998, 5. Goldbook2013 Merphos µg/L NA2013 Methyl parathion µg/L NA2013 Mevinphos µg/L NA2013 Naled µg/L NA2013 Phorate µg/L NA2013 Ronnel µg/L NA2013 Stirophos µg/L NA2013 Tokuthion (Prothiofos) µg/L NA2013 Trichloronate µg/L NAPyrethroids2007, 2013 Allethrin µg/L NA2007, 2013 Bifenthrin µg/L 0.0093 15. Anderson et al., 20062007, 2013 Cyfluthrin µg/L 0.344 17. Wheelock et al., 20042007, 2013 L-Cyhalothrin µg/L 0.20 17. Wheelock et al., 20042007, 2013 Cypermethrin µg/L 0.683 17. Wheelock et al., 20042007, 2013 Danitol (Fenpropathrin) µg/L NA2007, 2013 Deltamethrin/Tralomethrin£ µg/L NA2007, 2013 Esfenvalerate µg/L 0.25 17. Wheelock et al., 20042007, 2013 Fenvalerate µg/L NA2007, 2013 Fluvalinate µg/L NA2007, 2013 Permethrin µg/L 0.021 15. Anderson et al., 20062007, 2013 Prallethrin µg/L NA2007, 2013 Resmethrin µg/L NAToxicity2007, 2013 Ceriodaphnia 96-hr LC50 (%) >1002007, 2013 Ceriodaphnia 7-day survival NOEC (%) 1002007, 2013 Ceriodaphnia 7-day reproduction NOEC (%) 1002007 Hyalella 96-hr LC50 (%) >1002007, 2013 Selenastrum 96-hr NOEC (%) 1002013 Strongylocentrotus 96-hr TST Pass/FailSee last page for footnotes and source references.
2008-2009 2009-2010 2011-2012
12/10/06 01/31/07 02/20/07 11/30/07 02/03/08-02/04/08 11/12/08 - 10/20/10 02/17/11-
02/18/11 - 12/13/12-12/14/12 02/10/13
2012-20132010-2011
Historical Monitoring Data
2007-20082006-2007
<0.002 <0.002 <0.002 <0.002 <0.002 <0.002 <0.01 <0.01 <0.01 <0.01
<0.004 <0.004 <0.004 <0.004 <0.004 <0.004 <0.01 <0.01 <0.01 <0.01
<0.006 <0.006 <0.006 0.029 <0.006 <0.006 <0.01 <0.01 <0.01 <0.01
<0.002 <0.002 <0.002 <0.005 <0.002 <0.002 <0.0020.0258 <0.002 <0.002 <0.005 <0.002 0.0068 <0.002<0.002 <0.002 <0.002 0.0044J <0.002 <0.002 <0.0020.0006J <0.002 <0.002 0.0027J <0.002 <0.002 <0.002<0.002 <0.002 <0.002 0.0042J <0.002 <0.002 <0.002<0.002 <0.002 <0.002 <0.002 <0.002 <0.002<0.002 <0.002 <0.002 0.0047J <0.002 <0.002 <0.002<0.002 <0.002 <0.002 0.0035J <0.002 <0.002 <0.002<0.002 <0.002 <0.002 0.0035 <0.002 <0.002 <0.002<0.002 <0.002 <0.002 <0.002 <0.002 <0.002
<0.025* <0.025* <0.025* <0.005 <0.025* <0.025†† <0.01<0.002 <0.002 <0.002 <0.005 <0.002 <0.002 <0.002
<0.025 <0.025 <0.025 <0.01
>100 18.95 >100 >100 >100 >100 >100 >100 >100 >100100 12.5 100 100 100 100 100 100 100 10050 12.5 100 50 100 100 100 6.25 100 100
>100 >100 >100 >100 >100 >100 >100 >100 >100 >10050 100 100 100 100 100 100 100 100 100
No
Sam
ples
Col
lect
ed
No
Sam
ples
Col
lect
ed

Wet Weather Historical Monitoring Tables for SDC-MLS
Physical Chemistry2013 Dissolved Oxygen mg/L <6.0 (a) 1. Basin Plan2007, 2013 pH pH units 6.5-9.0 1. Basin Plan2007, 2013 Specific Conductivity µmhos/cm NA2007, 2013 Water Temperature Celsius NA2013 Color Color Units 20 1. Basin Plan2007, 2013 Turbidity NTU 20 1. Basin PlanBacteriological2007, 2013 Enterococcus MPN/100 mL NA2007, 2013 Fecal Coliform MPN/100 mL 400 1.Basin Plan REC-1/REC-2 2007, 2013 Total Coliform MPN/100 mL NANutrients2007, 2013 Ammonia as N mg/L (b) 6. USEPA Water Quality Criteria (Freshwater)2007, 2013 Nitrate as N mg/L 10 1. Basin Plan2007, 2013 Nitrite as N mg/L 1 1. Basin Plan2007, 2013 Total Kjeldahl Nitrogen mg/L NA2007, 2013 Dissolved Phosphorus mg/L 2 4. MSGP 20152013 Orthophosphate mg/L NA2007 Total Phosphorus mg/L 2 4. MSGP 2015General Chemistry2007 Biochemical Oxygen Demand mg/L 30 4. MSGP 2015, 8. McNeeley (1979)2007 Chemical Oxygen Demand mg/L 120 4. MSGP 20152013 Chloride mg/L 250 (a) 1. Basin Plan2007, 2013 Dissolved Organic Carbon mg/L NA2007, 2013 Total Organic Carbon mg/L NA2007 Oil and Grease mg/L 10 1. Basin Plan, 3. Anacostia River TMDL, 4. MSGP 20152013 Sulfate mg/L 250 (a) 1. Basin Plan2007, 2013 Surfactants (MBAS) mg/L 0.5 1. Basin Plan2007, 2013 Total Dissolved Solids mg/L 500 (a) 1. Basin Plan2007, 2013 Total Suspended Solids mg/L 100 4. MSGP 2015, 1. Basin Plan2007, 2013 Total Hardness mg CaCO3/L NATotal Metals2013 Aluminum mg/L NA2007 Antimony mg/L NA2007, 2013 Arsenic mg/L NA2007, 2013 Cadmium mg/L NA2007, 2013 Chromium mg/L NA2007, 2013 Copper mg/L NA2013 Iron mg/L 0.3 (a) 1. Basin Plan2007, 2013 Lead mg/L NA2013 Manganese mg/L 0.05 (a) 1. Basin Plan2013 Mercury mg/L NA2007, 2013 Nickel mg/L NA2007, 2013 Selenium mg/L 0.005 16. 40 CFR 131.382013 Thallium mg/L NA2007, 2013 Zinc mg/L NADissolved Metals2013 Aluminum mg/L NA2007 Antimony mg/L 0.006 1. Basin Plan2007, 2013 Arsenic mg/L 0.34 16. 40 CFR 131.382007, 2013 Cadmium mg/L (c) 16. 40 CFR 131.382007, 2013 Chromium mg/L (c) 16. 40 CFR 131.382007, 2013 Copper mg/L (c) 16. 40 CFR 131.382013 Iron mg/L NA2007, 2013 Lead mg/L (c) 16. 40 CFR 131.382013 Manganese mg/L NA2013 Mercury mg/L NA2007, 2013 Nickel mg/L (c) 16. 40 CFR 131.382007, 2013 Selenium mg/L NA2013 Thallium mg/L NA2007, 2013 Zinc mg/L (c) 16. 40 CFR 131.38
Permit Requirement Benchmark ReferencesWater Quality
BenchmarksUnitsAnalyte
Long Term and
Transitional Monitoring
Long Term and
Transitional Monitoring
Long Term Monitoring
Only
Long Term and
Transitional Monitoring
2013-2014
- 11/22/14 12/02/14-12/04/14
03/01/15-03/02/15
6.03 4.8 7.02 33% NA1
7.34 7.54 7.44 4% 0.294,194 3,705 3,63813.87 16.92 14.7
20 30 25 67% NA1
8.5 1.4 0.5 18% 0.63
170 220 140,000130 500 50,000 54% 8.55
3,000 1,400 50,000
0.15 0.53 <0.10 0% 0.020.054J 0.11 0.090J 0% 0.040.15 0.12 0.013J 0% 0.040.87 1.6 0.60.11 NR 0.13 0% 0.06
0.064 0.12 0.120.14 0.27 0.16 0% 0.10
8.5 NR <2.0 4% 0.2236 NR 27 7% 0.46
1,200 1,100 880 100% NA1
8.5 12 5.99.1 11 6.11.7J NR <5.0 0% 0.14610 570 450 100% NA1
0.098 0.18J 0.082 0% 0.342,800 2,700 2,200 100% 4.01
4 8 9 14% 0.361200 1230 1050
<0.0050 0.0089 0.0770.00014J NR 0.00019J0.0022 0.0027 0.0023
0.000018J 0.000021J <0.000100.000067J 0.000082J 0.00021
0.0015 0.0017 0.00160.16 0.3 0.25 0% NA1
<0.00020 0.000030J 0.000079J0.38 0.56 0.19 100% NA1
<0.000050 <0.000050 0.000013J0.0085 0.0076 0.00650.0034 0.0029 0.0018 4% 0.41
<0.00020 <0.00020 <0.000200.023 0.0074 0.0023J
<0.0050 <0.0050 0.0018J0.00015J NR 0.00017J 0% 0.230.0021 0.0023 0.0019 0% 0.01
0.000033J 0.000019J <0.00010 0% 0.020.000039J 0.000039J 0.000066J 0% 0.00
0.0014 0.00099 0.0013 0% 0.060.0099J 0.039 0.0080J
<0.00020 <0.00020 <0.00020 0% 0.000.15 0.37 0.08
<0.000050 <0.000050 0.0000080J0.0084 0.0069 0.0055 0% 0.000.0033 0.0021 0.0013
<0.00020 <0.00020 <0.000200.02 0.0068 0.0011J 0% 0.03
2014-2015
No
Sam
ples
Col
lect
ed
Frequency Above
Benchmarks
Mean Ratio to Benchmarks

Wet Weather Historical Monitoring Tables for SDC-MLS
Permit Requirement Benchmark ReferencesWater Quality
BenchmarksUnitsAnalyte
Acid Extractable Compounds2013 Pentachlorophenol µg/L (d) 16. 40 CFR 131.38Organophosphorus Pesticides2013 Azinphos methyl (Guthion) µg/L NA2013 Bolstar µg/L NA
2007, 2013 Chlorpyrifos µg/L 0.02 acute / 0.014 chronic 12. CA Dept. of Fish & Game, 2000
2013 Coumaphos µg/L NA2013 Demeton-o µg/L NA2013 Demeton-s µg/L NA
2007, 2013 Diazinon µg/L 0.08 acute / 0.05 chronic
12. CA Dept. of Fish & Game, 2000, 11. Chollas Creek TMDL for Diazinon, 10. USEPA, Aquatic Life Ambient
Water Quality Criteria Diazinon2013 Dichlorvos µg/L NA2013 Dimethoate µg/L NA2013 Disulfoton µg/L NA2013 Ethoprop µg/L NA2013 Ethyl parathion µg/L NA2013 Fensulfothion µg/L NA2013 Fenthion µg/L NA2007, 2013 Malathion µg/L 0.43 13. CA Dept. of Fish & Game, 1998, 5. Goldbook2013 Merphos µg/L NA2013 Methyl parathion µg/L NA2013 Mevinphos µg/L NA2013 Naled µg/L NA2013 Phorate µg/L NA2013 Ronnel µg/L NA2013 Stirophos µg/L NA2013 Tokuthion (Prothiofos) µg/L NA2013 Trichloronate µg/L NAPyrethroids2007, 2013 Allethrin µg/L NA2007, 2013 Bifenthrin µg/L 0.0093 15. Anderson et al., 20062007, 2013 Cyfluthrin µg/L 0.344 17. Wheelock et al., 20042007, 2013 L-Cyhalothrin µg/L 0.20 17. Wheelock et al., 20042007, 2013 Cypermethrin µg/L 0.683 17. Wheelock et al., 20042007, 2013 Danitol (Fenpropathrin) µg/L NA2007, 2013 Deltamethrin/Tralomethrin£ µg/L NA2007, 2013 Esfenvalerate µg/L 0.25 17. Wheelock et al., 20042007, 2013 Fenvalerate µg/L NA2007, 2013 Fluvalinate µg/L NA2007, 2013 Permethrin µg/L 0.021 15. Anderson et al., 20062007, 2013 Prallethrin µg/L NA2007, 2013 Resmethrin µg/L NAToxicity2007, 2013 Ceriodaphnia 96-hr LC50 (%) >1002007, 2013 Ceriodaphnia 7-day survival NOEC (%) 1002007, 2013 Ceriodaphnia 7-day reproduction NOEC (%) 1002007 Hyalella 96-hr LC50 (%) >1002007, 2013 Selenastrum 96-hr NOEC (%) 1002013 Strongylocentrotus 96-hr TST Pass/FailSee last page for footnotes and source references.
Long Term and
Transitional Monitoring
Long Term and
Transitional Monitoring
Long Term Monitoring
Only
Long Term and
Transitional Monitoring
2013-2014
- 11/22/14 12/02/14-12/04/14
03/01/15-03/02/15
2014-2015
Frequency Above
Benchmarks
Mean Ratio to Benchmarks
<1.0 <1.0 AE 0% NA1
<0.010 <0.010 <0.010<0.010 <0.010 <0.010
<0.010 <0.010 <0.010 0% 0.22
<0.010 <0.010 <0.010<0.010 <0.010 <0.010BS-L<0.010 <0.010 <0.010
<0.010 <0.010 <0.010 0% 0.10
<0.010 <0.010 <0.010<0.010 <0.010 <0.010<0.010 <0.010 <0.010<0.010 <0.010 <0.010<0.010 <0.010 <0.010<0.010 <0.010 <0.010<0.010 <0.010 <0.010<0.010 <0.010 0.0085J 0% 0.03<0.010 <0.010 <0.010<0.010 <0.010 <0.010<0.010 <0.010 <0.010<0.010 <0.010 <0.010<0.010 <0.010 <0.010<0.010 <0.010 <0.010<0.010 <0.010 0.0032J<0.010 <0.010 <0.010<0.010 <0.010 <0.010
<0.002 <0.002 <0.002<0.002 <0.002 <0.002 10% 0.45<0.002 <0.002 <0.002 0% 0.00<0.002 <0.002 <0.002 0% 0.04<0.002 <0.002 <0.002 0% 0.00<0.002 <0.002 <0.002<0.002 <0.002 <0.002<0.002 <0.002 <0.002 0% 0.01<0.002 <0.002 <0.002<0.002 <0.002 <0.002<0.01 <0.01 <0.01 0% 0.30
<0.002 <0.002 <0.002<0.01 <0.01 <0.01
>100 NR >100 4% 1.16100 NR 100 7% 1.3050 NR 100 41% 2.96
>100 NR >100 0% 1.0050 NR 100 26% 1.78
Fail Pass Pass 33%
No
Sam
ples
Col
lect
ed

Wet Weather Historical Monitoring Tables for SDC-MLSBlank spaces have been verified and no data is available.
NA indicate no criteria or published value was available or applicable to the matrix or program.(a) Water Quality Benchmark are based on the San Diego Regional Water Quality Control Plan by watershed for the San Diego Region (Basin Plan), 1994 (with amendments effective on or before April 4, 2011) and may vary by hydrologic area.
(c) Water Quality Benchmark for dissolved metal fractions are based on total hardness and are calculated as described by the USEPA Federal Register Doc. 40 CFR Part 131, May 18, 2000. The Criteria Maximum Concentration (CMC) was used.(d) Water Quality Benchmark is based on pH and is calculated as described by the USEPA Federal Register Doc. 40 CFR Part 131, May 18, 2000. * Indicates detection limit above water quality benchmark.£ Historical results for Deltamethrin/Tralomethrin contain results reported by lab as Deltamethrin.†† Permethrin was non-detect at the method detection limit of 0.005 µg/L. AE-Analysis error.BS-L - Blank Spike recovery of this analyte was below the control limits. Results may be biased low.J-Analyte was detected at a concentration below the reporting limit and above the method detection limit. Reported value is estimated.NA1 Three or more years of data required to calculate the Mean Ratio to Benchmark.NR-Sampling of this analyte not required for transitional monitoring (RWQCB Order No. R9-2007-0001) and/or for long term monitoring (RWQCB Order No. R9-2013-0001).
SourcesPlease refer to the San Diego County Copermittee Regional Monitoring Program Benchmark Sources in Attachment B to Appendix A for benchmark source citations.
(b) Prior to the 2014-2015 monitoring year, Water Quality Benchmark was calculated based on CMC (salmonids absent) using pH described in the U.S. EPA, 1999 Update of Ambient Water Quality Criteria for Ammonia, EPA-822-R-99-014, December 1999. For 2014-2015 monitoring year, Water Quality Benchmark CMC was calculated based on pH and water temperature (when applicable) as described in the U.S. EPA, 2013 Aquatic Life Ambient Water Quality Criteria for Ammonia - Freshwater, EPA-822-R-13-001, April 2013.
Values with red bold font and shading do not meet Water Quality Benchmarks.

Wet Weather Historical Monitoring Table for SLR-TWAS-1
2008-2009 2009-2010 2011-2012 2013-2014
11/30/07 02/03/08-02/04/08 - - 10/19/10-
10/20/1002/16/11-02/17/11 - 10/11/12-
10/12/1202/08/13-02/09/13 - 11/21/14 03/01/15-
03/02/15Physical Chemistry2007, 2013 pH pH units 6.5-9.0 1. Basin Plan 7.72 8.05 7.07 7.77 7.45 7.67 6.95 7.79 0% 0.232007, 2013 Specific Conductivity µmhos/cm NA 1,945 1,467 1,553 2,140 1,911 2,417 3,022 1,8252007, 2013 Water Temperature Celsius NA 14.20 12.10 18.10 13.90 17.7 11.87 15.52 13.562007, 2013 Turbidity NTU 20 1. Basin Plan 239 492 28 3.6 15 4.5 16.5 4.6 38% 5.02Bacteriological2007, 2013 Enterococcus MPN/100 mL NA 11,000 3,000 80,000 3,000 130,000 300 17 50,0002007, 2013 Fecal Coliform MPN/100 mL 400 1. Basin Plan REC-1/REC-2 30,000 1,700 50,000 500 500,000 500 23 240,000 88% 257.102007, 2013 Total Coliform MPN/100 mL NA 220,000 50,000 220,000 8,000 1,100,000 2,200 23 900,000Nutrients2007, 2013 Ammonia as N mg/L (a) 6. U.S. EPA Water Quality Criteria (Freshwater) 0.56 0.22 0.16 0.13 0.17 0.14 <0.10 <0.10 0% 0.012007, 2013 Nitrate as N mg/L 10 1. Basin Plan 3 3.6 1.7 3.4 2.5 1.5 <0.10 1.2 0% 0.212007, 2013 Nitrite as N mg/L 1 1. Basin Plan 0.07 0.09 0.14 0.04J 0.19 0.013J <0.10 0.023J 0% 0.082007, 2013 Total Kjeldahl Nitrogen mg/L NA 4.2 2 1.8 0.74 1.4 0.73 0.34 0.552007 Dissolved Phosphorus mg/L 2 4. MSGP 2015 1.1 0.24 0.44 0.12 0.41 0.14 0.024 0.16 0% 0.162007, 2013 Total Phosphorus mg/L 2 4. MSGP 2015 1.3 0.97 1.1 0.17 0.68 0.21 0.091 0.29 0% 0.30General Chemistry2007 Biochemical Oxygen Demand mg/L 30 4. MSGP 2000, 8. McNeeley (1979) 13 <2 7.5 1.5J 13 1.1J <2.0 <2.0 0% 0.162007 Chemical Oxygen Demand mg/L 120 4. MSGP 2015 57 34 54 17 39 16 17 17 0% 0.262007, 2013 Dissolved Organic Carbon mg/L NA 17.9 8.2 9.1 5.2 12 5 5.7 6.12007, 2013 Total Organic Carbon mg/L NA 18.2 8 8.7 5.1 12 4.9 5.9 6.52007 Oil and Grease mg/L 10 1. Basin Plan, 3. Anacostia River TMDL, 4. MSGP 2015 1.5J <5 <5 4.9J <5 <5 <5.0 6.2 0% 0.312007, 2013 Surfactants (MBAS) mg/L 0.5 1. Basin Plan 0.039 0.048 <0.05 0.036J 0.066 0.03J 0.038J 0.054 0% 0.082007, 2013 Total Dissolved Solids mg/L 500 (b) 1. Basin Plan 1,330 884 1,400 1,400 1,400 1,700 2,200 1,400 100% 2.932007, 2013 Total Suspended Solids mg/L 100 4. MSGP 2015, 1. Basin Plan 235 456 200 16 49 16 5 8 38% 1.232007, 2013 Hardness mg CaCO3/L NA 295.1 223 680 730 745 836 1160 766Total Metals2007 Antimony mg/L NA 0.0003J 0.0002J 0.00036J 0.00012J 0.00044J 0.00012J 0.000075J 0.00023J2007, 2013 Arsenic mg/L NA 0.0021 0.0029 0.0023 0.0011 0.0018 0.00097 0.0013 0.00122007, 2013 Cadmium mg/L NA <0.0004 0.0003J 0.00011 0.000048J 0.00006J 0.000046J 0.000083J 0.000062J2007, 2013 Chromium mg/L NA 0.0027 0.0027 0.0086 0.0003 0.00086 0.00041 0.000093J 0.000312007, 2013 Copper mg/L NA 0.0117 0.0176 0.021 0.0024 0.0048 0.0021 0.002 0.00212007, 2013 Lead mg/L NA 0.0045 0.0090 0.0041 0.0002 0.00073 0.00019J 0.000045J 0.00012J2007, 2013 Nickel mg/L NA 0.0029 0.0039 0.0069 0.0035 0.0023 0.0053 0.0072 0.00562007, 2013 Selenium mg/L 0.005 16. 40 CFR 131.38 0.0005 0.0006 0.00062 0.00085 0.00047 0.0009 0.003 0.0012 0% 0.202007, 2013 Zinc mg/L NA 0.0581 0.0435 0.043 0.0022J 0.011 0.003J 0.01 0.0046JDissolved Metals2007 Antimony mg/L 0.006 1. Basin Plan 0.0003J 0.0002J 0.00034J 0.00012J 0.00041J 0.00012J 0.000074J 0.00019J 0% 0.042007, 2013 Arsenic mg/L 0.34 16. 40 CFR 131.38 0.0015 0.0015 0.0013 0.00088 0.0014 0.00078 0.0011 0.001 0% 0.002007, 2013 Cadmium mg/L (c) 16. 40 CFR 131.38 <0.0004 <0.0004 0.000037J 0.000039J 0.00004J 0.000048J 0.000076J 0.000047J 0% 0.012007, 2013 Chromium mg/L (c) 16. 40 CFR 131.38 0.0002J 0.0001J 0.00011J 0.000092J 0.00009J 0.00008J 0.000054J 0.000071J 0% 0.002007, 2013 Copper mg/L (c) 16. 40 CFR 131.38 0.0040 0.0024 0.0038 0.0017 0.0031 0.0013 0.0015 0.0016 0% 0.062007, 2013 Lead mg/L (c) 16. 40 CFR 131.38 0.00005J <0.0001 <0.0002 <0.0002 0.00008J 0.000016J 0.000030J <0.00020 0% 0.002007, 2013 Nickel mg/L (c) 16. 40 CFR 131.38 0.0014 0.0008 0.0029 0.0032 0.0019 0.0052 0.007 0.0046 0% 0.002007, 2013 Selenium mg/L NA 0.0005 0.0006 0.00039J 0.00086 0.00038J 0.00081 0.0031 0.0012007, 2013 Zinc mg/L (c) 16. 40 CFR 131.38 0.0075 0.0013 0.0043J 0.002J 0.0067 0.0028J 0.0069 0.0034J 0% 0.01Organophosphorus Pesticides
2007, 2013 Chlorpyrifos µg/L 0.02 acute / 0.014 chronic 12. CA Dept. of Fish & Game, 2000 0.0623 <0.002 <0.01 <0.01 <0.01 <0.01 <0.010 <0.010 13% 0.58
2007, 2013 Diazinon µg/L 0.08 acute / 0.05 chronic
12. CA Dept. of Fish & Game, 2000, 11. Chollas Creek TMDL for Diazinon, 10. USEPA, Aquatic Life Ambient
Water Quality Criteria Diazinon0.013 <0.004 <0.01 <0.01 <0.01 <0.01 <0.010 <0.010 0% 0.07
2007, 2013 Malathion µg/L 0.43 13. CA Dept. of Fish & Game, 1998, 5. Goldbook <0.006 <0.006 0.013 <0.01 <0.01 <0.01 <0.010 <0.010 0% 0.01Pyrethroids2007, 2013 Allethrin µg/L NA <0.002 <0.002 <0.005 <0.002 <0.002 <0.002 <0.002 <0.0022007, 2013 Bifenthrin µg/L 0.0093 15. Anderson et al., 2006 0.0197 0.0153 <0.005 <0.002 <0.002 <0.002 <0.002 <0.002 25% 0.572007, 2013 Cyfluthrin µg/L 0.344 17. Wheelock et al., 2004 0.009 <0.002 <0.005 <0.002 <0.002 <0.002 <0.002 <0.002 0% 0.012007, 2013 Cyhalothrin, Total Lambda µg/L 0.20 17. Wheelock et al., 2004 <0.002 <0.002 <0.005 <0.002 <0.002 <0.002 <0.002 <0.002 0% 0.062007, 2013 Cypermethrin µg/L 0.683 17. Wheelock et al., 2004 <0.002 <0.002 <0.005 <0.002 <0.002 <0.002 <0.002 <0.002 0% 0.002007, 2013 Danitol (Fenpropathrin) µg/L NA 0.002J <0.002 <0.002 <0.002 <0.002 <0.002 <0.0022007, 2013 Deltamethrin/Tralomethrin£ µg/L NA <0.002 <0.002 <0.005 <0.002 <0.002 <0.002 <0.002 <0.0022007, 2013 Esfenvalerate µg/L 0.25 17. Wheelock et al., 2004 <0.002 <0.002 <0.005 <0.002 <0.002 <0.002 <0.002 <0.002 0% 0.002007, 2013 Fluvalinate µg/L NA <0.002 <0.002 <0.005 <0.002 <0.002 <0.002 <0.002 <0.0022007, 2013 Permethrin µg/L 0.021 15. Anderson et al., 2006 <0.002 <0.002 <0.002 <0.002 <0.002 <0.002 <0.0022007, 2013 Permethrin µg/L 0.021 15. Anderson et al., 2006 <0.03* <0.03* <0.005 <0.025* <0.025†† <0.01 <0.01 <0.01 0% 0.372007, 2013 Prallethrin µg/L NA <0.002 <0.002 <0.005 <0.002 <0.002 <0.002 <0.002 <0.0022007, 2013 Resmethrin µg/L NA <0.025 <0.025 <0.01 <0.01 <0.01Toxicity2007, 2013 Ceriodaphnia 96-hr LC50 (%) >100 >100 >100 >100 >100 >100 >100 >100 >100 0% 1.002007, 2013 Ceriodaphnia 7-day survival NOEC (%) 100 100 100 100 100 100 100 100 100 0% 1.002007, 2013 Ceriodaphnia 7-day reproduction NOEC (%) 100 100 25 100 50 100 100 50 100 38% 1.632007 Hyalella 96-hr LC50 (%) >100 >100 >100 >100 >100 >100 >100 >100 >100 0% 1.002007, 2013 Selenastrum 96-hr NOEC (%) 100 100 100 100 100 100 100 50 50 25% 1.25See last page for footnotes and source references.
Mean Ratio to Benchmarks2010-2011Permit
Requirement Analyte 2007-2008 2012-2013
Transitional Monitoring
Units Water Quality Benchmarks
Historical Monitoring Data
Benchmark ReferencesFrequency
Above Benchmarks
2014-2015
No
Sam
ples
Col
lect
ed
No
Sam
ples
Col
lect
ed
No
Sam
ples
Col
lect
ed
No
Sam
ples
Col
lect
ed

Wet Weather Historical Monitoring Table for SLR-TWAS-1
Blank spaces have been verified and no data is available.
NA indicate no criteria or published value was available or applicable to the matrix or program.
(b) Water Quality Benchmark is based on the San Diego Regional Water Quality Control Plan by watershed for the San Diego Region (Basin Plan), 1994 (with amendments effective on or before April 4, 2011) and may vary by hydrologic area.(c) Water Quality Benchmark for dissolved metal fractions are based on total hardness and are calculated as described by the USEPA Federal Register Doc. 40 CFR Part 131, May 18, 2000. The Criteria Maximum Concentration (CMC) was used.* Indicates detection limit above water quality benchmark.£ Historical results for Deltamethrin/Tralomethrin contain results reported by lab as Deltamethrin.†† Permethrin was non-detect at the method detection limit of 0.005 µg/L. J-Analyte was detected at a concentration below the reporting limit and above the method detection limit. Reported value is estimated.
SourcesPlease refer to the San Diego County Copermittee Regional Monitoring Program Benchmark Sources in Attachment B to Appendix A for benchmark source citations.
(a) Prior to the 2014-2015 monitoring year, Water Quality Benchmark was calculated based on CMC (salmonids absent) using pH described in the U.S. EPA, 1999 Update of Ambient Water Quality Criteria for Ammonia, EPA-822-R-99-014, December 1999. For 2014-2015 monitoring year, Water Quality Benchmark CMC was calculated based on pH and water temperature (when applicable) as described in the U.S. EPA, 2013 Aquatic Life Ambient Water Quality Criteria for Ammonia - Freshwater, EPA-822-R-13-001, April 2013.
Values with red bold font and shading do not meet Water Quality Benchmarks.

Wet Weather Historical Monitoring Table for SLR-TWAS-2
2011-2012 2013-2014 2014-2015
10/19/10-10/20/10
02/17/11-02/18/11 - 01/26/13 02/09/13 - -
Physical Chemistry2007, 2013 pH pH units 6.5-9.0 1. Basin Plan 7.78 7.85 7.68 8.02 0% NA1
2007, 2013 Specific Conductivity µmhos/cm NA 730 2,171 1,670 1,9622007, 2013 Water Temperature Celsius NA 16.10 12.36 16.8 12.92007, 2013 Turbidity NTU 20 1. Basin Plan 1,800 3.8 4.6 5.4 25% NA1
Bacteriological2007, 2013 Enterococcus MPN/100 mL NA 300,000 800 22,000 2302007, 2013 Fecal Coliform MPN/100 mL 400 1. Basin Plan REC-1/REC-2 80,000 300 9,000 130 50% NA1
2007, 2013 Total Coliform MPN/100 mL NA 500,000 2,200 110,000 2,300Nutrients2007, 2013 Ammonia as N mg/L (a) 6. U.S. EPA Water Quality Criteria (Freshwater) 0.54 0.12 0.063J 0.17 0% NA1
2007, 2013 Nitrate as N mg/L 10 1. Basin Plan 6.7 4.7 5.4 4.7 0% NA1
2007, 2013 Nitrite as N mg/L 1 1. Basin Plan 0.27 0.052J <0.15 0.051J 0% NA1
2007, 2013 Total Kjeldahl Nitrogen mg/L NA 6.3 0.55 0.57 0.542007 Dissolved Phosphorus mg/L 2 4. MSGP 2015 1.3 0.15 0.14 0.12 0% NA1
2007, 2013 Total Phosphorus mg/L 2 4. MSGP 2015 4 0.16 0.18 0.12 25% NA1
General Chemistry2007 Biochemical Oxygen Demand mg/L 30 4. MSGP 2015, 8. McNeeley (1979) 7.7 0.7J 1.9J 1.7J 0% NA1
2007 Chemical Oxygen Demand mg/L 120 4. MSGP 2015 120 16 17 19 0% NA1
2007, 2013 Dissolved Organic Carbon mg/L NA 13 5.1 5.5 5.32007, 2013 Total Organic Carbon mg/L NA 13 4.8 5.9 5.22007 Oil and Grease mg/L 10 1. Basin Plan, 3. Anacostia River TMDL, 4. MSGP 2015 <5 <5 1.6J <5 0% NA1
2007, 2013 Surfactants (MBAS) mg/L 0.5 1. Basin Plan <0.05 0.042J 0.04J 0.024J 0% NA1
2007, 2013 Total Dissolved Solids mg/L 500 (b) 1. Basin Plan 660 1,400 1,700 1,800 100% NA1
2007, 2013 Total Suspended Solids mg/L 100 4. MSGP 2015, 1. Basin Plan 1,500 9 20 5 25% NA1
2007, 2013 Hardness mg CaCO3/L NA 310 760 863 896Total Metals2007 Antimony mg/L NA 0.00027J 0.00011J 0.00011J 0.00007J2007, 2013 Arsenic mg/L NA 0.0046 0.0011 0.001 0.000942007, 2013 Cadmium mg/L NA 0.00015 0.000037J 0.00005J 0.00004J2007, 2013 Chromium mg/L NA 0.018 0.00032 0.00044 0.000282007, 2013 Copper mg/L NA 0.025 0.002 0.0018 0.00172007, 2013 Lead mg/L NA 0.0049 0.00012J 0.00014J 0.00011J2007, 2013 Nickel mg/L NA 0.011 0.0037 0.0016 0.00142007, 2013 Selenium mg/L 0.005 16. 40 CFR 131.38 0.0017 0.00074 0.00066 0.00066 0% NA1
2007, 2013 Zinc mg/L NA 0.052 0.0018J 0.012 0.0066Dissolved Metals2007 Antimony mg/L 0.006 1. Basin Plan 0.00036J 0.00011J 0.00011J 0.00007J 0% NA1
2007, 2013 Arsenic mg/L 0.34 16. 40 CFR 131.38 0.0031 0.00099 0.00092 0.00091 0% NA1
2007, 2013 Cadmium mg/L (c) 16. 40 CFR 131.38 0.000058J 0.000036J 0.00004J 0.00003J 0% NA1
2007, 2013 Chromium mg/L (c) 16. 40 CFR 131.38 0.00038 0.0001J <0.0002 0.00014J 0% NA1
2007, 2013 Copper mg/L (c) 16. 40 CFR 131.38 0.007 0.0017 0.0014 0.0011 0% NA1
2007, 2013 Lead mg/L (c) 16. 40 CFR 131.38 0.000025J <0.0002 0.00004J 0.00005J 0% NA1
2007, 2013 Nickel mg/L (c) 16. 40 CFR 131.38 0.0032 0.0037 0.0014 0.0013 0% NA1
2007, 2013 Selenium mg/L NA 0.0016 0.00072 0.00065 0.000662007, 2013 Zinc mg/L (c) 16. 40 CFR 131.38 0.0058 0.0017J 0.01 0.0048J 0% NA1
Organophosphorus Pesticides
2007, 2013 Chlorpyrifos µg/L 0.02 acute / 0.014 chronic 12. CA Dept. of Fish & Game, 2000 <0.01 <0.01 <0.01 <0.01 0% NA1
2007, 2013 Diazinon µg/L 0.08 acute / 0.05 chronic
12. CA Dept. of Fish & Game, 2000, 11. Chollas Creek TMDL for Diazinon, 10. USEPA, Aquatic Life Ambient
Water Quality Criteria Diazinon0.14 <0.01 <0.01 <0.01 25% NA1
2007, 2013 Malathion µg/L 0.43 13. CA Dept. of Fish & Game, 1998, 5. Goldbook 0.56 <0.01 <0.01 <0.01 25% NA1
Pyrethroids2007, 2013 Allethrin µg/L NA <0.005 <0.002 <0.002 <0.0022007, 2013 Bifenthrin µg/L 0.0093 15. Anderson et al., 2006 <0.005 <0.002 0.0142 <0.002 25% NA1
2007, 2013 Cyfluthrin µg/L 0.344 17. Wheelock et al., 2004 <0.005 <0.002 <0.002 <0.002 0% NA1
2007, 2013 Cyhalothrin, Total Lambda µg/L 0.20 17. Wheelock et al., 2004 <0.005 <0.002 <0.002 <0.002 0% NA1
2007, 2013 Cypermethrin µg/L 0.683 17. Wheelock et al., 2004 <0.005 <0.002 <0.002 <0.002 0% NA1
2007, 2013 Danitol (Fenpropathrin) µg/L NA <0.002 0.0114 <0.0022007, 2013 Deltamethrin/Tralomethrin£ µg/L NA <0.005 <0.002 <0.002 <0.0022007, 2013 Esfenvalerate µg/L 0.25 17. Wheelock et al., 2004 <0.005 <0.002 <0.002 <0.002 0% NA1
2007, 2013 Fenvalerate µg/L NA <0.005 <0.002 <0.002 <0.0022007, 2013 Fluvalinate µg/L NA <0.002 <0.002 <0.0022007, 2013 Permethrin µg/L 0.021 15. Anderson et al., 2006 <0.005 <0.025* <0.01 <0.01 0% NA1
2007, 2013 Prallethrin µg/L NA <0.005 <0.002 <0.002 <0.0022007, 2013 Resmethrin µg/L NA <0.01 <0.01Toxicity2007, 2013 Ceriodaphnia 96-hr LC50 (%) >100 32.99 >100 >100 >100 25% NA1
2007, 2013 Ceriodaphnia 7-day survival NOEC (%) 100 12.50 100 100 100 25% NA1
2007, 2013 Ceriodaphnia 7-day reproduction NOEC (%) 100 <6.25 100 100 100 25% NA1
2007 Hyalella 96-hr LC50 (%) >100 6.83 >100 >100 >100 25% NA1
2007, 2013 Selenastrum 96-hr NOEC (%) 100 100 100 100 100 0% NA1
See last page for footnotes and source references.
Mean Ratio to Benchmarks
Transitional Monitoring
Permit Requirement Analyte Units Water Quality
Benchmarks Benchmark References
Historical Monitoring Data
2010-2011 2012-2013
No
Sam
ples
Col
lect
ed
No
Sam
ples
Col
lect
ed
No
Sam
ples
Col
lect
ed
Frequency Above
Benchmarks
Wet Weather Historical Monitoring Table for SLR-TWAS-2
Blank spaces have been verified and no data is available.
NA indicate no criteria or published value was available or applicable to the matrix or program.
(b) Water Quality Benchmark is based on the San Diego Regional Water Quality Control Plan by watershed for the San Diego Region (Basin Plan), 1994 (with amendments effective on or before April 4, 2011) and may vary by hydrologic area.(c) Water Quality Benchmark for dissolved metal fractions are based on total hardness and are calculated as described by the USEPA Federal Register Doc. 40 CFR Part 131, May 18, 2000. The Criteria Maximum Concentration (CMC) was used.* Indicates detection limit above water quality benchmark.£ Historical results for Deltamethrin/Tralomethrin contain results reported by lab as Deltamethrin.J-Analyte was detected at a concentration below the reporting limit and above the method detection limit. Reported value is estimated.NA1 Three or more years of data required to calculate the Mean Ratio to Benchmark.
SourcesPlease refer to the San Diego County Copermittee Regional Monitoring Program Benchmark Sources in Attachment B to Appendix A for benchmark source citations.
(a) Prior to the 2014-2015 monitoring year, Water Quality Benchmark was calculated based on CMC (salmonids absent) using pH described in the U.S. EPA, 1999 Update of Ambient Water Quality Criteria for Ammonia, EPA-822-R-99-014, December 1999. For 2014-2015 monitoring year, Water Quality Benchmark CMC was calculated based on pH and water temperature (when applicable) as described in the U.S. EPA, 2013 Aquatic Life Ambient Water Quality Criteria for Ammonia - Freshwater, EPA-822-R-13-001, April 2013.
Values with red bold font and shading do not meet Water Quality Benchmarks.

Wet Weather Historical Monitoring Table for SLR-MLS
11/29/01 02/17/02 03/17/02 11/08/02 02/11/03 02/25/03 11/12/03 02/02/04 02/18/04 10/27/04 02/11/05 02/18/05 10/17/05 12/31/05 02/19/06 10/14/06 01/31/07 02/19/07
2007, 2013 pH pH units 6.5-9.0 1. Basin Plan 7.50 7.50 7.60 6.40 7.32 7.67 7.44 7.94 8.20 7.20 8.06 7.30 8.42 6.97 7.35 8.02 7.352007, 2013 Specific Conductivity µmhos/cm NA 2,370 2,310 2,450 4,190 1,965 2,680 2,860 2,780 2,810 927 2,790 1,865 2,580 2,990 2,300 2,650 2,530 2,4502007, 2013 Water Temperature Celsius 19.70 11.70 13.30 15.80 10.70 13.50 14.30 15.10 14.50 17.00 13.00 11.00 15.50 12.50 14.302007, 2013 Turbidity NTU 20 1. Basin Plan 5.7 2.14 2.1 6.96 3.3 185 2.98 4.49 1.23 136 11.9 31.3 11.4 15.6 13.1 21.4 4.8 4.78Bacteriological 2007, 2013 Enterococcus MPN/100 mL NA 800 80 900 500 800 16,000 1,300 700 130 80,000 5,000 13,000 800 3,000 1,300 35,000 6,000 2,2002007, 2013 Fecal Coliform MPN/100 mL 400 1.Basin Plan REC-1/REC-2 300 50 300 230 130 500 230 500 130 50,000 1,700 8,000 8,000 3,000 1,300 3,000 500 9002007, 2013 Total Coliform MPN/100 mL NA 2,300 130 300 300 300 1,700 2,800 1,300 230 170,000 11,000 11,000 17,000 3,000 11,000 170,000 5,000 2,200
2007, 2013 Ammonia as N mg/L (a) 6. USEPA Water Quality Criteria (Freshwater) 0.5 <0.1 <0.1 <0.1 <0.1 <0.1 <0.1 <0.1 <0.1 <0.1 <0.1 <0.1 0.33 0.19 0.16 0.64 0.31 0.222007, 2013 Nitrate as N mg/L 10 1. Basin Plan 0.9 0.6 0.5 0.72 1.10 0.65 0.8 0.94 1.64 0.58 5.99 5.18 3.7 3.78 4.36 1.72 <0.05 2.52007, 2013 Nitrite as N mg/L 1 1. Basin Plan <0.05 <0.05 <0.05 <0.05 <0.05 <0.05 <0.05 <0.05 <0.05 <0.05 <0.05 <0.05 <0.05 <0.05 <0.05 0.05 <0.05 <0.052007, 2013 Total Kjeldahl Nitrogen mg/L NA 2.2 1.3 1.2 <0.5 0.8 0.7 3.2 <0.5 0.8 2.4 1.7 2 1.5 0.8 2.2 3.8 1.9 1.22007 Dissolved Phosphorus mg/L 2 4. MSGP 2015 0.16 <0.05 0.16 0.22 0.19 0.10 0.33 0.08 0.11 0.46 0.36 <0.05 0.81 0.31 0.36 <0.05 0.21 0.112007, 2013 Total Phosphorus mg/L 2 4. MSGP 2015 1.12 0.4 0.2 0.29 0.23 0.22 0.29 0.13 0.13 0.58 0.84 0.57 0.87 0.32 0.58 0.68 0.37 0.22
2007 Biochemical Oxygen Demand mg/L 30 4. MSGP 2015, 8. McNeeley (1979) 2.3 2 2.9 <2.0 3.34 2.02 <2 33 2.05 4.09 2.61 <2 3.49 <2 <2 5.56 35.7 7.782007 Chemical Oxygen Demand mg/L 120 4. MSGP 2015 <25 61 48 38 49 25 33 <25 <25 32 58 40 45 <25 30 67 44 282007, 2013 Dissolved Organic Carbon mg/L NA 1.49 6.86 9.36 9.3 2.8 80.1 37.9 5.81 4.27 5.96 3.59 7.44 78.2 13.3 8.082007, 2013 Total Organic Carbon mg/L NA 5.61 11.10 4.93 7.24 6.56 76.2 51.3 7.8 10.2 20 5.62 8.43 78.2 13.8 8.292007 Oil and Grease mg/L 10 1. Basin Plan, 3. Anacostia River TMDL, 4. MSGP 2015 <1 <1 <1 <1 <1 <1 <1 <1 <1 <1 <1 <1 <1 <1 <1 <5 <5 52007, 2013 Surfactants (MBAS) mg/L 0.5 1. Basin Plan <0.5 <0.5 <0.5 <0.1 <0.1 <0.1 <0.5 <0.5 <0.5 <0.5 <0.5 <0.5 <0.5 <0.5 <0.5 <0.5 <0.5 <0.52007, 2013 Total Dissolved Solids mg/L 500 (b) 1. Basin Plan 1,480 1,340 1,420 1,730 1,500 818 1,840 1,530 2,410 652 1,280 1,100 1,240 1,500 1,450 1,380 1,280 1,4602007, 2013 Total Suspended Solids mg/L 100 4. MSGP 2015, 1. Basin Plan <20 <20 <20 14 8 152 <20 <20 <20 165 30 78 47 27 <20 29 <20 <202007, 2013 Total Hardness mg CaCO3/L NA 737 821 818 779 832 463 891 749 867 353 650 581 627 872 827 724 760 802
2007 Antimony mg/L NA <0.002 <0.002 <0.002 <0.002 0.002 0.003 <0.005 <0.005 <0.006 <0.005 <0.005 <0.005 <0.005 <0.005 <0.005 0.002 <0.002 0.0032007, 2013 Arsenic mg/L NA <0.001 0.002 0.001 0.001 0.001 0.003 0.003 0.004 0.003 0.002 0.003 <0.002 0.003 0.003 0.001 0.01 <0.001 0.0012007, 2013 Cadmium mg/L NA <0.001 <0.001 <0.001 <0.001 <0.001 <0.001 <0.001 <0.001 <0.001 <0.001 <0.001 <0.001 <0.001 <0.001 <0.001 0.002 <0.001 <0.0012007, 2013 Chromium mg/L NA <0.005 <0.005 <0.005 <0.005 0.001 0.007 <0.005 <0.005 <0.005 <0.005 <0.005 <0.005 <0.005 <0.005 <0.005 <0.005 <0.005 <0.0052007, 2013 Copper mg/L NA <0.005 <0.005 <0.005 0.002 0.014 0.009 <0.005 0.006 <0.005 0.011 0.005 0.005 0.009 <0.005 <0.005 0.006 0.006 0.0032007, 2013 Lead mg/L NA <0.002 <0.002 <0.002 0.004 0.002 <0.002 <0.002 <0.002 <0.002 <0.002 <0.002 <0.002 <0.002 <0.002 <0.002 0.002 0.001 <0.0012007, 2013 Nickel mg/L NA <0.002 <0.002 <0.002 0.00175 0.002 0.006 0.002 0.002 <0.002 0.011 0.002 0.002 0.003 0.002 0.002 0.003 <0.002 0.0022007, 2013 Selenium mg/L 0.005 16. 40 CFR 131.38 <0.002 0.005 <0.002 <0.004 <0.004 <0.004 <0.005 <0.005 <0.005 <0.005 <0.005 <0.005 <0.005 <0.004 <0.005 <0.004 <0.004 <0.0042007, 2013 Zinc mg/L NA <0.020 <0.020 <0.020 0.0102 0.006 0.022 <0.02 <0.02 <0.02 <0.02 <0.02 <0.02 <0.02 <0.02 <0.02 <0.02 0.022 <0.02
2007 Antimony mg/L 0.006 1. Basin Plan <0.002 <0.002 <0.002 <0.002 0.002 0.004 <0.005 <0.005 <0.006 <0.005 <0.005 <0.005 <0.005 <0.005 <0.005 <0.002 <0.002 0.0032007, 2013 Arsenic mg/L 0.34 16. 40 CFR 131.38 <0.001 <0.001 <0.001 0.001 0.002 0.001 <0.002 0.002 0.002 <0.002 <0.002 <0.002 <0.001 <0.001 <0.001 <0.001 <0.001 <0.0012007, 2013 Cadmium mg/L (c) 16. 40 CFR 131.38 <0.001 <0.001 <0.001 <0.001 0.0002 0.0002 <0.001 <0.001 <0.001 <0.001 <0.001 <0.001 <0.001 <0.001 <0.001 <0.001 <0.001 <0.0012007, 2013 Chromium mg/L (c) 16. 40 CFR 131.38 <0.005 <0.005 <0.005 <0.005 <0.005 <0.005 <0.005 <0.005 <0.005 <0.005 <0.005 <0.005 <0.005 <0.005 <0.005 <0.005 <0.005 <0.0052007, 2013 Copper mg/L (c) 16. 40 CFR 131.38 <0.005 <0.005 <0.005 <0.005 0.018 0.005 <0.005 <0.005 <0.005 <0.005 <0.005 <0.005 0.006 <0.005 <0.005 0.005 0.005 0.0022007, 2013 Lead mg/L (c) 16. 40 CFR 131.38 <0.002 <0.002 <0.002 <0.002 <0.002 <0.002 <0.002 <0.002 <0.002 <0.002 <0.002 <0.002 <0.002 <0.002 <0.002 <0.001 <0.001 <0.0012007, 2013 Nickel mg/L (c) 16. 40 CFR 131.38 <0.002 0.002 <0.002 0.002 0.003 <0.002 <0.002 0.003 <0.002 <0.002 0.002 0.002 0.003 0.002 <0.002 0.003 <0.002 0.0022007, 2013 Selenium mg/L NA <0.002 <0.002 <0.002 <0.004 <0.004 <0.004 <0.005 <0.005 <0.005 <0.005 <0.005 <0.005 <0.005 <0.004 <0.005 <0.004 <0.004 <0.0042007, 2013 Zinc mg/L (c) 16. 40 CFR 131.38 <0.020 <0.020 <0.020 0.001 0.070 0.024 <0.02 <0.02 <0.02 <0.02 <0.02 <0.02 <0.02 <0.02 <0.02 <0.02 <0.02 <0.02
2007, 2013 Chlorpyrifos µg/L 0.02 acute / 0.014 chronic 12. CA Dept. of Fish & Game, 2000 <0.03* <0.03* <0.03* <0.03* <0.03* <0.03* <0.01 <0.01 <0.01 <0.01 <0.01 <0.01 <0.01 <0.02 <0.02 <0.002 <0.002 <0.002
2007, 2013 Diazinon µg/L 0.08 acute / 0.05 chronic
12. CA Dept. of Fish & Game, 2000, 11. Chollas Creek TMDL for Diazinon, 10. USEPA, Aquatic Life Ambient
Water Quality Criteria Diazinon0.12 <0.03 <0.03 <0.03 <0.03 0.053 <0.01 <0.01 <0.01 <0.01 0.030 <0.01 <0.01 <0.02 <0.02 <0.004 <0.004 <0.004
2007, 2013 Malathion µg/L 0.43 13. CA Dept. of Fish & Game, 1998, 5. Goldbook <0.10 <0.10 <0.10 <0.01 0.021 <0.01 <0.01 <0.01 <0.01 0.117 <0.02 <0.02 0.183 0.042 <0.006
2007, 2013 Allethrin µg/L NA2007, 2013 Bifenthrin µg/L 0.0093 15. Anderson et al., 20062007, 2013 Cyfluthrin µg/L 0.344 17. Wheelock et al., 20042007, 2013 Cyhalothrin, Total Lambda µg/L 0.20 17. Wheelock et al., 20042007, 2013 Cypermethrin µg/L 0.683 17. Wheelock et al., 20042007, 2013 Danitol (Fenpropathrin) µg/L NA2007, 2013 Deltamethrin/Tralomethrin£ µg/L NA2007, 2013 Esfenvalerate µg/L 0.25 17. Wheelock et al., 20042007, 2013 Fenvalerate µg/L NA2007, 2013 Fluvalinate µg/L NA2007, 2013 Permethrin µg/L 0.021 15. Anderson et al., 20062007, 2013 Prallethrin µg/L NA2007, 2013 Resmethrin µg/L NA
2007, 2013 Ceriodaphnia 96-hr survival LC50 (%) >100 >100 >100 >100 >100 >100 >100 >100 >100 >100 >100 >100 >100 >100 >100 >100 >100 >100 >1002007, 2013 Ceriodaphnia 7-day survival NOEC (%) 100 100 100 100 100 100 100 100 100 100 100 100 100 100 100 100 100 100 1002007, 2013 Ceriodaphnia 7-day reproduction NOEC (%) 100 100 100 50 100 100 100 50 100 100 100 100 100 100 100 100 100 100 1002007 Hyalella 96-hr LC50 (%) >100 >100 >100 >100 >100 >100 >100 >100 >100 >100 >100 >100 >100 >100 >100 >100 >100 >100 >1002007, 2013 Selenastrum 96-hr NOEC (%) 100 100 100 100 100 100 100 100 100 50 100 100 100 100 100 100 100 100 100See last page for footnotes and source references.
Total Metals
2005-2006Analyte Units 2006-20072003-2004
Nutrients
Permit Requirement 2004-2005
Dissolved Metals
Organophosphorus Pesticides
Pyrethroids
Toxicity
Physical Chemistry
General Chemistry
Historical Monitoring Data
2001-2002 2002-2003Water Quality Benchmarks Benchmark References

Wet Weather Historical Monitoring Table for SLR-MLS
2007, 2013 pH pH units 6.5-9.0 1. Basin Plan2007, 2013 Specific Conductivity µmhos/cm NA2007, 2013 Water Temperature Celsius2007, 2013 Turbidity NTU 20 1. Basin PlanBacteriological 2007, 2013 Enterococcus MPN/100 mL NA2007, 2013 Fecal Coliform MPN/100 mL 400 1.Basin Plan REC-1/REC-2 2007, 2013 Total Coliform MPN/100 mL NA
2007, 2013 Ammonia as N mg/L (a) 6. USEPA Water Quality Criteria (Freshwater)2007, 2013 Nitrate as N mg/L 10 1. Basin Plan2007, 2013 Nitrite as N mg/L 1 1. Basin Plan2007, 2013 Total Kjeldahl Nitrogen mg/L NA2007 Dissolved Phosphorus mg/L 2 4. MSGP 20152007, 2013 Total Phosphorus mg/L 2 4. MSGP 2015
2007 Biochemical Oxygen Demand mg/L 30 4. MSGP 2015, 8. McNeeley (1979)2007 Chemical Oxygen Demand mg/L 120 4. MSGP 20152007, 2013 Dissolved Organic Carbon mg/L NA2007, 2013 Total Organic Carbon mg/L NA2007 Oil and Grease mg/L 10 1. Basin Plan, 3. Anacostia River TMDL, 4. MSGP 20152007, 2013 Surfactants (MBAS) mg/L 0.5 1. Basin Plan2007, 2013 Total Dissolved Solids mg/L 500 (b) 1. Basin Plan2007, 2013 Total Suspended Solids mg/L 100 4. MSGP 2015, 1. Basin Plan2007, 2013 Total Hardness mg CaCO3/L NA
2007 Antimony mg/L NA2007, 2013 Arsenic mg/L NA2007, 2013 Cadmium mg/L NA2007, 2013 Chromium mg/L NA2007, 2013 Copper mg/L NA2007, 2013 Lead mg/L NA2007, 2013 Nickel mg/L NA2007, 2013 Selenium mg/L 0.005 16. 40 CFR 131.382007, 2013 Zinc mg/L NA
2007 Antimony mg/L 0.006 1. Basin Plan2007, 2013 Arsenic mg/L 0.34 16. 40 CFR 131.382007, 2013 Cadmium mg/L (c) 16. 40 CFR 131.382007, 2013 Chromium mg/L (c) 16. 40 CFR 131.382007, 2013 Copper mg/L (c) 16. 40 CFR 131.382007, 2013 Lead mg/L (c) 16. 40 CFR 131.382007, 2013 Nickel mg/L (c) 16. 40 CFR 131.382007, 2013 Selenium mg/L NA2007, 2013 Zinc mg/L (c) 16. 40 CFR 131.38
2007, 2013 Chlorpyrifos µg/L 0.02 acute / 0.014 chronic 12. CA Dept. of Fish & Game, 2000
2007, 2013 Diazinon µg/L 0.08 acute / 0.05 chronic
12. CA Dept. of Fish & Game, 2000, 11. Chollas Creek TMDL for Diazinon, 10. USEPA, Aquatic Life Ambient
Water Quality Criteria Diazinon2007, 2013 Malathion µg/L 0.43 13. CA Dept. of Fish & Game, 1998, 5. Goldbook
2007, 2013 Allethrin µg/L NA2007, 2013 Bifenthrin µg/L 0.0093 15. Anderson et al., 20062007, 2013 Cyfluthrin µg/L 0.344 17. Wheelock et al., 20042007, 2013 Cyhalothrin, Total Lambda µg/L 0.20 17. Wheelock et al., 20042007, 2013 Cypermethrin µg/L 0.683 17. Wheelock et al., 20042007, 2013 Danitol (Fenpropathrin) µg/L NA2007, 2013 Deltamethrin/Tralomethrin£ µg/L NA2007, 2013 Esfenvalerate µg/L 0.25 17. Wheelock et al., 20042007, 2013 Fenvalerate µg/L NA2007, 2013 Fluvalinate µg/L NA2007, 2013 Permethrin µg/L 0.021 15. Anderson et al., 20062007, 2013 Prallethrin µg/L NA2007, 2013 Resmethrin µg/L NA
2007, 2013 Ceriodaphnia 96-hr survival LC50 (%) >1002007, 2013 Ceriodaphnia 7-day survival NOEC (%) 1002007, 2013 Ceriodaphnia 7-day reproduction NOEC (%) 1002007 Hyalella 96-hr LC50 (%) >1002007, 2013 Selenastrum 96-hr NOEC (%) 100See last page for footnotes and source references.
Total Metals
Analyte Units
Nutrients
Permit Requirement
Dissolved Metals
Organophosphorus Pesticides
Pyrethroids
Toxicity
Physical Chemistry
General Chemistry
Water Quality Benchmarks Benchmark References 2008-2009 2009-2010 2011-2012 2013-2014 2014-2015
11/30/07 02/03/08-02/05/08 12/16/08 - 10/19/10-
10/20/1002/17/11-02/18/11 - 02/09/13 02/20/13-
02/21/13 - -
7.57 8.38 7.55 9.20 7.63 7.66 7.51 8% 0.09496 1,759 755 1,050 2,342 265 2,710
14.80 11.80 12.10 14.10 11.97 11.4 12.427 136 17.5 7.6 3.3 1.5 1.7 24% 1.32
30,000 3,000 50,000 500,000 800 500 1,30017,000 1,700 13,000 500,000 3,000 70 5,000 68% 61.8528,000 50,000 110,000 500,000 5,000 22,000 23,000
0.16 0.18 0.05 0.14 0.12 0.068J <0.1 0% 0.020.7 3.27 1.17 0.64 3.1 0.94 0.93 0% 0.19
0.06 0.03J 0.04J 0.12 0.039J 0.026J <0.15 0% 0.031.4 1.8 1.4 1 0.78 0.72 0.53
0.76 0.35 0.5 0.7 0.14 0.13 0.061 0% 0.130.77 0.40 0.51 0.69 0.17 0.15 0.084 0% 0.22
8.5 <2 8 4.2 0.6J 2.4 2.3 8% 0.1955 27 71 36 26 24 24 0% 0.30
14.6 9.5 13.3 9.9 5.5 8.2 7.917.9 8.7 13.8 9.6 5.2 7.9 7.21.8J 1.9J <5 <5 <5 <5 <5 0% 0.130.21 0.057 0.138 0.049J 0.048J 0.042J 0.053 0% 0.36964 878 756 700 1,500 1,800 1,700 100% 2.7024 129 19.5 17 14 2 3 12% 0.34
151 242 251 290 760 884 820
0.0005 0.0002J 0.0006 0.00051 0.00012J 0.00022J 0.00017J0.0017 0.0024 0.002 0.0018 0.0012 0.0011 0.00096
<0.0004 <0.0004 <0.0004 0.000051J 0.000036J 0.00006J 0.00007J0.001 0.0016 0.0007 0.00092 0.0005 0.00028 0.00022
0.0043 0.0065 0.042 0.0041 0.0021 0.0017 0.00120.00078 0.0023 0.00049 0.00037 0.00016J 0.00008J 0.00006J0.0013 0.0025 0.0011 0.0019 0.0039 0.0019 0.00160.0003J 0.0006 0.0002J 0.00038J 0.00071 0.00093 0.00051 0% 0.360.012 0.015 0.009 0.007 0.0025J 0.0046J 0.0031J
0.0004J 0.0002J 0.0005 0.00047J 0.00012J 0.00021J 0.00016J 0% 0.270.0014 0.0019 0.0018 0.0017 0.001 0.00096 0.00084 0% 0.00
<0.0004 <0.0004 <0.0004 0.000022J 0.000032J 0.00005J 0.00006J 0% 0.020.0006 0.0002J 0.0003J 0.00038 0.000095J 0.00014J 0.00009J 0% 0.000.0032 0.0029 0.0018 0.0033 0.0015 0.0017 0.0012 0% 0.08
0.00007J <0.0001 <0.0001 0.000022J <0.0002 0.00003J 0.00003J 0% 0.000.0011 0.0014 0.0009 0.0017 0.0037 0.0017 0.0017 0% 0.000.0002J 0.0005 <0.0005 0.00043 0.00073 0.00098 0.00050.005 0.0025 0.0018 0.0039J 0.0014J 0.0059 0.004J 0% 0.03
<0.002 <0.002 <0.002 <0.01 <0.01 <0.01 <0.01 0% 0.21
0.010 0.016 <0.004 <0.01 <0.01 <0.01 <0.01 4% 0.18
0.083 <0.006 0.022 0.031 <0.01 <0.01 <0.01 0% 0.08
<0.002 <0.002 <0.002 <0.005 <0.002 <0.002 <0.0020.0089 <0.002 0.0124 <0.005 <0.002 <0.002 <0.002 14% 0.43<0.002 <0.002 <0.002 0.014 <0.002 <0.002 <0.002 0% 0.01<0.002 <0.002 <0.002 0.0063 <0.002 <0.002 <0.002 0% 0.09<0.002 <0.002 <0.002 0.012 <0.002 <0.002 <0.002 0% 0.00<0.002 0.005 <0.002 <0.002 <0.002 <0.002<0.002 <0.002 <0.002 0.01 <0.002 <0.002 <0.002<0.002 0.001 J 0.0008J 0.01 <0.002 <0.002 <0.002 0% 0.01<0.002 <0.002 0.0016 0.01 <0.002 <0.002 <0.002<0.002 <0.002 <0.002 <0.002 <0.002 <0.002<0.025* <0.025* <0.025* <0.005 <0.025* <0.01 <0.01 0% 0.39<0.002 <0.002 <0.002 <0.005 <0.002 <0.002 <0.002
<0.025 <0.025 <0.01 <0.01
>100 >100 >100 >100 >100 >100 >100 0% 1.00100 100 100 100 100 100 100 0% 1.00100 100 100 100 50 100 100 12% 1.12
>100 >100 >100 >100 >100 >100 >100 0% 1.00100 100 50 100 100 100 100 8% 1.08
2012-20132010-20112007-2008
Long Term and Transitional Monitoring
No
Sam
ples
Col
lect
ed
No
Sam
ples
Col
lect
ed
No
Sam
ples
Col
lect
ed
No
Sam
ples
Col
lect
ed
Frequency Above
Benchmarks
Mean Ratio to Benchmarks
Historical Monitoring Data

Wet Weather Historical Monitoring Table for SLR-MLS
Blank spaces have been verified and no data is available.
NA indicate no criteria or published value was available or applicable to the matrix or program.
(b) Water Quality Benchmark is based on the San Diego Regional Water Quality Control Plan by watershed for the San Diego Region (Basin Plan), 1994 (with amendments effective on or before April 4, 2011) and may vary by hydrologic area.(c) Water Quality Benchmark for dissolved metal fractions are based on total hardness and are calculated as described by the USEPA Federal Register Doc. 40 CFR Part 131, May 18, 2000. The Criteria Maximum Concentration (CMC) was used.* Indicates detection limit above water quality benchmark.£ Historical results for Deltamethrin/Tralomethrin contain results reported by lab as Deltamethrin.J-Analyte was detected at a concentration below the reporting limit and above the method detection limit. Reported value is estimated.
SourcesPlease refer to the San Diego County Copermittee Regional Monitoring Program Benchmark Sources in Attachment B to Appendix A for benchmark source citations.
(a) Prior to the 2014-2015 monitoring year, Water Quality Benchmark was calculated based on CMC (salmonids absent) using pH described in the U.S. EPA, 1999 Update of Ambient Water Quality Criteria for Ammonia, EPA-822-R-99-014, December 1999. For 2014-2015 monitoring year, Water Quality Benchmark CMC was calculated based on pH and water temperature (when applicable) as described in the U.S. EPA, 2013 Aquatic Life Ambient Water Quality Criteria for Ammonia - Freshwater, EPA-822-R-13-001, April 2013.
Values with red bold font and shading do not meet Water Quality Benchmarks.

Wet Weather Historical Monitoring Table for SM-TWAS-1a
2011-2012 2013-2014
10/06/10 02/16/11-02/17/11 - 10/11/12 02/08/13-
02/09/13 - 11/1/14 03/01/15-03/02/15
Physical Chemistry2007, 2013 pH pH units 6.5-9.0 1. Basin Plan 8.20 7.06 7.39 7.75 7.31 7.4 0% 0.312007, 2013 Specific Conductivity µmhos/cm NA 873 1,036 1,447 1,230 489 2682007, 2013 Water Temperature Celsius NA 17.73 15.10 19.6 12 16.86 13.262007, 2013 Turbidity NTU 20 1. Basin Plan 12 7.8 25 15 47 22.7 50% 1.08Bacteriological2007, 2013 Enterococcus MPN/100 mL NA 230,000 80,000 110,000 30,000 2,700 22,0002007, 2013 Fecal Coliform MPN/100 mL 400 1. Basin Plan REC-1/REC-2 70,000 11,000 8,000 13,000 22,000 11,000 100% 56.252007, 2013 Total Coliform MPN/100 mL NA 170,000 22,000 80,000 230,000 140,000 50,000Nutrients2007, 2013 Ammonia as N mg/L (a) 6. U.S. EPA Water Quality Criteria (Freshwater) 0.3 0.082J 0.73 0.15 0.37 <0.10 0% 0.022007, 2013 Nitrate as N mg/L 10 1. Basin Plan 1.1 2.5 1.9 2.5 1.3 0.62 0% 0.172007, 2013 Nitrite as N mg/L 1 1. Basin Plan 0.088J 0.073J 0.092J 0.033J 0.051J 0.038J 0% 0.062007, 2013 Total Kjeldahl Nitrogen mg/L NA 1.7 1 4.6 1.1 2.8 0.592007 Dissolved Phosphorus mg/L 2 4. MSGP 2015 0.28 0.17 0.3 0.12 0.38 0.23 0% 0.122007, 2013 Total Phosphorus mg/L 2 4. MSGP 2015 0.29 0.21 0.52 0.18 0.52 0.31 0% 0.17General Chemistry2007 Biochemical Oxygen Demand mg/L 30 4. MSGP 2015, 8. McNeeley (1979) 11 6.4 33 3 14 4.4 17% 0.402007 Chemical Oxygen Demand mg/L 120 4. MSGP 2015 63 33 160 47 110 33 17% 0.622007, 2013 Dissolved Organic Carbon mg/L NA 18 9.8 39 7.4 30 8.92007, 2013 Total Organic Carbon mg/L NA 20 11 39 8.1 34 9.52007 Oil and Grease mg/L 10 1. Basin Plan, 3. Anacostia River TMDL, 4. MSGP 2015 2.1J <5 <5 <5 <5.0 1.6J 0% 0.232007, 2013 Surfactants (MBAS) mg/L 0.5 1. Basin Plan 0.3 0.056 0.2 0.12 0.17 0.11 0% 0.322007, 2013 Total Dissolved Solids mg/L 500 (b) 1. Basin Plan 910 800 1,100 860 540 280 83% 1.502007, 2013 Total Suspended Solids mg/L 100 4. MSGP 2015, 1. Basin Plan 20 26 100 66 77 21 0% 0.522007, 2013 Hardness mg CaCO3/L NA 360 340 411 387 206 146Total Metals2007 Antimony mg/L NA 0.002 0.0012 0.0042 0.0011 0.0021 0.000962007, 2013 Arsenic mg/L NA 0.002 0.0018 0.0029 0.0017 0.0021 0.00132007, 2013 Cadmium mg/L NA 0.00012 0.000052J 0.00037 0.0001 0.00038 0.000061J2007, 2013 Chromium mg/L NA 0.0016 0.0014 0.0035 0.002 0.0042 0.00152007, 2013 Copper mg/L NA 0.012 0.0083 0.028 0.0092 0.027 0.0072007, 2013 Lead mg/L NA 0.0011 0.00075 0.0063 0.0016 0.0042 0.00112007, 2013 Nickel mg/L NA 0.0047 0.0039 0.0095 0.0046 0.0074 0.00212007, 2013 Selenium mg/L 0.005 16. 40 CFR 131.38 0.0018 0.0014 0.0012 0.0012 0.0014 0.00048 0% 0.252007, 2013 Zinc mg/L NA 0.069 0.03 0.25 0.044 0.21 0.03Dissolved Metals2007 Antimony mg/L 0.006 1. Basin Plan 0.0019 0.0012 0.0019 0.00085 0.0013 0.00077 0% 0.222007, 2013 Arsenic mg/L 0.34 16. 40 CFR 131.38 0.0019 0.0018 0.0023 0.0013 0.0014 0.0011 0% 0.002007, 2013 Cadmium mg/L (c) 16. 40 CFR 131.38 0.000074J 0.000034J 0.00019 0.000044J 0.00014 <0.00010 0% 0.012007, 2013 Chromium mg/L (c) 16. 40 CFR 131.38 0.00063 0.00072 0.0011 0.0004 0.00086 0.00048 0% 0.002007, 2013 Copper mg/L (c) 16. 40 CFR 131.38 0.0078 0.0064 0.011 0.0052 0.0095 0.0035 0% 0.202007, 2013 Lead mg/L (c) 16. 40 CFR 131.38 0.0002 0.000041J 0.00093 0.00009J 0.00055 0.00011J 0% 0.002007, 2013 Nickel mg/L (c) 16. 40 CFR 131.38 0.0045 0.0035 0.0078 0.0034 0.0051 0.0013 0% 0.002007, 2013 Selenium mg/L NA 0.0018 0.0015 0.00099 0.00096 0.0012 0.000472007, 2013 Zinc mg/L (c) 16. 40 CFR 131.38 0.044 0.019 0.14 0.016 0.088 0.011 0% 0.18Organophosphorus Pesticides
2007, 2013 Chlorpyrifos µg/L 0.02 acute / 0.014 chronic 12. CA Dept. of Fish & Game, 2000 <0.01 <0.01 <0.01 <0.01 <0.010 <0.010 0% 0.25
2007, 2013 Diazinon µg/L 0.08 acute / 0.05 chronic
12. CA Dept. of Fish & Game, 2000, 11. Chollas Creek TMDL for Diazinon, 10. USEPA, Aquatic Life Ambient
Water Quality Criteria Diazinon0.013 0.0066J <0.01 <0.01 <0.010BS-L <0.010 0% 0.08
2007, 2013 Malathion µg/L 0.43 13. CA Dept. of Fish & Game, 1998, 5. Goldbook 0.05 0.025 0.026 <0.01 0.05 0.0079J 0% 0.06Pyrethroids2007, 2013 Allethrin µg/L NA <0.002 <0.002 <0.002 <0.002 <0.002 <0.0022007, 2013 Bifenthrin µg/L 0.0093 15. Anderson et al., 2006 <0.002 0.0398 0.0674 0.0679 0.0481 0.0034 67% 4.082007, 2013 Cyfluthrin µg/L 0.344 17. Wheelock et al., 2004 <0.002 <0.002 0.0156 <0.002 0.0206 <0.002 0% 0.022007, 2013 Cyhalothrin, Total Lambda µg/L 0.20 17. Wheelock et al., 2004 <0.002 <0.002 0.0054 <0.002 0.0041 <0.002 0% 0.042007, 2013 Cypermethrin µg/L 0.683 17. Wheelock et al., 2004 <0.002 <0.002 <0.002 <0.002 0.0063 <0.002 0% 0.002007, 2013 Danitol (Fenpropathrin) µg/L NA <0.002 <0.002 <0.002 <0.002 <0.0022007, 2013 Deltamethrin/Tralomethrin£ µg/L NA <0.002 <0.002 <0.002 <0.002 <0.002 <0.0022007, 2013 Esfenvalerate µg/L 0.25 17. Wheelock et al., 2004 <0.002 <0.002 <0.002 <0.002 <0.002 <0.002 0% 0.002007, 2013 Fenvalerate µg/L NA <0.002 <0.002 <0.002 <0.002 0.0006J <0.0022007, 2013 Fluvalinate µg/L NA 0.0036 <0.002 <0.002 <0.002 <0.0022007, 2013 Permethrin µg/L 0.021 15. Anderson et al., 2006 <0.005 <0.025* 0.2575 <0.01 <0.01 <0.01 17% 2.282007, 2013 Prallethrin µg/L NA <0.002 <0.002 <0.002 <0.002 <0.002 <0.0022007, 2013 Resmethrin µg/L NA <0.01 <0.01 <0.01 <0.01Toxicity2007, 2013 Ceriodaphnia 96-hr LC50 (%) >100 >100 >100 >100 >100 >100 >100 0% 1.002007, 2013 Ceriodaphnia 7-day survival NOEC (%) 100 100 100 100 100 100 100 0% 1.002007, 2013 Ceriodaphnia 7-day reproduction NOEC (%) 100 100 100 100 100 100 100 0% 1.002007 Hyalella 96-hr LC50 (%) >100 >100 >100 >100 >100 >100 >100 0% 1.002007, 2013 Selenastrum 96-hr NOEC (%) 100 100 100 <25 100 100 100 17% 1.50See last page for footnotes and source references.
2012-2013 2014-2015
No
Sam
ples
Col
lect
ed
No
Sam
ples
Col
lect
ed
Frequency Above
Benchmarks
Mean Ratio to Benchmarks
Historical Monitoring Data
Permit Requirement Analyte Units Water Quality
Benchmarks Benchmark References
Transitional Monitoring
2010-2011

Wet Weather Historical Monitoring Table for SM-TWAS-1a
Blank spaces have been verified and no data is available.
NA indicate no criteria or published value was available or applicable to the matrix or program.
(b) Water Quality Benchmark is based on the San Diego Regional Water Quality Control Plan by watershed for the San Diego Region (Basin Plan), 1994 (with amendments effective on or before April 4, 2011) and may vary by hydrologic area.(c) Water Quality Benchmark for dissolved metal fractions are based on total hardness and are calculated as described by the USEPA Federal Register Doc. 40 CFR Part 131, May 18, 2000. The Criteria Maximum Concentration (CMC) was used.* Indicates detection limit above water quality benchmark.£ Historical results for Deltamethrin/Tralomethrin contain results reported by lab as Deltamethrin.BS-L-Blank Spike recovery of this analyte was below the control limits. Results may be biased low.J-Analyte was detected at a concentration below the reporting limit and above the method detection limit. Reported value is estimated.
SourcesPlease refer to the San Diego County Copermittee Regional Monitoring Program Benchmark Sources in Attachment B to Appendix A for benchmark source citations.
(a) Prior to the 2014-2015 monitoring year, Water Quality Benchmark was calculated based on CMC (salmonids absent) using pH described in the U.S. EPA, 1999 Update of Ambient Water Quality Criteria for Ammonia, EPA-822-R-99-014, December 1999. For 2014-2015 monitoring year, Water Quality Benchmark CMC was calculated based on pH and water temperature (when applicable) as described in the U.S. EPA, 2013 Aquatic Life Ambient Water Quality Criteria for Ammonia - Freshwater, EPA-822-R-13-001, April 2013.
Values with red bold font and shading do not meet Water Quality Benchmarks.

Wet Weather Historical Monitoring Table for SMR-MLS
2001-2002 2004-2005 2005-2006 2006-2007
11/29/01 02/12/03 02/25/03 02/03/04 02/24/04 - 02/28/06 - 11/30/07 02/03/08
Physical Chemistry2007, 2013 pH pH units 6.5-9.0 1. Basin Plan 7.90 7.50 7.40 7.80 7.75 7.73 7.99 7.96 0% 0.002007, 2013 Specific Conductivity µmhos/cm NA 1,410 1,050 492 1,170 643 717 1,080 1,3102007, 2013 Water Temperature Celsius NA 13.00 13.00 12.00 12.00 13.672007, 2013 Turbidity NTU 20 1. Basin Plan 2.5 193 1,160 147 0.095 362 10.9 6.72 50% 11.76Bacteriological2007, 2013 Enterococcus MPN/100 mL NA 130 300 4,106 5,172 11,000 1,600 232007, 2013 Fecal Coliform MPN/100 mL 400 1.Basin Plan REC-1/REC-2 >1,600 >1,600 500 1,300 500 170 23 71% 2.032007, 2013 Total Coliform MPN/100 mL NA 1. Basin Plan >1,600 >1,600 2,800 17,000 16,000 >1,600 >1,600Nutrients2007, 2013 Ammonia as N mg/L (a) 6. USEPA Water Quality Criteria (Freshwater) <0.1 <4 0.1 0.228 0.237 0.286 <0.02 <0.02 0% 0.022007, 2013 Nitrate as N mg/L 10 1. Basin Plan 0.5 1.2 1.5 0.985 1.21 1.62 0.08 0.98 0% 0.102007, 2013 Nitrite as N mg/L 1 1. Basin Plan <0.1 <0.1 <0.1 <0.5 <0.5 <0.1 <0.007 <0.007 0% 0.092007, 2013 Total Kjeldahl Nitrogen mg/L NA <0.5 0.6 0.7 1.92 1.46 0.677 0.6 2.12007 Dissolved Phosphorus mg/L 2 4. MSGP 2015 0.12 0.26 0.34 0.227 0.279 0.26 0.14 0% 0.102007, 2013 Total Phosphorus mg/L 2 4. MSGP 2015 <0.2 0.3 0.85 0.437 0.309 <0.05 0% 0.13General Chemistry2007 Biochemical Oxygen Demand mg/L 30 4. MSGP 2015, 8. McNeeley (1979) <5 16 22 14.1 6.72 10 2.09 <2.00 0% 0.312007 Chemical Oxygen Demand mg/L 120 4. MSGP 2015 <30 185 447 28 18 72.6 <25 <25 25% 0.822007, 2013 Dissolved Organic Carbon mg/L NA 8.24 5.522007, 2013 Total Organic Carbon mg/L NA 11.7 6.992007 Oil And Grease mg/L 10 1. Basin Plan, 3. Anacostia River TMDL, 4. MSGP 2015 <10 <5 <5 <1 <1 <1 <5 <5 0% 0.212007, 2013 Surfactants (MBAS) mg/L 0.5 1. Basin Plan 0.05 0.18 <0.04 0.154 0.095 <0.5 <0.1 <0.1 0% 0.212007, 2013 Total Dissolved Solids mg/L 750 (b) 1. Basin Plan 814 616 374 830 446 490 716 719 25% 0.832007, 2013 Total Suspended Solids mg/L 100 4. MSGP 2015, 1. Basin Plan <5 405 3,090 220 69 512 <1 <1 50% 5.372007, 2013 Total Hardness mg CaCO3/L NA 423 341 242 320 225 249 363 371Total Metals2007 Antimony mg/L NA <0.002 <0.002 <0.002 <0.005 <0.005 0.001 <0.001 <0.0012007, 2013 Arsenic mg/L NA <0.002 0.005 0.006 0.002 0.002 0.006 <0.001 <0.0012007, 2013 Cadmium mg/L NA <0.001 <0.001 <0.001 <0.001 <0.001 <0.001 <0.001 <0.0012007, 2013 Chromium mg/L NA 0.004 0.018 0.053 <0.005 <0.005 0.024 <0.004 <0.0042007, 2013 Copper mg/L NA 0.01 0.017 0.064 0.008 0.009 0.032 <0.002 <0.0022007, 2013 Lead mg/L NA <0.005 0.008 0.039 0.010 0.007 0.008 <0.004 <0.0042007, 2013 Nickel mg/L NA <0.005 0.013 0.024 0.003 0.003 0.013 <0.002 <0.0022007, 2013 Selenium mg/L 0.005 16. 40 CFR 131.38 <0.005 0.009 <0.005 <0.005 <0.005 0.001 <0.005 <0.005 13% 0.642007, 2013 Zinc mg/L NA 0.04 0.05 0.2 0.035 0.027 0.093 <0.010 <0.010Dissolved Metals2007 Antimony mg/L 0.006 1. Basin Plan <0.002 <0.002 <0.002 <0.005 <0.005 0.001 <0.002 <0.002 0% 0.232007, 2013 Arsenic mg/L 0.34 16. 40 CFR 131.38 <0.002 0.005 <0.002 <0.002 0.002 0.006 <0.001 <0.001 0% 0.012007, 2013 Cadmium mg/L (c) 16. 40 CFR 131.38 <0.001 <0.001 <0.001 <0.001 <0.001 <0.001 <0.001 <0.001 0% 0.042007, 2013 Chromium mg/L (c) 16. 40 CFR 131.38 0.003 0.002 0.004 <0.005 <0.005 0.024 <0.004 <0.004 0% 0.002007, 2013 Copper mg/L (c) 16. 40 CFR 131.38 0.005 0.009 0.012 <0.005 0.007 0.030 <0.001 <0.001 0% 0.252007, 2013 Lead mg/L (c) 16. 40 CFR 131.38 <0.005 0.005 <0.005 <0.002 0.005 0.008 <0.001 <0.001 0% 0.022007, 2013 Nickel mg/L (c) 16. 40 CFR 131.38 <0.005 0.007 <0.005 <0.002 0.003 0.011 <0.002 <0.002 0% 0.002007, 2013 Selenium mg/L NA <0.005 0.007 <0.005 <0.005 <0.005 0.001 <0.005 <0.0052007, 2013 Zinc mg/L (c) 16. 40 CFR 131.38 <0.010 0.05 0.01 <0.02 0.029 0.086 <0.010 <0.010 0% 0.09Organophosphorus Pesticides
2007, 2013 Chlorpyrifos µg/L 0.02 acute / 0.014 chronic 12. CA Dept. of Fish & Game, 2000 <0.01 <3.0* <3.0* 0.015 0.040 <0.01 <0.04* 25% 0.81
2007, 2013 Diazinon µg/L 0.08 acute / 0.05 chronic
12. CA Dept. of Fish & Game, 2000, 11. Chollas Creek TMDL for Diazinon, 10. USEPA, Aquatic Life Ambient
Water Quality Criteria Diazinon0.08 <6.0* <6.0* 0.011 0.031 <0.01 <0.04 0% 0.37
2007, 2013 Malathion µg/L 0.43 13. CA Dept. of Fish & Game, 1998, 5. Goldbook <0.05 0% NA1
Pyrethroids2007, 2013 Allethrin µg/L NA2007, 2013 Bifenthrin µg/L 0.0093 15. Anderson et al., 20062007, 2013 Cyfluthrin µg/L 0.344 17. Wheelock et al., 20042007, 2013 Cyhalothrin, Total Lambda µg/L 0.20 17. Wheelock et al., 20042007, 2013 Cypermethrin µg/L 0.683 17. Wheelock et al., 20042007, 2013 Danitol (Fenpropathrin) µg/L NA2007, 2013 Deltamethrin/Tralomethrin µg/L NA2007, 2013 Esfenvalerate µg/L 0.25 17. Wheelock et al., 20042007, 2013 Fenvalerate µg/L NA2007, 2013 Fluvalinate µg/L NA2007, 2013 Permethrin µg/L 0.021 15. Anderson et al., 20062007, 2013 Prallethrin µg/L NA2007, 2013 Resmethrin µg/L NAToxicity Toxicity2007, 2013 Ceriodaphnia 96-hr LC50 (%) >100 >100 >100 >100 100 100 100 >100 >100 38% 1.002007, 2013 Ceriodaphnia 7-day survival NOEC (%) 100 100 100 100 100 100 100 100 100 0% 1.002007, 2013 Ceriodaphnia 7-day reproduction NOEC (%) 100 100 50 <25 >100 100 100 100 100 25% 1.502007 Hyalella 96-hr LC50 (%) >100 >100 >100 0% 1.002007, 2013 Selenastrum 96-hr NOEC (%) 100 100 100 100 100 100 100 100 0% 1.00See last page for footnotes and source references.
Historical Monitoring Data
Permit Requirement Analyte Units Water Quality
Benchmarks Benchmark References Mean Ratio to Benchmarks
No
Sam
ples
Col
lect
ed
No
Sam
ples
Col
lect
ed
2007-20082003-20042002-2003Frequency
Above Benchmarks

Wet Weather Historical Monitoring Table for SMR-MLS
Blank spaces have been verified and no data is available.
NA indicate no criteria or published value was available or applicable to the matrix or program.
(b) Water Quality Benchmark are based on the San Diego Regional Water Quality Control Plan by watershed for the San Diego Region (Basin Plan), 1994 (with amendments effective on or before April 4, 2011) and may vary by hydrologic area/ subarea.(c) Water Quality Benchmark for dissolved metal fractions are based on total hardness and are calculated as described by the USEPA Federal Register Doc. 40 CFR Part 131, May 18, 2000. The Criteria Maximum Concentration (CMC) was used.* Indicates detection limit above water quality benchmark.£ Historical results for Deltamethrin/Tralomethrin contain results reported by lab as Deltamethrin.J-Analyte was detected at a concentration below the reporting limit and above the method detection limit. Reported value is estimated.NA1 Three or more years of data required to calculate the Mean Ratio to Benchmark.
SourcesPlease refer to the San Diego County Copermittee Regional Monitoring Program Benchmark Sources in Attachment B to Appendix A for benchmark source citations.
(a) Prior to the 2014-2015 monitoring year, Water Quality Benchmark was calculated based on CMC (salmonids absent) using pH described in the U.S. EPA, 1999 Update of Ambient Water Quality Criteria for Ammonia, EPA-822-R-99-014, December 1999. For 2014-2015 monitoring year, Water Quality Benchmark CMC was calculated based on pH and water temperature (when applicable) as described in the U.S. EPA, 2013 Aquatic Life Ambient Water Quality Criteria for Ammonia - Freshwater, EPA-822-R-13-001, April 2013.
Values with red bold font and shading do not meet Water Quality Benchmarks.

Wet Weather Historical Monitoring Table for SMR-MLS-2
Long Term and
Transitional Monitoring
Long Term and
Transitional Monitoring
Long Term Monitoring
Only
Long Term and
Transitional Monitoring
2008-2009 2009-2010 2011-2012 2013-2014
12/16/08 - 10/19/10 02/17/11 - 10/11/12-10/12/12 02/20/13 - 11/01/14 12/02/14-
12/04/1403/01/15-03/02/15
Physical Chemistry2013 Dissolved Oxygen mg/L <6.0 (a) 1. Basin Plan 8.38 9.12 9.45 0% NA1
2007, 2013 pH pH units 6.5-9.0 1. Basin Plan 8.16 7.43 8.27 7.9 7.4 7.68 7.76 8.46 0% 0.252007, 2013 Specific Conductivity µmhos/cm NA 239 1,155 1,173 1,013 986 1363 1259 13782007, 2013 Water Temperature Celsius NA 10.40 18.20 14.10 20.4 10.7 17.42 15.05 13.592007, 2013 Turbidity NTU 20 1. Basin Plan 855 180 4.5 2.4 31 1.1 14.8 2.4 38% 6.82
2007, 2013 Enterococcus MPN/100 mL NA 50,000 30,000 230 500 7,000 90 270 90,0002007, 2013 Fecal Coliform MPN/100 mL 400 1.Basin Plan REC-1/REC-2 23,000 80,000 700 500 3,000 170 5,000 30,000 88% 44.492007, 2013 Total Coliform MPN/100 mL NA 90,000 110,000 7,000 7,000 30,000 1,400 5,000 70,000Nutrients2007, 2013 Ammonia as N mg/L (b) 6. USEPA Water Quality Criteria (Freshwater) 0.23 0.15 0.15 0.093J 0.54 <0.10 <0.10 <0.10 0% 0.022007, 2013 Nitrate as N mg/L 10 1. Basin Plan 3.01 2.1 5.9 0.99 4.4 0.74 4.1 2.9 0% 0.302007, 2013 Nitrite as N mg/L 1 1. Basin Plan 0.05 0.098J 0.14 <0.1 <0.15 0.015J 0.045J 0.026J 0% 0.062007, 2013 Total Kjeldahl Nitrogen mg/L NA 4.8 2.3 0.71 0.26 1.6 0.25 3.2 0.252007 Dissolved Phosphorus mg/L 2 4. MSGP 2015 0.295 0.088 0.04 0.02 0.058 0.016 NR 0.025 0% 0.042013 Orthophosphate mg/L NA 0.015 0.065 0.0262007, 2013 Total Phosphorus mg/L 2 4. MSGP 2015 1.115 0.31 0.084 0.039 0.19 0.026 0.51 0.056 0% 0.15General Chemistry2007 Biochemical Oxygen Demand mg/L 30 4. MSGP 2015, 8. McNeeley (1979) 19.4 8.6 2.4 5.8 7 2.3 NR <2.0 0% 0.222007 Chemical Oxygen Demand mg/L 120 4. MSGP 2015 68 54 19 10 31 7.5 NR 22 0% 0.252007, 2013 Dissolved Organic Carbon mg/L NA 10.3 5.6 4.4 3.9 4.1 3.6 10 3.52007, 2013 Total Organic Carbon mg/L NA 8 5.9 4.4 5 4.7 3.7 11 3.72007 Oil and Grease mg/L 10 1. Basin Plan, 3. Anacostia River TMDL, 4. MSGP 2015 1.7J <5 6 <5 1.9J <5.0 NR <5.0 0% 0.282013 Sulfate mg/L 250 1. Basin Plan AE 290 250 50% NA1
2007, 2013 Surfactants (MBAS) mg/L 0.5 1. Basin Plan 0.005J <0.05 0.03J <0.05 0.033J 0.044J 0.040J 0.035J 0% 0.062007, 2013 Total Dissolved Solids mg/L 750 (a) 1. Basin Plan 564 870 830 880 570 900 830 810 75% 1.042007, 2013 Total Suspended Solids mg/L 100 4. MSGP 2015, 1. Basin Plan 1,220 220 44 10 63 3 340 15 38% 2.392007, 2013 Total Hardness mg CaCO3/L NA 135.5 450 410 422 318 467 476 398Total Metals2007 Antimony mg/L NA 0.0003J 0.00023J 0.00017J 0.00009J 0.00021J 0.00011J NR 0.00028J2007, 2013 Arsenic mg/L NA 0.003 0.0043 0.0015 0.0015 0.002 0.0011 0.0065 0.00222007, 2013 Cadmium mg/L NA 0.0004 0.00016 0.000063J 0.00003J 0.00005J <0.00010 0.00021 <0.000102007, 2013 Chromium mg/L NA 0.0072 0.013 0.0011 0.0002 0.0022 0.00011J 0.016 0.000842007, 2013 Copper mg/L NA 0.0236 0.014 0.0025 0.00081 0.0043 0.00068 0.021 0.00242013 Iron mg/L 0.3 (a) 1. Basin Plan 0.16 16 0.69 67% NA1
2007, 2013 Lead mg/L NA 0.01811 0.0046 0.00039 0.00006J 0.0009 0.000077J 0.0049 0.000212013 Manganese mg/L 0.05 (a) 1. Basin Plan 0.031 0.43 0.039 33% NA1
2013 Mercury mg/L NA <0.000050H <0.000050 0.0000050J2007, 2013 Nickel mg/L NA 0.0094 0.0082 0.0027 0.00074J 0.0017 0.00061J 0.01 0.00282007, 2013 Selenium mg/L 0.005 16. 40 CFR 131.38 0.0004J 0.0015 0.0013 0.00091 0.0009 0.00068 0.0031 0.0017 0% 0.262013 Thallium mg/L NA <0.00020 0.00019J 0.000023J2007, 2013 Zinc mg/L NA 0.0971 0.04 0.0068 0.0014J 0.011 0.0016J 0.05 0.0030JDissolved Metals2007 Antimony mg/L 0.006 1. Basin Plan 0.0006 0.00021J 0.00016J 0.0001J 0.00018J 0.00013J NR 0.00022J 0% 0.042007, 2013 Arsenic mg/L 0.34 16. 40 CFR 131.38 0.0027 0.0016 0.0013 0.0015 0.0012 0.0011 0.0015 0.0017 0% 0.002007, 2013 Cadmium mg/L (c) 16. 40 CFR 131.38 <0.0004 0.000018J 0.000038J 0.00002J 0.00002J 0.000034J 0.000020J <0.00010 0% 0.012007, 2013 Chromium mg/L (c) 16. 40 CFR 131.38 0.0002J 0.000086J 0.00011J <0.0002 0.00008J 0.000053J 0.00011J 0.00013J 0% 0.002007, 2013 Copper mg/L (c) 16. 40 CFR 131.38 0.0017 0.0017 0.0015 0.00094 0.0015 0.00092 0.0019 0.0014 0% 0.042013 Iron mg/L NA 0.043 0.058 0.0182007, 2013 Lead mg/L (c) 16. 40 CFR 131.38 <0.0001 0.00016J <0.0002 <0.0002 <0.0002 <0.00020 0.000024J <0.00020 0% 0.002013 Manganese mg/L NA 0.0027 0.0035 0.00442013 Mercury mg/L NA <0.000050H <0.000050 0.0000080J2007, 2013 Nickel mg/L (c) 16. 40 CFR 131.38 0.001 0.0027 0.0023 0.00083 0.00089 0.002 0.0028 0.0019 0% 0.002007, 2013 Selenium mg/L NA 0.0005 0.0011 0.0012 0.00089 0.00075 0.0013 0.0015 0.00142013 Thallium mg/L NA <0.00020 <0.00020 <0.000202007, 2013 Zinc mg/L (c) 16. 40 CFR 131.38 0.0006 0.0026J 0.0023J 0.0022J 0.0024J 0.0013J 0.0025J 0.0014J 0% 0.01
No
Sam
ples
Col
lect
ed
Frequency Above
BenchmarksAnalyte Units Benchmark ReferencesWater Quality
BenchmarksMean Ratio to Benchmarks2014-2015
No
Sam
ples
Col
lect
ed
2012-20132010-2011
Historical Monitoring Data
Bacteriological
Permit Requirement
No
Sam
ples
Col
lect
ed

Wet Weather Historical Monitoring Table for SMR-MLS-2
Long Term and
Transitional Monitoring
Long Term and
Transitional Monitoring
Long Term Monitoring
Only
Long Term and
Transitional Monitoring
2008-2009 2009-2010 2011-2012 2013-2014
12/16/08 - 10/19/10 02/17/11 - 10/11/12-10/12/12 02/20/13 - 11/01/14 12/02/14-
12/04/1403/01/15-03/02/15
Frequency Above
BenchmarksAnalyte Units Benchmark ReferencesWater Quality
BenchmarksMean Ratio to Benchmarks2014-20152012-20132010-2011
Historical Monitoring Data
Permit Requirement
Organophosphorus Pesticides2013 Azinphos methyl (Guthion) µg/L NA <0.010 <0.010 <0.0102013 Bolstar µg/L NA <0.010 <0.010 <0.010
2007, 2013 Chlorpyrifos µg/L 0.02 acute / 0.014 chronic 12. CA Dept. of Fish & Game, 2000 <0.002 <0.01 <0.01 <0.01 <0.01 <0.010 <0.010 <0.010 0% 0.23
2013 Coumaphos µg/L NA <0.010 <0.010 <0.0102013 Demeton-o µg/L NA <0.010 <0.010 <0.010BS-L2013 Demeton-s µg/L NA <0.010 <0.010 <0.010
2007, 2013 Diazinon µg/L 0.08 acute / 0.05 chronic
12. CA Dept. of Fish & Game, 2000, 11. Chollas Creek TMDL for Diazinon, 10. USEPA, Aquatic Life Ambient
Water Quality Criteria Diazinon<0.004 <0.01 <0.01 <0.01 <0.01 <0.010BS-L <0.010 <0.010 0% 0.06
2013 Dichlorvos µg/L NA <0.010 <0.010 <0.0102013 Dimethoate µg/L NA <0.010 <0.010 <0.0102013 Disulfoton µg/L NA <0.010 <0.010 <0.0102013 Ethoprop µg/L NA <0.010 <0.010 <0.0102013 Ethyl parathion µg/L NA <0.010 <0.010 <0.0102013 Fensulfothion µg/L NA <0.010 <0.010 <0.0102013 Fenthion µg/L NA <0.010 <0.010 <0.0102007, 2013 Malathion µg/L 0.43 13. CA Dept. of Fish & Game, 1998, 5. Goldbook 0.0976 <0.01 0.02 <0.01 0.0092J <0.010 0.014 <0.010 0% 0.052013 Merphos µg/L NA <0.010 <0.010 <0.0102013 Methyl parathion µg/L NA <0.010 <0.010 <0.0102013 Mevinphos µg/L NA <0.010 <0.010 <0.0102013 Naled µg/L NA <0.010 <0.010 <0.0102013 Phorate µg/L NA <0.010 <0.010 <0.0102013 Ronnel µg/L NA <0.010 <0.010 <0.0102013 Stirophos µg/L NA <0.010 <0.010 <0.0102013 Tokuthion (Prothiofos) µg/L NA <0.010 <0.010 <0.0102013 Trichloronate µg/L NA <0.010 <0.010 <0.010Pyrethroids2007, 2013 Allethrin µg/L NA <0.002 <0.005 <0.002 <0.002 <0.002 <0.002 <0.002 <0.0022007, 2013 Bifenthrin µg/L 0.0093 15. Anderson et al., 2006 0.1376 <0.005 <0.002 <0.002 0.0076 <0.002 0.0185 <0.002 25% 2.292007, 2013 Cyfluthrin µg/L 0.344 17. Wheelock et al., 2004 0.0347 <0.005 <0.002 <0.002 <0.002 <0.002 <0.002 <0.002 0% 0.022007, 2013 Cyhalothrin, Total Lambda µg/L 0.20 17. Wheelock et al., 2004 0.0065 <0.005 <0.002 <0.002 <0.002 <0.002 <0.002 <0.002 0% 0.062007, 2013 Cypermethrin µg/L 0.683 17. Wheelock et al., 2004 0.0483 <0.005 <0.002 <0.002 <0.002 <0.002 <0.002 <0.002 0% 0.012007, 2013 Danitol (Fenpropathrin) µg/L NA <0.002 <0.002 <0.002 <0.002 <0.002 0.005 <0.0022007, 2013 Deltamethrin/Tralomethrin£ µg/L NA <0.002 <0.005 <0.002 <0.002 <0.002 <0.002 <0.002 <0.0022007, 2013 Esfenvalerate µg/L 0.25 17. Wheelock et al., 2004 0.0025 <0.005 <0.002 <0.002 <0.002 <0.002 <0.002 <0.002 0% 0.012007, 2013 Fenvalerate µg/L NA <0.002 <0.002 <0.0022007, 2013 Fluvalinate µg/L NA <0.002 0.0032 <0.0022007, 2013 Permethrin µg/L 0.021 15. Anderson et al., 2006 <0.025* <0.005 <0.025* <0.025†† <0.01 <0.01 <0.01 <0.01 0% 0.302007, 2013 Prallethrin µg/L NA <0.002 <0.005 <0.002 <0.002 <0.002 <0.002 <0.002 <0.0022007, 2013 Resmethrin µg/L NA <0.01 <0.01 <0.01Toxicity2007, 2013 Ceriodaphnia 96-hr LC50 (%) >100 >100 >100 >100 >100 >100 >100 NR >100 0% 1.002007, 2013 Ceriodaphnia 7-day survival NOEC (%) 100 100 100 100 100 100 100 NR 100 0% 1.002013 Ceriodaphnia 7-day survival TST Pass/Fail Pass Pass Pass 0%2007, 2013 Ceriodaphnia 7-day reproduction NOEC (%) 100 50 100 100 100 100 100 NR 100 14% 1.142013 Ceriodaphnia 7-day reproduction TST Pass/Fail Pass Pass Pass 0%2007 Hyalella 96-hr LC50 (%) >100 65.8 >100 >100 >100 >100 >100 NR >100 14% 1.072007, 2013 Selenastrum 96-hr NOEC (%) 100 100 100 100 100 100 100 NR 100 0% 1.002013 Selenastrum 96-hr TST Pass/Fail Pass Fail Pass 33%2013 Pimephales 7-day survival TST Pass/Fail Pass Pass Pass 0%2013 Pimephales 7-day biomass TST Pass/Fail Pass Pass Pass 0%See last page for footnotes and source references.
No
Sam
ples
Col
lect
ed
No
Sam
ples
Col
lect
ed
No
Sam
ples
Col
lect
ed
Wet Weather Historical Monitoring Table for SMR-MLS-2Blank spaces have been verified and no data is available due to changes in the monitoring program.
NA indicate no criteria or published value was available or applicable to the matrix or program.(a) Water Quality Benchmark are based on the San Diego Regional Water Quality Control Plan by watershed for the San Diego Region (Basin Plan), 1994 (with amendments effective on or before April 4, 2011) and may vary by hydrologic area/subarea.
(c) Water Quality Benchmark for dissolved metal fractions are based on total hardness and are calculated as described by the USEPA Federal Register Doc. 40 CFR Part 131, May 18, 2000. The Criteria Maximum Concentration (CMC) was used.* Indicates detection limit above water quality benchmark.£ Historical results for Deltamethrin/Tralomethrin contain results reported by lab as Deltamethrin.†† Permethrin was non-detect at the method detection limit of 0.005 µg/L. AE-Analysis error.BS-L-Blank Spike recovery of this analyte was below the control limits. Results may be biased low.J-Analyte was detected at a concentration below the reporting limit and above the method detection limit. Reported value is estimated.H-Sample analyzed and/or extracted past the recommended holding time.NA1 Three or more years of data required to calculate the Mean Ratio to Benchmark.NR-Sampling of this analyte not required for transitional monitoring (RWQCB Order No. R9-2007-0001) and/or for long term monitoring (RWQCB Order No. R9-2013-0001).
SourcesPlease refer to the San Diego County Copermittee Regional Monitoring Program Benchmark Sources in Attachment B to Appendix A for benchmark source citations.
(b) Prior to the 2014-2015 monitoring year, Water Quality Benchmark was calculated based on CMC (salmonids absent) using pH described in the U.S. EPA, 1999 Update of Ambient Water Quality Criteria for Ammonia, EPA-822-R-99-014, December 1999. For 2014-2015 monitoring year, Water Quality Benchmark CMC was calculated based on pH and water temperature (when applicable) as described in the U.S. EPA, 2013 Aquatic Life Ambient Water Quality Criteria for Ammonia - Freshwater, EPA-822-R-13-001, April 2013.
Values with red bold font and shading do not meet Water Quality Benchmarks.

Wet Weather Historical Monitoring Table for SR-TWAS-1
2010-2011 2012-2013
11/28/09 02/06/10 - 10/06/11 02/07/12-02/08/12 - 10/09/13-
10/10/1302/06/14-02/07/14
Physical Chemistry2007, 2013 pH pH units 6.5-9.0 1. Basin Plan 7.36 7.38 7.49 8.24 8.02 7.29 0% 0.302007, 2013 Specific Conductivity µmhos/cm NA 3,120 623 1,256 533 225 2,7812007, 2013 Water Temperature Celsius NA 13.20 14.00 16.5 12.0 15.48 15.222007, 2013 Turbidity NTU 20 1. Basin Plan 7.1 61 40 7.1 106.8 23.7 67% 2.05Bacteriological2007, 2013 Enterococcus MPN/100 mL NA 3,000 5,000 800,000 230 49,000 1302007, 2013 Fecal Coliform MPN/100 mL 400 1. Basin Plan REC-1/REC-2 23,000 2,200 50,000 20 79,000 45 67% 64.282007, 2013 Total Coliform MPN/100 mL NA 30,000 23,000 110,000 1,700 170,000 3,300Nutrients2007, 2013 Ammonia as N mg/L (a) 6. U.S. EPA Water Quality Criteria (Freshwater) 0.04 0.03J 0.22 <0.1 <0.10 <0.10 0% 0.012007, 2013 Nitrate as N mg/L 10 1. Basin Plan 0.18 0.34 1.8 0.15 1.9 0.49 0% 0.082007, 2013 Nitrite as N mg/L 1 1. Basin Plan 0.05 <0.15 0.084J <0.1 0.12 0.029J 0% 0.072007, 2013 Total Kjeldahl Nitrogen mg/L NA 0.762J 0.492J 2.5 0.5 2.7 0.432007 Dissolved Phosphorus mg/L 2 4. MSGP 2015 0.041J 0.125 0.25 0.046 0.46 0.028 0% 0.082007, 2013 Total Phosphorus mg/L 2 4. MSGP 2015 0.074 0.159 0.6 0.063 0.77 0.15 0% 0.15General Chemistry2007, 2013 Biochemical Oxygen Demand mg/L 30 4. MSGP 2015, 8. McNeeley (1979) 3 2.5 16 2.7† 20 2.1 0% 0.262007 Chemical Oxygen Demand mg/L 120 4. MSGP 2015 17.8 51.1 91 19 110 14 0% 0.422007, 2013 Dissolved Organic Carbon mg/L NA 5 8.1 6.8 5.4 26 6.42007, 2013 Total Organic Carbon mg/L NA 7 7.7 19 5.9 32 7.12007, 2013 Oil and Grease mg/L 10 1. Basin Plan, 3. Anacostia River TMDL, 4. MSGP 2015 <5 <5 <5 1.3J <5.0 <5.0 0% 0.232007, 2013 Surfactants (MBAS) mg/L 0.5 1. Basin Plan 0.1H 0.056 0.08 0.066 0.06 0.12 0% 0.162007, 2013 Total Dissolved Solids mg/L 1500 (b) 1. Basin Plan 1,862 322B 1,000 290 1,100 1,500 17% 0.672007, 2013 Total Suspended Solids mg/L 100 4. MSGP 2015, 1. Basin Plan 5.5 40 110 5 160 18 33% 0.562007, 2013 Total Hardness mg CaCO3/L NA 798.7 163.6 500 180 516 803Total Metals2007 Antimony mg/L NA 0.0002J 0.0004J 0.001 0.00011J 0.0016 0.00042J2007, 2013 Arsenic mg/L NA 0.0018 0.0010 0.0025 0.00078 0.0026 0.00122007, 2013 Cadmium mg/L NA <0.0004 <0.0004 0.00011 <0.0001 0.00011 0.000044J2007, 2013 Chromium mg/L NA 0.0002J 0.0009 0.0059 0.0003 0.0056 0.000332007, 2013 Copper mg/L NA 0.0016 0.0047 0.015 0.001 0.018 0.00172007, 2013 Lead mg/L NA 0.00005J 0.0012 0.0043 0.00016J 0.0044 0.00022007, 2013 Nickel mg/L NA 0.0019 0.0012 0.0071 0.00085 0.0059 0.00372007, 2013 Selenium mg/L 0.005 16. 40 CFR 131.38 <0.0005 0.0007 0.00059 <0.0004 0.00082 0.0014 0% 0.132007, 2013 Zinc mg/L NA 0.0042 0.0128 0.043 0.0022J 0.07 0.0055Dissolved Metals2007 Antimony mg/L 0.006 1. Basin Plan 0.0001J 0.0003J 0.00085 0.000098J 0.0012 0.00039J 0% 0.082007, 2013 Arsenic mg/L 0.34 16. 40 CFR 131.38 0.0024 0.0010 0.0015 0.00072 0.0018 0.0007 0% 0.002007, 2013 Cadmium mg/L (c) 16. 40 CFR 131.38 <0.0004 <0.0004 0.000035J <0.0001 0.000030J 0.000047J 0% 0.012007, 2013 Chromium mg/L (c) 16. 40 CFR 131.38 0.0001J 0.0002J 0.00042 0.0001J 0.00064 0.00010J 0% 0.002007, 2013 Copper mg/L (c) 16. 40 CFR 131.38 0.0012 0.0020 0.0059 0.00071 0.007 0.0012 0% 0.072007, 2013 Lead mg/L (c) 16. 40 CFR 131.38 <0.0001 0.00008J 0.00011J 0.000015J 0.00014J <0.00020 0% 0.002007, 2013 Nickel mg/L (c) 16. 40 CFR 131.38 0.0021 0.0007 0.0033 0.0009 0.0031 0.0041 0% 0.002007, 2013 Selenium mg/L NA <0.0005 0.0002J 0.00038J 0.00035J 0.00073 0.00122007, 2013 Zinc mg/L (c) 16. 40 CFR 131.38 0.0015 0.0018 0.011 0.015 0.033 0.0046J 0% 0.04Organophosphorus Pesticides
2007, 2013 Chlorpyrifos µg/L 0.02 acute / 0.014 chronic 12. CA Dept. of Fish & Game, 2000 <0.002 <0.002 <0.01 <0.01 <0.010 <0.010 0% 0.18
2007, 2013 Diazinon µg/L 0.08 acute / 0.05 chronic
12. CA Dept. of Fish & Game, 2000, 11. Chollas Creek TMDL for Diazinon, 10. USEPA, Aquatic Life Ambient
Water Quality Criteria Diazinon<0.004 <0.004 <0.01 <0.01 <0.010 <0.010 0% 0.05
2007, 2013 Malathion µg/L 0.43 13. CA Dept. of Fish & Game, 1998, 5. Goldbook <0.006 <0.006 0.03 <0.01 0.015 <0.010 0% 0.02Pyrethroids2007, 2013 Allethrin µg/L NA <0.0005 0.0064B <0.002 <0.002 <0.002 <0.0022007, 2013 Bifenthrin µg/L 0.0093 15. Anderson et al., 2006 <0.0005 0.0293B <0.002 <0.002 0.0121 0.0013J 33% 0.812007, 2013 Cyfluthrin µg/L 0.344 17. Wheelock et al., 2004 <0.0005 0.0056 <0.002 <0.002 0.0047 <0.002 0% 0.012007, 2013 Cyhalothrin, Total Lambda µg/L 0.20 17. Wheelock et al., 2004 <0.0005 0.0256 <0.002 <0.002 <0.002 <0.002 0% 0.062007, 2013 Cypermethrin µg/L 0.683 17. Wheelock et al., 2004 <0.0005 0.006 <0.002 <0.002 <0.002 <0.002 0% 0.002007, 2013 Danitol (Fenpropathrin) µg/L NA <0.0005 0.004B <0.002 <0.002 <0.002 <0.0022007, 2013 Deltamethrin/Tralomethrin£ µg/L NA <0.0005 <0.0005 <0.002 <0.002 <0.002 <0.0022007, 2013 Esfenvalerate µg/L 0.25 17. Wheelock et al., 2004 <0.0005 0.0026 <0.002 <0.002 <0.002 <0.002 0% 0.002007, 2013 Fenvalerate µg/L NA <0.0005 0.0077 <0.002 <0.002 <0.002 <0.0022007, 2013 Fluvalinate µg/L NA <0.0005 <0.0005 <0.002 <0.002 <0.002 <0.0022007, 2013 Permethrin µg/L 0.021 15. Anderson et al., 2006 <0.005 <0.005 <0.025†† <0.025†† <0.01 <0.01 0% 0.082007, 2013 Prallethrin µg/L NA <0.0005 0.0098B <0.002 <0.002 <0.002 <0.0022007, 2013 Resmethrin µg/L NA <0.005 <0.025 <0.025 <0.01 <0.01Toxicity2007, 2013 Ceriodaphnia 96-hr LC50 (%) >100 >100 >100 >100 >100 >100 >100 0% 1.002007, 2013 Ceriodaphnia 7-day survival NOEC (%) 100 100 100 100 100 100 100 0% 1.002007, 2013 Ceriodaphnia 7-day reproduction NOEC (%) 100 100 100 100 100 100 100 0% 1.002007 Hyalella 96-hr LC50 (%) >100 >100 >100 >100 >100 >100 >100 0% 1.002007, 2013 Selenastrum 96-hr NOEC (%) 100 50 100 100 100 100 50 33% 1.33See last page for footnotes and source references.
Mean Ratio to Benchmarks2011-2012Analyte Units Water Quality
Benchmarks Benchmark References
Historical Monitoring Data
2009-2010Permit Requirement
Transitional Monitoring
2013-2014Frequency
Above Benchmarks
No
Sam
ples
Col
lect
ed
No
Sam
ples
Col
lect
ed

Wet Weather Historical Monitoring Table for SR-TWAS-1
Blank spaces have been verified and no data is available.
NA indicate no criteria or published value was available or applicable to the matrix or program.
(b) Water Quality Benchmark is based on the San Diego Regional Water Quality Control Plan by watershed for the San Diego Region (Basin Plan), 1994 (with amendments effective on or before April 4, 2011) and may vary by hydrologic area.(c) Water Quality Benchmark for dissolved metal fractions are based on total hardness and are calculated as described by the USEPA Federal Register Doc. 40 CFR Part 131, May 18, 2000. The Criteria Maximum Concentration (CMC) was used.*Indicates detection limit above water quality benchmark† Result was from composite sample. The grab sample was analyzed outside of the holding time.£ Historical results for Deltamethrin/Tralomethrin contain results reported by lab as Deltamethrin.†† Permethrin was non-detect at the method detection limit of 0.005 µg/L. B-Analyte was detected in the associated method blank.H-Sample received and/or analyzed past the recommended holding time.J-Analyte was detected at a concentration below the reporting limit and above the method detection limit. Reported value is estimated.
SourcesPlease refer to the San Diego County Copermittee Regional Monitoring Program Benchmark Sources in Attachment B to Appendix A for benchmark source citations.
(a) Prior to the 2014-2015 monitoring year, Water Quality Benchmark was calculated based on CMC (salmonids absent) using pH described in the U.S. EPA, 1999 Update of Ambient Water Quality Criteria for Ammonia, EPA-822-R-99-014, December 1999. For 2014-2015 monitoring year, Water Quality Benchmark CMC was calculated based on pH and water temperature (when applicable) as described in the U.S. EPA, 2013 Aquatic Life Ambient Water Quality Criteria for Ammonia - Freshwater, EPA-822-R-13-001, April 2013.
Values with red bold font and shading do not meet Water Quality Benchmarks.

Wet Weather Historical Monitoring Table for SR-MLS
02/17/02 03/17/02 04/25/02 12/16/02 02/11/03 02/25/03 11/12/03 02/03/04 02/18/04 10/17/04 02/11/05 02/18/05
Physical Chemistry2013 Dissolved Oxygen mg/L <5.0 (a)2007, 2013 pH pH units 6.5-9.0 1. Basin Plan 7.5 7.4 7.3 7.56 6.87 6.94 7.20 7.83 7.58 7.24 7.52 7.492007, 2013 Specific Conductivity µmhos/cm NA 3,820 3,430 2,980 2,990 2,760 1,955 3,040 1,742 1,995 529 5,070 3,2602007, 2013 Water Temperature Celsius NA 14.30 17.00 14.40 14.90 12.20 15.40 19.30 14.60 14.002013 Color Color units2007, 2013 Turbidity NTU 20 1. Basin Plan 7.7 20.2 8.24 62.9 13 46.5 15.2 11.5 16.8 4.03 5.8 48.8Bacteriological2007, 2013 Enterococcus MPN/100 mL NA 300 16,000 9,000 8,000 14,000 30,000 18,792 1,879 17,000 800 3,000 50,0002007, 2013 Fecal Coliform MPN/100 mL 4,000 1.Basin Plan REC-1/REC-2 130 500 11,000 23,000 7,000 1,700 4,000 2,200 2,300 300 1,300 1,3002007, 2013 Total Coliform MPN/100 mL NA 23,000 5,000 230,000 30,000 30,000 170,000 300,000 130,000 130,000 30,000 13,000 28,000Nutrients2007, 2013 Ammonia as N mg/L (b) 6. USEPA Water Quality Criteria (Freshwater) 0.16 0.3 0.2 0.25 0.28 0.19 0.16 0.1 0.15 0.39 0.14 0.142007, 2013 Nitrate as N mg/L 10 1. Basin Plan 0.4 0.3 0.2 0.54 0.81 0.39 2.19 0.25 0.27 0.07 1.02 1.932007, 2013 Nitrite as N mg/L 1 1. Basin Plan <0.05 <0.05 <0.05 0.06 <0.05 <0.05 0.08 <0.05 <0.05 <0.05 <0.05 <0.052007, 2013 Total Kjeldahl Nitrogen mg/L NA 1.5 3 1.2 1.0 1.0 0.8 2.8 <0.5 0.7 2.1 1.4 1.82007 Dissolved Phosphorus mg/L 2 4. MSGP 2015 <0.05 0.2 0.1 0.34 0.20 0.10 0.4 0.18 0.12 0.2 0.18 0.452013 Orthophosphate mg/L NA2007, 2013 Total Phosphorus mg/L 2 4. MSGP 2015 0.18 0.29 0.1 0.54 0.22 0.14 0.43 0.22 0.16 0.25 0.57 0.47General Chemistry2007, 2013 Biochemical Oxygen Demand mg/L 30 4. MSGP 2015, 8. McNeeley (1979) 2 14.2 4.7 <2.0 20.4 5.89 9.32 46.7 15.3 19.8 2.57 3.422007 Chemical Oxygen Demand mg/L 120 4. MSGP 2015 70 63 55 59 85 39 104 69 86 44 123 742007, 2013 Dissolved Organic Carbon mg/L NA 9.68 25.2 8.94 21.9 7.94 88.2 25.7 5.24 6.192007, 2013 Total Organic Carbon mg/L NA 40.7 12.9 6.72 20.8 12.5 96.4 30.1 10.9 11.72007, 2013 Oil and Grease mg/L 10 1. Basin Plan, 3. Anacostia River TMDL, 4. MSGP 2015 1 1 1 4.47 2 1 4.43 <1 1.05 <1 <1 <12013 Sulfate mg/L 500 (a) 1. Basin Plan2007, 2013 Surfactants (MBAS) mg/L 0.5 1. Basin Plan <0.5 <0.5 <0.5 <0.1 <0.1 <0.1 <0.5 <0.5 <0.5 <0.5 <0.5 <0.52007, 2013 Total Dissolved Solids mg/L 1,500 (a) 1. Basin Plan 2,000 1,050 2,870 793 1,660 1,150 1,880 1,780 2,230 2,860 2,370 1,4102007, 2013 Total Suspended Solids mg/L 100 4. MSGP 2015, 1. Basin Plan 21 47 23 74 14 51 <20 <20 <20 20 26 1022007, 2013 Total Hardness mg CaCO3/L NA 932 499 1,010 344 758 549 817 728 816 1,210 991 556Total Metals2013 Aluminum mg/L NA2007 Antimony mg/L NA <0.002 <0.002 <0.002 0.004 0.004 0.003 <0.005 <0.005 <0.006 <0.005 <0.005 <0.0052007, 2013 Arsenic mg/L NA 0.002 0.002 0.003 0.004 0.002 0.003 0.005 0.007 0.005 0.004 0.005 <0.0022007, 2013 Cadmium mg/L NA <0.001 <0.001 <0.001 <0.001 <0.001 <0.001 <0.001 <0.001 <0.001 <0.001 <0.001 <0.0012007, 2013 Chromium mg/L NA <0.005 0.007 <0.005 0.009 0.005 <0.005 <0.005 <0.005 <0.005 <0.005 <0.005 <0.0052007, 2013 Copper mg/L NA <0.005 0.010 0.006 0.010 0.018 0.007 0.009 0.013 0.012 <0.005 <0.005 0.0052013 Iron mg/L 0.3 (a) 1. Basin Plan2007, 2013 Lead mg/L NA 0.002 0.006 0.003 0.010 0.003 <0.002 0.002 <0.002 0.003 <0.002 <0.002 0.0022013 Manganese mg/L 0.05 (a) 1. Basin Plan2013 Mercury mg/L NA2007, 2013 Nickel mg/L NA 0.003 0.003 0.004 <0.002 0.002 <0.002 0.004 0.002 <0.002 0.002 0.003 0.0022007, 2013 Selenium mg/L 0.005 16. 40 CFR 131.38 0.003 <0.002 <0.002 <0.004 <0.004 <0.004 <0.005 <0.005 <0.005 <0.005 <0.005 <0.0052013 Thallium mg/L NA2007, 2013 Zinc mg/L NA <0.02 0.045 <0.020 0.042 0.029 0.025 0.036 <0.02 0.029 <0.02 <0.02 <0.02Dissolved Metals2013 Aluminum mg/L NA2007 Antimony mg/L 0.006 1. Basin Plan <0.002 <0.002 <0.002 0.006 <0.002 0.004 <0.005 <0.005 <0.006 <0.005 <0.005 <0.0052007, 2013 Arsenic mg/L 0.34 16. 40 CFR 131.38 <0.001 0.001 0.003 0.003 0.003 0.003 0.003 0.004 0.003 <0.002 <0.002 <0.0022007, 2013 Cadmium mg/L (c) 16. 40 CFR 131.38 <0.001 <0.001 <0.001 <0.001 <0.001 <0.001 <0.001 <0.001 <0.001 <0.001 <0.001 <0.0012007, 2013 Chromium mg/L (c) 16. 40 CFR 131.38 <0.005 <0.005 <0.005 0.005 <0.005 <0.005 <0.005 <0.005 <0.005 <0.005 <0.005 <0.0052007, 2013 Copper mg/L (c) 16. 40 CFR 131.38 <0.005 <0.005 <0.005 0.007 0.025 0.008 0.005 0.006 0.008 <0.005 <0.005 <0.0052013 Iron mg/L NA2007, 2013 Lead mg/L (c) 16. 40 CFR 131.38 <0.002 <0.002 <0.002 0.002 <0.002 <0.002 <0.002 <0.002 <0.002 <0.002 <0.002 <0.0022013 Manganese mg/L NA2013 Mercury mg/L NA2007, 2013 Nickel mg/L (c) 16. 40 CFR 131.38 0.004 <0.002 0.003 <0.002 0.002 <0.002 0.003 0.002 <0.002 0.002 0.003 0.0022007, 2013 Selenium mg/L NA <0.002 <0.002 <0.002 <0.004 <0.004 <0.004 <0.005 <0.005 <0.005 <0.005 <0.005 <0.0052013 Thallium mg/L NA2007, 2013 Zinc mg/L (c) 16. 40 CFR 131.38 <0.020 <0.020 <0.020 0.043 0.097 0.021 <0.02 <0.02 <0.02 <0.02 <0.02 <0.02
Permit Requirement Analyte
2003-2004
Historical Monitoring Data
2004-2005Units Water Quality
Benchmarks Benchmark Reference2001-2002 2002-2003

Wet Weather Historical Monitoring Table for SR-MLS
02/17/02 03/17/02 04/25/02 12/16/02 02/11/03 02/25/03 11/12/03 02/03/04 02/18/04 10/17/04 02/11/05 02/18/05
Permit Requirement Analyte
2003-2004
Historical Monitoring Data
2004-2005Units Water Quality
Benchmarks Benchmark Reference2001-2002 2002-2003
Chlorinated Pesticides 2013 Chlordane (tech) ug/L 2.4 16. 40 CFR 131.38Organophosphorus Pesticides2013 Azinphos methyl (Guthion) µg/L NA2013 Bolstar µg/L NA
2007, 2013 Chlorpyrifos µg/L 0.02 acute / 0.014 chronic 12. CA Dept. of Fish & Game, 2000 <0.03* <0.03* 0.03 0.053 0.059 <0.03* <0.01 <0.01 <0.01 <0.01 <0.01 <0.01
2013 Coumaphos µg/L NA2013 Demeton-o µg/L NA2013 Demeton-s µg/L NA
2007, 2013 Diazinon µg/L 0.08 acute / 0.05 chronic
12. CA Dept. of Fish & Game, 2000, 11. Chollas Creek TMDL for Diazinon, 10. USEPA, Aquatic Life Ambient
Water Quality Criteria Diazinon0.10 0.27 <0.03 0.301 0.146 0.171 0.084 <0.01 0.026 <0.01 <0.01 <0.01
2013 Dichlorvos µg/L NA2013 Dimethoate µg/L NA2013 Disulfoton µg/L NA2013 Ethoprop µg/L NA2013 Ethyl parathion µg/L NA2013 Fensulfothion µg/L NA2013 Fenthion µg/L NA2007, 2013 Malathion µg/L 0.43 13. CA Dept. of Fish & Game, 1998, 5. Goldbook 0.24 <0.10 <0.10 0.423 <0.01 <0.01 <0.01 <0.01 <0.012013 Merphos µg/L NA2013 Methyl parathion µg/L NA2013 Mevinphos µg/L NA2013 Naled µg/L NA2013 Phorate µg/L NA2013 Ronnel µg/L NA2013 Stirophos µg/L NA2013 Tokuthion (Prothiofos) µg/L NA2013 Trichloronate µg/L NAPCB Congeners 2013 PCB-8 µg/L 0.014 (d) 16. 40 CFR 131.38 2013 PCB-18 µg/L 0.014 (d) 16. 40 CFR 131.38 2013 PCB-28 µg/L 0.014 (d) 16. 40 CFR 131.38 2013 PCB-44 µg/L 0.014 (d) 16. 40 CFR 131.38 2013 PCB-52 µg/L 0.014 (d) 16. 40 CFR 131.38 2013 PCB-66 µg/L 0.014 (d) 16. 40 CFR 131.38 2013 PCB-77 µg/L 0.014 (d) 16. 40 CFR 131.38 2013 PCB-81 µg/L 0.014 (d) 16. 40 CFR 131.38 2013 PCB-101 µg/L 0.014 (d) 16. 40 CFR 131.38 2013 PCB-105 µg/L 0.014 (d) 16. 40 CFR 131.38 2013 PCB-114 µg/L 0.014 (d) 16. 40 CFR 131.38 2013 PCB-118 µg/L 0.014 (d) 16. 40 CFR 131.38 2013 PCB-123 µg/L 0.014 (d) 16. 40 CFR 131.38 2013 PCB-126 µg/L 0.014 (d) 16. 40 CFR 131.38 2013 PCB-128 µg/L 0.014 (d) 16. 40 CFR 131.38 2013 PCB-138 µg/L 0.014 (d) 16. 40 CFR 131.38 2013 PCB-153 µg/L 0.014 (d) 16. 40 CFR 131.38 2013 PCB-156 µg/L 0.014 (d) 16. 40 CFR 131.38 2013 PCB-157 µg/L 0.014 (d) 16. 40 CFR 131.38 2013 PCB-167 µg/L 0.014 (d) 16. 40 CFR 131.38 2013 PCB-169 µg/L 0.014 (d) 16. 40 CFR 131.38 2013 PCB-170 µg/L 0.014 (d) 16. 40 CFR 131.38 2013 PCB-180 µg/L 0.014 (d) 16. 40 CFR 131.38 2013 PCB-187 µg/L 0.014 (d) 16. 40 CFR 131.38 2013 PCB-189 µg/L 0.014 (d) 16. 40 CFR 131.38 2013 PCB-195 µg/L 0.014 (d) 16. 40 CFR 131.38 2013 PCB-206 µg/L 0.014 (d) 16. 40 CFR 131.38 2013 PCB-209 µg/L 0.014 (d) 16. 40 CFR 131.38
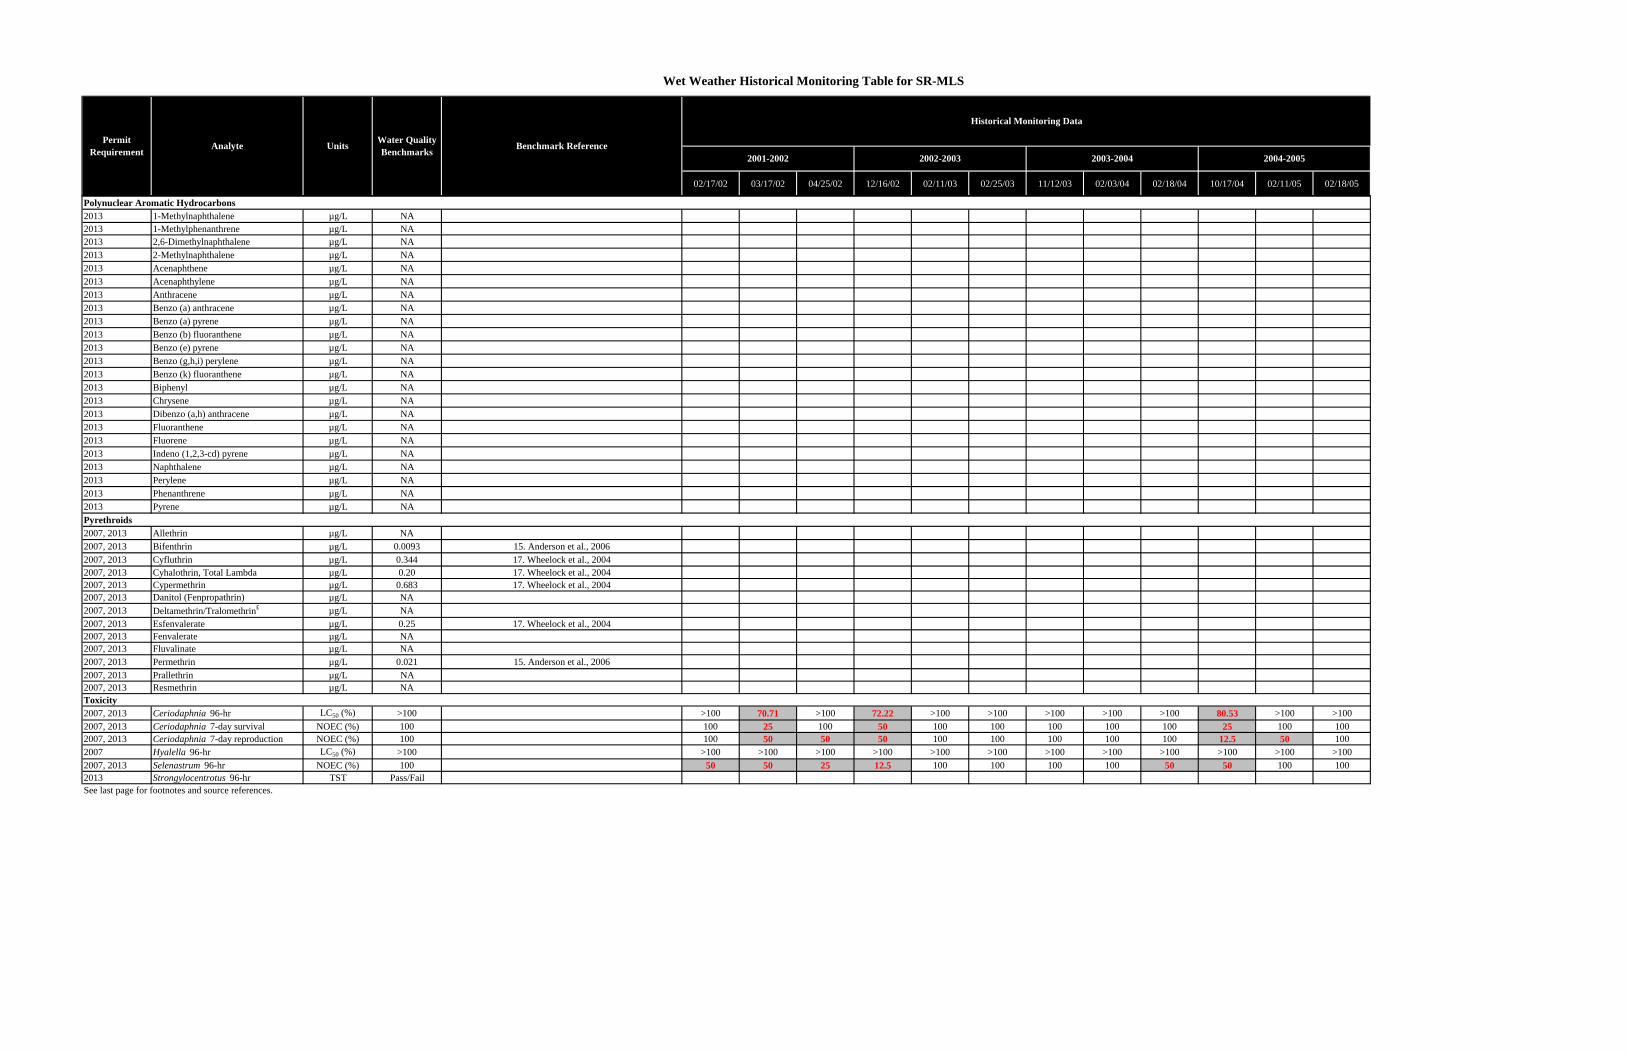
Wet Weather Historical Monitoring Table for SR-MLS
02/17/02 03/17/02 04/25/02 12/16/02 02/11/03 02/25/03 11/12/03 02/03/04 02/18/04 10/17/04 02/11/05 02/18/05
Permit Requirement Analyte
2003-2004
Historical Monitoring Data
2004-2005Units Water Quality
Benchmarks Benchmark Reference2001-2002 2002-2003
Polynuclear Aromatic Hydrocarbons 2013 1-Methylnaphthalene µg/L NA2013 1-Methylphenanthrene µg/L NA2013 2,6-Dimethylnaphthalene µg/L NA2013 2-Methylnaphthalene µg/L NA2013 Acenaphthene µg/L NA2013 Acenaphthylene µg/L NA2013 Anthracene µg/L NA2013 Benzo (a) anthracene µg/L NA2013 Benzo (a) pyrene µg/L NA2013 Benzo (b) fluoranthene µg/L NA2013 Benzo (e) pyrene µg/L NA2013 Benzo (g,h,i) perylene µg/L NA2013 Benzo (k) fluoranthene µg/L NA2013 Biphenyl µg/L NA2013 Chrysene µg/L NA2013 Dibenzo (a,h) anthracene µg/L NA2013 Fluoranthene µg/L NA2013 Fluorene µg/L NA2013 Indeno (1,2,3-cd) pyrene µg/L NA2013 Naphthalene µg/L NA2013 Perylene µg/L NA2013 Phenanthrene µg/L NA2013 Pyrene µg/L NAPyrethroids2007, 2013 Allethrin µg/L NA2007, 2013 Bifenthrin µg/L 0.0093 15. Anderson et al., 20062007, 2013 Cyfluthrin µg/L 0.344 17. Wheelock et al., 20042007, 2013 Cyhalothrin, Total Lambda µg/L 0.20 17. Wheelock et al., 20042007, 2013 Cypermethrin µg/L 0.683 17. Wheelock et al., 20042007, 2013 Danitol (Fenpropathrin) µg/L NA2007, 2013 Deltamethrin/Tralomethrin£ µg/L NA2007, 2013 Esfenvalerate µg/L 0.25 17. Wheelock et al., 20042007, 2013 Fenvalerate µg/L NA2007, 2013 Fluvalinate µg/L NA2007, 2013 Permethrin µg/L 0.021 15. Anderson et al., 20062007, 2013 Prallethrin µg/L NA2007, 2013 Resmethrin µg/L NAToxicity2007, 2013 Ceriodaphnia 96-hr LC50 (%) >100 >100 70.71 >100 72.22 >100 >100 >100 >100 >100 80.53 >100 >1002007, 2013 Ceriodaphnia 7-day survival NOEC (%) 100 100 25 100 50 100 100 100 100 100 25 100 1002007, 2013 Ceriodaphnia 7-day reproduction NOEC (%) 100 100 50 50 50 100 100 100 100 100 12.5 50 1002007 Hyalella 96-hr LC50 (%) >100 >100 >100 >100 >100 >100 >100 >100 >100 >100 >100 >100 >1002007, 2013 Selenastrum 96-hr NOEC (%) 100 50 50 25 12.5 100 100 100 100 50 50 100 1002013 Strongylocentrotus 96-hr TST Pass/FailSee last page for footnotes and source references.
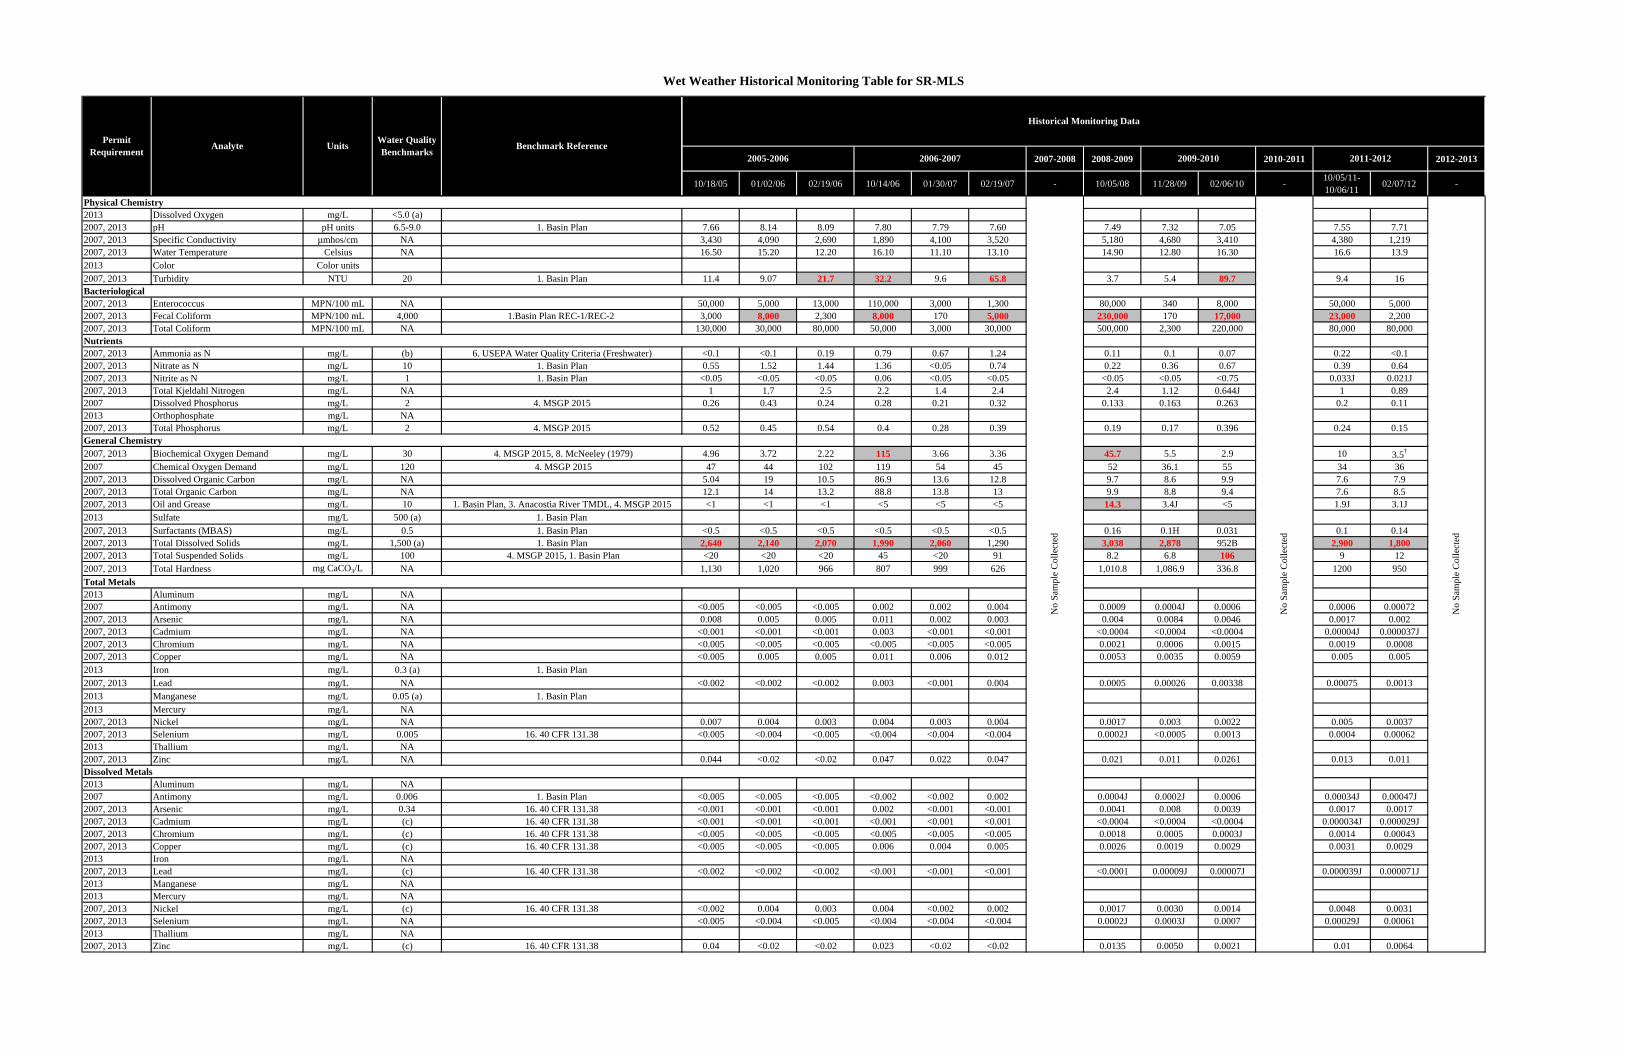
Wet Weather Historical Monitoring Table for SR-MLS
Physical Chemistry2013 Dissolved Oxygen mg/L <5.0 (a)2007, 2013 pH pH units 6.5-9.0 1. Basin Plan2007, 2013 Specific Conductivity µmhos/cm NA2007, 2013 Water Temperature Celsius NA2013 Color Color units2007, 2013 Turbidity NTU 20 1. Basin PlanBacteriological2007, 2013 Enterococcus MPN/100 mL NA2007, 2013 Fecal Coliform MPN/100 mL 4,000 1.Basin Plan REC-1/REC-2 2007, 2013 Total Coliform MPN/100 mL NANutrients2007, 2013 Ammonia as N mg/L (b) 6. USEPA Water Quality Criteria (Freshwater)2007, 2013 Nitrate as N mg/L 10 1. Basin Plan2007, 2013 Nitrite as N mg/L 1 1. Basin Plan2007, 2013 Total Kjeldahl Nitrogen mg/L NA2007 Dissolved Phosphorus mg/L 2 4. MSGP 20152013 Orthophosphate mg/L NA2007, 2013 Total Phosphorus mg/L 2 4. MSGP 2015General Chemistry2007, 2013 Biochemical Oxygen Demand mg/L 30 4. MSGP 2015, 8. McNeeley (1979)2007 Chemical Oxygen Demand mg/L 120 4. MSGP 20152007, 2013 Dissolved Organic Carbon mg/L NA2007, 2013 Total Organic Carbon mg/L NA2007, 2013 Oil and Grease mg/L 10 1. Basin Plan, 3. Anacostia River TMDL, 4. MSGP 20152013 Sulfate mg/L 500 (a) 1. Basin Plan2007, 2013 Surfactants (MBAS) mg/L 0.5 1. Basin Plan2007, 2013 Total Dissolved Solids mg/L 1,500 (a) 1. Basin Plan2007, 2013 Total Suspended Solids mg/L 100 4. MSGP 2015, 1. Basin Plan2007, 2013 Total Hardness mg CaCO3/L NATotal Metals2013 Aluminum mg/L NA2007 Antimony mg/L NA2007, 2013 Arsenic mg/L NA2007, 2013 Cadmium mg/L NA2007, 2013 Chromium mg/L NA2007, 2013 Copper mg/L NA2013 Iron mg/L 0.3 (a) 1. Basin Plan2007, 2013 Lead mg/L NA2013 Manganese mg/L 0.05 (a) 1. Basin Plan2013 Mercury mg/L NA2007, 2013 Nickel mg/L NA2007, 2013 Selenium mg/L 0.005 16. 40 CFR 131.382013 Thallium mg/L NA2007, 2013 Zinc mg/L NADissolved Metals2013 Aluminum mg/L NA2007 Antimony mg/L 0.006 1. Basin Plan2007, 2013 Arsenic mg/L 0.34 16. 40 CFR 131.382007, 2013 Cadmium mg/L (c) 16. 40 CFR 131.382007, 2013 Chromium mg/L (c) 16. 40 CFR 131.382007, 2013 Copper mg/L (c) 16. 40 CFR 131.382013 Iron mg/L NA2007, 2013 Lead mg/L (c) 16. 40 CFR 131.382013 Manganese mg/L NA2013 Mercury mg/L NA2007, 2013 Nickel mg/L (c) 16. 40 CFR 131.382007, 2013 Selenium mg/L NA2013 Thallium mg/L NA2007, 2013 Zinc mg/L (c) 16. 40 CFR 131.38
Permit Requirement Analyte Units Water Quality
Benchmarks Benchmark Reference2007-2008 2008-2009 2010-2011 2012-2013
10/18/05 01/02/06 02/19/06 10/14/06 01/30/07 02/19/07 - 10/05/08 11/28/09 02/06/10 - 10/05/11-10/06/11 02/07/12 -
7.66 8.14 8.09 7.80 7.79 7.60 7.49 7.32 7.05 7.55 7.713,430 4,090 2,690 1,890 4,100 3,520 5,180 4,680 3,410 4,380 1,21916.50 15.20 12.20 16.10 11.10 13.10 14.90 12.80 16.30 16.6 13.9
11.4 9.07 21.7 32.2 9.6 65.8 3.7 5.4 89.7 9.4 16
50,000 5,000 13,000 110,000 3,000 1,300 80,000 340 8,000 50,000 5,0003,000 8,000 2,300 8,000 170 5,000 230,000 170 17,000 23,000 2,200
130,000 30,000 80,000 50,000 3,000 30,000 500,000 2,300 220,000 80,000 80,000
<0.1 <0.1 0.19 0.79 0.67 1.24 0.11 0.1 0.07 0.22 <0.10.55 1.52 1.44 1.36 <0.05 0.74 0.22 0.36 0.67 0.39 0.64
<0.05 <0.05 <0.05 0.06 <0.05 <0.05 <0.05 <0.05 <0.75 0.033J 0.021J1 1.7 2.5 2.2 1.4 2.4 2.4 1.12 0.644J 1 0.89
0.26 0.43 0.24 0.28 0.21 0.32 0.133 0.163 0.263 0.2 0.11
0.52 0.45 0.54 0.4 0.28 0.39 0.19 0.17 0.396 0.24 0.15
4.96 3.72 2.22 115 3.66 3.36 45.7 5.5 2.9 10 3.5†
47 44 102 119 54 45 52 36.1 55 34 365.04 19 10.5 86.9 13.6 12.8 9.7 8.6 9.9 7.6 7.912.1 14 13.2 88.8 13.8 13 9.9 8.8 9.4 7.6 8.5<1 <1 <1 <5 <5 <5 14.3 3.4J <5 1.9J 3.1J
<0.5 <0.5 <0.5 <0.5 <0.5 <0.5 0.16 0.1H 0.031 0.1 0.142,640 2,140 2,070 1,990 2,060 1,290 3,038 2,878 952B 2,900 1,800<20 <20 <20 45 <20 91 8.2 6.8 106 9 12
1,130 1,020 966 807 999 626 1,010.8 1,086.9 336.8 1200 950
<0.005 <0.005 <0.005 0.002 0.002 0.004 0.0009 0.0004J 0.0006 0.0006 0.000720.008 0.005 0.005 0.011 0.002 0.003 0.004 0.0084 0.0046 0.0017 0.002
<0.001 <0.001 <0.001 0.003 <0.001 <0.001 <0.0004 <0.0004 <0.0004 0.00004J 0.000037J<0.005 <0.005 <0.005 <0.005 <0.005 <0.005 0.0021 0.0006 0.0015 0.0019 0.0008<0.005 0.005 0.005 0.011 0.006 0.012 0.0053 0.0035 0.0059 0.005 0.005
<0.002 <0.002 <0.002 0.003 <0.001 0.004 0.0005 0.00026 0.00338 0.00075 0.0013
0.007 0.004 0.003 0.004 0.003 0.004 0.0017 0.003 0.0022 0.005 0.0037<0.005 <0.004 <0.005 <0.004 <0.004 <0.004 0.0002J <0.0005 0.0013 0.0004 0.00062
0.044 <0.02 <0.02 0.047 0.022 0.047 0.021 0.011 0.0261 0.013 0.011
<0.005 <0.005 <0.005 <0.002 <0.002 0.002 0.0004J 0.0002J 0.0006 0.00034J 0.00047J<0.001 <0.001 <0.001 0.002 <0.001 <0.001 0.0041 0.008 0.0039 0.0017 0.0017<0.001 <0.001 <0.001 <0.001 <0.001 <0.001 <0.0004 <0.0004 <0.0004 0.000034J 0.000029J<0.005 <0.005 <0.005 <0.005 <0.005 <0.005 0.0018 0.0005 0.0003J 0.0014 0.00043<0.005 <0.005 <0.005 0.006 0.004 0.005 0.0026 0.0019 0.0029 0.0031 0.0029
<0.002 <0.002 <0.002 <0.001 <0.001 <0.001 <0.0001 0.00009J 0.00007J 0.000039J 0.000071J
<0.002 0.004 0.003 0.004 <0.002 0.002 0.0017 0.0030 0.0014 0.0048 0.0031<0.005 <0.004 <0.005 <0.004 <0.004 <0.004 0.0002J 0.0003J 0.0007 0.00029J 0.00061
0.04 <0.02 <0.02 0.023 <0.02 <0.02 0.0135 0.0050 0.0021 0.01 0.0064
2009-20102005-2006 2006-2007
Historical Monitoring Data
No
Sam
ple
Col
lect
ed
No
Sam
ple
Col
lect
ed
No
Sam
ple
Col
lect
ed
2011-2012

Wet Weather Historical Monitoring Table for SR-MLS
Permit Requirement Analyte Units Water Quality
Benchmarks Benchmark Reference
Chlorinated Pesticides 2013 Chlordane (tech) ug/L 2.4 16. 40 CFR 131.38Organophosphorus Pesticides2013 Azinphos methyl (Guthion) µg/L NA2013 Bolstar µg/L NA
2007, 2013 Chlorpyrifos µg/L 0.02 acute / 0.014 chronic 12. CA Dept. of Fish & Game, 2000
2013 Coumaphos µg/L NA2013 Demeton-o µg/L NA2013 Demeton-s µg/L NA
2007, 2013 Diazinon µg/L 0.08 acute / 0.05 chronic
12. CA Dept. of Fish & Game, 2000, 11. Chollas Creek TMDL for Diazinon, 10. USEPA, Aquatic Life Ambient
Water Quality Criteria Diazinon2013 Dichlorvos µg/L NA2013 Dimethoate µg/L NA2013 Disulfoton µg/L NA2013 Ethoprop µg/L NA2013 Ethyl parathion µg/L NA2013 Fensulfothion µg/L NA2013 Fenthion µg/L NA2007, 2013 Malathion µg/L 0.43 13. CA Dept. of Fish & Game, 1998, 5. Goldbook2013 Merphos µg/L NA2013 Methyl parathion µg/L NA2013 Mevinphos µg/L NA2013 Naled µg/L NA2013 Phorate µg/L NA2013 Ronnel µg/L NA2013 Stirophos µg/L NA2013 Tokuthion (Prothiofos) µg/L NA2013 Trichloronate µg/L NAPCB Congeners 2013 PCB-8 µg/L 0.014 (d) 16. 40 CFR 131.38 2013 PCB-18 µg/L 0.014 (d) 16. 40 CFR 131.38 2013 PCB-28 µg/L 0.014 (d) 16. 40 CFR 131.38 2013 PCB-44 µg/L 0.014 (d) 16. 40 CFR 131.38 2013 PCB-52 µg/L 0.014 (d) 16. 40 CFR 131.38 2013 PCB-66 µg/L 0.014 (d) 16. 40 CFR 131.38 2013 PCB-77 µg/L 0.014 (d) 16. 40 CFR 131.38 2013 PCB-81 µg/L 0.014 (d) 16. 40 CFR 131.38 2013 PCB-101 µg/L 0.014 (d) 16. 40 CFR 131.38 2013 PCB-105 µg/L 0.014 (d) 16. 40 CFR 131.38 2013 PCB-114 µg/L 0.014 (d) 16. 40 CFR 131.38 2013 PCB-118 µg/L 0.014 (d) 16. 40 CFR 131.38 2013 PCB-123 µg/L 0.014 (d) 16. 40 CFR 131.38 2013 PCB-126 µg/L 0.014 (d) 16. 40 CFR 131.38 2013 PCB-128 µg/L 0.014 (d) 16. 40 CFR 131.38 2013 PCB-138 µg/L 0.014 (d) 16. 40 CFR 131.38 2013 PCB-153 µg/L 0.014 (d) 16. 40 CFR 131.38 2013 PCB-156 µg/L 0.014 (d) 16. 40 CFR 131.38 2013 PCB-157 µg/L 0.014 (d) 16. 40 CFR 131.38 2013 PCB-167 µg/L 0.014 (d) 16. 40 CFR 131.38 2013 PCB-169 µg/L 0.014 (d) 16. 40 CFR 131.38 2013 PCB-170 µg/L 0.014 (d) 16. 40 CFR 131.38 2013 PCB-180 µg/L 0.014 (d) 16. 40 CFR 131.38 2013 PCB-187 µg/L 0.014 (d) 16. 40 CFR 131.38 2013 PCB-189 µg/L 0.014 (d) 16. 40 CFR 131.38 2013 PCB-195 µg/L 0.014 (d) 16. 40 CFR 131.38 2013 PCB-206 µg/L 0.014 (d) 16. 40 CFR 131.38 2013 PCB-209 µg/L 0.014 (d) 16. 40 CFR 131.38
2007-2008 2008-2009 2010-2011 2012-2013
10/18/05 01/02/06 02/19/06 10/14/06 01/30/07 02/19/07 - 10/05/08 11/28/09 02/06/10 - 10/05/11-10/06/11 02/07/12 -
2009-20102005-2006 2006-2007
Historical Monitoring Data
2011-2012
<0.01 <0.02 <0.02 <0.002 <0.002 <0.002 <0.002 <0.002 <0.002 <0.01 <0.01
<0.01 <0.02 <0.02 <0.004 <0.004 <0.004 <0.004 <0.004 <0.004 <0.01 <0.01
<0.01 <0.02 <0.02 0.097 0.063 <0.006 <0.006 <0.006 0.059 <0.01 <0.01
No
Sam
ple
Col
lect
ed
No
Sam
ple
Col
lect
ed
No
Sam
ple
Col
lect
ed

Wet Weather Historical Monitoring Table for SR-MLS
Permit Requirement Analyte Units Water Quality
Benchmarks Benchmark Reference
Polynuclear Aromatic Hydrocarbons 2013 1-Methylnaphthalene µg/L NA2013 1-Methylphenanthrene µg/L NA2013 2,6-Dimethylnaphthalene µg/L NA2013 2-Methylnaphthalene µg/L NA2013 Acenaphthene µg/L NA2013 Acenaphthylene µg/L NA2013 Anthracene µg/L NA2013 Benzo (a) anthracene µg/L NA2013 Benzo (a) pyrene µg/L NA2013 Benzo (b) fluoranthene µg/L NA2013 Benzo (e) pyrene µg/L NA2013 Benzo (g,h,i) perylene µg/L NA2013 Benzo (k) fluoranthene µg/L NA2013 Biphenyl µg/L NA2013 Chrysene µg/L NA2013 Dibenzo (a,h) anthracene µg/L NA2013 Fluoranthene µg/L NA2013 Fluorene µg/L NA2013 Indeno (1,2,3-cd) pyrene µg/L NA2013 Naphthalene µg/L NA2013 Perylene µg/L NA2013 Phenanthrene µg/L NA2013 Pyrene µg/L NAPyrethroids2007, 2013 Allethrin µg/L NA2007, 2013 Bifenthrin µg/L 0.0093 15. Anderson et al., 20062007, 2013 Cyfluthrin µg/L 0.344 17. Wheelock et al., 20042007, 2013 Cyhalothrin, Total Lambda µg/L 0.20 17. Wheelock et al., 20042007, 2013 Cypermethrin µg/L 0.683 17. Wheelock et al., 20042007, 2013 Danitol (Fenpropathrin) µg/L NA2007, 2013 Deltamethrin/Tralomethrin£ µg/L NA2007, 2013 Esfenvalerate µg/L 0.25 17. Wheelock et al., 20042007, 2013 Fenvalerate µg/L NA2007, 2013 Fluvalinate µg/L NA2007, 2013 Permethrin µg/L 0.021 15. Anderson et al., 20062007, 2013 Prallethrin µg/L NA2007, 2013 Resmethrin µg/L NAToxicity2007, 2013 Ceriodaphnia 96-hr LC50 (%) >1002007, 2013 Ceriodaphnia 7-day survival NOEC (%) 1002007, 2013 Ceriodaphnia 7-day reproduction NOEC (%) 1002007 Hyalella 96-hr LC50 (%) >1002007, 2013 Selenastrum 96-hr NOEC (%) 1002013 Strongylocentrotus 96-hr TST Pass/FailSee last page for footnotes and source references.
2007-2008 2008-2009 2010-2011 2012-2013
10/18/05 01/02/06 02/19/06 10/14/06 01/30/07 02/19/07 - 10/05/08 11/28/09 02/06/10 - 10/05/11-10/06/11 02/07/12 -
2009-20102005-2006 2006-2007
Historical Monitoring Data
2011-2012
<0.002 <0.0005 <0.0005 <0.002 <0.002<0.002 <0.0005 0.0358B <0.002 0.009<0.002 <0.0005 0.0179 <0.002 0.0142<0.002 <0.0005 0.0264 <0.002 <0.002<0.002 <0.0005 <0.0005 <0.002 <0.002<0.002 <0.0005 0.0009J <0.002 <0.002<0.002 <0.0005 <0.0005 <0.002 <0.002<0.002 <0.0005 0.0022 <0.002 <0.002<0.002 <0.0005 <0.0005 <0.002 <0.002<0.002 <0.0005 <0.0005 <0.002 <0.002
<0.025* <0.005 <0.005 <0.025†† <0.025††
<0.002 <0.0005 <0.0005 <0.002 <0.002<0.025 <0.005 <0.025 <0.025
>100 >100 >100 >100 >100 >100 >100 >100 >100 >100 >100100 100 100 100 100 100 100 100 100 100 100100 100 100 6.25 100 100 50 50 100 50 100
>100 >100 >100 >100 >100 >100 >100 >100 >100 >100 >10050 100 100 100 100 100 50 50 100 50 50
No
Sam
ple
Col
lect
ed
No
Sam
ple
Col
lect
ed
No
Sam
ple
Col
lect
ed

Wet Weather Historical Monitoring Table for SR-MLS
Physical Chemistry2013 Dissolved Oxygen mg/L <5.0 (a)2007, 2013 pH pH units 6.5-9.0 1. Basin Plan2007, 2013 Specific Conductivity µmhos/cm NA2007, 2013 Water Temperature Celsius NA2013 Color Color units2007, 2013 Turbidity NTU 20 1. Basin PlanBacteriological2007, 2013 Enterococcus MPN/100 mL NA2007, 2013 Fecal Coliform MPN/100 mL 4,000 1.Basin Plan REC-1/REC-2 2007, 2013 Total Coliform MPN/100 mL NANutrients2007, 2013 Ammonia as N mg/L (b) 6. USEPA Water Quality Criteria (Freshwater)2007, 2013 Nitrate as N mg/L 10 1. Basin Plan2007, 2013 Nitrite as N mg/L 1 1. Basin Plan2007, 2013 Total Kjeldahl Nitrogen mg/L NA2007 Dissolved Phosphorus mg/L 2 4. MSGP 20152013 Orthophosphate mg/L NA2007, 2013 Total Phosphorus mg/L 2 4. MSGP 2015General Chemistry2007, 2013 Biochemical Oxygen Demand mg/L 30 4. MSGP 2015, 8. McNeeley (1979)2007 Chemical Oxygen Demand mg/L 120 4. MSGP 20152007, 2013 Dissolved Organic Carbon mg/L NA2007, 2013 Total Organic Carbon mg/L NA2007, 2013 Oil and Grease mg/L 10 1. Basin Plan, 3. Anacostia River TMDL, 4. MSGP 20152013 Sulfate mg/L 500 (a) 1. Basin Plan2007, 2013 Surfactants (MBAS) mg/L 0.5 1. Basin Plan2007, 2013 Total Dissolved Solids mg/L 1,500 (a) 1. Basin Plan2007, 2013 Total Suspended Solids mg/L 100 4. MSGP 2015, 1. Basin Plan2007, 2013 Total Hardness mg CaCO3/L NATotal Metals2013 Aluminum mg/L NA2007 Antimony mg/L NA2007, 2013 Arsenic mg/L NA2007, 2013 Cadmium mg/L NA2007, 2013 Chromium mg/L NA2007, 2013 Copper mg/L NA2013 Iron mg/L 0.3 (a) 1. Basin Plan2007, 2013 Lead mg/L NA2013 Manganese mg/L 0.05 (a) 1. Basin Plan2013 Mercury mg/L NA2007, 2013 Nickel mg/L NA2007, 2013 Selenium mg/L 0.005 16. 40 CFR 131.382013 Thallium mg/L NA2007, 2013 Zinc mg/L NADissolved Metals2013 Aluminum mg/L NA2007 Antimony mg/L 0.006 1. Basin Plan2007, 2013 Arsenic mg/L 0.34 16. 40 CFR 131.382007, 2013 Cadmium mg/L (c) 16. 40 CFR 131.382007, 2013 Chromium mg/L (c) 16. 40 CFR 131.382007, 2013 Copper mg/L (c) 16. 40 CFR 131.382013 Iron mg/L NA2007, 2013 Lead mg/L (c) 16. 40 CFR 131.382013 Manganese mg/L NA2013 Mercury mg/L NA2007, 2013 Nickel mg/L (c) 16. 40 CFR 131.382007, 2013 Selenium mg/L NA2013 Thallium mg/L NA2007, 2013 Zinc mg/L (c) 16. 40 CFR 131.38
Permit Requirement Analyte Units Water Quality
Benchmarks Benchmark Reference
Long Term and
Transitional Monitoring
Long Term Monitoring
Long Term and
Transitional Monitoring
Long Term and
Transitional Monitoring
2014-2015
10/10/13 12/07/13-12/08/13 02/07/14 -
5.58 8.89 5.47 0% NA1
7.64 7.63 7.48 0% 0.244,854 2,450 5,10715.7 12.65 13.7750 25 30 100% NA1
2.1 52.5 26.8 38% 1.18
330 28,000 490330 17,000 <18 38% 3.57
7,900 110,000 13,000
0.18 <0.10 <0.10 0% 0.010.25 0.44 0.22 0% 0.07
0.032J <0.10 0.026J 0% 0.040.7 0.54 0.67
0.22 NR 0.11 0% 0.110.18 0.13 0.110.23 0.16 0.13 0% 0.15
<2.0 NR 6.2 12% 0.4736 NR 29 4% 0.529.8 8.6 6.69.8 8.2 6.42.4J NR 1.8J 4% 0.23430 210 420 0% NA1
0.096 0.1 0.084 0% 0.363,000 2,800 2,900 77% 1.40
28 13 4 8% 0.301,240 1,150 1,260
0.88 0.39 0.0330.0006 NR 0.00021J0.0016 0.0016 0.0014
0.000070J 0.000040J 0.000028J0.0016 0.0029 0.00015J0.007 0.0052 0.0012
1.3 0.63 0.1 67% NA1
0.0022 0.0011 0.000089J0.16 0.12 0.14 100% NA1
<0.000050 0.000032J <0.0000500.002 0.0079 0.006
0.00022J 0.00082 0.0023 0% 0.35<0.00020 <0.00020 <0.00020
0.029 0.014 0.0033J
0.0025J <0.0050 <0.00500.00026J NR 0.00022J 0% 0.290.0013 0.0015 0.0013 0% 0.01
0.000050J 0.000027J 0.000028J 0% 0.020.00063 0.0022 0.00014J 0% 0.000.0038 0.0036 0.0017 0% 0.09<0.010 <0.010 0.01
<0.00020 <0.00020 <0.00020 0% 0.000.0018 0.001 0.11
<0.000050 0.000030J <0.0000500.0015 0.0071 0.0074 0% 0.00
0.00021J 0.00076 0.0018<0.00020 <0.00020 <0.00020
0.013 0.005 0.0042J 0% 0.04
Frequency Above
Benchmarks
Mean Ratio to Benchmarks
2013-2014
No
Sam
ple
Col
lect
ed

Wet Weather Historical Monitoring Table for SR-MLS
Permit Requirement Analyte Units Water Quality
Benchmarks Benchmark Reference
Chlorinated Pesticides 2013 Chlordane (tech) ug/L 2.4 16. 40 CFR 131.38Organophosphorus Pesticides2013 Azinphos methyl (Guthion) µg/L NA2013 Bolstar µg/L NA
2007, 2013 Chlorpyrifos µg/L 0.02 acute / 0.014 chronic 12. CA Dept. of Fish & Game, 2000
2013 Coumaphos µg/L NA2013 Demeton-o µg/L NA2013 Demeton-s µg/L NA
2007, 2013 Diazinon µg/L 0.08 acute / 0.05 chronic
12. CA Dept. of Fish & Game, 2000, 11. Chollas Creek TMDL for Diazinon, 10. USEPA, Aquatic Life Ambient
Water Quality Criteria Diazinon2013 Dichlorvos µg/L NA2013 Dimethoate µg/L NA2013 Disulfoton µg/L NA2013 Ethoprop µg/L NA2013 Ethyl parathion µg/L NA2013 Fensulfothion µg/L NA2013 Fenthion µg/L NA2007, 2013 Malathion µg/L 0.43 13. CA Dept. of Fish & Game, 1998, 5. Goldbook2013 Merphos µg/L NA2013 Methyl parathion µg/L NA2013 Mevinphos µg/L NA2013 Naled µg/L NA2013 Phorate µg/L NA2013 Ronnel µg/L NA2013 Stirophos µg/L NA2013 Tokuthion (Prothiofos) µg/L NA2013 Trichloronate µg/L NAPCB Congeners 2013 PCB-8 µg/L 0.014 (d) 16. 40 CFR 131.38 2013 PCB-18 µg/L 0.014 (d) 16. 40 CFR 131.38 2013 PCB-28 µg/L 0.014 (d) 16. 40 CFR 131.38 2013 PCB-44 µg/L 0.014 (d) 16. 40 CFR 131.38 2013 PCB-52 µg/L 0.014 (d) 16. 40 CFR 131.38 2013 PCB-66 µg/L 0.014 (d) 16. 40 CFR 131.38 2013 PCB-77 µg/L 0.014 (d) 16. 40 CFR 131.38 2013 PCB-81 µg/L 0.014 (d) 16. 40 CFR 131.38 2013 PCB-101 µg/L 0.014 (d) 16. 40 CFR 131.38 2013 PCB-105 µg/L 0.014 (d) 16. 40 CFR 131.38 2013 PCB-114 µg/L 0.014 (d) 16. 40 CFR 131.38 2013 PCB-118 µg/L 0.014 (d) 16. 40 CFR 131.38 2013 PCB-123 µg/L 0.014 (d) 16. 40 CFR 131.38 2013 PCB-126 µg/L 0.014 (d) 16. 40 CFR 131.38 2013 PCB-128 µg/L 0.014 (d) 16. 40 CFR 131.38 2013 PCB-138 µg/L 0.014 (d) 16. 40 CFR 131.38 2013 PCB-153 µg/L 0.014 (d) 16. 40 CFR 131.38 2013 PCB-156 µg/L 0.014 (d) 16. 40 CFR 131.38 2013 PCB-157 µg/L 0.014 (d) 16. 40 CFR 131.38 2013 PCB-167 µg/L 0.014 (d) 16. 40 CFR 131.38 2013 PCB-169 µg/L 0.014 (d) 16. 40 CFR 131.38 2013 PCB-170 µg/L 0.014 (d) 16. 40 CFR 131.38 2013 PCB-180 µg/L 0.014 (d) 16. 40 CFR 131.38 2013 PCB-187 µg/L 0.014 (d) 16. 40 CFR 131.38 2013 PCB-189 µg/L 0.014 (d) 16. 40 CFR 131.38 2013 PCB-195 µg/L 0.014 (d) 16. 40 CFR 131.38 2013 PCB-206 µg/L 0.014 (d) 16. 40 CFR 131.38 2013 PCB-209 µg/L 0.014 (d) 16. 40 CFR 131.38
Long Term and
Transitional Monitoring
Long Term Monitoring
Long Term and
Transitional Monitoring
Long Term and
Transitional Monitoring
2014-2015
10/10/13 12/07/13-12/08/13 02/07/14 -
Frequency Above
Benchmarks
Mean Ratio to Benchmarks
2013-2014
<0.10 <0.10 <0.10 0% NA1
<0.010 <0.010 <0.010<0.010 <0.010 <0.010
<0.010 <0.010 <0.010 13% 0.50
<0.010 <0.010 <0.010<0.010 <0.010BS-L <0.010<0.010 <0.010BS-L <0.010
<0.010 <0.010 <0.010 23% 0.57
<0.010 <0.010 <0.010<0.010 <0.010 <0.010<0.010 <0.010BS-L <0.010<0.010 <0.010 <0.010<0.010 <0.010 <0.010<0.010 <0.010 <0.010<0.010 <0.010 <0.010<0.010 <0.010 <0.010 0% 0.11<0.010 <0.010 <0.010<0.010 <0.010 <0.010<0.010 <0.010 <0.010
<0.010BS-L <0.010BS-L <0.010<0.010 <0.010 <0.010<0.010 <0.010 <0.010<0.010 <0.010 <0.010<0.010 <0.010 <0.010<0.010 <0.010 <0.010
<0.010 <0.010 <0.010 0% NA1
<0.010 <0.010 <0.010 0% NA1
<0.010 <0.010 <0.010 0% NA1
<0.010 <0.010 <0.010 0% NA1
<0.010 <0.010 <0.010 0% NA1
<0.010 <0.010 <0.010 0% NA1
<0.010 <0.010 <0.010 0% NA1
<0.010 <0.010 <0.010 0% NA1
<0.010 <0.010 <0.010 0% NA1
<0.010 <0.010 <0.010 0% NA1
<0.010 <0.010 <0.010 0% NA1
<0.010 <0.010 <0.010 0% NA1
<0.010 <0.010 <0.010 0% NA1
<0.010 <0.010 <0.010 0% NA1
<0.010 <0.010 <0.010 0% NA1
<0.010 <0.010 <0.010 0% NA1
<0.010 <0.010 <0.010 0% NA1
<0.010 <0.010 <0.010 0% NA1
<0.010 <0.010 <0.010 0% NA1
<0.010 <0.010 <0.010 0% NA1
<0.010 <0.010 <0.010 0% NA1
<0.010 <0.010 <0.010 0% NA1
<0.010 <0.010 <0.010 0% NA1
<0.010 <0.010 <0.010 0% NA1
<0.010 <0.010 <0.010 0% NA1
<0.010 <0.010 <0.010 0% NA1
<0.010 <0.010 <0.010 0% NA1
<0.010 <0.010 <0.010 0% NA1
No
Sam
ple
Col
lect
ed

Wet Weather Historical Monitoring Table for SR-MLS
Permit Requirement Analyte Units Water Quality
Benchmarks Benchmark Reference
Polynuclear Aromatic Hydrocarbons 2013 1-Methylnaphthalene µg/L NA2013 1-Methylphenanthrene µg/L NA2013 2,6-Dimethylnaphthalene µg/L NA2013 2-Methylnaphthalene µg/L NA2013 Acenaphthene µg/L NA2013 Acenaphthylene µg/L NA2013 Anthracene µg/L NA2013 Benzo (a) anthracene µg/L NA2013 Benzo (a) pyrene µg/L NA2013 Benzo (b) fluoranthene µg/L NA2013 Benzo (e) pyrene µg/L NA2013 Benzo (g,h,i) perylene µg/L NA2013 Benzo (k) fluoranthene µg/L NA2013 Biphenyl µg/L NA2013 Chrysene µg/L NA2013 Dibenzo (a,h) anthracene µg/L NA2013 Fluoranthene µg/L NA2013 Fluorene µg/L NA2013 Indeno (1,2,3-cd) pyrene µg/L NA2013 Naphthalene µg/L NA2013 Perylene µg/L NA2013 Phenanthrene µg/L NA2013 Pyrene µg/L NAPyrethroids2007, 2013 Allethrin µg/L NA2007, 2013 Bifenthrin µg/L 0.0093 15. Anderson et al., 20062007, 2013 Cyfluthrin µg/L 0.344 17. Wheelock et al., 20042007, 2013 Cyhalothrin, Total Lambda µg/L 0.20 17. Wheelock et al., 20042007, 2013 Cypermethrin µg/L 0.683 17. Wheelock et al., 20042007, 2013 Danitol (Fenpropathrin) µg/L NA2007, 2013 Deltamethrin/Tralomethrin£ µg/L NA2007, 2013 Esfenvalerate µg/L 0.25 17. Wheelock et al., 20042007, 2013 Fenvalerate µg/L NA2007, 2013 Fluvalinate µg/L NA2007, 2013 Permethrin µg/L 0.021 15. Anderson et al., 20062007, 2013 Prallethrin µg/L NA2007, 2013 Resmethrin µg/L NAToxicity2007, 2013 Ceriodaphnia 96-hr LC50 (%) >1002007, 2013 Ceriodaphnia 7-day survival NOEC (%) 1002007, 2013 Ceriodaphnia 7-day reproduction NOEC (%) 1002007 Hyalella 96-hr LC50 (%) >1002007, 2013 Selenastrum 96-hr NOEC (%) 1002013 Strongylocentrotus 96-hr TST Pass/FailSee last page for footnotes and source references.
Long Term and
Transitional Monitoring
Long Term Monitoring
Long Term and
Transitional Monitoring
Long Term and
Transitional Monitoring
2014-2015
10/10/13 12/07/13-12/08/13 02/07/14 -
Frequency Above
Benchmarks
Mean Ratio to Benchmarks
2013-2014
<0.10 <0.10 <0.10<0.10 <0.10 <0.10<0.10 <0.10 <0.10<0.10 <0.10 <0.10<0.10 <0.10 <0.10<0.10 <0.10 <0.10<0.10 <0.10 <0.10<0.10 <0.10 <0.10
<0.10BS-L <0.10 <0.10<0.10BS-L <0.10 <0.10
<0.10 <0.10 <0.10<0.10BS-L <0.10 <0.10
<0.10 <0.10 <0.10<0.10 <0.10 <0.10<0.10 <0.10 <0.10
<0.10BS-L <0.10 <0.10<0.10 <0.10 <0.10<0.10 <0.10 <0.10
<0.10BS-L <0.10BS-L <0.10<0.10 <0.10 <0.10<0.10 <0.10 <0.10<0.10 <0.10 <0.10<0.10 <0.10 <0.10
<0.002 <0.002 <0.0020.0021 0.0013J <0.002 20% 1.01<0.002 <0.002 <0.002 0% 0.020.001J <0.002 <0.002 0% 0.06<0.002 <0.002 <0.002 0% 0.00<0.002 <0.002 <0.002<0.002 <0.002 <0.002<0.002 <0.002 <0.002 0% 0.00<0.002 <0.002 <0.002<0.002 <0.002 <0.002<0.01 <0.01 <0.01 0% 0.21
<0.002 <0.002 <0.002<0.01 <0.01 <0.01
>100 NR >100 13% 1.05100 NR 100 13% 1.3050 NR 50 39% 2.26
>100 NR >100 0% 1.0050 NR 25 48% 1.83
Pass Pass Pass 0%
No
Sam
ple
Col
lect
ed

Wet Weather Historical Monitoring Table for SR-MLSBlank spaces have been verified and no data is available.
(a) Water Quality Benchmark are based on the San Diego Regional Water Quality Control Plan by watershed for the San Diego Region (Basin Plan), 1994 (with amendments effective on or before April 4, 2011).
(c) Water Quality Benchmark for dissolved metal fractions are based on total hardness and are calculated as described by the USEPA Federal Register Doc. 40 CFR Part 131, May 18, 2000. The Criteria Maximum Concentration (CMC) was used.(d) Water Quality Benchmark for PCBs is the Criteria Continuous Concentration (CCC) was used (USEPA Federal Register Doc. 40 CFR Part 131, May 18, 2000). There is no Criteria Maximum Concentration (CMC) for PCBS. NA indicate no criteria or published value was available or applicable to the matrix or program.* Indicates detection limit above water quality benchmark.† Result was from composite sample. The grab sample was analyzed outside of the holding time.£ Historical results for Deltamethrin/Tralomethrin contain results reported by lab as Deltamethrin.†† Permethrin was non-detect at the method detection limit of 0.005 µg/L. B-Analyte was detected in the associated method blank.BS-L-Blank Spike recovery of this analyte was below the control limits. Results may be biased low.H-Sample received and or/analyzed past the recommended holding time.J-Analyte was detected at a concentration below the reporting limit and above the method detection limit. Reported value is estimated.NA1 Three or more years of data required to calculate the Mean Ratio to Benchmark.NR-Sampling of this analyte not required for transitional monitoring (RWQCB Order No. R9-2007-0001) and/or for long term monitoring (RWQCB Order No. R9-2013-0001).
SourcesPlease refer to the San Diego County Copermittee Regional Monitoring Program Benchmark Sources in Attachment B to Appendix A for benchmark source citations.
(b) Prior to the 2014-2015 monitoring year, Water Quality Benchmark was calculated based on CMC (salmonids absent) using pH described in the U.S. EPA, 1999 Update of Ambient Water Quality Criteria for Ammonia, EPA-822-R-99-014, December 1999. For 2014-2015 monitoring year, Water Quality Benchmark CMC was calculated based on pH and water temperature (when applicable) as described in the U.S. EPA, 2013 Aquatic Life Ambient Water Quality Criteria for Ammonia - Freshwater, EPA-822-R-13-001, April 2013.
Values with red bold font and shading do not meet Water Quality Benchmarks.